EP2406402B1 - Method to assess human allograft status from microrna expression levels - Google Patents
Method to assess human allograft status from microrna expression levels Download PDFInfo
- Publication number
- EP2406402B1 EP2406402B1 EP10751549.6A EP10751549A EP2406402B1 EP 2406402 B1 EP2406402 B1 EP 2406402B1 EP 10751549 A EP10751549 A EP 10751549A EP 2406402 B1 EP2406402 B1 EP 2406402B1
- Authority
- EP
- European Patent Office
- Prior art keywords
- mir
- rna
- expression
- small non
- coding
- Prior art date
- Legal status (The legal status is an assumption and is not a legal conclusion. Google has not performed a legal analysis and makes no representation as to the accuracy of the status listed.)
- Not-in-force
Links
- 230000014509 gene expression Effects 0.000 title claims description 156
- 238000000034 method Methods 0.000 title claims description 74
- 108091070501 miRNA Proteins 0.000 title description 62
- 108091032973 (ribonucleotides)n+m Proteins 0.000 claims description 199
- 238000001574 biopsy Methods 0.000 claims description 139
- 210000000056 organ Anatomy 0.000 claims description 98
- 239000003550 marker Substances 0.000 claims description 78
- 102000042567 non-coding RNA Human genes 0.000 claims description 53
- 108091027963 non-coding RNA Proteins 0.000 claims description 53
- 210000002700 urine Anatomy 0.000 claims description 14
- 238000004364 calculation method Methods 0.000 claims description 7
- 108700011259 MicroRNAs Proteins 0.000 description 94
- 239000002773 nucleotide Substances 0.000 description 91
- 125000003729 nucleotide group Chemical group 0.000 description 91
- 239000002679 microRNA Substances 0.000 description 68
- 108020004999 messenger RNA Proteins 0.000 description 56
- 239000012472 biological sample Substances 0.000 description 46
- 230000001154 acute effect Effects 0.000 description 36
- 108020004414 DNA Proteins 0.000 description 35
- QJJXYPPXXYFBGM-LFZNUXCKSA-N Tacrolimus Chemical compound C1C[C@@H](O)[C@H](OC)C[C@@H]1\C=C(/C)[C@@H]1[C@H](C)[C@@H](O)CC(=O)[C@H](CC=C)/C=C(C)/C[C@H](C)C[C@H](OC)[C@H]([C@H](C[C@H]2C)OC)O[C@@]2(O)C(=O)C(=O)N2CCCC[C@H]2C(=O)O1 QJJXYPPXXYFBGM-LFZNUXCKSA-N 0.000 description 31
- 210000003819 peripheral blood mononuclear cell Anatomy 0.000 description 31
- 229960001967 tacrolimus Drugs 0.000 description 31
- QJJXYPPXXYFBGM-SHYZHZOCSA-N tacrolimus Natural products CO[C@H]1C[C@H](CC[C@@H]1O)C=C(C)[C@H]2OC(=O)[C@H]3CCCCN3C(=O)C(=O)[C@@]4(O)O[C@@H]([C@H](C[C@H]4C)OC)[C@@H](C[C@H](C)CC(=C[C@@H](CC=C)C(=O)C[C@H](O)[C@H]2C)C)OC QJJXYPPXXYFBGM-SHYZHZOCSA-N 0.000 description 31
- DDRJAANPRJIHGJ-UHFFFAOYSA-N creatinine Chemical compound CN1CC(=O)NC1=N DDRJAANPRJIHGJ-UHFFFAOYSA-N 0.000 description 30
- 239000000523 sample Substances 0.000 description 29
- 238000010200 validation analysis Methods 0.000 description 29
- 108091079658 miR-142-1 stem-loop Proteins 0.000 description 26
- 108091071830 miR-142-2 stem-loop Proteins 0.000 description 26
- 210000004027 cell Anatomy 0.000 description 23
- 108091007772 MIRLET7C Proteins 0.000 description 22
- 238000003752 polymerase chain reaction Methods 0.000 description 20
- 239000013615 primer Substances 0.000 description 19
- 238000003556 assay Methods 0.000 description 18
- 230000006870 function Effects 0.000 description 17
- 108091043187 miR-30a stem-loop Proteins 0.000 description 17
- 108091029750 miR-30a-1 stem-loop Proteins 0.000 description 17
- 108091030035 miR-30a-2 stem-loop Proteins 0.000 description 17
- 229940109239 creatinine Drugs 0.000 description 15
- 108091033773 MiR-155 Proteins 0.000 description 14
- 108091062140 Mir-223 Proteins 0.000 description 14
- 108091064399 miR-10b stem-loop Proteins 0.000 description 13
- 238000003253 miRNA assay Methods 0.000 description 13
- 238000012549 training Methods 0.000 description 12
- 208000034706 Graft dysfunction Diseases 0.000 description 11
- 108020003224 Small Nucleolar RNA Proteins 0.000 description 11
- 102000042773 Small Nucleolar RNA Human genes 0.000 description 11
- 230000000692 anti-sense effect Effects 0.000 description 11
- 210000002966 serum Anatomy 0.000 description 11
- 230000004913 activation Effects 0.000 description 10
- 210000003734 kidney Anatomy 0.000 description 10
- 150000007523 nucleic acids Chemical class 0.000 description 10
- 238000000513 principal component analysis Methods 0.000 description 10
- 238000011002 quantification Methods 0.000 description 10
- 150000003431 steroids Chemical class 0.000 description 10
- 108020004463 18S ribosomal RNA Proteins 0.000 description 9
- 108091093088 Amplicon Proteins 0.000 description 9
- 108090000623 proteins and genes Proteins 0.000 description 9
- 238000003753 real-time PCR Methods 0.000 description 9
- 238000011282 treatment Methods 0.000 description 9
- 102000017420 CD3 protein, epsilon/gamma/delta subunit Human genes 0.000 description 8
- 108050005493 CD3 protein, epsilon/gamma/delta subunit Proteins 0.000 description 8
- 239000002299 complementary DNA Substances 0.000 description 8
- 230000003247 decreasing effect Effects 0.000 description 8
- 239000000203 mixture Substances 0.000 description 8
- 239000006228 supernatant Substances 0.000 description 8
- 102100022005 B-lymphocyte antigen CD20 Human genes 0.000 description 7
- 101000897405 Homo sapiens B-lymphocyte antigen CD20 Proteins 0.000 description 7
- 108091028066 Mir-126 Proteins 0.000 description 7
- 101100325747 Mus musculus Bak1 gene Proteins 0.000 description 7
- 238000004458 analytical method Methods 0.000 description 7
- 210000002919 epithelial cell Anatomy 0.000 description 7
- 108091023108 miR-30e stem-loop Proteins 0.000 description 7
- 108091027549 miR-30e-1 stem-loop Proteins 0.000 description 7
- 108091029213 miR-30e-2 stem-loop Proteins 0.000 description 7
- 102000039446 nucleic acids Human genes 0.000 description 7
- 108020004707 nucleic acids Proteins 0.000 description 7
- 102000004169 proteins and genes Human genes 0.000 description 7
- 230000035945 sensitivity Effects 0.000 description 7
- 101710135898 Myc proto-oncogene protein Proteins 0.000 description 6
- 102100038895 Myc proto-oncogene protein Human genes 0.000 description 6
- 238000011529 RT qPCR Methods 0.000 description 6
- 102100022432 Sclerostin domain-containing protein 1 Human genes 0.000 description 6
- 101710169324 Sclerostin domain-containing protein 1 Proteins 0.000 description 6
- 101710150448 Transcriptional regulator Myc Proteins 0.000 description 6
- 239000002987 primer (paints) Substances 0.000 description 6
- 238000010839 reverse transcription Methods 0.000 description 6
- 230000002441 reversible effect Effects 0.000 description 6
- 210000001519 tissue Anatomy 0.000 description 6
- 230000002485 urinary effect Effects 0.000 description 6
- 210000004369 blood Anatomy 0.000 description 5
- 239000008280 blood Substances 0.000 description 5
- 238000002955 isolation Methods 0.000 description 5
- -1 miR-1423p Proteins 0.000 description 5
- 239000000047 product Substances 0.000 description 5
- 230000000284 resting effect Effects 0.000 description 5
- 238000012353 t test Methods 0.000 description 5
- 238000002054 transplantation Methods 0.000 description 5
- 101710155857 C-C motif chemokine 2 Proteins 0.000 description 4
- 108091068993 Homo sapiens miR-142 stem-loop Proteins 0.000 description 4
- 108091070365 Homo sapiens miR-30a stem-loop Proteins 0.000 description 4
- 108091065436 Homo sapiens miR-30e stem-loop Proteins 0.000 description 4
- 108091007773 MIR100 Proteins 0.000 description 4
- 206010053159 Organ failure Diseases 0.000 description 4
- 210000001744 T-lymphocyte Anatomy 0.000 description 4
- 238000006243 chemical reaction Methods 0.000 description 4
- 230000000875 corresponding effect Effects 0.000 description 4
- 238000010195 expression analysis Methods 0.000 description 4
- 238000007429 general method Methods 0.000 description 4
- 108091091807 let-7a stem-loop Proteins 0.000 description 4
- 108091057746 let-7a-4 stem-loop Proteins 0.000 description 4
- 108091028376 let-7a-5 stem-loop Proteins 0.000 description 4
- 108091024393 let-7a-6 stem-loop Proteins 0.000 description 4
- 108091091174 let-7a-7 stem-loop Proteins 0.000 description 4
- 108091032320 miR-146 stem-loop Proteins 0.000 description 4
- 108091024530 miR-146a stem-loop Proteins 0.000 description 4
- 108091043612 miR-146b stem-loop Proteins 0.000 description 4
- 108091063344 miR-30b stem-loop Proteins 0.000 description 4
- 108091055059 miR-30c stem-loop Proteins 0.000 description 4
- 108091024082 miR-32 stem-loop Proteins 0.000 description 4
- 108091055145 miR-342 stem-loop Proteins 0.000 description 4
- 239000013610 patient sample Substances 0.000 description 4
- 210000005239 tubule Anatomy 0.000 description 4
- 102100021943 C-C motif chemokine 2 Human genes 0.000 description 3
- 108010074328 Interferon-gamma Proteins 0.000 description 3
- 102000004388 Interleukin-4 Human genes 0.000 description 3
- 108090000978 Interleukin-4 Proteins 0.000 description 3
- 108091028141 MiR-203 Proteins 0.000 description 3
- 108091036422 MiR-296 Proteins 0.000 description 3
- 108091027766 Mir-143 Proteins 0.000 description 3
- 108091080995 Mir-9/mir-79 microRNA precursor family Proteins 0.000 description 3
- 108091028043 Nucleic acid sequence Proteins 0.000 description 3
- 238000002123 RNA extraction Methods 0.000 description 3
- 238000000692 Student's t-test Methods 0.000 description 3
- 230000003409 anti-rejection Effects 0.000 description 3
- 239000000090 biomarker Substances 0.000 description 3
- 230000000295 complement effect Effects 0.000 description 3
- 238000007405 data analysis Methods 0.000 description 3
- 238000001514 detection method Methods 0.000 description 3
- 238000005516 engineering process Methods 0.000 description 3
- 238000002474 experimental method Methods 0.000 description 3
- 230000002962 histologic effect Effects 0.000 description 3
- 230000001506 immunosuppresive effect Effects 0.000 description 3
- 239000003018 immunosuppressive agent Substances 0.000 description 3
- 238000000338 in vitro Methods 0.000 description 3
- 108091035155 miR-10a stem-loop Proteins 0.000 description 3
- 108091044988 miR-125a stem-loop Proteins 0.000 description 3
- 108091049513 miR-125a-1 stem-loop Proteins 0.000 description 3
- 108091040046 miR-125a-2 stem-loop Proteins 0.000 description 3
- 108091091360 miR-125b stem-loop Proteins 0.000 description 3
- 108091058688 miR-141 stem-loop Proteins 0.000 description 3
- 108091037426 miR-152 stem-loop Proteins 0.000 description 3
- 108091064825 miR-181c stem-loop Proteins 0.000 description 3
- 108091044400 miR-181c-1 stem-loop Proteins 0.000 description 3
- 108091048818 miR-181c-2 stem-loop Proteins 0.000 description 3
- 108091032779 miR-181c-3 stem-loop Proteins 0.000 description 3
- 108091039097 miR-193b stem-loop Proteins 0.000 description 3
- 108091064378 miR-196b stem-loop Proteins 0.000 description 3
- 108091059199 miR-200a stem-loop Proteins 0.000 description 3
- 108091031479 miR-204 stem-loop Proteins 0.000 description 3
- 108091032382 miR-204-1 stem-loop Proteins 0.000 description 3
- 108091085803 miR-204-2 stem-loop Proteins 0.000 description 3
- 108091089766 miR-204-3 stem-loop Proteins 0.000 description 3
- 108091073500 miR-204-4 stem-loop Proteins 0.000 description 3
- 108091053626 miR-204-5 stem-loop Proteins 0.000 description 3
- 108091062762 miR-21 stem-loop Proteins 0.000 description 3
- 108091041631 miR-21-1 stem-loop Proteins 0.000 description 3
- 108091044442 miR-21-2 stem-loop Proteins 0.000 description 3
- 108091061970 miR-26a stem-loop Proteins 0.000 description 3
- 108091083275 miR-26b stem-loop Proteins 0.000 description 3
- 108091070404 miR-27b stem-loop Proteins 0.000 description 3
- 108091091870 miR-30a-3 stem-loop Proteins 0.000 description 3
- 108091067477 miR-30a-4 stem-loop Proteins 0.000 description 3
- 108091057431 miR-30d stem-loop Proteins 0.000 description 3
- 108091085488 miR-30e-3 stem-loop Proteins 0.000 description 3
- 108091030670 miR-365 stem-loop Proteins 0.000 description 3
- 108091036688 miR-365-3 stem-loop Proteins 0.000 description 3
- 108091027983 miR-378-1 stem-loop Proteins 0.000 description 3
- 108091089716 miR-378-2 stem-loop Proteins 0.000 description 3
- 108091090987 miR-425 stem-loop Proteins 0.000 description 3
- 108091082652 miR-425-1 stem-loop Proteins 0.000 description 3
- 108091048131 miR-425-2 stem-loop Proteins 0.000 description 3
- 108091059135 miR-429 stem-loop Proteins 0.000 description 3
- 108091050850 miR-489 stem-loop Proteins 0.000 description 3
- 108091063340 miR-497 stem-loop Proteins 0.000 description 3
- 108091063911 miR-650 stem-loop Proteins 0.000 description 3
- 108091063151 miR-660 stem-loop Proteins 0.000 description 3
- 108091047084 miR-9 stem-loop Proteins 0.000 description 3
- 108091076732 miR-99a stem-loop Proteins 0.000 description 3
- 108091064318 miR-99a-1 stem-loop Proteins 0.000 description 3
- 108091086202 miR-99a-2 stem-loop Proteins 0.000 description 3
- 238000013188 needle biopsy Methods 0.000 description 3
- 238000007427 paired t-test Methods 0.000 description 3
- 230000009467 reduction Effects 0.000 description 3
- 230000000638 stimulation Effects 0.000 description 3
- 238000012360 testing method Methods 0.000 description 3
- 238000002560 therapeutic procedure Methods 0.000 description 3
- 102000000018 Chemokine CCL2 Human genes 0.000 description 2
- 102000019034 Chemokines Human genes 0.000 description 2
- 108010012236 Chemokines Proteins 0.000 description 2
- 239000003155 DNA primer Substances 0.000 description 2
- 239000006144 Dulbecco’s modified Eagle's medium Substances 0.000 description 2
- 108060006698 EGF receptor Proteins 0.000 description 2
- 108700039887 Essential Genes Proteins 0.000 description 2
- WZUVPPKBWHMQCE-UHFFFAOYSA-N Haematoxylin Chemical compound C12=CC(O)=C(O)C=C2CC2(O)C1C1=CC=C(O)C(O)=C1OC2 WZUVPPKBWHMQCE-UHFFFAOYSA-N 0.000 description 2
- 108091070511 Homo sapiens let-7c stem-loop Proteins 0.000 description 2
- 108091069085 Homo sapiens miR-126 stem-loop Proteins 0.000 description 2
- 108091068991 Homo sapiens miR-141 stem-loop Proteins 0.000 description 2
- 108091068997 Homo sapiens miR-152 stem-loop Proteins 0.000 description 2
- 108091065981 Homo sapiens miR-155 stem-loop Proteins 0.000 description 2
- 108091068956 Homo sapiens miR-186 stem-loop Proteins 0.000 description 2
- 108091068960 Homo sapiens miR-195 stem-loop Proteins 0.000 description 2
- 108091070493 Homo sapiens miR-21 stem-loop Proteins 0.000 description 2
- 108091069527 Homo sapiens miR-223 stem-loop Proteins 0.000 description 2
- 108091070383 Homo sapiens miR-32 stem-loop Proteins 0.000 description 2
- 108091067008 Homo sapiens miR-342 stem-loop Proteins 0.000 description 2
- 108091032103 Homo sapiens miR-425 stem-loop Proteins 0.000 description 2
- 108091032930 Homo sapiens miR-429 stem-loop Proteins 0.000 description 2
- 108091092227 Homo sapiens miR-489 stem-loop Proteins 0.000 description 2
- 108091061672 Homo sapiens miR-660 stem-loop Proteins 0.000 description 2
- 206010062016 Immunosuppression Diseases 0.000 description 2
- 102100037850 Interferon gamma Human genes 0.000 description 2
- 238000012313 Kruskal-Wallis test Methods 0.000 description 2
- 108091008065 MIR21 Proteins 0.000 description 2
- 108091093082 MiR-146 Proteins 0.000 description 2
- 229930182555 Penicillin Natural products 0.000 description 2
- JGSARLDLIJGVTE-MBNYWOFBSA-N Penicillin G Chemical compound N([C@H]1[C@H]2SC([C@@H](N2C1=O)C(O)=O)(C)C)C(=O)CC1=CC=CC=C1 JGSARLDLIJGVTE-MBNYWOFBSA-N 0.000 description 2
- 238000012181 QIAquick gel extraction kit Methods 0.000 description 2
- 239000013614 RNA sample Substances 0.000 description 2
- 102000039471 Small Nuclear RNA Human genes 0.000 description 2
- 108020004566 Transfer RNA Proteins 0.000 description 2
- 230000003321 amplification Effects 0.000 description 2
- 238000013459 approach Methods 0.000 description 2
- 239000012148 binding buffer Substances 0.000 description 2
- 238000005119 centrifugation Methods 0.000 description 2
- 239000003153 chemical reaction reagent Substances 0.000 description 2
- 239000013068 control sample Substances 0.000 description 2
- 230000001351 cycling effect Effects 0.000 description 2
- 230000009089 cytolysis Effects 0.000 description 2
- 238000003745 diagnosis Methods 0.000 description 2
- 230000004064 dysfunction Effects 0.000 description 2
- 239000012530 fluid Substances 0.000 description 2
- JYGXADMDTFJGBT-VWUMJDOOSA-N hydrocortisone Chemical compound O=C1CC[C@]2(C)[C@H]3[C@@H](O)C[C@](C)([C@@](CC4)(O)C(=O)CO)[C@@H]4[C@@H]3CCC2=C1 JYGXADMDTFJGBT-VWUMJDOOSA-N 0.000 description 2
- NOESYZHRGYRDHS-UHFFFAOYSA-N insulin Chemical compound N1C(=O)C(NC(=O)C(CCC(N)=O)NC(=O)C(CCC(O)=O)NC(=O)C(C(C)C)NC(=O)C(NC(=O)CN)C(C)CC)CSSCC(C(NC(CO)C(=O)NC(CC(C)C)C(=O)NC(CC=2C=CC(O)=CC=2)C(=O)NC(CCC(N)=O)C(=O)NC(CC(C)C)C(=O)NC(CCC(O)=O)C(=O)NC(CC(N)=O)C(=O)NC(CC=2C=CC(O)=CC=2)C(=O)NC(CSSCC(NC(=O)C(C(C)C)NC(=O)C(CC(C)C)NC(=O)C(CC=2C=CC(O)=CC=2)NC(=O)C(CC(C)C)NC(=O)C(C)NC(=O)C(CCC(O)=O)NC(=O)C(C(C)C)NC(=O)C(CC(C)C)NC(=O)C(CC=2NC=NC=2)NC(=O)C(CO)NC(=O)CNC2=O)C(=O)NCC(=O)NC(CCC(O)=O)C(=O)NC(CCCNC(N)=N)C(=O)NCC(=O)NC(CC=3C=CC=CC=3)C(=O)NC(CC=3C=CC=CC=3)C(=O)NC(CC=3C=CC(O)=CC=3)C(=O)NC(C(C)O)C(=O)N3C(CCC3)C(=O)NC(CCCCN)C(=O)NC(C)C(O)=O)C(=O)NC(CC(N)=O)C(O)=O)=O)NC(=O)C(C(C)CC)NC(=O)C(CO)NC(=O)C(C(C)O)NC(=O)C1CSSCC2NC(=O)C(CC(C)C)NC(=O)C(NC(=O)C(CCC(N)=O)NC(=O)C(CC(N)=O)NC(=O)C(NC(=O)C(N)CC=1C=CC=CC=1)C(C)C)CC1=CN=CN1 NOESYZHRGYRDHS-UHFFFAOYSA-N 0.000 description 2
- 229940028885 interleukin-4 Drugs 0.000 description 2
- 238000011835 investigation Methods 0.000 description 2
- 230000021633 leukocyte mediated immunity Effects 0.000 description 2
- 239000006166 lysate Substances 0.000 description 2
- 239000012139 lysis buffer Substances 0.000 description 2
- 238000007403 mPCR Methods 0.000 description 2
- 238000005259 measurement Methods 0.000 description 2
- 108091047641 miR-186 stem-loop Proteins 0.000 description 2
- 108091025686 miR-199a stem-loop Proteins 0.000 description 2
- 108091007420 miR‐142 Proteins 0.000 description 2
- 239000003226 mitogen Substances 0.000 description 2
- 238000003199 nucleic acid amplification method Methods 0.000 description 2
- 239000002751 oligonucleotide probe Substances 0.000 description 2
- 239000008188 pellet Substances 0.000 description 2
- 229940049954 penicillin Drugs 0.000 description 2
- 239000008194 pharmaceutical composition Substances 0.000 description 2
- 238000002616 plasmapheresis Methods 0.000 description 2
- 230000000770 proinflammatory effect Effects 0.000 description 2
- 230000002829 reductive effect Effects 0.000 description 2
- 230000001105 regulatory effect Effects 0.000 description 2
- 108020004418 ribosomal RNA Proteins 0.000 description 2
- 238000000926 separation method Methods 0.000 description 2
- 108091029842 small nuclear ribonucleic acid Proteins 0.000 description 2
- 239000000243 solution Substances 0.000 description 2
- 238000007619 statistical method Methods 0.000 description 2
- 239000011550 stock solution Substances 0.000 description 2
- UCSJYZPVAKXKNQ-HZYVHMACSA-N streptomycin Chemical compound CN[C@H]1[C@H](O)[C@@H](O)[C@H](CO)O[C@H]1O[C@@H]1[C@](C=O)(O)[C@H](C)O[C@H]1O[C@@H]1[C@@H](NC(N)=N)[C@H](O)[C@@H](NC(N)=N)[C@H](O)[C@H]1O UCSJYZPVAKXKNQ-HZYVHMACSA-N 0.000 description 2
- 210000004926 tubular epithelial cell Anatomy 0.000 description 2
- 230000003827 upregulation Effects 0.000 description 2
- XLYOFNOQVPJJNP-UHFFFAOYSA-N water Substances O XLYOFNOQVPJJNP-UHFFFAOYSA-N 0.000 description 2
- WEEMDRWIKYCTQM-UHFFFAOYSA-N 2,6-dimethoxybenzenecarbothioamide Chemical compound COC1=CC=CC(OC)=C1C(N)=S WEEMDRWIKYCTQM-UHFFFAOYSA-N 0.000 description 1
- JKMHFZQWWAIEOD-UHFFFAOYSA-N 2-[4-(2-hydroxyethyl)piperazin-1-yl]ethanesulfonic acid Chemical compound OCC[NH+]1CCN(CCS([O-])(=O)=O)CC1 JKMHFZQWWAIEOD-UHFFFAOYSA-N 0.000 description 1
- VHRSUDSXCMQTMA-PJHHCJLFSA-N 6alpha-methylprednisolone Chemical compound C([C@@]12C)=CC(=O)C=C1[C@@H](C)C[C@@H]1[C@@H]2[C@@H](O)C[C@]2(C)[C@@](O)(C(=O)CO)CC[C@H]21 VHRSUDSXCMQTMA-PJHHCJLFSA-N 0.000 description 1
- 206010003226 Arteriovenous fistula Diseases 0.000 description 1
- 108091032955 Bacterial small RNA Proteins 0.000 description 1
- 229940122739 Calcineurin inhibitor Drugs 0.000 description 1
- 101710192106 Calcineurin-binding protein cabin-1 Proteins 0.000 description 1
- 102100024123 Calcineurin-binding protein cabin-1 Human genes 0.000 description 1
- 102000029816 Collagenase Human genes 0.000 description 1
- 108060005980 Collagenase Proteins 0.000 description 1
- 102000004127 Cytokines Human genes 0.000 description 1
- 108090000695 Cytokines Proteins 0.000 description 1
- 238000002965 ELISA Methods 0.000 description 1
- 229920001917 Ficoll Polymers 0.000 description 1
- 240000008168 Ficus benjamina Species 0.000 description 1
- 206010048748 Graft loss Diseases 0.000 description 1
- 101000878605 Homo sapiens Low affinity immunoglobulin epsilon Fc receptor Proteins 0.000 description 1
- 101000946860 Homo sapiens T-cell surface glycoprotein CD3 epsilon chain Proteins 0.000 description 1
- 108091068853 Homo sapiens miR-100 stem-loop Proteins 0.000 description 1
- 108091069086 Homo sapiens miR-127 stem-loop Proteins 0.000 description 1
- 108091068992 Homo sapiens miR-143 stem-loop Proteins 0.000 description 1
- 108091068998 Homo sapiens miR-191 stem-loop Proteins 0.000 description 1
- 108091067470 Homo sapiens miR-204 stem-loop Proteins 0.000 description 1
- 108091070371 Homo sapiens miR-25 stem-loop Proteins 0.000 description 1
- 108091070397 Homo sapiens miR-28 stem-loop Proteins 0.000 description 1
- 108091065453 Homo sapiens miR-296 stem-loop Proteins 0.000 description 1
- 108091066987 Homo sapiens miR-345 stem-loop Proteins 0.000 description 1
- 108091092303 Homo sapiens miR-497 stem-loop Proteins 0.000 description 1
- 108091063565 Homo sapiens miR-532 stem-loop Proteins 0.000 description 1
- 108091061608 Homo sapiens miR-650 stem-loop Proteins 0.000 description 1
- 108091070377 Homo sapiens miR-93 stem-loop Proteins 0.000 description 1
- 108091070375 Homo sapiens miR-95 stem-loop Proteins 0.000 description 1
- 238000012404 In vitro experiment Methods 0.000 description 1
- 102000004877 Insulin Human genes 0.000 description 1
- 108090001061 Insulin Proteins 0.000 description 1
- ZDXPYRJPNDTMRX-VKHMYHEASA-N L-glutamine Chemical compound OC(=O)[C@@H](N)CCC(N)=O ZDXPYRJPNDTMRX-VKHMYHEASA-N 0.000 description 1
- 229930182816 L-glutamine Natural products 0.000 description 1
- 102100038007 Low affinity immunoglobulin epsilon Fc receptor Human genes 0.000 description 1
- 102000007999 Nuclear Proteins Human genes 0.000 description 1
- 108010089610 Nuclear Proteins Proteins 0.000 description 1
- 108091034117 Oligonucleotide Proteins 0.000 description 1
- 238000012408 PCR amplification Methods 0.000 description 1
- 208000005228 Pericardial Effusion Diseases 0.000 description 1
- 239000013616 RNA primer Substances 0.000 description 1
- 239000012980 RPMI-1640 medium Substances 0.000 description 1
- 208000006265 Renal cell carcinoma Diseases 0.000 description 1
- 108091061750 Signal recognition particle RNA Proteins 0.000 description 1
- 102100035794 T-cell surface glycoprotein CD3 epsilon chain Human genes 0.000 description 1
- 239000012163 TRI reagent Substances 0.000 description 1
- 108010006785 Taq Polymerase Proteins 0.000 description 1
- 210000000447 Th1 cell Anatomy 0.000 description 1
- 210000004241 Th2 cell Anatomy 0.000 description 1
- 208000027418 Wounds and injury Diseases 0.000 description 1
- 230000004721 adaptive immunity Effects 0.000 description 1
- 230000002411 adverse Effects 0.000 description 1
- 239000011543 agarose gel Substances 0.000 description 1
- 238000000137 annealing Methods 0.000 description 1
- 238000009175 antibody therapy Methods 0.000 description 1
- 108010054176 apotransferrin Proteins 0.000 description 1
- 238000003149 assay kit Methods 0.000 description 1
- 210000003719 b-lymphocyte Anatomy 0.000 description 1
- 210000000941 bile Anatomy 0.000 description 1
- 238000004166 bioassay Methods 0.000 description 1
- 230000000740 bleeding effect Effects 0.000 description 1
- 210000000601 blood cell Anatomy 0.000 description 1
- 230000036765 blood level Effects 0.000 description 1
- 239000000872 buffer Substances 0.000 description 1
- 238000004113 cell culture Methods 0.000 description 1
- 230000001413 cellular effect Effects 0.000 description 1
- 238000012512 characterization method Methods 0.000 description 1
- 230000001684 chronic effect Effects 0.000 description 1
- 229960002424 collagenase Drugs 0.000 description 1
- 238000004891 communication Methods 0.000 description 1
- 230000000052 comparative effect Effects 0.000 description 1
- 238000004590 computer program Methods 0.000 description 1
- 238000002247 constant time method Methods 0.000 description 1
- 230000002596 correlated effect Effects 0.000 description 1
- 239000003246 corticosteroid Substances 0.000 description 1
- 210000001151 cytotoxic T lymphocyte Anatomy 0.000 description 1
- 230000006378 damage Effects 0.000 description 1
- 238000000354 decomposition reaction Methods 0.000 description 1
- 238000000432 density-gradient centrifugation Methods 0.000 description 1
- 230000037213 diet Effects 0.000 description 1
- 235000005911 diet Nutrition 0.000 description 1
- 238000010790 dilution Methods 0.000 description 1
- 239000012895 dilution Substances 0.000 description 1
- BVTBRVFYZUCAKH-UHFFFAOYSA-L disodium selenite Chemical compound [Na+].[Na+].[O-][Se]([O-])=O BVTBRVFYZUCAKH-UHFFFAOYSA-L 0.000 description 1
- BFMYDTVEBKDAKJ-UHFFFAOYSA-L disodium;(2',7'-dibromo-3',6'-dioxido-3-oxospiro[2-benzofuran-1,9'-xanthene]-4'-yl)mercury;hydrate Chemical compound O.[Na+].[Na+].O1C(=O)C2=CC=CC=C2C21C1=CC(Br)=C([O-])C([Hg])=C1OC1=C2C=C(Br)C([O-])=C1 BFMYDTVEBKDAKJ-UHFFFAOYSA-L 0.000 description 1
- 230000003828 downregulation Effects 0.000 description 1
- 229940079593 drug Drugs 0.000 description 1
- 239000003814 drug Substances 0.000 description 1
- 238000001962 electrophoresis Methods 0.000 description 1
- YQGOJNYOYNNSMM-UHFFFAOYSA-N eosin Chemical compound [Na+].OC(=O)C1=CC=CC=C1C1=C2C=C(Br)C(=O)C(Br)=C2OC2=C(Br)C(O)=C(Br)C=C21 YQGOJNYOYNNSMM-UHFFFAOYSA-N 0.000 description 1
- 238000001914 filtration Methods 0.000 description 1
- 239000012634 fragment Substances 0.000 description 1
- 239000000499 gel Substances 0.000 description 1
- 230000024924 glomerular filtration Effects 0.000 description 1
- 230000036541 health Effects 0.000 description 1
- 238000007417 hierarchical cluster analysis Methods 0.000 description 1
- 229960000890 hydrocortisone Drugs 0.000 description 1
- 210000002865 immune cell Anatomy 0.000 description 1
- 230000028993 immune response Effects 0.000 description 1
- 230000017555 immunoglobulin mediated immune response Effects 0.000 description 1
- 229960003444 immunosuppressant agent Drugs 0.000 description 1
- 230000001861 immunosuppressant effect Effects 0.000 description 1
- 229940124589 immunosuppressive drug Drugs 0.000 description 1
- 238000010348 incorporation Methods 0.000 description 1
- 238000011534 incubation Methods 0.000 description 1
- 238000011221 initial treatment Methods 0.000 description 1
- 208000014674 injury Diseases 0.000 description 1
- 230000015788 innate immune response Effects 0.000 description 1
- 229940125396 insulin Drugs 0.000 description 1
- 238000011862 kidney biopsy Methods 0.000 description 1
- 208000017169 kidney disease Diseases 0.000 description 1
- 108091053410 let-7 family Proteins 0.000 description 1
- 108091073704 let-7c stem-loop Proteins 0.000 description 1
- 238000012423 maintenance Methods 0.000 description 1
- 230000007246 mechanism Effects 0.000 description 1
- 229960004584 methylprednisolone Drugs 0.000 description 1
- 108091063348 miR-193 stem-loop Proteins 0.000 description 1
- 108091036762 miR-193a stem-loop Proteins 0.000 description 1
- 238000012986 modification Methods 0.000 description 1
- 230000004048 modification Effects 0.000 description 1
- 238000007479 molecular analysis Methods 0.000 description 1
- 230000000877 morphologic effect Effects 0.000 description 1
- 238000013059 nephrectomy Methods 0.000 description 1
- 238000010606 normalization Methods 0.000 description 1
- 239000012188 paraffin wax Substances 0.000 description 1
- 210000004738 parenchymal cell Anatomy 0.000 description 1
- 210000004912 pericardial fluid Anatomy 0.000 description 1
- 230000000737 periodic effect Effects 0.000 description 1
- 230000008569 process Effects 0.000 description 1
- 238000000746 purification Methods 0.000 description 1
- 238000011897 real-time detection Methods 0.000 description 1
- 230000009711 regulatory function Effects 0.000 description 1
- 230000004044 response Effects 0.000 description 1
- 238000003757 reverse transcription PCR Methods 0.000 description 1
- 238000012552 review Methods 0.000 description 1
- 229920002477 rna polymer Polymers 0.000 description 1
- 229960001471 sodium selenite Drugs 0.000 description 1
- 235000015921 sodium selenite Nutrition 0.000 description 1
- 239000011781 sodium selenite Substances 0.000 description 1
- 238000010186 staining Methods 0.000 description 1
- 229960005322 streptomycin Drugs 0.000 description 1
- 229960002385 streptomycin sulfate Drugs 0.000 description 1
- 238000006467 substitution reaction Methods 0.000 description 1
- ABZLKHKQJHEPAX-UHFFFAOYSA-N tetramethylrhodamine Chemical compound C=12C=CC(N(C)C)=CC2=[O+]C2=CC(N(C)C)=CC=C2C=1C1=CC=CC=C1C([O-])=O ABZLKHKQJHEPAX-UHFFFAOYSA-N 0.000 description 1
- 231100000331 toxic Toxicity 0.000 description 1
- 230000002588 toxic effect Effects 0.000 description 1
- 238000011277 treatment modality Methods 0.000 description 1
- 230000009452 underexpressoin Effects 0.000 description 1
- 210000003462 vein Anatomy 0.000 description 1
Images


Classifications
-
- C—CHEMISTRY; METALLURGY
- C12—BIOCHEMISTRY; BEER; SPIRITS; WINE; VINEGAR; MICROBIOLOGY; ENZYMOLOGY; MUTATION OR GENETIC ENGINEERING
- C12Q—MEASURING OR TESTING PROCESSES INVOLVING ENZYMES, NUCLEIC ACIDS OR MICROORGANISMS; COMPOSITIONS OR TEST PAPERS THEREFOR; PROCESSES OF PREPARING SUCH COMPOSITIONS; CONDITION-RESPONSIVE CONTROL IN MICROBIOLOGICAL OR ENZYMOLOGICAL PROCESSES
- C12Q1/00—Measuring or testing processes involving enzymes, nucleic acids or microorganisms; Compositions therefor; Processes of preparing such compositions
- C12Q1/68—Measuring or testing processes involving enzymes, nucleic acids or microorganisms; Compositions therefor; Processes of preparing such compositions involving nucleic acids
- C12Q1/6876—Nucleic acid products used in the analysis of nucleic acids, e.g. primers or probes
- C12Q1/6883—Nucleic acid products used in the analysis of nucleic acids, e.g. primers or probes for diseases caused by alterations of genetic material
-
- C—CHEMISTRY; METALLURGY
- C12—BIOCHEMISTRY; BEER; SPIRITS; WINE; VINEGAR; MICROBIOLOGY; ENZYMOLOGY; MUTATION OR GENETIC ENGINEERING
- C12Q—MEASURING OR TESTING PROCESSES INVOLVING ENZYMES, NUCLEIC ACIDS OR MICROORGANISMS; COMPOSITIONS OR TEST PAPERS THEREFOR; PROCESSES OF PREPARING SUCH COMPOSITIONS; CONDITION-RESPONSIVE CONTROL IN MICROBIOLOGICAL OR ENZYMOLOGICAL PROCESSES
- C12Q2600/00—Oligonucleotides characterized by their use
- C12Q2600/156—Polymorphic or mutational markers
-
- C—CHEMISTRY; METALLURGY
- C12—BIOCHEMISTRY; BEER; SPIRITS; WINE; VINEGAR; MICROBIOLOGY; ENZYMOLOGY; MUTATION OR GENETIC ENGINEERING
- C12Q—MEASURING OR TESTING PROCESSES INVOLVING ENZYMES, NUCLEIC ACIDS OR MICROORGANISMS; COMPOSITIONS OR TEST PAPERS THEREFOR; PROCESSES OF PREPARING SUCH COMPOSITIONS; CONDITION-RESPONSIVE CONTROL IN MICROBIOLOGICAL OR ENZYMOLOGICAL PROCESSES
- C12Q2600/00—Oligonucleotides characterized by their use
- C12Q2600/158—Expression markers
-
- C—CHEMISTRY; METALLURGY
- C12—BIOCHEMISTRY; BEER; SPIRITS; WINE; VINEGAR; MICROBIOLOGY; ENZYMOLOGY; MUTATION OR GENETIC ENGINEERING
- C12Q—MEASURING OR TESTING PROCESSES INVOLVING ENZYMES, NUCLEIC ACIDS OR MICROORGANISMS; COMPOSITIONS OR TEST PAPERS THEREFOR; PROCESSES OF PREPARING SUCH COMPOSITIONS; CONDITION-RESPONSIVE CONTROL IN MICROBIOLOGICAL OR ENZYMOLOGICAL PROCESSES
- C12Q2600/00—Oligonucleotides characterized by their use
- C12Q2600/16—Primer sets for multiplex assays
-
- C—CHEMISTRY; METALLURGY
- C12—BIOCHEMISTRY; BEER; SPIRITS; WINE; VINEGAR; MICROBIOLOGY; ENZYMOLOGY; MUTATION OR GENETIC ENGINEERING
- C12Q—MEASURING OR TESTING PROCESSES INVOLVING ENZYMES, NUCLEIC ACIDS OR MICROORGANISMS; COMPOSITIONS OR TEST PAPERS THEREFOR; PROCESSES OF PREPARING SUCH COMPOSITIONS; CONDITION-RESPONSIVE CONTROL IN MICROBIOLOGICAL OR ENZYMOLOGICAL PROCESSES
- C12Q2600/00—Oligonucleotides characterized by their use
- C12Q2600/178—Oligonucleotides characterized by their use miRNA, siRNA or ncRNA
Definitions
- transplantation of organs has progressed from a risky experimental therapy to a safe and life-saving treatment modality in a relatively short span of five decades.
- transplant recipients require life-long treatment with non-specific, toxic, and multiple immunosuppressive drugs, and are ever under the threat of losing their allografts because of immune rejection of the transplanted organ.
- Acute rejection of an organ transplanted from one human to another is an important risk factor for allograft failure.
- the outcome of acute rejection is, however, difficult to predict.
- the method includes measuring an amount of expression of a small non-coding marker RNA in a biological sample from the patient.
- the method further includes comparing the measured amount of expression of the small non-coding marker RNA in the patient to a reference amount of expression of the small non-coding marker RNA.
- the disclosure further includes methods wherein the small non-coding marker RNA is selected from SEQ ID NOs: 1-9, or variants thereof, wherein an increase of expression of the small non-coding marker RNA that is equivalent to at least 1-fold as compared to the reference amount of expression of the small non-coding marker RNA indicates an increased risk of rejection of the transplanted organ.
- the disclosure also includes that the small non-coding marker RNA is selected from SEQ ID NOs: 10-49, or variants thereof, wherein an increase of expression of the small non-coding marker RNA that is equivalent to less than 1-fold as compared to said reference amount of expression of the small non-coding marker RNA indicates an increased risk of rejection of said transplanted organ.
- the method further includes (c) measuring a difference between the amount of expression of the small non-coding marker RNA in the biological sample and the reference amount of expression of said small non-coding marker RNA; (d) measuring an amount of expression of a endogenously expressed small non-coding reference RNA in a biological sample from the patient; (e) measuring a difference between the amount of expression of the endogenously expressed small non-coding reference RNA in the biological sample from the patient and a reference amount of expression of said endogenously expressed small non-coding reference RNA; (f) comparing the difference in step (c) to the difference in step (e); wherein a difference in step (c) that is greater than the difference in step (d) further indicates an increased risk of rejection of said transplanted organ.
- a disclosed method for assessing risk of organ rejection in a patient having a transplanted organ includes: (a) measuring an amount of expression of a small non-coding marker RNA in a biological sample from the patient, said small non-coding RNA selected from SEQ ID NOs: 1-9 or a combination thereof; (b) measuring an amount of expression of an endogenously expressed small non-coding reference RNA in a biological sample from the patient; (c) comparing the measured amount of step (a) to the measured amount of step (b) to determine a first ratio; (d) measuring an amount of expression of said small non-coding marker RNA in a biological sample from a person having a non-rejected organ, said small non-coding RNA selected from SEQ ID NOs: 1-9 or a combination thereof; (e) measuring an amount of expression of an endogenously expressed small non-coding reference RNA in a biological sample from the person having a non-rejected organ; and comparing the measured amount of step (d) to the measured amount of step (e) to determine a
- a disclosed method for assessing risk of organ rejection in a patient having a transplanted organ includes: (a) measuring an amount of expression of a small non-coding marker RNA in a biological sample from the patient, said small non-coding RNA selected from SEQ ID NOs: 10-49, or a combination thereof; (b) measuring an amount of expression of an endogenously expressed small non-coding reference RNA in a biological sample from the patient; (c) comparing the measured amount of step (a) to the measured amount of step (b) to determine a first ratio; (d) measuring an amount of expression of said small non-coding marker RNA in a biological sample from a person having a non-rejected organ, said small non-coding RNA selected from the group consisting of SEQ ID NOs: 10-49, or a combination thereof; (e) measuring an amount of expression of an endogenously expressed small non-coding reference RNA in a biological sample from the person having a non-rejected organ; and comparing the measured amount of step (d) to the measured amount of step
- the disclosure also provides a kit for assessing risk of organ rejection in a patient having a transplanted organ.
- the kit includes at least one nucleic acid molecule complementary to a small non-coding marker RNA selected from the group consisting of SEQ ID NO: 1-49s, or variations thereof, and a means for measuring expression of a small non-coding marker RNA in a biological sample.
- the invention relates to methods for the non-invasive detection of renal allograft rejection using miR 142-5p.
- the inventor discovered, among other things, that certain marker microRNAs (miRNA) are overexpressed or underexpressed in response to organ failure (e.g., acute rejection).
- the invention relates to a method for assessing risk of organ rejection in a patient having a transplanted organ.
- Organ rejection refers to any failure of a transplanted organ resulting from an adverse immune response.
- organ rejection includes acute and/or chronic rejection.
- An episode of acute rejection of an organ can be caused by an antibody-mediated or cell-mediated immune response.
- the cells involved in a cell-mediated immune response include, for example, activated cytotoxic T cells.
- An episode of acute rejection typcially occurs within fourteen days, more typically within ten days, and even more typically within five days after a transplant if the patient is not taking an immunosuppressant drug.
- an episode of acute rejection generally occurs within about one year of a transplanted organ, more specifically within about nine months, even more specifically within about six months, and most specifically within about three months after transplant of an organ.
- Acute rejection can occur at any time during the life of a transplanted organ. Further, a patient can have more than one episode of acute rejection of a transplanted organ.
- the method includes measuring an amount of expression of a small non-coding marker RNA in a biological sample from the patient.
- a small non-coding RNA refers to a ribonucleic acid sequence that does not code for a protein.
- the small non-coding RNA may perform a regulatory function in the cell by regulating gene expression through sequence-specific base-pairing with complementary mRNA sequences.
- a small non-coding RNA is less than about 40 nucleotides in length, preferably less than about 30 nucleotides, for example, about 29, 28, 27, 26, 25, 24, 23, 22, 21, or 20 nucleotides in length.
- the small non-coding RNA is more than about 10 nucleotides, for example, 11, 12, 13, 14, 15, 16, 17, 18, 19, or 20 nucleotides in length. Any maximum value can be combined with any minimum value to define a range.
- RNA examples include transfer RNA (tRNA), ribosomal RNA (rRNA), microRNA (miRNA), small nuclear RNA (snRNA), small nucleolar RNA (snoRNA), and/or signal recognition particle RNA complex (SRP).
- tRNA transfer RNA
- rRNA ribosomal RNA
- miRNA microRNA
- snRNA small nuclear RNA
- snoRNA small nucleolar RNA
- SRP signal recognition particle RNA complex
- the small non-coding RNA is miRNA.
- a small non-coding marker RNA as used herein refers to a small non-coding RNA that is used to assess risk of organ rejection.
- Specific examples of a small non-coding marker RNA include the following nucleic acid molecules and/or a nucleic acid molecule that has at least about 85%, 86%, 87%, 88%, 89%, 90%, 91%, 92%, 93%, 94%, 95%, 96%, 97%, 98%, or 99% sequence identity to a sequence set forth below:
- Percent nucleic acid sequence identity with respect to the small non-coding RNAs identified herein is defined as the percentage of nucleic acids in a candidate sequence that are identical with the nucleic acids in the specific small non-coding RNA sequence, after aligning the sequences and introducing gaps, if necessary, to achieve the maximum percent sequence identity, and not considering any conservative substitutions as part of the sequence identity.
- Alignment for purposes of determining percent nucleic acid sequence identity can be achieved in various ways that are within the skill in the art, for instance, using publicly available computer software such as BLAST, BLAST-2, ALIGN or Megalign (DNASTAR) software. Those skilled in the art can determine appropriate parameters for measuring alignment, including any algorithms needed to achieve maximal alignment over the full length of the sequences being compared.
- NCBI-BLAST2 Altschul et al., Nucleic Acids Res. 25:3389-3402 (1997 )).
- NCBI-BLAST2 sequence comparison program may be downloaded from the National Center for Biotechnology Information's website or otherwise obtained from the National institutes of Health, Bethesda, Md.
- the method of the invention may include measuring an amount of expression of one small non-coding RNA or a combination of the small non-coding RNAs described above.
- RNA is typically found in a biological sample from the patient.
- a biological sample refers to any sample obtained from a patient.
- Exemplary biological samples include blood, urine, a tissue sample from any organ, and/or tissue sample from the transplanted organ. Urine samples are preferred.
- the method further includes comparing the measured amount of expression of the small non-coding marker RNA in the biological sample from the patient to a reference amount of expression of the small non-coding marker RNA.
- the reference amount of expression of the small non-coding marker RNA may be obtained by measuring an amount of expression of the small non-coding RNA in a person having a non-rejected organ.
- the person having a non-rejected organ includes a healthy person.
- the healthy person is a person of similar age, gender, race, graft-donor source. Banff histologic grade, and/or underwent the same initial anti-rejection treatment as the patient having a transplanted organ for which risk of organ failure is to assessed.
- a well-functioning (e.g., stable) transplanted organ may be defined as a transplanted organ that does not exhibit organ failure (e.g., rejection).
- a well-functioning transplanted organ is a transplanted organ that has not developed transplant dysfunction or morphologic evidence of transplant injury in areas of the transplant
- a stable functioning kidney transplant may be defined as having a serum creatinine concentration that has not changed by more than approximately 0.2 mg per deciliter during the seven days before and the seven days after collection of the biologic specimen for measurements of the small non-coding RNA.
- the person having a well-functioning (e.g., stable) transplanted organ is a person of similar age, gender, race, graft-donor source, Banff histologic grade, and/or underwent the same initial anti-rejection treatment as the patient having a transplanted organ for which risk of organ failure is to assessed.
- the reference amount is obtained by measuring an amount of expression of said small non-coding RNA in a second biological sample from the patient.
- the second biological sample may be obtained from the patient before the organ transplantion and/or from another non-rejected organ of the patient.
- the reference amount of expression of the small non-coding RNA is a value for expression of the small non-coding RNA that is accepted in the art.
- the method includes comparing the measured amount of expression of the small non-coding RNA to the reference amount of expression of the small non-coding RNA.
- the small non-coding marker RNA may be, for example, a small non-coding RNA selected from SEQ ID NOs: 1-53, or variants thereof.
- Preferably the small non-coding marker RNA is selected from SEQ ID NOs 1: 49, or variants thereof.
- the small non-coding marker RNA is selected from a sequence set forth in SEQ ID NOs: 1-9. or a variation thereof.
- the small non-coding marker RNA includes a small non-coding RNA selected from miR-142-5p; miR-142-3p; miR-155; miR-223; miR-146a; miR-146b; miR-342; miR-650; miR-21; and/or miR-425-5p, or a combination thereof, wherein an increase of expression of the small non-coding marker RNA that is equivalent to at least about 1-fold as compared to the reference amount of expression of the small non-coding marker RNA indicates an increased risk of rejection of the transplanted organ.
- the small non-coding marker RNA is miR-142-5p; miR-142-3p; and/or miR-155.
- An increase of expression that is equivalent to at least about 1-fold may be an increase in an amount equivalent to at least about 1-.
- the increase is a fold value. Examples of methods to quantify an increase of expression are known in the art, as are described in the General Methods section below.
- An increased risk of organ rejection varies in different patients and the type of organ transplanted. Generally, the increased risk is at least about 25%, at least about 50%, at least about 75%, or at least about 90% as compared to a person having no risk of organ rejection.
- an increase of expression of the small non-coding marker RNA selected from a sequence set forth in SEQ ID NOs: 1-9, or a variation thereof, that is equivalent to about less than 1-fold, as compared to the reference amount of expression of the small non-coding marker RNA indicates a decreased risk of rejection of the transplanted organ.
- the decreased risk of organ rejection varies in different patients and the type of organ transplanted. Generally, the decreased risk is at least about 25%, at least about 50%, at least about 75%, or at least about 90% as compared to a person having no risk of organ rejection.
- the small non-coding marker RNA is selected from a sequence set forth in SEQ ID NOs: 10-49, or a variation thereof.
- the small non-coding marker RNA includes a small non-coding RNA selected from miR-30c; miR-30a-3p; miR-10a; miR-30e-3p; miR-30b; miR-10b; miR-32; miR-9; miR-193b; miR-143; miR-489; miR-27b; miR-126; miR-378; miR-429; miR-181c; miR-196b; miR-199a; miR-660; miR-203; miR-204;miR-30e-5p; miR-30a-5p; miR-30d; miR-125b; miR-130a; miR-126; miR-195; miR-26a; miR-26b; miR-497; miR-152; miR-141; miR-296; miR-365; miR-99a
- An increase of expression that is equivalent to less than 1-fold may be an increase of at most about 0.9-, 0.8-, 0.7-, 0.6-, 0.5-, 0.4-, 0.3-, 0.2-, or 0.1-fold, or less as compared to the increase in the reference amount of expression of the small non-coding marker RNA.
- the increase is a fold value. Examples of methods to quantify an increase of expression are known in the art, as are described in the General Methods section below.
- an increase of expression of the small non-coding marker RNA selected from a sequence set forth in SEQ ID NOs: 10-49, or a variation thereof, equivalent to at least about 1-fold, or more, as compared to the reference amount of expression of the small non-coding marker RNA. indicates a decreased risk of rejection of the transplanted organ.
- the decreased risk of organ rejection varies in different patients and the type of organ transplanted. Generally, the decreased risk is at least about 25%, at least about 50%, at least about 75%, or at least about 90% as compared to a person having no risk of organ rejection.
- the method for assessing risk of organ rejection further includes measuring an amount of an endogenously expressed small non-coding reference RNA in a biological sample from the patient.
- the method includes measuring a reference amount of an endogenously expressed small non-coding reference RNA in a biological sample.
- the reference amount may be obtained by measuring the amount of expression of the endogenously expressed small non-coding reference RNA in a person having a non-rejected organ or in a second biological sample from the patient, as described above.
- the reference amount is a value for expression of the endogenously expressed small non-coding reference RNA that is accepted in the art.
- An endogenously expressed small non-coding reference RNA refers to a small non-coding RNA that is endogenously expressed (e.g., expressed within the patient, cell, and/or tissue) and demonstrates an expression that is relatively constant and abundant in the biological sample.
- the endogenously expressed small non-coding reference RNA is stable, has a similar size as the measured small non-coding RNA (e.g., SEQ ID NOs: 1-53), and is amenable to means for measuring expression.
- endogenously expressed small non-coding reference RNA examples include RNU24, RNU66, RNU19, RNU38B, RNU49, Z30, RNU6B, RNU48, RNU43, and/or RNU44.
- the endogenously expressed small non-coding reference RNA is endogenous small nucleolar RNA RNU44.
- the method further includes measuring a difference between the amount of expression of the small non-coding marker RNA in the biological sample and the reference amount of expression of the small non-coding marker RNA.
- the method can include measuring the difference between the amount of expression of the small non-coding marker RNA in the biological sample from the patient and the reference amount of expression of the small non-coding marker RNA.
- the reference amount may be obtained by measuring the amount of expression of the endogenously expressed small non-coding reference RNA in a person having a non-rejected organ or in a second biological sample from the patient, as described above.
- the reference amount is a value for expression of the endogenously expressed small non-coding reference RNA that is accepted in the art.
- the embodiment further includes measuring a difference between the amount of expression of the endogenously expressed small non-coding reference RNA in the biological sample and the reference amount of expression of the endogenously expressed small non-coding reference RNA.
- the method includes measuring the difference between the amount of expression of the endogenously expressed small non-coding reference RNA in the biological sample from the patient and the reference amount of expression of the endogenously small non-coding reference RNA.
- the reference amount may be obtained by measuring the amount of expression of the endogenously expressed small non-coding reference RNA in a person having a non-rejected organ or in a second biological sample from the patient, as described above.
- the reference amount is a value for expression of the endogenously expressed small non-coding reference RNA that is accepted in the art.
- the embodiment further includes comparing (i) the difference in amount of expression of the small non-coding marker RNA between the patient sample and the reference amount and (ii) the difference in amount of expression of the endogenously expressed small non-coding reference RNA between the patient sample and the reference amount.
- the difference in (i) i.e., expression of the small non-coding marker RNA between the patient sample and the reference amount
- the difference in (ii) i.e., the amount of expression of the endogenously expressed small non-coding reference RNA between the patient sample and the reference amount
- the comparison further indicates an increased risk of rejection of the transplanted organ.
- a difference in (i) that is greater than the difference in (ii) by an amount equivalent to at least about 1-, 2-, 3-, 4-, 5-, 6-, 7-, 8-, 9-, 10-, 11-, 12-, 13-, 14-, 15-, 16-, 17-, 18-, 19-, 20-fold, or more, indicates an increased risk of rejection of the transplanted organ.
- the present embodiment relates to one example by which one skilled in the art may measure and/or determine whether the increase in expression of the small non-coding RNA, as compared to the reference amount, is statistically significant in the patient.
- the invention includes normalizing the amount of expression of the small non-coding marker RNA.
- the method includes measuring an amount of expression of a small non-coding marker RNA in a biological sample from the patient, as described above.
- the method further includes measuring an amount of expression of an endogenously expressed small non-coding reference RNA in a biological sample from the patient.
- the method includes comparing the measured amount of the small non-coding marker RNA from the patient to the measured amount of endogenously expressed small non-coding reference RNA from the patient to determine a first ratio.
- the method further includes measuring an amount of expression of the small non-coding marker RNA in a biological sample from a person having a non-rejected organ.
- the method further includes measuring an amount of expression of an endogenously expressed small non-coding reference RNA in a biological sample from the person having a non-rejected organ.
- the method includes comparing the measured amount of the small non-coding marker RNA from the person having a non-rejected organ to the measured amount of endogenously expressed small non-coding reference RNA from the person having a non-rejected organ to determine a second ratio.
- the calculated increase of the first ratio over the second ratio that is at least 1-fold may be an increase that is equivalent to at least about 1-, 2-, 3-, 4-, 5-, 6-, 7-, 8-, 9-, 10-, 11-, 12-, 13-, 14-, 15-, 16-, 17-, 18-, 19-, 20-fold, or more.
- the calculated increase of the first ratio over the second ratio may be an increase that is equivalent to less than 1-fold may be an increase of at most about 0.9-, 0.8-, 0.7-, 0.6-, 0.3-, 0.4-, 0.3-, 0.2-, or 0.1-fold, or less.
- fold changes or equivalents thereof for the small non-coding marker RNA are normalized to the endogenously expressed small non-coding reference RNA.
- the method for assessing risk of organ rejection in a patient may further include determining the amount of serum creatinine protein in the patient.
- the determination of the amount of serum creatinine can be made by any method known to those skilled in the art, such as those described in U.S. Patent Publication US20080131441 .
- the measured amount of serum creatinine in the patient is compared to a control amount of serum creatinine of a healthy person or a person having a well-functioning (e.g., stable) transplant, as described in U.S. Patent Publication US20080131441 .
- the normal level of serum creatinine in a healthy person or a person with a well-functioning transplant is generally about 0.8-1.6 milligrams/deciliter.
- the person may be the patient or a person different from the patient.
- the serum creatinine level from the patient can be compared to that of one or more previously determined control samples or to a level recognized by the physician or clinician conducting the method, or by a consensus of medical and/or clinical practitioners.
- the method further includes informing the patient whether the patient is at decreased or increased risk of organ rejection.
- the information that a patient is at risk of rejection of a transplanted organ is useful.
- Such patients can be prescribed and/or administered a treatment to prevent rejection and/or loss of the transplanted organ.
- the treatment includes administering to the patient an effective amount of a pharmaceutical composition to prevent rejection and/or loss of the transplanted organ.
- a pharmaceutical composition to prevent rejection and/or loss of the transplanted organ.
- Such pharmaceutical compositions are well known to those skilled in the art, and include, for example a steroid pulse, an antibody, etc.
- a steroid pulse therapy can include the administration for three to six days of a high dose corticosteroid (e.g., greater than 100 mg).
- An example of an antibody therapy includes the administration for seven to fourteen days of the polyclonal antibody Thymoglobin or the monoclonal antibody, OKT3.
- Plasmapheresis is a process in which the fluid part of the blood (i.e., plasma) is removed from blood cells. Typically, the plasma is removed by a device known as a cell separator. The cells are generally returned to the person undergoing treatment, while the plasma, which contains antibodies, is discarded.
- a biological sample from a patient or person can be obtained by any method known to those in the art.
- further examples of biological samples include transplant tissue biopsy, blood, urine, bile, bronchoalveolar lavage fluid, and pericardial fluid.
- Suitable methods include, for example, venous puncture of a vein to obtain a blood sample, collection of a urine specimen, and a percutaneous core needle biopsy.
- RNA can be isolated from the sample by any method known to those in the art.
- commercial kits such as the TRI Reagent® commercially available from Molecular Research Center, Inc. (Cincinnati, OH), or the mir Vana miRNA isolation kit from Ambion, can be used to isolate RNA.
- the yield and purity of RNA can be measured using a NanoDrop ND-1000 spectrophotometer.
- the quantification of small non-coding RNA from total mRNA from the biological sample can be performed by any method known to those in the art.
- kinetic, quantitative PCR involves reverse transcribing the total RNA (e.g., by using the Taqman Multiplex RT set for TaqMan Array Human MicroRNA Panel v1.0) and polymerase chain reaction (PCR).
- Quantitative PCR can be carried out on an Applied BioSystems 7900HT thermocycler, or an equivalent thereof, using the manufacturer's recommended cycling conditions.
- cDNA can be reverse transcribed from the total RNA samples using specific small non-coding RNA primers, which may be obtained from the TaqMan MicroRNA assays (Applied Biosystems) and reagents from the TaqMan microRNA reverse transcription kit (Applied Biosystems).
- the isolated small non-coding RNA may be amplified by methods known in the art.
- Amplification systems utilizing, for example, PCR or RT-PCR methodologies are known to those skilled in the art.
- the amounts of small non-coding RNA can be determined using kinetic, quantitative PCR.
- PCR products are amplified from cDNA samples using the TaqMan microRNA assay (Applied Biosystems).
- An alternative method for determining the amount of small non-coding RNA expression includes the use of molecular beacons and other labeled probes useful in, for example multiplex PCR.
- the PCR mixture contains primers and probes directed to the small non-coding RNA PCR product.
- a single fluorochrome is used in the assay.
- the molecular beacon or probe is detected to determine the amount of small non-coding RNA.
- Molecular beacons are described, for example, by Tyagi and Kramer (Nature Biotechnology 14, 303-308, 1996 ) and by Andrus and Nichols in U.S. Patent Application Publication No. 20040053284 .
- Another method includes, for instance, quantifying cDNA (obtained by reverse transcribing the small non-coding RNA) using a fluorescence based real-time detection method, such as the ABI PRISM 7700 or 7900 Sequence Detection System [TaqMan®] commercially available from Applied Biosystems, Foster City, Calif. or similar system as described by Heid et al., (Genome Res. 1996;6:986-994 ) and Gibson et al.(Genome Res. 1996;6:995-1001 ).
- a fluorescence based real-time detection method such as the ABI PRISM 7700 or 7900 Sequence Detection System [TaqMan®] commercially available from Applied Biosystems, Foster City, Calif. or similar system as described by Heid et al., (Genome Res. 1996;6:986-994 ) and Gibson et al.(Genome Res. 1996;6:995-1001 ).
- Small non-coding marker RNA copy numbers can then be normalized using an endogenously expressed small non-coding reference RNA copy number and the abundance of the small non-coding marker RNA can be expressed as a ratio of the small non-coding marker RNA to the endogenously expressed small non-coding reference RNA.
- the amount of small non-coding RNA expression in a biological sample is significantly greater if the expression of small non-coding RNA is heightened.
- a discriminatory level for heightened gene expression e.g., the baseline magnitude of expression
- the group of values as used herein includes, for example, a minimum of at least about 2 values, more preferably a minimum of at least about 10 values, most preferably a minimum of at least about 20 values.
- the group of values as used herein includes, for example, a maximum of at most about 500 values, more preferably a maximum of at most about 100 values, most preferably a maximum of at most about 50 values.
- Heightened expression of the small non-coding RNA is considered to be significantly greater if the value is greater than the mean ⁇ 95% confidence interval of a group of values observed in non-rejecting organs.
- the level of the small non-coding RNA in the cell sample is considered to be significantly lower if the amount of expression of the small non-coding RNA is lower than the mean ⁇ 95% confidence interval of a group of values observed in non-rejecting organs.
- the amount of expression of the small non-coding RNA is typically considered not significantly greater if the level of the small non-coding RNA in the biological sample is not greater than the mean ⁇ 95% confidence interval of a group of values observed in non-rejecting organs.
- the amount of expression of the small non-coding RNA is normally considered not significantly lower if the amount in a biological sample is not lower than the mean ⁇ 95% confidence interval of a group of values observed in nonrejecting transplants.
- the amount of expression of the small non-coding marker RNA in a biological sample is significantly greater if the log-transformed mean ( ⁇ SE) ratio of the small non-coding marker RNA copies to the endogenously expressed small non-coding reference RNA copies is higher relative to a control ratio in non-rejecting organs, as determined by the Kruskal-Wallis test.
- ⁇ SE log-transformed mean
- a significantly greater ratio is typically at least about ⁇ SE 3.0, more typically between ⁇ SE 3.0 and 5.0, and most typically between ⁇ SE 3.8 and 4.7.
- the amount of the small non-coding RNA in a biological sample is significantly lower if the log-transformed mean ( ⁇ SE) ratio of the small non-coding marker RNA copies to the endogenously expressed small non-coding reference RNA copies is reduced relative to a control ratio (i.e., control values, control levels) in non-rejecting organs, as determined by the Kruskal-Wallis test.
- a control ratio i.e., control values, control levels
- a typical non-rejecting organ control ratio is not more than about 2.5, more typically 1.0 to 2.5, and most typically from 1.3 and 2.0.
- the amount of small non-coding RNA when compared to a control amount may be increased by at least about 10%, at least about 50%, or at least about 100%.
- the amount of expression level of a small non-coding RNA when compared to a control amount may be decreased by at least about 10%, at least about 50%, or at least about 100% lower.
- the amount of small non-coding marker RNA or the endogenously expressed small non-coding reference RNA can be compared to that of one or more previously determined control samples or compared to an amount recognized by the physician or clinician conducting the method of a consensus of medical and/or clinical practitioners.
- any method known in the art can be used for determining the amount of serum creatinine in the biological sample. Suitable methods for determining protein levels include an ELISA and a standard blot. Briefly, these assays are normally based on incubating an antibody specific to the protein with a sample suspected of containing the protein, and detecting the presence of a complex between the antibody and the protein.
- kits can be utilized.
- An example of a commercial kit for determining creatinine level is the QuantiChromTM Creatinine Assay Kit from BioAssay Systems (Hayward, Ca).
- the disclosure includes a kit for assessing risk of organ rejection in a patient having a transplanted organ.
- the kit includes at least one nucleic acid molecule complementary to a small non-coding marker RNA selected from SEQ ID NOs: 1-49, or variations thereof.
- the kit further includes a means for measuring expression of a small non-coding marker RNA in a biological sample.
- the kit may also include written instructions for a method of assessing risk of organ rejection, as described above.
- the means for measuring expression includes quantitative polymerase chain reaction. Additional means for measuring expression include those described under General Methods.
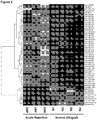
- Example 1 MicroRNA Expression Profiles of Human Renal Allografts.
- 174 ⁇ 7 miRNAs (48%) were expressed in each biopsy sample (174 ⁇ 10 miRNAs in the AR biopsies vs. 174 ⁇ 4 miRNAs in the normal allograft biopsies). Unsupervised hierarchical clustering of miRNA expression patterns correctly classified the normal allograft biopsies and the AR biopsies ( Fig. 1 A ).
- Example 2 MicroRNAs Distinguishing Acute Rejection Biopsies from Normal Allograft Biopsies. Supervised analysis was used to detect miRNAs differentially expressed in AR biopsies and normal allograft biopsies. A subset of 17 miRNAs was differentially expressed at a P value ⁇ 0.01.
- the fold changes were calculated using the delta-delta C T method, using 1 of the normal biopsies as the calibrator.
- the mean fold presented corresponds to the ratio of acute rejection biopsy to normal allograft biopsy.
- ⁇ P value calculated using Student's t test.
- ⁇ Two sequences corresponding to miR-126 have been quantified in the microfluidic cards.
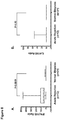
- Example 3 Validation of the MicroRNA Signatures Predictive of Renal Allograft Status.
- An independent set of 26 renal allograft biopsies (9 AR biopsies and 17 normal allograft biopsies) was used to validate a subset of miRNAs identified by global expression profiling to be differentially expressed in AR biopsies and normal allograft biopsies.
- Fig. 3 confirms the differential expression of miRNAs in AR biopsies compared to normal allograft biopsies.
- Example 4 Intragraft miRNA Levels Are Biomarkers of Renal Allograft Status. We investigated whether intragraft miRNA levels predict AR and renal allograft function. We used receiver-operating curves (ROCs) to analyze miRNA levels to determine cutoff points that yielded the highest combined sensitivity and specificity for predicting AR and allograft function. Our analysis showed that AR can be predicted very accurately using intragraft levels of miR-1425p (100% sensitivity and 95% specificity, P ⁇ 0.0001, Table 1) or miR-155 (100% sensitivity and 95% specificity. P ⁇ 0.0001, Table 1). Intragraft levels of miR-223, -10b, -30a-3p, and let-7c were also diagnostic of AR but with a lesser level of accuracy (Table 1).
- ROCs receiver-operating curves
- AR can also be predicted using intragraft levels of T cell CD3 mRNA, B cell CD20 mRNA, and mRNA encoding renal tubular proteins NKCC-2 and USAG-1 but with much less sensitivity and specificity compared to intragraft levels of miR-142-5p, -155, or -223 (Table 1).
- Example 5 Mechanisms for the Altered Intragraft Expression of miRNAs in AR Biopsies.
- R 2 0.61.
- intragraft levels of CD3 mRNA or CD20 mRNA and miR-30a-3p, miR-10b, or let-7c all P values >0.05).
- the miRNAs overexpressed in AR biopsies were all expressed at a higher level in normal human PBMCs compared to miRNAs (miR-30a-3p, miR-10b, or let-7c) underexpressed in AR biopsies.
- Example 6 Renal Allograft Recipients and Biopsy Specimens .
- Example 7 MicroRNA Expression Profiling .
- Global miRNA profiling of allograft biopsy specimens was studied using the TaqMan low-density array human microRNA panel v1.0 containing 365 mature human miRNAs (Applied Biosystems). miRNAs found to be differentially expressed in AR biopsies compared to normal allograft biopsies were quantified using TaqMan miRNA assays (Applied Biosystems) modified by the incorporation of our standard curve protocol. Details for total RNA purification, miRNA profiling, quantification, and data analysis are provided below.
- Example 8 Measurement of Intragraft Levels of mRNA Using Kinetic Quantitative PCR Assay. The expression level of mRNAs was quantified using real-time quantitative PCR assays as detailed below. Primers and probes sequences are shown in Table 4, below. Table 4.
- Oligonucleotide primers and probes used in real-time quantitative polymerase chain reaction assays for the quantification of mRNAs Gene Accession number Sequence Location CD3-epsilon NM_000733 Sense: 5'-AAGAAATGGGTGGTATTACACAGACA-3' (SEQ ID NO:54) 131-156 Antisense: 5'-TGCCATAGTATTTCAGATCCAGGAT-3' (SEQ ID NO:55) 233-209 170-202 CD20 NM_021950 Sense: 5'-AACTCCCCATCTACCCAATACTGTT-3' (SEQ ID NO:57) 616-640 Antisense: 5'-AGAAGGCAAAGATCAGCATCACT-3' (SEQ ID NO:58) 697-675 642-672 NKCC-2 BC0401382 Sense: 5'-TCACGAGCAACTCGCAAAGA-3' (SEQ ID NO; 60) 588-607 Antisene: 5'-TCCCATCACCGTTAGC
- Example 9 Cell Culture. The procedures for the in vitro studies using peripheral blood mononuclear cells and normal human renal epithelial cells are described below.
- Example 10 Human Renal Allograft Biopsy Classification. Percutaneous core needle biopsies were obtained and formalin-fixed, paraffin embedded renal biopsies were stained with hematoxylin and eosin, periodic acid-Schiff and Masson's trichrome, and analyzed by a pathologist, blinded to the results of molecular studies using the Banff 97 classification. Immunosuppression consisted of a calcineurin inhibitor-based regimen, with methyl prednisolone for the initial treatment of acute rejection. The study was approved by the Institutional Review Board at the Weill Cornell Medical College, and each patient gave written informed consent.
- Example 11 Global MicroRNA Expression Profiling. Allograft biopsy samples were placed in RNAlater (Ambion) and stored at -80 °C until RNA extraction. Total RNA was extracted from biopsies using the mir Vana miRNA isolation kit according to the manufacturer's specification (Ambion). The yield and purity of RNA were measured using a NanoDrop ND-1000 spectrophotometer (Nanodrop Technologies), and RNA integrity was assessed using the RNA 6000 Nano LabChip kit (Agilent Technologies).
- TaqMan Low-Density Array Human MicroRNA Panel v1.0 (Applied Biosystems), a 384-well microfluidic card that contains primers and probes for 365 different human miRNAs in addition to 2 small nucleolar RNAs that function as endogenous controls for data normalization, for global miRNA profiling of allograft biopsy specimens.
- Total RNA (480 ng) was reverse transcribed using the TaqMan Multiplex RT set for TaqMan Array Human MicroRNA Panel v1.0.
- Each RT reaction was diluted 62.5-fold with water, and 55 ⁇ L of each diluted product was combined with 55 ⁇ L of TaqMan 2X Universal PCR Master Mix, No AmpErase UNG.
- One-hundred microliters of the sample/master mix for each Multiplex pool were loaded into fill reservoirs of the microfluidic card; the array was then centrifuged and mechanically sealed with the Applied Biosystems sealer device.
- Quantitative PCR was carried out on an Applied BioSystems 7900HT thermocycler using the manufacturer's recommended cycling conditions. Fold changes for each miRNA were normalized to the endogenous control RNU44 small nucleolar RNA.
- the relative expression levels between samples were calculated using the comparative delta C T (threshold cycle number) method with a control sample (normal) as the reference point.
- Example 12 TaqMan Low-Density Array Analysis. Data analysis was performed by using the SDS software version 2.3 and the baseline and threshold were automatically set. Data were normalized and then analyzed to define genes that are differentially expressed between the AR biopsies and normal protocol biopsies. Assays that had C T values >35 were removed from the analysis. The delta C T values were calculated by using RNU44 as the endogenous control. Unsupervised clustering method and principal component analysis (PCA) were used to visualize patterns in the data set without any a priori sample classification. Average linkage clustering analysis was implemented in the Cluster program and Java Tree View 1.0.12 software. PCA were done using the xlstat software. Data were analyzed using Applied Biosystem's ABqPCR data analysis tool (Applied Biosystems, personal communication). A Student t test was performed to detect differentially expressed miRNAs between the AR samples and normal allograft biopsies.
- PCA principal component analysis
- Example 13 Quantification of MicroRNAs. miRNAs found to be differentially expressed in AR biopsies compared to normal allograft biopsies by the TaqMan Low-Density Array were measured using Taq- Man miRNA assays (Applied Biosystems) in 9 additional AR samples and 17 additional normal allograft biopsies (26 biopsies, validation set). TaqMan miRNA assays were also used to quantify miRNA in the in vitro experiments. Reverse transcription for individual miRNAs was performed using the TaqMan microRNA reverse transcription kit (Applied Biosystems).
- cDNA were reverse transcribed from total RNA samples using specific miRNA primers from the TaqMan microRNA assays (Applied Biosystems) and reagents from the TaqMan microRNA reverse transcription kit (Applied Biosystems). Each reverse transcription reaction consists of 7 ⁇ L master mix, 3 ⁇ L miRNA-specific primer, and 5 ⁇ L of 1 ng/ ⁇ L dilution of total RNA. Reverse transcription was done in Veriti thermal cyclers (Applied Biosystems), using the following parameter values: 16 °C for 30 min, 42 °C for 30 min, and 85 °C for 5 min. PCR products were amplified from cDNA samples using the TaqMan microRNA assay (Applied Biosystems).
- PCR for each sample was set up in duplicate as a 20- ⁇ L reaction volume using 1 ⁇ L 20X TaqMan miRNA assay (Applied Biosystems) containing a mix of miRNA-specific forward PCR primer, a specific reverse PCR primer, and a miRNA-specific TaqMan MGB probe, TaqMan Universal PCR Master Mix, and 1.5 ⁇ L cDNA.
- a synthetic amplicon was used to develop a standard curve (see below) and TaqMan C T values were converted into absolute copy numbers. See, N Engl J Med 358:353-361 .
- miRNA copy numbers were normalized using RNU44 small nucleolar RNA copy numbers and the abundance of miRNAs was expressed as a ratio of miRNA copies to RNU44 copies (miRNA copies in 1 ⁇ g RNA/RNU44 small nucleolar RNA copies in 1 ⁇ g RNA).
- TaqMan microRNA assays were performed using an ABI Prism 7500 real-time PCR system.
- Example 14 Quantification of Messenger RNAs. Levels of mRNAs were measured using an ABI Prism 7500 Fast detection system (Applied Biosystems). PCR for each sample was set up in duplicate as a 20- ⁇ L reaction volume using 10 ⁇ L TaqMan Universal PCR Master Mix, 2.5 ⁇ L preamplified template cDNA, 0.15 ⁇ L primers (sense primer and antisense primer, 50 ⁇ M each; Table 4 lists the oligonucleotide primers and probes), 0.05 ⁇ L probe (100 ⁇ M), and 7.34 ⁇ L of water.
- the PCR amplification protocol consists of an initial hold at 95 °C for 20 seconds and 40 cycles of denaturing at 95 °C for 3 seconds and primer annealing and extension at 60 °C for 30 seconds.
- Transcript levels are calculated using our standard curve method (see below), and mRNA copy numbers are normalized using 18S rRNA copy numbers (mRNA copies in 1 ⁇ g RNA/18S rRNA copies in 1 ng RNA).
- RNA levels were calculated using our previously described standard curve method, incorporated by reference herein from Kawai T, et al. (2008) HLA-mismatched renal transplantation without maintenance immunosuppression. N Engl J Med 358:353-361 .
- the standard curve was established using PCR generated 73-bp mouse Bak amplicon as the standard.
- the Bak amplicon was generated in a PCR using GeneAmp 9600 thermal cycler and with 3 ⁇ L cDNA and 22 ⁇ L of dNTP, 10 ⁇ PCR buffer, TaqDNA polymerase, and Bakspecific oligonucleotide primer pair [sense primer: 5' CCCACATCTGGACCAGAGTCA 3' (192-212) (SEQ ID NO:84); antisense primer: 5' CAGATGCCATTTTTCAGGTCTTG 3' (264-242) (SEQ ID NO:85), accession no. Y13231].
- the PCR product was separated by electrophoresis with a 2% agarose gel and the amplicon size (73 bp) was confirmed using a DNA size standard of pUC mix marker 8 (Crystalgen).
- the Bak amplicon was isolated and purified from the gel with QIAquick gel extraction kit (QIAGEN), The absolute quantity of the purified amplicon was measured by A260 and converted to the number of copies using the molecular weight of DNA.
- the Bak amplicon was diluted to the concentration of 10 7 copies/ ⁇ L (stock solution). When a standard curve was to be established for the real-time quantitative PCR assay, the stock solution was diluted over 6 orders of magnitude (1,000,000, 100,000, 10,000, 1,000, 100, and 10 copies per 1 ⁇ L) (work solution).
- Example 16 Isolation of Normal Human Peripheral Blood Mononuclear Cells and Activation with Phytohaemagglutinin.
- Peripheral blood mononuclear cells PBMCs
- PBMCs Peripheral blood mononuclear cells
- FCS 5% (vol/vol) heat-inactivated FCS
- penicillin 100 U/mL
- streptomycin sulfate 100 ⁇ g/mL
- L-glutamine 4 mM
- the PBMCs (10 6 /mL) were incubated without or with phytohaemagglutinin (PHA) (Remel) at a final concentration of 2 ⁇ g/mL. Following incubation for 24, 48, or 72 h at 37 °C in 5% CO 2 humidified atmosphere, the cells were retrieved, washed twice with PBS, and pelleted by centrifugation. Six hundred microliters of lysis/binding buffer from the mirVana miRNA isolation kit (Ambion) were added directly to the cell pellet. Lysates were stored at -80 °C or total RNA was immediately extracted using the manufacturer's recommended protocol for total RNA isolation. Cell-free supernatants of PBMCs incubated without or with 2 ⁇ g/mL PHA were collected by centrifugation and concentrated (Amicon, Millipore) for the in vitro studies using human renal epithelial cells.
- PHA phytohaemagglutinin
- Example 17 Human Renal Epithelial Cells Culture. Normal human renal tubular epithelial cells (HRECs) were harvested from human nephrectomy specimens removed for renal cell carcinoma and isolated according to previously published methods, with minor modifications. Fragments of nontumoral renal cortex were minced and digested with collagenase IV (250 IU/mL) for 3 h at 37 °C. Cells were centrifuged and the pellets washed 3 times with PBS.
- HRECs Human Renal Epithelial Cells Culture. Normal human renal tubular epithelial cells (HRECs) were harvested from human nephrectomy specimens removed for renal cell carcinoma and isolated according to previously published methods, with minor modifications. Fragments of nontumoral renal cortex were minced and digested with collagenase IV (250 IU/mL) for 3 h at 37 °C. Cells were centrifuged and the pellets washed 3 times with PBS.
- collagenase IV 250 IU/mL
- DMEM Dulbecco's modified Eagle medium
- HRECs were then incubated at 37 °C in 5% CO 2 and 95% air.
- HRECs were harvested at 80% confluence and seeded, in 60-mm dishes at 3 x 10 5 cells/dish. At 50% confluence, cells were treated with various amounts of concentrated cell-free supernatants of PBMCs incubated without or with 2 ⁇ g/mL PHA. Following 24 or 48 h of culture at 37 °C in 5% CO2-95% air-humidified atmosphere, the HRECs were retrieved and washed twice with PBS.
- lysis/binding buffer from the mirVana miRNA isolation kit (Ambion) were added directly to the culture plate to lyse the cells. Lysates were harvested manually with a sterile cell scraper and transferred to a 1.5-mL tube. Samples were stored at -80 °C or RNA was immediately extracted using the manufacturer's recommended protocol for total RNA isolation.
- Example 18 Statistical Analysis.
- ROC receiver-operating characteristic
- AUC area under the curve
- the association between intragraft levels of mRNAs and miRNAs was analyzed using the Pearson regression, and the relationship between intragraft levels of miRNA or mRNA and renal allograft function was also analyzed using the Pearson regression. All data were expressed as mean ⁇ SE, unless otherwise specified. Statistical significance was tested by Student's t test or paired t test.
- Example 19 Based on the above disclosure, we identified that intragraft miRNA profiles distinguish patients with AR of human allografts from patients with normal allograft biopsy results, and that AR can be diagnosed with a high degree of accuracy with the use of intragraft levels of miRNAs. Moreover, miRNA profiles were also predictive of renal allograft function. Our observations, together, support the hypothesis that intragraft miRNA expression patterns may serve as biomarkers of human renal allograft status.
- intragraft levels of miR-142-5p, -155, -223, -10b, -30a-3p, and let-7c are diagnostic of AR, with miR-142----5p, miR-155, and miR-223 each predicting AR with >90% sensitivity and specificity (Table 1).
- Intragraft levels of mRNA for CD3, CD20, NKCC-2, and USAG-1 were also diagnostic of AR, but with less combined sensitivity and specificity.
- miR-142-5p levels of miR-142-5p, -155, -223, -10b, -30a-3p, and let-7c predicted renal graft function with miR-142-5p and miR-10b showing the strongest association with graft function.
- mRNA for CD3 but not mRNAs for CD20.
- NKCC-2, and USAG-1 predicted graft function, and the association between CD3 mRNA and graft function was weaker compared to that of miR-142-5p or miR-10b.
- miR-146 is expressed at low levels in na ⁇ ve T cells, is upregulated in Th1 cells, but not in Th2 cells, and is considered as a Th1-specific miRNA.
- Th1-type cells infiltrating rejecting human renal allografts we found that intragraft level of mRNA for the type 1 cytokine IFN- ⁇ but not the level of mRNA for the Th2 cytokine IL-4 were higher in AR biopsies compared to normal allograft biopsies ( Fig. 8 ).
- miR-223 levels were the highest.
- Acute rejection of human renal allografts was also characterized by underexpression of miRNAs within the rejecting allografts compared to allografts with normal biopsy results. Indeed, among the 53 miRNAs differentially expressed between AR biopsies and normal biopsies, 43 were underexpressed and only 10 were overexpressed in the AR biopsies ( Fig. 2 ).
- let-7c Two members of the let-7 family (let-7a and let-7c) were underexpressed in AR biopsies. Our investigation showed that let-7c is downregulated in PHA-activated PBMCs ( Fig. 5 D and E ) and mRNA for both H-ras and c-myc are upregulated ( Fig. 5 F - I ). However, the reduction in the expression of let-7c was not observed 24 h after activation and was evident after 48 h, whereas the maximum upregulation of H-ras and c-myc was observed 24 h following activation ( Fig. 5 H and I ). Thus, downregulation of let-7c does not appear to be an absolute prerequisite for the upregulation of H-ras or c-myc in normal human PBMCs.
- miR-30a-3p and miR-10b were both underexpressed in AR biopsies compared to normal allograft biopsies ( Fig. 3 ). These miRNAs were expressed at a greater abundance in HRECs compared to PBMCs, and activation of HRECs, as demonstrated by increased expression of mRNA for proinflammatory chemokines MCP-1, RANTES, and IP-10 ( Fig. 7 ), was associated with a reduced expression of miR-30a-3p ( Fig. 6 ).
- Table 1 Characteristics of renal allograft recipients* Serum creatinime (mg/DL) Biopsy ID Sample group Recipient gender Ethnicity Recipient age (years) Date of transplentation Type of transplantattion Date of biopsy (days) Indication of biopsy Immunosuppressive treatment at biopsy Bantt 97 diagnostik Banff grade C4d stainings Tacrolumus blood level at biopsy (ng/mL) Baseline level At biopsy After treatment of acute rejection #1 Training set M Black 52 07/08/04 Living 161 dysfunction TacrolimusMMF/ steroids 4 1B Neg 4.0 1.1 3.2 2.4 #2 Training set White 32 01/11/07 Living 119 Graft dysfunction Tacrolimus/MMF 4 1B Neg 13.1 1.6 10.2 2.3 #3 Training set F White 48 03/04/07 Deceased 31 Graft dysfunction Tacrolimus/MMF/ 4 1B Neg 7.0 2.2 3.3 1.7 #4 Training set F Black 40 06/19/03 Living 203 Protocol Tacrolimus/MMF 1 - 7.5 1.1 1.3 - #
Landscapes
- Chemical & Material Sciences (AREA)
- Life Sciences & Earth Sciences (AREA)
- Proteomics, Peptides & Aminoacids (AREA)
- Health & Medical Sciences (AREA)
- Organic Chemistry (AREA)
- Wood Science & Technology (AREA)
- Analytical Chemistry (AREA)
- Zoology (AREA)
- Genetics & Genomics (AREA)
- Engineering & Computer Science (AREA)
- Pathology (AREA)
- Immunology (AREA)
- Microbiology (AREA)
- Molecular Biology (AREA)
- Biotechnology (AREA)
- Biophysics (AREA)
- Physics & Mathematics (AREA)
- Biochemistry (AREA)
- Bioinformatics & Cheminformatics (AREA)
- General Engineering & Computer Science (AREA)
- General Health & Medical Sciences (AREA)
- Measuring Or Testing Involving Enzymes Or Micro-Organisms (AREA)
Description
- Transplantation of organs has progressed from a risky experimental therapy to a safe and life-saving treatment modality in a relatively short span of five decades. However, transplant recipients require life-long treatment with non-specific, toxic, and multiple immunosuppressive drugs, and are ever under the threat of losing their allografts because of immune rejection of the transplanted organ.
- Acute rejection of an organ transplanted from one human to another is an important risk factor for allograft failure. The outcome of acute rejection is, however, difficult to predict.
- Currently, observation of histologic features in allograft tissue obtained by core needle biopsy is the best predictor whether an acute rejection will respond to antirejection therapy. However, the invasive procedure of allograft biopsy is associated with complications such as bleeding, arteriovenous fistula, and even graft loss. Thus, there is a need for a non-invasive method for determining whether a patient suffering from acute rejection of a transplant organ is at risk of loss of the transplanted organ.
- The above need has been met by the present invention, which is defined by the appended claims. The method includes measuring an amount of expression of a small non-coding marker RNA in a biological sample from the patient. The method further includes comparing the measured amount of expression of the small non-coding marker RNA in the patient to a reference amount of expression of the small non-coding marker RNA.
- The disclosure further includes methods wherein the small non-coding marker RNA is selected from SEQ ID NOs: 1-9, or variants thereof, wherein an increase of expression of the small non-coding marker RNA that is equivalent to at least 1-fold as compared to the reference amount of expression of the small non-coding marker RNA indicates an increased risk of rejection of the transplanted organ.
- The disclosure also includes that the small non-coding marker RNA is selected from SEQ ID NOs: 10-49, or variants thereof, wherein an increase of expression of the small non-coding marker RNA that is equivalent to less than 1-fold as compared to said reference amount of expression of the small non-coding marker RNA indicates an increased risk of rejection of said transplanted organ.
- In a further embodiment, the method further includes (c) measuring a difference between the amount of expression of the small non-coding marker RNA in the biological sample and the reference amount of expression of said small non-coding marker RNA; (d) measuring an amount of expression of a endogenously expressed small non-coding reference RNA in a biological sample from the patient; (e) measuring a difference between the amount of expression of the endogenously expressed small non-coding reference RNA in the biological sample from the patient and a reference amount of expression of said endogenously expressed small non-coding reference RNA; (f) comparing the difference in step (c) to the difference in step (e); wherein a difference in step (c) that is greater than the difference in step (d) further indicates an increased risk of rejection of said transplanted organ.
- A disclosed method for assessing risk of organ rejection in a patient having a transplanted organ includes: (a) measuring an amount of expression of a small non-coding marker RNA in a biological sample from the patient, said small non-coding RNA selected from SEQ ID NOs: 1-9 or a combination thereof; (b) measuring an amount of expression of an endogenously expressed small non-coding reference RNA in a biological sample from the patient; (c) comparing the measured amount of step (a) to the measured amount of step (b) to determine a first ratio; (d) measuring an amount of expression of said small non-coding marker RNA in a biological sample from a person having a non-rejected organ, said small non-coding RNA selected from SEQ ID NOs: 1-9 or a combination thereof; (e) measuring an amount of expression of an endogenously expressed small non-coding reference RNA in a biological sample from the person having a non-rejected organ; and comparing the measured amount of step (d) to the measured amount of step (e) to determine a second ratio; wherein a calculation of the first ratio being greater than the second ratio by an amount equivalent to at least 1-fold indicates an increased risk of rejection of said transplanted organ.
- A disclosed method for assessing risk of organ rejection in a patient having a transplanted organ includes: (a) measuring an amount of expression of a small non-coding marker RNA in a biological sample from the patient, said small non-coding RNA selected from SEQ ID NOs: 10-49, or a combination thereof; (b) measuring an amount of expression of an endogenously expressed small non-coding reference RNA in a biological sample from the patient; (c) comparing the measured amount of step (a) to the measured amount of step (b) to determine a first ratio; (d) measuring an amount of expression of said small non-coding marker RNA in a biological sample from a person having a non-rejected organ, said small non-coding RNA selected from the group consisting of SEQ ID NOs: 10-49, or a combination thereof; (e) measuring an amount of expression of an endogenously expressed small non-coding reference RNA in a biological sample from the person having a non-rejected organ; and comparing the measured amount of step (d) to the measured amount of step (e) to determine a second ratio; wherein a calculation of the first ratio being greater than the second ratio by at least an amount equivalent to less than 1-fold indicates an increased risk of rejection of said transplanted organ.
- The disclosure also provides a kit for assessing risk of organ rejection in a patient having a transplanted organ. The kit includes at least one nucleic acid molecule complementary to a small non-coding marker RNA selected from the group consisting of SEQ ID NO: 1-49s, or variations thereof, and a means for measuring expression of a small non-coding marker RNA in a biological sample.
-
-
Figure 1 . Unsupervised hierarchical clustering and principal component analysis of miRNA expression profiles differentiate acute rejection biopsies from normal allograft biopsies of human renal allografts. (A) MicroRNA (miRNA) expression patterns of 7 human kidney allograft biopsies [3 showing histological features of acute rejection (AR) and 4 with normal allograft biopsy results (N)] were examined using microfiuidic cards containing TaqMan probes and primer pairs for 365 human mature miRNAs. A total of 174 ± 7 miRNAs were expressed at a significant level (i.e., CT < 35) in all samples. Gender, age, ethnicity, type of transplantation, and time from transplantation to biopsy were as follow: AR1 (Male, Black, 52 years, living donor, 161 days), AR2 (male, White, 32 years, living donor, 119 days), AR3 (Female, White, 48 years, deceased donor, 31 days), N1 (female, Black, 40 years, living donor, 203 days), N2 (Male, Indian, 50 years, living donor, 191 days), N3 (Male, Black, 31 years, living donor, 196 days), and N4 (Male, Asian, 51 years, deceased donor, 88 days). The biopsies were grouped by unsupervised hierarchical clustering on the basis of similarity in expression patterns. The degree of relatedness of the expression patterns in biopsy samples is represented by the dendrogram at the top of the panel. Branch lengths represent the degree of similarity between individual samples (Top) or miRNA (Left), Two major clusters (Top) accurately divided AR biopsies from normal allograft biopsies. Each column corresponds to the expression profile of a renal allograft biopsy, and each row corresponds to a miRNA. The color in each cell reflects the level of expression of the corresponding miRNA in the corresponding sample, relative to its mean level of expression in the entire set of biopsy samples. The increasing intensities of red mean that a specific miRNA has a higher expression in the given sample and the increasing intensities of green mean that this miRNA has a lower expression. The scale (Bottom Right) reflects miRNA abundance ratio in a given sample relative to the mean level for all samples. (B) Principal component analysis of 7 kidney allograft biopsies based on the expression of 174 small RNAs significantly expressed (i.e., C T < 35) in all of the samples. PCA is a bilinear decomposition method designed to reduce the dimensionality of multivariable systems and used for overviewing clusters within multivariate data. It transforms a number of correlated variables into a smaller number of uncorrelated variables called principal components (PC). The first PC accounts for as much of the variability in the data as possible, and each succeeding component accounts for as much of the remaining variability as possible. PCA showed evident clustering and confirmed the separation of AR samples from normal allograft biopsies. Samples were accurately grouped by PCl, which explained 45.91% of the overall miRNA expression variability, whereas PC2 explained 21.48% of variability and did not classify the samples according to their diagnosis. -
Figure 2 . Differential expression of miRNAs in acute rejection biopsies and normal allograft biopsies at a P value <0.05. MicroRNA (miRNA) expression patterns of 7 human kidney allograft biopsies [3 showing histological features of acute rejection (AR) and 4 with normal allograft biopsy results (N)] were examined using microftuidic cards containing TaqMan probes and primer pairs for 365 human mature miRNAs. Each column corresponds to the expression profile of a renal allograft biopsy, and each row corresponds to a miRNA. ABqPCR software was used to identify miRNAs that were differentially expressed between AR biopsies and normal allograft biopsies. C T filtering procedure was first performed. Assays with a C T value >35 in >50% of samples in each group were called undetected. Assays that were not detected in both groups were not included in the analysis. For the remaining assays, t test was used to detect differentially expressed miRNAs. The miRNA clustering tree is shown on the Left. Branch lengths represent the degree of similarity between individual miRNAs. The higher intensities of red mean higher expression level. -
Figure 3 . Validation of differential expression of microRNAs in AR biopsies and normal allograft biopsies of human renal allografts. Intragraft expression levels of miR-142-5p, -155, -223, -10b, -30a-3p, and let-7c in an independent validation set of 9 acute rejection biopsies and 17 normal kidney allograft biopsies. Expression levels were quantified using modified TaqMan miRNA assays that allow absolute quantification of miRNAs. miRNA copy numbers were normalized using the stably expressed RNU44 small nucleolar RNA, and are shown as mean (± SE) ratio of miRNA copies to RNU44 copy numbers. RNU44 copy numbers were not different between the 9 acute rejection biopsies (8.87 × 10⁶ ± 1.48 × 10⁶ copies/µg RNA) and the 17 normal allograft biopsies (8.72 × 10⁶ ± 8.42 × 10⁵ copies/µg RNA, P = 0.92). P value calculated using t test. -
Figure 4 . Positive association between miRNAs and mRNAs in human allograft biopsies. Intragraft levels of miRNAs were quantified with the use of TaqMan miRNA. assays, and intragraft levels of mRNAs were quantified using real time quantitative PCR assays, and the relationship between the intragraft levels of miRNA and mRNA is shown, along with Pearson correlation (R 2) and P values. A strong positive association between the levels of CD3 mRNA and the levels of miRNAs overexpressed in acute rejection biopsies was found: (A) miR-142-5p (R 2 = 0.72, P < 0.0001); (B) miR-155 (R 2 = 0.69, P < 0.0001); or (C) miR-223 (R 2 = 0.66, P < 0.0001). A positive association between renal tubule specific NKCC-2 mRNA and miRNAs underexpressed in acute rejection biopsies was also observed: (E) miR-30a-3p (R 2 = 0.53, P < 0.0001); (F) miR-10b (R 2 = 0.36, P < 0.0001); or (G) let-7c (R 2 = 0.13, P = 0.04). Results from all 33 renal allograft biopsies (red, 12 acute rejection biopsies; green, 21 normal allograft biopsies) are shown. The threshold cycle (C T) is the fractional cycle number at which the fluorescence crossed the fixed threshold in miRNA/mRNA assays. (D) The mean (± SD) C T values of the endogenous control for mRNAs (18S rRNA, 24.8 ± 1.3 vs. 24.7 ± 1.1, P = 0.86, t test) and (H) for miRNAs (RNU44 small nucleolar RNA, 27.1 ± 0.7 vs. 27.1 ± 0.5, P = 0.97, t test) were similar between the acute rejection samples and the normal renal allografts. -
Figure 5 . Levels of miRNAs in resting or activated normal human peripheral blood mononuclear cells. Peripheral blood mononuclear cells (PBMCs) were obtained from healthy individuals and were incubated without (open bars) or with (filled bars) 2 µg/mL PHA for 24 h (A, F, and G) (n = 7 subjects), 48 h (D) (n = 4 subjects), or 24, 48, and 72 h (B, C, E, H, and I) (n = 2 subjects), and RNA was isolated for miRNA quantification (A-E) or mRNA quantification (F-I). miRNA copy numbers were normalized using the RNU44 small nucleolar RNA copy numbers and mRNA copy numbers were normalized using the 18S rRNA copy numbers and are shown as mean (± SE) ratio of miRNA copies to RNU44 copy numbers or ratio of mRNA copies to 18S rRNA copies. P value calculated using paired t test. -
Figure 6 . Levels of miRNAs in resting or activated normal human renal epithelial cells. Primary cultures of normal human renal epithelial cells (HRECs) were incubated for 24 h (A, B) or 24 and 48 h (C) with cell-free supernatants of resting PBMCs (open bars) or cell-free supernatants of PBMCs activated with 2 µg/mL PHA (filled bars). Total RNA was isolated from HRECs and a subset of miRNAs found to be overexpressed (A) or underexpressed (B and C) in acute rejection biopsies were quantified with the use of modified TaqMan miRNA assays. miRNA copy numbers were normalized using the RNU44 small nucleolar RNA copy numbers and are shown as mean (± SE) ratio of miRNA copies to RNU44 copy numbers. Results are from 2 consecutive experiments with 2 independent primary cultures of HRECs developed from 2 human kidneys. P values calculated using paired 1 test. -
Figure 7 . Levels of chemokine mRNAs in resting or activated normal human renal epithelial cells. Primary cultures of normal human renal epithelial cells (HRECs) were incubated for 24 h with cell-free supernatants of resting PBMCs (open bars) or cell-free supernatants of PBMCs activated with 2 µg/mL PHA (filled bars). Total RNA was isolated from HRECs and the absolute levels of MRNA for the chemokines monocyte chemoattractant protein-1 (MCPI), regulated upon activation, normal T cell expressed and secreted (RANTES), and IFN-inducible protein-10 (IP-10) mRNAs were quantified with the use of real-time PCR assays, miRNA copy numbers were normalized using the 18S rRNA copy numbers, and are shown as mean (± SE) ratio of mRNA copies to 18S rRNA copies. Results are from 2 consecutive experiments with 2 independent primary cultures of HRECs developed from 2 human kidneys. P values calculated using paired t test. -
Figure 8 . Intragraft levels of mRNA in human renal allograft biopsies. Box and whisker plots show the 10th, 25th, 50th (median), 75th, and 90th percentile values for ratios of mRNA copies to 18S rRNA copies for IFN-γ (A) and interleukin-4 (B) in 12 acute rejection biopsies and 21 normal allograft biopsies of human renal allografts. The level of IFN-γ but not that of interleukin-4 was higher in acute rejection biopsies compared to normal allograft biopsies. Absolute levels of mRNAs were quantified using real-time quantitative PCR assays. P value calculated using t test. -
Figure 9 . Urinary Cell Levels ofmiRNA 155 are diagnostic of acute rejection. Total RNA containing miRNAs was isolated from urinary cells collected from renal allograft recipients and levels of RNU44 (house keeping gene) andmiRNA 155 were measured real time quantitative PCR assays. Urinary cell levels ofmiRNA 155 and notRNU 44 were significantly higher in urine from patients whose biopsies were classified acute rejection (n=3 specimens) compared to urine from patients with stable graft function and normal biopsy findings (n=13 specimens). - The invention relates to methods for the non-invasive detection of renal allograft rejection using miR 142-5p. The inventor discovered, among other things, that certain marker microRNAs (miRNA) are overexpressed or underexpressed in response to organ failure (e.g., acute rejection).
- In one aspect, the invention relates to a method for assessing risk of organ rejection in a patient having a transplanted organ.
- Organ rejection refers to any failure of a transplanted organ resulting from an adverse immune response. For example, organ rejection includes acute and/or chronic rejection. An episode of acute rejection of an organ can be caused by an antibody-mediated or cell-mediated immune response. The cells involved in a cell-mediated immune response include, for example, activated cytotoxic T cells. An episode of acute rejection typcially occurs within fourteen days, more typically within ten days, and even more typically within five days after a transplant if the patient is not taking an immunosuppressant drug.
- However, most if not all transplant patients are given immunosuppressant drugs. Thus, an episode of acute rejection generally occurs within about one year of a transplanted organ, more specifically within about nine months, even more specifically within about six months, and most specifically within about three months after transplant of an organ. Acute rejection, however, can occur at any time during the life of a transplanted organ. Further, a patient can have more than one episode of acute rejection of a transplanted organ.
- The method includes measuring an amount of expression of a small non-coding marker RNA in a biological sample from the patient.
- As used herein, a small non-coding RNA refers to a ribonucleic acid sequence that does not code for a protein. For example, the small non-coding RNA may perform a regulatory function in the cell by regulating gene expression through sequence-specific base-pairing with complementary mRNA sequences.
- A small non-coding RNA is less than about 40 nucleotides in length, preferably less than about 30 nucleotides, for example, about 29, 28, 27, 26, 25, 24, 23, 22, 21, or 20 nucleotides in length. The small non-coding RNA is more than about 10 nucleotides, for example, 11, 12, 13, 14, 15, 16, 17, 18, 19, or 20 nucleotides in length. Any maximum value can be combined with any minimum value to define a range.
- Examples of a small non-coding RNA include transfer RNA (tRNA), ribosomal RNA (rRNA), microRNA (miRNA), small nuclear RNA (snRNA), small nucleolar RNA (snoRNA), and/or signal recognition particle RNA complex (SRP). Preferably, the small non-coding RNA is miRNA.
- A small non-coding marker RNA as used herein refers to a small non-coding RNA that is used to assess risk of organ rejection. Specific examples of a small non-coding marker RNA include the following nucleic acid molecules and/or a nucleic acid molecule that has at least about 85%, 86%, 87%, 88%, 89%, 90%, 91%, 92%, 93%, 94%, 95%, 96%, 97%, 98%, or 99% sequence identity to a sequence set forth below:
- miR-142-5p CAUAAAGUAGAAAGCACUAC (SEQ ID NO:1)
- miR-142-3p UGUAGUGUUUCCUACUUUAUGGA (SEQ ID NO:2)
- miR-155 UUAAUGCUAAUCGUGAUAGGGG (SEQ ID NO:3)
- miR-146a UGAGAACUGAAUUCCAUGGGUU (SEQ ID NO:4)
- miR-146b UGAGAACUGAAUUCCAUAGGCU (SEQ ID NO:5)
- miR-342 UCUCACACAGAAAUCGCACCCGUC (SEQ ID NO:6)
- miR-650 AGGAGGCAGCGCUCUCAGGAC (SEQ ID NO:7)
- miR-21 UAGCUUAUCAGACUGAUGUUGA (SEQ ID NO:8)
- miR-425-5p AAUGACACGAUCACUCCCGUUGA (SEQ ID NO:9)
- miR-30c UGUAAACAUCCUACACUCUCAGC (SEQ ID NO:10)
- miR-30a-3p CUUUCAGUCGGAUGUUUGCAGC (SEQ ID NO:11)
- miR-3Ga UACCCUGUAGAUCCGAAUUIIGUG (SEQ ID NO:12)
- miR-30e-3p CUUUCAGUCGGAUGUUUACAGC (SEQ ID NO:13)
- miR-30b UGUAAACAUCCUACACUCAGCU (SEQ ID NO:14)
- miR-10b UACCCUGUAGAACCGAAUUUGU (SEQ ID NO:15)
- miR-32 UAUUGCACAUUACUAAGUUGC (SEQ ID NO:16)
- miR-9 UCUUUGGUUAUCUAGCUGUAUGA (SEQ ID NO:17)
- miR-193b AACUGGCCCUCAAAGUCCCGCUUU (SEQ ID NO:18)
- miR-143 UGAGAUGAAGCACUGUAGCUCA (SEQ ID NO:19)
- miR-489 AGUGACAUCACAUAUACGGCAGC (SEQ ID NO:20)
- miR-27b UUCACAGUGGCUAAGUUCUGC (SEQ ID NO:21)
- miR-126 CAUUAUUACUUUUGGUACGCG (SEQ ID NO:22)
- mi R-193a AACLJGGCCUACAAAGLJCCCAG (SEQ ID NO:23)
- miR-378 CUCCUGACUCCAGGUCCUGUGU (SEQ ID NO:24)
- miR-429 UAAUACUGUCUGGUAAAACCGU (SEQ ID NO:25)
- miR-181c AACAUUCAACCUGUCGGUGAGU (SEQ ID NO:26)
- miR-196b UAGGUAGUUUCCUGUUGUUGG (SEQ ID NO:27)
- miR-I99a CCCAGUGUUCAGACUACCUGUUC (SEQ ID NO:28)
- miR-660 UACCCAUUGCAUAUCGGAGUUUG (SEQ ID NO:29)
- miR-203 GUGAAAUGUUUAGGACCACUAG (SEQ ID NO:30)
- miR-204 UUCCCUUUGUCAUCCUAUGCCU (SEQ ID NO:31)
- miR-30e-5p UGUAAACAUCCUUGACUGGA (SEQ ID NO:32)
- miR-30a-5p UGUAAACAUCCUCGACUGGAAG (SEQ ID NO:33)
- miR-30d UGUAAACAUCCCCGACUGGAAG (SEQ ID NO:34)
- miR-125b UCCCUGAGACCCUAACUUGUGA (SEQ ID NO:35)
- miR-130a CAGUGCAAUGUUAAAAGGGCAU (SEQ ID NO:36)
- miR-126 UCGUACCGUGAGUAAUAAUGC (SEQ ID NO:37)
- miR-195 UAGCAGCACAGAAAUAUUGGC (SEQ ID NO:38)
- miR-26a UUCAAGUAAUCCAGGAUAGGC (SEQ ID NO:39)
- miR-26b UUCAAGUAAUUCAGGAUAGGUU (SEQ ID NO:40)
- miR-497 CAGCAGCACACUGUGGUUUGU (SEQ ID NO:41)
- miR-152 UCAGUGCAUGACAGAACUUGGG (SEQ ID NO:42)
- miR-141 UAACACUGUCUGGUAAAGAUGG (SEQ ID NO:43)
- miR-296 AGGGCCCCCCCUCAAUCCUGU (SEQ ID NO:44)
- miR-365 UAAUGCCCCUAAAAAUCCUUAU (SEQ ID NO:45)
- miR-99a AACCCGUAGAUCCGAUCUUGUG (SEQ ID NO:46)
- miR-100 AACCCGUAGAUCCGAACUUGUG (SEQ ID NO:47)
- miR-186 CAAAGAAUUCUCCUUUUGGGCUU (SEQ ID NO:48)
- let-7a UGAGGUAGUAGGUUGUAUAGUU(SEQ ID NO:49)
- nuR-223 UGUCAGUUUGUCAAAUACCCC (SEQ ID NO:50)
- let-7c UGAGGUAGUAGGUUGUAUGGUU (SEQ ID NO:51)
- miR-125a UCCCUGAGACCCUUUAACCUGUG (SEQ ID NO:52)
- miR-200a UAACACUGUCUGGUAACGAUGU (SEQ ID NO:53)
- Methods of determining sequence identity are known in the art. Percent nucleic acid sequence identity with respect to the small non-coding RNAs identified herein is defined as the percentage of nucleic acids in a candidate sequence that are identical with the nucleic acids in the specific small non-coding RNA sequence, after aligning the sequences and introducing gaps, if necessary, to achieve the maximum percent sequence identity, and not considering any conservative substitutions as part of the sequence identity.
- Alignment for purposes of determining percent nucleic acid sequence identity can be achieved in various ways that are within the skill in the art, for instance, using publicly available computer software such as BLAST, BLAST-2, ALIGN or Megalign (DNASTAR) software. Those skilled in the art can determine appropriate parameters for measuring alignment, including any algorithms needed to achieve maximal alignment over the full length of the sequences being compared.
- For purposes herein, however, percent (%) nucleic acid sequence identity values are generated using the sequence comparison computer program NCBI-BLAST2 (Altschul et al., Nucleic Acids Res. 25:3389-3402 (1997)). The NCBI-BLAST2 sequence comparison program may be downloaded from the National Center for Biotechnology Information's website or otherwise obtained from the National institutes of Health, Bethesda, Md. NCBI-BLAST2 uses several search parameters, wherein all of those search parameters are set to default values including, for example, unmask=yes, strand=all, expected occurrences=10, minimum low complexity length=15/5, multi-pass e-value=0.01, constant for multi-pass=25, dropoff for final gapped alignment=25.
- The method of the invention may include measuring an amount of expression of one small non-coding RNA or a combination of the small non-coding RNAs described above.
- The small non-coding RNA is typically found in a biological sample from the patient. As used herein, a biological sample refers to any sample obtained from a patient. Exemplary biological samples include blood, urine, a tissue sample from any organ, and/or tissue sample from the transplanted organ. Urine samples are preferred.
- The method further includes comparing the measured amount of expression of the small non-coding marker RNA in the biological sample from the patient to a reference amount of expression of the small non-coding marker RNA.
- In one embodiment, the reference amount of expression of the small non-coding marker RNA may be obtained by measuring an amount of expression of the small non-coding RNA in a person having a non-rejected organ. For example, the person having a non-rejected organ includes a healthy person. Preferably, the healthy person is a person of similar age, gender, race, graft-donor source. Banff histologic grade, and/or underwent the same initial anti-rejection treatment as the patient having a transplanted organ for which risk of organ failure is to assessed.
- Another example of a person having a non-rejected organ is a person having a well-functioning (e.g., stable) transplanted organ. A well-functioning (e.g., stable) transplanted organ may be defined as a transplanted organ that does not exhibit organ failure (e.g., rejection). Preferably, a well-functioning transplanted organ is a transplanted organ that has not developed transplant dysfunction or morphologic evidence of transplant injury in areas of the transplant For example, a stable functioning kidney transplant may be defined as having a serum creatinine concentration that has not changed by more than approximately 0.2 mg per deciliter during the seven days before and the seven days after collection of the biologic specimen for measurements of the small non-coding RNA. Preferably, the person having a well-functioning (e.g., stable) transplanted organ is a person of similar age, gender, race, graft-donor source, Banff histologic grade, and/or underwent the same initial anti-rejection treatment as the patient having a transplanted organ for which risk of organ failure is to assessed.
- In another embodiment, the reference amount is obtained by measuring an amount of expression of said small non-coding RNA in a second biological sample from the patient. For example, the second biological sample may be obtained from the patient before the organ transplantion and/or from another non-rejected organ of the patient.
- In yet another embodiment, the reference amount of expression of the small non-coding RNA is a value for expression of the small non-coding RNA that is accepted in the art.
- The method includes comparing the measured amount of expression of the small non-coding RNA to the reference amount of expression of the small non-coding RNA. The small non-coding marker RNA may be, for example, a small non-coding RNA selected from SEQ ID NOs: 1-53, or variants thereof. Preferably the small non-coding marker RNA is selected from SEQ ID NOs 1: 49, or variants thereof.
- In a more preferred embodiment, the small non-coding marker RNA is selected from a sequence set forth in SEQ ID NOs: 1-9. or a variation thereof. For example, the small non-coding marker RNA includes a small non-coding RNA selected from miR-142-5p; miR-142-3p; miR-155; miR-223; miR-146a; miR-146b; miR-342; miR-650; miR-21; and/or miR-425-5p, or a combination thereof, wherein an increase of expression of the small non-coding marker RNA that is equivalent to at least about 1-fold as compared to the reference amount of expression of the small non-coding marker RNA indicates an increased risk of rejection of the transplanted organ. In a most preferred embodiment, the small non-coding marker RNA is miR-142-5p; miR-142-3p; and/or miR-155.
- An increase of expression that is equivalent to at least about 1-fold may be an increase in an amount equivalent to at least about 1-. 2-, 3-, 4-, 5-, 6-, 7-, 8-, 9-, 10-, 11-, 12-, 13-, 14-, 15-, 16-, 17-, 18-, 19-, 20-fold, or more as compared to the increase in the reference amount of expression of the small non-coding marker RNA. Preferably, the increase is a fold value. Examples of methods to quantify an increase of expression are known in the art, as are described in the General Methods section below.
- An increased risk of organ rejection varies in different patients and the type of organ transplanted. Generally, the increased risk is at least about 25%, at least about 50%, at least about 75%, or at least about 90% as compared to a person having no risk of organ rejection.
- Conversely, in one embodiment an increase of expression of the small non-coding marker RNA selected from a sequence set forth in SEQ ID NOs: 1-9, or a variation thereof, that is equivalent to about less than 1-fold, as compared to the reference amount of expression of the small non-coding marker RNA, indicates a decreased risk of rejection of the transplanted organ. The decreased risk of organ rejection varies in different patients and the type of organ transplanted. Generally, the decreased risk is at least about 25%, at least about 50%, at least about 75%, or at least about 90% as compared to a person having no risk of organ rejection.
- The disclosure includes that the small non-coding marker RNA is selected from a sequence set forth in SEQ ID NOs: 10-49, or a variation thereof. For example, the small non-coding marker RNA includes a small non-coding RNA selected from miR-30c; miR-30a-3p; miR-10a; miR-30e-3p; miR-30b; miR-10b; miR-32; miR-9; miR-193b; miR-143; miR-489; miR-27b; miR-126; miR-378; miR-429; miR-181c; miR-196b; miR-199a; miR-660; miR-203; miR-204;miR-30e-5p; miR-30a-5p; miR-30d; miR-125b; miR-130a; miR-126; miR-195; miR-26a; miR-26b; miR-497; miR-152; miR-141; miR-296; miR-365; miR-99a; miR-100; miR-186; and/or let-7a, wherein an increase of expression of the small non-coding RNA that is equivalent to less than 1-fold as compared to the reference amount of expression of the small non-coding marker RNA indicates an increased risk of rejection of the transplanted organ.
- An increase of expression that is equivalent to less than 1-fold may be an increase of at most about 0.9-, 0.8-, 0.7-, 0.6-, 0.5-, 0.4-, 0.3-, 0.2-, or 0.1-fold, or less as compared to the increase in the reference amount of expression of the small non-coding marker RNA. Preferably, the increase is a fold value. Examples of methods to quantify an increase of expression are known in the art, as are described in the General Methods section below.
- Conversely, an increase of expression of the small non-coding marker RNA selected from a sequence set forth in SEQ ID NOs: 10-49, or a variation thereof, equivalent to at least about 1-fold, or more, as compared to the reference amount of expression of the small non-coding marker RNA. indicates a decreased risk of rejection of the transplanted organ. The decreased risk of organ rejection varies in different patients and the type of organ transplanted. Generally, the decreased risk is at least about 25%, at least about 50%, at least about 75%, or at least about 90% as compared to a person having no risk of organ rejection.
- In yet another embodiment, the method for assessing risk of organ rejection further includes measuring an amount of an endogenously expressed small non-coding reference RNA in a biological sample from the patient In addition, the method includes measuring a reference amount of an endogenously expressed small non-coding reference RNA in a biological sample.
- The reference amount may be obtained by measuring the amount of expression of the endogenously expressed small non-coding reference RNA in a person having a non-rejected organ or in a second biological sample from the patient, as described above. In another embodiment, the reference amount is a value for expression of the endogenously expressed small non-coding reference RNA that is accepted in the art.
- An endogenously expressed small non-coding reference RNA refers to a small non-coding RNA that is endogenously expressed (e.g., expressed within the patient, cell, and/or tissue) and demonstrates an expression that is relatively constant and abundant in the biological sample.
- Methods of selecting and validating the endogenously expressed small non-coding reference RNA are known in the art. See, for example. TaqMan® MicroRNA Assays from Applied Biosystems. Preferably, the endogenously expressed small non-coding reference RNA is stable, has a similar size as the measured small non-coding RNA (e.g., SEQ ID NOs: 1-53), and is amenable to means for measuring expression.
- Examples of endogenously expressed small non-coding reference RNA include RNU24, RNU66, RNU19, RNU38B, RNU49, Z30, RNU6B, RNU48, RNU43, and/or RNU44. Preferably, the endogenously expressed small non-coding reference RNA is endogenous small nucleolar RNA RNU44.
- In a preferred embodiment, the method further includes measuring a difference between the amount of expression of the small non-coding marker RNA in the biological sample and the reference amount of expression of the small non-coding marker RNA. For example, the method can include measuring the difference between the amount of expression of the small non-coding marker RNA in the biological sample from the patient and the reference amount of expression of the small non-coding marker RNA.
- As explained above, the reference amount may be obtained by measuring the amount of expression of the endogenously expressed small non-coding reference RNA in a person having a non-rejected organ or in a second biological sample from the patient, as described above. In another embodiment, the reference amount is a value for expression of the endogenously expressed small non-coding reference RNA that is accepted in the art.
- The embodiment further includes measuring a difference between the amount of expression of the endogenously expressed small non-coding reference RNA in the biological sample and the reference amount of expression of the endogenously expressed small non-coding reference RNA. Or example, the method includes measuring the difference between the amount of expression of the endogenously expressed small non-coding reference RNA in the biological sample from the patient and the reference amount of expression of the endogenously small non-coding reference RNA.
- As explained above, the reference amount may be obtained by measuring the amount of expression of the endogenously expressed small non-coding reference RNA in a person having a non-rejected organ or in a second biological sample from the patient, as described above. In another embodiment, the reference amount is a value for expression of the endogenously expressed small non-coding reference RNA that is accepted in the art.
- The embodiment further includes comparing (i) the difference in amount of expression of the small non-coding marker RNA between the patient sample and the reference amount and (ii) the difference in amount of expression of the endogenously expressed small non-coding reference RNA between the patient sample and the reference amount. When the difference in (i) (i.e., expression of the small non-coding marker RNA between the patient sample and the reference amount) is greater than the difference in (ii) (i.e., the amount of expression of the endogenously expressed small non-coding reference RNA between the patient sample and the reference amount), the comparison further indicates an increased risk of rejection of the transplanted organ.
- Preferably, a difference in (i) that is greater than the difference in (ii) by an amount equivalent to at least about 1-, 2-, 3-, 4-, 5-, 6-, 7-, 8-, 9-, 10-, 11-, 12-, 13-, 14-, 15-, 16-, 17-, 18-, 19-, 20-fold, or more, indicates an increased risk of rejection of the transplanted organ.
- In another preferred embodiment, a difference in (i) that is greater than the difference in (ii) by an amount equivalent to less than 1-fold, for example, at most about 0.9-, 0.8-, 0.7-, 0.6-, 0.5-, 0.4-, 0.3-, 0.2-, or 0,1-fold, or less, indicates an increased risk of rejection of the transplanted organ.
- Accordingly, the present embodiment relates to one example by which one skilled in the art may measure and/or determine whether the increase in expression of the small non-coding RNA, as compared to the reference amount, is statistically significant in the patient.
- In a preferred embodiment, the invention includes normalizing the amount of expression of the small non-coding marker RNA. The method includes measuring an amount of expression of a small non-coding marker RNA in a biological sample from the patient, as described above. The method further includes measuring an amount of expression of an endogenously expressed small non-coding reference RNA in a biological sample from the patient. In addition, the method includes comparing the measured amount of the small non-coding marker RNA from the patient to the measured amount of endogenously expressed small non-coding reference RNA from the patient to determine a first ratio.
- The method further includes measuring an amount of expression of the small non-coding marker RNA in a biological sample from a person having a non-rejected organ. The method further includes measuring an amount of expression of an endogenously expressed small non-coding reference RNA in a biological sample from the person having a non-rejected organ. In addition, the method includes comparing the measured amount of the small non-coding marker RNA from the person having a non-rejected organ to the measured amount of endogenously expressed small non-coding reference RNA from the person having a non-rejected organ to determine a second ratio.
- When a calculation of the first ratio is greater than the second ratio by an amount equivalent to at least 1-fold, the calculation indicates an increased risk of rejection of said transplanted organ in the patient having a transplanted organ. The calculated increase of the first ratio over the second ratio that is at least 1-fold may be an increase that is equivalent to at least about 1-, 2-, 3-, 4-, 5-, 6-, 7-, 8-, 9-, 10-, 11-, 12-, 13-, 14-, 15-, 16-, 17-, 18-, 19-, 20-fold, or more.
- When a calculation of the first ratio is greater than the second ratio by an amount equivalent to less than 1-fold, the calculation indicates an increased risk of rejection of said transplanted organ in the patient having a transplanted organ. The calculated increase of the first ratio over the second ratio may be an increase that is equivalent to less than 1-fold may be an increase of at most about 0.9-, 0.8-, 0.7-, 0.6-, 0.3-, 0.4-, 0.3-, 0.2-, or 0.1-fold, or less.
- Accordingly, in the present embodiment, fold changes or equivalents thereof for the small non-coding marker RNA are normalized to the endogenously expressed small non-coding reference RNA.
- In one embodiment, when the transplanted organ is a kidney, the method for assessing risk of organ rejection in a patient may further include determining the amount of serum creatinine protein in the patient. The determination of the amount of serum creatinine can be made by any method known to those skilled in the art, such as those described in U.S. Patent Publication
US20080131441 . - In this embodiment, the measured amount of serum creatinine in the patient is compared to a control amount of serum creatinine of a healthy person or a person having a well-functioning (e.g., stable) transplant, as described in U.S. Patent Publication
US20080131441 . For example, the normal level of serum creatinine in a healthy person or a person with a well-functioning transplant is generally about 0.8-1.6 milligrams/deciliter. The person may be the patient or a person different from the patient. - It is not necessary to determine the level of creatinine in a control sample every time the method is conducted. For example, the serum creatinine level from the patient can be compared to that of one or more previously determined control samples or to a level recognized by the physician or clinician conducting the method, or by a consensus of medical and/or clinical practitioners.
- In another embodiment, the method further includes informing the patient whether the patient is at decreased or increased risk of organ rejection. The information that a patient is at risk of rejection of a transplanted organ is useful. Such patients can be prescribed and/or administered a treatment to prevent rejection and/or loss of the transplanted organ.
- In one embodiment, the treatment includes administering to the patient an effective amount of a pharmaceutical composition to prevent rejection and/or loss of the transplanted organ. Such pharmaceutical compositions are well known to those skilled in the art, and include, for example a steroid pulse, an antibody, etc.
- For example, a steroid pulse therapy can include the administration for three to six days of a high dose corticosteroid (e.g., greater than 100 mg). An example of an antibody therapy includes the administration for seven to fourteen days of the polyclonal antibody Thymoglobin or the monoclonal antibody, OKT3.
- Another example of a treatment that can be administered is plasmapheresis. Plasmapheresis is a process in which the fluid part of the blood (i.e., plasma) is removed from blood cells. Typically, the plasma is removed by a device known as a cell separator. The cells are generally returned to the person undergoing treatment, while the plasma, which contains antibodies, is discarded.
- Each of the methods and embodiments of the present invention can be used alone, or in combination with one or more, or all, of the other methods.
- A biological sample from a patient or person can be obtained by any method known to those in the art. In addition to the examples described above, further examples of biological samples include transplant tissue biopsy, blood, urine, bile, bronchoalveolar lavage fluid, and pericardial fluid. Suitable methods include, for example, venous puncture of a vein to obtain a blood sample, collection of a urine specimen, and a percutaneous core needle biopsy.
- Any method known to those in the art can be employed for determining the amount of a small non-coding RNA. Typically, total RNA is isolated from the biological sample. RNA can be isolated from the sample by any method known to those in the art. For example, commercial kits, such as the TRI Reagent® commercially available from Molecular Research Center, Inc. (Cincinnati, OH), or the mir Vana miRNA isolation kit from Ambion, can be used to isolate RNA. The yield and purity of RNA can be measured using a NanoDrop ND-1000 spectrophotometer.
- The quantification of small non-coding RNA from total mRNA from the biological sample can be performed by any method known to those in the art. For example, kinetic, quantitative PCR involves reverse transcribing the total RNA (e.g., by using the Taqman Multiplex RT set for TaqMan Array Human MicroRNA Panel v1.0) and polymerase chain reaction (PCR). Quantitative PCR can be carried out on an Applied BioSystems 7900HT thermocycler, or an equivalent thereof, using the manufacturer's recommended cycling conditions. Briefly, cDNA can be reverse transcribed from the total RNA samples using specific small non-coding RNA primers, which may be obtained from the TaqMan MicroRNA assays (Applied Biosystems) and reagents from the TaqMan microRNA reverse transcription kit (Applied Biosystems).
- Generally, the isolated small non-coding RNA may be amplified by methods known in the art. Amplification systems utilizing, for example, PCR or RT-PCR methodologies are known to those skilled in the art. For a general overview of amplification technology, see, for example, Dieffenbach et al., PCR Primer: A Laboratory Manual, Cold Spring Harbor Laboratory Press, New York (1995). For example, the amounts of small non-coding RNA can be determined using kinetic, quantitative PCR. Preferably, PCR products are amplified from cDNA samples using the TaqMan microRNA assay (Applied Biosystems).
- An alternative method for determining the amount of small non-coding RNA expression includes the use of molecular beacons and other labeled probes useful in, for example multiplex PCR. In a multiplex PCR assay, the PCR mixture contains primers and probes directed to the small non-coding RNA PCR product. Typically, a single fluorochrome is used in the assay. The molecular beacon or probe is detected to determine the amount of small non-coding RNA. Molecular beacons are described, for example, by Tyagi and Kramer (Nature Biotechnology 14, 303-308, 1996) and by
Andrus and Nichols in U.S. Patent Application Publication No. 20040053284 . - Another method includes, for instance, quantifying cDNA (obtained by reverse transcribing the small non-coding RNA) using a fluorescence based real-time detection method, such as the ABI PRISM 7700 or 7900 Sequence Detection System [TaqMan®] commercially available from Applied Biosystems, Foster City, Calif. or similar system as described by Heid et al., (Genome Res. 1996;6:986-994) and Gibson et al.(Genome Res. 1996;6:995-1001).
- Small non-coding marker RNA copy numbers can then be normalized using an endogenously expressed small non-coding reference RNA copy number and the abundance of the small non-coding marker RNA can be expressed as a ratio of the small non-coding marker RNA to the endogenously expressed small non-coding reference RNA.
- Generally, the amount of small non-coding RNA expression in a biological sample is significantly greater if the expression of small non-coding RNA is heightened. For example, a discriminatory level for heightened gene expression (e.g., the baseline magnitude of expression) of the small non-coding RNA is defined as the mean ± 95% confidence interval of a group of values observed in non-rejecting organs (e.g., control values, i.e., control levels). The group of values as used herein includes, for example, a minimum of at least about 2 values, more preferably a minimum of at least about 10 values, most preferably a minimum of at least about 20 values. The group of values as used herein includes, for example, a maximum of at most about 500 values, more preferably a maximum of at most about 100 values, most preferably a maximum of at most about 50 values.
- Heightened expression of the small non-coding RNA is considered to be significantly greater if the value is greater than the mean ± 95% confidence interval of a group of values observed in non-rejecting organs. Similarly, the level of the small non-coding RNA in the cell sample is considered to be significantly lower if the amount of expression of the small non-coding RNA is lower than the mean ± 95% confidence interval of a group of values observed in non-rejecting organs.
- The amount of expression of the small non-coding RNA is typically considered not significantly greater if the level of the small non-coding RNA in the biological sample is not greater than the mean ± 95% confidence interval of a group of values observed in non-rejecting organs. The amount of expression of the small non-coding RNA is normally considered not significantly lower if the amount in a biological sample is not lower than the mean ± 95% confidence interval of a group of values observed in nonrejecting transplants.
- Statistical analysis in the above mean ± 95% confidence interval of a group of values observed in non-rejecting organs may be performed with a x2 test.
- In another embodiment, the amount of expression of the small non-coding marker RNA in a biological sample is significantly greater if the log-transformed mean (±SE) ratio of the small non-coding marker RNA copies to the endogenously expressed small non-coding reference RNA copies is higher relative to a control ratio in non-rejecting organs, as determined by the Kruskal-Wallis test. For example, a significantly greater ratio is typically at least about ±SE 3.0, more typically between ±SE 3.0 and 5.0, and most typically between ±SE 3.8 and 4.7.
- Similarly, the amount of the small non-coding RNA in a biological sample is significantly lower if the log-transformed mean (±SE) ratio of the small non-coding marker RNA copies to the endogenously expressed small non-coding reference RNA copies is reduced relative to a control ratio (i.e., control values, control levels) in non-rejecting organs, as determined by the Kruskal-Wallis test. For example, a typical non-rejecting organ control ratio is not more than about 2.5, more typically 1.0 to 2.5, and most typically from 1.3 and 2.0.
- In an embodiment of the invention, generally, the amount of small non-coding RNA when compared to a control amount may be increased by at least about 10%, at least about 50%, or at least about 100%. The amount of expression level of a small non-coding RNA when compared to a control amount may be decreased by at least about 10%, at least about 50%, or at least about 100% lower.
- It is not necessary to determine the amount of expression of the small non-coding marker RNA or the endogenously expressed small non-coding reference RNA in a every time the method is conducted. For example, the amount of small non-coding marker or reference RNA in the biological sample from the transplanted organ can be compared to that of one or more previously determined control samples or compared to an amount recognized by the physician or clinician conducting the method of a consensus of medical and/or clinical practitioners.
- With respect to serum creatinine, any method known in the art can be used for determining the amount of serum creatinine in the biological sample. Suitable methods for determining protein levels include an ELISA and a standard blot. Briefly, these assays are normally based on incubating an antibody specific to the protein with a sample suspected of containing the protein, and detecting the presence of a complex between the antibody and the protein.
- Alternatively, commercial kits can be utilized. An example of a commercial kit for determining creatinine level is the QuantiChrom™ Creatinine Assay Kit from BioAssay Systems (Hayward, Ca).
- In another aspect, the disclosure includes a kit for assessing risk of organ rejection in a patient having a transplanted organ. The kit includes at least one nucleic acid molecule complementary to a small non-coding marker RNA selected from SEQ ID NOs: 1-49, or variations thereof. The kit further includes a means for measuring expression of a small non-coding marker RNA in a biological sample. The kit may also include written instructions for a method of assessing risk of organ rejection, as described above.
- In a preferred embodiment, the means for measuring expression includes quantitative polymerase chain reaction. Additional means for measuring expression include those described under General Methods.
- We first determined global miRNA expression profiles of human renal allografts using microfluidic cards containing TaqMan primers and probes for 365 mature human miRNAs. The characteristics of patients whose renal allograft biopsies were studied for global miRNA expression patterns (training set), or for a subset of differentially expressed miRNAs (validation set), are summarized in Table 1.
- Among the 365 mature human miRNAs analyzed in the training set (4 normal and 3 AR biopsies), 174 ± 7 miRNAs (48%) were expressed in each biopsy sample (174 ± 10 miRNAs in the AR biopsies vs. 174 ± 4 miRNAs in the normal allograft biopsies). Unsupervised hierarchical clustering of miRNA expression patterns correctly classified the normal allograft biopsies and the AR biopsies (
Fig. 1 A). - The clear separation of AR biopsies from normal allograft biopsies was further confirmed by displaying the relationships among miRNA expression patterns using principal component analysis (PCA) (
Fig. 1 B). Samples were accurately grouped by PC1, which explained 46% of the overall miRNA expression variability, whereas PC2 explained 21% of the variability and did not classify the samples according to their diagnosis. Table 2 below lists the miRNAs with high contribution to the overall variability of the samples.Table 2. Squared cosines table of miRNAs corresponding to their contribution to the grouping of the samples by the principal component analysis MicroRNA PC1 hsa-miR-26a 0.949 hsa-miR-30d 0.944 hsa-miR-200a 0.937 hsa-miR-660 0.933 hsa-miR-23b 0.928 hsa-miR-32 0.921 hsa-miR-30a-3p 0.920 hsa-miR-125a 0.914 hsa-miR-26b 0.913 hsa-miR-10a 0.908 hsa-miR-30c 0.903 hsa-miR-30e-3p 0.901 hsa-miR-10b 0.896 hsa-miR-30b 0.883 hsa-miR-152 0.882 hsa-let-7c 0.862 hsa-miR-30a-5p 0.858 hsa-miR-196b 0.852 hsa-miR-489 0.851 hsa-miR-186 0.830 hsa-miR-151 0.817 bia-miR-125b 0.816 hsa-miR-532 0.811 hsa-miR-101 0.806 hsa-miR-141 0.800 hsa-miR-130a 0.796 hsa-miR-30e-5p 0.784 hsa-miR-195 0.781 hsa-miR-429 0.775 hsa-miR-24 0.769 MicroRNA PC2 hsa-miR-93 0.903 hsa-miR-15b 0.853 hsa-miR-425-5p 0.829 hsa-miR-16 0.754 hsa-miR-28 0.728 hsa-miR-565 0.631 hsa-miR-155 0.600 hsa-miR-320 0.586 hsa-miR-191 0.577 hsa-miR-103 0.563 hsa-miR-146a 0.561 hsa-miR-342 0.550 hsa-miR-146b 0.538 fisa-let-7d 0.525 hsa-miR-142-5p 0.504 hsa-miR-594 0.492 hsa-miR-142-3p 0.476 hsa-miR-181d 0.464 hsa-miR-127 0.463 hsa-miR-106b 0.409 hsa-miR-130b 0.392 hsa-miR-95 0.391 hsa-miR-21 0.352 hsa-miR-223 0.341 hsa-miR-25 0.335 hsa-miR-451 0.327 hsa-miR-486 0.318 hsa-let-7 g 0.310 hsa-miR-345 0.303 hsa-miR-190 0.301 - Example 2: MicroRNAs Distinguishing Acute Rejection Biopsies from Normal Allograft Biopsies. Supervised analysis was used to detect miRNAs differentially expressed in AR biopsies and normal allograft biopsies. A subset of 17 miRNAs was differentially expressed at a P value <0.01. Among the 17 miRNAs, 10 (let-7c, miR-10a, miR-10b, miR-125a, miR-200a, miR-30a-3p, miR-30b, miR30c, miR30e-3p, and miR-32) were underexpressed in AR biopsies compared to normal allograft biopsies, and 7 (miR-142-5p, miR-1423p, miR-155, miR-223, miR-146b, miR-146a, and miR-342) were overexpressed (
Fig. 2 and Table 3). At a P value <0.05, 33 additional miRNAs were found to be underexpressed in AR biopsies compared to normal allograft biopsies, and only 3 miRNAs were found to be overexpressed (Fig. 2 and Table 3).Table 3. Differential expression of microRNAs in human renal allografts* miRNA Target Sequence SEQ ID NO: Mean fold P value † Overexpressed in AR hsa-miR-142-5p CAUAAAGUAGAAAGCACUAC 1 18.48 <0.01 hsa-miR-142- 3p UGUAGUGUUUCCUAGUUUAUGGA 2 16.61 <0.01 hsa-miR-155 UUAAUGCUAAUCGUGAUAGGGG 3 14.53 <0.01 hsa-miR-223 UGUCAGUUUGUGAAAUACCCC 5 0 9.20 <0.01. hsa-miR-146a UGAGAACUGAAUUCCAUGGGUU 4 3.65 <0.01 hsa-miR-146b UGAGAACUGAAUUCCAUAGGCU 5 2.90 <0.01 hsa-miR-342 UCUCACACAGAAAUCGCACCCGUC 6 2.90 <0.01 hsa-miR-650 AGGAGGCAGCGCUCUCAGGAC 7 11.31 <0.05 hsa-miR-21 UAGCUUAUCAGACUGAUGUUGA 8 3.45 <0.05 hsa-miR-425-5p AAUGACACGAUCACUCCCGUUGA 9 2.13 <0.05 Underexpressed in AR hsa-miR-30c UGUAAACAUCCUACACUCUCAGC 10 0.31 <0.01 hsa-miR-30a-3p CUUUCAGUCGGAUGUUUGCAGC 11 0.32 <0.01 hsa-miR-10a UACCCUGUAGAUCCGAAUUUGUG 12 0.34 <0.01 hsa-miR-30e-3p CUUUCAGUCGGAUGUUUACAGC 13 0.36 <0.01 has-miR-30b UGUAAACAUCCUACACUCAGCU 14 0.40 <0.01 hsa-miR-125a UCCCUGAGACCCUUUAACCUGUG 52 0.41 <0.01 hsa-miR-10b UACCCUGUAGAACCGAAUUUGU 15 0.42 <0.01 hsa-miR-32 UAUUGCACAUUACUAAGUUGC 16 0.46 <0.01 hsa-let-7c UGAGGUAGUAGGUUGUAUGGUU 51 0.48 <0.01 hsa-miR-200a UAACACUGUCUGGUAACGAUGU 53 0.50 <0.01 hsa-miR-9 UCUUUGGUUAUCUAGCUGUAUGA 1.7 0.20 <0.05 hsa-miR-193b AACUGGCCCUCAAAGUCCCGCUUU 18 0.24 <0.05 hsa-miR-143 UGAGAUGAAGCACUGUAGCUCA 19 0.26 <0.05 hsa-miR-489 AGUGACAUCACAUAUACGGCAGC 20 0.26 <0.05 hsa-miR-27b UUCACAGUGGCUAAGUUCUGC 21 0.32 <0.05 hsa-miR-126 CAUUAUUACUUUUGGUACGCG 22 0.35 <0.05 hsa-miR-193a AACUGGCCUACAAAGUCCCAG 23 0.35 <0.05 hsa-miR-378 CUCCUGACUCCAGGUCCUGUGU 24 0.35 <0.05 hsa-miR-429 UAAUACUGUCUGGUAAAACCGU 25 0.36 <0.05 hsa-miR-181c AACAUUCAACCUGUCGGUGAGU 26 0.36 <0.05 hsa-miR-196b UAGGUAGUUUCCUGUUGUUGG 27 0.40 <0.05 hsa-miR-199a CCCAGUGUUCAGACUACCUGUUC 28 0.40 <0.05 hsa-miR-660 UACCCAUUGCAUAUCOOAGUUG 29 0.40 <0.05 hsa-miR-203 GUGAAAUGUUUAGGACCACUAG 30 0.43 <0.05 hsa-miR-204 UUCCCUUUGUCAUCCUAUGCCU 31 0.43 <0.05 hsa-miR-30e-5p UGUAAACAUCCUUGACUGGA 32 0.43 <0.05 hsa-miR-30a-5p UGUAAACAUCCUCGACUGGAAG 33 0.44 <0.05 hsa-miR-30d UGUAAACAUCCCCGACUGGAAG 34 0.44 <0.05 hsa-miR-125b UCCCUGACACCCUAACUUGUGA 35 0.45 <0.05 hsa-miR-130a CAGUGCAAUGUUAAAAGGGCAU 36 0.48 <0.05 hsa-miR-126‡ UCGUACCGUGAGUAAUAAUGC 37 0.48 <0.05 hsa-miR-195 UAGCAGCACAGAAAUAUUGGC 38 0.48 <0.05 hsa-miR-26a UUCAAGUAAUCCAGGAUAGGC 39 0.49 <0.05 hsa-miR-36b UUCAAGUAAUUCAGGAUAGGUU 40 0.49 <0.05 hsa-miR-497 CAGCAGCACACUGUGGUUUGU 41 0.51 <0.05 hsa-miR-152 UCAGUGCAUGACAGAACUUGGG 42 0.51 <0.05 hsa-miR-141 UAACACUGUCUGGUAAAGAUGG 43 0.52 <0.05 hsa-miR-296 AGGGCCCCCCCUCAAUCCUGU 44 0.52 <0.05 hsa-miR-365 UAAUGCCCCUAAAAAUCCUUAU 45 0.55 <0.05 hsa-miR-99a AACCCGUAGAUCCGAUCUUGUG 46 0.57 <0.05 hsa-miR-100 AACCCGUAGAUCCGAACUUGUG 47 0.62 <0.05 hsa-miR-186 CAAAGAAUUCUCCUUUUGGGCUU 48 0.62 <0.05 hsa-let-7a UGAGGUAGUAGGUUGUAUAGUU 49 0.67 <0.05 *Differential expression of microRNAs in acute rejection (AR) biopsies (N = 3) compared to normal allograft biopsies (N = 4). The fold changes were calculated using the delta-delta CT method, using 1 of the normal biopsies as the calibrator. The mean fold presented corresponds to the ratio of acute rejection biopsy to normal allograft biopsy. †P value calculated using Student's t test. ‡Two sequences corresponding to miR-126 have been quantified in the microfluidic cards. - Example 3: Validation of the MicroRNA Signatures Predictive of Renal Allograft Status. An independent set of 26 renal allograft biopsies (9 AR biopsies and 17 normal allograft biopsies) was used to validate a subset of miRNAs identified by global expression profiling to be differentially expressed in AR biopsies and normal allograft biopsies.
Fig. 3 confirms the differential expression of miRNAs in AR biopsies compared to normal allograft biopsies. As observed in the training set, miR-142-5p (P < 0.0001), -155 (P < 0.0001), and -223 (P < 0.0001) were overexpressed in AR biopsies in the validation set, and mill-10b (P = 0.01), miR-30a-3p (P = 0.04), and let-7C (P = 0.08) were underexpressed. - Example 4: Intragraft miRNA Levels Are Biomarkers of Renal Allograft Status. We investigated whether intragraft miRNA levels predict AR and renal allograft function. We used receiver-operating curves (ROCs) to analyze miRNA levels to determine cutoff points that yielded the highest combined sensitivity and specificity for predicting AR and allograft function. Our analysis showed that AR can be predicted very accurately using intragraft levels of miR-1425p (100% sensitivity and 95% specificity, P < 0.0001, Table 1) or miR-155 (100% sensitivity and 95% specificity. P < 0.0001, Table 1). Intragraft levels of miR-223, -10b, -30a-3p, and let-7c were also diagnostic of AR but with a lesser level of accuracy (Table 1).
- Analysis involving the ROC showed that AR can also be predicted using intragraft levels of T cell CD3 mRNA, B cell CD20 mRNA, and mRNA encoding renal tubular proteins NKCC-2 and USAG-1 but with much less sensitivity and specificity compared to intragraft levels of miR-142-5p, -155, or -223 (Table 1).
- We examined whether intragraft miRNA levels predict renal allograft function. Renal graft function at the time of allograft biopsy was assessed by calculating glomerular filtration rate (eGFR.) using the 4-parameter modified diet in renal disease (MDRD) formula. Our examination showed that intragraft levels of miR-142-5p (R = -0.66, P < 0.0001), -10b (R = 0.62, P < 0.0001), -1.55 (R = -0.59, P = 0.0003), -223 (R = 0.57, P = 0.0006), -30a-3p (R = 0.57, P = 0.0006), and let-7c (R = 0.37, P = 0.03) are significantly associated with eGFR. Among the intragraft mRNAs assessed, CD3 mRNA (R 2 = 0.36, P = 0.0002), but not mRNA for CD20 (R 2 = 0.04, P = 0.25), NKCC-2 (R 2 = 0.0 1, P = 0.58), or USAG-1 (R 2 = 0.08, P = 0.21), was associated with graft function.
- Example 5: Mechanisms for the Altered Intragraft Expression of miRNAs in AR Biopsies.
Fig. 4 illustrates that there is a strong positive association between intragraft levels of CD3 mRNA and intragraft levels of miR-142-5p (Fig. 4 A, R 2 = 0.72, P < 0.0001), miR-155 (Fig. 4 B, R 2 = 0.69, P < 0.0001), or miR-223 (Fig. 4 C, R 2 = 0.66, P < 0.0001). We also found a strong positive relationship between intragraft levels of CD20 mRNA and miR-142-5p (R 2 = 0.61. P < 0.0001), miR-155 (R 2 = 0.55, P < 0.0001), or miR-223 (R 2 = 0.56, P < 0.0001). In contrast, there was no association between renal tubule NKCC-2 mRNA or USAC-1 mRNA and miR-142-5p, -155, or miR-223 (all P values >0.05). - We examined whether an association exists between miRNAs underexpressed in AR biopsies and intragraft mRNA levels. We found a positive association between renal tubule-specific NKCC-2 mRNA and miR-30a-3p (
Fig. 4 E, R 2 = 0.53, P < 0.0001), miR-10b (Fig. 4 F, R 2 = 0.36, P < 0.0001), or let-7c (Fig. 4 G, R 2 = 0.13, P = 0.04). In a similar fashion to NKCC-2, renal tubule-related USAG-1 mRNA levels were positively associated with the intragraft levels of miR-30a-3p (R 2 = 0.44, P < 0.0001), miR-10b (R 2 = 0.35, P = 0.0003), or let-7c (R 2 = 0.19, P = 0.01). In contrast, there was no significant association between intragraft levels of CD3 mRNA or CD20 mRNA and miR-30a-3p, miR-10b, or let-7c (all P values >0.05). - To address whether the altered expression of miRNAs in AR biopsies is because of the relative proportions of graft-infiltrating immune cells and resident kidney parenchymal cells, we quantified the abundance of differentially expressed miRNAs in normal human PBMCs and in normal HRECs. We also investigated whether stimulation of PBMCs or HRECs altered the level of expression of miRNAs. Our investigation showed that whereas the absolute levels of RNU44 small nucleolar miRNA was similar in both PBMCs and HRECs (2.0 × 10⁷ ± 1.2 × 10⁷ vs. 2.35 × 10⁷ ± 1.9 × 10⁶, P > 0.05), the miRNAs overexpressed in AR biopsies (miR-142-5p, miR-155, and miR-223) were all expressed at a higher level in normal human PBMCs compared to miRNAs (miR-30a-3p, miR-10b, or let-7c) underexpressed in AR biopsies. Moreover, stimulation of PBMCs with the mitogen phytohaemagglutinin (PHA) results in an increase in the abundance of miR-155 (P = 0.0002) and a decrease in miR-223 (P = 0.02), let-7c (P = 0.02), or miR-142-5p (P = 0.08) (
Fig. 5 ). H-ras and c-myc are targets of let-7c, and activation of PBMCs with PHA resulted in the increased expression of mRNAs for c-myc (P = 0.01) and H-ras (P = 0.07) (Fig. 5 ). - Quantification of miRNAs in primary cultures of HRECs showed that miR-30a-3p, miR-10b, or let-7c are expressed at a higher level in HRECs compared to PBMCs, and that stimulation of HRECs with cell-free supernatants of PHA-activated PBMCs results in a decrease in the abundance of miR-30a-3p (P = 0.02) (
Fig. 6 ). As expected, activation of HRECs with cell-free supernatants of PHA-activated PBMCs increased the expression of mRNA-encoding proinflammatory cytokines MCP-1, RANTES, and IP-10 in HRECs (Fig. 7 ). - Example 6: Renal Allograft Recipients and Biopsy Specimens. We investigated microRNA expression patterns of 33 renal allograft biopsies obtained from 32 adult recipients of human renal allografts: 12 biopsies from 11 recipients with graft dysfunction [mean (± SD) creatinine: 5.6 ± 3.5 mg/dL] and biopsy-confirmed AR according to the Banff 97 classification [mean age (± SD): 38.5 ± 8.6 yr, 7 men and 4 women, 5 living and 6 deceased donors] and 21 biopsies from 21 recipients with stable allograft function (creatinine: 1.3 ± 0.3 mg/dL) and normal allograft biopsy (46.4 ± 11.5 yr, 8 men and 13 women, 15 living and 6 deceased donors). The mean (± SE) time to biopsy was 19.1 ± 7.0 months posttransplantation in the AR group and 6.3 ± 0.9 months in the group with stable graft function and normal biopsy results (P = 0.51, Mann-Whitney test). Additional information of the study subjects is given in Table 1 and in the discussion below.
- Example 7: MicroRNA Expression Profiling. Global miRNA profiling of allograft biopsy specimens was studied using the TaqMan low-density array human microRNA panel v1.0 containing 365 mature human miRNAs (Applied Biosystems). miRNAs found to be differentially expressed in AR biopsies compared to normal allograft biopsies were quantified using TaqMan miRNA assays (Applied Biosystems) modified by the incorporation of our standard curve protocol. Details for total RNA purification, miRNA profiling, quantification, and data analysis are provided below.
- Example 8: Measurement of Intragraft Levels of mRNA Using Kinetic Quantitative PCR Assay. The expression level of mRNAs was quantified using real-time quantitative PCR assays as detailed below. Primers and probes sequences are shown in Table 4, below.
Table 4. Oligonucleotide primers and probes used in real-time quantitative polymerase chain reaction assays for the quantification of mRNAs Gene Accession number Sequence Location CD3-epsilon NM_000733 Sense: 5'-AAGAAATGGGTGGTATTACACAGACA-3' (SEQ ID NO:54) 131-156 Antisense: 5'-TGCCATAGTATTTCAGATCCAGGAT-3' (SEQ ID NO:55) 233-209 
170-202 CD20 NM_021950 Sense: 5'-AACTCCCCATCTACCCAATACTGTT-3' (SEQ ID NO:57) 616-640 Antisense: 5'-AGAAGGCAAAGATCAGCATCACT-3' (SEQ ID NO:58) 697-675 
642-672 NKCC-2 BC0401382 Sense: 5'-TCACGAGCAACTCGCAAAGA-3' (SEQ ID NO; 60) 588-607 Antisene: 5'-TCCCATCACCGTTAGCAACTC-3' (SEQ ID NO:6.1) 658-638 
609-632 USAG-1 NM_015464 Sense: 5'-TGGAGGCAGGCATTTCAGTAA-3' (SEQ ID NO:63) 364-366 Antisense: 5'-TTCCCGGCAACCCACTT-3' (SEQ ID NO:64) 412-396 
392-368 H-ras NM_001130442.1 Sense 5' -TGTGTGTGTTTGCCATCAACA-3' (SEQ ID NO:66) 424-444 Antisense: 5'CGTTTGATCTGCTCCCTGTACTG-3' (SEQ ID NO:67) 493-471 Probe: 5'-FAM-CACCAAGTCTTTTGAGGAC-MGB-3 (SEQ ID NO:68) 446-464 c-myc NM_002764.3 Sense: 5'-ACACCGCCCACCACCAG-3' (SEQ ID NO:69) 1299-1315 Antisense: 5'-TCCACAGAAACAACATCGATTTCT-3' (SEQ ID NO:70) 1349-1372 Probe: 5'-FAM AGGAACAAGAAGATGAGG-MGB-3' (SEQ ID NO:71) 1330-1347 MCP-1 NM_002982.2 Sense: 5'-CATAGCAGCCACCTTCATTCC-3' (SEQ ID NO:72) 107-127 Antisense: 5'-TCTGCACTGAGATCTTCCTATTGG-3' (SEQ ID NO:73) 210-186 
145-170 RANTES NM_002985.3 Sense: 5'-TCTGCCGCTCCTGCATCTG-3' (SEQ : ID NO:75) 118-135 Antisense: 5'-AGTGGGCGGGCAATGTAG-3' (SEQ ID NO:76) 193-176 
150-171 IP-10 NM_001565.1 Sense: 5'-TGTCCACGTGTTGAGATCATTG-3' (SEQ ID NO:78) 235-256 Antisense: 5'-GGCCTTCGATTCTGGATTCA-3' (SEQ ID NO:79) 309-290 
258-281 18S rRNA K03432 Sense: 5'GCCCGAAGCGTTTACTTTGA-3' (SEQ ID NO: 81) 929-948 Antisense: 5'TCCATTATTCCTAGCTGCGGTATC-3' (SEQ ID NO:82) 1009-986 
965-983 - Example 9: Cell Culture. The procedures for the in vitro studies using peripheral blood mononuclear cells and normal human renal epithelial cells are described below.
- Example 10: Human Renal Allograft Biopsy Classification. Percutaneous core needle biopsies were obtained and formalin-fixed, paraffin embedded renal biopsies were stained with hematoxylin and eosin, periodic acid-Schiff and Masson's trichrome, and analyzed by a pathologist, blinded to the results of molecular studies using the Banff 97 classification. Immunosuppression consisted of a calcineurin inhibitor-based regimen, with methyl prednisolone for the initial treatment of acute rejection. The study was approved by the Institutional Review Board at the Weill Cornell Medical College, and each patient gave written informed consent.
- Example 11: Global MicroRNA Expression Profiling. Allograft biopsy samples were placed in RNAlater (Ambion) and stored at -80 °C until RNA extraction. Total RNA was extracted from biopsies using the mirVana miRNA isolation kit according to the manufacturer's specification (Ambion). The yield and purity of RNA were measured using a NanoDrop ND-1000 spectrophotometer (Nanodrop Technologies), and RNA integrity was assessed using the RNA 6000 Nano LabChip kit (Agilent Technologies). We used the TaqMan Low-Density Array Human MicroRNA Panel v1.0 (Applied Biosystems), a 384-well microfluidic card that contains primers and probes for 365 different human miRNAs in addition to 2 small nucleolar RNAs that function as endogenous controls for data normalization, for global miRNA profiling of allograft biopsy specimens. Three acute rejection (AR) biopsy samples and 4 normal kidney allograft biopsy specimens were profiled for global miRNA gene expression patterns (7 biopsies, training set). Total RNA (480 ng) was reverse transcribed using the TaqMan Multiplex RT set for TaqMan Array Human MicroRNA Panel v1.0. Each RT reaction was diluted 62.5-fold with water, and 55 µL of each diluted product was combined with 55µL of TaqMan 2X Universal PCR Master Mix, No AmpErase UNG. One-hundred microliters of the sample/master mix for each Multiplex pool were loaded into fill reservoirs of the microfluidic card; the array was then centrifuged and mechanically sealed with the Applied Biosystems sealer device. Quantitative PCR was carried out on an Applied BioSystems 7900HT thermocycler using the manufacturer's recommended cycling conditions. Fold changes for each miRNA were normalized to the endogenous control RNU44 small nucleolar RNA. The relative expression levels between samples were calculated using the comparative delta CT (threshold cycle number) method with a control sample (normal) as the reference point.
- Example 12: TaqMan Low-Density Array Analysis. Data analysis was performed by using the SDS software version 2.3 and the baseline and threshold were automatically set. Data were normalized and then analyzed to define genes that are differentially expressed between the AR biopsies and normal protocol biopsies. Assays that had C T values >35 were removed from the analysis. The delta C T values were calculated by using RNU44 as the endogenous control. Unsupervised clustering method and principal component analysis (PCA) were used to visualize patterns in the data set without any a priori sample classification. Average linkage clustering analysis was implemented in the Cluster program and Java Tree View 1.0.12 software. PCA were done using the xlstat software. Data were analyzed using Applied Biosystem's ABqPCR data analysis tool (Applied Biosystems, personal communication). A Student t test was performed to detect differentially expressed miRNAs between the AR samples and normal allograft biopsies.
- Example 13: Quantification of MicroRNAs. miRNAs found to be differentially expressed in AR biopsies compared to normal allograft biopsies by the TaqMan Low-Density Array were measured using Taq- Man miRNA assays (Applied Biosystems) in 9 additional AR samples and 17 additional normal allograft biopsies (26 biopsies, validation set). TaqMan miRNA assays were also used to quantify miRNA in the in vitro experiments. Reverse transcription for individual miRNAs was performed using the TaqMan microRNA reverse transcription kit (Applied Biosystems). Briefly, cDNA were reverse transcribed from total RNA samples using specific miRNA primers from the TaqMan microRNA assays (Applied Biosystems) and reagents from the TaqMan microRNA reverse transcription kit (Applied Biosystems). Each reverse transcription reaction consists of 7 µL master mix, 3 µL miRNA-specific primer, and 5 µL of 1 ng/µL dilution of total RNA. Reverse transcription was done in Veriti thermal cyclers (Applied Biosystems), using the following parameter values: 16 °C for 30 min, 42 °C for 30 min, and 85 °C for 5 min. PCR products were amplified from cDNA samples using the TaqMan microRNA assay (Applied Biosystems). PCR for each sample was set up in duplicate as a 20-µL reaction volume using 1 µL 20X TaqMan miRNA assay (Applied Biosystems) containing a mix of miRNA-specific forward PCR primer, a specific reverse PCR primer, and a miRNA-specific TaqMan MGB probe, TaqMan Universal PCR Master Mix, and 1.5 µL cDNA. A synthetic amplicon was used to develop a standard curve (see below) and TaqMan C T values were converted into absolute copy numbers. See, N Engl J Med 358:353-361. miRNA copy numbers were normalized using RNU44 small nucleolar RNA copy numbers and the abundance of miRNAs was expressed as a ratio of miRNA copies to RNU44 copies (miRNA copies in 1 µg RNA/RNU44 small nucleolar RNA copies in 1 µg RNA). TaqMan microRNA assays were performed using an ABI Prism 7500 real-time PCR system.
- Example 14: Quantification of Messenger RNAs. Levels of mRNAs were measured using an ABI Prism 7500 Fast detection system (Applied Biosystems). PCR for each sample was set up in duplicate as a 20-µL reaction volume using 10 µL TaqMan Universal PCR Master Mix, 2.5 µL preamplified template cDNA, 0.15 µL primers (sense primer and antisense primer, 50 µM each; Table 4 lists the oligonucleotide primers and probes), 0.05 µL probe (100µM), and 7.34µL of water. The PCR amplification protocol consists of an initial hold at 95 °C for 20 seconds and 40 cycles of denaturing at 95 °C for 3 seconds and primer annealing and extension at 60 °C for 30 seconds. Transcript levels are calculated using our standard curve method (see below), and mRNA copy numbers are normalized using 18S rRNA copy numbers (mRNA copies in 1 µg RNA/18S rRNA copies in 1 ng RNA).
- Example 15: Method for Absolute Quantification of mRNAs and miRNAs. RNA levels (mRNA and miRNA) were calculated using our previously described standard curve method, incorporated by reference herein from Kawai T, et al. (2008) HLA-mismatched renal transplantation without maintenance immunosuppression. N Engl J Med 358:353-361. The standard curve was established using PCR generated 73-bp mouse Bak amplicon as the standard. The Bak amplicon was generated in a PCR using GeneAmp 9600 thermal cycler and with 3 µL cDNA and 22 µL of dNTP, 10µ PCR buffer, TaqDNA polymerase, and Bakspecific oligonucleotide primer pair [sense primer: 5' CCCACATCTGGACCAGAGTCA 3' (192-212) (SEQ ID NO:84); antisense primer: 5' CAGATGCCATTTTTCAGGTCTTG 3' (264-242) (SEQ ID NO:85), accession no. Y13231]. The PCR product was separated by electrophoresis with a 2% agarose gel and the amplicon size (73 bp) was confirmed using a DNA size standard of pUC mix marker 8 (Crystalgen). The Bak amplicon was isolated and purified from the gel with QIAquick gel extraction kit (QIAGEN), The absolute quantity of the purified amplicon was measured by A260 and converted to the number of copies using the molecular weight of DNA. The Bak amplicon was diluted to the concentration of 107 copies/µL (stock solution). When a standard curve was to be established for the real-time quantitative PCR assay, the stock solution was diluted over 6 orders of magnitude (1,000,000, 100,000, 10,000, 1,000, 100, and 10 copies per 1 µL) (work solution). Work solution (2.5 µL) was added to duplicate wells and amplified with Bak-specific primer pair and Bakspecific fluorogenic TaqMan probe [5' FAM CAGGTGACAAGTGACGGTGGTCTCCA TAMRA 3' (215-240) (SEQ ID NO:86)]. The threshold cycles (C T) were then plotted vs. the log of the initial amount of the Bak amplicon to develop the standard curve. The thresholds were in the exponential phase of the PCR and the higher the initial copy number of the Bak amplicon, the lower was the C T value.
- Example 16: Isolation of Normal Human Peripheral Blood Mononuclear Cells and Activation with Phytohaemagglutinin. Peripheral blood mononuclear cells (PBMCs) were obtained from whole blood of 7 healthy volunteers by standard Ficoll density-gradient centrifugation. PBMCs were resuspended at 106 cells/mL in RPMI 1640 (Gibco BRL) containing 5% (vol/vol) heat-inactivated FCS, penicillin (100 U/mL), streptomycin sulfate (100 µg/mL), and L-glutamine (4 mM). The PBMCs (106/mL) were incubated without or with phytohaemagglutinin (PHA) (Remel) at a final concentration of 2 µg/mL. Following incubation for 24, 48, or 72 h at 37 °C in 5% CO2 humidified atmosphere, the cells were retrieved, washed twice with PBS, and pelleted by centrifugation. Six hundred microliters of lysis/binding buffer from the mirVana miRNA isolation kit (Ambion) were added directly to the cell pellet. Lysates were stored at -80 °C or total RNA was immediately extracted using the manufacturer's recommended protocol for total RNA isolation. Cell-free supernatants of PBMCs incubated without or with 2 µg/mL PHA were collected by centrifugation and concentrated (Amicon, Millipore) for the in vitro studies using human renal epithelial cells.
- Example 17: Human Renal Epithelial Cells Culture. Normal human renal tubular epithelial cells (HRECs) were harvested from human nephrectomy specimens removed for renal cell carcinoma and isolated according to previously published methods, with minor modifications. Fragments of nontumoral renal cortex were minced and digested with collagenase IV (250 IU/mL) for 3 h at 37 °C. Cells were centrifuged and the pellets washed 3 times with PBS. Cells were then cultured in Dulbecco's modified Eagle medium (DMEM) containing 5 µg/mL insulin, 10 µg/mL human apotransferrin, 500 ng/mL hydrocortisone, 10 ng/mL EGF, 6.5 ng/mL triiodothyronin, 5 ng/mL sodium selenite, 1% FCS, 25 IU/mL penicillin, 25 µg/mL streptomycin, and 10 mM Hepes buffer. HRECs were then incubated at 37 °C in 5% CO2 and 95% air. The characterization of our cellular model has been published previously, confirming the proximal descent of the vast majority of the cultured tubular epithelial cells. Experiments were not performed with HRECs beyond the third passage. HRECs were harvested at 80% confluence and seeded, in 60-mm dishes at 3 x 10⁵ cells/dish. At 50% confluence, cells were treated with various amounts of concentrated cell-free supernatants of PBMCs incubated without or with 2 µg/mL PHA. Following 24 or 48 h of culture at 37 °C in 5% CO2-95% air-humidified atmosphere, the HRECs were retrieved and washed twice with PBS. Six hundred microliters of lysis/binding buffer from the mirVana miRNA isolation kit (Ambion) were added directly to the culture plate to lyse the cells. Lysates were harvested manually with a sterile cell scraper and transferred to a 1.5-mL tube. Samples were stored at -80 °C or RNA was immediately extracted using the manufacturer's recommended protocol for total RNA isolation.
- Example 18: Statistical Analysis. We used a conventional receiver-operating characteristic (ROC) curve to analyze mRNA and miRNA levels to determine the cutoff points that yielded the highest combined sensitivity and specificity with respect to distinguishing subjects with acute rejection from subjects with stable graft function and normal biopsy results. We calculated the area under the curve (AUC) and 95% confidence intervals for the AUC. The association between intragraft levels of mRNAs and miRNAs was analyzed using the Pearson regression, and the relationship between intragraft levels of miRNA or mRNA and renal allograft function was also analyzed using the Pearson regression. All data were expressed as mean ± SE, unless otherwise specified. Statistical significance was tested by Student's t test or paired t test.
- Example 19: Based on the above disclosure, we identified that intragraft miRNA profiles distinguish patients with AR of human allografts from patients with normal allograft biopsy results, and that AR can be diagnosed with a high degree of accuracy with the use of intragraft levels of miRNAs. Moreover, miRNA profiles were also predictive of renal allograft function. Our observations, together, support the hypothesis that intragraft miRNA expression patterns may serve as biomarkers of human renal allograft status.
- We used a 2-step approach to develop miRNA signatures predictive of AR. First, we ascertained intragraft expression patterns of 365 mature human miRNAs in 7 human renal allograft biopsies classified as AR or normal. Global expression profiling identified miRNAs differentially expressed in AR biopsies compared to normal biopsies (
Figs. 1 and2 ). In the second step, with the use of modified TaqMan miRNA assays, we determined absolute copy numbers of miRNAs in 26 additional renal allograft biopsies (Fig. 3 ). Our approach resolved that intragraft levels of miR-142-5p, -155, -223, -10b, -30a-3p, and let-7c are diagnostic of AR, with miR-142----5p, miR-155, and miR-223 each predicting AR with >90% sensitivity and specificity (Table 1). Intragraft levels of mRNA for CD3, CD20, NKCC-2, and USAG-1 were also diagnostic of AR, but with less combined sensitivity and specificity. - levels of miR-142-5p, -155, -223, -10b, -30a-3p, and let-7c predicted renal graft function with miR-142-5p and miR-10b showing the strongest association with graft function. Among the mRNAs analyzed, mRNA for CD3, but not mRNAs for CD20. NKCC-2, and USAG-1, predicted graft function, and the association between CD3 mRNA and graft function was weaker compared to that of miR-142-5p or miR-10b. Our observations that intragraft miRNA expression patterns are predictive of allograft status, in addition to the existing data that miRNAs are stable, present in high abundance, and can be examined in formalin-fixed tissues, advance the idea that miRNA expression patterns may be of value as biomarkers in clinical transplantation.
- Several of the miRNAs found at a higher level in AR biopsies compared to normal allograft biopsies may play an important role in innate and adaptive immunity. Our in vitro studies showed that activation with the polyclonal T-cell mitogen PHA increases miR-155 expression in normal human PBMCs.
- levels of miR-146 were higher in AR samples compared to normal allograft biopsies. miR-146 is expressed at low levels in naïve T cells, is upregulated in Th1 cells, but not in Th2 cells, and is considered as a Th1-specific miRNA. In support of Th1-type cells infiltrating rejecting human renal allografts, we found that intragraft level of mRNA for the type 1 cytokine IFN-γ but not the level of mRNA for the Th2 cytokine IL-4 were higher in AR biopsies compared to normal allograft biopsies (
Fig. 8 ). - Among the miRNAs overexpressed in the AR biopsies, miR-223 levels were the highest. We also found the abundance of miR-223 to be higher compared to that of miR-142-5p or miR-155 in normal human PBMCs, and that activation of PBMCs with PHA results in a reduction of miR-223 expression.
- levels of miR-142 were also higher in AR biopsies compared to normal allograft biopsies. We found that activation results in a reduction, albeit not statistically significant (P = 0.08), in the expression of miR-142 in PBMCs.
- Acute rejection of human renal allografts was also characterized by underexpression of miRNAs within the rejecting allografts compared to allografts with normal biopsy results. Indeed, among the 53 miRNAs differentially expressed between AR biopsies and normal biopsies, 43 were underexpressed and only 10 were overexpressed in the AR biopsies (
Fig. 2 ). - Two members of the let-7 family (let-7a and let-7c) were underexpressed in AR biopsies. Our investigation showed that let-7c is downregulated in PHA-activated PBMCs (
Fig. 5 D and E) and mRNA for both H-ras and c-myc are upregulated (Fig. 5 F-I). However, the reduction in the expression of let-7c was not observed 24 h after activation and was evident after 48 h, whereas the maximum upregulation of H-ras and c-myc was observed 24 h following activation (Fig. 5 H and I). Thus, downregulation of let-7c does not appear to be an absolute prerequisite for the upregulation of H-ras or c-myc in normal human PBMCs. - miR-30a-3p and miR-10b were both underexpressed in AR biopsies compared to normal allograft biopsies (
Fig. 3 ). These miRNAs were expressed at a greater abundance in HRECs compared to PBMCs, and activation of HRECs, as demonstrated by increased expression of mRNA for proinflammatory chemokines MCP-1, RANTES, and IP-10 (Fig. 7 ), was associated with a reduced expression of miR-30a-3p (Fig. 6 ). - Example 20: Urinary Cell Levels of
miRNA 155 are diagnostic of acute rejection. Total RNA containing miRNAs was isolated from urinary cells collected from renal allograft recipients and levels of RNU44 (house keeping gene) andmiRNA 155 were measured real time quantitative PCR assays. Urinary cell levels ofmiRNA 155 and notRNU 44 were significantly higher in urine from patients whose biopsies were classified acute rejection (n=3 specimens) compared to urine from patients with stable graft function and normal biopsy findings (n=13 specimens).Table 1: Characteristics of renal allograft recipients* Serum creatinime (mg/DL) Biopsy ID Sample group Recipient gender Ethnicity Recipient age (years) Date of transplentation Type of transplantattion Date of biopsy (days) Indication of biopsy Immunosuppressive treatment at biopsy Bantt 97 diagnostik Banff grade C4d stainings Tacrolumus blood level at biopsy (ng/mL) Baseline level At biopsy After treatment of acute rejection #1 Training set M Black 52 07/08/04 Living 161 dysfunction TacrolimusMMF/ steroids 4 1B Neg 4.0 1.1 3.2 2.4 #2 Training set White 32 01/11/07 Living 119 Graft dysfunction Tacrolimus/MMF 4 1B Neg 13.1 1.6 10.2 2.3 #3 Training set F White 48 03/04/07 Deceased 31 Graft dysfunction Tacrolimus/MMF/ 4 1B Neg 7.0 2.2 3.3 1.7 #4 Training set F Black 40 06/19/03 Living 203 Protocol Tacrolimus/MMF 1 - 7.5 1.1 1.3 - #5 Training set M Indian 50 07/03/05 Living 191 Protocol Tacrolimus/MMF 1 - 6.2 1.4 1.7 - #6 Training set M Black 31 05/06/04 Living 196 Protocol Tacrolimus/MMF t - 8.7 1.2 1.7 - #7 Training set M Asian 51 03/24/05 Deceased 88 Protocol Tacrolimus/MMF 1 - 13.1 1.3 1.3 - #9 Training set M White 36 11/24/02 Deceased 1081 Graft dysfunction Tacrolimus/MMF/ steroids 4 1B Neg 6.1 1.9 4.1 3.3 Validation set M Black 48 01/11/06 Deceased 166 Graft dysfunction Tacrolimus/MMF/ steroids 4 1B Neg 1.7 2.7 6.7 3.9 #10 Validation set F Hispanic 28 02/22/01 Living 1911 Graft dysfunction Tacrolimus/MMF/ steroids 4 1B - 7.2 1.3 10.4 HD8 #11 Validaton set M White 36 11/24/02 Deceased 969 Graft dysfunction Tacrolimus/MMF/ 4 1B Neg 6.2 1.2 2.8 1.9 #12 Validation set M Black 37 01/19/06 Living 244 Graft Non compliant 4 1B Neg <1.5 1.9 7.9 3.5 #13 Validation set F Hispanic 58 05/09/02 Living 370 Protocol Tacrolimus/MMF 1 - 2.0 1.0 1.0 - #14 Validation set M Hispanic 61 06/30/05 Living 35 Protocol Tacrolimus/MMF 1 - 9.4 1.2 1.2 - #15 Validation set M White 67 08/26/05 Deceased 40 Protocol Tacrolimus/MMF 1 - 13.5 1.2 1.7 #16 Validation set F White 57 03/17/05 Living 175 Protocol Tacrolimus/MMF/ 1 - 10.3 1 1.4 - #17 Validation set F Black 44 11/06/13 Living 189 Protocol Tacrolimus/MMF 1 - - .4 1.4 - #18 Validation set F Black 63 05/24/05 Deceased 86 Protocol Tacrolimus/MMF 1 - 9.9 1.2 1.3 - #19 Validation set F White 58 03/11/05 Living 404 Protocol Tacrolimus/MMF/ 1 - 1.4 1.3 1.7 - #20 Validation set M White 47 12/14/04 Living 366 Protocol Tacrolimus/MMF 1 - 7.3 1.6 1.6 - #21 Validation set F Black 51 03/24/06 Deceased 40 Protocol Tacrolimus/MMF 1 - 8.0 1.1 1.1 - #22 Validation set F Other 43 12/02/04 Deceased 147 Graft dysfunction Tacrolimus/MMF/ steroids 4 1B Focal 8.8 0.9 1.8 1.0 #23 Validation set F Black 24 07/08/09 Deceased 2283 Graft dysfunction Tacrolimus/MMF/ 4 1B Neg 5.1 1.6 11.2 HD #24 Validation set M Black 44 03/25/05 Deceased 137 Graft dysfunction Tacrolimus/MMF/ steroids 4 1B Neg 3.1 2.2 3.8 2.6 #25 Validation set M Hispanic 34 11/01/05 Living 20 Graft dysfunction Tacrolimus/MMF 4 1A Neg 12.9 1.3 2.1 1.3 #26 Validation set F Hispanic 37 01/16/03 Living 145 Protocol Tacrolimus/MMF/steroids t - 4.7 0.9 0.9 - #27 Validation set F Black 27 09/17/02 Living 365 Protocol Tacrolimus/MMF/ 1 - 10.9 0.9 0.9 - #28 Validatoin set M White 46 06/03/03 Living 408 Protocol Tacrolimus/MMF 1 - 6.9 1.2 1.4 - #29 Validation set M Axian 33 10/15/03 Deceased 201 Protocol Tacrolimus/MMF/ steroids 1 - 8.5 1.4 1.5 #30 Validation set Black 35 10/23/05 Deceased 221 Protocol Tacrolimus/MMF 1 - 6.7 1.2 1.3 - #31 Validation set F Hispanic 32 01/25/05 Living 79 Protocol Tacrolimus/MMF 1 - 10.9 0.9 1.2 - #32 Validation set F Asian 44 01/14/05 Living 109 Protocol Tacrolimus/MMF/ 1 - 5.3 1.0 1.2 #33 Validation set F White 43 03/22/05 Living 30 Protocol Tacrolimus/MMF t - 12.1 0.7 1.0 - -
- <110> Cornell University Suthanthiran, Manikkam
- <120> Method to Assess Human Allograft status from MicroRNA Expression Levels
- <130> 955-88 PCT
- <140> unassigned
<141> 2010-03-15 - <160> 86
- <170> PatentIn version 3.5
- <210> 1
<211> 20
<212> RNA
<213> Artificial Sequence - <220>
<223> Synthetic nucleotide sequence: miR-142-5p - <400> 1
cauaaaguag aaagcacuac 20 - <210> 2
<211> 23
<212> RNA
<213> Artificial Sequence - <220>
<223> Synthetic nucleotide sequence: miR-142-3p - <400> 2
uguaguguuu ccuacuuuau gga 23 - <210> 3
<211> 22
<212> RNA
<213> Artificial Sequence - <220>
<223> Synthetic nucleotide sequence: miR-155 - <400> 3
uuaaugcuaa ucgugauagg gg 22 - <210> 4
<211> 22
<212> RNA
<213> Artificial Sequence - <220>
<223> Synthetic nucleotide sequence: miR-146a - <400> 4
ugagaacuga auuccauggg uu 22 - <210> 5
<211> 22
<212> RNA
<213> Artificial sequence - <220>
<223> Synthetic nucleotide sequence: miR-146b - <400> 5
ugagaacuga auuccauagg cu 22 - <210> 6
<211> 24
<212> RNA
<213> Artificial Sequence - <220>
<223> Synthetic nucleotide sequence: miR-342 - <400> 6
ucucacacag aaaucgcacc cguc 24 - <210> 7
<211> 21
<212> RNA
<213> Artificial Sequence - <220>
<223> Synthetic nucleotide sequence: miR-650 - <400> 7
aggaggcagc gcucucaggac 21 - <210> 8
<211> 22
<212> RNA
<213> Artificial sequence - <220>
<223> Synthetic nucleotide sequence: miR-21 - <400> 8
uagcuuauca gacugauguuga 22 - <210> 9
<211> 23
<212> RNA
<213> Artificial Sequence - <220>
<223> Synthetic nucleotide sequence: miR-425-5p - <400> 9
aaugacacga ucacucccgu uga 23 - <210> 10
<211> 23
<212> RNA
<213> Artificial Sequence - <220>
<223> Synthetic nucleotide sequence: miR-30c - <400> 10
uguaaacauc cuacacucuc agc 23 - <210> 11
<211> 22
<212> RNA
<213> Artificial sequence - <220>
<223> Synthetic nucleotide sequence: miR-30a-3p - <400> 11
cuuucagucg gauguuugca gc 22 - <210> 12
<211> 23
<212> RNA
<213> Artificial sequence - <220>
<223> Synthetic nucleotide sequence: miR-10a - <400> 12
uacccuguag auccgaauuu gug 23 - <210> 13
<211> 22
<212> RNA
<213> Artificial Sequence - <220>
<223> Synthetic nucleotide sequence: miR-30e-3p - <400> 13
cuuucagucg gauguuuaca gc 22 - <210> 14
<211> 22
<212> RNA
<213> Artificial Sequence - <220>
<223> Synthetic nucleotide sequence: miR-30b - <400> 14
uguaaacauc cuacacucagcu 22 - <210> 15
<211> 22
<212> RNA
<213> Artificial Sequence - <220>
<223> synthetic nucleotide sequence: miR-10b - <400> 15
uacccuguag aaccgaauuu gu 22 - <210> 16
<211> 21
<212> RNA
<213> Artificial sequence - <220>
<223> Synthetic nucleotide sequence: miR-32 - <400> 16
uauugcacau uacuaaguugc 21 - <210> 17
<211> 23
<212> RNA
<213> Artificial Sequence - <220>
<223> synthetic nucleotide sequence: miR-9 - <400> 17
ucuuugguua ucuagcugua uga 23 - <210> 18
<211> 24
<212> RNA
<213> Artificial Sequence - <220>
<223> Synthetic nucleotide sequence: miR-193b - <400> 18
aacuggcccu caaagucccg cuuu 24 - <210> 19
<211> 22
<212> RNA
<213> Artificial Sequence - <220>
<223> Synthetic nucleotide sequence: miR-143 - <400> 19
ugagaugaag cacuguagcuca 22 - <210> 20
<211> 23
<212> RNA
<213> Artificial sequence - <220>
<223> Synthetic nucleotide sequence: miR-489 - <400> 20
agugacanca cauauacggc agc 23 - <210> 21
<211> 21
<212> RNA
<213> Artificial Sequence - <220>
<223> Synthetic nucleotide sequence: miR-27b - <400> 21
uucacagugg cuaaguucugc 21 - <210> 22
<211> 21
<212> RNA
<213> Artificial sequence - <220>
<223> Synthetic nucleotide sequence: miR-126 - <400> 22
cauuauuacu uuugguacgcg 21 - <210> 23
<211> 21
<212> RNA
<213> Artificial Sequence - <220>
<223> Synthetic nucleotide sequence: miR-193a - <400> 23
aacuggccua caaagucccag 21 - <210> 24
<211> 22
<212> RNA
<213> Artificial Sequence - <220>
<223> Synthetic nucleotide sequence; miR-378 - <400> 24
cuccugacuc cagguccugu gu 22 - <210> 25
<211> 22
<212> RNA
<213> Artificial Sequence - <220>
<223> Synthetic nucleotide sequence: miR-429 - <400> 25
uaauacuguc ugguaaaaccgu 22 - <210> 26
<211> 22
<212> RNA
<213> Artificial sequence - <220>
<223> Synthetic nucleotide sequence: miR-181c - <400> 26
aacauucaac cugucgguga gu 22 - <210> 27
<211> 21
<212> RNA
<213> Artificial Sequence - <220>
<223> Synthetic nucleotide sequence: miR-196b - <400> 27
uagguaguuu ccuguuguugg 21 - <210> 28
<211> 23
<212>RNA
<213> Artificial Sequence - <220>
<223> Synthetic nucleotide sequence: miR-199a - <400> 28
cccaguguuc agacuaccug uuc 23 - <210> 29
<211> 22
<212> RNA
<213> Artificial Sequence - <220>
<223> synthetic nucleotide sequence: miR-660 - <400> 29
uacccauugc auaucggagu ug 22 - <210> 30
<211> 22
<212> RNA
<213> Artificial Sequence - <220>
<223> Synthetic nucleotide sequence: miR-203 - <400> 30
gugaaauguu uaggaccacuag 22 - <210> 31
<211> 22
<212> RNA
<213> Artificial Sequence - <220>
<223> Synthetic nucleotide sequence: miR-204 - <400> 31
uucccuuugu cauccuaugccu 22 - <210> 32
<211> 20
<212> RNA
<213> Artificial Sequence - <220>
<223> Synthetic nucleotide sequence: miR-30e-5p - <400> 32
uguaaacauc cuugacugga 20 - <210> 33
<211> 22
<212> RNA
<213> Artificial sequence - <220>
<223> Synthetic nucleotide sequence: miR-30a-5p - <400> 33
uguaaacauc cucgacuggaag 22 - <210> 34
<211> 22
<212> RNA
<213> Artificial Sequence - <220>
<223> Synthetic nucleotide sequence: miR-30d - <400> 34
uguaaacauc cccgacuggaag 22 - <210> 35
<211> 22
<212> RNA
<213> Artificial Sequence - <220>
<223> Synthetic nucleotide sequence: miR-125b - <400> 35
ucccugagac ccuaacuuguga 22 - <210> 36
<211> 22
<212> RNA
<213> Artificial Sequence - <220>
<223> Synthetic nucleotide sequence: miR-130a - <400> 36
cagugcaaug uuaaaagggc au 22 - <210> 37
<211> 21
<212> RNA
<213> Artificial Sequence - <220>
<223> Synthetic nucleotide sequence: miR-126 - <400> 37
ucguaccgug aguaauaaugc 21 - <210> 38
<211> 21
<212> RNA
<213> Artificial Sequence - <220>
<223> Synthetic nucleotide sequence: miR-195. - <400> 38
uagcagcaca gaaauauuggc 21 - <210> 39
<211> 21
<212> RNA
<213> Artificial Sequence - <220>
<223> Synthetic nucleotide sequence: miR-26a - <400> 39
uucaaguaau ccaggauaggc 21 - <210> 40
<211> 22
<212> RNA
<213> Artificial sequence - <220>
<223> synthetic nucleotide sequence: miR-26b - <400> 40
uucaaguaau ucaggauagg uu 22 - <210> 41
<211> 21
<212> RNA
<213> Artificial Sequence - <220>
<223> Synthetic nucleotide sequence: miR-497 - <400> 41
cagcagcaca cugugguuugu 21 - <210> 42
<211> 22
<212> RNA
<213> Artificial sequence - <220>
<223> Synthetic nucleotide sequence: miR-152 - <400> 42
ucagugcaug acagaacuug gg 22 - <210> 43
<211> 22
<212> RNA
<213> Artificial Sequence - <220>
<223> Synthetic nucleotide sequence: miR-141 - <400> 43
uaacacuguc ugguaaagau gg 22 - <210> 44
<211> 21
<212> RNA
<213> Artificial sequence - <220>
<223> Synthetic nucleotide sequence: miR-296 - <400> 44
agggcccccc cucaauccugu 21 - <210> 45
<211> 22
<212> RNA
<213> Artificial Sequence - <220>
<223> synthetic nucleotide sequence: miR-365 - <400> 45
uaaugccccu aaaaauccuu au 22 - <210> 46
<211> 22
<212> RNA
<213> Artificial sequence - <220>
<223> synthetic nucleotide sequence: miR-99a - <400> 46
aacccguaga uccgaucuug ug 22 - <210> 47
<211> 22
<212> RNA
<213> Artificial sequence - <220>
<223> synthetic nucleotide sequence: miR-100 - <400> 47
aacccguaga uccgaacuug ug 22 - <210> 48
<211> 23
<212> RNA
<213> Artificial Sequence - <220>
<223> Synthetic nucleotide sequence: miR-166 - <400> 48
caaagaauuc uccuuuuggg cuu 23 - <210> 49
<211> 22
<212> RNA
<213> Artificial Sequence - <220>
<223> Synthetic nucleotide sequence: let-7a - <400> 49
ugagguagua gguuguauag uu 22 - <210> 50
<211> 21
<212> RNA
<213> Artificial Sequence - <220>
<223> Synthetic nucleotide sequence: miR-223 - <400> 50
ugucaguuug ucaaauacccc 21 - <210> 51
<211> 22
<212> RNA
<213> Artificial Sequence - <220>
<223> Synthetic nucleotide sequence: let-7c - <400> 51
ugagguagua gguuguaugg uu 22 - <210> 52
<211> 23
<212> RNA
<213> Artificial Sequence - <220>
<223> Synthetic nucleotide sequence: miR-125a - <400> 52
ucccugagac ccuuuaaccu gug 23 - <210> 53
<211> 22
<212> RNA
<213> Artificial Sequence - <220>
<223> Synthetic nucleotide sequence: miR-200a - <400> 53
uaacacuguc ugguaacgaugu 22 - <210> 54
<211> 26
<212> DNA
<213> Artificial Sequence - <220>
<223> Synthetic nucleotide sequence - <400> 54
aagaaatggg tggtattaca cagaca 26 - <210> 55
<211> 27
<212> DNA
<213> Artificial Sequence - <220>
<223> Synthetic nucleotide Sequence - <400> 55
aagaaatggg tggtattaca cagacat 27 - <210> 56
<211> 33
<212> DNA
<213> Artificial Sequence - <220>
<223> Synthetic nucleotide sequence - <400> 56
ccatctctgg aaccacagta atattgacatgcc 33 - <210> 57
<211> 25
<212> DNA
<213> Artificial sequence - <220>
<223> Synthetic nucleotide sequence - <400> 57
aactccccat ctacccaata ctgtt 25 - <210> 58
<211> 23
<212> DNA
<213> Artificial Sequence - <220>
<223> synthetic nucleotide Sequence - <400> 58
agaaggcaaa gatcagcatcact 23 - <210> 59
<211> 31
<212> DNA
<213> Artificial sequence - <220>
<223> Synthetic nucleotide sequence - <400> 59
cagcatacaa tctctgttct tgggcatttt g 31 - <210> 60
<211> 20
<212> DNA
<213> Artificial sequence - <220>
<223> Synthetic nucleotide Sequence - <400> 60
tcacgagcaa cttgcaaaga 20 - <210> 61
<211> 21
<212> DNA
<213> Artificial Sequence - <220>
<223> Synthetic nucleotide sequence - <400> 61
tcccatcacc gttagcaactc 21 - <210> 62
<211> 24
<212> DNA
<213> Artificial sequence - <220>
<223> Synthetic nucleotide sequence - <400> 62
tgtggcagtc accccaagtt cagc 24 - <210> 63
<211> 21
<212> DNA
<213> Artificial Sequence - <220>
<223> Synthetic nucleotide Sequence - <400> 63
tggaggcagg catttcagta a 21 - <210> 64
<211> 17
<212> DNA
<213> Artificial Sequence - <220>
<223> Synthetic nucleotide Sequence - <400> 64
ttcccggcaa cccactt 17 - <210> 65
<211> 25
<212> DNA
<213> Artificial Sequence - <220>
<223> Synthetic nucleotide sequence - <400> 65
cccgagtgtt ccgatccagt ccagt 25 - <210> 66
<211> 21
<212> DNA
<213> Artificial Sequence - <220>
<223> synthetic nucleotide sequence - <400> 66
tgtgtgtgtt tgccatcaac a 21 - <210> 67
<211> 23
<212> DNA
<213> Artificial Sequence - <220>
<223> Synthetic nucleotide sequence - <400> 67
cgtttgatct gctccctgta ctg 23 - <210> 68
<211> 19
<212> DNA
<213> Artificial Sequence - <220>
<223> Synthetic nucleotide Sequence - <400> 68
caccaagtct tttgaggac 19 - <210> 69
<211> 17
<212> DNA
<213> Artificial sequence - <220>
<223> Synthetic nucleotide Sequence - <400> 69
acaccgccca ccaccag 17 - <210> 70
<211> 24
<212> DNA
<213> Artificial Sequence - <220>
<223> Synthetic nucleotide sequence - <400> 70
tccacagaaa caacatcgat ttct 24 - <210> 71
<211> 18
<212> DNA
<213> Artificial Sequence - <220>
<223> Synthetic nucleotide sequence - <400> 71
aggaacaaga agatgagg 18 - <210> 72
<211> 21
<212> DNA
<213> Artificial sequence - <220>
<223> Synthetic nucleotide sequence - <400> 72
catagcagcc accttcattcc 21 - <210> 73
<211> 24
<212> DNA
<213> Artificial Sequence - <220>
<223> Synthetic nucleotide sequence - <400> 73
tctgcactga gatcttccta ttgg 24 - <210> 74
<211> 26
<212> DNA
<213> Artificial Sequence - <220>
<223> Synthetic nucleotide Sequence - <400> 74
cagatgcaat caatgcccca gtcacc 26 - <210> 75
<211> 18
<212> DNA
<213> Artificial sequence - <220>
<223> Synthetic nucleotide Sequence - <400> 75
tctgccgctcc tgcatctg 18 - <210> 76
<211> 18
<212> DNA
<213> Artificial Sequence - <220>
<223> Synthetic nucleotide sequence - <400> 76
agtgggcggg caatgtag 18 - <210> 77
<211> 22
<212> DNA
<213> Artificial Sequence - <220>
<223> Synthetic nucleotide Sequence - <400> 77
tcggacacca caccctgctgct 22 - <210> 78
<211> 22
<212> DNA
<213> Artificial sequence - <220>
<223> Synthetic nucleotide sequence - <400> 78
tgtccacgtg ttgagatcat tg 22 - <210> 79
<211> 20
<212> DNA
<213> Artificial sequence - <220>
<223> synthetic nucleotide sequence - <400> 79
ggccttcgat tctggattca 20 - <210> 80
<211> 24
<212> DNA
<213> Artificial sequence - <220>
<223> Synthetic nucleotide sequence - <400> 80
tacaatgaaa aagaagggtg agaa 24 - <210> 81
<211> 20
<212> DNA
<213> Artificial Sequence - <220>
<223> synthetic nucleotide sequence - <400> 81
gcccgaagcg tttactttga 20 - <210> 82
<211> 24
<212> DNA
<213> Artificial Sequence - <220>
<223> synthetic nucleotide sequence - <400> 82
tccattattc ctagctgcgg tatc 24 - <210> 83
<211> 19
<212> DNA
<213> Artificial sequence - <220>
<223> Synthetic nucleotide sequence - <400> 83
aaagcaggcc cgagecgcc 19 - <210>84
<211> 21
<212> DNA
<213> Artificial sequence - <220>
<223> synthetic nucleotide sequence - <400> 84
cccacatctg gagcagagtc a 21 - <210> 85
<211> 23
<212> DNA
<213> Artificial sequence - <220>
<223> Synthetic nucleotide sequence - <400> 85
cagatgccat ttttcaggtc ttg 23 - <210> 86
<211> 26
<212> DNA
<213> Artificial sequence - <220>
<223> Synthetic nucleotide sequence - <400> 86
caggtgacaa gtgacggtgg tctcca 26
Claims (9)
- A method for assessing risk of renal allograft rejection in a patient having a renal allograft, the method comprising:(a) measuring an amount of expression of a small non-coding marker RNA in a urine or renal allograft tissue biopsy sample from the patient, said small non-coding marker RNA including SEQ ID N0:1; and(b) comparing the measured amount of expression in step (a) to a reference amount of expression of said small non-coding marker RNA;wherein an increase of expression of said small non-coding marker RNA that is equivalent to at least 1-fold as compared to said reference amount of expression of the small non-coding marker RNA indicates an increased risk of rejection of said renal allograft.
- The method according to claim 1, wherein said risk of rejection is increased by about 10% to about 100%.
- The method according to claim 1, wherein the sample is a renal allograft tissue biopsy sample.
- The method according to claim 1, wherein said reference amount is obtained by measuring an amount of expression of the small non-coding marker RNA in a urine or transplant tissue biopsy sample of a person having a non-rejected organ.
- The method according to 1, wherein said reference amount is obtained by measuring an amount of expression of said small non-coding marker RNA in a second urine or tissue biopsy sample from the patient.
- The method according to claim 5, wherein the second tissue biopsy sample is from a second renal organ in the patient.
- The method according to claim 6, wherein the organ is a non-transplanted renal organ or a non-rejected renal allograft.
- The method according to claim 1, further comprising(c) measuring a difference between the amount of expression of the small non-coding marker RNA in the urine or renal allograft tissue biopsy sample and the reference amount of expression of said small non-coding marker RNA;(d) measuring an amount of expression of an endogenously expressed small noncoding reference RNA in the sample from the patient;(e) measuring a difference between the amount of expression of the endogenously expressed small non-coding reference RNA in the sample from the patient and a reference amount of expression of said endogenously expressed small non-coding reference RNA;(f) comparing the difference in step (c) to the difference in step (e),wherein a difference in step (c) that is greater than the difference in step (d) further indicates an increased risk of rejection of said transplanted organ.
- A method for assessing risk of renal allograft rejection in a patient having a renal allograft, the method comprising:(a) measuring an amount of expression of a small non-coding marker RNA in a urine sample or renal allograft tissue biopsy sample from the patient, said small non-coding RNA including SEQ ID N0:1;(b) measuring an amount of expression of an endogenously expressed small non-coding reference RNA in the sample from the patient;(c) comparing the measured amount of step (a) to the measured amount of step (b) to determine a first ratio;(d) measuring an amount of expression of said small non-coding marker RNA in a urine or renal allograft tissue biopsy sample from a person having a non-rejected renal allograft, said small non-coding RNA including SEQ ID N0:1;(e) measuring an amount of expression of an endogenously expressed small noncoding reference RNA in the sample from the person having a non-rejected renal allograft; and(f) comparing the measured amount of step (d) to the measured amount of step (e) to determine a second ratio;wherein a calculation of the first ratio being greater than the second ratio by an amount equivalent to at least 1-fold indicates an increased risk of rejection of said renal allograft.
Applications Claiming Priority (2)
| Application Number | Priority Date | Filing Date | Title |
|---|---|---|---|
| US16018809P | 2009-03-13 | 2009-03-13 | |
| PCT/US2010/027361 WO2010105275A2 (en) | 2009-03-13 | 2010-03-15 | Method to assess human allograft status from microrna expression levels |
Publications (3)
| Publication Number | Publication Date |
|---|---|
| EP2406402A2 EP2406402A2 (en) | 2012-01-18 |
| EP2406402A4 EP2406402A4 (en) | 2015-09-16 |
| EP2406402B1 true EP2406402B1 (en) | 2018-05-16 |
Family
ID=42729169
Family Applications (1)
| Application Number | Title | Priority Date | Filing Date |
|---|---|---|---|
| EP10751549.6A Not-in-force EP2406402B1 (en) | 2009-03-13 | 2010-03-15 | Method to assess human allograft status from microrna expression levels |
Country Status (4)
| Country | Link |
|---|---|
| US (1) | US9868988B2 (en) |
| EP (1) | EP2406402B1 (en) |
| CN (1) | CN103003442B (en) |
| WO (1) | WO2010105275A2 (en) |
Families Citing this family (17)
| Publication number | Priority date | Publication date | Assignee | Title |
|---|---|---|---|---|
| WO2010105275A2 (en) | 2009-03-13 | 2010-09-16 | Cornell University | Method to assess human allograft status from microrna expression levels |
| US9752191B2 (en) | 2009-07-09 | 2017-09-05 | The Scripps Research Institute | Gene expression profiles associated with chronic allograft nephropathy |
| US9746479B2 (en) | 2010-03-09 | 2017-08-29 | Cornell University | Methods and compositions to predict and detect acute rejection |
| US9334498B2 (en) | 2012-05-10 | 2016-05-10 | Uab Research Foundation | Methods and compositions for modulating MIR-204 activity |
| WO2014093504A1 (en) * | 2012-12-11 | 2014-06-19 | Duke University | Microrna biomarkers for graft versus host disease |
| US20170130267A1 (en) * | 2014-03-17 | 2017-05-11 | Inserm (Institut National De La Sante Et De La Recerrche Medicale) | Methods for predicting acute rejection in heart recipients |
| EP3129504A4 (en) * | 2014-04-10 | 2018-02-14 | The Trustees Of The University Of Pennsylvania | Use of micro-ribonucleic acid (mirna) to diagnose transplant rejection and tolerance of immunosuppression therapy |
| US11104951B2 (en) | 2014-05-22 | 2021-08-31 | The Scripps Research Institute | Molecular signatures for distinguishing liver transplant rejections or injuries |
| US10443100B2 (en) | 2014-05-22 | 2019-10-15 | The Scripps Research Institute | Gene expression profiles associated with sub-clinical kidney transplant rejection |
| CN104313145B (en) * | 2014-10-16 | 2016-03-23 | 上海交通大学医学院附属仁济医院 | MiRNA-30e is preparing the purposes in diagnostic reagent as tagged molecule |
| US20160138106A1 (en) * | 2014-11-14 | 2016-05-19 | The Trustees Of Columbia University In The City Of New York | Circulating Non-coding RNA Profiles for Detection of Cardiac Transplant Rejection |
| EP3070178B1 (en) * | 2015-03-20 | 2020-02-12 | Albert-Ludwigs-Universität Freiburg | Method for diagnosing breast cancer |
| US20180292384A1 (en) * | 2015-05-29 | 2018-10-11 | Cornell University | Urine metabolite profiles identify kidney allograft status |
| US11046932B2 (en) * | 2016-01-25 | 2021-06-29 | Albert-Ludwigs-Universitaet Freiburg | Method of producing renal cells from differentiated cells |
| WO2019204730A1 (en) * | 2018-04-19 | 2019-10-24 | Duke University | Compositions and methods for donor selection and prognosis of acute graft-versus-host disease |
| TWI758670B (en) * | 2018-12-24 | 2022-03-21 | 奎克生技光電股份有限公司 | Health risk assessment method |
| DE102020205364B4 (en) * | 2020-04-28 | 2022-01-20 | Universität Rostock | Method of monitoring the progress of cardiomyocyte transplantation and method of determining whether a subject is eligible for cardiomyocyte transplantation |
Family Cites Families (14)
| Publication number | Priority date | Publication date | Assignee | Title |
|---|---|---|---|---|
| HU223760B1 (en) | 1991-09-24 | 2005-01-28 | Keygene N.V. | Selective restriction fragment amplification, a general method for dna fingerprinting |
| US7625697B2 (en) * | 1994-06-17 | 2009-12-01 | The Board Of Trustees Of The Leland Stanford Junior University | Methods for constructing subarrays and subarrays made thereby |
| US6187534B1 (en) | 1997-09-24 | 2001-02-13 | Cornell Research Foundation, Inc. | Methods of evaluating transplant rejection |
| US6900015B2 (en) | 2000-04-24 | 2005-05-31 | Beth Israel Deaconess Medical Center, Inc. | Measurement of protective genes in allograft rejection |
| EP1390544B1 (en) | 2001-04-17 | 2006-11-29 | The New York Blood Center, Inc. | Universal multi-variant detection system |
| US7235358B2 (en) | 2001-06-08 | 2007-06-26 | Expression Diagnostics, Inc. | Methods and compositions for diagnosing and monitoring transplant rejection |
| WO2003043663A1 (en) * | 2001-11-22 | 2003-05-30 | Anges Mg, Inc. | Compositions inhibiting rejection in organ transplantation and method of using the same |
| US7130679B2 (en) * | 2002-11-20 | 2006-10-31 | Medtronic, Inc. | Organ rejection monitoring |
| CN1654637A (en) * | 2005-02-21 | 2005-08-17 | 田文志 | Interferential RNA retrovirus and its preparation and use |
| US20080131441A1 (en) | 2006-09-26 | 2008-06-05 | Manikkam Suthanthiran | Methods of Using FOXP3 Levels to Predict the Outcome of Organs Undergoing Acute Rejection |
| WO2008079303A2 (en) | 2006-12-20 | 2008-07-03 | The Brigham And Women's Hospital, Inc. | Detection of organ rejection |
| WO2010105275A2 (en) | 2009-03-13 | 2010-09-16 | Cornell University | Method to assess human allograft status from microrna expression levels |
| EP2435476A4 (en) * | 2009-05-27 | 2013-04-17 | Synageva Biopharma Corp | Avian derived antibodies |
| US9746479B2 (en) | 2010-03-09 | 2017-08-29 | Cornell University | Methods and compositions to predict and detect acute rejection |
-
2010
- 2010-03-15 WO PCT/US2010/027361 patent/WO2010105275A2/en active Application Filing
- 2010-03-15 US US13/256,422 patent/US9868988B2/en active Active
- 2010-03-15 CN CN201080021368.6A patent/CN103003442B/en not_active Expired - Fee Related
- 2010-03-15 EP EP10751549.6A patent/EP2406402B1/en not_active Not-in-force
Non-Patent Citations (1)
| Title |
|---|
| HAMDORF MATTHIAS ET AL: "The Potential of MicroRNAs as Novel Biomarkers for Transplant Rejection.", JOURNAL OF IMMUNOLOGY RESEARCH 2017, vol. 2017, 2017, pages 4072364, ISSN: 2314-7156 * |
Also Published As
| Publication number | Publication date |
|---|---|
| CN103003442A (en) | 2013-03-27 |
| EP2406402A2 (en) | 2012-01-18 |
| WO2010105275A2 (en) | 2010-09-16 |
| CN103003442B (en) | 2018-10-09 |
| US20120101001A1 (en) | 2012-04-26 |
| EP2406402A4 (en) | 2015-09-16 |
| WO2010105275A3 (en) | 2014-04-03 |
| US9868988B2 (en) | 2018-01-16 |
Similar Documents
| Publication | Publication Date | Title |
|---|---|---|
| EP2406402B1 (en) | Method to assess human allograft status from microrna expression levels | |
| KR101912731B1 (en) | Plasma MicroRNAs for The Detection of Early Colorectal Cancer | |
| AU2012265177B2 (en) | Methods and devices for prognosis of cancer relapse | |
| EP2800820B1 (en) | Methods and kits for detecting subjects having pancreatic cancer | |
| US20140243240A1 (en) | microRNA EXPRESSION PROFILING OF THYROID CANCER | |
| US20160076098A1 (en) | Methods of diagnosing and treating chronic pain | |
| AU2012265177A1 (en) | Methods and devices for prognosis of cancer relapse | |
| AU2018202963A1 (en) | Biomarkers useful for detection of types, grades and stages of human breast cancer | |
| US20130165497A1 (en) | Monitoring of immune system using peripheral blood micro-rna expression profile analysis and uses thereof | |
| US20130012405A1 (en) | Circulating miRNA Biomaker Signatures | |
| WO2014114802A1 (en) | Non-invasive prenatal genetic diagnostic methods | |
| WO2011154008A1 (en) | Microrna classification of thyroid follicular neoplasia | |
| US20100266555A1 (en) | Micro rnas as markers of the functional state of a dendritic cell | |
| EP3083987B1 (en) | Determination of platelet-mirnas in alzheimer's disease | |
| US20170159125A1 (en) | Micro-rna biomarkers for haemolysis and methods of using same | |
| US20150152499A1 (en) | Diagnostic portfolio and its uses | |
| KR102546809B1 (en) | Method of providing information for diagnosing acute tumor response of cervical cancer | |
| US20200199680A1 (en) | MIRNA in Gulf War Illness | |
| EP3725882A1 (en) | Method for aiding detection of alzheimer's disease | |
| Akbas et al. | ANALYSIS OF SERUM MICRO-RNAs AS POTENTIAL BIOMARKER IN CHRONIC OBSTRUCTIVE PULMONARY | |
| Fichtlscherer et al. | Clinical/Translational Research |
Legal Events
| Date | Code | Title | Description |
|---|---|---|---|
| PUAI | Public reference made under article 153(3) epc to a published international application that has entered the european phase |
Free format text: ORIGINAL CODE: 0009012 |
|
| 17P | Request for examination filed |
Effective date: 20111012 |
|
| AK | Designated contracting states |
Kind code of ref document: A2 Designated state(s): AT BE BG CH CY CZ DE DK EE ES FI FR GB GR HR HU IE IS IT LI LT LU LV MC MK MT NL NO PL PT RO SE SI SK SM TR |
|
| DAX | Request for extension of the european patent (deleted) | ||
| R17D | Deferred search report published (corrected) |
Effective date: 20140403 |
|
| RIC1 | Information provided on ipc code assigned before grant |
Ipc: C12Q 1/68 20060101AFI20150413BHEP |
|
| A4 | Supplementary search report drawn up and despatched |
Effective date: 20150813 |
|
| RIC1 | Information provided on ipc code assigned before grant |
Ipc: C12Q 1/68 20060101AFI20150807BHEP |
|
| STAA | Information on the status of an ep patent application or granted ep patent |
Free format text: STATUS: EXAMINATION IS IN PROGRESS |
|
| 17Q | First examination report despatched |
Effective date: 20170418 |
|
| GRAP | Despatch of communication of intention to grant a patent |
Free format text: ORIGINAL CODE: EPIDOSNIGR1 |
|
| STAA | Information on the status of an ep patent application or granted ep patent |
Free format text: STATUS: GRANT OF PATENT IS INTENDED |
|
| INTG | Intention to grant announced |
Effective date: 20171207 |
|
| GRAS | Grant fee paid |
Free format text: ORIGINAL CODE: EPIDOSNIGR3 |
|
| GRAA | (expected) grant |
Free format text: ORIGINAL CODE: 0009210 |
|
| STAA | Information on the status of an ep patent application or granted ep patent |
Free format text: STATUS: THE PATENT HAS BEEN GRANTED |
|
| AK | Designated contracting states |
Kind code of ref document: B1 Designated state(s): AT BE BG CH CY CZ DE DK EE ES FI FR GB GR HR HU IE IS IT LI LT LU LV MC MK MT NL NO PL PT RO SE SI SK SM TR |
|
| REG | Reference to a national code |
Ref country code: GB Ref legal event code: FG4D |
|
| REG | Reference to a national code |
Ref country code: CH Ref legal event code: EP |
|
| REG | Reference to a national code |
Ref country code: IE Ref legal event code: FG4D |
|
| REG | Reference to a national code |
Ref country code: DE Ref legal event code: R096 Ref document number: 602010050635 Country of ref document: DE |
|
| REG | Reference to a national code |
Ref country code: AT Ref legal event code: REF Ref document number: 999610 Country of ref document: AT Kind code of ref document: T Effective date: 20180615 |
|
| REG | Reference to a national code |
Ref country code: NL Ref legal event code: MP Effective date: 20180516 |
|
| REG | Reference to a national code |
Ref country code: LT Ref legal event code: MG4D |
|
| PG25 | Lapsed in a contracting state [announced via postgrant information from national office to epo] |
Ref country code: BG Free format text: LAPSE BECAUSE OF FAILURE TO SUBMIT A TRANSLATION OF THE DESCRIPTION OR TO PAY THE FEE WITHIN THE PRESCRIBED TIME-LIMIT Effective date: 20180816 Ref country code: NO Free format text: LAPSE BECAUSE OF FAILURE TO SUBMIT A TRANSLATION OF THE DESCRIPTION OR TO PAY THE FEE WITHIN THE PRESCRIBED TIME-LIMIT Effective date: 20180816 Ref country code: FI Free format text: LAPSE BECAUSE OF FAILURE TO SUBMIT A TRANSLATION OF THE DESCRIPTION OR TO PAY THE FEE WITHIN THE PRESCRIBED TIME-LIMIT Effective date: 20180516 Ref country code: SE Free format text: LAPSE BECAUSE OF FAILURE TO SUBMIT A TRANSLATION OF THE DESCRIPTION OR TO PAY THE FEE WITHIN THE PRESCRIBED TIME-LIMIT Effective date: 20180516 Ref country code: ES Free format text: LAPSE BECAUSE OF FAILURE TO SUBMIT A TRANSLATION OF THE DESCRIPTION OR TO PAY THE FEE WITHIN THE PRESCRIBED TIME-LIMIT Effective date: 20180516 Ref country code: LT Free format text: LAPSE BECAUSE OF FAILURE TO SUBMIT A TRANSLATION OF THE DESCRIPTION OR TO PAY THE FEE WITHIN THE PRESCRIBED TIME-LIMIT Effective date: 20180516 |
|
| PG25 | Lapsed in a contracting state [announced via postgrant information from national office to epo] |
Ref country code: NL Free format text: LAPSE BECAUSE OF FAILURE TO SUBMIT A TRANSLATION OF THE DESCRIPTION OR TO PAY THE FEE WITHIN THE PRESCRIBED TIME-LIMIT Effective date: 20180516 Ref country code: LV Free format text: LAPSE BECAUSE OF FAILURE TO SUBMIT A TRANSLATION OF THE DESCRIPTION OR TO PAY THE FEE WITHIN THE PRESCRIBED TIME-LIMIT Effective date: 20180516 Ref country code: HR Free format text: LAPSE BECAUSE OF FAILURE TO SUBMIT A TRANSLATION OF THE DESCRIPTION OR TO PAY THE FEE WITHIN THE PRESCRIBED TIME-LIMIT Effective date: 20180516 Ref country code: GR Free format text: LAPSE BECAUSE OF FAILURE TO SUBMIT A TRANSLATION OF THE DESCRIPTION OR TO PAY THE FEE WITHIN THE PRESCRIBED TIME-LIMIT Effective date: 20180817 |
|
| REG | Reference to a national code |
Ref country code: AT Ref legal event code: MK05 Ref document number: 999610 Country of ref document: AT Kind code of ref document: T Effective date: 20180516 |
|
| PG25 | Lapsed in a contracting state [announced via postgrant information from national office to epo] |
Ref country code: PL Free format text: LAPSE BECAUSE OF FAILURE TO SUBMIT A TRANSLATION OF THE DESCRIPTION OR TO PAY THE FEE WITHIN THE PRESCRIBED TIME-LIMIT Effective date: 20180516 Ref country code: EE Free format text: LAPSE BECAUSE OF FAILURE TO SUBMIT A TRANSLATION OF THE DESCRIPTION OR TO PAY THE FEE WITHIN THE PRESCRIBED TIME-LIMIT Effective date: 20180516 Ref country code: DK Free format text: LAPSE BECAUSE OF FAILURE TO SUBMIT A TRANSLATION OF THE DESCRIPTION OR TO PAY THE FEE WITHIN THE PRESCRIBED TIME-LIMIT Effective date: 20180516 Ref country code: RO Free format text: LAPSE BECAUSE OF FAILURE TO SUBMIT A TRANSLATION OF THE DESCRIPTION OR TO PAY THE FEE WITHIN THE PRESCRIBED TIME-LIMIT Effective date: 20180516 Ref country code: AT Free format text: LAPSE BECAUSE OF FAILURE TO SUBMIT A TRANSLATION OF THE DESCRIPTION OR TO PAY THE FEE WITHIN THE PRESCRIBED TIME-LIMIT Effective date: 20180516 Ref country code: CZ Free format text: LAPSE BECAUSE OF FAILURE TO SUBMIT A TRANSLATION OF THE DESCRIPTION OR TO PAY THE FEE WITHIN THE PRESCRIBED TIME-LIMIT Effective date: 20180516 Ref country code: SK Free format text: LAPSE BECAUSE OF FAILURE TO SUBMIT A TRANSLATION OF THE DESCRIPTION OR TO PAY THE FEE WITHIN THE PRESCRIBED TIME-LIMIT Effective date: 20180516 |
|
| REG | Reference to a national code |
Ref country code: DE Ref legal event code: R097 Ref document number: 602010050635 Country of ref document: DE |
|
| PG25 | Lapsed in a contracting state [announced via postgrant information from national office to epo] |
Ref country code: SM Free format text: LAPSE BECAUSE OF FAILURE TO SUBMIT A TRANSLATION OF THE DESCRIPTION OR TO PAY THE FEE WITHIN THE PRESCRIBED TIME-LIMIT Effective date: 20180516 Ref country code: IT Free format text: LAPSE BECAUSE OF FAILURE TO SUBMIT A TRANSLATION OF THE DESCRIPTION OR TO PAY THE FEE WITHIN THE PRESCRIBED TIME-LIMIT Effective date: 20180516 |
|
| PLBE | No opposition filed within time limit |
Free format text: ORIGINAL CODE: 0009261 |
|
| STAA | Information on the status of an ep patent application or granted ep patent |
Free format text: STATUS: NO OPPOSITION FILED WITHIN TIME LIMIT |
|
| 26N | No opposition filed |
Effective date: 20190219 |
|
| PG25 | Lapsed in a contracting state [announced via postgrant information from national office to epo] |
Ref country code: SI Free format text: LAPSE BECAUSE OF FAILURE TO SUBMIT A TRANSLATION OF THE DESCRIPTION OR TO PAY THE FEE WITHIN THE PRESCRIBED TIME-LIMIT Effective date: 20180516 |
|
| PG25 | Lapsed in a contracting state [announced via postgrant information from national office to epo] |
Ref country code: MC Free format text: LAPSE BECAUSE OF FAILURE TO SUBMIT A TRANSLATION OF THE DESCRIPTION OR TO PAY THE FEE WITHIN THE PRESCRIBED TIME-LIMIT Effective date: 20180516 |
|
| REG | Reference to a national code |
Ref country code: CH Ref legal event code: PL |
|
| PG25 | Lapsed in a contracting state [announced via postgrant information from national office to epo] |
Ref country code: LU Free format text: LAPSE BECAUSE OF NON-PAYMENT OF DUE FEES Effective date: 20190315 |
|
| REG | Reference to a national code |
Ref country code: BE Ref legal event code: MM Effective date: 20190331 |
|
| PG25 | Lapsed in a contracting state [announced via postgrant information from national office to epo] |
Ref country code: LI Free format text: LAPSE BECAUSE OF NON-PAYMENT OF DUE FEES Effective date: 20190331 Ref country code: CH Free format text: LAPSE BECAUSE OF NON-PAYMENT OF DUE FEES Effective date: 20190331 |
|
| PG25 | Lapsed in a contracting state [announced via postgrant information from national office to epo] |
Ref country code: BE Free format text: LAPSE BECAUSE OF NON-PAYMENT OF DUE FEES Effective date: 20190331 |
|
| PG25 | Lapsed in a contracting state [announced via postgrant information from national office to epo] |
Ref country code: TR Free format text: LAPSE BECAUSE OF FAILURE TO SUBMIT A TRANSLATION OF THE DESCRIPTION OR TO PAY THE FEE WITHIN THE PRESCRIBED TIME-LIMIT Effective date: 20180516 |
|
| PG25 | Lapsed in a contracting state [announced via postgrant information from national office to epo] |
Ref country code: PT Free format text: LAPSE BECAUSE OF FAILURE TO SUBMIT A TRANSLATION OF THE DESCRIPTION OR TO PAY THE FEE WITHIN THE PRESCRIBED TIME-LIMIT Effective date: 20180917 Ref country code: MT Free format text: LAPSE BECAUSE OF NON-PAYMENT OF DUE FEES Effective date: 20190315 |
|
| PG25 | Lapsed in a contracting state [announced via postgrant information from national office to epo] |
Ref country code: CY Free format text: LAPSE BECAUSE OF FAILURE TO SUBMIT A TRANSLATION OF THE DESCRIPTION OR TO PAY THE FEE WITHIN THE PRESCRIBED TIME-LIMIT Effective date: 20180516 |
|
| PG25 | Lapsed in a contracting state [announced via postgrant information from national office to epo] |
Ref country code: IS Free format text: LAPSE BECAUSE OF FAILURE TO SUBMIT A TRANSLATION OF THE DESCRIPTION OR TO PAY THE FEE WITHIN THE PRESCRIBED TIME-LIMIT Effective date: 20180916 |
|
| PG25 | Lapsed in a contracting state [announced via postgrant information from national office to epo] |
Ref country code: HU Free format text: LAPSE BECAUSE OF FAILURE TO SUBMIT A TRANSLATION OF THE DESCRIPTION OR TO PAY THE FEE WITHIN THE PRESCRIBED TIME-LIMIT; INVALID AB INITIO Effective date: 20100315 |
|
| PGFP | Annual fee paid to national office [announced via postgrant information from national office to epo] |
Ref country code: IE Payment date: 20220328 Year of fee payment: 13 Ref country code: GB Payment date: 20220328 Year of fee payment: 13 Ref country code: DE Payment date: 20220329 Year of fee payment: 13 |
|
| PGFP | Annual fee paid to national office [announced via postgrant information from national office to epo] |
Ref country code: FR Payment date: 20220325 Year of fee payment: 13 |
|
| PG25 | Lapsed in a contracting state [announced via postgrant information from national office to epo] |
Ref country code: MK Free format text: LAPSE BECAUSE OF FAILURE TO SUBMIT A TRANSLATION OF THE DESCRIPTION OR TO PAY THE FEE WITHIN THE PRESCRIBED TIME-LIMIT Effective date: 20180516 |
|
| REG | Reference to a national code |
Ref country code: DE Ref legal event code: R119 Ref document number: 602010050635 Country of ref document: DE |
|
| GBPC | Gb: european patent ceased through non-payment of renewal fee |
Effective date: 20230315 |
|
| REG | Reference to a national code |
Ref country code: IE Ref legal event code: MM4A |
|
| PG25 | Lapsed in a contracting state [announced via postgrant information from national office to epo] |
Ref country code: GB Free format text: LAPSE BECAUSE OF NON-PAYMENT OF DUE FEES Effective date: 20230315 |
|
| PG25 | Lapsed in a contracting state [announced via postgrant information from national office to epo] |
Ref country code: IE Free format text: LAPSE BECAUSE OF NON-PAYMENT OF DUE FEES Effective date: 20230315 Ref country code: GB Free format text: LAPSE BECAUSE OF NON-PAYMENT OF DUE FEES Effective date: 20230315 Ref country code: FR Free format text: LAPSE BECAUSE OF NON-PAYMENT OF DUE FEES Effective date: 20230331 Ref country code: DE Free format text: LAPSE BECAUSE OF NON-PAYMENT OF DUE FEES Effective date: 20231003 |