EP2254277B1 - Gestion du contrôle de paramètres de voix sur IP - Google Patents
Gestion du contrôle de paramètres de voix sur IP Download PDFInfo
- Publication number
- EP2254277B1 EP2254277B1 EP09425193.1A EP09425193A EP2254277B1 EP 2254277 B1 EP2254277 B1 EP 2254277B1 EP 09425193 A EP09425193 A EP 09425193A EP 2254277 B1 EP2254277 B1 EP 2254277B1
- Authority
- EP
- European Patent Office
- Prior art keywords
- network
- network traffic
- control
- state
- traffic shaping
- Prior art date
- Legal status (The legal status is an assumption and is not a legal conclusion. Google has not performed a legal analysis and makes no representation as to the accuracy of the status listed.)
- Active
Links
- 238000007493 shaping process Methods 0.000 claims description 388
- 238000005259 measurement Methods 0.000 claims description 223
- 238000012544 monitoring process Methods 0.000 claims description 140
- 230000007704 transition Effects 0.000 claims description 75
- 238000000034 method Methods 0.000 claims description 31
- 230000008859 change Effects 0.000 claims description 10
- 230000011664 signaling Effects 0.000 claims description 8
- 238000004458 analytical method Methods 0.000 claims description 5
- 238000004590 computer program Methods 0.000 claims description 2
- 230000000977 initiatory effect Effects 0.000 claims description 2
- 238000007726 management method Methods 0.000 description 49
- 230000004044 response Effects 0.000 description 39
- 239000000523 sample Substances 0.000 description 37
- 230000006870 function Effects 0.000 description 24
- 230000015654 memory Effects 0.000 description 22
- 238000004891 communication Methods 0.000 description 19
- 238000001914 filtration Methods 0.000 description 13
- 230000002776 aggregation Effects 0.000 description 12
- 238000004220 aggregation Methods 0.000 description 12
- 230000008569 process Effects 0.000 description 9
- 238000012545 processing Methods 0.000 description 7
- 230000009471 action Effects 0.000 description 6
- 230000005540 biological transmission Effects 0.000 description 6
- 230000001276 controlling effect Effects 0.000 description 5
- 238000005516 engineering process Methods 0.000 description 4
- 239000003795 chemical substances by application Substances 0.000 description 3
- 230000007423 decrease Effects 0.000 description 3
- 230000001687 destabilization Effects 0.000 description 3
- 230000007246 mechanism Effects 0.000 description 3
- 238000003860 storage Methods 0.000 description 3
- 230000002730 additional effect Effects 0.000 description 2
- 230000008901 benefit Effects 0.000 description 2
- 230000000052 comparative effect Effects 0.000 description 2
- 238000012905 input function Methods 0.000 description 2
- 230000003993 interaction Effects 0.000 description 2
- 230000004913 activation Effects 0.000 description 1
- 230000009286 beneficial effect Effects 0.000 description 1
- 230000033228 biological regulation Effects 0.000 description 1
- 230000001419 dependent effect Effects 0.000 description 1
- 230000000694 effects Effects 0.000 description 1
- 238000011156 evaluation Methods 0.000 description 1
- 238000004519 manufacturing process Methods 0.000 description 1
- 230000001343 mnemonic effect Effects 0.000 description 1
- 238000012986 modification Methods 0.000 description 1
- 230000004048 modification Effects 0.000 description 1
- 238000010926 purge Methods 0.000 description 1
- 230000001105 regulatory effect Effects 0.000 description 1
- 238000005070 sampling Methods 0.000 description 1
- 239000000344 soap Substances 0.000 description 1
- 238000012546 transfer Methods 0.000 description 1
Images


Classifications
-
- H—ELECTRICITY
- H04—ELECTRIC COMMUNICATION TECHNIQUE
- H04L—TRANSMISSION OF DIGITAL INFORMATION, e.g. TELEGRAPHIC COMMUNICATION
- H04L47/00—Traffic control in data switching networks
- H04L47/10—Flow control; Congestion control
-
- H—ELECTRICITY
- H04—ELECTRIC COMMUNICATION TECHNIQUE
- H04L—TRANSMISSION OF DIGITAL INFORMATION, e.g. TELEGRAPHIC COMMUNICATION
- H04L41/00—Arrangements for maintenance, administration or management of data switching networks, e.g. of packet switching networks
- H04L41/14—Network analysis or design
-
- H—ELECTRICITY
- H04—ELECTRIC COMMUNICATION TECHNIQUE
- H04L—TRANSMISSION OF DIGITAL INFORMATION, e.g. TELEGRAPHIC COMMUNICATION
- H04L43/00—Arrangements for monitoring or testing data switching networks
- H04L43/12—Network monitoring probes
-
- H—ELECTRICITY
- H04—ELECTRIC COMMUNICATION TECHNIQUE
- H04L—TRANSMISSION OF DIGITAL INFORMATION, e.g. TELEGRAPHIC COMMUNICATION
- H04L47/00—Traffic control in data switching networks
- H04L47/10—Flow control; Congestion control
- H04L47/22—Traffic shaping
- H04L47/225—Determination of shaping rate, e.g. using a moving window
-
- H—ELECTRICITY
- H04—ELECTRIC COMMUNICATION TECHNIQUE
- H04L—TRANSMISSION OF DIGITAL INFORMATION, e.g. TELEGRAPHIC COMMUNICATION
- H04L47/00—Traffic control in data switching networks
- H04L47/10—Flow control; Congestion control
- H04L47/25—Flow control; Congestion control with rate being modified by the source upon detecting a change of network conditions
-
- H—ELECTRICITY
- H04—ELECTRIC COMMUNICATION TECHNIQUE
- H04L—TRANSMISSION OF DIGITAL INFORMATION, e.g. TELEGRAPHIC COMMUNICATION
- H04L47/00—Traffic control in data switching networks
- H04L47/10—Flow control; Congestion control
- H04L47/29—Flow control; Congestion control using a combination of thresholds
-
- H—ELECTRICITY
- H04—ELECTRIC COMMUNICATION TECHNIQUE
- H04L—TRANSMISSION OF DIGITAL INFORMATION, e.g. TELEGRAPHIC COMMUNICATION
- H04L41/00—Arrangements for maintenance, administration or management of data switching networks, e.g. of packet switching networks
- H04L41/06—Management of faults, events, alarms or notifications
- H04L41/0631—Management of faults, events, alarms or notifications using root cause analysis; using analysis of correlation between notifications, alarms or events based on decision criteria, e.g. hierarchy, tree or time analysis
Definitions
- This application relates to the control management of voice-over-Internet-Protocol (VoIP) parameters and, in particular, to the control of a network traffic shaping control implemented according to a previously configured network traffic shaping control state model.
- VoIP voice-over-Internet-Protocol
- a Next Generation Network focuses on the concept of one network transporting all information and services (voice, data, and all sorts of media such as video) by encapsulating these into packets.
- One of the telecommunication services provided by a telecommunication service provider using a Next Generation Network (“NGN”) may be Voice-Over-Internet-Protocol (“VoIP”) service.
- VoIP Voice-Over-Internet-Protocol
- a VoIP service employs session control protocols to control the set-up and tear-down of calls over a packet-switched network, such as an NGN.
- a VoIP service may also provide audio encoding algorithms that digitally encode speech for transmission over the packet-switched network.
- a telecommunication service provider may desire to enter the telecommunications marketplace by providing VoIP service over an NGN.
- a telecommunication service provider seeking to implementing VoIP services over an NGN faces unique challenges. Examples of these challenges include providing quality service during peak usage times and providing service when the number of concurrent VoIP calls meets or exceeds the number of concurrent attempted calls served by the telecommunication service provider.
- regulating the control over concurrent VoIP calls and concurrent attempted calls can be difficult.
- a telecommunication service provider In controlling concurrent and attempted concurrent calls, a telecommunication service provider must consider such complexities as the duration of the regulation of the concurrent and attempted concurrent VoIP calls, whether to increase or decrease the number of concurrent and attempted concurrent VoIP calls, and when a stable condition exists such that the quality of service of the concurrent and attempted concurrent VoIP calls remains stable.
- US 2008/052394 A1 discloses a system and method for diagnosing a problem on a packet network.
- Network performance information associated with data packet communications over a packet network may be collected.
- a network performance information parameter may be monitored and a determination that the network performance information parameter crosses a threshold value may be made.
- diagnostics may be initiated to determine a cause of the network performance information parameter crossing the threshold value.
- US 2007/081543 A1 discloses a Customer Premises Equipment (CPE) apparatus which includes a first communications unit and a processing unit.
- the first communications unit sends and receives message packets over a wide area network (WAN), and the processing unit controls the sending and receiving of message packets through the first communications unit.
- the sending and receiving of message packets comprises network traffic, while each packet has a packet size corresponding to an amount of WAN network utilization for each packet.
- the processing unit is adapted to measure, report, and limit the amount of WAN network utilization.
- US 2008/037552 A1 discloses methods and systems for providing necessary and sufficient quality-of-service (QoS), in a packet-based core transport network that utilizes dynamic setting of bandwidth management pipes or thresholds to obviate link congestion are disclosed.
- QoS quality-of-service
- Access Controllers which perform traffic shaping, are situated on remote sites.
- dynamic adjustment of the bandwidth management policies on affected Access Controllers is enforced.
- Various algorithms in determining the correlation between the link nearing congestion and the source or destination of traffic streams are also discussed.
- the network traffic shaping control defines the intensity of network traffic flows and can be used to control the rate at which concurrent and attempted concurrent VoIP calls are received. Other uses for the network traffic shaping control are also possible.
- the network traffic shaping control includes a network traffic shaping control state model comprising network traffic shaping control states and network traffic shaping control transitions.
- the network traffic shaping control states indicate the state of the network traffic shaping control.
- the states of the network traffic shaping control may be grouped into network traffic shaping control state sets, such as a pending state set, a running state set, a finished state set, a terminated state set, and a stopped state set. Other state sets are also possible.
- the network traffic shaping control transitions indicate events that cause the network traffic shaping control to change state. Examples of network traffic shaping control transitions include pending state transitions, running state transitions, finished state transitions, terminated state transitions, stopped state transitions, and other transitions.
- the network traffic shaping control transitions may indicate an event that causes the network traffic shaping control to change state between two state sets. For example, a network traffic shaping control transition may indicate that the network traffic shaping control changes from a first state of a first network traffic shaping control state set to a second state of a second network traffic shaping control state set.
- the network traffic shaping control transitions may indicate an event that causes the network traffic shaping control to change state within a state set. For example, a network traffic shaping control transition may indicate that the network traffic shaping control changes from a first state of a first network traffic shaping control state set to a second state of the first network shaping control state set.
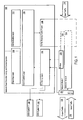
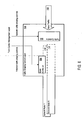
- Figure 1 shows one example of a network real-time monitoring and control system 102 for monitoring and controlling network traffic flow input and output by one or more network nodes.
- the network real-time monitoring and control system 102 includes several layers for monitoring and controlling the input and output network traffic flow.
- the network real-time monitoring and control system 102 includes a monitoring layer 104, an event control layer 106, a traffic shaping control layer 108, a reporting layer 110, and an administrative layer 112.
- the network real-time monitoring and control system 102 is in communication with one or more network nodes 114-116.
- a network node is an electronic device capable of sending, receiving, or forwarding information over a communications channel.
- the network nodes 114-116 may be any type of network node.
- one or more of the network nodes 114-116 may be data circuit-terminating equipment (DCE) such as a modem, hub, bridge or switch.
- the network nodes 114-116 may be data terminal equipment (DTE), such as a digital telephone handset, a printer or a computer.
- DCE data circuit-terminating equipment
- DTE data terminal equipment
- Other examples of network nodes 114-116 include a router, a workstation or a server.
- network nodes 114-116 include a public or private telephone exchange, a remote concentrator or a computer providing network service.
- the network nodes 114-116 are Session Initiation Protocol ("SIP") Servers, Home Subscriber Servers, SIP Application Servers, carrier-class session border controllers, such as the Acme Packet Net-Net 4250 or Acme Packet Net-Net 4500, available from Acme Packet located in Burlington, Massachusetts, United States.
- SIP Session Initiation Protocol
- Home Subscriber Servers Home Subscriber Servers
- SIP Application Servers SIP Application Servers
- carrier-class session border controllers such as the Acme Packet Net-Net 4250 or Acme Packet Net-Net 4500, available from Acme Packet located in Burlington, Massachusetts, United States.
- the network nodes 114-116 receive input network traffic flows 118 and transmit output network traffic flows 120.
- the input network traffic flows 118 and output network traffic flows 120 may include different types of network traffic.
- the input network traffic flows 118 may include signaling network traffic.
- An example of signaling network traffic includes network traffic from SIP network traffic, such as SIP REQUEST messages, SIP REGISTER messages, and other SIP messages.
- Another example of signaling network traffic is Real-Time Streaming Protocol ("RTSP") network traffic.
- RTSP Real-Time Streaming Protocol
- Signaling network traffic may also include network traffic from umbrella system specifications, such as the H.323 system specification that describes the use of several Telecommunication Standardization Sector ("ITU-T') and Internet Engineering Task Force ("IETF”) protocols. Other types of signaling network traffic are also contemplated.
- the input network traffic flows 118 may further include media treatment network traffic.
- media treatment network traffic includes the Real-Time Transport Protocol ("RTP") network traffic.
- RTP Real-Time Transport Protocol
- media treatment network traffic may also include other protocol network traffic that manages the real-time transmission of multimedia data over unicast or multicast network services, a fax relay standard, such as T.38, or other protocol network traffic.
- provisioning network traffic refers to network traffic that includes messages directed to the request for the provisioning of a telecommunication.
- provisioning network traffic may also include network traffic that is related to the first activation of a service for a given user.
- Other types of provisioning network traffic are also contemplated.
- the output network traffic flows 120 may include network traffic output by one or more of the network nodes 114-116.
- the output network traffic flows 120 may include responses to the messages of the input network traffic flows 118.
- the output network traffic flows 120 include responses to SIP network traffic.
- Responses to SIP network traffic include informational responses, such as TRYING responses, RINGING responses, and other informational responses; successful responses, such as OK responses, ACCEPTED responses, and other successful responses; redirection responses, such as MULTIPLE CHOICES responses, MOVED PERMANENTLY responses, and other redirection responses; and, other types of SIP network traffic responses.
- the output network traffic flows 120 may also include responses to media treatment network traffic, provisioning network traffic, and other types of network traffic.
- the input network traffic flows 118 and output network traffic flows 120 may also include network traffic in addition to signaling, media treatment, and provisioning network traffic flows.
- the input network traffic flows 118 may include Address Resolution Protocol ("ARP") network traffic, Domain Name System (“DNS”) Protocol network traffic, Transmission Control Protocol (“TCP”) network traffic, Hyper Text Transfer Protocol (“HTTP”) network traffic, and other types of network traffic.
- the output network traffic flows 120 may include responses to the aforementioned network traffic.
- the monitoring layer 104 monitors the input network traffic flows 118 and output network traffic flows 120 of the network nodes 114-116.
- the network real-time monitoring and control system 102 can identify when one or more of the network nodes 114-116 begins to destabilize or reach an instability status. For example, during an increase in SIP input network traffic, the network nodes 114-116 may be unable to satisfy all the SIP input network traffic flows 118. In these situations, the network nodes 114-116 may destabilize, and the quality of service provided to the SIP input network traffic may suffer.
- the real-time monitoring and control system 102 may also prevent the destabilization of the network nodes 114-116 through the monitoring of the output network traffic flows 120.
- the network real-time monitoring and control system 102 can identify when one or more of the network nodes 114-116 begins to destabilize or reach an instability status. For example, during an increase in SIP output network traffic, an increase in response output network traffic, or an increase in output network traffic, the network nodes 114-116 may be unable to maintain the level of output required to satisfy all of the output network traffic flows 120.
- the network nodes 114-116 may destabilize, and the quality of service transmitted by the network nodes 114-116 may suffer. Furthermore, because the amount of outgoing network traffic may correlate to the amount of incoming network traffic, there is a high probability that the incoming network traffic has caused the increase in outgoing network traffic. Hence, by monitoring the output network traffic flows 120, the network real-time monitoring and control system 102 can control the amount of incoming input network traffic and prevent the destabilization of the network nodes 114-116.
- the monitoring layer 104 may establish one or more network traffic flow identifiers that identify the network traffic flows 118-120.
- the network traffic flow identifiers may be stored in the monitoring layer 104 or in another layer of the network real-time monitoring and control system 102, such as the event control layer 106.
- the real-time network and control system 102 may communicate with one or more probes 122 via the monitoring layer 104 to monitor the input and output network traffic flows 118-120.
- a network traffic probe 122 is a network appliance that analyzes the network traffic flows to obtain a network traffic indicator measurement that provides a measurement of a network traffic indicator for a network node.
- a network traffic indicator may represent a particular network traffic type received or transmitted by a network node.
- the network traffic probe 122 may obtain the network traffic indicator measurement, and then expose the network traffic indicator measurement to the network real-time monitoring and control system 102 via a communication protocol, such as the Simple Network Management Protocol ("SNMP").
- SNMP Simple Network Management Protocol
- the network traffic probe 122 is includes one or more components.
- the network traffic probe 122 may include a packet analyzer and a statistic generator.
- a packet analyzer is computer software or hardware that intercepts and logs network traffic passing over a network or part of a network.
- a software packet analyzer is Wireshark, which is available from the Wireshark Foundation located in Davis, California, United States.
- the statistic generator is computer software or hardware that generates statistics associated with the network packets analyzed by the packet analyzer. Examples of statistics generated by the statistic generator may include the number of packets analyzed, the number of packets analyzed for a particular network traffic type, or other statistic.
- the statistic generator may also be configured to monitor network traffic indicators and obtain monitored network traffic indicator measurements from the monitored network traffic indicators. Other statistic operations by the statistic generator may also be possible.
- the exposure of the network traffic indicator measurement may occur after the network traffic indicator measurement is obtained, or may occur in real-time while the network traffic probe 122 is acquiring the network traffic indicator measurement. Other timings for exposing the network traffic indicator measurement are also possible.
- a network probe exposing agent component of the network traffic probe 122 exposes the network traffic indicator measurement via a network traffic protocol.
- the network probe exposing agent component may expose the network traffic indicator measurement via a network traffic protocol, such as SNMP.
- the monitoring layer 104 may also monitor the internal operations of the network nodes 114-116 via a network node probe 124 in communication with the network nodes 114-116 and monitoring layer 104.
- the network node probe 124 may be implemented in computer hardware, software, or a combination of computer hardware and software. In one implementation, the network node probe 124 is implemented in software and includes a statistic generator and a network probe exposing agent.
- the network node probe 124 provides internal operation information of the network nodes 114-116, such as system information relating directly to the network nodes 114-116. For example, the network node probe 124 may provide such information as the number of computing cycles, the amount of free memory available to the network nodes 114-116, the amount of memory used by the network nodes 114-116, and other similar system information. By providing the system information to the monitoring layer 104, the network real-time monitoring and control system 102 can better account for the stability status of the network nodes 114-116.
- the monitoring layer 104 may also be in communication with operation support systems 128-130.
- an operation support system supports processes such as maintaining network inventory, provisioning services, configuring network components, and managing faults.
- the monitoring layer 104 may also communicate with one or more business support system that support processes such as taking orders, processing bills, and collecting payments.
- the monitoring layer 104 may communicate with the operation support systems or business support systems to send or receive information regarding node configuration, provisioning information, performance information, or other types of information.
- the network traffic indicator measurements received by the monitoring layer 104 are stored for later retrieval by an event control layer 106.
- the structure of the event control layer 106 is explained later with reference to Figure 3 , but, in summary, the event control layer 106 generates a network event identifier by comparing a retrieved network traffic indicator measurement with a network traffic indicator threshold.
- a network event identifier identifies an event. Examples of events are discussed with reference to Figure 3 .
- the event control layer 106 correlates the generated network event identifier with a network node status identifier. Correlating the generated network event identifier with the network node status identifier serves as one mechanism by which the event control layer 106 can determine the status of the network nodes 114-116. In general, correlating may including identifying the network node status identifier based on the generated network event identifier, matching the network node status identifier with the generated network event identifier, or otherwise determining the network node status identifier from the generated network event identifier.
- a network traffic shaping control includes instructions and parameters to shape a network traffic flow.
- a network traffic shaping control may control additional actions other than traffic shaping actions. Examples of parameters that define a network traffic shaping control include an Internet traffic protocol, a message type, a source address, a destination address, and a network traffic shaping control intensity that identifies the amount of allowed network traffic.
- the network traffic shaping control intensity may identify an absolute value of the maximum allowed traffic, an absolute value of the minimum allowed traffic, or other value.
- a network traffic shaping control may define additional parameters.
- the event control layer 106 communicates the network traffic shaping control request to the traffic shaping control layer 108.
- the traffic shaping control layer 108 then implements a network traffic shaping control according to the network traffic shaping control request. With the implemented network traffic shaping control, the traffic shaping control 108 then controls the shaping of the network traffic flow.
- the network real-time monitoring and control system 102 may also include layers for reporting and administrative functions.
- the network real-time monitoring and control system 102 includes a reporting layer 110 that handles the reporting functions of the network real-time monitoring and control system 102.
- the reporting layer 110 may include output and input functions to provide input and output to a user via graphical user interface, or to provide input and output to another system in communication with the network real-time monitoring and control system 102.
- the network real-time monitoring and control system 102 may include an administrative layer 112 that handles administrative functions of the network real-time monitoring and control system 102.
- the administrative layer 112 may include output and input functions to provide input and output to a user via graphical user interface, or to provide input and output to another system in communication with the network real-time monitoring and control system 102.
- the monitoring layer 104 may be implemented in hardware or software.
- the monitoring layer 104 may be implemented in the Java programming language as OpenNMS, which is an enterprise-grade network monitoring platform developed under an open source software model. OpenNMS is available from The OpenNMS Group, Inc., located in Pittsboro, North Carolina, United States.
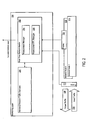
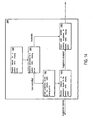
- the monitoring layer 102 includes a real-time network monitor 202 in communication with the network traffic probe 122 and the network node probe 124.
- the real-time monitor 202 monitors one or more of the traffic flows in communication with the network traffic probe 122.
- the real-time monitor 202 may monitor input traffic flows 118, output traffic flows 120, or other traffic flows.
- the monitored traffic flows may be for the same network node or different network nodes.
- the real-time network monitor 202 monitors a first and second network traffic flow for a first network traffic node.
- the real-time network monitor 202 monitors a first network traffic flow for a first network traffic node, and a second network traffic flow for a second network traffic node.
- Other examples and scenarios are also possible.
- network real-time monitor 202 monitors one or more network traffic indicators associated with a respective network traffic flow.
- the network real-time monitor 202 may monitor the network traffic indicators via the network traffic probe 122.
- examples of network traffic indicators a signaling indicators, media treatment indicators, provisioning indicators, and other types of network traffic indicators.
- the real-time network monitor 202 By monitoring the network traffic indicators, the real-time network monitor 202 obtains a monitored network traffic indicator measurement that provides a measurement of the network traffic indicator for a network node.
- the real-time network monitor 202 may monitor network traffic input indicators, network traffic output indicators, or a combination of network traffic input and network traffic output indicators.
- the input network traffic flow 118 monitored by the real-time network monitor 202 is SIP network traffic.
- network traffic input indicators associated with SIP network traffic include the throughput of SIP INVITE messages incoming to the network probes 114-116, the throughput of SIP REGISTER messages incoming to the network probes 114-116, and the number of re-transmitted SIP REGISTER messages.
- a monitored network traffic input indicator measurement such as the measurement of the throughput of SIP INVITE messages incoming to the network probes 114-116, may be used to calculate a network performance measurement.
- Table 1 describes exemplary network traffic input indicators. Table 1 Network Traffic Input Indicator Type Description Throughput The number of SIP messages.
- Throughput The number of SIP REGISTER messages. Throughput The number of SIP INVITE messages. Throughput The number of re-transmitted messages. Throughput The number of re-transmitted SIP REGISTER messages. Throughput The number of re-transmitted SIP INVITE messages. Syntax and Semantic Percentage of the number of malformed requests.
- the real-time network monitor 202 may monitor network traffic output indicators associated with one or more output network traffic flows 120. Using SIP network traffic as an example, the real-time network monitor 202 may monitor such network traffic output indicators as the response time to answer SIP INVITE messages output from a network node, the response time to answer SIP REGISTER messages output from a network node, or another network traffic output indicators. Table 2 below describes exemplary network traffic output indicators. Table 2 Network Traffic Output Indicator Type Description Throughput The number of SIP messages. Throughput The number of SIP REGISTER messages. Throughput The number of SIP INVITE messages. Syntax and Semantic Percentage of the number of messages that are redirection or failure responses. Syntax and Semantic Percentage of the number of malformed requests. Response Time The maximum response time at the 95th percentile for SIP messages. Transmission Quality The mean packet loss for an established SIP session. Transmission Quality The mean packet delay for an established SIP session.
- the real-time network monitor 202 may monitor for incoming messages having a specific payload. For example, to determine the response time for SIP INVITE messages output from a network node, the real-time network monitor 202 may monitor for response messages having a specific SIP status code, such as an SIP status code of 180 ("Ringing"), 183 ("Session Progress"), 200 ("OK”), or other SIP status code. Alternatively, the real-time network monitor 202 may monitor for response messages having a range of SIP status codes, such as SIP status codes in the range of 300-699.
- the real-time network monitor 202 may monitor for response messages having a specific SIP status code, or response messages having an SIP status code from a range of SIP status codes, such as SIP status codes in the range of 200-699.
- the real-time network monitor 202 can keep the real-time monitoring and control system 102 informed as to whether the network nodes 114-116 are meeting the network needs of the network traffic flows 118-120. Moreover, the real-time monitoring and control system 102 can use the network traffic indicator measurements to determine the stability status of the network nodes 114-116. Fluctuations in network traffic indicator measurements may indicate that one or more network nodes 114-116 are experiencing instability, an increase or decrease in network traffic, or that one of the network nodes 114-116 is about to suffer an outage.
- the real-time network monitor 202 may also monitor network node operational indicators via network node probe 124. As monitoring the network traffic flows 118-120 may not provide complete information relating to the stability status of the network nodes 114-116, the monitored network node operational indicators provide information relating directly to the network nodes 114-116. Examples of monitored network node operational indicators include the idle CPU quantity, the quantity of CPU used by the kernel of the network node, the quantity of CPU used by user processes of the network node, the quantity of CPU used by processes waiting for input/output resources, the quantity of CPU used to verify interrupts, the total quantity of memory installed, the total quantity of available memory, the number of requests on a database, or other operational indicators.
- the operational indicator measurements of the operational indicators may be used to calculate additional measurements, such as time-derivative measurements. Furthermore, monitoring the network node operational indicators provides an indication as to the stability status of the network node that may not be apparent from monitoring the network traffic indicators.
- Table 3 below describes exemplary network node operational indicators. Table 3 Network Node Operational Indicator Type Description Basic Software The quantity of idle CPU usage. Basic Software The quantity of CPU usage used by kernel. Basic Software The quantity of CPU usage used by user processes. Basic Software The quantity of CPU usage used by processes waiting for input/output resources. Basic Software The quantity of CPU usage used to verify interrupts. Basic Software The quantity of available memory. Basic Software The quantity of memory in use. Basic Software The number of open sockets. Middleware The number of active threads. Middleware The number of running processes. Middleware The number of errors. Middleware The number of exceptions. Application The number of active network nodes on the network. Application The number of inactive network nodes on the network. Application The total number of network nodes on the network.
- the real-time network monitor 202 includes several components to facilitate the monitoring of the network traffic indicators and network node operational indicators.
- the real-time network monitor 202 includes a measurement manager 204, a measurement ETL manager 206, and a monitored network traffic database 208.
- the measurement manager 204 may manage the measurement and monitoring of the network traffic indicators and the network node operational indicators.
- the measurement manager 204 may also handle communications and message passing with the event control layer 106.
- the measurement ETL manager 206 manages the manipulation of the network traffic indicator measurements and the network node operational indicator measurements.
- the measurement ETL manager 206 may receive the indicator measurements from the network traffic probe 122 and the network node probe 124, transform the indicator measurements to fit within an expected format or other construct, and populate the monitored network traffic database 208 with the indicator measurements. Furthermore, the measurement ETL manager 206 may operate in conjunction with the measurement manager 204 to extract the indicator measurements from the monitored network traffic database 208 and communicate the indicator measurements to the event control layer 106.
- the components of the monitoring layer 104 may be implemented in software, hardware, or a combination of hardware and software.
- the components of the real-time network monitor 202 such as the measurement manager 204 and measurement ETL manager 206, may be implemented in software.
- the measurement manager 204 and the measurement ETL manager 206 are implemented as computer software daemons, including a poller daemon, a discovery daemon, a capture service daemon, and a collect daemon.
- a poller daemon including a poller daemon, a discovery daemon, a capture service daemon, and a collect daemon.
- a collect daemon including a collect daemon, or additional daemons are also possible.
- Each of the real-time network monitor daemons may be configured to perform one or more specific operations.
- the poller daemon may be configured to verify the connection with the network nodes 114-116 using one or more network traffic protocols, such as Internet Control Message Protocol ("ICMP"), SNMP, or other network traffic protocols.
- the discovery daemon may be configured to discover new network nodes that have been added to the network.
- the capture service daemon may be configured to discover services exposed by the network nodes 114-116, discover services exposed by the probes 122-124, or other service discovery operations.
- the capture service daemon may be configured to discover the exposed services via a network traffic protocol, such as SNMP or other protocol.
- the collect daemon may be configured to monitor the network traffic indicators and obtain network traffic indicator measurements.
- the collect daemon may also be configured to monitor network node operational indicators and obtain network node operational indicator measurements.
- the monitoring layer 104 reduces the time it takes for the real-time network monitor 202 to obtain the network traffic indicator measurements and network node operational indicator measurements.
- the real-time network monitor 202 stores the monitored network traffic indicator measurements and network node operational indicator measurements in a monitored network traffic database 208 in communication with the real-time network monitor 202.
- the measurement ETL manager 206 obtains the indicator measurements from the network traffic probes 122 and network node probes 124, and stores the indicator measurements in the monitored network traffic database 208.
- the real-time network monitor 202 may be configured to store the indicator measurements in the monitored network traffic database 208 at predefined time intervals, such as every 5 milliseconds, every 10 seconds, or any other predefined time interval. By storing the indicator measurements at predefined time intervals, the real-time network monitor 202 ensures that the indicator measurements stored in the monitored network traffic database 208 are current indicator measurements. By having access to current indicator measurements, the network real-time monitoring and control system 102 can respond more readily to changes in the stability status of one or more network nodes 114-116.
- the monitored network traffic database 208 may be implemented as a round-robin database.
- a round-robin database describes a database in which time-series data is stored. Examples of time-series data includes data such as network bandwidth, temperatures, free CPU capacity, available program memory, and other data.
- a round-robin database may be configured to store the data in such a way that system storage footprint remains constant over time.
- a database configured as a round-robin database avoids resource expensive purge jobs and reduces complexity.
- An example of an available round-robin database is RRDtool, which is available from Oetiker+Partner AG, located in Olten, Switzerland.
- alternative databases may be used as the monitored network traffic database 208, such as a relational database, a hierarchical database, network-model database, or other type of database.
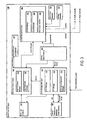
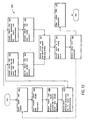
- Figure 3 shows one example of the event control layer 106 of the network real-time monitoring and control system 102 shown in Figure 1 .
- the event control layer 106 may be implemented in computer hardware or software.
- One example of a computer software implementation of the event control layer 106 is OpenNMS, which is available from The OpenNMS Group, Inc., located in Pittsboro, North Carolina, United States.
- the event control layer 106 may include several components and databases.
- the components of the event control layer 106 include an event management layer 302, a real-time status analyzer 304, and a control management layer 306.
- the databases of the event control layer 106 include a network performance and threshold profile database 308, an event log database 310, a control request log database, 312, a control log database 314, a scoring database 316, and a service model database 318. Other databases and components are also possible.
- the databases 308-318 may be implemented as individual databases, as tables of a larger database, or in any other configuration of databases or as a single database.
- the databases 308-318 are implemented as a single object-relational database management system.
- An example of an object-relational database management system is PostgreSQL, which is available from the PostgreSQL Foundation located in Arlington, Virginia, United States.
- PostgreSQL is available from the PostgreSQL Foundation located in Arlington, Virginia, United States.
- other implementations of the databases 308-318 are also possible.
- the event manager layer 302 is configured to generate a network event identifier that identifies an event.
- the event manager layer 302 is also configured to manage network event identifiers generated by other layers of the real-time monitoring and control system 102.
- an event may indicate an incidence or occurrence that has happened.
- events may relate to changes in the network traffic flows 118-120, changes in the network traffic indicators, changes in network nodes, 114-116, or other changes.
- the event manager layer 302 may communicate the generated network event identifier to one or more components of the network real-time monitoring and control system 102 to provide status information or status updates.
- the components of the network real-time monitoring and control system 102 may react to the network event identifiers generated by the event manager layer 302.
- a network event identifier may be used to initiate a network traffic shaping control, or, as discussed with reference to Figures 8-10 , to change the state of a network traffic shaping control.
- the event manager layer 302 includes an event manager 320, a Network Performance Indicator ("NPI") manager 322, and a filtering and aggregation manager 324 to facilitate the generation of network event identifiers.
- the components of the event manager layer 302 may be configured for specific operations.
- the filtering and aggregation manager 324 may be configured to receive and filter network indicator measurements from the monitoring layer 104. Filtering the network indicator measurements from the monitoring layer 104 may ensure that the event manager 320 or NPI manager 322 receives relevant network traffic indicator measurements for generating network event identifiers, and that the event manager layer 302 is not overloaded with extraneous network traffic indicator measurements.
- the filtering and aggregation manager 324 filters predetermined network traffic indicator measurements.
- the filtering and aggregation manager 324 may be configured to filter network traffic indicator measurements associated with specific network traffic, such as network traffic indicator measurements for ARP network traffic.
- the filtering and aggregation manager 324 may be configured to filter network traffic indicator measurements associated with a specific network traffic indicator, such as SIP REGISTER messages for an SIP network traffic flow.
- the filtering and aggregation manager 324 may further be configured to filter network traffic indicator measurements associated with a network traffic flow or associated with a network node.
- the filtering and aggregation manager 324 may also be configured to receive any and all types of network traffic indicator measurements communicated by the monitoring layer 304.
- the NPI manager 322 is configured to generate network performance measurements based on network performance equations and the network indicator measurements received from the monitoring layer 104.
- a network performance measurement refers to a value that is derived from a network indicator measurement.
- a network performance measurement may be a time derivative measurement for a network indicator measurement.
- the network performance measurement may indicate a rate of change between network indicator measurements.
- the NPI manager 322 is implemented as a computer software daemon, and generates the network performance measurements by receiving the network indicator measurements from the monitored network traffic database 208 and applying the network indicator measurements to a network performance equation retrieved from the network performance and threshold profile database 308.
- the filtering and aggregation manager 324 retrieves network indicator measurements from the monitored network traffic database 208 and communicates the retrieved network indicator measurements to the NPI manager 322. The NPI manager 322 may then execute the network performance equation to obtain a network performance measurement.
- the NPI manager 322 may be configured to generate one or more types of network performance measurements. For example, the NPI manager 322 may generate network input performance measurements, network output performance measurements, network node performance measurements, or other network performance measurements. The NPI manger 322 may then store the generated network performance indicator in one or more of the databases 308-318. Alternatively, the NPI manager 322 may store the generate network performance indicator in a layer different than the event control layer 106. For example, in one implementation, the NPI manager 322 stores the network performance measurement in the monitored network traffic database 208 of the monitoring layer 104. In this implementation, the NPI manager 322 stores the network performance measurement in the monitored network traffic database 208 to ensure that the network performance measurement is the most current network performance measurement available to the network real-time monitoring and control system 102. The stored network performance measurement may then be retrievable by any of the components in the monitoring layer 104, the event control layer 106, traffic shaping control layer 108, or other layer.
- the NPI manager 322 may generate network performance measurements that correspond to the received network indicator measurements. For example, the NPI manager 322 may generate network input performance measurements, network output performance measurements, network node performance measurements, or other network performance measurements. Network input performance measurements may be based on network traffic input indicator measurements. Exemplary network input performance measurements include a time derivative measurement of throughput of SIP INVITE messages incoming to a network node and a time derivative measurement of throughput of SIP REGISTER messages incoming to a network node. Similarly, network output performance measurements may be based on network traffic output indicator measurements.
- Exemplary network output performance measurements include a time derivative measurement of response time to answer SIP INVITE messages output from a network node and a time derivative measurement of response time to answer SIP REGISTER messages output from a network node.
- network node performance measurements may be based on network node operational indicator measurements.
- Exemplary network node performance measurements include a CPU percentage usage amount that indicates the percentage of used CPU normalized for the number of processors in the network real-time monitoring and control system 102 and a memory percentage usage amount that indicates the percentage of memory used by the network real-time monitoring and control system 102.
- a network input performance measurement, a network output performance measurement, or a network node performance measurement may be based on any combination of network traffic input indicator measurements, network traffic output indicator measurements, and network node operational indicator measurements.
- the NPI manager 322 may generate the network performance measurements according to a predefined time interval.
- the predefined time interval for generating the network performance measurement may be the same as, or different than, the predefined time interval for generating the network indicator measurements.
- the predefined time interval for generating network performance measurements may be differentiated according to individual network performance measurements or network performance measurement type.
- the network performance measurements may be differentiated according to a differentiating schema.
- the network performance measurements may be differentiated according to network traffic flow, network node, or other differentiating schema.
- the NPI manager 322 may retrieve one or more network performance equations from the network performance and threshold profile database 308.
- Table 4 shows an exemplary network performance and threshold profile database schema for defining network performance equations in the network performance and threshold profile database 308.
- Table 4 Column Name Description ID_INDICATOR A unique indicator of the network performance indicator.
- NAME A mnemonic name of the network performance indicator.
- DESCRIPTION A brief description of the network performance measurement defined by the network performance equation.
- ALAS_OPENNMS An identifier used to reference the network performance equation.
- TYPOLOGY Describes the classification of the network performance measurement defined by the network performance equation. FUNCTION The network performance equation that defines the network performance measurement.
- NETWORK_NODE A unique identifier of the network node the to which the network performance indicator refers.
- KPI_NODE An identifier that identifiers the network node where the network performance indicator is measured.
- ID_ANAG_INDICATORS A reference to the type of indicators for the network performance indicator.
- ENABLED An identifier that indicates whether the network performance indicator is active and calculated from the system.
- a network performance and threshold profile database schema provides a flexible and convenient template for defining complex network performance equations that define network performance measurements.
- Table 5 shows one example of a network performance equation record that defines a network performance equation for determining a CPU percentage usage amount network node performance measurement.
- Table 5 Parameter Name Description ID_INDICATOR 15 NAME SS_MIK05 DESCRIPTION Percentage Used CPU ALIAS_OPENNMS percentageUsedCPU TYPOLOGY NPI FUNCTION 100 - A29 / round ((A29 + A36 + A43 + A50 + A57 + A64) / 100, 3) NETWORK_NODE 20 KPI_NODE 20 ID_ANAG_INDICATORS 4 ENABLED TRUE
- Table 6 shows one example of a network performance equation record that defines a network performance equation for determining Table 6 Parameter Name Description ID_INDICATOR 22 NAME SS_MIK012 DESCRIPTION Percentage of memory used by SIP SERVER ALIAS_OPENNMS percentUsedMem TYPOLOGY NPI FUNCTION 100 * (1 - (A73 / A72)) NETWORK_NODE 20 KPI_NODE 37 ID_ANAG_INDICATORS 5 ENABLED TRUE
- the NPI manager 322 evaluates the network performance equation stored in the function field of the network performance record to generate the network performance measurement.
- the values in the function field of Tables 5-6 refer to other network indicator measurements and network performance measurements.
- Table 7 provides examples of the references referred by the function field of the network performance equation.
- Table 7 Function Field Parameter Variable Name Description A26 ssCPURawldle Number of CPU cycles while idle. A36 ssCPURawKernel Number of CPU cycles used for the kernel. A43 ssCPURawSystem Number of CPU cycles used for the system. A50 ssCPURawUser Number of CPU cycles used to execute user program. A57 ssCPURawWait Number of CPU cycles used while waiting for input/output resources. A64 ssCPURawNice Number of CPU cycles used due to an interrupt. A72 N/A Amount of available physical memory on a server in the sampling moment. A73 N/A Amount of physical memory in server.
- the event manager 320 uses the network performance measurements and network indicator measurements to generate network event identifiers.
- the event manager 320 is also configured to handle the management of network event identifiers generated by other components of the network real-time monitoring and control system 102.
- the event manager 320 provides a centralized component for handling network event identifiers that may be generated by multiple components.
- the event manager 320 may be configured to communicate network event identifiers generated by a first component to a second component, where the second component relies on the network event identifier to perform a task or operation.
- added components may be configured to communicate with the event manager 320 or the event control layer 106 directly rather than having to be configured with every component in the network real-time monitoring and control system 102.
- the event manager 320 configured to manage and log generated network event identifiers
- the other components of the network real-time monitoring and control system 102 can be configured to perform operations without the complex overhead of being configured to manage network event identifiers or unknown future components that may be added later to the network real-time monitoring and control system 102.
- the event manager 320 may be implemented as computer hardware, computer software, or both. In one implementation, the event manager 320 is implemented as computer software daemon written in the Java computer programming language.
- the event manager 320 may be configured to listen for data and notifications on a predefined TCP port and, in response to the received data and notifications from the predefined TCP port, generate network event identifiers that are communicated to one or more components of the event control layer 106. For example, the event manager 320 may communicate network event identifiers to the real-time status analyzer 304. As another example, the event manager 320 may communicate the network event identifiers to an event log database 310, which may then be accessed by other components of the event control layer 106.
- the network indicator measurements and network performance measurements of the monitoring layer 104 are communicated to the event manager 320.
- the event manager 320 retrieves the network indicator measurements and network performance measurements from the monitored network traffic database 208.
- the filtering and aggregation manager 324 retrieves the network indicator measurements and network performance measurements from the monitored network traffic database 208, and communicates the network indicator measurements and network performance measurements to the event manager 320.
- the filtering and aggregation manager 324 may further filter the retrieved network indicator measurements and network performance measurements to communicate a predefined type of network indicator measurement and/or network performance measurement to the event manager 320.
- the event manager 320 may also access other databases to retrieve the network performance measurements and network indicator measurements, such as any of the databases 308-318.
- the network performance and threshold profile database 308 may store a network performance threshold profile and a network indicator threshold profile.
- the network performance threshold profile may also be configured by a user or other system, such as through administrative layer 112.
- the network performance threshold profile may define network performance thresholds for one or more network performance measurements.
- the network performance threshold profile may define network input performance thresholds for network input performance measurements, network output performance thresholds for network output performance measurements, and network node performance thresholds for network node performance measurements. Other network performance thresholds are also possible.
- the network indicator threshold profile may define network indicator thresholds for one or more network indicator measurements.
- the network indicator threshold profile may define network traffic input indicator thresholds for network traffic input indicator measurements, network traffic output indicator thresholds for network traffic output indicator measurements, and network node operational indicator thresholds for network node operational indicator measurements.
- Other types and combinations of network performance thresholds and network indicator thresholds are also possible.
- one or more network performance threshold profiles and one or more network indicator threshold profiles are also possible that define the network performance thresholds and network indicator thresholds, respectively.
- the network performance threshold profile and the network indicator threshold profile may distinguish between different types of thresholds.
- the profiles may define a warning threshold and a critical threshold.
- the warning threshold may be less than the critical threshold.
- the warning threshold may be a threshold where one or more network nodes are approaching an instability status.
- a critical threshold may be a threshold where one or more network nodes have reached an instability status.
- the network real-time monitoring and control system 102 can attempt to prevent one or more network nodes 114-116 from reaching an instability status if a warning threshold has been reached.
- the warning thresholds may serve as a warning to the network real-time monitoring and control system 102 that one or more network nodes are about to become unstable.
- the event manager 320 compares the network performance measurements and network indicator measurements with the network performance thresholds and network indicator thresholds, respectively, to generate network event identifiers.
- Network event identifiers may be implemented in a computer markup language, such as the Extensible Markup Language ("XML").
- XML Extensible Markup Language
- other computer languages that use a set of annotations to text that give instructions regarding the structure of text or how it is to be displayed may also be used.
- the event manager 320 may be configured to generate a network event identifier based on a comparison of the network performance measurement with a network performance threshold, such as when the network performance measurement exceeds or falls below the network performance threshold. Similarly, the event manager 320 may be configured to generate a network event identifier based on a comparison of a network indicator measurement with a network indicator threshold, such as when a network indicator measurement exceeds or falls below a network indicator threshold. As one example, the event manager 320 may generate a network event identifier when a network traffic input indicator measurement, such as the number of SIP REGISTER messages received by a network node, exceeds a network traffic input indicator threshold, such as a total number of SIP REGISTER messages that can be received by the network node.
- a network traffic input indicator measurement such as the number of SIP REGISTER messages received by a network node
- a network traffic input indicator threshold such as a total number of SIP REGISTER messages that can be received by the network node.
- the event manager 320 may generate a network event identifier when a network input performance measurement, such as the time derivative measurement of SIP REGISTER messages received by a network node, exceeds a network input performance threshold, such as the maximum rate at which the network node can receive SIP REGISTER messages.
- a network input performance measurement such as the time derivative measurement of SIP REGISTER messages received by a network node
- a network input performance threshold such as the maximum rate at which the network node can receive SIP REGISTER messages.
- the event manager 320 may generate a network event identifier according to a combination of comparative measurements of network indicator thresholds and/or network performance thresholds. For example, the event manger 320 may generate a network event identifier when a first network input performance threshold is exceeded and a second network input performance threshold is exceeded. As another example, the event manager 320 may generate a network event identifier when a first network input performance threshold is exceeded and a first network node operational indicator threshold is exceeded. Other comparative combinations are also possible.
- the event manager 302 may be configured to generate any type of network event identifier.
- Table 8 below lists exemplary network event identifiers accompanied by corresponding descriptions.
- Table 8 Network event identifier Description
- EVENT_FINE_CONTR_OUT_SONDA Identifies an event for automatically terminating a network traffic shaping control dues to a network probe outage.
- EVENT_FINE_CONTR_OUT_SONDA_KO Identifies an event where the control logic associated with the network event identifier EVENT_FINE_CONTR_OUT_SONDA has raised an error.
- EVENT_FINE_CONTR_OUT_SONDA_OK Identifies an event where the control logic associated with the network event identifier EVENT_FINE_CONTR_OUT_SONDA has correctly executed.
- EVENT_FINE_CONTR_RTC Identifies an event where the network traffic shaping control should be terminated automatically.
- EVENT_FINE_CONTR_RTC_KO Identifies an event where the control logic associated with the network event identifier EVENT_FINE_CONTR_RTC has raised an error.
- EVENT_FINE_CONTR_RTC_OK Identifies an event where the control logic associated to the network event identifier EVENT_FINE_CONTR_RTC has correctly executed.
- EVENT_FINE_CONTR_RTC_OUT_SONDA Identifies an event where a network traffic shaping control should be automatically deleted due to an outage of a network probe.
- EVENT_NODE_UP Identifies an event where a network node is active and reachable.
- EVENT_NODE_UP_KO Identifies an event where the control logic associated with the network event identifier EVENT_NODE_UP has raised an error.
- EVENT_NODE_UP_OK Identifies an event where the control logic associated with the network event identifier EVENT_NODE_UP correctly executed.
- EVENT_NOTIF_OUT_ISTANZA_SERVER Identifies an event for an outage of a server instance that may be notified.
- EVENT_NOTIF_OUT_SONDA Identifies an event for an outage of the probes for notification.
- EVENT_NOTIF_THR Identifies an event for an exceeding/rearmed threshold for a particular indicator/NPI that may be notified.
- EVENT_SUGG_CONTR Identifies an event where a network traffic shaping control has been suggested.
- EVENT_THR Identifies an event for an exceeding/rearmed threshold for a particular indicator/NPI
- EVENT_USR ACC_CONTR Identifies an event where a network traffic shaping control has been accepted.
- EVENT_USR_ACC_CONTR_KO Identifies an event where the control logic with the network event identifier EVENT_USR_ACC_CONTR has raised an error.
- EVENT_USR_ACC_CONTR_OK Identifies an event where the control logic associated with the network event identifier EVENT_USR_ACC_CONTR has been correctly executed.
- EVENT_USR_ANN_CONTR Identifies an event where a network traffic shaping control has been canceled.
- EVENT_USR_TERM_CONTR Identifies an event where a network traffic shaping control has been terminated.
- EVENT_USR_TERM_CONTR_OK Identifies an event where the control logic associated with the network event identifier EVENT_USR_TERM_CONTR has been correctly executed.
- the control logic referred to by Table 8 may be implemented by one or more of the components 302-306 of the event control layer 106.
- the control logic may be implemented by the real-time status analyzer 304 and control management layer 306.
- the control logic may be implemented by the filtering and aggregation manager 324, the control selector 330, and the control manager 332.
- Alternative implementations of the control logic are also possible.
- the event manager 320 may be configured to manage network event identifiers generated from other components of the real-time monitoring and control system 102, such as from the monitoring layer 104.
- the event manager 302 may receive a network event identifier from the monitoring layer 104 regarding the status of a network node.
- the network event identifier may indicate that the network node is active and reachable.
- the event manager 302 may receive an EVENT_NODE_UP network event identifier.
- the event manager 302 may receive a network event identifier regarding the status of a network probe, such as the network traffic probe 122 or the network node probe 124.
- the network event identifier may indicate that the network probe has failed or has suffered an outage. Where the network probe has failed or has suffered an outage, the event manager 302 may receive an EVENT_FINE_CONTR_OUT_SONDA network event identifier. Other types of network event identifiers are also possible.
- the event manager 302 may communicate the generated network event identifiers to the real-time status analyzer 304.
- the real-time status analyzer 304 handles the generation of requests for a network traffic shaping control.
- the real-time status analyzer 304 may be implemented in computer hardware or computer software.
- real-time status analyzer 304 is implemented as an event receiver queue, a computer software thread containing a network event identifier hash table, and a main control thread.
- the event receiver queue is configured to receive network event identifiers from the event manager 320 and distribute the network event identifiers to the real-time status manager 324 and the real-time event correlator 326.
- the event receiver queue may be implemented as a Java Message Service ("JMS") queue deployed in a JBoss application server.
- JMS Java Message Service
- the JBoss application server is available from JBoss, which is a division of Red Hat, and located in Atlanta, Georgia, United States.
- the computer software thread containing the network event identifier hash table contains hashes of all the events associated with a network node.
- the filtering and aggregation manager 324 and the real-time event correlator 326 may store network state identifiers in the hash table, and when a change in state is requested, the main control thread communicates requests for network traffic shaping controls to the control management layer 306.
- the real-time status manager 324 is the main control thread.
- the real-time status analyzer 304 includes a real-time event manager 324 and the real-time event correlator 326.
- the real-time event correlator 326 correlates the network event identifier with a network node status identifier that identifies the status of the network node associated with the network event identifier.
- a network event identifier may not specify the stability status of a network node
- the configuration of the real-time event correlator 326 facilitates the identification of an instability status given a network event identifier.
- the real-time event correlator 326 may be configured to correlate multiple network event identifiers with a single network node status identifier.
- the real-time event correlator 326 simplifies the task of identifying an instability status.
- the real-time event correlator 326 interacts with the service model database 318 to correlate network event identifiers with a network node.
- the real-time correlator may be implemented as a messenger queue, such as a JMS queue, deployed on a JBoss application server and as a software thread that contains the status of a network node.
- the real-time event correlator 326 may include a business rules engine or other software that executes rules to make decisions.
- the real-time event correlator 326 may further include facts and assertions for executing the rules, and the facts and assertions may comprise network event identifiers, network indicator measurements, network performance measurements, and other facts and assertions.
- the real-time event correlator 326 may receive one or more network event identifiers from one or more layers 104-112, such as the monitoring layer 104 or the event control layer 106, using the JMS queue, and then interacts with the service model database 318 based on the received network event identifier.
- the real-time event correlator 326 may also be implemented as part of a JMS queue controller and a Java class logic.
- the real-time status manager 324 generates a request for a network traffic shaping control based on the correlation of the network event identifier with the network node status identifier.
- the real-time status analyzer 324 may also communicate one or more network event identifiers to the event manager 302 that identifies the actions taken by the real-time status analyzer 324.
- the real-time event correlator 326 may correlate network event identifiers with a network node status identifier according to a predefined node status rule set.
- the real-time event correlator 326 receives network event identifiers and, based on the status of one or more indicators for a network node, identifies a potential beginning of network node instability.
- the real-time event correlator 326 may refer to the service model database 318 to correlate the network event identifier with the network node and with the real-time status manager 324.
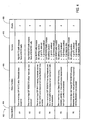
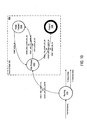
- Figure 4 shows an example of a node status rule set 402.
- the network node status rule set 402 may be implemented in any number of computer hardware or computer software technologies.
- the network node status rule set 402 is implemented in Microsoft Excel, which is available from the Microsoft Corporation, located in Redmond, Washington, United States.
- the node status rule set 402 may include node status rule components such as one or more of a network node status identifier 404, a network node status condition 406, a network node status condition priority 408, and a network node status scenario 410.
- node status rule components such as one or more of a network node status identifier 404, a network node status condition 406, a network node status condition priority 408, and a network node status scenario 410.
- Alternative node status rule components are also possible.
- the network node status identifier 404 identifies an instability status of one or more of the network nodes 114-116.
- the node status rule set 402 includes six network node status identifiers 404 labeled as R1, R2, R3, R4, R5, and R6 to identify status of a network node.
- the node status rule set 402 may be used to identify an instability status of any of the network nodes 114-116.
- a single node status rule set 402 may associated with all of the network nodes 114-116.
- each network node 114-116 may be associated with its own node status rule set 402.
- the node status rule set 402 may include alternative network node status identifiers than those shown in Figure 4 .
- Each network node status identifiers 404 is associated with a network node status condition 406.
- a network node status condition 406 may be one or more conditions that are satisfied according to one or more network event identifiers. As a network node status condition 406 may be satisfied based on one or more network event identifiers, the network node status condition 406 provides a streamlined mechanism for evaluating complex and disparate network event identifiers.
- the real-time event correlator 326 uses a network event identifier to evaluate and/or satisfy the network node status conditions 406.
- a network node status condition 406 is satisfied, the associated network node status identifier 404 is identified.
- the network event identifier identifies that an input indicator threshold, such as an input SIP INVITE critical threshold, has been exceeded, the real-time event correlator 326 identifies that the network node status condition 406 associated with the node status identifier R1 has been satisfied.
- the real-time event correlator 326 correlates the network event identifier associated with an exceeded input SIP INVITE critical threshold with the network instability status identifier R1.
- the real-time event correlator 326 identifies that the network node status condition 406 associated with the node status identifier R4 has been satisfied. Hence, in this second example, the real-time event correlator 326 correlates network event identifiers with the network instability status identifier R4.
- the node status rule set 402 also includes a network node status condition priority 408.
- the network node status condition priority 408 indicates a priority level associated with a corresponding network node status condition 406.
- the network node status condition priority 408 may be different for each network node status conditions 406. Alternatively, two or more network node status conditions 406 may have the same network node status condition priority 408.
- the real-time event correlator 326 may be configured to evaluate the network node status condition 406 according to its associated priority level identified by the network node status condition priority 408. For example, as shown in Figure 4 , the real-time event correlator 326 may evaluate the R2 network node status condition, which as the highest level priority, first; the R1 network node status condition second;, the R6 network node status condition third; the R5 network node status condition fifth; and the R3 network node status condition, which has the lowest level priority, sixth. Because the network node status condition priorities 408 identify a priority level of the network node status conditions 406, the network node status condition priorities 408 establish a priority order in which network traffic shaping controls are applied to network traffic flows and/or network nodes.
- the network node status priority 408 assists in the resolution of conflicts among simultaneously satisfied network node status conditions 408.
- the network node status condition priority 408 facilitates the evaluation of a network node status condition that may be considered more severe than other network node status conditions. Accordingly, the network real-time monitoring and control system 102 can take quicker action to implement a network traffic shaping control where a network node status condition with a high priority is satisfied by generated network node network event identifiers.
- the node status rule set 402 may also include a node status scenario 410.
- the node status scenario 410 describes the system situation under which the network node status condition 406 has been satisfied.
- the node status scenario 410 may provide system information, network node information, network traffic flow information, or other information.
- the node status scenario 410 may be displayed on a graphical user interface or other output interface, such as a printer or audio speaker.
- the real-time event correlator 326 may communicate the R2 node status scenario 410 to the reporting layer 110 for outputting to a display or other system or device.
- the real-time event correlator 326 may communicate the network node status identifier to the real-time status manager 324.
- the real-time event correlator 326 may generate a network event identifier indicating the identified network node status identifier, and may communicate the generated network event identifier to the event manager 320 for further processing.
- the real-time status manager 324 may receive the network node status identifier via a component other than the real-time event correlator 326, such as the event manager 320.
- the real-time status manager 324 may generate a request for a network traffic shaping control.
- the real-time status manager 324 communicates the request for a network traffic shaping control to a control request log database 312.
- the request for the network traffic shaping control may be read from the control request log database 312 from one or more components, such as the control management layer 306.
- the real-time status manager 324 generates a network event identifier that contains a request for a network traffic shaping control and communicates the network event identifier to the event management layer 302.
- the network event identifier containing the request for the network traffic shaping control may then be stored on the monitored network traffic database 208 and retrievable by any of the components of the network real-time monitoring and control system 102.
- the control management layer 306 may receive the request for a network traffic shaping control from the monitored network traffic database 208, the real-time status analyzer 304, or any other component of the network real-time monitoring and control system 102.
- the control management layer 306 is implemented as part of the JBoss application server, which is available from JBoss, a division of Red Hat.
- the control management layer 306 may define a main control node thread and a control management thread.
- the main control node thread may be configured to generate the network traffic shaping control.
- the main control node thread may then communicate the generated network traffic shaping control to the control management thread.
- the control management thread manages network traffic shaping controls.
- Managing a network traffic shaping control may include sending a network event identifier to the event management layer 302 that notifies the event management layer 302 of the generated control, and managing the life cycle of the network traffic control as the network traffic control transitions between one or more states based on generated network event identifiers.
- Managing the network traffic shaping control may also include terminating the network traffic shaping control based on a predefined condition, such as when a network node becomes stable or when a received termination request to terminate the network traffic shaping control is received.
- the control management layer 306 may include one or more components to facilitate the generation and management of network traffic shaping controls.
- the control management layer 306 includes a root cause identifier 328, a control selector 330, and a control manager 332. Alternative components are also possible.
- the control manager 332 initially receives the request for the network traffic shaping control. Where the control manager 332 receives multiple requests for network traffic shaping controls, the control manager 332 communicates with the root cause identifier 328 to prioritize which network traffic flow is considered first.
- the root cause identifier 328 assigns priority levels to one or more network traffic flows in deciding which network traffic flows should receive a network traffic shaping control.
- the root cause identifier 328 may communicate with a scoring database 316 to apply a network traffic scoring function to one or more of the input network traffic flows 118 to obtain a priority level for each corresponding input network traffic flow 118.
- a network traffic scoring function is a function that identifies the network traffic flow priority for a corresponding network traffic flow.
- the root cause identifier 328 may use one or more network traffic scoring functions to determine network traffic flow priorities among one or more input network traffic flows 118 or output network traffic flows 120.
- a network traffic flow priority identifies a network traffic flow priority level for a network traffic flow.
- the network traffic flow priority level assigned to a corresponding network traffic flow may determine whether a network traffic shaping control is applied to the corresponding network traffic flow.
- Each of the network traffic flows of the network nodes 114-116 may be assigned a network traffic flow priority. For example, when there are no indications on a network traffic flow to shape, the root cause identifier 328 may apply the network traffic scoring function to identify a candidate network traffic flow that has less impact on the overall service for one or more network nodes 114-116. Assigning a network traffic flow priority may be performed based on the service impact of the network traffic flow and the transactional computing weight.
- the term "transaction computing weight" refers to the amount of computing resources required to process a transaction.
- Computing resources may include processor cycles, an amount of memory, available input or output devices, or any other type of computing resources.
- the network real-time monitoring and control system 102 may implement a first method and a second method.
- the first method may require at least three queries of one or more of the databases of the network real-time monitoring and control system 102, whereas the second method may require only one query.
- the transaction computing weight for the first method would be greater than the transaction computing weight of the second method, and the increased transaction computing weight may be taken into account when a network traffic shaping control is suggested.
- the root cause identifier 328 may use a network traffic scoring function by to determine network traffic flow priorities.
- the network traffic scoring function may use the network node status condition priorities 408.
- the network traffic scoring function may be dependent on the transaction computing weight of one or more network traffic flows.
- the root cause identifier may retain the network traffic flow priority level for a network traffic flow.
- the root cause identifier 328 stores the network traffic flow priority in the scoring database 316.
- the root cause identifier 328 may store the network traffic flow priority in another database, such as the monitored network traffic database 208.
- the control selector 330 selects and/or generates the network traffic shaping control requested by the real-time status analyzer 304.
- the control selector 330 may be implemented as a business rules engine or other software system that executes one or more rules in a runtime production environment.
- a business rules engine is JBoss Rules, which is available from JBoss, which is a division of Red Hat.
- a network traffic shaping control includes instructions and parameters to shape a network traffic flow.
- a network traffic shaping control may control additional actions other than network traffic shaping actions.
- a network traffic shaping control may include one or more network traffic shaping control parameters that define the network traffic shaping control.
- the network traffic shaping control parameters define the actions to be taken when the network traffic shaping control is implemented.
- Examples of network traffic shaping control parameters that define a network traffic shaping control include an Internet traffic protocol, a message type, a source address, a destination address, and a network traffic shaping control intensity that identifies the amount of network traffic to be received by a network node.
- the network traffic shaping control intensity may identify an absolute value of the maximum allowed traffic, an absolute value of the minimum allowed traffic, or other value.
- Alternative parameters may also define a network traffic shaping control.
- the control selector 330 may receive data from one or more databases of the network real-time monitoring and control system 102. For example, the control selector 330 may receive network indicator measurements and/or network performance measurements from the monitored network traffic database 208 to obtain current measurements relating to the operational conditions of one or more network nodes 114-116, the operational conditions of one or more network traffic flows, or a combination of measurements.
- the monitoring layer 104 may include a network communication interface based on an HTTP/XML protocol for receiving data from the monitored network traffic database 208.
- the control selector 330 defines the network traffic shaping control intensity.
- the network traffic shaping control intensity function shown above defines network traffic shaping intensity as a percentage of network traffic flow.
- the network traffic shaping control may define that the network traffic flow associated with the R1 status identifier is reduced by 33%, or that the network traffic flow associated with the R1 status identifier network traffic shaping control intensity is reduced to 33% of the normal network traffic flow.
- the network traffic shaping control may define that the network traffic flow associated with the R1 status identifier is reduced by 50%, or that the network traffic flow associated with the R1 status identifier is reduced to 50% of the normal network traffic flow.
- variable values in the function defining a network traffic shaping control intensity may be based on the network status identifier and/or the request for a network traffic shaping control from the real-time status analyzer 304.
- the "Rearm Measurement” variable value may be based on a critical threshold or warning threshold associated with the network measurement used to calculate the network traffic shaping control intensity.
- one or more of the databases 308-318 may define the variables and/or variable values to use in defining the network traffic shaping control intensity.
- the control selector 330 may then populate a primary network traffic shaping control record with the network traffic shaping control parameter values of the network traffic shaping control intensity.
- Table 9 shows one example of network traffic shaping parameters that may define a primary network traffic shaping record.
- Table 9 Network Traffic Shaping Parameter Description
- ID_CONTROL A parameter that identifies an identification number of the network traffic shaping control.
- ID_ANAG_CONTROLLO A parameter that identifiers the type of the network traffic shaping control.
- ID_ANAG_CONTROLLO may be used as a foreign key.
- TIMESTAMP_ARRIVAL A parameter that identifies the arrival time of the network traffic shaping control.
- TIMESTAMP_BEGIN A parameter that identifies the time when the network traffic shaping control begins execution.
- TIMESTAMP_END A parameter that identifies the time when the network traffic shaping control ends execution.
- STATE A parameter that identifies the state of the network traffic shaping control.
- ID_NETWORK_NODE A parameter that identifies the network node for the network traffic shaping control.
- EVENTID A parameter that identifies an event identification number for the network traffic shaping control.
- XML_DATA A parameter that contains network traffic shaping control data.
- the network traffic shaping control data may be stored in an XML format.
- RIMODULATION A parameter that identifies whether the network traffic shaping control is in modulation mode. In general, modulation mode indicates that once the control is started the intensity could be automatically adjusted depending on the new values of the measures of the indicators.
- the control selector 330 may also populate a network traffic shaping control intensity record with network traffic shaping control parameter values.
- Table 10 shows one example of the parameters for a network traffic shaping control intensity record.
- Table 10 Network Traffic Shaping Parameter Description ID_DETTAGLIO_CONTROLLO A parameter that identifies the secondary network traffic shaping control record.
- ID_CONTROL A parameter that identifies the primary network traffic shaping control record.
- INTENSITY A parameter that identifies the intensity of the network traffic shaping control.
- ID_FLUSSO A parameter that identifies the network traffic flow to which the network traffic shaping control should be applied.
- the primary network traffic shaping control record and the network traffic shaping control intensity record may be stored in one or more databases of the network real-time monitoring and control system 102.
- the primary network traffic shaping control record and the network traffic shaping control intensity record may be stored in the service model database 318, the monitored network traffic database 208, or any of the other databases 308-318.
- the control selector 330 may communicate the network traffic shaping control to the control manager 332 to notify the network real-time monitoring and control system 102 that a network traffic shaping control has been generated.
- the network traffic shaping control is sent as part of a network event identifier to the event manager 320.
- An example of an network event identifier that incorporates a network traffic shaping control is shown below as implemented in XML:
- control manager 332 may maintain a log of the network traffic shaping controls that have been generated. In one implementation, a log of the network traffic shaping controls is maintained in the network traffic shaping control log database 314. In addition to the control manager 332, one or more components of the network real-time monitoring and control system 102 may have access to the network traffic shaping control log database 314.
- the control manager 332 may or may not automatically output the network traffic shaping control to the traffic shaping control layer 108.
- the output of the network traffic shaping control is controlled by a user of the network real-time monitoring and control system 102.
- a determined network traffic shaping control is a suggested network traffic shaping control because the user of the network real-time monitoring and control system 102 may have discretion as to whether the suggested network traffic shaping control is output to the traffic shaping control layer 108.
- the control manager 332 may communicate a control acceptance request that requests acceptance of the suggested network traffic shaping control to the reporting layer 110, which, in turn, may be output to the user of the network real-time monitoring and control system 102.
- the control manager 332 may then hold the output of the suggested network traffic shaping control unit until the control manager 332 receives an acceptance acknowledgment of the suggested network traffic shaping control.
- the control manager 332 may terminate the suggested network traffic shaping control according to a predefined termination condition. For example, the control manager 332 may terminate the suggested network traffic shaping control when the control manager receives a decline acknowledgement.
- the user may selectively apply the network traffic shaping controls that the user believes to be most desirable or beneficial for the network nodes 114-116.
- the acceptance and output of the network traffic shaping control is automatic.
- the control manager 332 automatically outputs the network traffic shaping control to the traffic shaping control layer 108.
- a network traffic shaping control may end when a terminating condition is satisfied.
- a terminating condition may be satisfied when a terminating request to terminate the network traffic shaping control is received from a user, or may be based on a network event identifier received by the control manager 332.
- Other conditions may include a finishing condition, a stopping condition, a failing condition, and an aborting condition. The conditions may be satisfied based on the occurrence of a network event identifier or the receipt of a user request.
- a network traffic shaping control may change to a state that ends the network traffic shaping control, and, by entering the state that ends the network traffic shaping, a condition controlling the life cycle of the network traffic shaping control may be satisfied.
- the event control layer 106 may include a service model database 318 that stores a service model.
- the service model provides a platform representation of a VoIP provider through the definition of its elements and their interconnections.
- the event management layer 302 communicates with the service model database 318 using Structured Query Language ("SQL") queries.
- SQL Structured Query Language
- the information retrieved from the service model database 318 facilitates the correlation of an event with one or more of the network nodes 114-116.
- the information retrieved from the service model database 318 may include relations between a network performance measurement, or other measurements and the server instance, and the relations between network nodes and server instances.
- the information retrieved from the service model database 318 occurs according to a predetermined service model condition, such as when the service model is first introduced to the network real-time monitoring and control system 102, when the service model database 318 has been modified, or other predetermined service model condition.
- the real-time status analyzer 304 and the control management layer 306 may communicate with the service model database 318.
- the real-time status manager 324 of the real-time time status analyzer 304 may retrieve information the service model database 318 when a predetermined service model condition occurs or is satisfied.
- the root cause identifier 328 of the control management layer 306 may communicate with the service model database 318 to identify a root cause of the event and to identify one or more input traffic flows 118 or output traffic flows 120 to shape.
- Other components of the network real-time monitoring and control system 102 may also communicate with the service model database 318.
- the administrative layer 112 may communicate with the service model database 318.
- the administrative layer 112 may communicate with the service model database 318 for initial configuration of the service model or for later modifications of the service model database 318. Other interactions between the administrative layer 112 and the service model database 318 are also possible.
- Figure 5 shows one example of a service model 502 stored in the service model database 318.
- the service model 502 includes a platform root node 504 that forms the root of the service model 502.
- the children and connectors of the platform root node 504 identify the network nodes, network servers, network node services, network traffic flows, and other entities that form the VoIP platform.
- the VoIP platform includes a first service center node 506 and a second service center node 508.
- the service center nodes 506-508 represent primary points of connection for network nodes.
- the service center nodes 506-508 may provide telecommunication services, such as VoIP service to one or more network nodes.
- the network nodes of the service centers 506-508 are identified by node type. Examples of node types include an SIP server, a Home Subscriber Server ("HSS"), a softswitch, a media gateway, a session border controller, or other node types. However, the network nodes of the service center nodes 506-508 may be identified by other criteria, such as geographic location, telecommunication service provided, or other criteria.
- the first service center node 506 is identified as having two network node types, a first network node type 510 and a second node type 512. While the first network node type 510 does not have any children nodes, the second node type 512 is identified as having at least two network nodes
- the network node types 510-512 may or may not have network nodes as children nodes. Although the first network node type 510 does not have children nodes, the second network node type 512 is identified as having two children network nodes 514-516. The network nodes 514-516 may have similar children nodes. Children nodes of the network nodes 514-516 include server instances, network traffic flows, executive services and network node operational indicators. However, the children nodes of the network nodes 514-516 may include other types of children nodes, such as children nodes for network traffic indicator measurements, network traffic performance measurements, or other children nodes.
- the second network node 516 is identified as having two network traffic flows 518-520.
- the network traffic flows 518-520 may be input network traffic flows, output network traffic flows, or a combination of network traffic flows.
- the second network node 516 is also identified as having a first server instance node 522 and a second server instance node 524.
- a server instance node identifies a computer software application or other program running on a physical computer.
- an SIP server generally includes many different types of server instances, such as a load balancer, one or more servers installed in different server instances.
- a server instance node may identify the load balancer of the SIP server or one of the other server instances installed on the SIP server.
- a server instance node may also identify one or more server instances.
- a server instance node may have children nodes.
- Children nodes of service instance nodes 522-524 may include executive service nodes, indicator nodes, or other children nodes.
- an executive service node identifies an executive service that may be integral to the service instance. Examples of executive services include operating systems, application server software, database software, or other executive service.
- the first server instance node 522 has a first executive service node 526 and a second executive service node 528.
- the second server instance node 524 is not shown with executive service nodes, executive service nodes are possible for the second server instance node 524. Other configurations are also possible.
- the second server instance node 524 includes a first set of indicators 526 and a second set of indicators 528.
- the indicators 526-528 identify network indicators for the second server instance node 524.
- the indicators 526-528 may identify network node operational measurements, network traffic indicator measurements, network traffic performance measurements, or other indicators.
- the second service center node 508 may have children network node type nodes, children network node nodes, network traffic flow nodes, server instance nodes, indicator nodes, and other nodes. It is further possible that the children nodes of the second service node 508 are different than the first service center node 506. Other configurations of the service model 502, including additional or different service center nodes, are also possible.
- FIG. 6 is an example of the traffic shaping control layer 108 of the network real-time monitoring and control system 102.
- the traffic shaping control layer 108 is configured to receive a network traffic shaping control from the event control layer 106.
- the traffic shaping control layer 108 may receive the network traffic shaping control when a user provides an acceptance acknowledgement of a suggest network traffic shaping control.
- the traffic shaping control layer 108 may receive the network traffic shaping control automatically after a network traffic shaping control is generated.
- the traffic shaping controller layer 108 includes a traffic controller 602 and a network node controller 604.
- the traffic controller 602 and the network node controller 604 are configured to execute a network traffic shaping control to actively shape network traffic flows for one or more network nodes 114-116.
- the traffic controller 602 and the network node controller 604 may be configured to execute a network traffic shaping control to actively shape input network traffic flows 118.
- the traffic controller 602 and the network node controller 604 may be configured to execute network traffic shaping controls to shape other network traffic flows, such as the output network traffic flow 120.
- the traffic controller 602 and node controller 604 may also provide responses to originating network nodes from where the network traffic flows originated.
- the traffic controller 602 and node controller 604 may provide intelligent responses to the originating network nodes when a network traffic flow is shaped.
- the traffic controller 602 and/or node controller 604 may be implemented in computer software or computer hardware. In one implementation, the traffic controller 602 and node controller 604 are implemented on a single network traffic shaping appliance that receives the network traffic shaping control from the control management layer 306. Alternatively, the traffic controller 602 and the node controller 604 may be implemented on two or more network traffic shaping appliances.
- An example of a network traffic shaping appliance that receives network traffic controls is the BIG-IP Application Delivery Controller, which is available from F5 Networks, Inc. located in Seattle, Washington, United States.
- the control management layer 306 communicates with the BIG-IP Application Delivery Controller using software designed to support interoperable machine-to-machine interaction over a network, such as XML and Simple Object Access Protocol ("SOAP").
- SOAP Simple Object Access Protocol
- the BIG-IP Application Delivery Controller may also be programmed using an internal scripting language, such as iRule, and a Service Oriented Architecture (“SOA”) enabled Application Programming Interface (“API”), such as iControl. Both iRule and iControl are also available from F5 Networks, Inc.
- SOA Service Oriented Architecture
- API Application Programming Interface
- FIG 7 shows an example of the reporting layer 110 and the administrative layer 112 of the network real-time monitoring and control system shown in Figure 1 .
- the reporting layer 110 handles the reporting functions of the network real-time monitoring and control system 102.
- the administrative layer 112 handles the administrative functions of the network real-time monitoring and control system 102, such as displaying graphical user interfaces, receiving configuration information, displaying results from shaping one or more network traffic flows, and other administrative functions.
- the reporting layer 110 and administrative layer 112 may be implemented in computer hardware or computer software.
- the reporting layer 110 and 112 are implemented as servlet containers, using such technologies as Apache Tomcat, which is available from the Apache Software Foundation, located in Forest Hill, Maryland, United States.
- the reporting layer 110 and administrative 112 may implement one or more web pages that are used to configure another technology used by the network real-time monitoring and control system 102, such as the OpenNMS system that may implement the monitoring layer 104 and the event control layer 106.
- the reporting layer 110 may include one or more components for providing reporting information to another component, layer, system, user, or other entity.
- the reporting layer 110 includes a monitoring component 706 and a reporting component 708.
- the monitoring component 706 may monitor the data of the network real-time monitoring and control system 102, such as network traffic indicator measurements, network traffic performance measurements, network node operational indicator measurements, network traffic shaping controls, or other data.
- the reporting component 708 may generate reports for the data monitored by the monitoring component 706.
- the reporting layer 110 may communicate the monitored and reported data to the administrative layer 112 for output to a user via a graphical user interface or output to another system. Other types of output are also possible.
- the administrative layer 112 may include one or more components for managing the configuration of the network real-time monitoring and control system 102.
- the administrative layer 112 includes a control configuration component 710, a threshold configuration component 712, a model configuration component 714, and an NPI configuration component 716.
- the control configuration component 710 may receive inputs that configure one or more network traffic shaping controls or configures the parameter values for generating a network traffic shaping control.
- the control configuration component 710 may be used by a user to control the lifecycle management of a network traffic shaping control.
- a user may also use the control configuration component 710 to accept or reject a suggested network traffic shaping control suggested by the control manager 332.
- the threshold configuration component 712 may receive inputs that configure one or more thresholds, such as a warning threshold and a critical threshold, for one or more indicators monitored by the network real-time monitoring and control system 102.
- the threshold configuration 712 may receive inputs that configure network indicator warning thresholds, network performance warning thresholds, network indicator critical thresholds, network performance warning thresholds, or any other threshold implemented by the network real-time monitoring and control system 102.
- the model configuration component 714 may receive inputs that configure the service model 502 stored in the service model database 318.
- the NPI configuration component 716 may receive inputs that configure the determination of network performance measurements, network indicator measurements, or any other measurement determined by the network real-time monitoring and control system 102.
- the components 710-716 may also be configured for outputting data, such as the warning thresholds, the critical thresholds, the service model, the network traffic shaping controls, or other data.
- outputting data may include the display of data, the transmission of data, such as to another system, the storage of data, or any other type of output now known or later developed.
- Figure 8 shows an example of a network traffic shaping control state model 802.
- the network traffic shaping control state model 802 defines the life cycle of a network traffic shaping control.
- the network traffic shaping control state model 802 may include one or more states, and the network traffic shaping control may transition between these states according to a network event identifier.
- the network traffic shaping control may start at an initial state and transition between various states as network event identifiers are generated until the network traffic shaping control reaches an ending state that ends the network traffic shaping control.
- the network traffic shaping control state model 802 provides a flexible model for both automatically and manually managing network traffic shaping controls. As a network traffic shaping control may be automatically suggested, manually suggested, automatically accepted, or manually accepted, the network traffic shaping control model 802 implements several states that account for the varying conditions under which a network traffic shaping control may be suggested or accepted. Moreover, the network traffic shaping control model 802 includes states that account for a potential failure in executing a control command that is issued to control one or more network traffic shaping controls.
- the network traffic shaping control state model 802 includes five sets of states.
- the five sets of states include a set of pending states 804, a set of running states 806, a set of finished states 808, a set of stopped states 810, and a set of terminated states 812.
- alternative state sets are also possible.
- the network traffic shaping control state model 802 facilitates distinguishing the different causes for terminating or ending a network traffic shaping control through the various state sets 808-812.
- the network traffic shaping control state model 802 includes state sets 808-812 that identify the different causes for the ending of a network traffic shaping control.
- Exemplary causes for ending a network traffic shaping control include manual termination by a user or operator, which may be identified by the terminated state sets 812, automatic termination by the network real-time monitoring and control system 102, which may be identified by the finished state set 808, or the identification that one or more network nodes 114-116 have stopped responding, which may be identified by the stooped state set 810.
- Other causes for ending a network traffic shaping control such as a communication failure in one or more layers of the real-time monitoring and control system 102 or a failure in the node controller 604 or the traffic controller 602, are also possible.
- the network traffic shaping control state model 802 may be event driven so that implementing logic is based on events and a current state, such as using a finite state machine (“FSM”) paradigm. Moreover, the network traffic shaping control state mode 802 is flexible and extensible to include other states and/or events, and may be used in other contexts outside of VoIP. Alternatively, the network traffic shaping control state model 802 may be implemented using a business process management ("BPM”)
- Each of the state sets 804-812 generally include states that identify the general status of a network traffic shaping control.
- the set of pending states 804 generally includes states in which a network traffic shaping control is pending execution by the traffic controller 602 or the node controller 604.
- the set of running states 806 generally include states in which the network traffic shaping control is being executed or transitioning to execution by the traffic controller 602 or the node controller 604.
- the set of finished states 808 generally includes states in which the network traffic shaping control has finished or transitioning to a finishing state by the traffic controller 602 or the node controller 604 according to a finishing condition.
- the set of stopped states 810 generally includes states in which the network traffic shaping control has stopped or is transitioning to a stopped state by the traffic controller 602 or the node controller 604.
- the set of terminated states 812 generally includes states in which the network traffic shaping has terminated or will be terminated by the traffic controller 602 or the node controller 604.
- each of the state sets 804-812 may also include alternative or different types of states.
- the network traffic shaping control has sixteen possible states. However, other implementations may employ more or fewer states.
- the different states may have a state type that defines whether the network traffic shaping control is in an initial state, an intermediary state, or an ending state.
- an initial state is a state the network traffic shaping control is first assigned when instantiated.
- An intermediary state is a state reachable from the initial state but it is not a final state of the network traffic shaping control.
- An intermediary state may transition to another intermediary state or an ending state.
- An ending state is reachable from the pending state and the intermediary state, but, in general, is a state that does not transition to another state.
- Table 11 below provides an exemplary list of states. Table 11 lists the state, the state set in which the state has been grouped, the state type, and a brief description of the state. However, alternative states than those shown in Table 11 are also possible. Table 11 State State Set State Type Description Aborted Pending States Final State A state that indicates that the network traffic shaping control has been aborted based on the satisfaction of an aborting condition. Pending Pending States Initial State A state that indicates that the network traffic shaping control has been suggested and is pending execution. When instantiated, a network traffic shaping control may first be assigned a pending state. Deleted Pending States Final State A state that indicates that the network traffic shaping control has been automatically deleted before being accepted.
- Discarded Pending States Final State A state that indicates that the network traffic shaping control has been discarded since a newer network traffic shaping control has been suggested. Wait Running Running States Intermediary State A state that indicates that a run control command has been issued to execute the network traffic shaping control, but the run control command has not yet been acknowledged. Running Running States Final State A state that indicates that the network traffic shaping control is being executed by a network traffic shaping-appliance. Failed Running Running States Intermediary State A state that indicates that the network traffic control has failed due to the occurrence of a failing condition. Wait Finished Finished States State Intermediary A state that indicates that a finish control command has been issued to finish the network traffic shaping control, but the finish control command has not yet been acknowledged.
- Finished Finished States Final State A state that indicates that the network traffic shaping control has finished according the satisfaction of a finishing condition.
- Failed Finished Finished States Intermediary State A state that identifies that the network traffic shaping control has been unable to reach the finished state due to the occurrence of a failing condition.
- Wait Stopped Stopped States Intermediary State A state that indicates that a stop control command has been issued to stop the network traffic shaping control, but the stop control command has not yet been acknowledged.
- Stopped Stopped States Final State A state that identifies that the network traffic shaping control has stopped according to the satisfaction of a stopping condition.
- Failed Stopped Stopped States Intermediary State A state that identifies that the network traffic shaping control has been unable to reach the stopped state due to the satisfaction of a failing condition.
- Terminated Terminated States Intermediary State A state that indicates that a terminate control command has been issued to terminate the network traffic shaping control, but the terminate control command has not yet been acknowledged.
- Terminated Terminated States Final State A state that identifies that the network traffic shaping control has terminated according to the satisfaction of a terminating condition.
- Failed Terminated Terminated States Intermediary State A state that identifies that the network traffic shaping control has been unable to reach the terminated state due to the satisfaction of a failing condition.
- one or more of the states may be reached according to the satisfaction of a condition.
- conditions may include an aborting condition, terminating conditions, stopped conditions, failing conditions, and finished conditions.
- the conditions may be defined by whether one or more particular network event identifiers have been generated. Accordingly, the conditions may be satisfied according to the generation of the network event identifier. However, the conditions may also be satisfied by another event, such as the receipt of a request by the user to perform an action, or other event.
- Figure 9 shows one example of the pending state set 804 and the running state set 806.
- the pending state set 804 includes a pending state 902, an aborted state 904, a discarded state 908, and a deleted state 906.
- the pending state 902 is an initial state that occurs when a network event identifier EVENT_SUGG_CONTR is generated.
- the EVENT_SUGG_CONTR network event identifier identifies that a network traffic shaping control has been generated and has been suggested.
- the network traffic shaping control may then transition to one or more of the states within the pending state set 804 according to the satisfaction of a condition, such as an aborting condition, or the occurrence of an event. Other conditions are also possible.
- the pending state set 804 may include one or more intra-pending state transitions, such as an intra-pending state transition between the pending state 902 and the aborted state 904.
- the network traffic shaping control may transition out of the pending state set 804 from the pending state 902 according to a pending state transition established between the pending state 902 and a wait running state 910.
- the network traffic shaping control may transition from the pending state 902 to the wait running state 910 when the network traffic shaping control has been accepted, such as being accepted by a user, by another system, or by automatic acceptance.
- Table 12 below lists state transitions established between originating states and destination states including: the originating state, the state transition type, the condition type that causes the state transition, the network event identifier that satisfies the condition that causes the network traffic shaping control to undergo the state transition, and the destination state.
- Table 12 Originating State Transition Type Condition Type Network event identifier Destination State Pending Intra-pending Aborting EVENT_USR_ANN_CONTR Aborted Pending Intra-pending Deleting EVENT_FINE_CONTR_RTC or EVENT_FINE_CONTR_OUT_SONDA Deleted Pending Intra-pending Discarded EVENT_SUGG_CONTR Discarded Pending Pending Accepting EVENT_USR ACC_CONTR Wait Running
- the running state set 806 includes a wait running state 910, a failed running state 912, and a running state 914.
- the network traffic shaping control enters the running state set 806 when the network traffic shaping control is assigned the wait running state 910. After the network traffic shaping control is assigned the wait running state 910, the network traffic shaping control may then transition to one or more of the states within the pending state set 804 according to the satisfaction of a running condition, such as when the network traffic shaping control has been accepted but not yet executed by the traffic controller 602 or the node controller 604. Other types of running conditions are also possible.
- the running state set 806 may include one or more intra-running state transitions, such as an intra-running state transition between the wait running state 910 and the failed running state 912.
- the network traffic shaping control may transition out of the running state set 806 from the wait running state 910 or the running state 914 according to a running state transition.
- a first running state transition may be established between the wait running state 910 and the discarded state 908, and a second running state transition may be established between the running state 914 and to a state selected from the group comprising a finished state, a terminated state, and a stopped state.
- the network traffic shaping control may transition from the running state 914 to another state set when the network traffic shaping control has been executed.
- Table 13 below lists state transitions established in the running state set 806 and between originating states and destination states. Table 13 also lists the state transition type, the condition type that causes the transition, and the network event identifier that satisfies the condition that causes the network traffic shaping control to undergo the transition.
- Figure 10 shows one example of a finished state set 808 for the network traffic shaping control state model 802.
- the finished state set 808 includes a wait finished state 1002, a failed finished state 1004, and a finished state 1006.
- the network traffic shaping control enters the finished state set 808 when the network traffic shaping control is assigned the wait finished state 1002.
- the network traffic shaping control may then transition to one or more of the states within the finished state set 808 according to the satisfaction of a finishing condition, such as when the network real-time monitoring and control system 102 determines that the network traffic shaping control is no longer needed.
- a finishing condition may also include that one or more network performance measurement values have fallen below a threshold, such as a network performance threshold. Other finishing conditions are also possible.
- the finished state set 808 may establish one or more intra-finished state transitions, such as an intra-finished state transition between the wait finished state 1002 and the failed finished state 1004.
- Table 14 below lists state transitions established between originating states and destination states of the finished state set 808 including: the originating state, the state transition type, the condition type that causes the transition, the network event identifier that satisfies the condition that causes the network traffic shaping control to undergo the transition, and the destination state. Table 14 also lists the transition established between the running state 914 and the wait finished state 1002.
- Figure 11 shows one example of a stopped state set 810 for the network traffic shaping control state model 802.
- the stopped state set 810 includes a wait stopped state 1102, a failed stopped state 1104, and a stopped state 1106.
- the network traffic shaping control enters the stopped state set 810 when the network traffic shaping control is assigned the wait stopped state 1102.
- the network traffic shaping control may then transition to one or more of the states within the stopped state set 810 according to the satisfaction of a stopping condition, such as when the network real-time monitoring and control system 102 determines that one or more of the network nodes 114-116 has stopped responding, or the satisfaction of a failing condition.
- a stopping condition such as when the network real-time monitoring and control system 102 determines that one or more of the network nodes 114-116 has stopped responding, or the satisfaction of a failing condition.
- Other conditions are also possible.
- the stopped state set 810 may include one or more intra-stopped state transitions, such as an intra-stopped state transition between the wait stopped state 1102 and the failed stopped state 1104.
- Table 15 below lists state transitions established between originating states and destination states of the stopped state set 810 including: the originating state, the state transition type, the condition type that causes the transition, the network event identifier that satisfies the condition that causes the network traffic shaping control to undergo the transition, and the destination state. Table 15 also lists the transition established between the running state 914 and the wait stopped state 1102.
- Figure 12 shows one example of a terminated state set 812 for the network traffic shaping control state model 802.
- the terminated state set 812 includes a wait terminated state 1202, a failed terminated state 1204, and a terminated state 1206.
- the network traffic shaping control enters the terminated state set 812 when the network traffic shaping control is assigned the wait terminated state 1202.
- the network traffic shaping control may then transition to one or more of the states within the terminated state set 812 according to the satisfaction of a terminating condition, such as when the network real-time monitoring and control system 102 or a user requests the termination of the network traffic control, or the satisfaction of a failing condition. Other conditions are also possible.
- the terminated state set 812 may include one or more intra-terminated state transitions, such as an intra-terminated state transition between the wait terminated state 1202 and the failed terminated state 1204.
- Table 16 below lists state transitions established between originating states and destination states of the terminated state set 812 including: the originating state, the state transition type, the condition type that causes the transition, the network event identifier that satisfies the condition that causes the network traffic shaping control to undergo the transition, and the destination state. Table 16 also lists the transition established between the running state 914 and the wait terminated state 1202.
- control commands include an abort control command, a discard control command, a delete control command, a run control command, a finish control command, a stop control command, and a terminate control command.
- Each of the control commands may indicate a desired state in which to place a network traffic shaping control.
- an abort control command may be a command that places the network traffic shaping control in the aborted state 904.
- the run control command may be a command that places the network traffic shaping control in the running state 914.
- a control command may be issued by one or more layers, such as the control management layer 306, with the intended recipient being another layer or another component, such as the traffic controller 602 or the node controller 604.
- the intended recipient is another layer or another component, such as the traffic controller 602 or the node controller 604.
- a control command is issued by a layer and the control command does not reach, or is unable to reach, its intended recipient.
- Exemplary instances where a control command does not reach its intended recipient include where there is a communication failure in one or more layers of the real-time monitoring and control system 102, where the traffic controller 602 or node controller 604 has stopped responding or has suffered a terminal failure, or where one or more network nodes 114-116 have suffered an outage.
- the control command may be issued by the network real-time monitoring and control system 102 to control a network traffic shaping control, but the control command may not be successfully executed or received by intended recipient of the control command.
- a run control command may be issued to the traffic controller 602, but the traffic controller 602 may have suffered an outage.
- the traffic controller 602 may be unable to run execute the run control command and therefore transmit an acknowledgement that the traffic controller 602 has executed the run control command.
- Outages may also occur within the network real-time monitoring and control system 102, such as a communication failure between one or more layers 104-112. Where there is an outage between one or more layers 104-112, a control command may be issued, but the control command may not reach its intended destination, such as to another layer, to the traffic controller 602, to the node controller 604, or other component.
- the potential for a loss in a control command is addressed by the implementation of the various wait states 910, 1002, 1102, 1202 shown in Figures 9-12 .
- the wait states 910, 1002, 1102, 1202 place a network traffic shaping control in a waiting state until a decision is reached as to whether a control command has been successfully received or executed. In one implementation, this decision is based on whether an acknowledgement of the control command is received during a timeout period of a set period of time, such as a 1 second, 5 seconds, or any other period of time.
- the intended recipient of the control command may transmit an acknowledgement of the control command, which in turn may trigger the generation of a network event identifier, such as the EVENT_FINE_CONTR_RTC_OK network event identifier, the EVENT_NODE_UP_OK network event identifier, or other network event identifier, that places the network traffic shaping control into an ending state, such as the discarded state 908, the finished state 1006, or any other ending state.
- a network event identifier such as the EVENT_FINE_CONTR_RTC_OK network event identifier, the EVENT_NODE_UP_OK network event identifier, or other network event identifier
- the intended recipient of the control command may not transmit an acknowledgement of the control command.
- a network event identifier may be generated that places the network traffic shaping control into one of the failed states, such as the failed running state 912, failed finished state 1004, the failed stopped state 1104, or any other failed state.
- the real-time monitoring and control system 102 may iteratively try to re-issue the control command that caused the network traffic shaping control to be placed into the failed state.
- the real-time monitoring and control system 102 may engage in a diagnostic analysis of the intended recipient of the control command that caused the network traffic shaping control to be placed into the failed state.
- the diagnostic analysis of the intended recipient may result in the restart of the intended recipient, such as where the traffic controller 602 or node controller 604 has failed, or other corrective measures to be applied, such as by transmitting an alarm or notice to the reporting layer 110.
- Corrective measures may also include a diagnostic analysis of one or more layers of the real-time monitoring and control system 102.
- the intended recipient of the control command may be identified as operating within a predetermined set of operational parameters.
- a network event identifier may be generated that places the network traffic shaping control back into a waiting state. For example, when the network traffic shaping control is in the failed finished state 1004, the EVENT_NODE_UP network event identifier may be generated that places the network traffic shaping control in the wait finished state 1002.
- the control command that caused the initial failure may be re-transmitted to the intended recipient and the timeout period may begin tolling again until an acknowledgement is received from the intended recipient.
- a network event identifier may be generated that places the network traffic shaping control into the ending state, such as the finished state 1006.
- the wait states 910, 1002, 1102, 1202 address a problem where an outage may have occurred in the real-time monitoring and control system 102 and the outage has not yet been acknowledged by the real-time monitoring and control system 102. Rather than assuming that a control command has been successfully executed, which would cause the network traffic shaping control to enter an ending state, the wait states 910, 1002, 1102, 1202 place the network traffic shaping control into a waiting state until the real-time monitoring and control system 102 can verify whether the control command was executed or received successfully.
- the wait states 910, 1002, 1102, and 1202 present one technical measure that addresses the problem of controlling a network traffic shaping control where an outage has occurred that has not yet been reported.
- the system may be implemented in many different ways. For example, some features are shown stored in computer-readable memories and may be implemented with logic stored as processor-executable instructions or as data structures in a computer-readable medium. Examples of computer-readable mediums include random access memory (RAM), read-only memory (ROM), erasable and rewriteable memory, removable discs, and fixed discs. Furthermore, all or part of the system and its logic and data structures may be stored on, distributed across, or read from other machine-readable media.
- the media may include hard disks, floppy disks, CD-ROMs, tangible signals, such as a signal received from a network, received over multiple packets communicated across the network, or received at an antenna or other receiver.
- Figure 13 shows one example of logic flow 1302 for generating a network traffic shaping control.
- the network real-time monitoring and control system 102 may first monitor one or more traffic indicators (1304).
- the monitoring layer 104 may obtain network traffic indicator measurements from the network traffic probe 122, and store the network traffic indicator measurements in the monitored network traffic database 208 (1306).
- the event management layer 302 may retrieve one or more network traffic indicator measurements from the monitored network traffic database 208, and retrieve a network performance equation from the network performance equation and threshold profile database 308 associated with the retrieved network traffic indicator measurements (1308). Using the network traffic indicator measurements and the network performance equation, the event management layer 302 determines one or more network performance measurements (1310).
- the event management layer 302 may also determine network node operational performance measurements according to one or more network node operational indicator measurements.
- the event management layer 302 retrieves one or more network traffic thresholds from the network performance equation and threshold profile database 308.
- the network traffic thresholds may include network traffic indicator thresholds, network traffic performance thresholds and network node operational thresholds.
- the retrieved one or more network traffic indicator thresholds may include warning thresholds, critical thresholds, or any other threshold.
- the event management layer 302 may then compare the network traffic indicator thresholds with the previously retrieved network traffic indicator measurements (1312). Alternatively, or in addition, the event management layer 302 may compare the network performance measurements with the network traffic performance thresholds (1314), or the event management layer 302 may compare the network node operational indicator measurements with network node operational indicator thresholds. Additional comparisons are also possible.
- the event management layer 302 may then generate a network event identifier according to the comparison (1316/1318).
- the generated network event identifier may indicate that one or more of the measurements have exceeded a threshold, such as a warning threshold or critical threshold. Alternatively, the generated network event identifier may indicate that one or more of the measurements have not exceeded a threshold.
- a generated network event identifier may also indicate that one or more of the network nodes 114-116 are non-responsive or that an unexpected error has occurred in the generation of the network event identifier. Other types of generated network event identifiers are also possible.
- the generated network event identifier is then communicated to the real-time status analyzer 304.
- the real-time status analyzer 304 correlates the communicated network event identifier with a network node status identifier (1320).
- the real-time status analyzer 304 may refer to a network node status rule set to correlate the network event identifier with a network node status identifier.
- the real-time status analyzer 304 may generate a request for a network traffic shaping control (1322).
- the control management layer 306 receives the request for the network traffic shaping control, and determines the parameter values for the network traffic shaping control (1324). Examples of parameters for a network traffic shaping control are shown in Tables 7-8 above.
- the control management layer 306 then communicates the network traffic shaping control to the traffic shaping control layer 108 for execution by the node controller 604, the traffic controller 602, or both (1326).
- Figure 14 shows one example of logic flow for generating a network traffic shaping control where the generated network traffic shaping control is subject to acceptance.
- the control management layer 306 receives the request for the network traffic shaping control (1402) and determines the network traffic shaping control parameters for the network traffic shaping control (1404).
- the control management layer 306 outputs an acceptance request that requests acceptance of the generated network traffic shaping control (1406).
- the acceptance request may be output by the administrative layer 112 of the network real-time monitoring and control system 102.
- the administrative layer 112 may be tasked with receiving a response to the acceptance request (1408).
- a network event identifier may be output that indicates the suggested network traffic shaping control has been accepted (1410).
- the network event identifier may trigger an event where the network traffic shaping control is communicated to the traffic shaping control layer 108.
- the acceptance of the network traffic shaping control automatic when the network traffic shaping control is generated, the network traffic shaping control is automatically accepted and communicated to the traffic shaping control layer 108.
- a network event identifier may be generated that indicates that the network traffic shaping control has been automatically accepted (1410).
- the system may be implemented with additional, different, or fewer components.
- a processor may be implemented as a microprocessor, a microcontroller, a DSP, an application specific integrated circuit (ASIC), discrete logic, or a combination of other types of circuits or logic.
- memories may be DRAM, SRAM, Flash or any other type of memory.
- the processing capability of the system may be distributed among multiple components, such as among multiple processors and memories, optionally including multiple distributed processing systems. Parameters, databases, and other data structures may be separately stored and managed, may be incorporated into a single memory or database, may be logically and physically organized in many different ways, and may be implemented with different types of data structures such as linked lists, hash tables, or implicit storage mechanisms.
- Logic such as programs or circuitry, may be combined or split among multiple programs, distributed across several memories and processors, and may be implemented in a library, such as a shared library (e.g., a dynamic link library (DLL)).
- the DLL may store code that implements functionality for a specific module as noted above.
- the DLL may itself provide all or some of the functionality of the system.
- the system may be implemented using one or more available technologies.
- the system may be implemented using the OpenNMS network management platform, the XML specification, a Java Runtime Environment ("JRE"), the JBoss application server, the Microsoft Excel spreadsheet application, the Apache Tomcat servlet container, and the PostgreSQL object-relational database management system.
- the system may further be implemented with alternative technologies other than those described herein.
- the computer program product may be tangibly embodied on a computer-readable medium (such as a CD-ROM, flash memory or the like) or may be embodied as a signal or data stream.
Landscapes
- Engineering & Computer Science (AREA)
- Computer Networks & Wireless Communication (AREA)
- Signal Processing (AREA)
- Data Exchanges In Wide-Area Networks (AREA)
Claims (13)
- Un procédé mis en oeuvre par ordinateur pour la modélisation de trafic du à la communication vocale sur protocole Internet, le procédé comprenant le fait de :définir dans un support lisible par ordinateur :les seuils de performance de réseau ; etune logique de commande à états multiples présentant une pluralitéd'états différents possibles ;surveiller les flux de trafic réseau d'entrée (118) et/ou les flux de trafic réseau de sortie (120), les flux de trafic réseau de sortie (120) incluant un trafic réseau sortant d'un ou de plusieurs noeuds de réseau (114 à 116), sachant que le fait de surveiller inclut en outre le fait de surveiller les opérations internes des noeuds de réseau (114 à 116) ;générer des identificateurs d'événement de réseau qui identifient des événements sensibles à l'analyse de mesurages de performance de réseau concernant les seuils de performance de réseau, sachant qu'un événement indique une incidence qui s'est produite, des changements dans les flux de trafic réseau (118, 120), des changements dans les indicateurs de trafic réseau ou des changements dans les noeuds de réseau (114 à 116) ;corréler un identificateur d'événement de réseau généré avec un identificateur d'état de noeud de réseau ;générer une requête pour un contrôle de modélisation de trafic réseau basée sur la corrélation de l'identificateur d'événement de réseau avec l'identificateur d'état de noeud de réseau ;lancer les contrôles de modélisation de trafic réseau là où l'identificateur d'événement de réseau satisfait à la condition d'état de noeud de réseau associée à l'identificateur d'état de noeud de réseau, la condition d'état de noeud de réseau étant satisfaite quand un seuil critique est dépassé ;gérer le contrôle de modélisation de trafic réseau en utilisant un modèle d'état de contrôle de modélisation de trafic réseau (802) qui définit un cycle de vie du contrôle de modélisation de réseau, le modèle d'état de contrôle de modélisation de trafic réseau (802) comprenantdes états de contrôle de modélisation de trafic réseau indiquant l'état du contrôle de modélisation de trafic réseau et étant regroupés dans des ensembles d'états de contrôle de modélisation (808-812),sachant que le contrôle de modélisation de trafic réseau opère le passage entre les états de contrôle de modélisation de trafic réseau suivant un identificateur d'événement de réseau,sachant que les différents états de contrôle de modélisation de trafic réseau présentent un type d'état qui définit si le contrôle de modélisation de trafic réseau se trouve dans un état initial, dans un état intermédiaire, ou dans un état terminal, sachant que le contrôle de modélisation de trafic réseau commence dans l'état initial et passe entre divers états à mesure que sont générés les identificateurs d'événement de réseau jusqu'à ce que le contrôle de modélisation de trafic réseau parvienne à l'état terminal qui termine le contrôle de modélisation de trafic réseau,sachant que les ensembles d'états (808-812) identifient différentes causes pour la terminaison du contrôle de modélisation, etles transitions du contrôle de modélisation de trafic réseau indiquent des événements qui amènent le contrôle de modélisation de trafic réseau à changer d'état entre deux ensembles d'états ou à l'intérieur d'un ensemble d'états.
- Le procédé d'après la revendication 1, sachant que la condition d'état de noeud de réseau est satisfaite quand un seuil d'alerte d'entrée est dépassé et qu'un seuil d'alerte de mesurage de performance de réseau est dépassé.
- Le procédé d'après une des revendications précédentes, sachant que la logique de contrôle définit :un ensemble d'états de résiliation précisant quand un contrôle de modélisation de trafic réseau doit s'achever à la demande d'un utilisateur ;un ensemble d'états de terminaison précisant quand un contrôle de modélisation de trafic réseau doit s'achever lorsque une condition de terminaison est satisfaite ; etun ensemble d'états d'arrêt précisant quand un contrôle de modélisation de trafic réseau doit s'achever lorsqu'il est établi qu'un noeud de réseau ne répond plus.
- Le procédé d'après une des revendications précédentes, comprenant en outre le fait de :envoyer une commande de contrôle au contrôleur de trafic (602) ou au contrôleur de noeud (604) susceptible d'affecter le contrôle de modélisation de trafic réseau ; etsachant que la logique de contrôle définit :un état d'attente précisant que le contrôle de modélisation de trafic réseau se trouve dans un état d'attente jusqu'à ce qu'une décision ne soit prise concernant la question si le contrôleur de trafic (602) ou le contrôleur de noeud (604) ait reconnu l'envoi de la commande de contrôle.
- Le procédé d'après la revendication 4, sachant que le contrôleur de trafic (602) ou le contrôleur de noeud (604) sont déterminés comme n'ayant pas reconnu l'envoi de la commande de contrôle, quand une durée prédéterminée s'est écoulée après que la commande de contrôle ait été envoyée.
- Le procédé d'après une des revendications précédentes, comprenant en outre le fait de :définir une intensité de contrôle de modélisation de trafic réseau précisant l'intensité du contrôle de modélisation de trafic réseau.
- Le procédé d'après une des revendications précédentes, comprenant en outre le fait de :appliquer le contrôle de modélisation de trafic réseau à un flux de trafic réseau.
- Le procédé d'après la revendication 7, sachant que le flux de trafic réseau est un flux de trafic réseau à protocole d'ouverture de session (Session Initiation Protocol).
- Le procédé d'après la revendication 7 ou 8, sachant que le flux de trafic réseau est un flux de trafic réseau de signalisation.
- Le procédé d'après une des revendications précédentes de 7 à 9, sachant que le flux de trafic réseau est un flux de trafic réseau de traitement des documents (media treatment).
- Un système mis en oeuvre par ordinateur pour la modélisation de trafic du à la communication vocale sur protocole Internet, le système comprenant :un support lisible par ordinateur qui définit :les seuils de performance de réseau ; etune logique de commande à états multiples présentant une pluralitéd'états différents possibles ;une couche de surveillance (104), qui est adaptée pour surveiller des flux de trafic réseau d'entrée (118) et/ou des flux de trafic réseau de sortie (120), les flux de trafic réseau de sortie (120) incluant un trafic réseau sortant d'un ou de plusieurs noeuds de réseau (114 à 116), et qui est adaptée pour surveiller des opérations internes des noeuds de réseau (114 à 116) ;un analyseur de mode en temps réel qui est adapté pour générer des identificateurs d'événement de réseau qui identifient des événements sensibles à l'analyse de mesurages de performance de réseau concernant les seuils de performance de réseau ; sachant qu'un événement indique une incidence qui s'est produite, des changements dans les flux de trafic réseau (118, 120), des changements dans les indicateurs de trafic réseau ou des changements dans les noeuds de réseau (114 à 116) ;une couche de contrôle d'événement (106), qui est adaptée pour corréler l'identificateur d'événement de réseau généré avec un identificateur d'état de noeud de réseau ;un gestionnaire de mode en temps réel (324), qui est adapté pour générer une requête pour un contrôle de modélisation de trafic réseau basée sur la corrélation de l'identificateur d'événement de réseau avec l'identificateur d'état de noeud de réseau ;une couche de gestion de contrôle (306), qui est adaptée pour gérer le contrôle de modélisation de trafic réseau en utilisant un modèle d'état de contrôle de modélisation de trafic réseau (802) qui définit un cycle de vie du contrôle de modélisation de réseau, le modèle d'état de contrôle de modélisation de trafic réseau (802) comprenantdes états de contrôle de modélisation de trafic réseau indiquant l'état du contrôle de modélisation de trafic réseau et étant regroupés dans des ensembles d'états de contrôle de modélisation (808-812),sachant que le contrôle de modélisation de trafic réseau opère le passage entre les états de contrôle de modélisation de trafic réseau suivant un identificateur d'événement de réseau,sachant que les différents états de contrôle de modélisation de trafic réseau présentent un type d'état qui définit si le contrôle de modélisation de trafic réseau se trouve dans un état initial, dans un état intermédiaire, ou dans un état terminal, sachant que le contrôle de modélisation de trafic réseau commence dans l'état initial et passe entre divers états à mesure que sont générés les identificateurs d'événement de réseau jusqu'à ce que le contrôle de modélisation de trafic réseau parvienne à l'état terminal qui termine le contrôle de modélisation de trafic réseau,sachant que les ensembles d'états (808-812) identifient différentes causes pour la terminaison du contrôle de modélisation, etles transitions du contrôle de modélisation de trafic réseau indiquent des événements qui amènent le contrôle de modélisation de trafic réseau à changer d'état entre deux ensembles d'états ou à l'intérieur d'un ensemble d'états.
- Le système d'après la revendication 11, sachant que le système est configuré pour effectuer des opérations d'après une des revendications de 1 à 10.
- Un produit programme informatique comprenant des instructions lisibles par ordinateur, lesquelles, quand elles sont chargées et exécutées dans un système informatique, amènent le système informatique à effectuer des opérations conformes au procédé d'après une des revendications de 1 à 10.
Priority Applications (4)
| Application Number | Priority Date | Filing Date | Title |
|---|---|---|---|
| EP09425193.1A EP2254277B1 (fr) | 2009-05-20 | 2009-05-20 | Gestion du contrôle de paramètres de voix sur IP |
| US12/535,571 US7983161B2 (en) | 2009-05-20 | 2009-08-04 | Control management of voice-over-IP parameters |
| CA2701240A CA2701240C (fr) | 2009-05-20 | 2010-04-20 | Gestion de commandes de parametres - voix sur ip |
| CN201010182784.6A CN101895413B (zh) | 2009-05-20 | 2010-05-19 | 网际协议语音参数的控制管理 |
Applications Claiming Priority (1)
| Application Number | Priority Date | Filing Date | Title |
|---|---|---|---|
| EP09425193.1A EP2254277B1 (fr) | 2009-05-20 | 2009-05-20 | Gestion du contrôle de paramètres de voix sur IP |
Publications (2)
| Publication Number | Publication Date |
|---|---|
| EP2254277A1 EP2254277A1 (fr) | 2010-11-24 |
| EP2254277B1 true EP2254277B1 (fr) | 2015-03-18 |
Family
ID=41113772
Family Applications (1)
| Application Number | Title | Priority Date | Filing Date |
|---|---|---|---|
| EP09425193.1A Active EP2254277B1 (fr) | 2009-05-20 | 2009-05-20 | Gestion du contrôle de paramètres de voix sur IP |
Country Status (4)
| Country | Link |
|---|---|
| US (1) | US7983161B2 (fr) |
| EP (1) | EP2254277B1 (fr) |
| CN (1) | CN101895413B (fr) |
| CA (1) | CA2701240C (fr) |
Families Citing this family (11)
| Publication number | Priority date | Publication date | Assignee | Title |
|---|---|---|---|---|
| WO2011042903A1 (fr) | 2009-10-07 | 2011-04-14 | Comability Ltd. | Système de prestation de services en réseau informatique comportant une fonctionnalité d'exécution de volume auto-réglable |
| US8782216B2 (en) * | 2011-07-29 | 2014-07-15 | Cisco Technology, Inc. | Quantitative management assessments of data communication networks with converged architectures |
| CN102497444B (zh) * | 2011-12-23 | 2014-09-10 | 山东中创软件工程股份有限公司 | 一种数据传输方法及系统 |
| EP2685663A1 (fr) * | 2012-07-12 | 2014-01-15 | Alcatel Lucent | Procédé d'évaluation d'une configuration de réseau |
| US20140153388A1 (en) * | 2012-11-30 | 2014-06-05 | Hewlett-Packard Development Company, L.P. | Rate limit managers to assign network traffic flows |
| US10097474B1 (en) | 2013-03-15 | 2018-10-09 | Google Llc | Shared rate limiting |
| CN105306384A (zh) * | 2014-06-24 | 2016-02-03 | 中兴通讯股份有限公司 | 报文处理方法、装置及线卡 |
| WO2016091311A1 (fr) * | 2014-12-11 | 2016-06-16 | Telefonaktiebolaget Lm Ericsson (Publ) | Procédés et dispositif pour tomographie de réseau |
| US9876676B1 (en) * | 2015-03-27 | 2018-01-23 | VCE IP Holding Company LLC | Methods, systems, and computer readable mediums for managing computing systems by a management orchestration module |
| CN105137283B (zh) * | 2015-08-21 | 2018-12-14 | 华中科技大学 | 一种电缆运行状态诊断系统 |
| US10701176B1 (en) * | 2016-09-23 | 2020-06-30 | Amazon Technologies, Inc. | Messaging using a hash ring with host groups |
Family Cites Families (15)
| Publication number | Priority date | Publication date | Assignee | Title |
|---|---|---|---|---|
| US7509425B1 (en) * | 2002-01-15 | 2009-03-24 | Dynamicsoft, Inc. | Establishing and modifying network signaling protocols |
| WO2003107190A1 (fr) * | 2002-06-13 | 2003-12-24 | Netscout Systems, Inc. | Systeme de controle des performances d'un reseau en temps reel |
| US7457872B2 (en) * | 2003-10-15 | 2008-11-25 | Microsoft Corporation | On-line service/application monitoring and reporting system |
| US7733787B1 (en) * | 2004-04-16 | 2010-06-08 | Ciena Corporation | Dependability measurement schema for communication networks |
| EP1701487A1 (fr) | 2005-03-07 | 2006-09-13 | France Telecom | Adaptation de largeur de bande en fuction de la charge de réseau |
| US20070081543A1 (en) | 2005-10-11 | 2007-04-12 | Manrique Brenes | Network utilization control apparatus and method of using |
| US7773509B2 (en) * | 2006-03-07 | 2010-08-10 | Samsung Electronics Co., Ltd. | Method and system for traffic control for providing quality of service in a network |
| US7948909B2 (en) * | 2006-06-30 | 2011-05-24 | Embarq Holdings Company, Llc | System and method for resetting counters counting network performance information at network communications devices on a packet network |
| US7599290B2 (en) | 2006-08-11 | 2009-10-06 | Latitude Broadband, Inc. | Methods and systems for providing quality of service in packet-based core transport networks |
| US9479341B2 (en) | 2006-08-22 | 2016-10-25 | Centurylink Intellectual Property Llc | System and method for initiating diagnostics on a packet network node |
| US7808918B2 (en) * | 2006-08-22 | 2010-10-05 | Embarq Holdings Company, Llc | System and method for dynamically shaping network traffic |
| JP4295779B2 (ja) * | 2006-11-14 | 2009-07-15 | アンリツ株式会社 | 帯域制御装置 |
| US7822849B2 (en) * | 2006-11-16 | 2010-10-26 | Path Solutions, Inc. | Apparatus and method for measuring and using response to SNMP requests to provide real-time network parameter estimates in a network management zone |
| CN100440819C (zh) * | 2007-05-18 | 2008-12-03 | 清华大学 | 基于通话模型的网络语音通话测试流量生成方法 |
| EP2254286B1 (fr) * | 2009-05-20 | 2013-03-20 | Accenture Global Services Limited | Procédé, système et produit logiciel pour ordinateurs pour le contrôle et la surveillance de réseau en temps réel |
-
2009
- 2009-05-20 EP EP09425193.1A patent/EP2254277B1/fr active Active
- 2009-08-04 US US12/535,571 patent/US7983161B2/en active Active
-
2010
- 2010-04-20 CA CA2701240A patent/CA2701240C/fr active Active
- 2010-05-19 CN CN201010182784.6A patent/CN101895413B/zh active Active
Also Published As
| Publication number | Publication date |
|---|---|
| CA2701240A1 (fr) | 2010-11-20 |
| US7983161B2 (en) | 2011-07-19 |
| EP2254277A1 (fr) | 2010-11-24 |
| CA2701240C (fr) | 2017-01-24 |
| CN101895413B (zh) | 2014-08-20 |
| US20100296397A1 (en) | 2010-11-25 |
| CN101895413A (zh) | 2010-11-24 |
Similar Documents
| Publication | Publication Date | Title |
|---|---|---|
| EP2254286B1 (fr) | Procédé, système et produit logiciel pour ordinateurs pour le contrôle et la surveillance de réseau en temps réel | |
| EP2254277B1 (fr) | Gestion du contrôle de paramètres de voix sur IP | |
| US8121049B2 (en) | Method and arrangement for controlling service level agreements in a mobile network | |
| US7809002B2 (en) | Method and apparatus for priority services management | |
| WO2022179140A1 (fr) | Procédé et système de traitement de données | |
| US8817609B2 (en) | Communications system and method for load management | |
| JP2013531826A (ja) | 管理通信の改善 | |
| CN109714648A (zh) | 一种视频流负载均衡方法和装置 | |
| US7861003B2 (en) | Adaptive feedback for session over internet protocol | |
| WO2011020363A1 (fr) | Procédé et système de réalisation d'équilibrage de charge et client diamètre | |
| US9641603B2 (en) | Method and system for spooling diameter transactions | |
| CN102549981A (zh) | 用于服务质量(QoS)控制的节点和方法 | |
| CN110098987A (zh) | 一种解决物联网多层长连接负载均衡的方法 | |
| CN107343012A (zh) | 视频存储系统及其视频数据发送方法 | |
| Noel et al. | Initial simulation results that analyze SIP based VoIP networks under overload | |
| CN109561487A (zh) | 降低移动终端能耗的方法、装置以及移动终端 | |
| JP2009105949A5 (fr) | ||
| WO2021159884A8 (fr) | Procédé et nœud de réseau pour une notification qos | |
| Wong et al. | Load balancing to improve dependability and performance for program objects in distributed real-time co-operation over the Internet | |
| US20240137276A1 (en) | Controlling User Plane Function (UPF) Load | |
| JP2007060282A (ja) | Snmpエージェント通信装置 | |
| CN106406246B (zh) | 调度消息传输的方法及装置 | |
| CN116915577A (zh) | 业务质差故障诊断方法、装置、设备、终端及存储介质 | |
| Pana et al. | RSVP bundle extension in OPNET modeler: implementation and evaluation | |
| US20040042393A1 (en) | Apparatus and method for data acquisition from network elements having reserved resources for specialized traffic |
Legal Events
| Date | Code | Title | Description |
|---|---|---|---|
| PUAI | Public reference made under article 153(3) epc to a published international application that has entered the european phase |
Free format text: ORIGINAL CODE: 0009012 |
|
| AK | Designated contracting states |
Kind code of ref document: A1 Designated state(s): AT BE BG CH CY CZ DE DK EE ES FI FR GB GR HR HU IE IS IT LI LT LU LV MC MK MT NL NO PL PT RO SE SI SK TR |
|
| AX | Request for extension of the european patent |
Extension state: AL BA RS |
|
| RAP1 | Party data changed (applicant data changed or rights of an application transferred) |
Owner name: ACCENTURE GLOBAL SERVICES LIMITED |
|
| 17P | Request for examination filed |
Effective date: 20110520 |
|
| 17Q | First examination report despatched |
Effective date: 20110823 |
|
| RIC1 | Information provided on ipc code assigned before grant |
Ipc: H04L 12/815 20130101ALI20140718BHEP Ipc: H04L 12/26 20060101ALI20140718BHEP Ipc: H04L 12/825 20130101ALI20140718BHEP Ipc: H04L 12/24 20060101AFI20140718BHEP Ipc: H04L 12/801 20130101ALI20140718BHEP |
|
| GRAP | Despatch of communication of intention to grant a patent |
Free format text: ORIGINAL CODE: EPIDOSNIGR1 |
|
| INTG | Intention to grant announced |
Effective date: 20141112 |
|
| RIN1 | Information on inventor provided before grant (corrected) |
Inventor name: D'ALEO, MARCO Inventor name: FORLANDO, LUIGI Inventor name: FRACCALVIERI, DONATO |
|
| GRAS | Grant fee paid |
Free format text: ORIGINAL CODE: EPIDOSNIGR3 |
|
| GRAA | (expected) grant |
Free format text: ORIGINAL CODE: 0009210 |
|
| AK | Designated contracting states |
Kind code of ref document: B1 Designated state(s): AT BE BG CH CY CZ DE DK EE ES FI FR GB GR HR HU IE IS IT LI LT LU LV MC MK MT NL NO PL PT RO SE SI SK TR |
|
| REG | Reference to a national code |
Ref country code: GB Ref legal event code: FG4D |
|
| REG | Reference to a national code |
Ref country code: CH Ref legal event code: EP |
|
| REG | Reference to a national code |
Ref country code: IE Ref legal event code: FG4D |
|
| REG | Reference to a national code |
Ref country code: AT Ref legal event code: REF Ref document number: 717158 Country of ref document: AT Kind code of ref document: T Effective date: 20150415 |
|
| REG | Reference to a national code |
Ref country code: DE Ref legal event code: R096 Ref document number: 602009030024 Country of ref document: DE Effective date: 20150430 |
|
| REG | Reference to a national code |
Ref country code: NL Ref legal event code: VDEP Effective date: 20150318 |
|
| REG | Reference to a national code |
Ref country code: NL Ref legal event code: VDEP Effective date: 20150318 |
|
| PG25 | Lapsed in a contracting state [announced via postgrant information from national office to epo] |
Ref country code: HR Free format text: LAPSE BECAUSE OF FAILURE TO SUBMIT A TRANSLATION OF THE DESCRIPTION OR TO PAY THE FEE WITHIN THE PRESCRIBED TIME-LIMIT Effective date: 20150318 Ref country code: NO Free format text: LAPSE BECAUSE OF FAILURE TO SUBMIT A TRANSLATION OF THE DESCRIPTION OR TO PAY THE FEE WITHIN THE PRESCRIBED TIME-LIMIT Effective date: 20150618 Ref country code: SE Free format text: LAPSE BECAUSE OF FAILURE TO SUBMIT A TRANSLATION OF THE DESCRIPTION OR TO PAY THE FEE WITHIN THE PRESCRIBED TIME-LIMIT Effective date: 20150318 Ref country code: FI Free format text: LAPSE BECAUSE OF FAILURE TO SUBMIT A TRANSLATION OF THE DESCRIPTION OR TO PAY THE FEE WITHIN THE PRESCRIBED TIME-LIMIT Effective date: 20150318 Ref country code: LT Free format text: LAPSE BECAUSE OF FAILURE TO SUBMIT A TRANSLATION OF THE DESCRIPTION OR TO PAY THE FEE WITHIN THE PRESCRIBED TIME-LIMIT Effective date: 20150318 |
|
| REG | Reference to a national code |
Ref country code: AT Ref legal event code: MK05 Ref document number: 717158 Country of ref document: AT Kind code of ref document: T Effective date: 20150318 |
|
| REG | Reference to a national code |
Ref country code: LT Ref legal event code: MG4D |
|
| PG25 | Lapsed in a contracting state [announced via postgrant information from national office to epo] |
Ref country code: LV Free format text: LAPSE BECAUSE OF FAILURE TO SUBMIT A TRANSLATION OF THE DESCRIPTION OR TO PAY THE FEE WITHIN THE PRESCRIBED TIME-LIMIT Effective date: 20150318 Ref country code: GR Free format text: LAPSE BECAUSE OF FAILURE TO SUBMIT A TRANSLATION OF THE DESCRIPTION OR TO PAY THE FEE WITHIN THE PRESCRIBED TIME-LIMIT Effective date: 20150619 |
|
| PG25 | Lapsed in a contracting state [announced via postgrant information from national office to epo] |
Ref country code: NL Free format text: LAPSE BECAUSE OF FAILURE TO SUBMIT A TRANSLATION OF THE DESCRIPTION OR TO PAY THE FEE WITHIN THE PRESCRIBED TIME-LIMIT Effective date: 20150318 |
|
| PG25 | Lapsed in a contracting state [announced via postgrant information from national office to epo] |
Ref country code: SK Free format text: LAPSE BECAUSE OF FAILURE TO SUBMIT A TRANSLATION OF THE DESCRIPTION OR TO PAY THE FEE WITHIN THE PRESCRIBED TIME-LIMIT Effective date: 20150318 Ref country code: EE Free format text: LAPSE BECAUSE OF FAILURE TO SUBMIT A TRANSLATION OF THE DESCRIPTION OR TO PAY THE FEE WITHIN THE PRESCRIBED TIME-LIMIT Effective date: 20150318 Ref country code: CZ Free format text: LAPSE BECAUSE OF FAILURE TO SUBMIT A TRANSLATION OF THE DESCRIPTION OR TO PAY THE FEE WITHIN THE PRESCRIBED TIME-LIMIT Effective date: 20150318 Ref country code: ES Free format text: LAPSE BECAUSE OF FAILURE TO SUBMIT A TRANSLATION OF THE DESCRIPTION OR TO PAY THE FEE WITHIN THE PRESCRIBED TIME-LIMIT Effective date: 20150318 Ref country code: RO Free format text: LAPSE BECAUSE OF FAILURE TO SUBMIT A TRANSLATION OF THE DESCRIPTION OR TO PAY THE FEE WITHIN THE PRESCRIBED TIME-LIMIT Effective date: 20150318 Ref country code: PT Free format text: LAPSE BECAUSE OF FAILURE TO SUBMIT A TRANSLATION OF THE DESCRIPTION OR TO PAY THE FEE WITHIN THE PRESCRIBED TIME-LIMIT Effective date: 20150720 |
|
| PG25 | Lapsed in a contracting state [announced via postgrant information from national office to epo] |
Ref country code: IS Free format text: LAPSE BECAUSE OF FAILURE TO SUBMIT A TRANSLATION OF THE DESCRIPTION OR TO PAY THE FEE WITHIN THE PRESCRIBED TIME-LIMIT Effective date: 20150718 Ref country code: PL Free format text: LAPSE BECAUSE OF FAILURE TO SUBMIT A TRANSLATION OF THE DESCRIPTION OR TO PAY THE FEE WITHIN THE PRESCRIBED TIME-LIMIT Effective date: 20150318 Ref country code: AT Free format text: LAPSE BECAUSE OF FAILURE TO SUBMIT A TRANSLATION OF THE DESCRIPTION OR TO PAY THE FEE WITHIN THE PRESCRIBED TIME-LIMIT Effective date: 20150318 |
|
| REG | Reference to a national code |
Ref country code: DE Ref legal event code: R097 Ref document number: 602009030024 Country of ref document: DE |
|
| REG | Reference to a national code |
Ref country code: CH Ref legal event code: PL |
|
| PLBE | No opposition filed within time limit |
Free format text: ORIGINAL CODE: 0009261 |
|
| STAA | Information on the status of an ep patent application or granted ep patent |
Free format text: STATUS: NO OPPOSITION FILED WITHIN TIME LIMIT |
|
| PG25 | Lapsed in a contracting state [announced via postgrant information from national office to epo] |
Ref country code: CH Free format text: LAPSE BECAUSE OF NON-PAYMENT OF DUE FEES Effective date: 20150531 Ref country code: LU Free format text: LAPSE BECAUSE OF FAILURE TO SUBMIT A TRANSLATION OF THE DESCRIPTION OR TO PAY THE FEE WITHIN THE PRESCRIBED TIME-LIMIT Effective date: 20150520 Ref country code: DK Free format text: LAPSE BECAUSE OF FAILURE TO SUBMIT A TRANSLATION OF THE DESCRIPTION OR TO PAY THE FEE WITHIN THE PRESCRIBED TIME-LIMIT Effective date: 20150318 Ref country code: MC Free format text: LAPSE BECAUSE OF FAILURE TO SUBMIT A TRANSLATION OF THE DESCRIPTION OR TO PAY THE FEE WITHIN THE PRESCRIBED TIME-LIMIT Effective date: 20150318 Ref country code: LI Free format text: LAPSE BECAUSE OF NON-PAYMENT OF DUE FEES Effective date: 20150531 |
|
| 26N | No opposition filed |
Effective date: 20151221 |
|
| PG25 | Lapsed in a contracting state [announced via postgrant information from national office to epo] |
Ref country code: SI Free format text: LAPSE BECAUSE OF FAILURE TO SUBMIT A TRANSLATION OF THE DESCRIPTION OR TO PAY THE FEE WITHIN THE PRESCRIBED TIME-LIMIT Effective date: 20150318 |
|
| REG | Reference to a national code |
Ref country code: FR Ref legal event code: PLFP Year of fee payment: 8 |
|
| PG25 | Lapsed in a contracting state [announced via postgrant information from national office to epo] |
Ref country code: BE Free format text: LAPSE BECAUSE OF FAILURE TO SUBMIT A TRANSLATION OF THE DESCRIPTION OR TO PAY THE FEE WITHIN THE PRESCRIBED TIME-LIMIT Effective date: 20150318 |
|
| PG25 | Lapsed in a contracting state [announced via postgrant information from national office to epo] |
Ref country code: MT Free format text: LAPSE BECAUSE OF FAILURE TO SUBMIT A TRANSLATION OF THE DESCRIPTION OR TO PAY THE FEE WITHIN THE PRESCRIBED TIME-LIMIT Effective date: 20150318 |
|
| REG | Reference to a national code |
Ref country code: FR Ref legal event code: PLFP Year of fee payment: 9 |
|
| PG25 | Lapsed in a contracting state [announced via postgrant information from national office to epo] |
Ref country code: BG Free format text: LAPSE BECAUSE OF FAILURE TO SUBMIT A TRANSLATION OF THE DESCRIPTION OR TO PAY THE FEE WITHIN THE PRESCRIBED TIME-LIMIT Effective date: 20150318 Ref country code: HU Free format text: LAPSE BECAUSE OF FAILURE TO SUBMIT A TRANSLATION OF THE DESCRIPTION OR TO PAY THE FEE WITHIN THE PRESCRIBED TIME-LIMIT; INVALID AB INITIO Effective date: 20090520 |
|
| PG25 | Lapsed in a contracting state [announced via postgrant information from national office to epo] |
Ref country code: CY Free format text: LAPSE BECAUSE OF FAILURE TO SUBMIT A TRANSLATION OF THE DESCRIPTION OR TO PAY THE FEE WITHIN THE PRESCRIBED TIME-LIMIT Effective date: 20150318 |
|
| PG25 | Lapsed in a contracting state [announced via postgrant information from national office to epo] |
Ref country code: TR Free format text: LAPSE BECAUSE OF FAILURE TO SUBMIT A TRANSLATION OF THE DESCRIPTION OR TO PAY THE FEE WITHIN THE PRESCRIBED TIME-LIMIT Effective date: 20150318 |
|
| REG | Reference to a national code |
Ref country code: FR Ref legal event code: PLFP Year of fee payment: 10 |
|
| PG25 | Lapsed in a contracting state [announced via postgrant information from national office to epo] |
Ref country code: MK Free format text: LAPSE BECAUSE OF FAILURE TO SUBMIT A TRANSLATION OF THE DESCRIPTION OR TO PAY THE FEE WITHIN THE PRESCRIBED TIME-LIMIT Effective date: 20150318 |
|
| REG | Reference to a national code |
Ref country code: DE Ref legal event code: R079 Ref document number: 602009030024 Country of ref document: DE Free format text: PREVIOUS MAIN CLASS: H04L0012240000 Ipc: H04L0041000000 |
|
| REG | Reference to a national code |
Ref country code: FR Ref legal event code: PLFP Year of fee payment: 15 |
|
| PGFP | Annual fee paid to national office [announced via postgrant information from national office to epo] |
Ref country code: GB Payment date: 20230330 Year of fee payment: 15 |
|
| P01 | Opt-out of the competence of the unified patent court (upc) registered |
Effective date: 20230523 |
|
| PGFP | Annual fee paid to national office [announced via postgrant information from national office to epo] |
Ref country code: IT Payment date: 20230412 Year of fee payment: 15 Ref country code: FR Payment date: 20230411 Year of fee payment: 15 Ref country code: DE Payment date: 20230331 Year of fee payment: 15 |
|
| PGFP | Annual fee paid to national office [announced via postgrant information from national office to epo] |
Ref country code: IE Payment date: 20240312 Year of fee payment: 16 |