EP2108115B1 - Method for the automated measurement of gas pressure and concentration inside sealed containers - Google Patents
Method for the automated measurement of gas pressure and concentration inside sealed containers Download PDFInfo
- Publication number
- EP2108115B1 EP2108115B1 EP07849712.0A EP07849712A EP2108115B1 EP 2108115 B1 EP2108115 B1 EP 2108115B1 EP 07849712 A EP07849712 A EP 07849712A EP 2108115 B1 EP2108115 B1 EP 2108115B1
- Authority
- EP
- European Patent Office
- Prior art keywords
- absorption
- container
- gas
- laser
- pressure
- Prior art date
- Legal status (The legal status is an assumption and is not a legal conclusion. Google has not performed a legal analysis and makes no representation as to the accuracy of the status listed.)
- Active
Links
- 238000000034 method Methods 0.000 title claims description 34
- 238000005259 measurement Methods 0.000 title claims description 10
- 238000010521 absorption reaction Methods 0.000 claims description 54
- 230000003287 optical effect Effects 0.000 claims description 19
- 238000000862 absorption spectrum Methods 0.000 claims description 14
- 238000004611 spectroscopical analysis Methods 0.000 claims description 11
- 238000001228 spectrum Methods 0.000 claims description 8
- 239000011521 glass Substances 0.000 claims description 6
- 238000012545 processing Methods 0.000 claims description 4
- 230000004075 alteration Effects 0.000 claims description 2
- 230000002238 attenuated effect Effects 0.000 claims 1
- CURLTUGMZLYLDI-UHFFFAOYSA-N Carbon dioxide Chemical compound O=C=O CURLTUGMZLYLDI-UHFFFAOYSA-N 0.000 description 46
- 239000007789 gas Substances 0.000 description 35
- 229910002092 carbon dioxide Inorganic materials 0.000 description 23
- 239000001569 carbon dioxide Substances 0.000 description 23
- XLYOFNOQVPJJNP-UHFFFAOYSA-N water Substances O XLYOFNOQVPJJNP-UHFFFAOYSA-N 0.000 description 18
- QVGXLLKOCUKJST-UHFFFAOYSA-N atomic oxygen Chemical compound [O] QVGXLLKOCUKJST-UHFFFAOYSA-N 0.000 description 11
- 239000001301 oxygen Substances 0.000 description 11
- 229910052760 oxygen Inorganic materials 0.000 description 11
- 230000000694 effects Effects 0.000 description 9
- 235000014101 wine Nutrition 0.000 description 9
- 238000004458 analytical method Methods 0.000 description 8
- 238000004519 manufacturing process Methods 0.000 description 7
- 238000000883 frequency modulation spectroscopy Methods 0.000 description 5
- 230000003595 spectral effect Effects 0.000 description 5
- 238000000041 tunable diode laser absorption spectroscopy Methods 0.000 description 5
- 235000015040 sparkling wine Nutrition 0.000 description 4
- 241000894007 species Species 0.000 description 4
- 229910000530 Gallium indium arsenide Inorganic materials 0.000 description 3
- KXNLCSXBJCPWGL-UHFFFAOYSA-N [Ga].[As].[In] Chemical compound [Ga].[As].[In] KXNLCSXBJCPWGL-UHFFFAOYSA-N 0.000 description 3
- 238000009530 blood pressure measurement Methods 0.000 description 3
- 235000019993 champagne Nutrition 0.000 description 3
- 239000007799 cork Substances 0.000 description 3
- 238000001514 detection method Methods 0.000 description 3
- 230000027734 detection of oxygen Effects 0.000 description 3
- 238000010586 diagram Methods 0.000 description 3
- 230000035945 sensitivity Effects 0.000 description 3
- IJGRMHOSHXDMSA-UHFFFAOYSA-N Atomic nitrogen Chemical compound N#N IJGRMHOSHXDMSA-UHFFFAOYSA-N 0.000 description 2
- 238000002835 absorbance Methods 0.000 description 2
- 238000004847 absorption spectroscopy Methods 0.000 description 2
- 235000013405 beer Nutrition 0.000 description 2
- 235000013361 beverage Nutrition 0.000 description 2
- BJQHLKABXJIVAM-UHFFFAOYSA-N bis(2-ethylhexyl) phthalate Chemical compound CCCCC(CC)COC(=O)C1=CC=CC=C1C(=O)OCC(CC)CCCC BJQHLKABXJIVAM-UHFFFAOYSA-N 0.000 description 2
- 238000007405 data analysis Methods 0.000 description 2
- 238000011156 evaluation Methods 0.000 description 2
- 238000002474 experimental method Methods 0.000 description 2
- 235000013305 food Nutrition 0.000 description 2
- 229910052500 inorganic mineral Inorganic materials 0.000 description 2
- 239000011707 mineral Substances 0.000 description 2
- 238000012544 monitoring process Methods 0.000 description 2
- 230000000704 physical effect Effects 0.000 description 2
- 238000012360 testing method Methods 0.000 description 2
- 238000012546 transfer Methods 0.000 description 2
- 101100371219 Pseudomonas putida (strain DOT-T1E) ttgE gene Proteins 0.000 description 1
- 239000011358 absorbing material Substances 0.000 description 1
- 230000033228 biological regulation Effects 0.000 description 1
- 238000004364 calculation method Methods 0.000 description 1
- 238000011088 calibration curve Methods 0.000 description 1
- 235000014171 carbonated beverage Nutrition 0.000 description 1
- 239000000919 ceramic Substances 0.000 description 1
- 238000006243 chemical reaction Methods 0.000 description 1
- 238000000205 computational method Methods 0.000 description 1
- 238000012937 correction Methods 0.000 description 1
- 230000007547 defect Effects 0.000 description 1
- 230000006866 deterioration Effects 0.000 description 1
- 238000011161 development Methods 0.000 description 1
- 239000003814 drug Substances 0.000 description 1
- 229940079593 drug Drugs 0.000 description 1
- 230000008030 elimination Effects 0.000 description 1
- 238000003379 elimination reaction Methods 0.000 description 1
- 238000005516 engineering process Methods 0.000 description 1
- 238000004868 gas analysis Methods 0.000 description 1
- 229910052732 germanium Inorganic materials 0.000 description 1
- GNPVGFCGXDBREM-UHFFFAOYSA-N germanium atom Chemical compound [Ge] GNPVGFCGXDBREM-UHFFFAOYSA-N 0.000 description 1
- 230000003993 interaction Effects 0.000 description 1
- 230000009878 intermolecular interaction Effects 0.000 description 1
- 229910052757 nitrogen Inorganic materials 0.000 description 1
- 230000005693 optoelectronics Effects 0.000 description 1
- 238000004806 packaging method and process Methods 0.000 description 1
- 235000020095 red wine Nutrition 0.000 description 1
- 230000001105 regulatory effect Effects 0.000 description 1
- GGYFMLJDMAMTAB-UHFFFAOYSA-N selanylidenelead Chemical compound [Pb]=[Se] GGYFMLJDMAMTAB-UHFFFAOYSA-N 0.000 description 1
- 229910052709 silver Inorganic materials 0.000 description 1
- 239000004332 silver Substances 0.000 description 1
- 230000001629 suppression Effects 0.000 description 1
- 230000002123 temporal effect Effects 0.000 description 1
- 239000012780 transparent material Substances 0.000 description 1
Images


Classifications
-
- G—PHYSICS
- G01—MEASURING; TESTING
- G01N—INVESTIGATING OR ANALYSING MATERIALS BY DETERMINING THEIR CHEMICAL OR PHYSICAL PROPERTIES
- G01N21/00—Investigating or analysing materials by the use of optical means, i.e. using sub-millimetre waves, infrared, visible or ultraviolet light
- G01N21/17—Systems in which incident light is modified in accordance with the properties of the material investigated
- G01N21/25—Colour; Spectral properties, i.e. comparison of effect of material on the light at two or more different wavelengths or wavelength bands
- G01N21/31—Investigating relative effect of material at wavelengths characteristic of specific elements or molecules, e.g. atomic absorption spectrometry
- G01N21/39—Investigating relative effect of material at wavelengths characteristic of specific elements or molecules, e.g. atomic absorption spectrometry using tunable lasers
-
- G—PHYSICS
- G01—MEASURING; TESTING
- G01L—MEASURING FORCE, STRESS, TORQUE, WORK, MECHANICAL POWER, MECHANICAL EFFICIENCY, OR FLUID PRESSURE
- G01L11/00—Measuring steady or quasi-steady pressure of a fluid or a fluent solid material by means not provided for in group G01L7/00 or G01L9/00
- G01L11/02—Measuring steady or quasi-steady pressure of a fluid or a fluent solid material by means not provided for in group G01L7/00 or G01L9/00 by optical means
-
- G—PHYSICS
- G01—MEASURING; TESTING
- G01N—INVESTIGATING OR ANALYSING MATERIALS BY DETERMINING THEIR CHEMICAL OR PHYSICAL PROPERTIES
- G01N21/00—Investigating or analysing materials by the use of optical means, i.e. using sub-millimetre waves, infrared, visible or ultraviolet light
- G01N21/17—Systems in which incident light is modified in accordance with the properties of the material investigated
- G01N21/25—Colour; Spectral properties, i.e. comparison of effect of material on the light at two or more different wavelengths or wavelength bands
- G01N21/27—Colour; Spectral properties, i.e. comparison of effect of material on the light at two or more different wavelengths or wavelength bands using photo-electric detection ; circuits for computing concentration
- G01N21/274—Calibration, base line adjustment, drift correction
Definitions
- This invention relates to a method and to an apparatus that measures pressure and concentration of a gas in sealed containers and has been specifically designed for use with bottles (e.g. of wine). It employs an innovative method for determining the pressure and concentration of the gas in the head space of the container by measuring its absorption spectrum.
- the ability to measure the total pressure within a sealed container, as well as the concentration of a particular gas in the container, is very important in several fields, ranging from the drug industry to food production.
- the ability to take a precise measurement of the concentration and pressure of carbon dioxide inside bottles has several important applications: it is useful for distinguishing between champagne and sparkling wine (which have different allowable levels of carbonation); for monitoring the state of conservation of a single bottle; and even for fine-tuning the equipment used in the bottling process.
- the determination of the oxygen content is critical as an indicator of the conservation state of the product and of the integrity of the container.
- the methods commonly used for these kinds of pressure measurements include electronic pressure or vacuum gauges; pressure-measuring cells based on ceramic technology; piezoresistive sensors, etc.
- all of these methods share the disadvantage of being invasive, because in order to measure the gas present in a given container they need to extract a sample, and thereby spoil the integrity of the container's cork or seal.
- these methods are difficult to integrate as on-line controls in the production process.
- the current standard instrument for measuring above-atmospheric pressure is the aphrometer, which functions by piercing the bottle's cork or seal and measuring the total pressure inside.
- the apbrometer is not able to measure the concentration of individual gases (such as carbon dioxide) or the partial pressure of the gases that comprise the total atmosphere within the bottle. This is an important shortcoming, because regulations regarding certain kinds of wine production distinguish between the partial pressure from carbon dioxide and the total pressure within the bottle (that can be due also to the contribution of other gases like nitrogen and oxygen). As such, it is clear that the aphrometer is not an adequate instrument.
- US 5614718 discloses a method and apparatus for the rapid estimation of the gas concentration within the headspace of a production beverage container which contains a carbonated beverage, includes preparing a prediction model based on correlations between an infrared absorption spectrum obtained from an analysis container and corresponding measured values of gas concentrations and physical properties of the analysis container, the method, whereby the physical property or gas concentration within the headspace of production container do not need to be measured directly, but rather are estimated based on the prediction model with a measured infrared absorption spectrum as an input to the prediction model, thereby providing non-invasive monitoring of production containers, filled and pressurized.
- US 5026991 describes a wavelength-locked laser gaseous species monitor including a variable wavelength laser with a laser output actively stabilized to a wavelength at or near an absorption wavelength of the species being monitored.
- the laser is modulated about that wavelength to establish a modulated output with a known frequency and bandwidth.
- the modulated output is passed through the sample being monitored and then collected.
- An even harmonic of the collected output with respect to the modulation frequency is determined, and the presence in the sample of the species being monitored is detected from the even harmonic signal.
- Our invention which is defined by the method of independent claim 1, offers a method for measuring in real time (i.e. during the bottling filling phase and the conservation period) the pressure and the concentration inside a sealed container without reference container for calibration. Furthermore, this is accomplished by means of a measuring system that is simple, easy to operate, and usable both on the bottling lines as well during after-production controls, by using a spectroscopic method well known as the TDLAS spectroscopy.
- FIG. 1 shows two possible configurations: 2 and 4 are schematic diagrams of a measuring system for absorption spectroscopy.
- first configuration 2 there is a laser source 6, a container 8, that is the object of the measurement and a detector 10.
- second configuration 4 identical objects are indicated by same numbers ed in addition there is a retro-reflecting optic 12.
- retro-reflecting optic 12 can be as way of example a mirror, a corner cube or simply a diffusive screen.
- the source 6 and the detector 10 are located from the same size with respect to container 8.
- the first lens is a collimating lens and the second one a collecting lens.
- These lenses can be standard plano-convex lenses as well as grin lenses. The latter ones have a greater width than the former and have the purpose of both collimating the beam and of reducing the optical path in free space, thereby minimizing the passage of the beam towards gas molecules present in the path external to the region of interest.
- cylindrical lenses could be used with the purpose of correcting the optical aberrations introduced by the surface of the container 8; this is important in the case in which container 8 is e.g.
- a champagne bottle with thickness of the walls as large as 5-8 mm and mainly of cylindrical shape.
- type of container 8 means of regulating the respective position of the lenses as well as other optoelectronic devices could be included. They are not shown in the figure.
- the measuring system is based on the physical principle that different elements in the gas phase present absorption at different frequencies, or lines in the electromagnetic spectrum. Such frequencies being characteristics of the particular gas. These absorption lines have approximately a Lorentzian shape with a width as a known function of the pressure. The contribution due to the Doppler effect is in general quite small (for pressures above atmospheric pressure) and can be neglected.
- I is the intensity as measured by detector 10
- I 0o the intensity impinging on the container 8
- the absorption cross-section presents a constant shape (Lorentzian) whose characteristics parameters (amplitude, width as function of the pressure and center point) can be derived form several spectroscopy data base and are constant even while other parameters of the measure vary.
- This behaviour allows the determination of the quantity C, by a comparison between the quantities I and I 0 for several molecules of interest depending on the availability of a suitable laser source 6.
- the main molecules interesting this invention are carbon dioxide and oxygen as they are of interest in the case when the container 8 is a bottle of wine. In any case it is possible to realize the measure also with reference to water vapour.
- FIGS. 2a to 2d show an absorption spectrum of carbon dioxide at atmospheric pressure and in the interval 0-10 ⁇ m;
- FIG. 2b shows an enlargement of said spectrum in the region around 2 um.
- FIGS. 2c and 2d are shown the absorption spectra in a possible region of measurement i.e. in the interval 2002-2009 nm respectively for the atmospheric pressure and at a pressure of 7 bar.
- Scanning the chosen line is realized by modulating the wavelength emitted by the laser. Consequently for this type of analysis can be used any laser source 6 whose wavelength can be tuned and of spectral width smaller than the absorption line.
- any laser source 6 whose wavelength can be tuned and of spectral width smaller than the absorption line.
- the laser sources 6 available it is preferable to use a diode laser because it presents very narrow spectral width ( width of the emitted line smaller than 30 MHz) together with a wide tuning interval (about 6 nm for the laser used for carbon dioxide determination).
- Other possible lasers can be: DFB laser, Fabry-Perot laser, SePb laser and Quantum Cascade Laser.
- the wavelength can be tuned by varying the temperature or the current of the laser. Providing one or both of these quantities varying in time allows to have a tuning along the absorption line of the gas under examination.
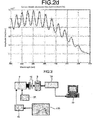
- the current flowing on the laser is modulated with a sawtooth or triangular wave at the frequency of some hundredth Hz, as shown in FIG. 3 .
- These wave shapes are optimal for extracting the parameters of interest in the easiest way but it is possible to use also other shapes of waves as e.g. sinusoidal, provided that they provide the laser with a current continuously variable between two fixed values.
- sinusoidal e.g. sinusoidal
- the current modulator 18 is connected to a ramp generator 24 and it is able to modulate the laser current as required.
- the computer 22 is used for manipulating the data measured by detector 10 for an easier handling.
- Computer 22 can be substituted by a microprocessor or DSP for data analysis that allows the A/D conversion and numerical computation.
- the method adopted in this invention is the direct absorption known as TDLAS: Tunable Diode Laser Absorption Spectroscopy.
- TDLAS Tunable Diode Laser Absorption Spectroscopy.
- derivative spectroscopy due to the very low value of the molecular cross-section ⁇ ( ⁇ ) it is necessary to use derivative spectroscopy know as: WMS (Wavelength Modulation Spectroscopy) or FMS (Frequency Modulation Spectroscopy) (Frequency-modulation spectroscopy for trace species detection: theory and comparison among experimental methods. Applied Optics, Vol. 31, Issue 6, pp. 707- February 1992 Joel A. Silver ) in which at the described modulation it is added a sinusoidal modulation at frequency of some MHz.
- This method is particularly useful for the detection of oxygen inside wine bottles, particularly of red wine where it is required a constant control of the oxygen concentration in the head space that is the space of container 8 near the closing cork.
- An increase of the oxygen concentration could be due to transfer from the dissolved oxygen and could be a sign of a deterioration of the product. Since both the concentration of the oxygen to be detected as well the absorption cross section are small it is necessary to increase the sensitivity of the measure using derivative spectroscopy.
- the preferred laser is a VCSEL at 760 nm. Even in the case of oxygen a known method is used but new procedures of data analysis and determination of pressure and concentration are defined in such way as to allow precise measurements even for high pressures and without the need to have reference paths or the need to know a priori the optical characteristics of the container.
- the central element of the measuring system is as already said the VCSEL laser or any other laser that presents the same characteristics in terms of wavelength of emission and possibility of modulation.
- Said laser is mounted in a suitable mounting with fine temperature control using a thermistor associated to a Peltier cell capable of keeping constant the temperature with an accuracy of 0.01 °C.
- the mount of laser 6 is provided with necessary connections for connecting the VCSEL with the current modulator 18 and with the temperature controller 20. The latter are electronic devices that allow the operator to set and maintaining the temperature and current values provided to the laser 6.
- a laser of this type presents a line width smaller than the traditional laser diodes: the VCSEL utilized for the water vapour measurement has a line width with a typical value of FWHM (Full Width at Half Maximum) of 30 MHz and the one used for carbon dioxide has a width slightly more.
- FWHM Full Width at Half Maximum
- This characteristic is very important in spectroscopy; using this property it is possible to obtain a precise scan and a reliable measure of the absorption line whose width is several order of magnitude larger (the estimated width for standard temperature and pressure values is about 7 GHz for both water vapour and carbon dioxide).
- VCSEL is a nearly monomode laser: in effect its SMSR (Side Mode Suppression Ratio) presents values that varies from 30 to 60 dB; this means that the side modes give a negligible contribution to the laser emission and therefore can be neglected.
- SMSR Segment Mode Suppression Ratio
- Detector 10 used in this measuring system is preferably a preamplified photodiode.
- Detector 10 varies according to the laser used: for water vapour photodiodes of Germanium or Indium Gallium Arsenide (InGaAs) can be used while in the case of carbon dioxide extended InGaAs, or Lead Selenide (PbSe) or PbS photoresistors can be used ( Peter Werle, Franz Slemr, Karl Maurer, Robert Kormann, Robert Micke, Bernd Janker, Near- and mid-infrared laser-optical sensors for gas analysis, Optics and Lasers in Engineering 37 (2-3), 2002, pp. 101-114 ).
- InGaAs Germanium or Indium Gallium Arsenide
- PbSe Lead Selenide
- PbS photoresistors Peter Werle, Franz Slemr, Karl Maurer, Robert Kormann, Robert Micke, Bernd Janker, Near- and mid-infrared laser-optical sensors
- the electronic following detector 10 not shown in the figures provides an output proportional to the absorbance at the given wavelength.
- the absorbance provided by a numerical computation realized by computer 22 can be translated in gas concentration as explained in the following.
- FIGS. 4a and 4b two examples of the signals acquired by detector 10 are shown: from these it is apparent that it is necessary to perform a numerical computation of the said signal in order to derive the required values of amplitude and width of the lines.
- FIG. 4a it is shown a signal of water vapour
- FIG. 4b the absorption lines (show upside down since in this case the detector 10 is with a preamplifier in inverting mode) are due to carbon dioxide in a sparkling wine bottle.
- the wavelengths at the centre of the lines are indicated.
- both the presence of the ramp modulating the intensity of laser 6 as well the interaction among nearby lines do not allow the precise determination of either the amplitude and the width of the lines.
- the first step of the analysis is the elimination of the modulating ramp; for doing this operation the procedure illustrated in FIG. 5 is performed.
- the scheme of FIG. 5 based on the Lambert-Beer law is composed of a block 26 that acquires the trace provided by detector 10 and provides measured intensity I. Said intensity I is input to block 28, a computer unit that provides an evaluation of the intensity I 0 incident on the analyzed sample.
- Block 28 and 30 can be integrated in the computer 22.
- This correction can be obtained analytically using a suitable spectroscopy data base or can be obtained experimentally if one acquires a signal in free space: in this case in effect the absorption refers to know conditions (atmospheric pressure and relative humidity measurable with precision).
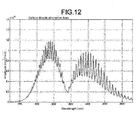
- Figs 11 and 12 show the same lines spectrum at the pressures of 1 and 7 bar; the merging of the lines in the latter case is evident as well as an apparent background over which the lines appear.
- This "atomic" background is the main problem for obtaining a precise fit reconstruction. In effect this "atomic" background couples with the background due to the absorption and scattering by the glass walls of container 8. The latter effects being not known a priori because e.g. the wine bottles to be measured could be of any type and quality and there is not the possibility to determine their background in a separate measure.
- the processing device (22) operates the measurement of the amplitude of the signal and selects a proper optimal background shape from a database of background analytic functions which better fits with the selected glass container.
- This customizable database can be realized selecting different kinds of glass containers according to the application.
- the algorithm in turn interpolates this selected background function with a third grade polynomial fit.
- the output of this step are four coefficients representative of the background.
- the processing device (22) performs an operation of polynomial-exponential fit using the following expression: K .
- the partial pressure of the gas can be determined with the following procedure; this quantity is related to the concentration of the said gas in the container. If we indicate with:
- a measure that is particularly relevant is the one performed on wine bottles as a knowledge of the pressure is related to the characteristics of the same wine and in particular its position on the marked discriminating between sparkling and champagne; furthermore knowing the pressure with small uncertainty allows to certify the product and some of its proprieties.
- the measuring system has been calibrated using tests containers with known internal pressure and concentration (e.g. pressure between 1 and 7 bar with steps of 50 mbar). The calibration curve is shown in FIG.14 while in FIG.15 are reported measured values of pressure in the case of bottles of mineral water.
- Pressure measurements present good reproducibility and sensitivity with a sigma value with respect to the polynomial interpolation of 28 mbar.
- the measured values appear slightly overestimated but the apparatus can be better calibrated using a look-up table.
- the invention can be applied to any field provided the container is even partially transmissive to the wavelength of the laser.
Description
- This invention relates to a method and to an apparatus that measures pressure and concentration of a gas in sealed containers and has been specifically designed for use with bottles (e.g. of wine). It employs an innovative method for determining the pressure and concentration of the gas in the head space of the container by measuring its absorption spectrum.
- The ability to measure the total pressure within a sealed container, as well as the concentration of a particular gas in the container, is very important in several fields, ranging from the drug industry to food production. In the wine industry, for example, the ability to take a precise measurement of the concentration and pressure of carbon dioxide inside bottles (but without damaging either the bottle or its contents in any way) has several important applications: it is useful for distinguishing between champagne and sparkling wine (which have different allowable levels of carbonation); for monitoring the state of conservation of a single bottle; and even for fine-tuning the equipment used in the bottling process. Similarly, in the pharmaceutical and food packaging sectors (e.g. lyophilized components) the determination of the oxygen content is critical as an indicator of the conservation state of the product and of the integrity of the container.
- At present, the methods commonly used for these kinds of pressure measurements include electronic pressure or vacuum gauges; pressure-measuring cells based on ceramic technology; piezoresistive sensors, etc. However, all of these methods share the disadvantage of being invasive, because in order to measure the gas present in a given container they need to extract a sample, and thereby spoil the integrity of the container's cork or seal. Moreover these methods are difficult to integrate as on-line controls in the production process.
- For sparkling wine, for example, the current standard instrument for measuring above-atmospheric pressure is the aphrometer, which functions by piercing the bottle's cork or seal and measuring the total pressure inside. Unfortunately, the apbrometer is not able to measure the concentration of individual gases (such as carbon dioxide) or the partial pressure of the gases that comprise the total atmosphere within the bottle. This is an important shortcoming, because regulations regarding certain kinds of wine production distinguish between the partial pressure from carbon dioxide and the total pressure within the bottle (that can be due also to the contribution of other gases like nitrogen and oxygen). As such, it is clear that the aphrometer is not an adequate instrument.
- In recent years, some novel measuring techniques for the detection of oxygen have been developed based on optical or opto-acoustic methods such as absorption spectroscopy in the modality TDLAS (Tunable Diode Laser Absorption Spectroscopy) or FMS (Frequency Modulation Spectroscopy). These systems have been studied for applications in the pharmaceutical sector, where a production-line control is required on any single piece. However, these systems have been limited to the detection of oxygen, and need reference container for calibration. A typical system is described by Veale et al. (pat.
US. 6,639,678 Bl ) which shows a system using derivative spectroscopy applied to the detection of pressure inside transparent containers and with predetermined background detection and calibration. -
US 5614718 discloses a method and apparatus for the rapid estimation of the gas concentration within the headspace of a production beverage container which contains a carbonated beverage, includes preparing a prediction model based on correlations between an infrared absorption spectrum obtained from an analysis container and corresponding measured values of gas concentrations and physical properties of the analysis container, the method, whereby the physical property or gas concentration within the headspace of production container do not need to be measured directly, but rather are estimated based on the prediction model with a measured infrared absorption spectrum as an input to the prediction model, thereby providing non-invasive monitoring of production containers, filled and pressurized. - Pustogov, V. V., et al., "Pressure Broadening of NO2 by NO2, N2, He, Ar, and Kr Studied with TDLAS". J. Mole. Spectrosc. 167: 288-299, 1994 has studied the line broadening in the strongest band of NO2, the 3 band near 1616.85 cm-1, using a spectrometer with pulsed lead salt diode lasers. The examination uses self-broadening experiments as well as broadening with N2, He, Ar, and Kr to obtain information on the intermolecular interactions. For a set of quantum numbers with 16 ≤ N ≤ 48,0 ≤ K a ≤ 12, the broadening coefficients and spin splittings were determined with an accuracy between 1.5 and 5%.
-
US 5026991 describes a wavelength-locked laser gaseous species monitor including a variable wavelength laser with a laser output actively stabilized to a wavelength at or near an absorption wavelength of the species being monitored. The laser is modulated about that wavelength to establish a modulated output with a known frequency and bandwidth. The modulated output is passed through the sample being monitored and then collected. An even harmonic of the collected output with respect to the modulation frequency is determined, and the presence in the sample of the species being monitored is detected from the even harmonic signal. - In contrast, we propose an apparatus to measure the pressure of the gas inside a generic bottle made of glass or other partially optically transparent materials, where the optical properties, such as absorption and scattering, are completely unknown. In this case the background absorption must be reconstructed. A novel calculation method that allows the self-referenced determination of the measured quantity, being it the pressure or the concentration, is disclosed.
- Our invention which is defined by the method of independent claim 1, offers a method for measuring in real time (i.e. during the bottling filling phase and the conservation period) the pressure and the concentration inside a sealed container without reference container for calibration. Furthermore, this is accomplished by means of a measuring system that is simple, easy to operate, and usable both on the bottling lines as well during after-production controls, by using a spectroscopic method well known as the TDLAS spectroscopy.
- These and others purposes are achieved by the invention with a measuring method and implementation whose main characteristics are described in the claims paragraph.
- The present invention is further described in the detailed description which follows, in reference to the noted plurality of drawings by way of non-limiting examples of preferred embodiments of the present invention, and wherein:
-
FIG. 1 is a block schematic view of two possible configuration of the measuring system according to the present invention. -
FIGS. 2(A) through 2(D) show a graphical representation indicating carbon dioxide absorption spectra at different wavelength intervals and different pressure. -
FIG. 3 is a working scheme of the device. -
FIGS. 4(A) through 4(B) show two examples of signals recorded by the measuring system. -
FIG. 5 is a schematic diagram showing the method for eliminating the modulating ramp. -
FIG. 6 shows one example of the best fitting of the Lorentzian profile for the lines of water vapour. -
FIG. 7 and 8 show two polynomial fittings of the lines for the case of water vapour and pressure of 1 and 5 bar. -
FIG. 9 and 10 show the corresponding absorption lines of water vapour for the cases ofFIGS. 7 and 8 . -
FIGS. 11 and12 show absorption spectra of carbon dioxide at 1 and 7 bar in the same wavelength interval. -
FIG. 13 is a schematic diagram showing the procedure for fitting the lines for the case of carbon dioxide. -
FIG. 14 is one example of curve of calibration. -
FIG. 15 show a graphical representation of the pressure measurement applied to mineral water bottles. -
FIG. 1 shows two possible configurations: 2 and 4 are schematic diagrams of a measuring system for absorption spectroscopy. In the first configuration: 2 there is a laser source 6, a container 8, that is the object of the measurement and adetector 10. In the second configuration 4 identical objects are indicated by same numbers ed in addition there is a retro-reflecting optic 12. Such retro-reflecting optic 12 can be as way of example a mirror, a corner cube or simply a diffusive screen. Differently from the first configuration 2, the source 6 and thedetector 10 are located from the same size with respect to container 8. - For both configurations 2 and 4 there is the possibility of including two lenses, not indicated in
FIG. 1 , in the optical path represented by thearrow 14; the first lens is a collimating lens and the second one a collecting lens. These lenses can be standard plano-convex lenses as well as grin lenses. The latter ones have a greater width than the former and have the purpose of both collimating the beam and of reducing the optical path in free space, thereby minimizing the passage of the beam towards gas molecules present in the path external to the region of interest. Also cylindrical lenses could be used with the purpose of correcting the optical aberrations introduced by the surface of the container 8; this is important in the case in which container 8 is e.g. a champagne bottle with thickness of the walls as large as 5-8 mm and mainly of cylindrical shape. In respect to the type of container 8 means of regulating the respective position of the lenses as well as other optoelectronic devices could be included. They are not shown in the figure. - The measuring system is based on the physical principle that different elements in the gas phase present absorption at different frequencies, or lines in the electromagnetic spectrum. Such frequencies being characteristics of the particular gas. These absorption lines have approximately a Lorentzian shape with a width as a known function of the pressure. The contribution due to the Doppler effect is in general quite small (for pressures above atmospheric pressure) and can be neglected.
- In particular the gas object of the measure present in container 8 produces an absorption of the beam coming from laser source 6 according to the Lambert-Beer law:

- Where I is the intensity as measured by
detector 10, I0o the intensity impinging on the container 8 and i is the optical depth given by:
in which C is the concentration of the gas present in container 8, x is the length of the absorbing material and σ(ν) is the molecular absorption cross-section, function of the wavenumber ν (expressed in cm-1). Both x and σ(ν) are known quantities, therefore the optical depth can be determined with a simple measure on the object under test. Furthermore it is known that the absorption cross-section presents a constant shape (Lorentzian) whose characteristics parameters (amplitude, width as function of the pressure and center point) can be derived form several spectroscopy data base and are constant even while other parameters of the measure vary. This behaviour allows the determination of the quantity C, by a comparison between the quantities I and I0 for several molecules of interest depending on the availability of a suitable laser source 6. The main molecules interesting this invention are carbon dioxide and oxygen as they are of interest in the case when the container 8 is a bottle of wine. In any case it is possible to realize the measure also with reference to water vapour. - It is possible to increase the sensitivity using laser sources 6 emitting in the spectral regions where the molecule of interest has the greatest absorption. In particular laser source 6 emitting at wavelengths exciding 2 µm is preferable as in this spectral region there are some strong absorption lines as shown in FIGS from 2a to 2d. In
FIG. 2a the absorption spectrum of carbon dioxide at atmospheric pressure and in the interval 0-10 µm is shown;FIG. 2b shows an enlargement of said spectrum in the region around 2 um. InFIGS. 2c and2d are shown the absorption spectra in a possible region of measurement i.e. in the interval 2002-2009 nm respectively for the atmospheric pressure and at a pressure of 7 bar. Scanning the chosen line is realized by modulating the wavelength emitted by the laser. Consequently for this type of analysis can be used any laser source 6 whose wavelength can be tuned and of spectral width smaller than the absorption line. Among the laser sources 6 available it is preferable to use a diode laser because it presents very narrow spectral width ( width of the emitted line smaller than 30 MHz) together with a wide tuning interval (about 6 nm for the laser used for carbon dioxide determination). Among the more apt laser it is preferred a diode laser with vertical cavity (VCSEL). Other possible lasers can be: DFB laser, Fabry-Perot laser, SePb laser and Quantum Cascade Laser. In a VCSEL laser the wavelength can be tuned by varying the temperature or the current of the laser. Providing one or both of these quantities varying in time allows to have a tuning along the absorption line of the gas under examination. For obtaining the absorption spectrum the current flowing on the laser is modulated with a sawtooth or triangular wave at the frequency of some hundredth Hz, as shown inFIG. 3 . These wave shapes are optimal for extracting the parameters of interest in the easiest way but it is possible to use also other shapes of waves as e.g. sinusoidal, provided that they provide the laser with a current continuously variable between two fixed values. InFIG. 3 it is shown the laser source 6, the container 8, thedetector 10, twolenses 16 one collimating and one collecting, acurrent modulator 18, atemperature controller 20 and acomputer 22. Thecurrent modulator 18 is connected to aramp generator 24 and it is able to modulate the laser current as required. Thecomputer 22 is used for manipulating the data measured bydetector 10 for an easier handling.Computer 22 can be substituted by a microprocessor or DSP for data analysis that allows the A/D conversion and numerical computation. - The method adopted in this invention is the direct absorption known as TDLAS: Tunable Diode Laser Absorption Spectroscopy. In some cases, due to the very low value of the molecular cross-section σ(ν) it is necessary to use derivative spectroscopy know as: WMS (Wavelength Modulation Spectroscopy) or FMS (Frequency Modulation Spectroscopy) (Frequency-modulation spectroscopy for trace species detection: theory and comparison among experimental methods. Applied Optics, Vol. 31, Issue 6, pp. 707- February 1992 Joel A. Silver) in which at the described modulation it is added a sinusoidal modulation at frequency of some MHz.
- This method is particularly useful for the detection of oxygen inside wine bottles, particularly of red wine where it is required a constant control of the oxygen concentration in the head space that is the space of container 8 near the closing cork. An increase of the oxygen concentration could be due to transfer from the dissolved oxygen and could be a sign of a deterioration of the product. Since both the concentration of the oxygen to be detected as well the absorption cross section are small it is necessary to increase the sensitivity of the measure using derivative spectroscopy. In the case of oxygen the preferred laser is a VCSEL at 760 nm. Even in the case of oxygen a known method is used but new procedures of data analysis and determination of pressure and concentration are defined in such way as to allow precise measurements even for high pressures and without the need to have reference paths or the need to know a priori the optical characteristics of the container.
- In order to realize a portable device microsystems and miniaturized sub-systems have been used with the purpose of obtaining a whole package of reduced dimensions and easily applicable to several types of containers 8. The central element of the measuring system is as already said the VCSEL laser or any other laser that presents the same characteristics in terms of wavelength of emission and possibility of modulation. Said laser is mounted in a suitable mounting with fine temperature control using a thermistor associated to a Peltier cell capable of keeping constant the temperature with an accuracy of 0.01 °C. The mount of laser 6 is provided with necessary connections for connecting the VCSEL with the
current modulator 18 and with thetemperature controller 20. The latter are electronic devices that allow the operator to set and maintaining the temperature and current values provided to the laser 6. A laser of this type presents a line width smaller than the traditional laser diodes: the VCSEL utilized for the water vapour measurement has a line width with a typical value of FWHM (Full Width at Half Maximum) of 30 MHz and the one used for carbon dioxide has a width slightly more. This characteristic is very important in spectroscopy; using this property it is possible to obtain a precise scan and a reliable measure of the absorption line whose width is several order of magnitude larger (the estimated width for standard temperature and pressure values is about 7 GHz for both water vapour and carbon dioxide). Furthermore a VCSEL is a nearly monomode laser: in effect its SMSR (Side Mode Suppression Ratio) presents values that varies from 30 to 60 dB; this means that the side modes give a negligible contribution to the laser emission and therefore can be neglected. -
Detector 10 used in this measuring system is preferably a preamplified photodiode.Detector 10 varies according to the laser used: for water vapour photodiodes of Germanium or Indium Gallium Arsenide (InGaAs) can be used while in the case of carbon dioxide extended InGaAs, or Lead Selenide (PbSe) or PbS photoresistors can be used (Peter Werle, Franz Slemr, Karl Maurer, Robert Kormann, Robert Micke, Bernd Janker, Near- and mid-infrared laser-optical sensors for gas analysis, Optics and Lasers in Engineering 37 (2-3), 2002, pp. 101-114). - The electronic following
detector 10 not shown in the figures provides an output proportional to the absorbance at the given wavelength. The absorbance provided by a numerical computation realized bycomputer 22 can be translated in gas concentration as explained in the following. - Now we enter in detailed description of the measure of the pressure and concentration of the gas in the container. These quantities are strictly related to the measure of amplitude and width of the absorption line. In fact if one neglects (or deconvolve) the contribution to the line width of Doppler effect, it is known that the line profile given by a Lorentzian shape has a width directly proportional to the pressure of the gas. This means that, by measuring the width at half maximum one can derive a measure of the pressure inside the container. In similar way the gas concentration (being it carbon dioxide, oxygen water vapour or other) is related to the amplitude of the absorption line; if one compares the height of the experimentally measured line with the height of the same line at known concentration and pressure one derives the concentration.
- When measurements of absorption lines are made with a system like the one shown in
FIG. 1 there are typically three factors that affect such measure: the nature and shape of the walls of container 8, the pressure inside said container 8 and the contribution due to the gas present in the path external to the container 8. The nature and shape of the walls of the container produce an attenuation of the absorption spectrum not known a priori; the pressure inside the container produces a broadening and eventually a merging of the lines and the external absorption introduces an error in the measure. In addition, particularly when using lasers with narrow width of the line i.e. with high temporal coherence, there could be etalon effects due to reflection on the various optical surfaces. Etalon effect produces noise. - In the following we describe example of analysis of the absorption spectra for water vapour and carbon dioxide. For the case of water vapour is particularly important the contribution due to the path external to container 8. The same case applies also to the analysis of oxygen. For the case of carbon dioxide we consider instead the contribution due to the internal pressure and the one due to the nature and shape of the container 8 and neglect the contribution due to the path external to container 8 since the concentration of carbon dioxide in air can be neglected with respect to the one present e.g. in a bottle of sparkling wine or beer. Of course it is possible to consider simultaneously all three effects independently of the gas analyzed.
- In
FIGS. 4a and 4b two examples of the signals acquired bydetector 10 are shown: from these it is apparent that it is necessary to perform a numerical computation of the said signal in order to derive the required values of amplitude and width of the lines. In the first,FIG. 4a it is shown a signal of water vapour and in the second:FIG. 4b the absorption lines ( shown upside down since in this case thedetector 10 is with a preamplifier in inverting mode) are due to carbon dioxide in a sparkling wine bottle. In both cases the wavelengths at the centre of the lines are indicated. In these figures and in particular in the case of the carbon dioxide, it is clear that both the presence of the ramp modulating the intensity of laser 6 as well the interaction among nearby lines do not allow the precise determination of either the amplitude and the width of the lines. - One of the purposes of the present invention is the development of a specific computational method for eliminating the modulating signal and to obtain the required parameters of the absorption lines even in the presence of high pressures and consequently of merged lines as well to discriminate between the background introduced by the glass of the container and the "atomic" background due to the merging of the lines. The first step of the analysis is the elimination of the modulating ramp; for doing this operation the procedure illustrated in
FIG. 5 is performed. The scheme ofFIG. 5 , based on the Lambert-Beer law is composed of ablock 26 that acquires the trace provided bydetector 10 and provides measured intensity I. Said intensity I is input to block 28, a computer unit that provides an evaluation of the intensity I0 incident on the analyzed sample. The way to accomplish this depends on the gas to be analyzed and on the measure that is required; in any case it is required to obtain the behaviour of the ramp in absence of the absorption. Once obtained an approximation of the signal without absorption, the two traces (I that is the trace with absorption and I0 that is the trace without absorption) are compared and using Lambert-Beer law one derives the effective absorption line (or lines) profile. The latter comparison is performed byblock 30, another computing block that outputs the absorption profile that is function of the wavelength and of the optical depth τ according to the expression:
- Taking x as the length of the optical path inside the container, it is clear that by comparing the intensities of the beam before and after the optical path one derives the quantity τ.
Block computer 22. However as previously indicated there are situations in which it is necessary to modify somehow the model for the analysis. In the case of water vapour one needs to account also of the contribution to absorption due to the path external to container 8. This correction can be obtained analytically using a suitable spectroscopy data base or can be obtained experimentally if one acquires a signal in free space: in this case in effect the absorption refers to know conditions (atmospheric pressure and relative humidity measurable with precision). - The evaluation of the trace without absorption is derived from the experimental signal neglecting the regions where there are absorption lines and fitting the rest with a third order polynomial interpolation. This can be explained with reference to
FIG. 6 . In this figure 26 indicates the block that acquires trace I and sends the signal to block 32 which eliminates the regions containing the lines.Block 34 executes a polynomial interpolation of the signal.Block 36 now compares the initial trace I and the signal output fromblock 34 and output the absorption lines. Finally block 38 compares the Lorentzian profile corresponding to the absorption lines as given byblock 36 with a reference Lorentzian profile at atmospheric pressure and provides the parameter of the unknown Lorentzian i.e. amplitude A and line width γ. All blocks 32, 34, 36 and 38 representing computing units can be incorporated incomputer 22. - Taking in account the absorption external to container 8 one obtains the graphs shown in
Figs 7 and 8 respectively at pressures of 1 and 5 bar. Form these graphs one obtains the absorption lines of the water vapour present in the bottle as indicated inFigs. 9 and 10 in which with dotted lines are shown the single lines and with solid lines the total absorption by the water vapour present inside the bottle. Having now obtained the absorption lines it is possible to determine the FWHM and consequently with the help ofcomputer 22 values of gas pressure and concentration inside the container as previously explained. - In the case of carbon dioxide distortion in the absorption spectra due to the nature and shape of the wall of the container (including wall defects such as blisters and cracks) as well as the gas pressure have to be considered. These issues produce a spectrum with very merged absorption lines and this makes very difficult the determination of the modulating ramp with the previously described method, particularly when the pressure of the gas is high. The carbon dioxide absorption spectrum, used for this described analysis, is made up of two regions as shown in
FIG. 2 consisting in several lines. Some of these lines are quite near each other; so if the gas pressure increases, so does the FWHM of the lines. This line broadening could eventually be very strong and the lines become so merged that not only their profiles but also the total absorption contribution, and its parameters cannot be determined. -
Figs 11 and12 show the same lines spectrum at the pressures of 1 and 7 bar; the merging of the lines in the latter case is evident as well as an apparent background over which the lines appear. This "atomic" background is the main problem for obtaining a precise fit reconstruction. In effect this "atomic" background couples with the background due to the absorption and scattering by the glass walls of container 8. The latter effects being not known a priori because e.g. the wine bottles to be measured could be of any type and quality and there is not the possibility to determine their background in a separate measure. In order to solve these problems, the processing device (22) operates the measurement of the amplitude of the signal and selects a proper optimal background shape from a database of background analytic functions which better fits with the selected glass container. This customizable database can be realized selecting different kinds of glass containers according to the application. - The algorithm in turn interpolates this selected background function with a third grade polynomial fit. The output of this step are four coefficients representative of the background. Furthermore, based on the Lambert-Beer law, the processing device (22) performs an operation of polynomial-exponential fit using the following expression:

- A,B,C,D are the coefficients of the third grade polynomial background and the coefficient starting values were those obtained in the previous step;
- the absorption lines (whose shapes are expressed inside the sum) whose parameters (HWHM: γ, amplitude: A and line center position: ti) are unknown and are determined by a best fit procedure as described later. The number of lines included in the model is variable and depends on the power and duration of the computation; for getting good results it is important to include all the lines in the absorption region of interest that, increasing the pressure, contribute to the chosen measuring interval. In the case of carbon dioxide there are approximately 20 "side" lines that at the maximum pressure considered (8- 10 bar) interact with the chosen measuring spectral region. In
FIG. 13 is shown the block scheme for the computation performed in the case of carbon dioxide scheme that is valid for any gas with absorption lines very near each other.Block 26 acquires signal I and outputs to block 40 that performs the polynomial exponential fit according to equation (4). The purpose is to determine the coefficients of the third degree polynomial and the unknown parameters present in the exponential. The coefficients of the polynomial are calculated by best fitting a polynomial on trace I and choosing arbitrary coefficients for the polynomial. The unknown parameters of the exponential are determined according tointerpolation parameters 48 derived from a spectroscopic data base as e.g. Hitran (The ) that provides distance between lines, relative intensity of the lines, relative widths of the lines etc. At this point block 42 outputs the parameters Ai and 'γi of the Lorentzian corresponding to the absorption lines from which block 44 derives the values for the pressure and concentration. - All blocks form 40 to 52 previously mentioned represent computational units and can be integrated in
computer 22. Once available the values for the parameters describing the lines ( HWHM, centre of the line and peak value) it is possible to derive from these the values for the pressure inside the container as well the concentration of the gas as a partial pressure of the said gas. The total pressure is derived from the relation:
- Once determined the total internal pressure, the partial pressure of the gas can be determined with the following procedure; this quantity is related to the concentration of the said gas in the container. If we indicate with:
- τ the value of the peak of the absorption line as measured
- p the total internal pressure
- γ the theoretical width of the line related to collisions with the gas molecules
- S the theoretical total area of the line profile
- L the length of the optical path in the container
- N1 the Loschmidt number
- Than the partial pressure is derived from the following equation:

- In this way the amplitude, the widths and the values for the centre line of the various lines (that are related by constant and known ratios among themselves) as well as the attenuation due to the container are determined.
- Now we have applied the procedures previously described for the measure of pressure of water vapour and carbon dioxide in several containers, using a laser at 1390 nm or one at 2004 nm according to the gas present.
- A measure that is particularly relevant is the one performed on wine bottles as a knowledge of the pressure is related to the characteristics of the same wine and in particular its position on the marked discriminating between sparkling and champagne; furthermore knowing the pressure with small uncertainty allows to certify the product and some of its proprieties. The measuring system has been calibrated using tests containers with known internal pressure and concentration (e.g. pressure between 1 and 7 bar with steps of 50 mbar). The calibration curve is shown in
FIG.14 while inFIG.15 are reported measured values of pressure in the case of bottles of mineral water. - Pressure measurements present good reproducibility and sensitivity with a sigma value with respect to the polynomial interpolation of 28 mbar. The measured values appear slightly overestimated but the apparatus can be better calibrated using a look-up table.
- As can be appreciated, even if the invention is described with particular relevance for the sector of bottling in the beverages field (water, wine, beer), it can be applied to any field provided the container is even partially transmissive to the wavelength of the laser.
Claims (7)
- A method for the automated measurement of total pressure and concentration of a gas in optically transparent closed containers (8) having unknown optical properties, the method comprising the step of:a. emitting a laser beam of a predetermined wavelength by a laser source (6) towards the optically transparent closed container (8) which contains the gas to be measured;b. detecting the laser beam which is attenuated by the gas absorption of the gas present in the closed container (8) using an optical detector (10);c. providing first data of gas absorption representative of a first absorption spectrum of the gas to be measured, said first spectrum including distorted absorption lines, background due to the container walls and noise;d. processing and elaborating said first spectrum data to obtain a second absorption spectrum free of distortion in the absorption lines and of the background; said processing and elaborating step including:o Selecting a proper background shape from a database of background analytic functions, said background shape being chosen selecting the function which better fits with the selected closed container and on the basis of the measurement of the amplitude of the signal obtained in said first spectrum,∘ interpolating this selected background function with a third grade polynomial fit,∘ outputting four coefficients representative of the background as a result of said fit,∘ executing a polynomial-exponential best fit of the absorption lines data of the first spectrum and the starting valves of the coefficients are those obtained in the interpolating step:
 - Where K is a coefficient which considers the glass attenuation;- A,B,C,D are the four coefficients of the third grade polynomial background using the following expression,∘ Outputting the absorption line parameters obtained by the above best fit procedure:- γi is the Half width at Half Maximum (HWHM),- Ai the amplitude,- ti the line center position (centerline).e. calculating the total pressure of the gas inside said closed container (8) using the following formula:
Where "Hitran" indicates parameters from the spectroscopic data base Hitran and "experimental" indicates the values obtained with the best fit operation with expression (1);f. calculating the partial pressure of the gas in the container (8) with the following formula: - where τ is the value of the peak of the absorption line as measured,- p the total internal pressure calculated in formula (2),- γ the theoretical width of the line related to collisions with the gas molecules,- S the theoretical total area of the line profile,- L the length of the optical path in the container and- Nl the Loschmidt number.
 - The method in accordance with any of the previous claims, further comprising a back reflecting optic (12) which is included in order to reflect the beam coming from the light source (6) and the container (8).
- The method in accordance with any of previous claims, including the step of collimating and/or focalizing and/or reducing the optical path of the laser beam in free space in order to minimize absorption and correcting optical aberrations introduced by the container (8) using at least a lens (16) interposed between the laser source and the container.
- The method in accordance with any of the previous claims, further comprising the step of modulating the laser driver current via a current driver modulator (18).
- The method according to claim 4, wherein the current driver (18) has a triangular- shaped or sawtooth-shaped modulation.
- The method in accordance with any of the previous claims, wherein the laser source (6) is Vertical Cavity Surface Emitting lasers (VCSELs).
- The method in accordance with any of the previous claims, wherein the optical detector (10) is a preamplified photodiode or a photoresistor.
Applications Claiming Priority (2)
| Application Number | Priority Date | Filing Date | Title |
|---|---|---|---|
| IT000778A ITTO20060778A1 (en) | 2006-10-30 | 2006-10-30 | EQUIPMENT FOR THE MEASUREMENT OF GAS PRESSURE IN CONTAINERS |
| PCT/IT2007/000743 WO2008053507A2 (en) | 2006-10-30 | 2007-10-24 | Method for the automated measurement of gas pressure and concentration inside sealed containers |
Publications (2)
| Publication Number | Publication Date |
|---|---|
| EP2108115A2 EP2108115A2 (en) | 2009-10-14 |
| EP2108115B1 true EP2108115B1 (en) | 2014-08-20 |
Family
ID=39244718
Family Applications (1)
| Application Number | Title | Priority Date | Filing Date |
|---|---|---|---|
| EP07849712.0A Active EP2108115B1 (en) | 2006-10-30 | 2007-10-24 | Method for the automated measurement of gas pressure and concentration inside sealed containers |
Country Status (4)
| Country | Link |
|---|---|
| US (1) | US7948626B2 (en) |
| EP (1) | EP2108115B1 (en) |
| IT (1) | ITTO20060778A1 (en) |
| WO (1) | WO2008053507A2 (en) |
Cited By (1)
| Publication number | Priority date | Publication date | Assignee | Title |
|---|---|---|---|---|
| WO2020208012A1 (en) | 2019-04-11 | 2020-10-15 | Steinfurth Mess-Systeme GmbH | Method for contactlessly characterizing a substance |
Families Citing this family (32)
| Publication number | Priority date | Publication date | Assignee | Title |
|---|---|---|---|---|
| EP2430423B1 (en) * | 2009-05-11 | 2017-08-02 | GasPorOx AB | Apparatus and method for non-intrusive assessment of gas in packages |
| DE102009022465A1 (en) * | 2009-05-23 | 2010-11-25 | Bernd Baumann | Method for optical pressure measurement |
| PL2449356T3 (en) * | 2009-07-01 | 2013-11-29 | Wilco Ag | Method for leak testing closed, at least partially gas filled containers |
| IT1399109B1 (en) * | 2010-03-31 | 2013-04-05 | Bonfiglioli Engineering S R L Ora Bonfiglioli Engineering S P A | METHOD OF ANALYSIS OF A GASEOUS COMPONENT PRESENT IN A HERMETICALLY SEALED CONTAINER |
| WO2011159982A2 (en) * | 2010-06-18 | 2011-12-22 | Andrew Pogosyan | Scattering light source multi-wavelength photometer |
| IT1401562B1 (en) * | 2010-06-28 | 2013-07-26 | L Pro S R L | EQUIPMENT FOR MEASURING A GAS CONCENTRATION IN A CLOSED CONTAINER |
| FI20115482A (en) * | 2011-05-18 | 2012-11-19 | Sparklike Ab Oy | Method and apparatus for determining the concentration of a gas component within a glass element |
| GB2494853B (en) * | 2011-07-11 | 2013-09-04 | M Squared Lasers Ltd | Maturation apparatus and methods |
| US9441260B2 (en) * | 2012-06-17 | 2016-09-13 | Vayu Sense Ag | Method and system for real-time, non-invasive monitoring of a biological material in a sealed container |
| US20150099274A1 (en) | 2012-06-17 | 2015-04-09 | Physical Logic Ag | Method and system for use in monitoring biological material |
| EP2762857B1 (en) * | 2012-12-19 | 2018-05-02 | General Electric Company | Method and device for dissolved gas analysis |
| CN103196782B (en) * | 2013-03-22 | 2016-08-03 | 朗松珂利(上海)仪器仪表有限公司 | Gas pressure intensity based on curve matching and the measuring method of micro-water content |
| GB2518147A (en) * | 2013-09-10 | 2015-03-18 | M Squared Lasers Ltd | Maturation apparatus and monitoring methods |
| WO2015055743A1 (en) * | 2013-10-15 | 2015-04-23 | Cork Institute Of Technology | System and method for determining the level of carbon dioxide dissolved in a liquid in a sealed container |
| CN103543126B (en) * | 2013-10-30 | 2015-12-30 | 北京航天易联科技发展有限公司 | For the signal correction compensation calculation method under the interference of gas-monitoring interference signal |
| FI20145030L (en) | 2014-01-15 | 2015-07-16 | Sparklike Ab Oy | Method and device for determining gas component inside a transparent container |
| CN107076637B (en) * | 2014-09-30 | 2020-12-04 | Ft系统有限责任公司 | Apparatus and method for measuring pressure in closed container |
| US9784673B2 (en) * | 2014-10-16 | 2017-10-10 | Nec Corporation | Laser spectroscopic sensor using orbital angular momentum |
| SE538814C2 (en) * | 2015-04-02 | 2016-12-13 | Gasporox Ab | System and method for determining the integrity of containers by optical measurement |
| US10207489B2 (en) * | 2015-09-30 | 2019-02-19 | Sigma Labs, Inc. | Systems and methods for additive manufacturing operations |
| ITUB20169954A1 (en) | 2016-01-13 | 2017-07-13 | L Pro S R L | GROUP AND METHOD OF MEASURING THE CONTENT OF GAS IN CLOSED CONTAINERS AND FILLING AND / OR AUTOMATIC PACKAGING LINE USING THIS GROUP |
| CN107764761B (en) * | 2017-10-18 | 2020-01-21 | 中国科学院合肥物质科学研究院 | Laser detection system and method for concentration of harmful gas in open space atmosphere |
| RU2687179C1 (en) * | 2018-07-20 | 2019-05-07 | Александр Валентинович Озаренко | Method of determining pressure in annular laser gyroscopes |
| JP7006800B2 (en) * | 2018-09-20 | 2022-01-24 | 株式会社島津製作所 | Gas measuring device and gas measuring method |
| CN109959637B (en) * | 2019-04-04 | 2021-06-01 | 中南大学 | Etalon effect inhibition method and device for detecting residual oxygen of glass medicine bottle |
| JP7321453B2 (en) * | 2019-10-28 | 2023-08-07 | ゼネラルパッカー株式会社 | Laser gas concentration meter |
| CN112945903B (en) * | 2019-12-11 | 2022-12-09 | 天津科技大学 | Method for analyzing and simulating influence of laser line width on gas absorption spectral line in TDLAS (tunable diode laser absorption spectroscopy) |
| CN112326597A (en) * | 2020-11-02 | 2021-02-05 | 河北地质大学 | Gas concentration absorption function reconstruction method, electronic device, and medium |
| JP2022176603A (en) * | 2021-05-17 | 2022-11-30 | ゼネラルパッカー株式会社 | Packaging bag gas concentration measurement device and packaging bag gas concentration measurement method |
| JP2022176601A (en) * | 2021-05-17 | 2022-11-30 | ゼネラルパッカー株式会社 | Packaging bag gas concentration measurement device, packaging machine having the same, and packaging bag gas concentration measurement method |
| JP2022176602A (en) * | 2021-05-17 | 2022-11-30 | ゼネラルパッカー株式会社 | Packaging bag gas concentration measurement device and packaging bag gas concentration measurement method |
| CN117091760B (en) * | 2023-10-20 | 2024-02-13 | 国科大杭州高等研究院 | Single photon time-dependent ranging and gas concentration detection method, device and medium |
Family Cites Families (13)
| Publication number | Priority date | Publication date | Assignee | Title |
|---|---|---|---|---|
| DE3620324A1 (en) * | 1985-07-04 | 1987-01-22 | Karl Prof Dr Cammann | METHOD AND DEVICE FOR ANALYZING ATOMIC SPECTRES |
| US5026991A (en) * | 1989-09-20 | 1991-06-25 | Spectral Sciences, Inc. | Gaseous species absorption monitor |
| US5407638A (en) * | 1993-04-28 | 1995-04-18 | Shell Oil Company | Detector-cell adapted for continuous-flow absorption detection |
| US5621213A (en) * | 1995-07-07 | 1997-04-15 | Novitron International Inc. | System and method for monitoring a stack gas |
| EP0766080A1 (en) * | 1995-09-29 | 1997-04-02 | FINMECCANICA S.p.A. AZIENDA ANSALDO | System and method for monitoring combustion and pollutants by means of laser diodes |
| US5614718A (en) * | 1995-10-03 | 1997-03-25 | Hoover Universal, Inc. | Apparatus and method for noninvasive assessment of pressurized container properties |
| US6356350B1 (en) * | 1998-07-30 | 2002-03-12 | Southwest Sciences Incorporated | Wavelength modulation spectroscopy with multiple harmonic detection |
| US6121627A (en) * | 1998-08-31 | 2000-09-19 | Tulip; John | Gas detector with reference cell |
| US6853452B1 (en) * | 1999-03-17 | 2005-02-08 | University Of Virginia Patent Foundation | Passive remote sensor of chemicals |
| US6597462B2 (en) * | 2000-03-01 | 2003-07-22 | Lambda Physik Ag | Laser wavelength and bandwidth monitor |
| US6639678B1 (en) * | 2000-07-13 | 2003-10-28 | Lighthouse Instruments Llc | Apparatus and method for nondestructive monitoring of gases in sealed containers |
| US7009170B2 (en) * | 2003-06-26 | 2006-03-07 | Itt Manufacturing Enterprises, Inc. | Active remote sensing using a simultaneous spectral sampling technique |
| US7222537B2 (en) * | 2004-07-20 | 2007-05-29 | Martin Lehmann | Method of monitoring pressure of a gas species and apparatus to do so |
-
2006
- 2006-10-30 IT IT000778A patent/ITTO20060778A1/en unknown
-
2007
- 2007-10-24 WO PCT/IT2007/000743 patent/WO2008053507A2/en active Application Filing
- 2007-10-24 EP EP07849712.0A patent/EP2108115B1/en active Active
- 2007-10-24 US US12/447,542 patent/US7948626B2/en active Active
Cited By (2)
| Publication number | Priority date | Publication date | Assignee | Title |
|---|---|---|---|---|
| WO2020208012A1 (en) | 2019-04-11 | 2020-10-15 | Steinfurth Mess-Systeme GmbH | Method for contactlessly characterizing a substance |
| DE102019109583A1 (en) * | 2019-04-11 | 2020-10-15 | Steinfurth Mess-Systeme GmbH | Method for the contactless characterization of a substance |
Also Published As
| Publication number | Publication date |
|---|---|
| WO2008053507A2 (en) | 2008-05-08 |
| US7948626B2 (en) | 2011-05-24 |
| US20100067012A1 (en) | 2010-03-18 |
| ITTO20060778A1 (en) | 2008-04-30 |
| WO2008053507A3 (en) | 2008-06-19 |
| EP2108115A2 (en) | 2009-10-14 |
Similar Documents
| Publication | Publication Date | Title |
|---|---|---|
| EP2108115B1 (en) | Method for the automated measurement of gas pressure and concentration inside sealed containers | |
| EP2942616B1 (en) | Gas absorption spectroscopy system and gas absorption spectroscopy method | |
| US9759654B2 (en) | Cavity enhanced laser based isotopic gas analyzer | |
| AU2005318683B2 (en) | A method for standardising a spectrometer | |
| CN108007901B (en) | A kind of method and apparatus detecting multicomponent trace gas concentration | |
| JP7135608B2 (en) | Gas absorption spectroscopy device and gas absorption spectroscopy method | |
| Nadezhdinskii et al. | High sensitivity methane analyzer based on tuned near infrared diode laser | |
| EP3278074B1 (en) | System and method for determining the integrity of containers by optical measurement | |
| Centeno et al. | Three mirror off axis integrated cavity output spectroscopy for the detection of ethylene using a quantum cascade laser | |
| Moriaux et al. | Development and validation of a diode laser sensor for gas-phase CO2 monitoring above champagne and sparkling wines | |
| US20050062972A1 (en) | System and method for cavity ring-down spectroscopy using continuously varying continuous wave excitation | |
| JP7006800B2 (en) | Gas measuring device and gas measuring method | |
| JP7357918B2 (en) | Gas concentration measuring device inside packaging bag | |
| US11293859B2 (en) | Fermentation state monitoring apparatus and fermentation state monitoring method | |
| Cocola et al. | Laser spectroscopy for totally non-intrusive detection of oxygen in modified atmosphere food packages | |
| Cai et al. | Simultaneous measurement of CO and CO2 at elevated temperatures by diode laser wavelength modulated spectroscopy | |
| US20170052069A1 (en) | Method for determining the temperature of an infrared-active gas by means of infrared spectroscopy | |
| WO2024037937A1 (en) | Method and apparatus for measuring a concentration of a gas species | |
| Moriaux et al. | A first step towards the mapping of gas-phase CO2 in the headspace of champagne glasses | |
| Hu et al. | Axial section multi-reflection cavity-like enhanced oxygen detection in pharmaceutical vial | |
| CN117825333A (en) | High-reflectivity calibration method for cavity enhancement spectrum system | |
| CN115343233A (en) | Real-time measurement method and device for concentration of trace gas on open path | |
| JP2021067631A (en) | Method of measuring gas concentration in packaging bag |
Legal Events
| Date | Code | Title | Description |
|---|---|---|---|
| PUAI | Public reference made under article 153(3) epc to a published international application that has entered the european phase |
Free format text: ORIGINAL CODE: 0009012 |
|
| 17P | Request for examination filed |
Effective date: 20090831 |
|
| AK | Designated contracting states |
Kind code of ref document: A2 Designated state(s): AT BE BG CH CY CZ DE DK EE ES FI FR GB GR HU IE IS IT LI LT LU LV MC MT NL PL PT RO SE SI SK TR |
|
| DAX | Request for extension of the european patent (deleted) | ||
| R17P | Request for examination filed (corrected) |
Effective date: 20090525 |
|
| 17Q | First examination report despatched |
Effective date: 20110120 |
|
| RAP1 | Party data changed (applicant data changed or rights of an application transferred) |
Owner name: CONSIGLIO NAZIONALE DELLE RICERCHE Owner name: UNIVERSITA DEGLI STUDI DI PADOVA |
|
| RIC1 | Information provided on ipc code assigned before grant |
Ipc: G01N 21/39 20060101AFI20140131BHEP Ipc: G01N 21/27 20060101ALI20140131BHEP Ipc: G01L 11/02 20060101ALI20140131BHEP |
|
| GRAP | Despatch of communication of intention to grant a patent |
Free format text: ORIGINAL CODE: EPIDOSNIGR1 |
|
| INTG | Intention to grant announced |
Effective date: 20140325 |
|
| GRAS | Grant fee paid |
Free format text: ORIGINAL CODE: EPIDOSNIGR3 |
|
| GRAA | (expected) grant |
Free format text: ORIGINAL CODE: 0009210 |
|
| AK | Designated contracting states |
Kind code of ref document: B1 Designated state(s): AT BE BG CH CY CZ DE DK EE ES FI FR GB GR HU IE IS IT LI LT LU LV MC MT NL PL PT RO SE SI SK TR |
|
| REG | Reference to a national code |
Ref country code: GB Ref legal event code: FG4D |
|
| REG | Reference to a national code |
Ref country code: CH Ref legal event code: EP |
|
| REG | Reference to a national code |
Ref country code: AT Ref legal event code: REF Ref document number: 683718 Country of ref document: AT Kind code of ref document: T Effective date: 20140915 |
|
| REG | Reference to a national code |
Ref country code: IE Ref legal event code: FG4D |
|
| REG | Reference to a national code |
Ref country code: DE Ref legal event code: R096 Ref document number: 602007038261 Country of ref document: DE Effective date: 20141002 |
|
| REG | Reference to a national code |
Ref country code: AT Ref legal event code: MK05 Ref document number: 683718 Country of ref document: AT Kind code of ref document: T Effective date: 20140820 |
|
| REG | Reference to a national code |
Ref country code: NL Ref legal event code: VDEP Effective date: 20140820 |
|
| REG | Reference to a national code |
Ref country code: LT Ref legal event code: MG4D |
|
| PG25 | Lapsed in a contracting state [announced via postgrant information from national office to epo] |
Ref country code: ES Free format text: LAPSE BECAUSE OF FAILURE TO SUBMIT A TRANSLATION OF THE DESCRIPTION OR TO PAY THE FEE WITHIN THE PRESCRIBED TIME-LIMIT Effective date: 20140820 Ref country code: PT Free format text: LAPSE BECAUSE OF FAILURE TO SUBMIT A TRANSLATION OF THE DESCRIPTION OR TO PAY THE FEE WITHIN THE PRESCRIBED TIME-LIMIT Effective date: 20141222 Ref country code: SE Free format text: LAPSE BECAUSE OF FAILURE TO SUBMIT A TRANSLATION OF THE DESCRIPTION OR TO PAY THE FEE WITHIN THE PRESCRIBED TIME-LIMIT Effective date: 20140820 Ref country code: BG Free format text: LAPSE BECAUSE OF FAILURE TO SUBMIT A TRANSLATION OF THE DESCRIPTION OR TO PAY THE FEE WITHIN THE PRESCRIBED TIME-LIMIT Effective date: 20141120 Ref country code: GR Free format text: LAPSE BECAUSE OF FAILURE TO SUBMIT A TRANSLATION OF THE DESCRIPTION OR TO PAY THE FEE WITHIN THE PRESCRIBED TIME-LIMIT Effective date: 20141121 Ref country code: LT Free format text: LAPSE BECAUSE OF FAILURE TO SUBMIT A TRANSLATION OF THE DESCRIPTION OR TO PAY THE FEE WITHIN THE PRESCRIBED TIME-LIMIT Effective date: 20140820 Ref country code: FI Free format text: LAPSE BECAUSE OF FAILURE TO SUBMIT A TRANSLATION OF THE DESCRIPTION OR TO PAY THE FEE WITHIN THE PRESCRIBED TIME-LIMIT Effective date: 20140820 |
|
| PG25 | Lapsed in a contracting state [announced via postgrant information from national office to epo] |
Ref country code: LV Free format text: LAPSE BECAUSE OF FAILURE TO SUBMIT A TRANSLATION OF THE DESCRIPTION OR TO PAY THE FEE WITHIN THE PRESCRIBED TIME-LIMIT Effective date: 20140820 Ref country code: IS Free format text: LAPSE BECAUSE OF FAILURE TO SUBMIT A TRANSLATION OF THE DESCRIPTION OR TO PAY THE FEE WITHIN THE PRESCRIBED TIME-LIMIT Effective date: 20141220 Ref country code: AT Free format text: LAPSE BECAUSE OF FAILURE TO SUBMIT A TRANSLATION OF THE DESCRIPTION OR TO PAY THE FEE WITHIN THE PRESCRIBED TIME-LIMIT Effective date: 20140820 |
|
| PG25 | Lapsed in a contracting state [announced via postgrant information from national office to epo] |
Ref country code: NL Free format text: LAPSE BECAUSE OF FAILURE TO SUBMIT A TRANSLATION OF THE DESCRIPTION OR TO PAY THE FEE WITHIN THE PRESCRIBED TIME-LIMIT Effective date: 20140820 |
|
| PG25 | Lapsed in a contracting state [announced via postgrant information from national office to epo] |
Ref country code: RO Free format text: LAPSE BECAUSE OF FAILURE TO SUBMIT A TRANSLATION OF THE DESCRIPTION OR TO PAY THE FEE WITHIN THE PRESCRIBED TIME-LIMIT Effective date: 20140820 Ref country code: DK Free format text: LAPSE BECAUSE OF FAILURE TO SUBMIT A TRANSLATION OF THE DESCRIPTION OR TO PAY THE FEE WITHIN THE PRESCRIBED TIME-LIMIT Effective date: 20140820 Ref country code: EE Free format text: LAPSE BECAUSE OF FAILURE TO SUBMIT A TRANSLATION OF THE DESCRIPTION OR TO PAY THE FEE WITHIN THE PRESCRIBED TIME-LIMIT Effective date: 20140820 Ref country code: CZ Free format text: LAPSE BECAUSE OF FAILURE TO SUBMIT A TRANSLATION OF THE DESCRIPTION OR TO PAY THE FEE WITHIN THE PRESCRIBED TIME-LIMIT Effective date: 20140820 Ref country code: SK Free format text: LAPSE BECAUSE OF FAILURE TO SUBMIT A TRANSLATION OF THE DESCRIPTION OR TO PAY THE FEE WITHIN THE PRESCRIBED TIME-LIMIT Effective date: 20140820 Ref country code: IT Free format text: LAPSE BECAUSE OF FAILURE TO SUBMIT A TRANSLATION OF THE DESCRIPTION OR TO PAY THE FEE WITHIN THE PRESCRIBED TIME-LIMIT Effective date: 20140820 |
|
| REG | Reference to a national code |
Ref country code: DE Ref legal event code: R097 Ref document number: 602007038261 Country of ref document: DE |
|
| PG25 | Lapsed in a contracting state [announced via postgrant information from national office to epo] |
Ref country code: PL Free format text: LAPSE BECAUSE OF FAILURE TO SUBMIT A TRANSLATION OF THE DESCRIPTION OR TO PAY THE FEE WITHIN THE PRESCRIBED TIME-LIMIT Effective date: 20140820 Ref country code: LU Free format text: LAPSE BECAUSE OF FAILURE TO SUBMIT A TRANSLATION OF THE DESCRIPTION OR TO PAY THE FEE WITHIN THE PRESCRIBED TIME-LIMIT Effective date: 20141024 Ref country code: MC Free format text: LAPSE BECAUSE OF FAILURE TO SUBMIT A TRANSLATION OF THE DESCRIPTION OR TO PAY THE FEE WITHIN THE PRESCRIBED TIME-LIMIT Effective date: 20140820 |
|
| REG | Reference to a national code |
Ref country code: CH Ref legal event code: PL |
|
| PLBE | No opposition filed within time limit |
Free format text: ORIGINAL CODE: 0009261 |
|
| STAA | Information on the status of an ep patent application or granted ep patent |
Free format text: STATUS: NO OPPOSITION FILED WITHIN TIME LIMIT |
|
| PG25 | Lapsed in a contracting state [announced via postgrant information from national office to epo] |
Ref country code: BE Free format text: LAPSE BECAUSE OF NON-PAYMENT OF DUE FEES Effective date: 20141031 |
|
| 26N | No opposition filed |
Effective date: 20150521 |
|
| GBPC | Gb: european patent ceased through non-payment of renewal fee |
Effective date: 20141120 |
|
| REG | Reference to a national code |
Ref country code: IE Ref legal event code: MM4A |
|
| PG25 | Lapsed in a contracting state [announced via postgrant information from national office to epo] |
Ref country code: CH Free format text: LAPSE BECAUSE OF NON-PAYMENT OF DUE FEES Effective date: 20141031 Ref country code: LI Free format text: LAPSE BECAUSE OF NON-PAYMENT OF DUE FEES Effective date: 20141031 |
|
| REG | Reference to a national code |
Ref country code: FR Ref legal event code: PLFP Year of fee payment: 9 |
|
| PG25 | Lapsed in a contracting state [announced via postgrant information from national office to epo] |
Ref country code: IE Free format text: LAPSE BECAUSE OF NON-PAYMENT OF DUE FEES Effective date: 20141024 Ref country code: GB Free format text: LAPSE BECAUSE OF NON-PAYMENT OF DUE FEES Effective date: 20141120 |
|
| PG25 | Lapsed in a contracting state [announced via postgrant information from national office to epo] |
Ref country code: SI Free format text: LAPSE BECAUSE OF FAILURE TO SUBMIT A TRANSLATION OF THE DESCRIPTION OR TO PAY THE FEE WITHIN THE PRESCRIBED TIME-LIMIT Effective date: 20140820 |
|
| PG25 | Lapsed in a contracting state [announced via postgrant information from national office to epo] |
Ref country code: CY Free format text: LAPSE BECAUSE OF FAILURE TO SUBMIT A TRANSLATION OF THE DESCRIPTION OR TO PAY THE FEE WITHIN THE PRESCRIBED TIME-LIMIT Effective date: 20140820 |
|
| PG25 | Lapsed in a contracting state [announced via postgrant information from national office to epo] |
Ref country code: MT Free format text: LAPSE BECAUSE OF FAILURE TO SUBMIT A TRANSLATION OF THE DESCRIPTION OR TO PAY THE FEE WITHIN THE PRESCRIBED TIME-LIMIT Effective date: 20140820 Ref country code: BE Free format text: LAPSE BECAUSE OF FAILURE TO SUBMIT A TRANSLATION OF THE DESCRIPTION OR TO PAY THE FEE WITHIN THE PRESCRIBED TIME-LIMIT Effective date: 20140820 Ref country code: HU Free format text: LAPSE BECAUSE OF FAILURE TO SUBMIT A TRANSLATION OF THE DESCRIPTION OR TO PAY THE FEE WITHIN THE PRESCRIBED TIME-LIMIT; INVALID AB INITIO Effective date: 20071024 Ref country code: TR Free format text: LAPSE BECAUSE OF FAILURE TO SUBMIT A TRANSLATION OF THE DESCRIPTION OR TO PAY THE FEE WITHIN THE PRESCRIBED TIME-LIMIT Effective date: 20140820 |
|
| REG | Reference to a national code |
Ref country code: FR Ref legal event code: PLFP Year of fee payment: 10 |
|
| REG | Reference to a national code |
Ref country code: FR Ref legal event code: PLFP Year of fee payment: 11 |
|
| REG | Reference to a national code |
Ref country code: FR Ref legal event code: PLFP Year of fee payment: 12 |
|
| P01 | Opt-out of the competence of the unified patent court (upc) registered |
Effective date: 20230529 |
|
| PGFP | Annual fee paid to national office [announced via postgrant information from national office to epo] |
Ref country code: FR Payment date: 20231023 Year of fee payment: 17 Ref country code: DE Payment date: 20231222 Year of fee payment: 17 |