EP2016371B1 - Apparatus and method for monitoring and controlling detection of stray voltage anomalies - Google Patents
Apparatus and method for monitoring and controlling detection of stray voltage anomalies Download PDFInfo
- Publication number
- EP2016371B1 EP2016371B1 EP06851981.8A EP06851981A EP2016371B1 EP 2016371 B1 EP2016371 B1 EP 2016371B1 EP 06851981 A EP06851981 A EP 06851981A EP 2016371 B1 EP2016371 B1 EP 2016371B1
- Authority
- EP
- European Patent Office
- Prior art keywords
- electric field
- display
- vehicle
- plot
- image data
- Prior art date
- Legal status (The legal status is an assumption and is not a legal conclusion. Google has not performed a legal analysis and makes no representation as to the accuracy of the status listed.)
- Active
Links
- 238000000034 method Methods 0.000 title claims description 20
- 238000001514 detection method Methods 0.000 title description 28
- 238000012544 monitoring process Methods 0.000 title description 15
- 230000005684 electric field Effects 0.000 claims description 51
- 238000005259 measurement Methods 0.000 claims description 24
- 239000000523 sample Substances 0.000 claims description 20
- 238000012545 processing Methods 0.000 claims description 13
- 230000003044 adaptive effect Effects 0.000 claims description 8
- 230000008569 process Effects 0.000 claims description 5
- 230000001360 synchronised effect Effects 0.000 claims description 4
- 238000005070 sampling Methods 0.000 description 6
- 238000004891 communication Methods 0.000 description 5
- 238000007689 inspection Methods 0.000 description 5
- 238000012552 review Methods 0.000 description 5
- 230000000007 visual effect Effects 0.000 description 5
- 230000005540 biological transmission Effects 0.000 description 4
- 230000033001 locomotion Effects 0.000 description 4
- 239000000872 buffer Substances 0.000 description 3
- 230000008901 benefit Effects 0.000 description 2
- 230000008859 change Effects 0.000 description 2
- 238000013480 data collection Methods 0.000 description 2
- 238000003384 imaging method Methods 0.000 description 2
- 230000004044 response Effects 0.000 description 2
- 238000012935 Averaging Methods 0.000 description 1
- 241001465754 Metazoa Species 0.000 description 1
- 230000009471 action Effects 0.000 description 1
- 230000009286 beneficial effect Effects 0.000 description 1
- 230000002457 bidirectional effect Effects 0.000 description 1
- 230000001413 cellular effect Effects 0.000 description 1
- 238000004590 computer program Methods 0.000 description 1
- 239000004020 conductor Substances 0.000 description 1
- 238000010586 diagram Methods 0.000 description 1
- 238000010292 electrical insulation Methods 0.000 description 1
- 230000005670 electromagnetic radiation Effects 0.000 description 1
- 230000007613 environmental effect Effects 0.000 description 1
- 238000012986 modification Methods 0.000 description 1
- 230000004048 modification Effects 0.000 description 1
- 230000003472 neutralizing effect Effects 0.000 description 1
- 238000007781 pre-processing Methods 0.000 description 1
- 230000000306 recurrent effect Effects 0.000 description 1
- 239000013589 supplement Substances 0.000 description 1
- 230000002123 temporal effect Effects 0.000 description 1
- 230000002463 transducing effect Effects 0.000 description 1
- 238000013024 troubleshooting Methods 0.000 description 1
- 238000012795 verification Methods 0.000 description 1
- XLYOFNOQVPJJNP-UHFFFAOYSA-N water Substances O XLYOFNOQVPJJNP-UHFFFAOYSA-N 0.000 description 1
Images


Classifications
-
- G—PHYSICS
- G01—MEASURING; TESTING
- G01R—MEASURING ELECTRIC VARIABLES; MEASURING MAGNETIC VARIABLES
- G01R29/00—Arrangements for measuring or indicating electric quantities not covered by groups G01R19/00 - G01R27/00
- G01R29/12—Measuring electrostatic fields or voltage-potential
- G01R29/14—Measuring field distribution
-
- G—PHYSICS
- G01—MEASURING; TESTING
- G01R—MEASURING ELECTRIC VARIABLES; MEASURING MAGNETIC VARIABLES
- G01R29/00—Arrangements for measuring or indicating electric quantities not covered by groups G01R19/00 - G01R27/00
- G01R29/12—Measuring electrostatic fields or voltage-potential
Definitions
- the present invention relates to the detection of electric fields. More particularly, the present invention is directed to an apparatus and method employing a video graphical user interface configured to enhance mobile detection and monitoring of stray voltage anomalies.
- stray voltages may present themselves when objects, such as manhole covers, gratings, street light poles, phone booths and the like become electrically energized (e.g., at 120V AC).
- An electrically conductive path may be established between underground secondary network cabling and these objects through physical damage to electrical insulation resulting in direct contact between electrically conductive elements or through the introduction of water acting as a conductor.
- a radiating object e.g., manhole cover or light pole
- a receiving "antenna” should be 11 ⁇ 2 to 2 wavelengths away from the emitting source (about 6,214 miles).
- Two wavelengths is the distance required for electric and magnetic fields to come into time phase and space quadrature where they behave as a plane wave.
- a detection system will typically be perhaps 10 ft. to 30 ft. away from the energized object, so that detection will take place in the extreme near field where electric and magnetic fields exist in a complex temporal and spatial pattern, not as a unified electromagnetic plane wave. Thus, electric and magnetic fields must be considered and measured separately.
- Techniques for the detection of stray voltages are typically carried out by manual inspection of surrounding electrical infrastructures for signs of leaking current as disclosed in US Patent Application No. 2005/0122188 to Zank .
- An inspection team equipped, for example, with hand held detection devices may be employed to make direct physical inspections of electrical infrastructures.
- inspectors using these detection devices are typically required to make contact with portions of electrical infrastructures, such as streetlamp bases or manhole covers, in order to obtain accurate measurements for determining the existence of potentially dangerous stray voltages.
- These manual inspections are undoubtedly time-consuming and give a false sense of security.
- a mobile stray voltage detection system integrated with a user-controllable monitoring interface, wherein the user interface is a video based graphical user interface configured to enhance the detection of stray voltage anomalies.
- Input to the mobile stray voltage detection system is provided by at least one vehicle mounted sensor probe, which is sensitive to the presence of an electric field in at least one axis.
- vehicle mounted sensor probe system is described, for example, in commonly owned U.S. Patent Application Nos. 11/224,909 and 11/224,910 .
- the vehicle is additionally mounted with at least one camera unit for recording a scene being patrolled for stray voltage anomalies using the vehicle mounted sensor probe.
- Intensity of electric field signals are communicated to an operator through means of an audio tone that is pitch proportional to strength of the field detected, as well as through a visual display, both user communication means being controllable through the user interface.
- Distance traveled by the vehicle, as well as GPS positions of the vehicle throughout various points of the vehicle's travel, are also provided as input to the mobile stray voltage detection system in order to tag the location of measured electric fields and further assist the operator in isolating an anomaly-emitting source.
- the graphical user interface provides a video display for depicting a graphical representation of the electric field signal strength and corresponding video image of a patrolled scene.
- Vehicle mounted camera units present video images of the passing scene on the video display portion of the user interface.
- Signals measured by the sensor probe are analyzed by a processing unit to produce a "moving chart" graphical display of the electric field strength.
- the graphical display of the measured field strength are associated with and overlaid on the video images of the patrolled scene, thereby assisting a user to isolate and associate the source of the stray voltage anomaly to specific infrastructures depicted in the patrolled scene.
- the present invention is directed towards a mobile apparatus and method for monitoring and controlling the detection of stray voltage anomalies in a patrolled environment.
- a mobile apparatus and method for monitoring and controlling the detection of stray voltage anomalies in a patrolled environment For purposes of clarity, and not by way of limitation, illustrative depictions of the present invention are described with references made to the above-identified drawing figures. Various modifications obvious to one skilled in the art are deemed to be within the scope of the present invention.
- apparatus 100 is comprised of a detection system unit (DSU) 102 , which may receive electric field measurements from sensor probes 104a, 104b and 104c.
- DSU 102 may employ any number of sensor probes for purposes of measuring an electric field in any particular area of interest being surveyed for stray voltage anomalies.
- DSU 102 may employ only one of said sensor probes 104a, 104b or 104c, additional sensor probes to supplement the measurements obtained by sensor probes 104a, 104b and 104c or, alternatively, any other suitable combination of sensor probes.
- DSU 102 may employ a multi-axis sensor probe arrangement as the ones described, for example, in commonly owned U.S. Patent Application Nos. 11/224,909 and 11/224,910 .
- Apparatus 100 of FIG. 1 is additionally comprised of imaging system unit (ISU) 106 , which may receive video input from cameras 108a and 108b. Similar to DSU 102 , ISU 106 may employ any number of cameras suitable for providing streaming images of a patrolled scene. Cameras employed in apparatus 100 may be video cameras, stereo cameras, various digital cameras, a combination of the aforementioned cameras or any other suitable camera and arrangement of cameras suitable for imagining a patrolled scene.
- ISU imaging system unit
- One or more of cameras 108 may be provided for imaging the environs where apparatus 100 is employed. Specifically, where apparatus 100 is deployed on a patrol vehicle or trailer (not shown), cameras 108a and 108b may be provided thereon, wherein camera 108a is directed to view in a direction about 90° to the left of the direction of travel and camera 108b is directed to view about 90° to the right of the direction of travel, so that images of what is present to the left and to the right of the patrolling vehicle are obtained. Video images therefrom may be recorded as apparatus 100 traverses a patrolled environment.
- Video images may be obtained at a standard video rate, e.g., at 30 or 60 frames per second, but may be at much slower rates, e.g., one or two frames per second, consistent with the speeds at which the patrolling vehicle moves. For example, if a vehicle is moving at between 10 and 20 mph (about 14-28 feet per second or about 4.2-8.5 m/sec.), video at a two frames per second video rate would provide a new image for approximately each 14 feet (about 4.2 m) or less of travel, which should be sufficient to identify the location at which the stray voltage was detected.
- the video images may all be recorded (stored) or only selected images may be recorded.
- video images are stored in a video frame data buffer having a capacity to store a substantial number of frames of video data, e.g., frames representing about thirty (30) seconds of video scenes. As each new frame is stored, the oldest previous frame is lost. Thus, the video data buffer contains video frames for the most recent thirty seconds.
- Video buffers storing frames representing a longer period of time, or even a shorter period of time may be employed.
- a "frame grabber" card in the form of a PCMCIA card or an internal card, may be employed to synchronize processed electric field data DSU 102 with processed video data from ISU 106 .
- DSU 102 and ISU 106 are coupled to a processor 110 .
- DSU 102 and ISU 106 may perform preprocessing of signals received, respectively, from sensor probes 104a-104c and cameras 108a-108b or, as previously described, any alternative arrangements of sensor probes and cameras prior to transmitting data to processor 110 .
- Processor 110 coupled to DSU 102 and ISU 106 is capable of processing sensor probe measurement data and corresponding video frame data in near real time (e.g., with less than one second latency).
- processor 110 may be arranged to interface directly to a three-axis stray voltage sensing probe arrangement, as described in U.S. Patent Application Nos. 11/224,909 and 11/224,910 .
- Processor 110 may include a plurality of electronic components (not shown) such as a multi-channel analog-to-digital converter (ADC), a digital signal processor (DSP), a memory (e.g., an EEPROM), an audio amplifier, audible transducing device (e.g., a loudspeaker), one or more data converters (e.g., uni-directional or bidirectional SPI to RS-232 converters), a source of electrical power (e.g., a power converter operating from a vehicle power system) or any other applicable electronic processing component.
- ADC analog-to-digital converter
- DSP digital signal processor
- a memory e.g., an EEPROM
- an audio amplifier e.g., an EEPROM
- audible transducing device e.g., a loudspeaker
- one or more data converters e.g., uni-directional or bidirectional SPI to RS-232 converters
- a source of electrical power e.g.
- a wheel speed sensor 112 In addition to DSU 102 and ISU 106 , a wheel speed sensor 112 , a global positioning system (GPS) receiver 114 , a memory component 116 , a transceiver component 118 and a graphical user interface (GUI) 120 may also be coupled to processor 110 . Data pertaining to the speed and distance of travel of a patrolling vehicle may be provided to processor 110 by wheel speed sensor 112 . Wheel speed sensor 112 is employed in the processing of electric field data to facilitate signal processing while apparatus 100 is in motion as described herein.
- GPS global positioning system
- GUI graphical user interface
- GPS receiver 114 may be configured to provide a location reference including latitude, longitude, elevation, time and date about once per second so that the location is known to a reasonably high precision.
- GPS position data may be exported to a conventional GPS mapping software for utilization and then stored, for example, in memory component 116 , so that there is a stored precision location and time reference associated with the stored electric field measurements.
- Memory component 116 may additionally be utilized to store, temporarily or permanently, other data pertaining to electric field measurements, video images or any other data associated with the stray voltage detection process described and referenced herein.
- apparatus 100 may be operated in urban/city environments where buildings and other obstacles distort and/or block signals from a GPS satellite system from reaching GPS receiver 114 via a direct path, GPS location information may have degraded accuracy, or may not be available.
- wheel speed sensor 112 may be provided as a suitable substitute for highly accurate GPS location information, or may be utilized in conjunction therewith.
- the GPS location data provides a record of the location at which each detected stray voltage anomaly was detected and the time thereof, as may be desired for subsequent analysis, for example, for reviewing the location of the anomaly and identifying the emitting source in the patrolled environment. Since the peak of a response to a source of stray voltage can not be ascertained until after the patrolling vehicle has passed the source, the exact location of the source may not be observed until after the time at which it is detected (i.e. until after it is passed).
- Transceiver component 118 may be configured to transmit and receive data transmissions to and from remote transceivers.
- Transceiver component 118 may be transceivers of the type that are compatible with Wi-Fi standard IEEE 802.11, BLUETOOTHTM enabled, a combination of local area network (LAN), wide area network (WAN), wireless area network (WLAN), personal area network (PAN) standards or any other suitable combination of communication means to permit robust wireless transmission of data.
- transceiver component 118 may be a BLUETOOTHTM enabled device, thereby providing a means for communicating stray voltage related information between mobile apparatus 100 and a remote device, such as a personal digital assistants (PDAs), cellular phones, notebook and desktop computers, printers, digital cameras or any other suitable electronic device, via a secured short-range radio frequency.
- a utility member equipped with the remote device configured to receive the stray voltage related communication may be dispatched to a site determined to have a potential stray voltage anomaly for purposes of neutralizing the anomaly.
- the aforementioned are provided merely as exemplary means for wireless transmission of stray voltage related data. Other suitable wireless transmission and receiving means may be employed in the present invention.
- An optional laptop computer (not shown) or other suitable computing system having a display provides GUI 120 for an operator to control the operation of apparatus 100 , particularly measurement and processing components associated with sensor probes 104 , and to monitor electric field data as measured. For example, an operator may adjust the values of the constants and scaling factors utilized in the detection and averaging processing for producing an audible alarm (described in detail below).
- the laptop computer may also provide a convenient means for storing a record or log of the measured field and location (GPS) data for subsequent review and/or analysis, as might be desired for determining when and where a stray voltage anomaly existed.
- GPS measured field and location
- GUI 120 receives data, directly or indirectly, from various components described in conjunction with apparatus 100 and, accordingly, displays them to the operator for purposes of controlling and monitoring the detection of stray voltage anomalies present in patrolled areas.
- GUI 120 is a video based interface having a video display 122. The data provided to GUI 120 provides the interface operator with an opportunity to visually monitor and analyze incoming data measured by a stray voltage detection system on video display 122.
- FIGS. 2-13 illustrate exemplary displays that may be provided on video display 122 of GUI 120 for monitoring and controlling the operation of apparatus 100.
- GUI 120 is provided on a computer, preferably a laptop computer for purposes of mobility.
- a computer program for providing GUI 120 will initialize a main display 200 , as illustrated in FIG. 2 .
- Main display 200 provides an interface user with a real-time monitoring environment of the area being patrolled for stray voltage anomalies.
- Main display 200 may be comprised of a video display 202 and a control panel 204.
- Real-time electric field measurements and video frames of the patrolled environment may be provided in video display 202 , which is supplemented with a graphical plot having an x-axis 202x indicative of the linear distance traveled by the patrol vehicle versus a y-axis 202y indicative of the signal strength of the measured electric field associated with various locations of the patrol vehicle.
- the interface user may select a run command option 206 provided on display 200.
- Run command option 206 when selected, will prompt for information to be entered in an initial identification screen.
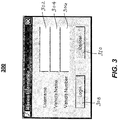
- the initial identification screen may be, for example, system login display 300 of FIG. 3 .
- System login display 300 may request an the interface operator to provide a username in field 302 , a patrol vehicle name in field 304 and a patrol vehicle number in field 306 for purposes of authorizing access to the operational and monitoring controls of apparatus 100 .
- the interface operator may then select login command option 308 to proceed with system verification of authorized access to apparatus 100 .
- the interface operator may select cancel command option 310 to terminate login procedures for apparatus 100 .
- main display 200 is populated with sensor data, as illustrated in the main display of FIG. 4 .
- Sensor data is provided on video display 202 , which may be provided in a split screen format for displaying multiple video image frames (one from each camera).
- a split screen view 402 may display video image frames received from camera 108a
- a split screen view 404 may display corresponding video image frames received from camera 108b , or vice versa.
- a patrol vehicle may be equipped with cameras 108a and 108b positioned on opposing sides for providing corresponding video image frames from both sides of the patrol vehicles path of travel.
- main display 200 of FIG. 4 is shown with two split screens 402 and 404 , additional split screens may be incorporated into video display 202 for an apparatus utilizing more than two cameras.
- Adaptive threshold plot 408 is generated from data gathered before and after the raw voltage was sensed by sensor probes 104a-104c .
- Smoothed plot 410 is a smoothed version of plot 406 that has been filtered to remove spurious content. A potential stray voltage is indicated when smoothed plot 410 exceeds adaptive threshold plot 408 .
- Control panel 204 of main display 200 provides the interface operator with a plurality of monitoring and control options.
- An enlarged view of control panel 204 is provided and described in connection with FIG. 5 .
- Control panel 204 may include a system monitor indicator 502 , an audio threshold indicator 504 and an audio snooze indicator 506.
- a clear command option 508 a suspend command option 510 , a preferences command option 512 , an event capture command option 514 and a stop command option 516 are provided to the interface operator in control panel 204.
- Control panel 204 may also provide information in a latitude display 518 , a longitude display 519 , an address display 520 , a signal strength display 522 , a speed display 524 and a time stamp display 526.
- Indicators 502 , 504 and 506 may be visual indicators, configured to change color or blink upon satisfaction of preprogrammed criteria.
- System monitor indicator 502 may be a green color when operating within system specifications.
- system monitor indicator 502 may turn yellow to notify the interface operator that their exists a problem, such as, lack of a GPS signal. In this case, no latitude, longitude or address information may be shown, respectively, in displays 518 , 519 and 520.
- Another potential trigger indicative of a problem is lack of video or electric field measurement data, wherein there would be no video image frame or measurement readings on video display 202.
- Other potential problems that may trigger indicator 502 may be depleted disk space for recording captured events (described in detail below) or loss of communication between processor 110 and GUI 120.
- an audible tone output signal having a pitch that is proportional to the signal strength of the measured electric field may be provided as a tool in conjunction with the monitoring capabilities provided in GUI 120 to aid the interface operator in determining the source and potential danger of stray voltage anomalies.
- An audio threshold value that is indicative of the minimum voltage level required to trigger an audible notification tone is desired.
- an optimum audio alert value for identifying stray voltage anomalies, while minimizing the number of false detections may be preset as a default value. Default settings may be represented by audio threshold indicator 504 being, for example, a green color.
- the interface operator may adjust the default threshold settings provided in connection with the audible notification tone if too much noise is being picked up.
- preferences command option 512 provided on control panel 204
- the interface operator could be provided with a preferences display 600 , as illustrated in FIG. 6 , for modifying values associated with the audible tone.
- the interface operator could raise the threshold value, using audio threshold increase button 602 and decrease button 604 , to minimize or eliminate false audible tones being generated due to a noisy environment in a patrolled environment.
- Any changes made to the default audible threshold value in preferences display 600 may be represented by audible threshold indicator 504 on control panel 204 turning yellow. The change in color informs the interface operator that the audible notification tone is operating according to user defined values, not system defined default values.
- Audio snooze time option 606 specifies in seconds how long audio alerts are suspended when a snooze button 506 is pushed.
- Snooze button 506 may be green when default values are provided in the display of snooze time option 606 of preferences display 600 .
- snooze button 506 may also include a color indicator that changes, for example, to yellow when the default snooze time has been changed in preferences display 600.
- Toggle switches 608 and 610 permit the interface operator to adjust, respectively, the scale used in x-axis 202x , which measures in feet the distance traveled since the last event capture, and y-axis 202y , which measures in decibels the electric field signal strength, on video display 202.
- Trace option 614 when selected, allows for the logarithmic scaling of all y-axis 202 values in order to ensure that values are easily readable and that entire plot lines appear within video display 202 of main display 200.
- DSP string option 616 may be provided as a means for displaying processing related data, when selected, to troubleshooting apparatus 100 .
- Default values for system preferences identified in display 600 may be restored by selecting a restore defaults command option 618 . Otherwise defined preferences may be saved and executed by selecting an "OK" command option 620 . Alternatively, if the interface operator decides not to make any changes, then a "CANCEL" command option 622 may be selected. Selection of either command option 620 or 622 will return the interface operator to display 200 .
- streaming synchronized data of the electric field strength overlaid on the corresponding video frames of the scene being traversed at the time of measurement may be displayed to the interface operator on video display 202 of main display 200 .
- corresponding latitude and longitude information related to the patrolling vehicle is received by GPS receiver 114 and provided, respectively, to display fields 518 and 519 .
- An address corresponding to the latitude and longitude readings provided in display fields 518 and 519 may also be provided in display field 520 .
- a signal strength value may be provided in display field 522 .
- the speed of the patrol vehicle may be presented in display field 524 , along with a current data and time stamp in display field 526 .
- the interface operator may temporarily suspend data sampling at any time by selecting a suspend command option 510 , clear received data by selecting a clear command option 508 or exit GUI 120 system entirely by selecting a stop command option 516 provided on control panel 204 of main display 200 .
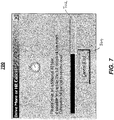
- variable-pitch alert configured for alerting the interface operator of detected fluctuations and/or spikes in measured electric field readings that exceed a defined threshold. Therefore, when a potential anomaly is detected, represented for example by a rise-peak-fall in the alert pitch, a corresponding visual spike in raw voltage plot 406 , a high signal strength value in display field 522 or a combination thereof, interface operator may select an event capture command option 514 for purposes of gathering additional information to review the potentially detected stray voltage anomaly.
- Data collection display 700 prompts the interface operator to continue driving the patrol vehicle for a predefined distance (e.g., an additional 40 feet after selection of event capture command option 514 ) in order to collect enough data sampling information to fully analyze the background noise associated with the captured event.
- a progress bar 702 may be provided in display 700 to inform the interface user of the remaining distance of travel required.
- the interface operator may stop the collection of streaming data by GUI 120 and proceed to event capture display 800 for analyzing the captured event.
- the collection of streaming data may be stopped or paused by stopping the patrol vehicle.
- collection of additional information pertaining to the captured event may be optionally terminated earlier, through selection of a cancel command option 704 , to permit the interface operator to proceed to review the captured event on event capture display 800 without collection of additional information.
- processing of data related to the event capture may be processed (e.g. by processor 110 ) and a second distinctive alert tone (e.g., a chime-like sound) may be presented to the interface operator if it is determined that the processed captured measurement is not a false alarm. Thereupon, the interface operator could further examine the potential detected anomaly in event capture display 800 , as illustrated in FIG. 8 .
- event capture display 800 provides a video display 802 and a playback control panel 804.
- Scene scroll tabs 803a and 803b may be provided on opposing sides of display 802 to permit the interface operator to view captured video images and their corresponding electric field measurements throughout various positions traversed by the patrol vehicle.
- Event capture display 800 may also provide a pinpoint indicator 801 that may be positioned on any part of the video display 802 to display data and video for a different location.
- Data displayed in playback control panel 804 corresponds to the applied position of indicator 801 .
- the interface operator would like to view measurement and video data associated with a position 225 feet prior in motion, the interface operator could use scene scroll tabs 803a and 803b to move pinpoint indicator 801 to the desired location on video display 802 .
- Event capture display 800 allows the interface operator to more closely examine potentially detected anomalies by providing playback analysis of the captured event. More specifically, the interface operator may compare raw voltage plot 406 and adaptive threshold plot 408 to assist in identifying the object displayed in the corresponding image frame that is most likely to be the source of the anomaly. In event capture display 800 , the three plot lines may be aligned to permit the interface operator to look for points where smoothed plot 410 exceeds adaptive threshold plot 408 . This indicates that there exists a spike above the averaged background noise and, therefore, the existence of an anomaly.
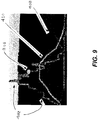
- FIG. 9 Enlarged views of a detected stray voltage anomaly as it may be provided on video display 802 of event capture display 800 of FIG. 8 is illustrated in conjunction with FIGS. 9-10 .
- pinpoint indicator 801 is positioned near the peak of spike in raw voltage plot 406. All related sensor data related to this particular position is provided to the interface operator on playback control panel 804 .
- smoothed plot 410 exceeds adaptive threshold plot 408 , indicative of a potentially dangerous anomaly in the captured scene.
- pinpoint indicator 801 is positioned over the peak of a spike, the object most centered in a video frame on video display 802 is likely the source of the detected anomaly.
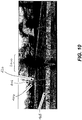
- An isolated enlarged view as illustrated in FIG.
- the video image frame shown on video display 802 of event capture display 800 may be provided, wherein it can be seen that an object 1000 most centered in the video frame is likely the source of the detected anomaly.
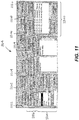
- the video image frame may be isolated and enlarged by selecting a full screen command option 1106 ( FIG. 11 ) from playback control panel 804 .
- Event capture control panel 804 is comprised of a play command option 1102 , a pause command option 1104 , a full screen command option 1106 , a preferences option 1108 and a main display option 1110.
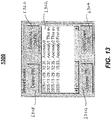
- Play command option 1102 may allow the interface operator to play a video clip selected from a saved events section 1300.
- pause command option 1104 may allow the interface operator to pause playback of the video clip selected from saved events section 1300.
- Full screen command option 1106 may allow the interface operator to toggle between full-sized video images and regular-sized video images provided on display 802.
- Preferences command option 1108 may provide the interface operator with additional playback and review options not shown on playback control panel 804.
- command option 1108 when selected, may provide preferences related to wireless communication of captured events to dispatch a remote crew.
- Main display option 1110 may allow the interface operator to return to main display 200.
- a disable plotting option 1112 may also be provided, wherein the plots may be removed for a clearer view of scene objects displayed on video display 802 when option 1112 is selected.
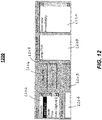
- the interface operator may then proceed to record object related information in an objects section 1200 of playback control panel 804.
- An environmental object or infrastructure name may be listed in a predefined objects scroll menu 1202 or may be defined by the interface operator using an object identification field 1204.
- the interface operator may then add the object identified in menu 1202 or field 1204 to a selected object field 1208 using, respectively, an add command option 1206 or an add command option 1203.
- An added object identified in field 1208 may also be removed by selecting a remove command option 1207. Additional notes, comments and instructions may be provided by the interface operator using a comments field 1210.
- the interface operator may identify a lamp post, in field 1208 , as the potential source of a detected stray voltage anomaly and instruct, in field 1210 , the need for a utility crew to be dispatched immediately to the site to neutralize the source.
- GUI 120 is configured so that if multiple objects are determined to be present in a scene where an anomaly was detected, the interface operator may identify the multiple objects in field 1208. The interface operator may then select a save event command option 1114 to record the identified object source of the anomaly, associated comments regarding the anomaly and anomaly location information 1116 for future reference and analysis of the captured anomaly event. Thereafter, the interface operator may return to main display 200 , via command option 1110 , and restart movement of the patrol vehicle to restart data sampling of the scene being traversed.
- Captured events that have been previously saved by the interface operator may be viewed by selecting a saved event file from an events listing 1302 available in section 1300 of playback control panel 804.
- the interface operator may select the desired event and then select a load event command option 1304.
- display 800 is populated with all data related to the selected event (e.g., location information, object identification, comments, captured video image frame and corresponding measurement data).
- the interface operator may move the pinpoint indicator 801 to the desired starting location on video display 802 in which he/she wishes to begin viewing and select play command option 1102.
- Information that has been populated, for example, into section 1200 may be edited. For instance, if it is determined that an object previously identified as the source of a stray voltage anomaly is not indeed the source of the anomaly, field 1208 may be edited using commands 1206 and 1207 to, respectively, add a new source and remove the inaccurate source. Once changes have been made, the interface operator may select an update command option 1306 to have the new information saved in connection with the previously saved event.
- apparatus 100 may be configured to generate a database entry for the saved event and create separate files for video and corresponding sensor related data.
- apparatus 100 may be configured to create an AVI file for storing video images and an XML file for storing all other sensor related data. These files may be saved on a hard disk (e.g., memory component 116 ) and retrieved when the corresponding event is selected and loaded using playback control panel 804 on event capture display 800. If it is determined that saved events are no longer needed or have been archived elsewhere, or alternatively, if additional storage space is needed in apparatus 100, the interface operator may delete command options 1308 and 1310 provided on section 1300 of playback control panel 804.
- FIG. 14 An illustrative depiction of the general steps employed in use of VGUI 120 of apparatus 100 for monitoring and controlling the detection of a stray voltage anomaly is described with reference to the flowchart of FIG. 14 .
- the monitoring of streaming data displayed on video display 122 of GUI 120 is initiated, at step 1402 , by providing user login information at step 1404 . If the login information provided at display 300 of FIG. 3 is determined to be for an authorized user, then VGUI 120 may begin to sample data and provide a visual output of streaming data, at step 1408 , on main display 200 , which may be driven by movement of the patrol vehicle equipped with apparatus 100 .
- GUI 120 of apparatus 100 may audibly, via a variable-pitched alert tone, and visually, via a spike in plots provided on graphical video display 202 , prompt the interface operator upon detection of a stray voltage anomaly at step 1410 .
- interface operator may decide to capture the event by selecting event capture command option 514 provided on control panel 204 of main display 200 .
- additional processing may be executed to collect additional information about the captured event and an additional alert notification may be provided to the interface operator at step 1416 , indicating to the interface operator that the subsequent processing of the captured event is likely a stray voltage anomaly.
- Playback controls are provided to the interface operator, at step 1418 , via control panel 804 on event capture display 800 of FIG. 8 .
- the interface operator may record the event at step 1420 .
- the interface operator may elect to resume data sampling of the area being patrolled at step 1424 , thereby reinitiating the receipt of streaming data at main display 200.
- GUI 120 may go into a standby mode, at step 1426 , if no action is taken after a predetermined amount of time or, alternatively, if the interface operator elects to suspend data sampling by selecting, e.g., suspend command option 510 on control panel 204 of main display 200 .
Landscapes
- Physics & Mathematics (AREA)
- General Physics & Mathematics (AREA)
- Closed-Circuit Television Systems (AREA)
- Testing And Monitoring For Control Systems (AREA)
- Alarm Systems (AREA)
Description
- This patent application claims the benefit of
U.S. Provisional Patent Application No. 60/728,168, filed October 19, 2005 - The present invention relates to the detection of electric fields. More particularly, the present invention is directed to an apparatus and method employing a video graphical user interface configured to enhance mobile detection and monitoring of stray voltage anomalies.
- Large power distribution systems, especially those in large metropolitan areas, are subject to many stresses, which may occasionally result in the generation of undesirable or dangerous anomalies. An infrequent, but recurrent problem in power distribution infrastructures is the presence of "stray voltages" in the system. These stray voltages may present themselves when objects, such as manhole covers, gratings, street light poles, phone booths and the like become electrically energized (e.g., at 120V AC). An electrically conductive path may be established between underground secondary network cabling and these objects through physical damage to electrical insulation resulting in direct contact between electrically conductive elements or through the introduction of water acting as a conductor. These energized objects present obvious dangers to people and animals in the general public.
- Detecting the existence of stray voltages by means of assessing electromagnetic radiation is not practical because the wavelength of a 60 Hz electromagnetic wave is approximately 5,000 kilometers (i.e., about 3,107 miles) in length. To effectively radiate electromagnetic waves, a radiating object (e.g., manhole cover or light pole) should represent at least 1/4 wavelength (i.e., about 776.75 miles) and a receiving "antenna" should be 1½ to 2 wavelengths away from the emitting source (about 6,214 miles). Two wavelengths is the distance required for electric and magnetic fields to come into time phase and space quadrature where they behave as a plane wave. A detection system will typically be perhaps 10 ft. to 30 ft. away from the energized object, so that detection will take place in the extreme near field where electric and magnetic fields exist in a complex temporal and spatial pattern, not as a unified electromagnetic plane wave. Thus, electric and magnetic fields must be considered and measured separately.
- Due to power distribution networks typically having many miles of buried cable carrying perhaps thousands of amperes of current, the magnetic field in any one location due to such normal load is likely to be very high. Detecting magnetic fields arising from a relatively weak stray voltage anomaly would be very difficult due to the interference from strong ambient magnetic fields arising from normal loads and, therefore, it has been determined that the best way to detect a stray voltage anomaly is to assess the electric field.
- Techniques for the detection of stray voltages are typically carried out by manual inspection of surrounding electrical infrastructures for signs of leaking current as disclosed in
US Patent Application No. 2005/0122188 to Zank . An inspection team equipped, for example, with hand held detection devices may be employed to make direct physical inspections of electrical infrastructures. However, inspectors using these detection devices are typically required to make contact with portions of electrical infrastructures, such as streetlamp bases or manhole covers, in order to obtain accurate measurements for determining the existence of potentially dangerous stray voltages. These manual inspections are undoubtedly time-consuming and give a false sense of security. - Accordingly, there exists a need to provide a more efficient means for detecting and identifying sources of stray voltage anomalies over vast geographic areas, particularly, populated urban, suburban and rural areas.
- In view of the foregoing, it is an object of the present invention to provide a mobile stray voltage detection apparatus and method configured to sense potentially dangerous stray voltage anomalies from a moving vehicle.
- It is another object of the present invention to provide a mobile stray voltage detection apparatus and method configured to provide real-time awareness of detected stray voltage anomalies, thereby enabling rapid and efficient inspection·of surrounding patrolled areas.
- It is yet another object of the present invention to provide a mobile stray voltage detection apparatus and method configured to provide accurate location and visual identification of potential hazards.
- These and other objects of the present invention are accomplished in accordance with the principles of the present invention by providing a mobile stray voltage detection system integrated with a user-controllable monitoring interface, wherein the user interface is a video based graphical user interface configured to enhance the detection of stray voltage anomalies. Input to the mobile stray voltage detection system is provided by at least one vehicle mounted sensor probe, which is sensitive to the presence of an electric field in at least one axis. Such a vehicle mounted sensor probe system is described, for example, in commonly owned
U.S. Patent Application Nos. 11/224,909 and11/224,910 - In accordance with the present invention, the graphical user interface provides a video display for depicting a graphical representation of the electric field signal strength and corresponding video image of a patrolled scene. Vehicle mounted camera units present video images of the passing scene on the video display portion of the user interface. Signals measured by the sensor probe are analyzed by a processing unit to produce a "moving chart" graphical display of the electric field strength. The graphical display of the measured field strength are associated with and overlaid on the video images of the patrolled scene, thereby assisting a user to isolate and associate the source of the stray voltage anomaly to specific infrastructures depicted in the patrolled scene.
- The above and other objects and advantages of the present invention will become apparent upon consideration of the following detailed description, taken in conjunction with the accompanying drawings, in which like reference characters refer to like parts throughout, and in which:
-
FIG. 1 illustrates a block diagram of an exemplary apparatus suitable for implementing the stray voltage detection methods employed in accordance with an embodiment of the present invention. -
FIG. 2 illustrates an exemplary login display produced by a system in accordance with an embodiment of the present invention. -
FIG. 3 illustrates an exemplary main display produced by a system upon successful logging in of an operator at the illustrative display inFIG. 2 in accordance with an embodiment of the present invention. -
FIG. 4 illustrates the main display ofFIG. 2 depicting streaming data of measured electric fields and corresponding video images of a patrolled scene in accordance with an embodiment of the present invention. -
FIG. 5 illustrates an exploded view of an exemplary monitoring control panel provided on the main displays ofFIGS. 3 and4 in accordance with an embodiment of the present invention. -
FIG. 6 illustrates an exemplary standby display produced by the system upon selection of an event capture option provided on the main displays ofFIGS. 3 and4 in accordance with an embodiment of the present invention. -
FIG. 7 illustrates an exemplary event capture display produced by the system upon completion of the processing for a request to capture an event in accordance with an embodiment of the present invention. -
FIG. 8 illustrates an exploded view of plotted electric field measurements and a location indicator provided on the playback display ofFIG. 7 in accordance with an embodiment of the present invention. -
FIG. 9 illustrates an exploded view of plotted electric field measurements and a potentially electrified source provided on the playback display ofFIG. 7 in accordance with an embodiment of the present invention. -
FIG. 10 illustrates an exploded view of an exemplary playback control panel provided on the event capture display ofFIG. 7 in accordance with an embodiment of the present invention. -
FIG. 11 illustrates an exploded view of an exemplary anomaly identification sub-panel provided on the playback control panel ofFIG. 10 in accordance with an embodiment of the present invention. -
FIG. 12 illustrates an exploded view of an exemplary event log sub-panel provided on the playback control panel ofFIG. 10 in accordance with an embodiment of the present invention. -
FIG. 13 illustrates an exemplary preferences display produced by the system upon selection of a preferences option provided on the displays ofFIGS. 3 ,4 and6 in accordance with an embodiment of the present invention. -
FIG. 14 is a flowchart illustrating the steps employed by the system in monitoring electric fields in accordance with an embodiment of the present invention. - It is to be understood that the above-identified drawing figures are for purposes of illustrating the concepts of the present invention and may not be to scale, and are not intended to be limiting in terms of the range of possible shapes and proportions of the present invention.
- The present invention is directed towards a mobile apparatus and method for monitoring and controlling the detection of stray voltage anomalies in a patrolled environment. For purposes of clarity, and not by way of limitation, illustrative depictions of the present invention are described with references made to the above-identified drawing figures. Various modifications obvious to one skilled in the art are deemed to be within the scope of the present invention.
- An
exemplary apparatus 100 for implementing the present invention is illustrated inFIG. 1 . In accordance with a preferred embodiment of the present invention,apparatus 100 is comprised of a detection system unit (DSU) 102, which may receive electric field measurements fromsensor probes sensor probes sensor probes U.S. Patent Application Nos. 11/224,909 and11/224,910 -
Apparatus 100 ofFIG. 1 is additionally comprised of imaging system unit (ISU) 106, which may receive video input fromcameras DSU 102,ISU 106 may employ any number of cameras suitable for providing streaming images of a patrolled scene. Cameras employed inapparatus 100 may be video cameras, stereo cameras, various digital cameras, a combination of the aforementioned cameras or any other suitable camera and arrangement of cameras suitable for imagining a patrolled scene. - One or more of cameras 108 may be provided for imaging the environs where
apparatus 100 is employed. Specifically, whereapparatus 100 is deployed on a patrol vehicle or trailer (not shown),cameras camera 108a is directed to view in a direction about 90° to the left of the direction of travel andcamera 108b is directed to view about 90° to the right of the direction of travel, so that images of what is present to the left and to the right of the patrolling vehicle are obtained. Video images therefrom may be recorded asapparatus 100 traverses a patrolled environment. - Video images may be obtained at a standard video rate, e.g., at 30 or 60 frames per second, but may be at much slower rates, e.g., one or two frames per second, consistent with the speeds at which the patrolling vehicle moves. For example, if a vehicle is moving at between 10 and 20 mph (about 14-28 feet per second or about 4.2-8.5 m/sec.), video at a two frames per second video rate would provide a new image for approximately each 14 feet (about 4.2 m) or less of travel, which should be sufficient to identify the location at which the stray voltage was detected.
- The video images may all be recorded (stored) or only selected images may be recorded. In one exemplary embodiment, video images are stored in a video frame data buffer having a capacity to store a substantial number of frames of video data, e.g., frames representing about thirty (30) seconds of video scenes. As each new frame is stored, the oldest previous frame is lost. Thus, the video data buffer contains video frames for the most recent thirty seconds. Video buffers storing frames representing a longer period of time, or even a shorter period of time, may be employed. For example, a "frame grabber" card, in the form of a PCMCIA card or an internal card, may be employed to synchronize processed electric
field data DSU 102 with processed video data fromISU 106. -
DSU 102 andISU 106 are coupled to aprocessor 110.DSU 102 andISU 106 may perform preprocessing of signals received, respectively, fromsensor probes 104a-104c andcameras 108a-108b or, as previously described, any alternative arrangements of sensor probes and cameras prior to transmitting data toprocessor 110.Processor 110 coupled toDSU 102 andISU 106 is capable of processing sensor probe measurement data and corresponding video frame data in near real time (e.g., with less than one second latency). For example,processor 110 may be arranged to interface directly to a three-axis stray voltage sensing probe arrangement, as described inU.S. Patent Application Nos. 11/224,909 and11/224,910 Processor 110 may include a plurality of electronic components (not shown) such as a multi-channel analog-to-digital converter (ADC), a digital signal processor (DSP), a memory (e.g., an EEPROM), an audio amplifier, audible transducing device (e.g., a loudspeaker), one or more data converters (e.g., uni-directional or bidirectional SPI to RS-232 converters), a source of electrical power (e.g., a power converter operating from a vehicle power system) or any other applicable electronic processing component. - In addition to
DSU 102 andISU 106, awheel speed sensor 112, a global positioning system (GPS)receiver 114, amemory component 116, atransceiver component 118 and a graphical user interface (GUI) 120 may also be coupled toprocessor 110. Data pertaining to the speed and distance of travel of a patrolling vehicle may be provided toprocessor 110 bywheel speed sensor 112.Wheel speed sensor 112 is employed in the processing of electric field data to facilitate signal processing whileapparatus 100 is in motion as described herein. - Data pertaining to the position of a patrolling vehicle equipped with
GPS receiver 114 may be provided toprocessor 110 to determine exact locations of the patrolling vehicle's path of travel at the time particular electric field measurements were received.GPS receiver 114 may be configured to provide a location reference including latitude, longitude, elevation, time and date about once per second so that the location is known to a reasonably high precision. GPS position data may be exported to a conventional GPS mapping software for utilization and then stored, for example, inmemory component 116, so that there is a stored precision location and time reference associated with the stored electric field measurements.Memory component 116 may additionally be utilized to store, temporarily or permanently, other data pertaining to electric field measurements, video images or any other data associated with the stray voltage detection process described and referenced herein. - Since
apparatus 100 may be operated in urban/city environments where buildings and other obstacles distort and/or block signals from a GPS satellite system from reachingGPS receiver 114 via a direct path, GPS location information may have degraded accuracy, or may not be available. In those cases,wheel speed sensor 112 may be provided as a suitable substitute for highly accurate GPS location information, or may be utilized in conjunction therewith. - Thus, the GPS location data provides a record of the location at which each detected stray voltage anomaly was detected and the time thereof, as may be desired for subsequent analysis, for example, for reviewing the location of the anomaly and identifying the emitting source in the patrolled environment. Since the peak of a response to a source of stray voltage can not be ascertained until after the patrolling vehicle has passed the source, the exact location of the source may not be observed until after the time at which it is detected (i.e. until after it is passed). While having this stray voltage and location data recorded is desirable and beneficial, in a typical service environment, e.g., on a city street, it is not practical to stop the patrolling
vehicle carrying apparatus 100 each time a stray voltage is detected, or to back the vehicle up to ascertain the exact location at which the detection took place. -
Transceiver component 118 may be configured to transmit and receive data transmissions to and from remote transceivers.Transceiver component 118 may be transceivers of the type that are compatible with Wi-Fi standard IEEE 802.11, BLUETOOTH™ enabled, a combination of local area network (LAN), wide area network (WAN), wireless area network (WLAN), personal area network (PAN) standards or any other suitable combination of communication means to permit robust wireless transmission of data. For example,transceiver component 118 may be a BLUETOOTH™ enabled device, thereby providing a means for communicating stray voltage related information betweenmobile apparatus 100 and a remote device, such as a personal digital assistants (PDAs), cellular phones, notebook and desktop computers, printers, digital cameras or any other suitable electronic device, via a secured short-range radio frequency. Thereafter, a utility member equipped with the remote device configured to receive the stray voltage related communication may be dispatched to a site determined to have a potential stray voltage anomaly for purposes of neutralizing the anomaly. It should be noted that the aforementioned are provided merely as exemplary means for wireless transmission of stray voltage related data. Other suitable wireless transmission and receiving means may be employed in the present invention. - An optional laptop computer (not shown) or other suitable computing system having a display provides GUI 120 for an operator to control the operation of
apparatus 100, particularly measurement and processing components associated with sensor probes 104, and to monitor electric field data as measured. For example, an operator may adjust the values of the constants and scaling factors utilized in the detection and averaging processing for producing an audible alarm (described in detail below). The laptop computer may also provide a convenient means for storing a record or log of the measured field and location (GPS) data for subsequent review and/or analysis, as might be desired for determining when and where a stray voltage anomaly existed. - GUI 120 receives data, directly or indirectly, from various components described in conjunction with
apparatus 100 and, accordingly, displays them to the operator for purposes of controlling and monitoring the detection of stray voltage anomalies present in patrolled areas. GUI 120 is a video based interface having avideo display 122. The data provided to GUI 120 provides the interface operator with an opportunity to visually monitor and analyze incoming data measured by a stray voltage detection system onvideo display 122. -
FIGS. 2-13 illustrate exemplary displays that may be provided onvideo display 122 of GUI 120 for monitoring and controlling the operation ofapparatus 100. As previously described, GUI 120 is provided on a computer, preferably a laptop computer for purposes of mobility. Upon start up of GUI 120 ofapparatus 100, for example, by selecting or clicking an icon displayed on the "desktop" provided on a monitor display of a computer, a computer program for providing GUI 120 will initialize amain display 200, as illustrated inFIG. 2 .Main display 200 provides an interface user with a real-time monitoring environment of the area being patrolled for stray voltage anomalies.Main display 200 may be comprised of avideo display 202 and acontrol panel 204. Real-time electric field measurements and video frames of the patrolled environment may be provided invideo display 202, which is supplemented with a graphical plot having an x-axis 202x indicative of the linear distance traveled by the patrol vehicle versus a y-axis 202y indicative of the signal strength of the measured electric field associated with various locations of the patrol vehicle. In order to initiate the detection and monitoring system ofapparatus 100, the interface user may select arun command option 206 provided ondisplay 200. -
Run command option 206, when selected, will prompt for information to be entered in an initial identification screen. The initial identification screen may be, for example,system login display 300 ofFIG. 3 .System login display 300 may request an the interface operator to provide a username infield 302, a patrol vehicle name infield 304 and a patrol vehicle number infield 306 for purposes of authorizing access to the operational and monitoring controls ofapparatus 100. When the required information has been provided by the interface operator infields login command option 308 to proceed with system verification of authorized access toapparatus 100. Similarly, the interface operator may select cancelcommand option 310 to terminate login procedures forapparatus 100. - Upon a successful login at
display 300, data sampling is initiated andmain display 200 is populated with sensor data, as illustrated in the main display ofFIG. 4 . Sensor data is provided onvideo display 202, which may be provided in a split screen format for displaying multiple video image frames (one from each camera). Asplit screen view 402 may display video image frames received fromcamera 108a, while asplit screen view 404 may display corresponding video image frames received fromcamera 108b, or vice versa. For example, a patrol vehicle may be equipped withcameras main display 200 ofFIG. 4 is shown with twosplit screens video display 202 for an apparatus utilizing more than two cameras. - Three plot lines, a raw electrical
field measurement plot 406, anadaptive threshold plot 408 set relative to the local ambient or background noise level and a smoothedplot 410 are provided in conjunction with the graphical plot overlaid on the video image frames displayed onvideo display 202.Adaptive threshold plot 408 is generated from data gathered before and after the raw voltage was sensed bysensor probes 104a-104c.Smoothed plot 410 is a smoothed version ofplot 406 that has been filtered to remove spurious content. A potential stray voltage is indicated when smoothedplot 410 exceedsadaptive threshold plot 408. -
Control panel 204 ofmain display 200 provides the interface operator with a plurality of monitoring and control options. An enlarged view ofcontrol panel 204, as illustrated inFIG. 4 , is provided and described in connection withFIG. 5 .Control panel 204 may include asystem monitor indicator 502, anaudio threshold indicator 504 and anaudio snooze indicator 506. In addition, aclear command option 508, a suspendcommand option 510, apreferences command option 512, an eventcapture command option 514 and a stop command option 516 are provided to the interface operator incontrol panel 204.Control panel 204 may also provide information in alatitude display 518, alongitude display 519, an address display 520, asignal strength display 522, aspeed display 524 and atime stamp display 526. -
Indicators System monitor indicator 502 may be a green color when operating within system specifications. When a problem is detected in connection with GUI 120, system monitorindicator 502 may turn yellow to notify the interface operator that their exists a problem, such as, lack of a GPS signal. In this case, no latitude, longitude or address information may be shown, respectively, indisplays video display 202. Other potential problems that may triggerindicator 502 may be depleted disk space for recording captured events (described in detail below) or loss of communication betweenprocessor 110 and GUI 120. - Generation of an audible tone output signal having a pitch that is proportional to the signal strength of the measured electric field may be provided as a tool in conjunction with the monitoring capabilities provided in GUI 120 to aid the interface operator in determining the source and potential danger of stray voltage anomalies. An audio threshold value that is indicative of the minimum voltage level required to trigger an audible notification tone is desired. For example, an optimum audio alert value for identifying stray voltage anomalies, while minimizing the number of false detections, may be preset as a default value. Default settings may be represented by
audio threshold indicator 504 being, for example, a green color. - However, the interface operator may adjust the default threshold settings provided in connection with the audible notification tone if too much noise is being picked up. By selecting
preferences command option 512 provided oncontrol panel 204, the interface operator could be provided with apreferences display 600, as illustrated inFIG. 6 , for modifying values associated with the audible tone. Therein, the interface operator could raise the threshold value, using audiothreshold increase button 602 and decrease button 604, to minimize or eliminate false audible tones being generated due to a noisy environment in a patrolled environment. Any changes made to the default audible threshold value in preferences display 600 may be represented byaudible threshold indicator 504 oncontrol panel 204 turning yellow. The change in color informs the interface operator that the audible notification tone is operating according to user defined values, not system defined default values. - Additional features that may be provided in preferences display 600 of
FIG. 6 , may be an audio snooze time option 606, anx-axis toggle switch 608, a y-axis toggle switch 610, atrace option 614 and a DSP string option 616. Audio snooze time option 606 specifies in seconds how long audio alerts are suspended when asnooze button 506 is pushed.Snooze button 506 may be green when default values are provided in the display of snooze time option 606 of preferences display 600. However, similar toaudio threshold indicator 504,snooze button 506 may also include a color indicator that changes, for example, to yellow when the default snooze time has been changed in preferences display 600.Toggle switches video display 202.Trace option 614, when selected, allows for the logarithmic scaling of all y-axis 202 values in order to ensure that values are easily readable and that entire plot lines appear withinvideo display 202 ofmain display 200. DSP string option 616 may be provided as a means for displaying processing related data, when selected, totroubleshooting apparatus 100. - Default values for system preferences identified in
display 600 may be restored by selecting a restore defaultscommand option 618. Otherwise defined preferences may be saved and executed by selecting an "OK" command option 620. Alternatively, if the interface operator decides not to make any changes, then a "CANCEL"command option 622 may be selected. Selection of eithercommand option 620 or 622 will return the interface operator to display 200. - As the patrol vehicle traverses through an environment, streaming synchronized data of the electric field strength overlaid on the corresponding video frames of the scene being traversed at the time of measurement may be displayed to the interface operator on
video display 202 ofmain display 200. In addition, corresponding latitude and longitude information related to the patrolling vehicle is received byGPS receiver 114 and provided, respectively, to displayfields display fields display field 522. The speed of the patrol vehicle may be presented indisplay field 524, along with a current data and time stamp indisplay field 526. The interface operator may temporarily suspend data sampling at any time by selecting a suspendcommand option 510, clear received data by selecting aclear command option 508 or exit GUI 120 system entirely by selecting a stop command option 516 provided oncontrol panel 204 ofmain display 200. - As the interface operator monitors the incoming streaming data on
video display 202, he/she is also presented with a variable-pitch alert that is configured for alerting the interface operator of detected fluctuations and/or spikes in measured electric field readings that exceed a defined threshold. Therefore, when a potential anomaly is detected, represented for example by a rise-peak-fall in the alert pitch, a corresponding visual spike inraw voltage plot 406, a high signal strength value indisplay field 522 or a combination thereof, interface operator may select an eventcapture command option 514 for purposes of gathering additional information to review the potentially detected stray voltage anomaly. Therefore, when the interface operator selects eventcapture command option 514 oncontrol panel 204 ofmain display 200, he/she may be presented with adata collection display 700 and aevent capture display 800 illustrated, respectively, inFIGS. 7 and8 .Data collection display 700 prompts the interface operator to continue driving the patrol vehicle for a predefined distance (e.g., an additional 40 feet after selection of event capture command option 514) in order to collect enough data sampling information to fully analyze the background noise associated with the captured event. Aprogress bar 702 may be provided indisplay 700 to inform the interface user of the remaining distance of travel required. Upon completion of the additional information collection process, represented byprogress bar 702, the interface operator may stop the collection of streaming data by GUI 120 and proceed toevent capture display 800 for analyzing the captured event. The collection of streaming data may be stopped or paused by stopping the patrol vehicle. Alternatively, collection of additional information pertaining to the captured event may be optionally terminated earlier, through selection of a cancelcommand option 704, to permit the interface operator to proceed to review the captured event onevent capture display 800 without collection of additional information. - After driving the additional distance prompted by
display 700 and stopping the patrol vehicle, processing of data related to the event capture may be processed (e.g. by processor 110) and a second distinctive alert tone (e.g., a chime-like sound) may be presented to the interface operator if it is determined that the processed captured measurement is not a false alarm. Thereupon, the interface operator could further examine the potential detected anomaly inevent capture display 800, as illustrated inFIG. 8 . Similar tomain display 200,event capture display 800 provides avideo display 802 and aplayback control panel 804.Scene scroll tabs display 802 to permit the interface operator to view captured video images and their corresponding electric field measurements throughout various positions traversed by the patrol vehicle.Event capture display 800 may also provide apinpoint indicator 801 that may be positioned on any part of thevideo display 802 to display data and video for a different location. Data displayed in playback control panel 804 (to be described below) corresponds to the applied position ofindicator 801. For example, if the interface operator would like to view measurement and video data associated with a position 225 feet prior in motion, the interface operator could usescene scroll tabs pinpoint indicator 801 to the desired location onvideo display 802. -
Event capture display 800 allows the interface operator to more closely examine potentially detected anomalies by providing playback analysis of the captured event. More specifically, the interface operator may compareraw voltage plot 406 andadaptive threshold plot 408 to assist in identifying the object displayed in the corresponding image frame that is most likely to be the source of the anomaly. Inevent capture display 800, the three plot lines may be aligned to permit the interface operator to look for points where smoothedplot 410 exceedsadaptive threshold plot 408. This indicates that there exists a spike above the averaged background noise and, therefore, the existence of an anomaly. - Enlarged views of a detected stray voltage anomaly as it may be provided on
video display 802 ofevent capture display 800 ofFIG. 8 is illustrated in conjunction withFIGS. 9-10 . InFIG. 9 ,pinpoint indicator 801 is positioned near the peak of spike inraw voltage plot 406. All related sensor data related to this particular position is provided to the interface operator onplayback control panel 804. As can be seen near the spike inraw voltage plot 406, smoothedplot 410 exceedsadaptive threshold plot 408, indicative of a potentially dangerous anomaly in the captured scene. Whenpinpoint indicator 801 is positioned over the peak of a spike, the object most centered in a video frame onvideo display 802 is likely the source of the detected anomaly. An isolated enlarged view, as illustrated inFIG. 10 , of the video image frame shown onvideo display 802 ofevent capture display 800 may be provided, wherein it can be seen that an object 1000 most centered in the video frame is likely the source of the detected anomaly. The video image frame may be isolated and enlarged by selecting a full screen command option 1106 (FIG. 11 ) fromplayback control panel 804. - An enlarged view of event
capture control panel 804 is illustrated inFIG. 11 . Eventcapture control panel 804 is comprised of aplay command option 1102, apause command option 1104, a full screen command option 1106, apreferences option 1108 and amain display option 1110. Playcommand option 1102 may allow the interface operator to play a video clip selected from a savedevents section 1300. Similarly, pausecommand option 1104 may allow the interface operator to pause playback of the video clip selected from savedevents section 1300. Full screen command option 1106 may allow the interface operator to toggle between full-sized video images and regular-sized video images provided ondisplay 802.Preferences command option 1108 may provide the interface operator with additional playback and review options not shown onplayback control panel 804. For example,command option 1108, when selected, may provide preferences related to wireless communication of captured events to dispatch a remote crew.Main display option 1110 may allow the interface operator to return tomain display 200. A disable plottingoption 1112 may also be provided, wherein the plots may be removed for a clearer view of scene objects displayed onvideo display 802 whenoption 1112 is selected. - Once a detected stray voltage anomaly has been confirmed by the interface operator and object 1000, for example, has been determined to be the likely source of the anomaly, the interface operator may then proceed to record object related information in an
objects section 1200 ofplayback control panel 804. An environmental object or infrastructure name may be listed in a predefined objects scrollmenu 1202 or may be defined by the interface operator using anobject identification field 1204. The interface operator may then add the object identified inmenu 1202 orfield 1204 to a selectedobject field 1208 using, respectively, anadd command option 1206 or anadd command option 1203. An added object identified infield 1208 may also be removed by selecting aremove command option 1207. Additional notes, comments and instructions may be provided by the interface operator using acomments field 1210. For example, the interface operator may identify a lamp post, infield 1208, as the potential source of a detected stray voltage anomaly and instruct, infield 1210, the need for a utility crew to be dispatched immediately to the site to neutralize the source. In addition, GUI 120 is configured so that if multiple objects are determined to be present in a scene where an anomaly was detected, the interface operator may identify the multiple objects infield 1208. The interface operator may then select a saveevent command option 1114 to record the identified object source of the anomaly, associated comments regarding the anomaly andanomaly location information 1116 for future reference and analysis of the captured anomaly event. Thereafter, the interface operator may return tomain display 200, viacommand option 1110, and restart movement of the patrol vehicle to restart data sampling of the scene being traversed. - Captured events that have been previously saved by the interface operator may be viewed by selecting a saved event file from an events listing 1302 available in
section 1300 ofplayback control panel 804. To open a saved event provided inlisting 1302, the interface operator, or any other applicable user, may select the desired event and then select a loadevent command option 1304. When the desired event is loaded,display 800 is populated with all data related to the selected event (e.g., location information, object identification, comments, captured video image frame and corresponding measurement data). To play the video associated with a loaded event, the interface operator may move thepinpoint indicator 801 to the desired starting location onvideo display 802 in which he/she wishes to begin viewing and selectplay command option 1102. - Information that has been populated, for example, into
section 1200 may be edited. For instance, if it is determined that an object previously identified as the source of a stray voltage anomaly is not indeed the source of the anomaly,field 1208 may be edited usingcommands update command option 1306 to have the new information saved in connection with the previously saved event. - When an event is saved,
apparatus 100 may be configured to generate a database entry for the saved event and create separate files for video and corresponding sensor related data. For example,apparatus 100 may be configured to create an AVI file for storing video images and an XML file for storing all other sensor related data. These files may be saved on a hard disk (e.g., memory component 116) and retrieved when the corresponding event is selected and loaded usingplayback control panel 804 onevent capture display 800. If it is determined that saved events are no longer needed or have been archived elsewhere, or alternatively, if additional storage space is needed inapparatus 100, the interface operator may deletecommand options section 1300 ofplayback control panel 804. - An illustrative depiction of the general steps employed in use of VGUI 120 of
apparatus 100 for monitoring and controlling the detection of a stray voltage anomaly is described with reference to the flowchart ofFIG. 14 . As previously described, the monitoring of streaming data displayed onvideo display 122 of GUI 120 is initiated, at step 1402, by providing user login information atstep 1404. If the login information provided atdisplay 300 ofFIG. 3 is determined to be for an authorized user, then VGUI 120 may begin to sample data and provide a visual output of streaming data, atstep 1408, onmain display 200, which may be driven by movement of the patrol vehicle equipped withapparatus 100. - GUI 120 of
apparatus 100 may audibly, via a variable-pitched alert tone, and visually, via a spike in plots provided ongraphical video display 202, prompt the interface operator upon detection of a stray voltage anomaly atstep 1410. When initial detection of a potential anomaly is detected atstep 1410, interface operator may decide to capture the event by selecting eventcapture command option 514 provided oncontrol panel 204 ofmain display 200. In response to the user initiated instruction to capture an event, additional processing may be executed to collect additional information about the captured event and an additional alert notification may be provided to the interface operator atstep 1416, indicating to the interface operator that the subsequent processing of the captured event is likely a stray voltage anomaly. - Playback controls are provided to the interface operator, at
step 1418, viacontrol panel 804 onevent capture display 800 ofFIG. 8 . After the interface operator has had an opportunity to review information related to the captured event, as well as identify the source emitting the stray voltage anomaly atstep 1422, he/she may record the event atstep 1420. Thereafter, the interface operator may elect to resume data sampling of the area being patrolled atstep 1424, thereby reinitiating the receipt of streaming data atmain display 200. GUI 120 may go into a standby mode, at step 1426, if no action is taken after a predetermined amount of time or, alternatively, if the interface operator elects to suspend data sampling by selecting, e.g., suspendcommand option 510 oncontrol panel 204 ofmain display 200. - One skilled in the art will appreciate that the present invention can be practiced by other than the described embodiments, which are presented for purposes of illustration and not by way of limitation, and the present invention is limited only by the claims that follow.
Claims (12)
- An apparatus (100) mountable to a vehicle for identifying a hazardously energized object, comprising:a camera device (108a, 108b) for obtaining image data of a patrolled area viewed in a direction to the left or right of the direction of travel of the vehicle,one or more sensor probes (104a, 104b, 104c) configured to detect an electric field and to provide an analog signal corresponding to the electric field;a processor (110) configured to process the image data along with the analog signal corresponding to the electric field, the processor including a signal converter which is configured to generate a digital signal from the analog signal, the processor being configured to process the digital signal pertaining to the at least one hazardously energized object and configured to provide a second signal representing a strength of the electric field; anda display (122, 202) configured to display the image data synchronized with a graphical plot representing the electric field and comprising an indication of the strength of the electric field associated with locations of the vehicle, the display being configured to display a rise, peak and fall of the strength of the electric field represented by the second signal in a moving chart as the vehicle moves past the hazardously energized object.
- The apparatus of claim 1, wherein the graphical plot comprises an indication of a linear distance traveled versus the indication of the strength of the electric field.
- The apparatus of claim 1, wherein the graphical plot comprises at least one of a raw electric field measurement plot, a smoothed electrical field measurement plot, or an adaptive threshold plot.
- The apparatus of claim 1, further comprising at least one of a speed sensor (112), a distance sensor, or a position device (114) for determining a location of the apparatus.
- The apparatus of claim 4, wherein at least one of the electric field or the image data is tagged with location data representing the location.
- The apparatus of claim 1, wherein an interface provides at least one of an option for capturing at least a portion of the output as an event or a playback option for replaying the event.
- A method for identifying a hazardously energized object by an apparatus (100) mounted to a vehicle, the method comprising:obtaining, by a camera device (108a, 108b), image data of a patrolled area viewed in a direction to the left or right of the direction of travel of the vehicle;detecting an electric field and providing an analog signal corresponding to the electric field by one or more sensor probes (104a, 104b, 104c);generating a digital signal from the analog signal by a signal converter of a processor, processing the digital signal pertaining to the at least one hazardously energized object and providing a second signal representing a strength of the electric field by the processor (110), wherein the processor processes the image data along with the analog signal corresponding to the electric field; anddisplaying, by a display (122, 202), the image data synchronized with a graphical plot representing the electric field and comprising an indication of the strength of the electric field associated with locations of the vehicle, wherein said displaying includes displaying a rise, peak and fall of the strength of the electrical field represented by the second signal in a moving chart as the vehicle moves past the hazardously energized object.
- The method of claim 7, wherein the graphical plot comprises an indication of a linear distance traveled versus the indication of the strength of the electric field.
- The method of claim 7, wherein the graphical plot comprises at least one of a raw electric field measurement plot, a smoothed electrical field measurement plot, or an adaptive threshold plot.
- The method of claim 7, further comprising:obtaining at least one of a speed of the apparatus, a distance traveled by the apparatus, or a position of the apparatus;determining a location of the apparatus based on the at least one of a speed, a distance, or a position; andtagging at least one of the electric field or the image data with location data representing the location.
- The method of claim 10, further comprising storing in a synchronized relationship at least two measurements of the electric field, the image data, the speed, the distance, the position, or the location data.
- The method of claim 7, further comprising at least one of capturing at least a portion of the output as an event or providing a playback option for replaying the event.
Priority Applications (1)
| Application Number | Priority Date | Filing Date | Title |
|---|---|---|---|
| EP20192719.1A EP3767229A1 (en) | 2005-10-19 | 2006-10-19 | Apparatus and method for detection of stray voltage anomalies |
Applications Claiming Priority (2)
| Application Number | Priority Date | Filing Date | Title |
|---|---|---|---|
| US72816805P | 2005-10-19 | 2005-10-19 | |
| PCT/IB2006/004314 WO2008087464A2 (en) | 2005-10-19 | 2006-10-19 | Apparatus and method for monitoring and controlling detection of stray voltage anomalies |
Related Child Applications (1)
| Application Number | Title | Priority Date | Filing Date |
|---|---|---|---|
| EP20192719.1A Division EP3767229A1 (en) | 2005-10-19 | 2006-10-19 | Apparatus and method for detection of stray voltage anomalies |
Publications (3)
| Publication Number | Publication Date |
|---|---|
| EP2016371A2 EP2016371A2 (en) | 2009-01-21 |
| EP2016371A4 EP2016371A4 (en) | 2016-03-09 |
| EP2016371B1 true EP2016371B1 (en) | 2020-08-26 |
Family
ID=39636425
Family Applications (2)
| Application Number | Title | Priority Date | Filing Date |
|---|---|---|---|
| EP20192719.1A Pending EP3767229A1 (en) | 2005-10-19 | 2006-10-19 | Apparatus and method for detection of stray voltage anomalies |
| EP06851981.8A Active EP2016371B1 (en) | 2005-10-19 | 2006-10-19 | Apparatus and method for monitoring and controlling detection of stray voltage anomalies |
Family Applications Before (1)
| Application Number | Title | Priority Date | Filing Date |
|---|---|---|---|
| EP20192719.1A Pending EP3767229A1 (en) | 2005-10-19 | 2006-10-19 | Apparatus and method for detection of stray voltage anomalies |
Country Status (4)
| Country | Link |
|---|---|
| EP (2) | EP3767229A1 (en) |
| CA (1) | CA2627169C (en) |
| DK (1) | DK2016371T3 (en) |
| WO (1) | WO2008087464A2 (en) |
Families Citing this family (4)
| Publication number | Priority date | Publication date | Assignee | Title |
|---|---|---|---|---|
| EP3546960B1 (en) * | 2014-01-07 | 2023-04-19 | Osmose Utilities Services, Inc. | Apparatus and method for monitoring and controlling detection of stray voltage anomalies using a photonic sensor |
| CN104378590A (en) * | 2014-11-06 | 2015-02-25 | 国家电网公司 | Remote video monitoring system for extra-high voltage transmission line |
| CN110261728A (en) * | 2019-05-13 | 2019-09-20 | 广州供电局有限公司 | Power transmission line monitoring device and system |
| CN112801189A (en) * | 2021-01-29 | 2021-05-14 | 上海寻梦信息技术有限公司 | Method and device for detecting longitude and latitude abnormity, electronic equipment and storage medium |
Family Cites Families (12)
| Publication number | Priority date | Publication date | Assignee | Title |
|---|---|---|---|---|
| FR2450460A1 (en) * | 1979-02-27 | 1980-09-26 | Robson William | Electrostatic field detector - has antenna responding to field and connected to amplifier of high input impedance |
| US4683464A (en) * | 1983-06-30 | 1987-07-28 | Texaco Inc. | Safety monitor means and method |
| AU6043990A (en) * | 1989-06-28 | 1991-01-17 | William E. Merritt | Electric field detection system |
| GB2343956B (en) * | 1998-09-18 | 2003-09-03 | Safe Flight Instrument | In-flight aid for detecting power lines |
| US6154178A (en) * | 1998-12-11 | 2000-11-28 | L3 Communications Corporation | Ultra wideband personal electromagnetic radiation monitor |
| US6317683B1 (en) * | 2000-10-05 | 2001-11-13 | Navigation Technologies Corp. | Vehicle positioning using three metrics |
| EP1388062A2 (en) * | 2001-03-12 | 2004-02-11 | Nice Systems Limited | System and method for capturing, analyzing and recording screen events |
| WO2003050547A2 (en) * | 2001-12-10 | 2003-06-19 | Bae Systems Information And Electronic Systems Integration Inc. | Electric field sensor |
| US6853307B2 (en) * | 2002-03-14 | 2005-02-08 | Irvin H. Nickerson | High voltage proximity warning system and method |
| WO2004015369A2 (en) * | 2002-08-09 | 2004-02-19 | Intersense, Inc. | Motion tracking system and method |
| US20050113985A1 (en) * | 2003-11-26 | 2005-05-26 | Safe Flight Instrument Corporation | Obstacle avoidance system for rotary wing aircraft |
| US20060013903A1 (en) * | 2004-07-16 | 2006-01-19 | Timothy Romero | Dietary supplements containing extracts of cinnamon and methods of using same to promote weight loss |
-
2006
- 2006-10-19 WO PCT/IB2006/004314 patent/WO2008087464A2/en active Application Filing
- 2006-10-19 EP EP20192719.1A patent/EP3767229A1/en active Pending
- 2006-10-19 CA CA2627169A patent/CA2627169C/en active Active
- 2006-10-19 EP EP06851981.8A patent/EP2016371B1/en active Active
- 2006-10-19 DK DK06851981.8T patent/DK2016371T3/en active
Non-Patent Citations (1)
| Title |
|---|
| None * |
Also Published As
| Publication number | Publication date |
|---|---|
| WO2008087464A3 (en) | 2009-05-07 |
| EP3767229A1 (en) | 2021-01-20 |
| CA2627169A1 (en) | 2007-04-19 |
| DK2016371T3 (en) | 2020-09-14 |
| WO2008087464A2 (en) | 2008-07-24 |
| EP2016371A2 (en) | 2009-01-21 |
| EP2016371A4 (en) | 2016-03-09 |
| CA2627169C (en) | 2015-05-19 |
Similar Documents
| Publication | Publication Date | Title |
|---|---|---|
| US7486081B2 (en) | Apparatus and method for monitoring and controlling detection of stray voltage anomalies | |
| US8482274B2 (en) | Apparatus and method for monitoring and controlling detection of stray voltage anomalies | |
| US9666058B2 (en) | Apparatus and method for monitoring and controlling detection of stray voltage anomalies | |
| US20060139032A1 (en) | Method for sensing an electric field | |
| US20060139031A1 (en) | Sensor for sensing an electric field | |
| US10802067B2 (en) | Apparatus and method for monitoring and controlling detection of stray voltage anomalies using a photonic sensor | |
| EP2016371B1 (en) | Apparatus and method for monitoring and controlling detection of stray voltage anomalies | |
| US10916116B2 (en) | Apparatus and method for detection of hazardously energized objects |
Legal Events
| Date | Code | Title | Description |
|---|---|---|---|
| PUAI | Public reference made under article 153(3) epc to a published international application that has entered the european phase |
Free format text: ORIGINAL CODE: 0009012 |
|
| 17P | Request for examination filed |
Effective date: 20080519 |
|
| AK | Designated contracting states |
Kind code of ref document: A2 Designated state(s): AT BE BG CH CY CZ DE DK EE ES FI FR GB GR HU IE IS IT LI LT LU LV MC NL PL PT RO SE SI SK TR |
|
| RIN1 | Information on inventor provided before grant (corrected) |
Inventor name: PARAGANO, VINCENT Inventor name: POLYZOIS, CHRISTOS Inventor name: KALOKITIS, DAVID Inventor name: SCHULTZ, LEONARD, JOSHUA |
|
| RAP1 | Party data changed (applicant data changed or rights of an application transferred) |
Owner name: POWER SURVEY LLC |
|
| R17D | Deferred search report published (corrected) |
Effective date: 20090507 |
|
| RIC1 | Information provided on ipc code assigned before grant |
Ipc: G01C 19/00 20060101ALI20090618BHEP Ipc: G01C 17/00 20060101ALI20090618BHEP Ipc: G01C 9/00 20060101AFI20090618BHEP |
|
| DAX | Request for extension of the european patent (deleted) | ||
| REG | Reference to a national code |
Ref country code: DE Ref legal event code: R079 Ref document number: 602006059629 Country of ref document: DE Free format text: PREVIOUS MAIN CLASS: G01C0007040000 Ipc: G01C0009000000 |
|
| A4 | Supplementary search report drawn up and despatched |
Effective date: 20160205 |
|
| RIC1 | Information provided on ipc code assigned before grant |
Ipc: G01C 19/00 20130101ALI20160201BHEP Ipc: G01R 29/14 20060101ALI20160201BHEP Ipc: G01C 9/00 20060101AFI20160201BHEP Ipc: G01R 29/12 20060101ALI20160201BHEP Ipc: G01C 17/00 20060101ALI20160201BHEP |
|
| STAA | Information on the status of an ep patent application or granted ep patent |
Free format text: STATUS: EXAMINATION IS IN PROGRESS |
|
| 17Q | First examination report despatched |
Effective date: 20180207 |
|
| GRAP | Despatch of communication of intention to grant a patent |
Free format text: ORIGINAL CODE: EPIDOSNIGR1 |
|
| STAA | Information on the status of an ep patent application or granted ep patent |
Free format text: STATUS: GRANT OF PATENT IS INTENDED |
|
| INTG | Intention to grant announced |
Effective date: 20191004 |
|
| GRAJ | Information related to disapproval of communication of intention to grant by the applicant or resumption of examination proceedings by the epo deleted |
Free format text: ORIGINAL CODE: EPIDOSDIGR1 |
|
| STAA | Information on the status of an ep patent application or granted ep patent |
Free format text: STATUS: EXAMINATION IS IN PROGRESS |
|
| GRAP | Despatch of communication of intention to grant a patent |
Free format text: ORIGINAL CODE: EPIDOSNIGR1 |
|
| STAA | Information on the status of an ep patent application or granted ep patent |
Free format text: STATUS: GRANT OF PATENT IS INTENDED |
|
| INTC | Intention to grant announced (deleted) | ||
| INTG | Intention to grant announced |
Effective date: 20200318 |
|
| GRAS | Grant fee paid |
Free format text: ORIGINAL CODE: EPIDOSNIGR3 |
|
| GRAA | (expected) grant |
Free format text: ORIGINAL CODE: 0009210 |
|
| STAA | Information on the status of an ep patent application or granted ep patent |
Free format text: STATUS: THE PATENT HAS BEEN GRANTED |
|
| RAP1 | Party data changed (applicant data changed or rights of an application transferred) |
Owner name: OSMOSE UTILITIES SERVICES, INC. |
|
| AK | Designated contracting states |
Kind code of ref document: B1 Designated state(s): AT BE BG CH CY CZ DE DK EE ES FI FR GB GR HU IE IS IT LI LT LU LV MC NL PL PT RO SE SI SK TR |
|
| REG | Reference to a national code |
Ref country code: GB Ref legal event code: FG4D |
|
| REG | Reference to a national code |
Ref country code: CH Ref legal event code: EP |
|
| REG | Reference to a national code |
Ref country code: DK Ref legal event code: T3 Effective date: 20200911 |
|
| REG | Reference to a national code |
Ref country code: AT Ref legal event code: REF Ref document number: 1306794 Country of ref document: AT Kind code of ref document: T Effective date: 20200915 |
|
| REG | Reference to a national code |
Ref country code: IE Ref legal event code: FG4D |
|
| REG | Reference to a national code |
Ref country code: DE Ref legal event code: R096 Ref document number: 602006059629 Country of ref document: DE Ref country code: FI Ref legal event code: FGE |
|
| REG | Reference to a national code |
Ref country code: NL Ref legal event code: FP |
|
| REG | Reference to a national code |
Ref country code: SE Ref legal event code: TRGR |
|
| REG | Reference to a national code |
Ref country code: LT Ref legal event code: MG4D |
|
| PG25 | Lapsed in a contracting state [announced via postgrant information from national office to epo] |
Ref country code: LT Free format text: LAPSE BECAUSE OF FAILURE TO SUBMIT A TRANSLATION OF THE DESCRIPTION OR TO PAY THE FEE WITHIN THE PRESCRIBED TIME-LIMIT Effective date: 20200826 Ref country code: BG Free format text: LAPSE BECAUSE OF FAILURE TO SUBMIT A TRANSLATION OF THE DESCRIPTION OR TO PAY THE FEE WITHIN THE PRESCRIBED TIME-LIMIT Effective date: 20201126 Ref country code: PT Free format text: LAPSE BECAUSE OF FAILURE TO SUBMIT A TRANSLATION OF THE DESCRIPTION OR TO PAY THE FEE WITHIN THE PRESCRIBED TIME-LIMIT Effective date: 20201228 Ref country code: GR Free format text: LAPSE BECAUSE OF FAILURE TO SUBMIT A TRANSLATION OF THE DESCRIPTION OR TO PAY THE FEE WITHIN THE PRESCRIBED TIME-LIMIT Effective date: 20201127 |
|
| REG | Reference to a national code |
Ref country code: AT Ref legal event code: MK05 Ref document number: 1306794 Country of ref document: AT Kind code of ref document: T Effective date: 20200826 |
|
| PG25 | Lapsed in a contracting state [announced via postgrant information from national office to epo] |
Ref country code: LV Free format text: LAPSE BECAUSE OF FAILURE TO SUBMIT A TRANSLATION OF THE DESCRIPTION OR TO PAY THE FEE WITHIN THE PRESCRIBED TIME-LIMIT Effective date: 20200826 Ref country code: PL Free format text: LAPSE BECAUSE OF FAILURE TO SUBMIT A TRANSLATION OF THE DESCRIPTION OR TO PAY THE FEE WITHIN THE PRESCRIBED TIME-LIMIT Effective date: 20200826 Ref country code: IS Free format text: LAPSE BECAUSE OF FAILURE TO SUBMIT A TRANSLATION OF THE DESCRIPTION OR TO PAY THE FEE WITHIN THE PRESCRIBED TIME-LIMIT Effective date: 20201226 |
|
| PG25 | Lapsed in a contracting state [announced via postgrant information from national office to epo] |
Ref country code: RO Free format text: LAPSE BECAUSE OF FAILURE TO SUBMIT A TRANSLATION OF THE DESCRIPTION OR TO PAY THE FEE WITHIN THE PRESCRIBED TIME-LIMIT Effective date: 20200826 Ref country code: CZ Free format text: LAPSE BECAUSE OF FAILURE TO SUBMIT A TRANSLATION OF THE DESCRIPTION OR TO PAY THE FEE WITHIN THE PRESCRIBED TIME-LIMIT Effective date: 20200826 Ref country code: EE Free format text: LAPSE BECAUSE OF FAILURE TO SUBMIT A TRANSLATION OF THE DESCRIPTION OR TO PAY THE FEE WITHIN THE PRESCRIBED TIME-LIMIT Effective date: 20200826 |
|
| REG | Reference to a national code |
Ref country code: DE Ref legal event code: R097 Ref document number: 602006059629 Country of ref document: DE |
|
| PG25 | Lapsed in a contracting state [announced via postgrant information from national office to epo] |
Ref country code: ES Free format text: LAPSE BECAUSE OF FAILURE TO SUBMIT A TRANSLATION OF THE DESCRIPTION OR TO PAY THE FEE WITHIN THE PRESCRIBED TIME-LIMIT Effective date: 20200826 Ref country code: AT Free format text: LAPSE BECAUSE OF FAILURE TO SUBMIT A TRANSLATION OF THE DESCRIPTION OR TO PAY THE FEE WITHIN THE PRESCRIBED TIME-LIMIT Effective date: 20200826 |
|
| REG | Reference to a national code |
Ref country code: CH Ref legal event code: PL |
|
| PG25 | Lapsed in a contracting state [announced via postgrant information from national office to epo] |
Ref country code: LU Free format text: LAPSE BECAUSE OF NON-PAYMENT OF DUE FEES Effective date: 20201019 Ref country code: SK Free format text: LAPSE BECAUSE OF FAILURE TO SUBMIT A TRANSLATION OF THE DESCRIPTION OR TO PAY THE FEE WITHIN THE PRESCRIBED TIME-LIMIT Effective date: 20200826 Ref country code: MC Free format text: LAPSE BECAUSE OF FAILURE TO SUBMIT A TRANSLATION OF THE DESCRIPTION OR TO PAY THE FEE WITHIN THE PRESCRIBED TIME-LIMIT Effective date: 20200826 |
|
| PLBE | No opposition filed within time limit |
Free format text: ORIGINAL CODE: 0009261 |
|
| STAA | Information on the status of an ep patent application or granted ep patent |
Free format text: STATUS: NO OPPOSITION FILED WITHIN TIME LIMIT |
|
| 26N | No opposition filed |
Effective date: 20210527 |
|
| PG25 | Lapsed in a contracting state [announced via postgrant information from national office to epo] |
Ref country code: CH Free format text: LAPSE BECAUSE OF NON-PAYMENT OF DUE FEES Effective date: 20201031 Ref country code: LI Free format text: LAPSE BECAUSE OF NON-PAYMENT OF DUE FEES Effective date: 20201031 Ref country code: SI Free format text: LAPSE BECAUSE OF FAILURE TO SUBMIT A TRANSLATION OF THE DESCRIPTION OR TO PAY THE FEE WITHIN THE PRESCRIBED TIME-LIMIT Effective date: 20200826 |
|
| PG25 | Lapsed in a contracting state [announced via postgrant information from national office to epo] |
Ref country code: TR Free format text: LAPSE BECAUSE OF FAILURE TO SUBMIT A TRANSLATION OF THE DESCRIPTION OR TO PAY THE FEE WITHIN THE PRESCRIBED TIME-LIMIT Effective date: 20200826 Ref country code: CY Free format text: LAPSE BECAUSE OF FAILURE TO SUBMIT A TRANSLATION OF THE DESCRIPTION OR TO PAY THE FEE WITHIN THE PRESCRIBED TIME-LIMIT Effective date: 20200826 |
|
| P01 | Opt-out of the competence of the unified patent court (upc) registered |
Effective date: 20230601 |
|
| PGFP | Annual fee paid to national office [announced via postgrant information from national office to epo] |
Ref country code: NL Payment date: 20230915 Year of fee payment: 18 Ref country code: IT Payment date: 20230913 Year of fee payment: 18 Ref country code: IE Payment date: 20230912 Year of fee payment: 18 Ref country code: GB Payment date: 20230914 Year of fee payment: 18 |
|
| PGFP | Annual fee paid to national office [announced via postgrant information from national office to epo] |
Ref country code: SE Payment date: 20230912 Year of fee payment: 18 Ref country code: FR Payment date: 20230921 Year of fee payment: 18 Ref country code: BE Payment date: 20230918 Year of fee payment: 18 |
|
| PGFP | Annual fee paid to national office [announced via postgrant information from national office to epo] |
Ref country code: FI Payment date: 20231011 Year of fee payment: 18 Ref country code: DK Payment date: 20231016 Year of fee payment: 18 Ref country code: DE Payment date: 20230912 Year of fee payment: 18 |