EP1526493B1 - Method for display of traffic information in a vehicle - Google Patents
Method for display of traffic information in a vehicle Download PDFInfo
- Publication number
- EP1526493B1 EP1526493B1 EP04024478A EP04024478A EP1526493B1 EP 1526493 B1 EP1526493 B1 EP 1526493B1 EP 04024478 A EP04024478 A EP 04024478A EP 04024478 A EP04024478 A EP 04024478A EP 1526493 B1 EP1526493 B1 EP 1526493B1
- Authority
- EP
- European Patent Office
- Prior art keywords
- traffic
- vehicle
- displayed
- bottlenecks
- queuing
- Prior art date
- Legal status (The legal status is an assumption and is not a legal conclusion. Google has not performed a legal analysis and makes no representation as to the accuracy of the status listed.)
- Active
Links
Images


Classifications
-
- G—PHYSICS
- G08—SIGNALLING
- G08G—TRAFFIC CONTROL SYSTEMS
- G08G1/00—Traffic control systems for road vehicles
- G08G1/09—Arrangements for giving variable traffic instructions
- G08G1/0962—Arrangements for giving variable traffic instructions having an indicator mounted inside the vehicle, e.g. giving voice messages
- G08G1/0967—Systems involving transmission of highway information, e.g. weather, speed limits
- G08G1/096708—Systems involving transmission of highway information, e.g. weather, speed limits where the received information might be used to generate an automatic action on the vehicle control
- G08G1/096716—Systems involving transmission of highway information, e.g. weather, speed limits where the received information might be used to generate an automatic action on the vehicle control where the received information does not generate an automatic action on the vehicle control
-
- G—PHYSICS
- G01—MEASURING; TESTING
- G01C—MEASURING DISTANCES, LEVELS OR BEARINGS; SURVEYING; NAVIGATION; GYROSCOPIC INSTRUMENTS; PHOTOGRAMMETRY OR VIDEOGRAMMETRY
- G01C21/00—Navigation; Navigational instruments not provided for in groups G01C1/00 - G01C19/00
- G01C21/26—Navigation; Navigational instruments not provided for in groups G01C1/00 - G01C19/00 specially adapted for navigation in a road network
- G01C21/34—Route searching; Route guidance
- G01C21/36—Input/output arrangements for on-board computers
- G01C21/3691—Retrieval, searching and output of information related to real-time traffic, weather, or environmental conditions
- G01C21/3694—Output thereof on a road map
-
- G—PHYSICS
- G08—SIGNALLING
- G08G—TRAFFIC CONTROL SYSTEMS
- G08G1/00—Traffic control systems for road vehicles
- G08G1/09—Arrangements for giving variable traffic instructions
- G08G1/0962—Arrangements for giving variable traffic instructions having an indicator mounted inside the vehicle, e.g. giving voice messages
- G08G1/0967—Systems involving transmission of highway information, e.g. weather, speed limits
- G08G1/096733—Systems involving transmission of highway information, e.g. weather, speed limits where a selection of the information might take place
- G08G1/096741—Systems involving transmission of highway information, e.g. weather, speed limits where a selection of the information might take place where the source of the transmitted information selects which information to transmit to each vehicle
-
- G—PHYSICS
- G08—SIGNALLING
- G08G—TRAFFIC CONTROL SYSTEMS
- G08G1/00—Traffic control systems for road vehicles
- G08G1/09—Arrangements for giving variable traffic instructions
- G08G1/0962—Arrangements for giving variable traffic instructions having an indicator mounted inside the vehicle, e.g. giving voice messages
- G08G1/0967—Systems involving transmission of highway information, e.g. weather, speed limits
- G08G1/096766—Systems involving transmission of highway information, e.g. weather, speed limits where the system is characterised by the origin of the information transmission
- G08G1/096775—Systems involving transmission of highway information, e.g. weather, speed limits where the system is characterised by the origin of the information transmission where the origin of the information is a central station
-
- G—PHYSICS
- G08—SIGNALLING
- G08G—TRAFFIC CONTROL SYSTEMS
- G08G1/00—Traffic control systems for road vehicles
- G08G1/09—Arrangements for giving variable traffic instructions
- G08G1/0962—Arrangements for giving variable traffic instructions having an indicator mounted inside the vehicle, e.g. giving voice messages
- G08G1/0967—Systems involving transmission of highway information, e.g. weather, speed limits
- G08G1/096766—Systems involving transmission of highway information, e.g. weather, speed limits where the system is characterised by the origin of the information transmission
- G08G1/096791—Systems involving transmission of highway information, e.g. weather, speed limits where the system is characterised by the origin of the information transmission where the origin of the information is another vehicle
-
- G—PHYSICS
- G08—SIGNALLING
- G08G—TRAFFIC CONTROL SYSTEMS
- G08G1/00—Traffic control systems for road vehicles
- G08G1/09—Arrangements for giving variable traffic instructions
- G08G1/0962—Arrangements for giving variable traffic instructions having an indicator mounted inside the vehicle, e.g. giving voice messages
- G08G1/0968—Systems involving transmission of navigation instructions to the vehicle
- G08G1/0969—Systems involving transmission of navigation instructions to the vehicle having a display in the form of a map
Definitions
- the invention relates to a method for vehicle-side display of traffic information, in which selbige vehicle determined and / or identified outside the vehicle and transmitted to the vehicle and displayed on the vehicle side.
- Laid-open specification DE 100 37 827 A1 discloses a method in which location and extent of forecasted storage areas are displayed spatially resolved on the basis of a digital road network map.
- the term "spatially resolved” is to be understood here and below, the statement at which point of the considered traffic route network is the traffic jam or another traffic object to be displayed.
- predicted travel times may be displayed in the form of time equidistant lines or zones, the estimated time of arrival at particular route points, and / or the likelihood that the forecast will assume the occurrence of the congestion involved.
- a determined optimal route and, if required, additionally one or more determined alternative routes can be displayed together with associated arrival times or loss times of the alternative routes with respect to the optimal route.
- Analog traffic jamming objects occur in traffic networks of agglomerations in which the traffic is dominated by traffic-controlled network nodes in the form of upstream such traffic-regulated network node forming queue traffic patterns that can be adequately taken into account in corresponding traffic forecasts, see for further details such as the published patent DE 199 40 957 A1 and DE 100 36 792 A1 and the literature cited therein.
- traffic dynamics are typically dominated by the traffic control measures at the network nodes, such as traffic lights at road intersections, ie Traffic-controlled network nodes form effective bottlenecks at which queuing traffic patterns arise in the case of corresponding traffic volumes, hereinafter also referred to simply as queues.
- a generic method disclosed in the published patent application DE 101 19 730 A1 is particularly suitable for displaying determined effective bottlenecks and / or associated, determined patterns of dense traffic of a motorway network. These are displayed in a spatially resolved on a screen, preferably on a digital road network map and / or in a route profile display and / or a travel time profile representation driving direction selective.
- detailed information about the determined patterns of dense traffic can be displayed, in particular relevant forecast information such as probability of emergence, vehicle arrival time, departure time, residence time, extent, traffic density on the respective lane, average vehicle speed, time of origin, time of dissolution, travel time loss and / or internal structure.
- the invention is based on the technical problem of providing a method of the type mentioned by the vehicle occupants and in particular the driver vividly, reliably and accurately informed about the relevant traffic for further driving in particular in metropolitan areas, in which the traffic of the dynamics is dominated by queue traffic patterns.
- the invention solves this problem by providing a traffic information display method having the features of claim 1.
- a traffic information display method having the features of claim 1.
- the traffic information to be displayed at least effective congestion bottlenecks and associated current and / or future expected queue traffic patterns are determined and spatially resolved, i. indicating their location on the underlying agglomeration network.
- the display of effective congestion bottlenecks or queue traffic patterns is selected direction of travel selectively only in the possible direction of travel of the vehicle so that the driver does not interfere with the display of irrelevant to him information, for. is loaded on the traffic lane sections on the traffic situation.
- the effective conurbation bottlenecks are displayed with any associated queues symbolically on a digital road map.
- the symbol-driven display of effective metropolitan bottlenecks is clear to the user.
- associated detailed information in the desired type and number can be displayed, be it automatically with the symbol display of agglomeration bottlenecks or only on user request.
- the queues are shown in their longitudinal extent together with the associated number of waiting free phases and / or the associated waiting time. This gives the user a detailed picture of the queue in question.
- a further developed according to claim 6 method comprises displaying a determined optimal route and one or more alternative routes together with associated predicted travel time information. The driver is informed in this way very comfortable on cheap routes.
- the figures illustrate exemplary traffic information displays on a vehicle-side screen, as provided by various advantageous implementations of the method according to the invention for the vehicle-side traffic information display.
- Characteristic component of the various process implementations is in each case that the displayed traffic information in addition to any other conventional traffic information in particular information about the existence of effective congestion bottlenecks and their location on the considered road network and information about any queue traffic patterns, in the present case also referred to as queues, contained upstream of such effective agglomeration bottlenecks.
- a road network is considered for the examples shown, alternatively, however, the inventive method is also suitable for another type of road network with appropriate traffic characteristics, such as a rail network.
- the examples represented by the different figures may vary depending on the application may be such different process implementations, or several of these examples may be part of a shared process implementation, which then has a switching capability between these different types of traffic information display on the screen.
- the means and methods underlying the present traffic information display method for detecting the current and / or predicted traffic condition to be displayed are e.g. in the related patent applications of the applicant described in detail, see also the cited documents and cited therein further literature, so that it can be referred to and this requires no further explanation.
- suitable means and methods for determining the location of effective bottlenecks in metropolitan area networks and optionally also in expressway networks and for determining queues or patterns of dense traffic occurring there may be required for the present method.
- this can be both systems working autonomously with the vehicle, systems operating with vehicle-vehicle communication and / or systems operating with a traffic center for determining the current and / or forecasting of the future traffic condition on a road network of interest, above all the detection of customizable traffic obstruction objects, such as effective congestion bottlenecks, in particular, light signal-controlled network nodes, and queues formed before them, as well as wide jams, synchronized traffic and compressed synchronized traffic, and patterns built up from such traffic state phases, enable dense traffic from effective bottlenecks in expressway network areas.
- traffic obstruction objects such as effective congestion bottlenecks, in particular, light signal-controlled network nodes, and queues formed before them, as well as wide jams, synchronized traffic and compressed synchronized traffic, and patterns built up from such traffic state phases, enable dense traffic from effective bottlenecks in expressway network areas.
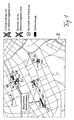
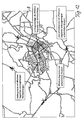
- FIG. 1 illustrates, as a basic form, a method example in which, based on a digital road map, starting from the respective current vehicle location as a starting point is determined and displayed whether and if so where specific for the possible directions of travel of a considered vehicle F effective agglomeration bottlenecks within a vehicle location containing metropolitan area network area, which could meet the vehicle F in his further drive depending on the selected direction.
- effective agglomeration bottlenecks are formed, in particular, by traffic light systems at network nodes, ie intersection areas, and by construction sites.
- these are four traffic signal bottlenecks E1 to E4 and a construction site bottleneck E5.
- the bottlenecks E1 to E5 are symbolically displayed as crosses in conjunction with an intuitive traffic sign representation at the corresponding route point of the digital road map on a screen B in the vehicle F. This allows the driver to respond promptly when needed.
- queues W1 to W5 are displayed, which are forecasted for the time at the associated bottleneck E1 to E5, to which the vehicle F is expected to arrive on the basis of the results of the traffic forecast and which it then encounters.
- the display of the queues W1 to W5 is performed by bars having a length corresponding to the predicted queue length. These may also be so-called cross queues, as in the case of queues W1 and W3, which extend upstream beyond one or more network nodes.
- the associated probability of occurrence of their occurrence in percent and the estimated time of arrival are also indicated.
- more or less such detailed information about predicted metropolitan queues may be displayed, alternatively or automatically, or only to a particular user request towards, for example, by appropriate operation of controls for the screen B by a vehicle occupant.
- only the identified congestion bottlenecks can be represented by their corresponding symbols on the digital road map or only together with the queue bars or additionally conurbation bottlenecks on opposite direction lanes with or without associated queues and detailed information associated with them.
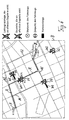
- FIG. 2 shows a display variant in which travel time equidistance zones are reproduced in addition to the information of FIG. the vehicle F can get to any point in the zone concerned, with the likely same maximum time of arrival, on the basis of the predicted traffic situation.
- the predicted arrival time is given for the zone-limiting equidistant lines.
- three equidistant lines D1, D2, D3 are explicitly reproduced, to which a predicted travel time interval of 5 minutes each belongs.
- the queue bars and predicted event probabilities in addition to the symbols of the identified congestion bottlenecks, the queue bars and predicted event probabilities, the number of free phases that are likely to be awaited on arriving at the queue in question is displayed until the associated bottleneck can be passed. Specifically, it is in the light signal systems to the number of corresponding green phases, in the present case also called traffic light cycles. This gives the user a further indication of the strength of the queue traffic jam.
- Fig. 4 shows a variant of Fig. 3, in which, instead of the number of traffic light cycles for each forecasted queue W1 to W5, the probable waiting time in seconds which the vehicle F needs to pass the queue W1 to W5 is indicated.
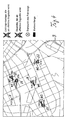
- FIG. 5 shows a method example in which predicted arrival times are indicated as times for conurbation bottlenecks and for network nodes in addition to the symbols of the identified congestion bottlenecks E1 to E5 and the longitudinal bars of the associated predicted queues W1 to W5 which the vehicle F could possibly drive.
- route recommendations resulting from the traffic forecast are displayed in addition to the congestion bottlenecks E1 to E5 and the associated predicted queues W1 to W5, namely a predicted optimal route R and one or more alternative routes, in the representation of FIG Fig. 6 two alternative routes A1 and A2.
- the route recommendation is based on a traffic prognosis which corrects any traffic disruption objects in time, i. at the time of the predicted arrival of the vehicle F, predicts, in particular, the queues W1 to W5.
- the route R proves to be optimal, i. shortest in time, although it passes over the queue W1.
- the estimated time of arrival is indicated on the illustrated digital road map.
- FIGS. 7 and 8 illustrate alternative ways of presenting a predicted route as a route axis or time axis profile.
- FIG. 7 shows a track axis, which in turn can be visually displayed on the screen B of the vehicle, with a track or road section Sa lying in front of the vehicle F and with an associated scale of FIG Distance s from the current vehicle location.
- a time axis representation according to FIG. 8 can be selected on the vehicle-side screen, in which the route section Sa is displayed in advance of the vehicle F in time-length form with an associated linear time scale indicating the predicted travel time.
- FIGS. 7 and 8 in these representations along the track or timeline at the location concerned, the predicted traffic signal bottlenecks as symbols and predicted queues W6, W7 at these as bars and any speed limits and Turning represented in corresponding traffic sign shape.
- other or further traffic information along the route or time axis can be displayed.
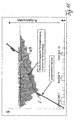
- the examples of Figs. 7 and 8 show a case in which, after turning, a road section is driven on which there is an effective constriction E6 before which a pattern M dense traffic formed upon arrival of the vehicle F according to the underlying traffic forecast Has.
- a detailed representation of the respective predicted queue can be activated, as shown by way of example in FIG. 9, at the request of the driver.
- the lane area upstream of the queue causing congestion bottleneck is represented for this purpose and the queue is entered therein as a bar having a bar length corresponding to the queue length, preferably individually for each lane.
- the queue bar entry includes a subdivision into beam length units of each free phase cycle, there called a wait cycle. The length of each wait cycle thus gives the vehicle during a free phase, such as a traffic light green phase expected distance traveled in the queue.
- 9 is an overall queue W8 with a total length of 9.3 wait cycles on a right turn lane, ie a vehicle approaching the queue W8 is likely to turn right at the traffic light controlled intersection in the tenth green phase , There is no overlapping queue on an additionally displayed left turn lane. Obviously, this representation provides the driver with very detailed information about a queue that he may encounter later in the journey.
- a predicted queue W9 upstream of a congestion bottleneck such as a congestion-related constriction
- a congestion bottleneck such as a congestion-related constriction
- the green-phase time intervals and the red-phase time intervals of the traffic signal system are marked on the time axis t, the sum of a red-phase time and a green-phase time being designated as the circulation time, which represents the time period length of the traffic signal system control.
- the predicted movement of the vehicle F is indicated as the corresponding predicted driving line.
- a calculated average speed of the vehicle in the queue is used, while in the case of Fig. 11 the predicted vehicle movement within the queue W9 is based on its exact route and time is reproduced.
- the method according to the invention comprises both a traffic forecast of effective congestion bottlenecks and resulting queues in metropolitan areas of a considered road network as well as effective motorway bottlenecks and on these resulting patterns dense traffic in highways areas of the road network.
- the determined metropolitan bottlenecks with associated queues and the expressway bottlenecks with associated dense traffic patterns are then displayed combined on a digital road map on the screen B in the vehicle.
- FIG. 12 shows by way of example such a screen display with a traffic signal bottleneck in a conurbation area and four effective expressway bottlenecks in a motorway network area.
- the associated queues or patterns dense traffic are in turn each represented with bars of appropriate length.
- further detailed information on the individual bottlenecks can be displayed as needed, as explained above for the other examples shown.
- the described embodiments show that the inventive method allows a comfortable and realistic reproduction of predicted traffic disturbance patterns in metropolitan areas and optionally additionally in expressway network areas on the basis of suitable conventional traffic forecasting methods.
Abstract
Description
Die Erfindung bezieht sich auf ein Verfahren zur fahrzeugseitigen Anzeige von Verkehrsinformationen, bei dem selbige fahrzeugseitig ermittelt und/oder fahrzeugextern ermittelt und zum Fahrzeug übertragen werden und fahrzeugseitig angezeigt werden.The invention relates to a method for vehicle-side display of traffic information, in which selbige vehicle determined and / or identified outside the vehicle and transmitted to the vehicle and displayed on the vehicle side.
Verfahren dieser Art sind in verschiedenen Ausprägungen bekannt, insbesondere für Straßenfahrzeuge. In der Offenlegungsschrift DE 100 37 827 A1 ist ein Verfahren offenbart, bei dem auf der Basis einer digitalen Straßennetzkarte ortsaufgelöst Lage und Ausdehnung prognostizierter Staubereiche angezeigt werden. Unter dem Begriff "ortsaufgelöst" soll dabei hier und im folgenden die Angabe verstanden werden, an welcher Stelle des betrachteten Verkehrswegenetzes sich der Stau bzw. ein anderes anzuzeigendes, verkehrliches Objekt befindet. Zusätzlich können prognostizierte Reisezeiten in Form zeitlicher Äquidistanzlinien bzw. -zonen, die voraussichtliche Ankunftszeit an bestimmten Streckenpunkten und/oder die Wahrscheinlichkeit angezeigt werden, mit der die Prognose das Auftreten des betreffenden Staus annimmt. Weiter können bei Angabe eines Zielortes eine ermittelte optimale Route und bei Bedarf zusätzlich eine oder mehrere ermittelte Alternativrouten zusammen mit zugehörigen Ankunftszeiten bzw. Verlustzeiten der Alternativrouten gegenüber der optimalen Route angezeigt werden.Methods of this kind are known in various forms, especially for road vehicles. Laid-
Zur Beschreibung des Verkehrszustands ist es bekannt geworden, diesen in verschiedene Zustandsphasen zu klassifizieren, außer der Phase "freier Verkehr" insbesondere die Zustandsphasen "synchronisierter Verkehr", "gestauchter synchronisierter Verkehr" (sogenannte "pinch region") und "sich bewegende breite Staus", wobei die Dynamik des Verkehrsablaufs insbesondere auf Schnellstraßennetzen wesentlich durch das individuelle Verhalten dieser verkehrlichen Objekte und durch Phasenübergänge zwischen diesen verschiedenen Verkehrszustandsphasen geprägt wird. Dabei bilden sich an sogenannten effektiven Engstellen bei entsprechendem Verkehrsaufkommen typische Muster dichten Verkehrs. In verschiedenen früheren Patentanmeldungen der Anmelderin zu dieser Thematik sind die Definition und Charakteristika solcher effektiver Engstellen und der sich stromaufwärts davon bildenden Muster dichten Verkehrs sowie geeignete Verfahren zur Bestimmung, Überwachung und/oder Prognose des Verkehrszustands unter Berücksichtigung solcher Muster dichten Verkehrs stromaufwärts von effektiven Engstellen beschrieben, worauf für weitere Details verwiesen werden kann. Stellvertretend seien hier die Offenlegungsschriften DE 199 44 075 A1 und DE 100 36 789 A1 und die dort genannte Literatur erwähnt.For describing the traffic condition, it has become known to classify this into different status phases, in particular, the phases of "free traffic", in particular the phases of "synchronized traffic", "compressed synchronized traffic" (so-called "pinch region") and "wide traffic congestion", the dynamics of the traffic flow, especially on expressway networks, being significantly influenced by the individual behavior of these traffic Objects and is characterized by phase transitions between these different traffic state phases. In the process, typical patterns of dense traffic are formed at so-called effective bottlenecks with corresponding traffic volumes. Several of Applicants' earlier patent applications to this subject describe the definition and characteristics of such actual bottlenecks and the dense traffic patterns forming upstream therefrom, as well as suitable methods for determining, monitoring and / or forecasting the traffic condition taking into account such dense traffic patterns upstream of effective bottlenecks which can be referred to for further details. Representative here are the published patent applications DE 199 44 075 A1 and DE 100 36 789 A1 and the literature cited therein.
Die Berücksichtigung solcher effektiver Engstellen und der dort gegebenenfalls entstehenden Muster dichten Verkehrs ermöglicht gegenüber einer bloßen Berücksichtigung von Staubereichen eine deutlich verbesserte Genauigkeit und Zuverlässigkeit von Verkehrsprognosen. Analoge Verkehrsstörungsobjekte treten in Verkehrsnetzen von Ballungsräumen, bei denen das Verkehrsgeschehen von verkehrsgeregelten Netzknoten dominiert wird, in Form von sich stromaufwärts solcher verkehrsgeregelter Netzknoten bildenden Warteschlangen-Verkehrsmuster auf, die in entsprechenden Verkehrsprognosen adäquat berücksichtigt werden können, siehe hierzu für weitere Details z.B. die Offenlegungsschriften DE 199 40 957 A1 und DE 100 36 792 A1 und die dort genannte Literatur. In solchen Ballungsraum-Verkehrsnetzen ist die Verkehrsdynamik typischerweise durch die Verkehrsregelungsmaßnahmen an den Netzknoten, wie durch Lichtsignalanlagen an Straßenkreuzungen, dominiert, d.h. die verkehrsgeregelten Netzknoten bilden effektive Engstellen, an denen bei entsprechendem Verkehrsaufkommen Wartschlangen-Verkehrsmuster entstehen, nachfolgend auch einfach als Warteschlangen bezeichnet.The consideration of such effective bottlenecks and the pattern of dense traffic that may arise there, compared to a mere consideration of dusty areas, allows a significantly improved accuracy and reliability of traffic forecasts. Analog traffic jamming objects occur in traffic networks of agglomerations in which the traffic is dominated by traffic-controlled network nodes in the form of upstream such traffic-regulated network node forming queue traffic patterns that can be adequately taken into account in corresponding traffic forecasts, see for further details such as the published patent DE 199 40 957 A1 and DE 100 36 792 A1 and the literature cited therein. In such agglomeration transport networks, traffic dynamics are typically dominated by the traffic control measures at the network nodes, such as traffic lights at road intersections, ie Traffic-controlled network nodes form effective bottlenecks at which queuing traffic patterns arise in the case of corresponding traffic volumes, hereinafter also referred to simply as queues.
Ein in der Offenlegungsschrift DE 101 19 730 A1 offenbartes gattungsgemäßes Verfahren eignet sich besonders zur Anzeige von ermittelten effektiven Engstellen und/oder zugehörigen, ermittelten Mustern dichten Verkehrs eines Schnellstraßennetzes. Diese werden ortsaufgelöst auf einem Bildschirm angezeigt, vorzugsweise auf einer digitalen Wegenetzkarte und/oder in einer Fahrstrecken-Profildarstellung und/oder einer Reisezeit-Profildarstellung fahrtrichtungsselektiv. Zusätzlich können Detailinformationen über die ermittelten Muster dichten Verkehrs angezeigt werden, insbesondere relevante Prognoseinformationen wie Wahrscheinlichkeit der Entstehung, Fahrzeugankunftszeitpunkt, Ausfahrzeitpunkt, Verweildauer, Ausdehnung, Verkehrsdichte auf der jeweiligen Fahrspur, mittlere Fahrzeuggeschwindigkeit, Entstehungszeitpunkt, Auflösungszeitpunkt, Reisezeitverlust und/oder innere Struktur. In Ballungsräumen spielen die dynamischen Effekte der Entstehung und Entwicklung solcher Muster dichten Verkehrs aus den Zustandsphasen freier Verkehr, synchronisierter Verkehr, gestauchter synchronisierter Verkehr und sich bewegende breite Staus kaum eine Rolle, hier wird der Verkehrszustand von der andersartigen Dynamik der erwähnten Warteschlangen-Verkehrsmuster beherrscht.A generic method disclosed in the published patent application DE 101 19 730 A1 is particularly suitable for displaying determined effective bottlenecks and / or associated, determined patterns of dense traffic of a motorway network. These are displayed in a spatially resolved on a screen, preferably on a digital road network map and / or in a route profile display and / or a travel time profile representation driving direction selective. In addition, detailed information about the determined patterns of dense traffic can be displayed, in particular relevant forecast information such as probability of emergence, vehicle arrival time, departure time, residence time, extent, traffic density on the respective lane, average vehicle speed, time of origin, time of dissolution, travel time loss and / or internal structure. In metropolitan areas, the dynamic effects of the emergence and development of such patterns of dense traffic from the free-phase traffic phases, synchronized traffic, compressed synchronized traffic and wide traffic congestion play a minor role. Here, traffic conditions are dominated by the different dynamics of the queuing traffic patterns mentioned above.
Der Erfindung liegt als technisches Problem die Bereitstellung eines Verfahrens der eingangs genannten Art zugrunde, durch das Fahrzeuginsassen und insbesondere der Fahrzeugführer anschaulich, zuverlässig und genau über den für die weitere Fahrt relevanten Verkehrszustand insbesondere auch in Ballungsraumgebieten informiert werden, in denen das Verkehrsgeschehen von der Dynamik von Warteschlangen-Verkehrsmustern dominiert ist.The invention is based on the technical problem of providing a method of the type mentioned by the vehicle occupants and in particular the driver vividly, reliably and accurately informed about the relevant traffic for further driving in particular in metropolitan areas, in which the traffic of the dynamics is dominated by queue traffic patterns.
Die Erfindung löst dieses Problem durch die Bereitstellung eines Verkehrsinformationsanzeigeverfahrens mit den Merkmalen des Anspruchs 1. Bei diesem Verfahren werden als anzuzeigende Verkehrsinformationen mindestens effektive Ballungsraum-Engstellen und zugehörige aktuelle und/oder zukünftig zu erwartende Warteschlangen-Verkehrsmuster ermittelt und ortsaufgelöst, d.h. unter Angabe ihrer Lage auf dem zugrundeliegenden Ballungsraum-Verkehrswegenetz, angezeigt. Die Berücksichtigung der effektiven Ballungsraum-Engstellen, wie sie insbesondere von Lichtsignalanlagen an Kreuzungsbereichen und von Ballungsraum-Baustellen gebildet werden, verbessert signifikant die Qualität der dem Fahrzeugführer angezeigten Verkehrsstörungsinformationen in Ballungsräumen und erlaubt zudem eine deutlich verbesserte Genauigkeit und Zuverlässigkeit weiterer, für den Fahrzeugführer relevanter Verkehrsinformationen, wie z.B. Informationen über optimale Fahrtrouten und voraussichtliche Reisezeiten in Ballungsraumgebieten.The invention solves this problem by providing a traffic information display method having the features of
Bei einem nach Anspruch 2 weitergebildeten Verfahren erfolgt das Anzeigen von effektiven Ballungsraum-Engstellen bzw. Warteschlangen-Verkehrsmustern fahrtrichtungsselektiv nur in der möglichen Fahrtrichtung des Fahrzeugs, so dass der Fahrzeugführer nicht mit der Anzeige von für ihn irrelevanten Informationen z.B. über die Verkehrslage auf Gegenfahrbahnabschnitten belastet wird.In a further developed according to
In einer Weiterbildung der Erfindung nach Anspruch 3 werden die effektiven Ballungsraum-Engstellen mit eventuellen zugehörigen Warteschlangen auf einer digitalen Wegenetzkarte symbolisch angezeigt. Das durch Symbole bewirkte Anzeigen von effektiven Ballungsraum-Engstellen ist für den Nutzer übersichtlich. Zusätzlich können je nach Bedarf zugehörige Detailinformationen in gewünschter Art und Anzahl angezeigt werden, sei es automatisch mit der Symbolanzeige der Ballungsraum-Engstellen oder nur auf Nutzeranforderung hin.In one embodiment of the invention according to
In weiterer Ausgestaltung der Erfindung können gemäß Anspruch 4 als Detailinformationen z.B. die Wahrscheinlichkeit der Entstehung von Warteschlangen, der voraussichtliche Fahrzeugankunftszeitpunkt, die Länge und prognostizierte Zeitpunkte des Auftretens und der Auflösung von Warteschlangen, ein warteschlangenbedingter Reisezeitverlust bzw. die voraussichtliche Wartezeit und/oder die Anzahl von Freiphasenzyklen, während denen der Verkehr an z.B. durch Lichtsignalanlagen verkehrsgeregelten Netzknoten jeweils freigegeben ist, angezeigt werden. Derartige Detailinformationen geben dem Fahrzeugführer je nach Bedarf einen genaueren Eindruck über die zu erwartende Verkehrslage.In a further embodiment of the invention, according to
In einer Weiterbildung der Erfindung nach Anspruch 5 werden die Warteschlangen in ihrer Längenausdehnung zusammen mit der zugehörigen Anzahl von abzuwartenden Freiphasen und/oder der zugehörigen Wartezeit dargestellt. Dies gibt dem Nutzer ein detailliertes Bild von der betreffenden Warteschlange.In a further development of the invention according to
Ein nach Anspruch 6 weitergebildetes Verfahren umfasst das Anzeigen einer ermittelten optimalen Fahrtroute und einer oder mehrerer Alternativrouten zusammen mit zugehörigen prognostizierten Reisezeitinformationen. Der Fahrzeugführer wird auf diese Weise sehr komfortabel über günstige Routen informiert.A further developed according to
Ein nach Anspruch 7 weitergebildetes Verfahren umfasst zusätzlich zur Ermittlung und Anzeige der effektiven Ballungsraum-Engstellen und zugehörigen Warteschlangen das Ermitteln und Anzeigen effektiver Schnellstraßennetz-Engstellen und zugehöriger Muster dichten Verkehrs. Dies gibt dem Fahrzeugführer zuverlässige und komfortable Verkehrsinformationen speziell auch dann, wenn er Gebiete mit sowohl Schnellstraßenals auch Ballungsraum-Streckenabschnitten befährt.A method further developed according to
Vorteilhafte Ausführungsbeispiele der Erfindung sind in den Zeichnungen dargestellt und werden nachfolgend beschrieben. Hierbei zeigen:
- Fig. 1
- eine Bildschirmdarstellung einer digitalen Straßenkarte mit fahrtrichtungsselektiver Anzeige von effektiven Ballungsraum-Engstellen mit zugehörigen Warteschlangen und Informationen über deren Ereigniswahrscheinlichkeit und Antreffzeitpunkt,
- Fig. 2
- eine Darstellung entsprechend Fig. 1, jedoch mit zusätzlichen Reisezeit-Äquidistanzzonen,
- Fig. 3
- eine Darstellung entsprechend Fig. 1, jedoch mit zusätzlicher Angabe der Anzahl von abzuwartenden Verkehrsregelungs-Freiphasen,
- Fig. 4
- eine Darstellung entsprechend Fig. 1, jedoch mit zusätzlicher Angabe der voraussichtlichen Wartezeit in der Warteschlange,
- Fig. 5
- eine Darstellung entsprechend Fig. 1, jedoch mit zusätzlichen Ankunftszeitangaben auch an warteschlangenfreien Wegenetzknoten,
- Fig. 6
- eine Darstellung entsprechend Fig. 1, jedoch mit zusätzlicher Darstellung einer prognostizierten optimalen Fahrtroute und von Alternativrouten mit zugehörigen Reisezeitinformationen,
- Fig. 7
- eine Streckenachsendarstellung für eine ermittelte Route,
- Fig. 8
- eine Zeitachsendarstellung für die ermittelte Route von Fig. 7,
- Fig. 9
- eine detaillierte Darstellung der Ausdehnung einer Warteschlange mit zugehörigen Freiphasen bzw. Wartezyklen,
- Fig. 10
- eine diagrammatische Detaildarstellung einer prognostizierten Warteschlange und Fahrlinie auf Basis einer Durchschnittsgeschwindigkeit,
- Fig. 11
- eine diagrammatische Darstellung entsprechend Fig. 10, jedoch mit prognostiziertem tatsächlichem Fahrzeugbewegungsverlauf in der Warteschlange, und
- Fig. 12
- eine Bildschirmdarstellung einer digitalen Straßenkarte in einem Gebiet mit Ballungsraumbereich und Schnellstraßenbereich mit fahrtrichtungsselektiver Anzeige von effektiven Ballungsraum- und Schnellstraßen-Engstellen.
- Fig. 1
- a screen display of a digital road map with a direction-selective display of effective conurbation bottlenecks with associated queues and information on their probability of occurrence and time of arrival,
- Fig. 2
- a representation corresponding to FIG. 1, but with additional travel time equidistant zones,
- Fig. 3
- a representation corresponding to Figure 1, but with additional indication of the number of waiting traffic control freiphases,
- Fig. 4
- a representation corresponding to FIG. 1, but with additional indication of the expected waiting time in the queue,
- Fig. 5
- a representation corresponding to FIG. 1, but with additional arrival time information also at queuing-free road network node,
- Fig. 6
- 1, but with additional representation of a predicted optimal route and of alternative routes with associated travel time information,
- Fig. 7
- a route axis representation for a determined route,
- Fig. 8
- a time axis representation for the determined route of Fig. 7,
- Fig. 9
- a detailed representation of the extent of a queue with associated free phases or waiting cycles,
- Fig. 10
- a diagrammatic detailed representation of a predicted queue and driving line on the basis of an average speed,
- Fig. 11
- a diagrammatic representation corresponding to FIG 10, but with predicted actual vehicle movement history in the queue, and
- Fig. 12
- a screen display of a digital road map in an area with metropolitan area and expressway area with directionally selective display of effective conurbation and expressway bottlenecks.
Die Figuren veranschaulichen beispielhafte Verkehrsinformationsanzeigen auf einem fahrzeugseitigen Bildschirm, wie sie von verschiedenen vorteilhaften Realisierungen des erfindungsgemäßen Verfahrens zur fahrzeugseitigen Verkehrsinformationsanzeige bereitgestellt werden. Charakteristischer Bestandteil der verschiedenen Verfahrensrealisierungen ist jeweils, dass die angezeigten Verkehrsinformationen neben eventuellen weiteren, herkömmlichen Verkehrsinformationen insbesondere Informationen über die Existenz von effektiven Ballungsraum-Engstellen und deren Lage auf dem betrachteten Wegenetz sowie Informationen über etwaige Warteschlangen-Verkehrsmuster, vorliegend auch kurz als Warteschlangen bezeichnet, enthalten, die sich stromaufwärts von solchen effektiven Ballungsraum-Engstellen bilden können. Zwar wird für die gezeigten Beispiele ein Straßennetz betrachtet, alternativ eignet sich das erfindungsgemäße Verfahren jedoch auch für einen anderen Wegenetztyp mit entsprechenden Verkehrseigenschaften, z.B. ein Schienennetz. Bei den durch die unterschiedlichen Figuren repräsentierten Beispielen kann es sich je nach Anwendungsfall um solche unterschiedlichen Verfahrensrealisierungen handeln, oder es können mehrere dieser Beispiele Bestandteil einer gemeinsamen Verfahrensrealisierung sein, die dann eine Umschaltmöglichkeit zwischen diesen verschiedenen Arten der Verkehrsinformationsanzeige auf dem Bildschirm aufweist.The figures illustrate exemplary traffic information displays on a vehicle-side screen, as provided by various advantageous implementations of the method according to the invention for the vehicle-side traffic information display. Characteristic component of the various process implementations is in each case that the displayed traffic information in addition to any other conventional traffic information in particular information about the existence of effective congestion bottlenecks and their location on the considered road network and information about any queue traffic patterns, in the present case also referred to as queues, contained upstream of such effective agglomeration bottlenecks. Although a road network is considered for the examples shown, alternatively, however, the inventive method is also suitable for another type of road network with appropriate traffic characteristics, such as a rail network. The examples represented by the different figures may vary depending on the application may be such different process implementations, or several of these examples may be part of a shared process implementation, which then has a switching capability between these different types of traffic information display on the screen.
Die dem vorliegenden Verkehrsinformationsanzeigeverfahren zugrundeliegenden Mittel und Methoden zur Erfassung des aktuellen und/oder prognostizierten, anzuzeigenden Verkehrszustands sind z.B. in diesbezüglichen früheren Patentanmeldungen der Anmelderin eingehend beschrieben, siehe auch die eingangs zitierten Druckschriften und die dort zitierte weitere Literatur, so dass darauf verwiesen werden kann und dies keiner weiteren Erläuterung bedarf. Insbesondere können geeignete Mittel und Methoden zur Bestimmung der Lage effektiver Engstellen in Ballungsraumnetzen und optional auch in Schnellstraßennetzen und zur Bestimmung von dort auftretenden Warteschlangen bzw. Mustern dichten Verkehrs für das vorliegende Verfahren vorausgesetzt werden. Dies können, wie dem Fachmann geläufig, sowohl fahrzeugautonom arbeitende Systeme, mit Fahrzeug-Fahrzeug-Kommunikation arbeitende Systeme und/oder mit einer Verkehrszentrale arbeitende Systeme zur Ermittlung des aktuellen und/oder Prognose des zukünftigen Verkehrszustands auf einem interessierenden Wegenetzbereich sein, die vor allem auch die Erfassung von individualisierbaren Verkehrsstörungsobjekten ermöglichen, wie effektiven Ballungsraum-Engstellen, insbesondere lichtsignalanlagengeregelte Netzknoten, und vor solchen gebildete Warteschlangen sowie von sich bewegenden breiten Staus, synchronisiertem Verkehr und gestauchtem synchronisiertem Verkehr und aus solchen Verkehrszustandsphasen aufgebauten Mustern dichten Verkehrs vor effektiven Engstellen in Schnellstraßennetzgebieten.The means and methods underlying the present traffic information display method for detecting the current and / or predicted traffic condition to be displayed are e.g. in the related patent applications of the applicant described in detail, see also the cited documents and cited therein further literature, so that it can be referred to and this requires no further explanation. In particular, suitable means and methods for determining the location of effective bottlenecks in metropolitan area networks and optionally also in expressway networks and for determining queues or patterns of dense traffic occurring there may be required for the present method. As is familiar to the person skilled in the art, this can be both systems working autonomously with the vehicle, systems operating with vehicle-vehicle communication and / or systems operating with a traffic center for determining the current and / or forecasting of the future traffic condition on a road network of interest, above all the detection of customizable traffic obstruction objects, such as effective congestion bottlenecks, in particular, light signal-controlled network nodes, and queues formed before them, as well as wide jams, synchronized traffic and compressed synchronized traffic, and patterns built up from such traffic state phases, enable dense traffic from effective bottlenecks in expressway network areas.
Fig. 1 veranschaulicht als eine Grundform ein Verfahrensbeispiel, bei dem auf der Basis einer digitalen Straßenkarte ausgehend vom jeweils momentanen Fahrzeugort als Startpunkt ermittelt und angezeigt wird, ob und wenn ja wo sich spezifisch für die möglichen Fahrtrichtungen eines betrachteten Fahrzeugs F effektive Ballungsraum-Engstellen innerhalb eines den Fahrzeugstandort enthaltenden Ballungsraum-Wegenetzbereiches befinden, auf die das Fahrzeug F bei seiner weiteren Fahrt je nach gewählter Fahrtrichtung treffen könnte. Solche effektiven Ballungsraum-Engstellen sind insbesondere durch Lichtsignalanlagen an Netzknoten, d.h. Straßenkreuzungsbereichen, und durch Baustellen gebildet. Im Beispiel von Fig. 1 sind dies vier Lichtsignalanlagen-Engstellen E1 bis E4 und eine Baustellen-Engstelle E5. Die Engstellen E1 bis E5 werden symbolisch als Kreuze in Verbindung mit einer intuitiven Verkehrsschilddarstellung am entsprechenden Streckenpunkt der digitalen Straßenkarte auf einem Bildschirm B im Fahrzeug F angezeigt. Dies ermöglicht es dem Fahrzeugführer, darauf bei Bedarf rechtzeitig zu reagieren.1 illustrates, as a basic form, a method example in which, based on a digital road map, starting from the respective current vehicle location as a starting point is determined and displayed whether and if so where specific for the possible directions of travel of a considered vehicle F effective agglomeration bottlenecks within a vehicle location containing metropolitan area network area, which could meet the vehicle F in his further drive depending on the selected direction. Such effective agglomeration bottlenecks are formed, in particular, by traffic light systems at network nodes, ie intersection areas, and by construction sites. In the example of FIG. 1, these are four traffic signal bottlenecks E1 to E4 and a construction site bottleneck E5. The bottlenecks E1 to E5 are symbolically displayed as crosses in conjunction with an intuitive traffic sign representation at the corresponding route point of the digital road map on a screen B in the vehicle F. This allows the driver to respond promptly when needed.
Hierzu trägt die zusätzliche Darstellung von Detailinformationen für jede Engstelle E1 bis E5 bei. So werden im Beispiel von Fig. 1 Warteschlangen W1 bis W5 angezeigt, die für denjenigen Zeitpunkt an der zugehörigen Engstelle E1 bis E5 prognostiziert werden, zu dem das Fahrzeug F aufgrund der Resultate der durchgeführten Verkehrsprognose dort voraussichtlich ankommt und auf die es dann trifft. Die Anzeige der Warteschlangen W1 bis W5 erfolgt durch Balken mit einer der prognostizierten Warteschlangenlänge entsprechenden Länge. Es kann sich dabei auch um sogenannte übergreifende Warteschlangen, wie im Fall der Warteschlangen W1 und W3 handeln, die sich stromaufwärts über einen oder mehrere Netzknoten hinaus erstrecken. Zu jeder Warteschlange W1 bis W5 sind außerdem die zugehörige Prognosewahrscheinlichkeit ihres Auftretens in Prozent und der voraussichtliche Ankunftszeitpunkt angegeben.The additional presentation of detailed information for each bottleneck E1 to E5 contributes to this. Thus, in the example of FIG. 1, queues W1 to W5 are displayed, which are forecasted for the time at the associated bottleneck E1 to E5, to which the vehicle F is expected to arrive on the basis of the results of the traffic forecast and which it then encounters. The display of the queues W1 to W5 is performed by bars having a length corresponding to the predicted queue length. These may also be so-called cross queues, as in the case of queues W1 and W3, which extend upstream beyond one or more network nodes. For each queue W1 to W5, the associated probability of occurrence of their occurrence in percent and the estimated time of arrival are also indicated.
Es versteht sich, dass in alternativen Ausführungsformen mehr oder weniger solche Detailinformationen über prognostizierte Ballungsraum-Warteschlangen angezeigt werden können, und zwar alternativ automatisch oder nur auf eine spezielle Nutzeranforderung hin, z.B. durch entsprechende Betätigung von Bedienelementen für den Bildschirm B durch einen Fahrzeuginsassen. So können je nach Bedarf nur die ermittelten Ballungsraum-Engstellen durch ihre entsprechenden Symbole auf der digitalen Straßenkarte oder nur diese zusammen mit den Warteschlangenbalken oder zusätzlich auch Ballungsraum-Engstellen auf Gegenrichtungsfahrbahnen mit oder ohne zugehörige Warteschlangen und zu diesen gehörende Detailinformationen dargestellt werden.It is understood that in alternative embodiments, more or less such detailed information about predicted metropolitan queues may be displayed, alternatively or automatically, or only to a particular user request towards, for example, by appropriate operation of controls for the screen B by a vehicle occupant. Thus, depending on the needs, only the identified congestion bottlenecks can be represented by their corresponding symbols on the digital road map or only together with the queue bars or additionally conurbation bottlenecks on opposite direction lanes with or without associated queues and detailed information associated with them.
Fig. 2 zeigt eine Darstellungsvariante, bei der zusätzlich zu den Informationen von Fig. 1 Reisezeit-Äquidistanzzonen wiedergegeben werden, d.h. das Fahrzeug F kann an jede Stelle der betreffenden Zone mit voraussichtlich gleicher maximaler Ankunftszeit auf der Grundlage der prognostizierten Verkehrslage gelangen. Zu den zonenbegrenzenden Äquidistanzlinien ist die prognostizierte Ankunftszeit angegeben. Im Beispiel von Fig. 2 sind drei Äquidistanzlinien D1, D2, D3 explizit wiedergegeben, zu denen ein prognostizierter Reisezeitabstand von jeweils 5 Minuten gehört.FIG. 2 shows a display variant in which travel time equidistance zones are reproduced in addition to the information of FIG. the vehicle F can get to any point in the zone concerned, with the likely same maximum time of arrival, on the basis of the predicted traffic situation. The predicted arrival time is given for the zone-limiting equidistant lines. In the example of FIG. 2, three equidistant lines D1, D2, D3 are explicitly reproduced, to which a predicted travel time interval of 5 minutes each belongs.
Im Beispiel von Fig. 3 wird zusätzlich zu den Symbolen der ermittelten Ballungsraum-Engstellen, den Warteschlangenbalken und prognostizierten Ereigniswahrscheinlichkeiten die Anzahl an Freiphasen angezeigt, die voraussichtlich bei Ankommen an der betreffenden Warteschlange dort abgewartet werden müssen, bis die zugehörige Engstelle passiert werden kann. Speziell handelt es sich bei Lichtsignalanlagen um die Anzahl an entsprechenden Grünphasen, vorliegend auch Ampel-Zyklen bezeichnet. Dies gibt dem Nutzer einen weiteren Hinweis über die Stärke der Warteschlangen-Verkehrsstörung.In the example of FIG. 3, in addition to the symbols of the identified congestion bottlenecks, the queue bars and predicted event probabilities, the number of free phases that are likely to be awaited on arriving at the queue in question is displayed until the associated bottleneck can be passed. Specifically, it is in the light signal systems to the number of corresponding green phases, in the present case also called traffic light cycles. This gives the user a further indication of the strength of the queue traffic jam.
Fig. 4 zeigt eine Variante von Fig. 3, bei der statt der Anzahl von Ampel-Zyklen für jede prognostizierte Warteschlange W1 bis W5 die voraussichtliche Wartezeit in Sekunden angegeben ist, die das Fahrzeug F zum Passieren der Warteschlange W1 bis W5 benötigt.Fig. 4 shows a variant of Fig. 3, in which, instead of the number of traffic light cycles for each forecasted queue W1 to W5, the probable waiting time in seconds which the vehicle F needs to pass the queue W1 to W5 is indicated.
Fig. 5 zeigt ein Verfahrensbeispiel, bei dem aus der Verkehrsprognose zusätzlich zu den Symbolen der ermittelten Ballungsraum-Engstellen E1 bis E5 und den Längsbalken der zugehörigen prognostizierten Warteschlangen W1 bis W5 prognostizierte Ankunftszeitpunkte als Uhrzeiten für die Ballungsraum-Engstellen und für Netzknoten angegeben werden, zu denen das Fahrzeug F eventuell fahren könnte.FIG. 5 shows a method example in which predicted arrival times are indicated as times for conurbation bottlenecks and for network nodes in addition to the symbols of the identified congestion bottlenecks E1 to E5 and the longitudinal bars of the associated predicted queues W1 to W5 which the vehicle F could possibly drive.
Bei einer in Fig. 6 veranschaulichten Verfahrensvariante werden zusätzlich zu den Ballungsraum-Engstellen E1 bis E5 und den zugehörigen prognostizierten Warteschlangen W1 bis W5 aus der Verkehrsprognose resultierende Routenempfehlungen dargestellt, und zwar eine prognostizierte optimale Route R und eine oder mehrere Alternativrouten, in der Darstellung von Fig. 6 zwei Alternativrouten A1 und A2. Es versteht sich, dass der Routenempfehlung, wie in allen vorliegend betrachteten Fällen, eine Verkehrsprognose zugrunde liegt, welche etwaige Verkehrsstörungsobjekte zeitrichtig, d.h. zum Zeitpunkt des vorausgesagten Eintreffens des Fahrzeugs F, prognostiziert, insbesondere auch die Warteschlangen W1 bis W5. Die Route R erweist sich als optimal, d.h. zeitlich am kürzesten, obwohl sie über die Warteschlange W1 führt. Am Zielpunkt Z ist auf der dargestellten digitalen Straßenkarte der voraussichtliche Ankunftszeitpunkt angegeben. Für die Alternativrouten sind die Reisezeitunterschiede angegeben, d.h. die bezogen auf die optimale Route R zusätzliche Fahrtzeit bis zum Erreichen des Zielpunkts Z. Für die beiden angezeigten Alternativrouten A1, A2, welche die prognostizierten Warteschlangen W1 bis W5 umgehen, sind dies zusätzliche Fahrtdauern von 1 Minute bzw. 3 Minuten.In a variant of the method illustrated in FIG. 6, route recommendations resulting from the traffic forecast are displayed in addition to the congestion bottlenecks E1 to E5 and the associated predicted queues W1 to W5, namely a predicted optimal route R and one or more alternative routes, in the representation of FIG Fig. 6 two alternative routes A1 and A2. It is understood that the route recommendation, as in all the cases considered in the present case, is based on a traffic prognosis which corrects any traffic disruption objects in time, i. at the time of the predicted arrival of the vehicle F, predicts, in particular, the queues W1 to W5. The route R proves to be optimal, i. shortest in time, although it passes over the queue W1. At the destination point Z, the estimated time of arrival is indicated on the illustrated digital road map. For the alternative routes the travel time differences are indicated, i. with respect to the optimal route R additional travel time until reaching the destination point Z. For the two displayed alternative routes A1, A2, which bypass the predicted queues W1 to W5, these are additional driving time of 1 minute or 3 minutes.
Die Fig. 7 und 8 veranschaulichen alternative Darstellungsmöglichkeiten einer prognostizierten Route als Streckenachsen- bzw. Zeitachsenprofil. Speziell zeigt Fig. 7 eine wiederum auf dem Bildschirm B des Fahrzeugs optisch darstellbare Streckenachse mit einem vor dem Fahrzeug F liegenden Strecken- bzw. Fahrbahnabschnitt Sa und zugeordnetem Maßstab der Streckenlänge s ab dem momentanen Fahrzeugstandort. Alternativ oder zusätzlich kann auf dem fahrzeugseitigen Bildschirm eine Zeitachsendarstellung gemäß Fig. 8 gewählt werden, bei welcher der Streckenabschnitt Sa im Vorfeld des Fahrzeugs F in Zeitlängenform mit zugeordnetem linearem Zeitmaßstabt angezeigt wird, der die prognostizierte Reisezeit angibt.FIGS. 7 and 8 illustrate alternative ways of presenting a predicted route as a route axis or time axis profile. In particular, FIG. 7 shows a track axis, which in turn can be visually displayed on the screen B of the vehicle, with a track or road section Sa lying in front of the vehicle F and with an associated scale of FIG Distance s from the current vehicle location. Alternatively or additionally, a time axis representation according to FIG. 8 can be selected on the vehicle-side screen, in which the route section Sa is displayed in advance of the vehicle F in time-length form with an associated linear time scale indicating the predicted travel time.
Wie aus den Fig. 7 und 8 ersichtlich, sind in diesen Darstellungen entlang der Strecken- bzw. Zeitachse an der betreffenden Stelle die prognostizierten Lichtsignalanlagen- bzw. Baustellen-Engstellen als Symbole und vorhergesagte Warteschlangen W6, W7 an diesen als Balken sowie etwaige Geschwindigkeitsbegrenzungen und Abbiegevorgänge in entsprechender Verkehrsschildform wiedergegeben. Je nach Bedarf können andere oder weitere Verkehrsinformationen entlang der Strecken- oder Zeitachse dargestellt werden. Außerdem zeigen die Beispiele der Fig. 7 und 8 einen Fall, bei dem nach dem Abbiegen ein Straßenabschnitt befahren wird, an dem sich eine effektive Engstelle E6 befindet, vor der sich bei Eintreffen des Fahrzeugs F gemäß der zugrundeliegenden Verkehrsprognose ein Muster M dichten Verkehrs gebildet hat.As can be seen from FIGS. 7 and 8, in these representations along the track or timeline at the location concerned, the predicted traffic signal bottlenecks as symbols and predicted queues W6, W7 at these as bars and any speed limits and Turning represented in corresponding traffic sign shape. Depending on requirements, other or further traffic information along the route or time axis can be displayed. In addition, the examples of Figs. 7 and 8 show a case in which, after turning, a road section is driven on which there is an effective constriction E6 before which a pattern M dense traffic formed upon arrival of the vehicle F according to the underlying traffic forecast Has.
Als weitere Verkehrsvariante kann z.B. auf Fahreranforderung hin eine Detaildarstellung der jeweiligen prognostizierten Warteschlange aktiviert werden, wie sie beispielhaft in Fig. 9 gezeigt ist. Wie daraus ersichtlich, wird hierzu der Fahrbahnbereich stromaufwärts der die Warteschlange verursachenden effektiven Ballungsraum-Engstelle dargestellt und die Warteschlange darin als Balken mit einer der Warteschlangenlänge entsprechenden Balkenlänge eingetragen, vorzugsweise individuell für jede Fahrtrichtungsspur. Als weitere Detailinformation enthält der Warteschlangen-Balkeneintrag, dessen Gesamtlänge in Fig. 9 von einer zugehörigen geschweiften Klammer umfasst wird, eine Unterteilung in Balkenlängeneinheiten je eines Freiphasenzyklus, dort als Warte-Zyklus bezeichnet. Die Länge jedes Warte-Zyklus gibt folglich die während einer Freiphase, wie einer Ampel-Grünphase, vom Fahrzeug in der Warteschlange voraussichtlich zurückgelegte Fahrstrecke an. Im Beispiel von Fig. 9 handelt es sich um eine übergreifende Warteschlange W8 mit einer Länge von insgesamt 9,3 Warte-Zyklen auf einer Rechtsabbiegespur, d.h. ein auf die Warteschlange W8 auffahrendes Fahrzeug kann an der ampelgeregelten Kreuzung voraussichtlich in der zehnten Grünphase nach rechts abbiegen. Auf einer zusätzlich wiedergegebenen Linksabbiegespur liegt keine übergreifende Warteschlange vor. Ersichtlich liefert diese Darstellung dem Fahrzeugführer eine sehr detaillierte Information über eine Warteschlange, auf die er eventuell im weiteren Fahrverlauf trifft.As a further traffic variant, for example, a detailed representation of the respective predicted queue can be activated, as shown by way of example in FIG. 9, at the request of the driver. As can be seen, the lane area upstream of the queue causing congestion bottleneck is represented for this purpose and the queue is entered therein as a bar having a bar length corresponding to the queue length, preferably individually for each lane. As further detail information, the queue bar entry, the overall length of which is included in Fig. 9 by an associated curly brace, includes a subdivision into beam length units of each free phase cycle, there called a wait cycle. The length of each wait cycle thus gives the vehicle during a free phase, such as a traffic light green phase expected distance traveled in the queue. 9 is an overall queue W8 with a total length of 9.3 wait cycles on a right turn lane, ie a vehicle approaching the queue W8 is likely to turn right at the traffic light controlled intersection in the tenth green phase , There is no overlapping queue on an additionally displayed left turn lane. Obviously, this representation provides the driver with very detailed information about a queue that he may encounter later in the journey.
Dies gilt auch für die diagrammatischen Warteschlangendarstellungen, wie sie in den Verfahrensvarianten der Fig. 10 und 11 vorgesehen sind. In diesen Darstellungen wird eine prognostizierte Warteschlange W9 stromaufwärts einer Ballungsraum-Engstelle, wie einer lichtsignalanlagebedingten Engstelle, in ihrer räumlich-zeitlichen Ausdehnung veranschaulicht, d.h. in einem Diagramm mit auf einer Abszisse abgetragenem Zeitverlauf t und auf einer Ordinate in Fahrtrichtung abgetragener Streckenlänge s. Auf der Zeitachse t sind die Grünphasen-Zeitintervalle und die Rotphasen-Zeitintervalle der Lichtsignalanlage markiert, wobei die Summe einer Rotphasen-Zeit und einer Grünphasen-Zeit als Umlauf-Zeit bezeichnet ist, welche die zeitliche Periodenlänge der Lichtsignalanlagenregelung repräsentiert. Zusätzlich ist die prognostizierte Bewegung des Fahrzeugs F als entsprechende prognostizierte Fahrlinie angegeben. Im Beispiel von Fig. 10 wird für die Darstellung der prognostizierten Fahrlinie während des Durchquerens der Warteschlange W9 eine berechnete Durchschnittsgeschwindigkeit des Fahrzeugs in der Warteschlange zugrundegelegt, während im Fall von Fig. 11 die prognostizierte Fahrzeugbewegung innerhalb der Warteschlange W9 in ihrem exakten Strecken- und Zeitverlauf wiedergegeben wird.This also applies to the diagrammatic queue representations, as provided in the method variants of FIGS. 10 and 11. In these illustrations, a predicted queue W9 upstream of a congestion bottleneck, such as a congestion-related constriction, is illustrated in its spatial-temporal extent, i. in a diagram with the time course t removed on an abscissa and the distance s worn on an ordinate in the direction of travel s. The green-phase time intervals and the red-phase time intervals of the traffic signal system are marked on the time axis t, the sum of a red-phase time and a green-phase time being designated as the circulation time, which represents the time period length of the traffic signal system control. In addition, the predicted movement of the vehicle F is indicated as the corresponding predicted driving line. In the example of Fig. 10, for the representation of the predicted driving line during the crossing of the queue W9, a calculated average speed of the vehicle in the queue is used, while in the case of Fig. 11 the predicted vehicle movement within the queue W9 is based on its exact route and time is reproduced.
In einer weiteren vorteilhaften Ausführungsform umfasst das erfindungsgemäße Verfahren sowohl eine Verkehrsprognose von effektiven Ballungsraum-Engstellen und an diesen entstehenden Warteschlangen in Ballungsraumgebieten eines betrachteten Wegenetzes als auch von effektiven Schnellstraßen-Engstellen und an diesen entstehenden Mustern dichten Verkehrs in Schnellstraßengebieten des Wegenetzes. Die ermittelten Ballungsraum-Engstellen mit zugehörigen Warteschlangen und die Schnellstraßen-Engstellen mit zugehörigen Mustern dichten Verkehrs werden dann kombiniert auf einer digitalen Straßenkarte am Bildschirm B im Fahrzeug dargestellt. Fig. 12 zeigt beispielhaft eine derartige Bildschirmdarstellung mit einer Lichtsignalanlagen-Engstelle in einem Ballungsraumgebiet und vier effektiven Schnellstraßen-Engstellen in einem Schnellstraßennetzgebiet. Die zugehörigen Warteschlangen bzw. Muster dichten Verkehrs sind jeweils wiederum mit Balken entsprechender Länge wiedergegeben. Zusätzlich können auch in diesem Ausführungsbeispiel weitere Detailinformationen zu den einzelnen Engstellen je nach Bedarf angezeigt werden, wie oben zu den anderen gezeigten Beispielen erläutert.In a further advantageous embodiment, the method according to the invention comprises both a traffic forecast of effective congestion bottlenecks and resulting queues in metropolitan areas of a considered road network as well as effective motorway bottlenecks and on these resulting patterns dense traffic in highways areas of the road network. The determined metropolitan bottlenecks with associated queues and the expressway bottlenecks with associated dense traffic patterns are then displayed combined on a digital road map on the screen B in the vehicle. FIG. 12 shows by way of example such a screen display with a traffic signal bottleneck in a conurbation area and four effective expressway bottlenecks in a motorway network area. The associated queues or patterns dense traffic are in turn each represented with bars of appropriate length. In addition, in this embodiment, further detailed information on the individual bottlenecks can be displayed as needed, as explained above for the other examples shown.
Insgesamt zeigen die beschriebenen Ausführungsbeispiele, dass das erfindungsgemäße Verfahren eine komfortable und realitätsnahe Wiedergabe von prognostizierten Verkehrsstörungsmustern in Ballungsräumen und optional zusätzlich in Schnellstraßennetzgebieten auf der Basis geeigneter herkömmlicher Verkehrsprognoseverfahren ermöglicht.Overall, the described embodiments show that the inventive method allows a comfortable and realistic reproduction of predicted traffic disturbance patterns in metropolitan areas and optionally additionally in expressway network areas on the basis of suitable conventional traffic forecasting methods.
Claims (7)
- Method for displaying traffic information in a vehicle, with which- the traffic information is determined at the vehicle and/or is determined externally to the vehicle and is transmitted to the vehicle and displayed at the vehicle, characterized in that- the determination of the traffic information which is to be displayed comprises determining effective conurbation bottlenecks (E1 to E5) and associated queuing traffic patterns of a conurbation transport route network under consideration, and- the determined, effective conurbation bottlenecks and queuing traffic patterns which are determined are displayed at the vehicle with resolution at the local level.
- Method according to Claim 1, further characterized in that the effective conurbation bottlenecks and/or the queuing traffic patterns are determined and displayed selectively with respect to the direction of travel.
- Method according to Claim 1 or 2, further characterized in that the effective conurbation bottlenecks and queuing traffic patterns are displayed in symbol form on a digital route network map on a screen (B) in the vehicle, and associated detailed information is displayed automatically or on request by a user.
- Method according to Claim 3, further characterized in that the displayed detailed information comprises information about the length of projected queuing traffic patterns, about predicted queuing waiting times, number of free phases, the time when the queuing traffic patterns occur and break up, their event probability, predicted travel times, queuing-related travel time losses and/or vehicle arrival times for the respective queuing traffic pattern.
- Method according to one of Claim 1 to 4, further characterized in that the queuing traffic patterns are represented in their local extent together with the associated number of free phase cycles to be waited for and/or the associated waiting time.
- Method according to one of Claims 1 to 5, further characterized in that a predicted optimum route and one or more alternative routes from the current location of the vehicle to a predefined destination are represented together with associated arrival times and differences in travel time.
- Method according to one of Claims 1 to 6, further characterized in that- the determination of the traffic information to be displayed additionally comprises determination of effective bottlenecks of a high-speed route network which, like the conurbation route network, forms part of a transport route network under consideration, and- the determined, effective high-speed bottlenecks are also displayed at the vehicle together with associated determined patterns of dense traffic with resolution at the local level.
Applications Claiming Priority (2)
| Application Number | Priority Date | Filing Date | Title |
|---|---|---|---|
| DE10349179A DE10349179A1 (en) | 2003-10-22 | 2003-10-22 | Method for vehicle-side traffic information display |
| DE10349179 | 2003-10-22 |
Publications (3)
| Publication Number | Publication Date |
|---|---|
| EP1526493A2 EP1526493A2 (en) | 2005-04-27 |
| EP1526493A3 EP1526493A3 (en) | 2005-06-01 |
| EP1526493B1 true EP1526493B1 (en) | 2006-07-05 |
Family
ID=34384403
Family Applications (1)
| Application Number | Title | Priority Date | Filing Date |
|---|---|---|---|
| EP04024478A Active EP1526493B1 (en) | 2003-10-22 | 2004-10-14 | Method for display of traffic information in a vehicle |
Country Status (3)
| Country | Link |
|---|---|
| EP (1) | EP1526493B1 (en) |
| AT (1) | ATE332553T1 (en) |
| DE (2) | DE10349179A1 (en) |
Cited By (1)
| Publication number | Priority date | Publication date | Assignee | Title |
|---|---|---|---|---|
| CN103377559A (en) * | 2012-04-20 | 2013-10-30 | 腾讯科技(深圳)有限公司 | Method and system for displaying road condition information of electronic map |
Families Citing this family (3)
| Publication number | Priority date | Publication date | Assignee | Title |
|---|---|---|---|---|
| DE102005010246A1 (en) * | 2005-03-05 | 2006-09-07 | Deutsche Telekom Ag | Method and device for transmitting normal forms of traffic jams for the purpose of time-dependent navigation |
| EP3154043B1 (en) * | 2015-10-06 | 2021-01-13 | Volkswagen Aktiengesellschaft | Method and system for providing information about the surroundings of a crossing |
| CN111798660B (en) * | 2020-06-30 | 2021-12-07 | 腾讯科技(深圳)有限公司 | Vehicle information display and acquisition method and device and related equipment |
Family Cites Families (3)
| Publication number | Priority date | Publication date | Assignee | Title |
|---|---|---|---|---|
| DE19951546C2 (en) * | 1999-10-26 | 2002-03-21 | Siemens Ag | Method for notifying a user of traffic information and a navigation device |
| DE10036792A1 (en) * | 2000-07-28 | 2002-02-07 | Daimler Chrysler Ag | Monitoring traffic in road network by classification and pattern analysis, defines and observes repeated patterns, intervals and locations of dense traffic |
| DE10119730A1 (en) * | 2001-04-21 | 2002-11-21 | Daimler Chrysler Ag | On-board display for providing vehicle information with regard to determining location of traffic bottlenecks on road network comprises display layout on on-board screen |
-
2003
- 2003-10-22 DE DE10349179A patent/DE10349179A1/en not_active Withdrawn
-
2004
- 2004-10-14 AT AT04024478T patent/ATE332553T1/en not_active IP Right Cessation
- 2004-10-14 EP EP04024478A patent/EP1526493B1/en active Active
- 2004-10-14 DE DE502004000912T patent/DE502004000912D1/en active Active
Cited By (1)
| Publication number | Priority date | Publication date | Assignee | Title |
|---|---|---|---|---|
| CN103377559A (en) * | 2012-04-20 | 2013-10-30 | 腾讯科技(深圳)有限公司 | Method and system for displaying road condition information of electronic map |
Also Published As
| Publication number | Publication date |
|---|---|
| DE502004000912D1 (en) | 2006-08-17 |
| ATE332553T1 (en) | 2006-07-15 |
| EP1526493A3 (en) | 2005-06-01 |
| DE10349179A1 (en) | 2005-05-25 |
| EP1526493A2 (en) | 2005-04-27 |
Similar Documents
| Publication | Publication Date | Title |
|---|---|---|
| EP1110195B1 (en) | Traffic surveillance method and vehicle flow control in a road network | |
| EP0029201B1 (en) | Method for traffic coverage in a guiding and information system for individual traffic | |
| DE112012001799B4 (en) | Drive assistance device | |
| EP1212738B1 (en) | Method for monitoring the condition of traffic for a traffic network comprising effective narrow points | |
| DE10037827B4 (en) | Vehicle autonomous traffic information system | |
| EP3223257B1 (en) | Method and device for influencing a traffic control device | |
| EP1154389A1 (en) | Method to determine the traffic situation in a road network | |
| DE102012218935A1 (en) | Highway threading assistant and control | |
| DE102011113019A1 (en) | Method for determining and evaluating hazards of traffic conditions between e.g. vehicles in signal-controlled junction, involves performing probabilistic hazard estimation of hazards for road users moved relative to movement | |
| EP1303845B1 (en) | Method for determining traffic related information | |
| DE102016013972A1 (en) | Driver assistance system and method | |
| DE102015215605A1 (en) | Method for controlling a traffic control system | |
| DE10057796B4 (en) | Method for vehicle-specific traffic condition forecasting | |
| DE102008062012A1 (en) | navigation device | |
| DE69631629T2 (en) | Registration and prediction of traffic obstructions | |
| DE19725556A1 (en) | Method and device for predicting traffic conditions | |
| DE10062856A1 (en) | Traffic prediction system for individual vehicles uses data captured by vehicle itself and other vehicle data that is analyzed using dynamic traffic prediction algorithm | |
| EP1466140B1 (en) | Method for determining a travel time | |
| DE10108611A1 (en) | Simulation and prediction method for individual motor vehicle movement within a road network, by separation of macroscopic modeling from microscopic or individual vehicle modeling | |
| EP1526493B1 (en) | Method for display of traffic information in a vehicle | |
| DE19940957C2 (en) | Traffic forecasting method for a traffic network with traffic-regulated network nodes | |
| DE10119730A1 (en) | On-board display for providing vehicle information with regard to determining location of traffic bottlenecks on road network comprises display layout on on-board screen | |
| DE10336590A1 (en) | Customized traffic forecast method for individual vehicles, using vehicle based traffic computer to create forecasts based on traffic conditions data captured on side of other vehicles and transmitted to individual vehicle | |
| DE10025039C2 (en) | Method for determining traffic control phase durations | |
| EP1528524B1 (en) | Method for traffic prognosis based on historical data |
Legal Events
| Date | Code | Title | Description |
|---|---|---|---|
| PUAI | Public reference made under article 153(3) epc to a published international application that has entered the european phase |
Free format text: ORIGINAL CODE: 0009012 |
|
| PUAL | Search report despatched |
Free format text: ORIGINAL CODE: 0009013 |
|
| AK | Designated contracting states |
Kind code of ref document: A2 Designated state(s): AT BE BG CH CY CZ DE DK EE ES FI FR GB GR HU IE IT LI LU MC NL PL PT RO SE SI SK TR |
|
| AX | Request for extension of the european patent |
Extension state: AL HR LT LV MK |
|
| AK | Designated contracting states |
Kind code of ref document: A3 Designated state(s): AT BE BG CH CY CZ DE DK EE ES FI FR GB GR HU IE IT LI LU MC NL PL PT RO SE SI SK TR |
|
| AX | Request for extension of the european patent |
Extension state: AL HR LT LV MK |
|
| RIC1 | Information provided on ipc code assigned before grant |
Ipc: 7G 08G 1/0969 B Ipc: 7G 08G 1/0967 A |
|
| 17P | Request for examination filed |
Effective date: 20050616 |
|
| GRAP | Despatch of communication of intention to grant a patent |
Free format text: ORIGINAL CODE: EPIDOSNIGR1 |
|
| AKX | Designation fees paid |
Designated state(s): AT BE BG CH CY CZ DE DK EE ES FI FR GB GR HU IE IT LI LU MC NL PL PT RO SE SI SK TR |
|
| RIC1 | Information provided on ipc code assigned before grant |
Ipc: G08G 1/01 20060101AFI20060119BHEP |
|
| GRAS | Grant fee paid |
Free format text: ORIGINAL CODE: EPIDOSNIGR3 |
|
| GRAA | (expected) grant |
Free format text: ORIGINAL CODE: 0009210 |
|
| AK | Designated contracting states |
Kind code of ref document: B1 Designated state(s): AT BE BG CH CY CZ DE DK EE ES FI FR GB GR HU IE IT LI LU MC NL PL PT RO SE SI SK TR |
|
| PG25 | Lapsed in a contracting state [announced via postgrant information from national office to epo] |
Ref country code: IT Free format text: LAPSE BECAUSE OF FAILURE TO SUBMIT A TRANSLATION OF THE DESCRIPTION OR TO PAY THE FEE WITHIN THE PRESCRIBED TIME-LIMIT;WARNING: LAPSES OF ITALIAN PATENTS WITH EFFECTIVE DATE BEFORE 2007 MAY HAVE OCCURRED AT ANY TIME BEFORE 2007. THE CORRECT EFFECTIVE DATE MAY BE DIFFERENT FROM THE ONE RECORDED. Effective date: 20060705 Ref country code: NL Free format text: LAPSE BECAUSE OF FAILURE TO SUBMIT A TRANSLATION OF THE DESCRIPTION OR TO PAY THE FEE WITHIN THE PRESCRIBED TIME-LIMIT Effective date: 20060705 Ref country code: RO Free format text: LAPSE BECAUSE OF FAILURE TO SUBMIT A TRANSLATION OF THE DESCRIPTION OR TO PAY THE FEE WITHIN THE PRESCRIBED TIME-LIMIT Effective date: 20060705 Ref country code: IE Free format text: LAPSE BECAUSE OF FAILURE TO SUBMIT A TRANSLATION OF THE DESCRIPTION OR TO PAY THE FEE WITHIN THE PRESCRIBED TIME-LIMIT Effective date: 20060705 Ref country code: GB Free format text: LAPSE BECAUSE OF FAILURE TO SUBMIT A TRANSLATION OF THE DESCRIPTION OR TO PAY THE FEE WITHIN THE PRESCRIBED TIME-LIMIT Effective date: 20060705 Ref country code: FI Free format text: LAPSE BECAUSE OF FAILURE TO SUBMIT A TRANSLATION OF THE DESCRIPTION OR TO PAY THE FEE WITHIN THE PRESCRIBED TIME-LIMIT Effective date: 20060705 Ref country code: CZ Free format text: LAPSE BECAUSE OF FAILURE TO SUBMIT A TRANSLATION OF THE DESCRIPTION OR TO PAY THE FEE WITHIN THE PRESCRIBED TIME-LIMIT Effective date: 20060705 Ref country code: SK Free format text: LAPSE BECAUSE OF FAILURE TO SUBMIT A TRANSLATION OF THE DESCRIPTION OR TO PAY THE FEE WITHIN THE PRESCRIBED TIME-LIMIT Effective date: 20060705 Ref country code: SI Free format text: LAPSE BECAUSE OF FAILURE TO SUBMIT A TRANSLATION OF THE DESCRIPTION OR TO PAY THE FEE WITHIN THE PRESCRIBED TIME-LIMIT Effective date: 20060705 Ref country code: PL Free format text: LAPSE BECAUSE OF FAILURE TO SUBMIT A TRANSLATION OF THE DESCRIPTION OR TO PAY THE FEE WITHIN THE PRESCRIBED TIME-LIMIT Effective date: 20060705 |
|
| REG | Reference to a national code |
Ref country code: GB Ref legal event code: FG4D Free format text: NOT ENGLISH |
|
| REG | Reference to a national code |
Ref country code: CH Ref legal event code: EP |
|
| REG | Reference to a national code |
Ref country code: IE Ref legal event code: FG4D Free format text: LANGUAGE OF EP DOCUMENT: GERMAN |
|
| REF | Corresponds to: |
Ref document number: 502004000912 Country of ref document: DE Date of ref document: 20060817 Kind code of ref document: P |
|
| PG25 | Lapsed in a contracting state [announced via postgrant information from national office to epo] |
Ref country code: BG Free format text: LAPSE BECAUSE OF FAILURE TO SUBMIT A TRANSLATION OF THE DESCRIPTION OR TO PAY THE FEE WITHIN THE PRESCRIBED TIME-LIMIT Effective date: 20061005 Ref country code: SE Free format text: LAPSE BECAUSE OF FAILURE TO SUBMIT A TRANSLATION OF THE DESCRIPTION OR TO PAY THE FEE WITHIN THE PRESCRIBED TIME-LIMIT Effective date: 20061005 Ref country code: DK Free format text: LAPSE BECAUSE OF FAILURE TO SUBMIT A TRANSLATION OF THE DESCRIPTION OR TO PAY THE FEE WITHIN THE PRESCRIBED TIME-LIMIT Effective date: 20061005 |
|
| PG25 | Lapsed in a contracting state [announced via postgrant information from national office to epo] |
Ref country code: ES Free format text: LAPSE BECAUSE OF FAILURE TO SUBMIT A TRANSLATION OF THE DESCRIPTION OR TO PAY THE FEE WITHIN THE PRESCRIBED TIME-LIMIT Effective date: 20061016 |
|
| PG25 | Lapsed in a contracting state [announced via postgrant information from national office to epo] |
Ref country code: MC Free format text: LAPSE BECAUSE OF NON-PAYMENT OF DUE FEES Effective date: 20061031 |
|
| NLV1 | Nl: lapsed or annulled due to failure to fulfill the requirements of art. 29p and 29m of the patents act | ||
| PG25 | Lapsed in a contracting state [announced via postgrant information from national office to epo] |
Ref country code: PT Free format text: LAPSE BECAUSE OF FAILURE TO SUBMIT A TRANSLATION OF THE DESCRIPTION OR TO PAY THE FEE WITHIN THE PRESCRIBED TIME-LIMIT Effective date: 20061205 |
|
| GBV | Gb: ep patent (uk) treated as always having been void in accordance with gb section 77(7)/1977 [no translation filed] |
Effective date: 20060705 |
|
| REG | Reference to a national code |
Ref country code: IE Ref legal event code: FD4D |
|
| RAP2 | Party data changed (patent owner data changed or rights of a patent transferred) |
Owner name: DAIMLERCHRYSLER AG |
|
| EN | Fr: translation not filed | ||
| PLBE | No opposition filed within time limit |
Free format text: ORIGINAL CODE: 0009261 |
|
| STAA | Information on the status of an ep patent application or granted ep patent |
Free format text: STATUS: NO OPPOSITION FILED WITHIN TIME LIMIT |
|
| 26N | No opposition filed |
Effective date: 20070410 |
|
| BERE | Be: lapsed |
Owner name: DAIMLERCHRYSLER A.G. Effective date: 20061031 |
|
| PG25 | Lapsed in a contracting state [announced via postgrant information from national office to epo] |
Ref country code: AT Free format text: LAPSE BECAUSE OF NON-PAYMENT OF DUE FEES Effective date: 20061014 |
|
| PG25 | Lapsed in a contracting state [announced via postgrant information from national office to epo] |
Ref country code: GR Free format text: LAPSE BECAUSE OF FAILURE TO SUBMIT A TRANSLATION OF THE DESCRIPTION OR TO PAY THE FEE WITHIN THE PRESCRIBED TIME-LIMIT Effective date: 20061006 Ref country code: FR Free format text: LAPSE BECAUSE OF FAILURE TO SUBMIT A TRANSLATION OF THE DESCRIPTION OR TO PAY THE FEE WITHIN THE PRESCRIBED TIME-LIMIT Effective date: 20070511 |
|
| PG25 | Lapsed in a contracting state [announced via postgrant information from national office to epo] |
Ref country code: EE Free format text: LAPSE BECAUSE OF FAILURE TO SUBMIT A TRANSLATION OF THE DESCRIPTION OR TO PAY THE FEE WITHIN THE PRESCRIBED TIME-LIMIT Effective date: 20060705 |
|
| PG25 | Lapsed in a contracting state [announced via postgrant information from national office to epo] |
Ref country code: LU Free format text: LAPSE BECAUSE OF NON-PAYMENT OF DUE FEES Effective date: 20061014 Ref country code: TR Free format text: LAPSE BECAUSE OF FAILURE TO SUBMIT A TRANSLATION OF THE DESCRIPTION OR TO PAY THE FEE WITHIN THE PRESCRIBED TIME-LIMIT Effective date: 20060705 Ref country code: HU Free format text: LAPSE BECAUSE OF FAILURE TO SUBMIT A TRANSLATION OF THE DESCRIPTION OR TO PAY THE FEE WITHIN THE PRESCRIBED TIME-LIMIT Effective date: 20070106 |
|
| PG25 | Lapsed in a contracting state [announced via postgrant information from national office to epo] |
Ref country code: FR Free format text: LAPSE BECAUSE OF FAILURE TO SUBMIT A TRANSLATION OF THE DESCRIPTION OR TO PAY THE FEE WITHIN THE PRESCRIBED TIME-LIMIT Effective date: 20060705 Ref country code: CY Free format text: LAPSE BECAUSE OF FAILURE TO SUBMIT A TRANSLATION OF THE DESCRIPTION OR TO PAY THE FEE WITHIN THE PRESCRIBED TIME-LIMIT Effective date: 20060705 |
|
| REG | Reference to a national code |
Ref country code: CH Ref legal event code: PL |
|
| PG25 | Lapsed in a contracting state [announced via postgrant information from national office to epo] |
Ref country code: BE Free format text: LAPSE BECAUSE OF FAILURE TO SUBMIT A TRANSLATION OF THE DESCRIPTION OR TO PAY THE FEE WITHIN THE PRESCRIBED TIME-LIMIT Effective date: 20061031 |
|
| PG25 | Lapsed in a contracting state [announced via postgrant information from national office to epo] |
Ref country code: LI Free format text: LAPSE BECAUSE OF NON-PAYMENT OF DUE FEES Effective date: 20081031 Ref country code: CH Free format text: LAPSE BECAUSE OF NON-PAYMENT OF DUE FEES Effective date: 20081031 |
|
| PGFP | Annual fee paid to national office [announced via postgrant information from national office to epo] |
Ref country code: DE Payment date: 20120102 Year of fee payment: 8 |
|
| PG25 | Lapsed in a contracting state [announced via postgrant information from national office to epo] |
Ref country code: DE Free format text: LAPSE BECAUSE OF NON-PAYMENT OF DUE FEES Effective date: 20130501 |
|
| REG | Reference to a national code |
Ref country code: DE Ref legal event code: R119 Ref document number: 502004000912 Country of ref document: DE Effective date: 20130501 |