EP1117045B1 - Performance monitoring in distributed systems - Google Patents
Performance monitoring in distributed systems Download PDFInfo
- Publication number
- EP1117045B1 EP1117045B1 EP01300068A EP01300068A EP1117045B1 EP 1117045 B1 EP1117045 B1 EP 1117045B1 EP 01300068 A EP01300068 A EP 01300068A EP 01300068 A EP01300068 A EP 01300068A EP 1117045 B1 EP1117045 B1 EP 1117045B1
- Authority
- EP
- European Patent Office
- Prior art keywords
- time
- node
- event
- records
- distributed application
- Prior art date
- Legal status (The legal status is an assumption and is not a legal conclusion. Google has not performed a legal analysis and makes no representation as to the accuracy of the status listed.)
- Expired - Lifetime
Links
Images


Classifications
-
- G—PHYSICS
- G06—COMPUTING; CALCULATING OR COUNTING
- G06F—ELECTRIC DIGITAL DATA PROCESSING
- G06F11/00—Error detection; Error correction; Monitoring
- G06F11/07—Responding to the occurrence of a fault, e.g. fault tolerance
- G06F11/0703—Error or fault processing not based on redundancy, i.e. by taking additional measures to deal with the error or fault not making use of redundancy in operation, in hardware, or in data representation
- G06F11/0706—Error or fault processing not based on redundancy, i.e. by taking additional measures to deal with the error or fault not making use of redundancy in operation, in hardware, or in data representation the processing taking place on a specific hardware platform or in a specific software environment
- G06F11/0709—Error or fault processing not based on redundancy, i.e. by taking additional measures to deal with the error or fault not making use of redundancy in operation, in hardware, or in data representation the processing taking place on a specific hardware platform or in a specific software environment in a distributed system consisting of a plurality of standalone computer nodes, e.g. clusters, client-server systems
-
- G—PHYSICS
- G06—COMPUTING; CALCULATING OR COUNTING
- G06F—ELECTRIC DIGITAL DATA PROCESSING
- G06F11/00—Error detection; Error correction; Monitoring
- G06F11/30—Monitoring
- G06F11/34—Recording or statistical evaluation of computer activity, e.g. of down time, of input/output operation ; Recording or statistical evaluation of user activity, e.g. usability assessment
- G06F11/3466—Performance evaluation by tracing or monitoring
- G06F11/3495—Performance evaluation by tracing or monitoring for systems
-
- G—PHYSICS
- G06—COMPUTING; CALCULATING OR COUNTING
- G06F—ELECTRIC DIGITAL DATA PROCESSING
- G06F11/00—Error detection; Error correction; Monitoring
- G06F11/07—Responding to the occurrence of a fault, e.g. fault tolerance
- G06F11/0703—Error or fault processing not based on redundancy, i.e. by taking additional measures to deal with the error or fault not making use of redundancy in operation, in hardware, or in data representation
- G06F11/0766—Error or fault reporting or storing
-
- G—PHYSICS
- G06—COMPUTING; CALCULATING OR COUNTING
- G06F—ELECTRIC DIGITAL DATA PROCESSING
- G06F11/00—Error detection; Error correction; Monitoring
- G06F11/30—Monitoring
- G06F11/34—Recording or statistical evaluation of computer activity, e.g. of down time, of input/output operation ; Recording or statistical evaluation of user activity, e.g. usability assessment
- G06F11/3404—Recording or statistical evaluation of computer activity, e.g. of down time, of input/output operation ; Recording or statistical evaluation of user activity, e.g. usability assessment for parallel or distributed programming
-
- G—PHYSICS
- G06—COMPUTING; CALCULATING OR COUNTING
- G06F—ELECTRIC DIGITAL DATA PROCESSING
- G06F11/00—Error detection; Error correction; Monitoring
- G06F11/30—Monitoring
- G06F11/34—Recording or statistical evaluation of computer activity, e.g. of down time, of input/output operation ; Recording or statistical evaluation of user activity, e.g. usability assessment
- G06F11/3466—Performance evaluation by tracing or monitoring
- G06F11/3476—Data logging
Definitions
- the present invention pertains to the field of distributed systems. More particularly, this invention relates to performance monitoring in distributed systems using synchronized clocks and distributed event logs.
- a typical distributed system includes a set of nodes that communicate via a communication network.
- One or more of the nodes usually include processing resources that execute software for a distributed application.
- Examples of distributed applications include web client-server applications, groupware applications, and industrial and other types of control systems.
- a distributed application may be viewed as a arrangement of software components that are distributed among the nodes of a distributed system.
- software components of a distributed application include processes, file systems, database servers, web servers, client applications, server applications, network components, and sensor, actuator, and controller applications.
- Such software components typically interact with one another using mechanisms such as function calls, messages, HTTP commands, etc., to name a few examples.
- An interaction between software components of a distributed application may be referred to as an event.
- Events that are generated in one location of a distributed application typically cause events to occur at other locations in the distributed application.
- an end-user may click a button in a web browser.
- the click typically generates events in the form of HTTP commands.
- Each HTTP command in turn usually generates other events at other locations in the distributed application to communicate the HTTP command to a web server, for example via a TCP/IP link established by the protocol stacks in each node.
- a web server as the remote portion of the distributed application typically generates events such as SQL statements for database access or events for file system access to carry out the HTTP command as well as events to return the appropriate information to the requesting web browser.
- a capability to record the timing of events in a distributed application may be useful for a variety of system management tasks such as performance monitoring, diagnosis, and capacity planning. For example, a record of the timing of events may be useful for identifying bottlenecks in a distributed application that hinder overall performance.
- prior methods for performance monitoring usually record the timing of events in a single node. Prior methods typically do not provide event timing across multiple nodes of a distributed application.
- EP-A-0585479 discloses an apparatus for monitoring the behaviour of a distributed system comprising subsystems, and having a distributed recorder function which obtains events time-stamps in respect of event at the systems.
- a distributed application with performance monitoring capability comprising: a set of node applications which communicate via a network each node having a clock, the clocks being synchronized with each other, each node application having at least one function and each node further having a recorder function which when called by the function obtains an event code from the function and obtains a time-stamp from a corresponding synchronized clock; and an event log for each node application, each event log for holding a record including the corresponding event code and the corresponding time-stamp such that the time-stamps in the event logs provide a synchronized time base in the distributed application for evaluating a set of significant events identified by the event codes.
- a method of performance monitoring in a distributed application having a set of node applications, that communicate via a network comprising the steps of providing each node with a clock, the clocks being synchronized with each other, and with a recorder function that obtains an event code from a function of the corresponding node application and that generates a record that includes a time-stamp obtained from a corresponding synchronized clock; running an experiment in the distributed application; obtaining the records from the node applications and analyzing the records such that the time-stamps in the records provide a synchronized time base in the distributed application for evaluating a set of significant events identified by the event codes.
- a preferred embodiment of the present invention provides performance monitoring capability across multiple nodes of a distributed application and includes a set of nodes that communicate via a network.
- a distributed application is performed by a set of cooperating node applications executing in the nodes.
- the distributed system implements techniques for generating time-stamp records for each of a set of significant events associated with one or more of the node applications.
- the time-stamp records provides a synchronized time base across the nodes for the significant events. This enables temporal ordering of the significant events.
- FIG. 1 shows a distributed system 10 that includes the performance monitoring techniques disclosed herein.
- the distributed system 10 includes a set of nodes 20-24 that communicate via a network 30.
- Each of the nodes 20-24 include processor resources for executing a set of node applications 50-54, respectively.
- the node applications 50-54 interact via the communication network 30 when performing a distributed application in the distributed system 10.
- the distributed application performed by the node applications 50-54 may be any type of distributed application such as web-based client-server applications including those used in e-commerce, groupware applications, order processing applications, or inventory management applications to name a few examples.
- the distributed application performed by the node applications 50-54 may be a control system application in which the nodes 20-24 include the appropriate control system hardware including sensors and actuators.
- each of the nodes 20-24 each include a corresponding synchronized clock 40-44.
- the synchronized clocks 40-44 maintain time values which are synchronized with respect to one another. These synchronized time values enable the coordination of event timing measurements throughout a distributed application in the distributed system 10.
- the nodes 20-24 each implement a corresponding event time-stamp recorder function 68, 78, and 88.
- Each event time-stamp recorder function 68, 78, and 88 is call-able by the corresponding node application 50-54.
- Each event time-stamp recorder function 68, 78, and 88 when called obtains a time value from the corresponding synchronized clock 40-44 and writes the time value and an event code provided by the corresponding node application 50-54 into a corresponding event log 90-94 as a time-stamp record.
- companion nodes may be associated with the nodes that do not have synchronized clocks. Events of interest on the nodes that do not have synchronized clocks are time-stamped and recorded using the corresponding companion nodes. Communication paths to companion nodes can be a physical wire, serial or parallel communication path, etc.
- event codes from an application executing on a node that does not have a synchronized clock is passed to the event time-stamp recorder on its companion node over the communication path to the companion node.
- Event logs may be implemented on either node.
- the information recorded in the event logs 90-94 may be read by any of the nodes 20-24 or other nodes reachable via the network 30. This information may be used to determine a variety of performance indications for the distributed application performed by the node applications 50-54. The information may be used to construct graphical displays that indicate timing associated with a set of predetermined events of interest in a distributed application.
- the time values in the synchronized clocks 40-44 are synchronized using a synchronization protocol described in U.S. Patent no. 5,566,180 .
- the nodes 20-24 implement the network time protocol (NTP).
- NTP network time protocol
- the nodes 20-24 periodically exchange messages via the network 30.
- Each message contains a time value from the synchronized clock 40-44 of the node 20-24 that originated the message.
- each node 20-24 adjusts its corresponding synchronized clock 40-44.
- the synchronized clocks 40-44 in the nodes 20-24 converge to synchronized time values.
- the network 30 may be a packetized network such as Ethernet or a network such as LonTalk which is adapted to control systems.
- the network 30 may be implemented as a serial or parallel communication bus or other mechanism for communication.
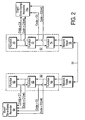
- Figure 2 illustrates the capture of time-stamp records for events associated with the node applications 50-52.
- the node application 50 includes a set of functions 60-64 which are application-specific and a network stack 66 that performs communication via the network 30.
- the node application 52 includes a set of functions 70-74 which are application-specific and a network stack 76 that performs communication via the network 30.
- the particulars of the functions 60-64 and 70-74 depend on the particular distributed application performed by the node applications 50-52.
- the functions 60-64 may be associated with a web browser application and the functions 70-74 may be associated with a web server application.
- the network stacks 66 and 76 bridge the underlying physical network 30 to the node applications 50-52.
- the application 50 is designed such that a call to the function 62 by the function 60 is deemed an event of significance in the execution of the corresponding distributed application.
- the function 60 calls the event time-stamp recorder function 68 near the time of the call to the function 62.
- the event time-stamp recorder function 68 reads a time value (t1) from the synchronized clock 40 and writes the value-pair c1-t1 to an entry in the event log 90 as a time-stamp record.
- a call to the function 64 by the function 62 is deemed an event of significance in the execution of the corresponding distributed application.
- the event time-stamp recorder function 68 reads a time value (t2) from the synchronized clock 40 and writes the value-pair c2-t2 to an entry in the event log 90 as a time-stamp record.
- the event time-stamp recorder function 78 reads a time value (t3) from the synchronized clock 42 and writes the value-pair c3-t3 to an entry in the event log 92 as a time-stamp record.
- the event time-stamp recorder function 78 reads a time value (t4) from the synchronized clock 42 and writes the value-pair c4-t4 to an entry in the event log 92 as a time-stamp record.
- the function 70 may respond to the above sequence by calling the function 72, which calls the function 74, which calls the network stack 76 to transfer a message back to the node application 50 on up to the function 60.
- This provides an event loop which is originated by the node application 50 and completed by the node application 52 with the reply being returned to the node application 50.
- different codes may be recorded in the event logs along the function call chain.
- the node application 50 is a web browser and the node application 52 is a web server.
- the function 60 generates HTTP commands as events and time values for these events recorded by the event time-stamp recorder function 68.
- HTTP commands received by the node application 52 that require a database access cause the function 70, a database access function, to be called and time-stamp records for these events are recorded by the event time-stamp recorder function 78.
- the event time-stamp recorder function 78 records when the function 70 completes a database access and the event time-stamp recorder function 68 records when the results are provided back to the function 60 to complete a web browser-web server transaction loop.
- hardware in a node automatically records a time-stamp for a significant event, for example the time of data collection for a sensor or time of arrival of a network message.
- This time-stamp can be passed to an event time-stamp recorder along with the desired code to be stored in an event log.
- Tables 1 and 2 show examples of information recorded in the event logs 90 and 92, respectively, for the example sequence described above.
- Table 1 Event Code Time-stamp c1 t1 c2 t2 c2(ret) t7 c1(ret) t8
- Table 2 Event Code Time-stamp c3 t3 c4 t4 c4(ret) t5 c3 (ret) t6
- This sequence of entries written in to the event logs 90 and 92 may be viewed as corresponding to a series of states S1 through S8 in the distributed application performed by the node applications 50-52.
- the states S1 through S4 correspond to the event codes-value pairs C1-t1, C2-t2, C3-t3, and C4-t4, respectively.
- the states S5 through S8 correspond to the event codes-value pairs C4(ret)-t5, C3(ret)-t6, C2(ret)-t7, and C1(ret)-t8, respectively.
- Table 3 aggregates the information recorded in the event logs 90 and 92, respectively, for the example sequence described above.
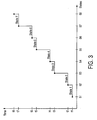
- Figure 3 is a graph constructed from the information obtained from the event logs 90-92.
- the states S1 through S8 are shown plotted against the corresponding time values t1 through t8.
- the time values t1 through t8 which were obtained from the synchronized clocks 40-42 provide a synchronized time base for analyzing the timing of the states S1 through S8 even though these states represent events that occur in the separate nodes 20 and 22.
- Figure 4 shows a method for performance monitoring in a distributed application using the techniques disclosed herein.
- a set of significant events in the distributed application are determined.
- the significance of an event is generally application-specific.
- the significant events are the generation of HTTP commands, the transmission and receipt of messages on the network 30, and database accesses for responses to the HTTP commands.
- the significant events may be the generation of control values, the receipt of sensor data, and the application of control values to actuators, etc.
- the distributed node applications that perform the distributed application are provided with functionality for creating time-stamp records in their corresponding event logs when the significant events occur.
- the node applications 50-54 are provided with the event time-stamp recorder functions 68, 78, and 88, respectively, that read the corresponding synchronized clocks 40-44 and log entries in the event logs 90-94.
- the functions 60-64 and 70-74 and the network stacks 66 and 76 may directly read the synchronized clocks 40-44 and directly write entries in the event logs 90-94 or there functions may be performed in hardware and/or on companion nodes.
- one or more experiments are run in the distributed application to generate the significant events and capture time-stamp records.
- HTTP commands are generated using the node application 50 and are processed by the node application 52, thereby generating significant events which are recorded in the event logs 90-92.
- Event loops such as the states S1 through S8 may be executed a large number of times to gather time-stamp records.
- the time-stamp records captured during step 104 are read and analyzed.
- the time-stamp records are read from the event logs 90-94.
- Any computer system or node, etc. having access to the network 30, including the nodes 20-24, may read and analyze the time-stamp records.
- Graphs may be generated such as the one in Figure 3 or other type of graph.
- time-stamp records from multiple loops through the states S1 through S8 may be overlaid on a graph and/or may be used to generate statistical distributions of time values associated with transitions among the states S1 through S8.
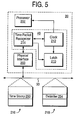
- FIG. 5 shows the synchronized clock 40 in one examplary configuration of the node 20.
- the synchronized clocks 42-44 may be implemented in a similar manner.
- the synchronized clock 40 includes a time packet recognizer 214, a clock 212, and a latch 210.
- the node 20 includes a physical interface 200 that enables transmission and reception of packets via the network 30.
- the physical interface 200 provides received packets to the time packet recognizer 214.
- the synchronized clock 40 maintains synchronized time in response to timing data packets and follow up packets which are transferred via the network 30.
- a timing data packet 218 and a follow up packet 216 are carried on the network 30.
- the timing data packet 218 and the follow up packet 216 are generated by a master clock on the network 30.
- the master clock may be contained in one of the nodes 22-24 or on another node reachable via the network 30.
- the master clock may be a real-time clock.
- the timing data packet 218 includes a delimiter 254 that identifies it as a timing data packet for the synchronization protocol of the synchronized clock 40.
- the follow up packet 216 includes a time stamp 250.
- the time stamp 250 indicates the local time in the master clock when the timing data packet 218 was generated.
- the time packet recognizer 214 receives the timing data packet 218 through the physical interface 200.
- the time packet recognizer 214 detects a unique timing point in the recovered bit stream for the timing data packet 218. Upon detection of the unique timing point, the time packet recognizer 214 causes the latch 210 to latch a time value from the clock 212. The time value held in the latch 210 indicates the local time at which the time packet recognizer 214 received the timing data packet 218. Thereafter, the time packet recognizer 214 receives the follow up packet 216 and extracts the time stamp 250. The difference between the time stamp 250 and the time value in the latch 210 indicates the relative synchronization of the master clock and the clock 212. Once this difference is computed by the processor 202 it is used to adjust the time value in the clock 212 to conform it to the master clock.
- the adjustment of the time value in the clock 212 may be accomplished by implementing the clock 212 as a counter driven by an oscillator with sufficient stability.
- the least significant few bits of the counter may be implemented as an adder so that an increment on oscillator periods may be occasionally increased or decreased to effectively speed up or slow down the clock 212 in accordance with the results of the computation of the difference between the time stamp 250 and the time held in the latch 210.
- the processor 202 when executing the event time-stamp recorder function 68 reads the contents of the clock 212 to obtain time-stamps.
- the present teachings yield a set of time-stamp records in each node involved in the distributed application. Synchronized clocks in each node provide a synchronized time base that allows temporal ordering of the time-stamp records. This information is the basis for performance analysis of the end-to-end distributed application. In addition to summary statistical performance metrics (e.g. average end-to-end latency) details on individual distributed transactions can be captured with this system.
- An event time-stamp recorder can run in two modes including one in which a time-stamp and code are provided by application (usually by the hardware), and one in which a time-stamp is read by the event time-stamp recorder as it processes the code from the application.
- the event code of interest is presented to the application along with a time-stamp.
- an event time-stamp recorder stores both the event code and time-stamp and does not read a local clock.
- a measurement node in a distributed measurement and control system automatically generates a time-stamp when a measurement is made. If the application finds this measurement of interest, it passes the appropriate event code and time-stamp to an event time-stamp recorder for storage.
- the present techniques provide the ability to analyze repetitions of a sequence of distributed transactions. Because time-stamp records from each repetition are captured, it is very useful to analyze how all the repetitions compare. For example, statistical descriptions of the complete transaction such as the average delay for a transaction, the maximum delay, the minimum delay, and the statistical distribution (i.e. histogram).
- a pair states may be selected and the delay between them analyzed. This provides a portion of the delay for the entire transaction and similar information such as average, max, min, and distribution may be calculated.
- One goal of distributed applications is to allow all the nodes to perform useful work at the same time (e.g parallel execution). While the server is working, the client is also performing some useful activity.
- the events and time-stamps from the different nodes yielded by the present techniques enable the generation of diagrams that describe how much parallel work is really occurring.
- the synchronized clock mechanisms disclosed herein also provide detailed statistics on how tightly synchronized a slave clock is to the remote master clock.
- One statistic that is available is the local clock offset Due to the nature of the synchronization algorithm in some embodiments (a digital software servo algorithm) this value will vary between the synchronization bounds.
- An event time-stamp recorder can store this offset along with the time-stamp.
- this new information can be used when comparing time-stamps from different nodes. This may be viewed as time-stamp confidence limits on the stair-step plots. This yields a visual indication if two events are too close together to differentiate which came first.
- Companion nodes when used are preferably in close proximity to the corresponding nodes and communicate using a low latency mechanism such as a wire or parallel port, etc.
- the companion node may be very simple and contain just a synchronized clock.
- a node sends a signal to the companion node and receive back the current time-stamp. All the buffer management functions would be on the other node. This is useful when the other node is a full participant in the present techniques but does not have a synchronized clock.
- the other node may be a PC or network server.
- companion nodes may have synchronized clocks and all the buffer management function.
- the other node sends the event code.
- the companion node then performs the time-stamp function, buffer management, etc.
- the code may be via a separate digital or analog wire with the companion node making a measurement of the behavior of the other node.
- the communication latency between the a node and its companion node be kept to a minimum.
- the event logs 90-94 may be organized in a circular fashion (circular queue). During data gathering, the event logs 90-94 fill and new time-stamp records replace the oldest time-stamp records in the event logs 90-94. If one of the nodes 20-24 recognizes a deviant situation such as a long round trip for a network transaction it can quickly sends messages out to all the participant nodes preferably using a multi-cast message on the network 30. This message includes a begin time and duration of interest. All participant nodes use this information to lock down those sections of there corresponding event buffers 90-94 so that they are not overwritten with new time-stamp records. Thereafter, the locked down portions of the event buffers 90-94 may be retrieved for post analysis.
- the corresponding node 20-24 node may unlock those portions of the corresponding event buffer 90-94 and continue to gather time-stamp records. This is particularly useful in application where significant events are infrequent.
- the nodes 20-24 are configured to watch for a signification event and when it is detected all the other nodes 20-24 get notified.
- event logs 90-94 are large enough to store all the interesting events over the fetch phase of the post process interval plus a safety margin to hold all the events that have recently come in.
- the safety margin is sized such that each node will have sufficient time to perform the determination of whether an event is interesting and to send out the lock down message. The transit time and processing time for the lock down message should also be considered.
- the present techniques may introduce slight delays in the execution of the distributed application. This delay may be measured using the present techniques and the delays removed in the post processing phase. To perform this correction, an application would execute a correction loop such as the following;
- time-stamps from these pairs of time-stamp records can be subtracted and then analyzed to obtain an understanding of the average delay, the maximum delay, the minimum delay, and the statistical distribution of delays. These facts can be used to correct the post analysis results of the full distributed application.
- the application programmer may enter two back to back calls to the EventLog() function as illustrated above at some point in the application. At the expense of event log space, the difference in these two time-stamps may be used to verify the timing overhead of the present techniques. It is preferable that the EventLog() be efficient and its execution time be much shorter than the running distributed application.
Abstract
Description
- The present invention pertains to the field of distributed systems. More particularly, this invention relates to performance monitoring in distributed systems using synchronized clocks and distributed event logs.
- Distributed systems are commonly employed in a variety of applications. A typical distributed system includes a set of nodes that communicate via a communication network. One or more of the nodes usually include processing resources that execute software for a distributed application. Examples of distributed applications include web client-server applications, groupware applications, and industrial and other types of control systems.
- A distributed application may be viewed as a arrangement of software components that are distributed among the nodes of a distributed system. Examples of software components of a distributed application include processes, file systems, database servers, web servers, client applications, server applications, network components, and sensor, actuator, and controller applications. Such software components typically interact with one another using mechanisms such as function calls, messages, HTTP commands, etc., to name a few examples. An interaction between software components of a distributed application may be referred to as an event.
- Events that are generated in one location of a distributed application typically cause events to occur at other locations in the distributed application. In a web-based application, for example, an end-user may click a button in a web browser. The click typically generates events in the form of HTTP commands. Each HTTP command in turn usually generates other events at other locations in the distributed application to communicate the HTTP command to a web server, for example via a TCP/IP link established by the protocol stacks in each node. In response, a web server as the remote portion of the distributed application typically generates events such as SQL statements for database access or events for file system access to carry out the HTTP command as well as events to return the appropriate information to the requesting web browser.
- A capability to record the timing of events in a distributed application may be useful for a variety of system management tasks such as performance monitoring, diagnosis, and capacity planning. For example, a record of the timing of events may be useful for identifying bottlenecks in a distributed application that hinder overall performance. Unfortunately, prior methods for performance monitoring usually record the timing of events in a single node. Prior methods typically do not provide event timing across multiple nodes of a distributed application.
EP-A-0585479 discloses an apparatus for monitoring the behaviour of a distributed system comprising subsystems, and having a distributed recorder function which obtains events time-stamps in respect of event at the systems. - According to a first aspect of the present invention there is provided a distributed application with performance monitoring capability comprising: a set of node applications which communicate via a network each node having a clock, the clocks being synchronized with each other, each node application having at least one function and each node further having a recorder function which when called by the function obtains an event code from the function and obtains a time-stamp from a corresponding synchronized clock; and an event log for each node application, each event log for holding a record including the corresponding event code and the corresponding time-stamp such that the time-stamps in the event logs provide a synchronized time base in the distributed application for evaluating a set of significant events identified by the event codes.
- According to a second aspect of the present invention there is provided a method of performance monitoring in a distributed application having a set of node applications, that communicate via a network, comprising the steps of providing each node with a clock, the clocks being synchronized with each other, and with a recorder function that obtains an event code from a function of the corresponding node application and that generates a record that includes a time-stamp obtained from a corresponding synchronized clock; running an experiment in the distributed application; obtaining the records from the node applications and analyzing the records such that the time-stamps in the records provide a synchronized time base in the distributed application for evaluating a set of significant events identified by the event codes.
- A preferred embodiment of the present invention provides performance monitoring capability across multiple nodes of a distributed application and includes a set of nodes that communicate via a network. A distributed application is performed by a set of cooperating node applications executing in the nodes. The distributed system implements techniques for generating time-stamp records for each of a set of significant events associated with one or more of the node applications. The time-stamp records provides a synchronized time base across the nodes for the significant events. This enables temporal ordering of the significant events.
- Other features and advantages of the present invention will be apparent from the detailed description that follows.
- The present invention is described with respect to particular exemplary embodiments thereof and reference is accordingly made to the drawings in which:
- Figure 1 shows a distributed system that includes the performance monitoring techniques disclosed herein;
- Figure 2 illustrates the capture of time-stamp records for events associated with the node applications;
- Figure 3 is a graph constructed from the captured time-stamp records with their synchronized time base;
- Figure 4 shows a method for performance monitoring in a distributed application using the techniques disclosed herein;
- Figure 5 shows a synchronized clock in one embodiment of a node.
- Figure 1 shows a
distributed system 10 that includes the performance monitoring techniques disclosed herein. Thedistributed system 10 includes a set of nodes 20-24 that communicate via anetwork 30. Each of the nodes 20-24 include processor resources for executing a set of node applications 50-54, respectively. - The node applications 50-54 interact via the
communication network 30 when performing a distributed application in thedistributed system 10. The distributed application performed by the node applications 50-54 may be any type of distributed application such as web-based client-server applications including those used in e-commerce, groupware applications, order processing applications, or inventory management applications to name a few examples. In addition, the distributed application performed by the node applications 50-54 may be a control system application in which the nodes 20-24 include the appropriate control system hardware including sensors and actuators. - In one embodiment, each of the nodes 20-24 each include a corresponding synchronized clock 40-44. The synchronized clocks 40-44 maintain time values which are synchronized with respect to one another. These synchronized time values enable the coordination of event timing measurements throughout a distributed application in the
distributed system 10. - The nodes 20-24 each implement a corresponding event time-
stamp recorder function stamp recorder function stamp recorder function - Applications in nodes that do not have synchronized clocks can also be monitored. For example, companion nodes may be associated with the nodes that do not have synchronized clocks. Events of interest on the nodes that do not have synchronized clocks are time-stamped and recorded using the corresponding companion nodes. Communication paths to companion nodes can be a physical wire, serial or parallel communication path, etc. In one embodiment, event codes from an application executing on a node that does not have a synchronized clock is passed to the event time-stamp recorder on its companion node over the communication path to the companion node. Event logs may be implemented on either node.
- The information recorded in the event logs 90-94 may be read by any of the nodes 20-24 or other nodes reachable via the
network 30. This information may be used to determine a variety of performance indications for the distributed application performed by the node applications 50-54. The information may be used to construct graphical displays that indicate timing associated with a set of predetermined events of interest in a distributed application. - In one embodiment, the time values in the synchronized clocks 40-44 are synchronized using a synchronization protocol described in
U.S. Patent no. 5,566,180 . - In another embodiment, the nodes 20-24 implement the network time protocol (NTP). In accordance with NTP, the nodes 20-24 periodically exchange messages via the
network 30. Each message contains a time value from the synchronized clock 40-44 of the node 20-24 that originated the message. In response, each node 20-24 adjusts its corresponding synchronized clock 40-44. Eventually, the synchronized clocks 40-44 in the nodes 20-24 converge to synchronized time values. - The
network 30 may be a packetized network such as Ethernet or a network such as LonTalk which is adapted to control systems. Alternatively, thenetwork 30 may be implemented as a serial or parallel communication bus or other mechanism for communication. - Figure 2 illustrates the capture of time-stamp records for events associated with the node applications 50-52. The
node application 50 includes a set of functions 60-64 which are application-specific and anetwork stack 66 that performs communication via thenetwork 30. Similarly, thenode application 52 includes a set of functions 70-74 which are application-specific and anetwork stack 76 that performs communication via thenetwork 30. - The particulars of the functions 60-64 and 70-74 depend on the particular distributed application performed by the node applications 50-52. For example, the functions 60-64 may be associated with a web browser application and the functions 70-74 may be associated with a web server application. The network stacks 66 and 76 bridge the underlying
physical network 30 to the node applications 50-52. - The
application 50 is designed such that a call to thefunction 62 by thefunction 60 is deemed an event of significance in the execution of the corresponding distributed application. As a consequence, thefunction 60 calls the event time-stamp recorder function 68 near the time of the call to thefunction 62. Thefunction 60 passes an event code=c1 parameter with the call to the event time-stamp recorder function 68. In response, the event time-stamp recorder function 68 reads a time value (t1) from thesynchronized clock 40 and writes the value-pair c1-t1 to an entry in theevent log 90 as a time-stamp record. - In addition, a call to the
function 64 by thefunction 62 is deemed an event of significance in the execution of the corresponding distributed application. As a consequence, thefunction 62 calls the event time-stamp recorder function 68 near the time of the call to thefunction 64 and passes an event code=c2 parameter with the call to the event time-stamp recorder function 68. In response, the event time-stamp recorder function 68 reads a time value (t2) from thesynchronized clock 40 and writes the value-pair c2-t2 to an entry in theevent log 90 as a time-stamp record. - A call by the
function 74 to thefunction 72 is deemed a significant event and a call is made to the event time-stamp recorder function 78 with an event code=c3 parameter. In response, the event time-stamp recorder function 78 reads a time value (t3) from thesynchronized clock 42 and writes the value-pair c3-t3 to an entry in theevent log 92 as a time-stamp record. - A call to the
function 70 by thefunction 72 is deemed an event of significance and thefunction 72 calls the event time-stamp recorder function 78 near that time and passes an event code=c4 parameter with the call. In response, the event time-stamp recorder function 78 reads a time value (t4) from thesynchronized clock 42 and writes the value-pair c4-t4 to an entry in theevent log 92 as a time-stamp record. - In some embodiments, the
function 70 may respond to the above sequence by calling thefunction 72, which calls thefunction 74, which calls thenetwork stack 76 to transfer a message back to thenode application 50 on up to thefunction 60. This provides an event loop which is originated by thenode application 50 and completed by thenode application 52 with the reply being returned to thenode application 50. On the return path, different codes may be recorded in the event logs along the function call chain. - In an example embodiment, the
node application 50 is a web browser and thenode application 52 is a web server. Thefunction 60 generates HTTP commands as events and time values for these events recorded by the event time-stamp recorder function 68. HTTP commands received by thenode application 52 that require a database access cause thefunction 70, a database access function, to be called and time-stamp records for these events are recorded by the event time-stamp recorder function 78. Similarly, the event time-stamp recorder function 78 records when thefunction 70 completes a database access and the event time-stamp recorder function 68 records when the results are provided back to thefunction 60 to complete a web browser-web server transaction loop. - In some time critical cases, hardware in a node automatically records a time-stamp for a significant event, for example the time of data collection for a sensor or time of arrival of a network message. This time-stamp can be passed to an event time-stamp recorder along with the desired code to be stored in an event log.
- Tables 1 and 2 show examples of information recorded in the event logs 90 and 92, respectively, for the example sequence described above.
Table 1 Event Code Time-stamp c1 t1 c2 t2 c2(ret) t7 c1(ret) t8 Table 2 Event Code Time-stamp c3 t3 c4 t4 c4(ret) t5 c3 (ret) t6 - This sequence of entries written in to the event logs 90 and 92 may be viewed as corresponding to a series of states S1 through S8 in the distributed application performed by the node applications 50-52. The states S1 through S4 correspond to the event codes-value pairs C1-t1, C2-t2, C3-t3, and C4-t4, respectively. The states S5 through S8 correspond to the event codes-value pairs C4(ret)-t5, C3(ret)-t6, C2(ret)-t7, and C1(ret)-t8, respectively.
- Table 3 aggregates the information recorded in the event logs 90 and 92, respectively, for the example sequence described above.
State Number Node Event Code Time- Stamp S1 20 C1 T1 S2 20 C2 T2 S3 22 C3 T3 S4 22 C4 T4 S5 22 C4(ret) T5 S6 22 C3(ret) T6 S7 20 C2(ret) T7 S8 20 C1(ret) T8 - Figure 3 is a graph constructed from the information obtained from the event logs 90-92. The states S1 through S8 are shown plotted against the corresponding time values t1 through t8. The time values t1 through t8 which were obtained from the synchronized clocks 40-42 provide a synchronized time base for analyzing the timing of the states S1 through S8 even though these states represent events that occur in the
separate nodes - An examination of the graphs shows that the highest latency in the states S1 through S8 occur between states S2 and S3, between states S4 and S5, and between states S6 and S7. The transitions between states S2 and S3 and between states S6 and S7 correspond to the latency of message transfer via the
network 30. The transitions between states S4 and S5 correspond to the latency of thefunction 70 which in the example embodiment is a database lookup. - Figure 4 shows a method for performance monitoring in a distributed application using the techniques disclosed herein. At
step 100, a set of significant events in the distributed application are determined. The significance of an event is generally application-specific. For the example above, the significant events are the generation of HTTP commands, the transmission and receipt of messages on thenetwork 30, and database accesses for responses to the HTTP commands. For a distributed control application, as another example, the significant events may be the generation of control values, the receipt of sensor data, and the application of control values to actuators, etc. - At
step 102, the distributed node applications that perform the distributed application are provided with functionality for creating time-stamp records in their corresponding event logs when the significant events occur. In the example above, the node applications 50-54 are provided with the event time-stamp recorder functions 68, 78, and 88, respectively, that read the corresponding synchronized clocks 40-44 and log entries in the event logs 90-94. Alternatively, one or more of the functions 60-64 and 70-74 and the network stacks 66 and 76 may directly read the synchronized clocks 40-44 and directly write entries in the event logs 90-94 or there functions may be performed in hardware and/or on companion nodes. - At
step 104, one or more experiments are run in the distributed application to generate the significant events and capture time-stamp records. In the example above, HTTP commands are generated using thenode application 50 and are processed by thenode application 52, thereby generating significant events which are recorded in the event logs 90-92. Event loops such as the states S1 through S8 may be executed a large number of times to gather time-stamp records. - At
step 106, the time-stamp records captured duringstep 104 are read and analyzed. In the example above, the time-stamp records are read from the event logs 90-94. Any computer system or node, etc. having access to thenetwork 30, including the nodes 20-24, may read and analyze the time-stamp records. Graphs may be generated such as the one in Figure 3 or other type of graph. For example, time-stamp records from multiple loops through the states S1 through S8 may be overlaid on a graph and/or may be used to generate statistical distributions of time values associated with transitions among the states S1 through S8. - Figure 5 shows the
synchronized clock 40 in one examplary configuration of thenode 20. The synchronized clocks 42-44 may be implemented in a similar manner. Thesynchronized clock 40 includes atime packet recognizer 214, aclock 212, and alatch 210. Thenode 20 includes aphysical interface 200 that enables transmission and reception of packets via thenetwork 30. Thephysical interface 200 provides received packets to thetime packet recognizer 214. - In this example, the
synchronized clock 40 maintains synchronized time in response to timing data packets and follow up packets which are transferred via thenetwork 30. For example, a timing data packet 218 and a follow uppacket 216 are carried on thenetwork 30. The timing data packet 218 and the follow uppacket 216 are generated by a master clock on thenetwork 30. The master clock may be contained in one of the nodes 22-24 or on another node reachable via thenetwork 30. The master clock may be a real-time clock. - The timing data packet 218 includes a
delimiter 254 that identifies it as a timing data packet for the synchronization protocol of thesynchronized clock 40. The follow uppacket 216 includes atime stamp 250. Thetime stamp 250 indicates the local time in the master clock when the timing data packet 218 was generated. - The
time packet recognizer 214 receives the timing data packet 218 through thephysical interface 200. Thetime packet recognizer 214 detects a unique timing point in the recovered bit stream for the timing data packet 218. Upon detection of the unique timing point, thetime packet recognizer 214 causes thelatch 210 to latch a time value from theclock 212. The time value held in thelatch 210 indicates the local time at which thetime packet recognizer 214 received the timing data packet 218. Thereafter, thetime packet recognizer 214 receives the follow uppacket 216 and extracts thetime stamp 250. The difference between thetime stamp 250 and the time value in thelatch 210 indicates the relative synchronization of the master clock and theclock 212. Once this difference is computed by theprocessor 202 it is used to adjust the time value in theclock 212 to conform it to the master clock. - The adjustment of the time value in the
clock 212 may be accomplished by implementing theclock 212 as a counter driven by an oscillator with sufficient stability. The least significant few bits of the counter may be implemented as an adder so that an increment on oscillator periods may be occasionally increased or decreased to effectively speed up or slow down theclock 212 in accordance with the results of the computation of the difference between thetime stamp 250 and the time held in thelatch 210. Theprocessor 202 when executing the event time-stamp recorder function 68 reads the contents of theclock 212 to obtain time-stamps. - As a distributed application executes, the present teachings yield a set of time-stamp records in each node involved in the distributed application. Synchronized clocks in each node provide a synchronized time base that allows temporal ordering of the time-stamp records. This information is the basis for performance analysis of the end-to-end distributed application. In addition to summary statistical performance metrics (e.g. average end-to-end latency) details on individual distributed transactions can be captured with this system.
- From the time-stamp records, an individual transaction can be analyzed to elucidate why it deviates from the norm. This detailed information provides key insights to software engineers and system programmers to understand the overall behavior of the distributed application.
- Because this technique quickly identifies performance bottlenecks across the distributed system, engineering resources can be focused on the areas to optimize, tune, and/or redesign software/hardware. The resulting improvements can be monitored and analyzed with the present techniques to assess the real benefits of the changes and to focus engineering activities for the next round of improvements.
- Through an iterative process of using the present techniques to identify performance bottlenecks and then focusing engineering resources to remove those bottlenecks, the performance of the distributed application can be subsequently improved.
- An event time-stamp recorder can run in two modes including one in which a time-stamp and code are provided by application (usually by the hardware), and one in which a time-stamp is read by the event time-stamp recorder as it processes the code from the application.
- In some embodiments, the event code of interest is presented to the application along with a time-stamp. In this embodiment, an event time-stamp recorder stores both the event code and time-stamp and does not read a local clock. For example, a measurement node in a distributed measurement and control system automatically generates a time-stamp when a measurement is made. If the application finds this measurement of interest, it passes the appropriate event code and time-stamp to an event time-stamp recorder for storage.
- The present techniques provide the ability to analyze repetitions of a sequence of distributed transactions. Because time-stamp records from each repetition are captured, it is very useful to analyze how all the repetitions compare. For example, statistical descriptions of the complete transaction such as the average delay for a transaction, the maximum delay, the minimum delay, and the statistical distribution (i.e. histogram).
- A pair states may be selected and the delay between them analyzed. This provides a portion of the delay for the entire transaction and similar information such as average, max, min, and distribution may be calculated.
- The fact the present techniques yield a time-stamp for of every state across a distributed application provides more information in comparison to other measurement techniques. This makes it possible to analyze the statistical distribution over and above a simple average.
- It may be useful is to examine what is happening on different nodes. One goal of distributed applications is to allow all the nodes to perform useful work at the same time (e.g parallel execution). While the server is working, the client is also performing some useful activity. The events and time-stamps from the different nodes yielded by the present techniques enable the generation of diagrams that describe how much parallel work is really occurring.
- In addition to providing time-stamps, the synchronized clock mechanisms disclosed herein also provide detailed statistics on how tightly synchronized a slave clock is to the remote master clock. One statistic that is available is the local clock offset Due to the nature of the synchronization algorithm in some embodiments (a digital software servo algorithm) this value will vary between the synchronization bounds. An event time-stamp recorder can store this offset along with the time-stamp. In a post processing phase, this new information can be used when comparing time-stamps from different nodes. This may be viewed as time-stamp confidence limits on the stair-step plots. This yields a visual indication if two events are too close together to differentiate which came first.
- Companion nodes when used are preferably in close proximity to the corresponding nodes and communicate using a low latency mechanism such as a wire or parallel port, etc.
- The companion node may be very simple and contain just a synchronized clock. A node sends a signal to the companion node and receive back the current time-stamp. All the buffer management functions would be on the other node. This is useful when the other node is a full participant in the present techniques but does not have a synchronized clock. For example, the other node may be a PC or network server.
- Alternatively, companion nodes may have synchronized clocks and all the buffer management function. The other node sends the event code. The companion node then performs the time-stamp function, buffer management, etc. The code may be via a separate digital or analog wire with the companion node making a measurement of the behavior of the other node.
- It is preferable that the communication latency between the a node and its companion node be kept to a minimum.
- The event logs 90-94 may be organized in a circular fashion (circular queue). During data gathering, the event logs 90-94 fill and new time-stamp records replace the oldest time-stamp records in the event logs 90-94. If one of the nodes 20-24 recognizes a deviant situation such as a long round trip for a network transaction it can quickly sends messages out to all the participant nodes preferably using a multi-cast message on the
network 30. This message includes a begin time and duration of interest. All participant nodes use this information to lock down those sections of there corresponding event buffers 90-94 so that they are not overwritten with new time-stamp records. Thereafter, the locked down portions of the event buffers 90-94 may be retrieved for post analysis. As the locked down portions are retrieved, the corresponding node 20-24 node may unlock those portions of the corresponding event buffer 90-94 and continue to gather time-stamp records. This is particularly useful in application where significant events are infrequent. The nodes 20-24 are configured to watch for a signification event and when it is detected all the other nodes 20-24 get notified. - It is preferable that event logs 90-94 are large enough to store all the interesting events over the fetch phase of the post process interval plus a safety margin to hold all the events that have recently come in. The safety margin is sized such that each node will have sufficient time to perform the determination of whether an event is interesting and to send out the lock down message. The transit time and processing time for the lock down message should also be considered.
- The present techniques may introduce slight delays in the execution of the distributed application. This delay may be measured using the present techniques and the delays removed in the post processing phase. To perform this correction, an application would execute a correction loop such as the following;
 For (I=0; 1<10000; I++) {
      EventLog(startCorrectionCode):
      EventLog(endCorrectionCode);
}
Claims (10)
- A distributed application with performance monitoring capability, comprisinga set of node applications (50-54) which communicate via a network (30), each node having a clock, the clocks being synchronized with each other, each node application having at least one function (60-64, 70-74) and each node further having a recorder function (68) which when called by the function obtains an event code from the function and obtains a time-stamp from a corresponding synchronized clock (40-44);an event log (90-94) for each node application, each event log for holding a record including the corresponding event code and the corresponding time-stamp such that the time-stamps in the event logs provide a synchronized time base in the distributed application for evaluating a set of significant events identified by the event codes; andmeans for stopping the recording of records in a plurality of the event logs so that the records therein are locked down and not overwritten, and for restarting the recording of said records in each event log after retrieval of the locked down record therein.
- The distributed application of claim 1, wherein each recorder function (68) obtains the event code from the corresponding function and writes the event code into the corresponding event log along with the corresponding time-stamp.
- The distributed application of claim 1 or 2, wherein one or more of the node applications executes on a node that includes the corresponding synchronized clock (40-44).
- The distributed application of claim 1 or 2, wherein one or more of the node applications executes on a node that does not have a synchronized clock but is connected to a companion node that includes a corresponding synchronized clock (40-44).
- The distributed application of any preceding claim, further comprising means for obtaining the records from the event logs (90-94) via the network (30') and analyzing the records using the time-stamps and event codes.
- The distributed application of any preceding claim, wherein the significant events comprise one or more of the following:(i) a generation of an HTTP command in the distributed application;(ii) a transmission of a message on the network;(iii) a receipt of a message on the network;(iv) a database access(v) a generation of a control value in the distributed application;(vi) a receipt of sensor data; and(vii) an application of a control value to an actuator.
- A method of performance monitoring in a distributed application having a set of node applications, (50-54) that communicate via a network (30), comprising the steps of:providing each node with a clock, the clocks being synchronized with each other, and with a recorder function (68, 78, 88) that obtain an event code from a function of the corresponding node application and that generates a record that includes a time-stamp obtained from a corresponding synchronized clock (40-44);running an experiment in the distributed application;obtaining the records from the node applications and analyzing the records such that the time-stamps in the records provide a synchronized time base in the distributed application for evaluating a set of significant events identified by the event codes; andstopping the recording of records in a plurality of the event logs so that the records therein are locked down and not overwritten, and restarting the recording of said records in each event log after retrieval of the locked down record therein.
- The method of claim 7, wherein the step of analyzing the records comprises the step of generating a graphical representation of the records.
- The method of claim 7 or 8, further comprising the step of determining a set of delays in execution of the node applications (50-54) associated with the generation of the records.
- The method of claim,9, further comprising the step of correcting the records in response to the delays.
Applications Claiming Priority (2)
| Application Number | Priority Date | Filing Date | Title |
|---|---|---|---|
| US09/480,041 US6751573B1 (en) | 2000-01-10 | 2000-01-10 | Performance monitoring in distributed systems using synchronized clocks and distributed event logs |
| US480041 | 2000-01-10 |
Publications (3)
| Publication Number | Publication Date |
|---|---|
| EP1117045A2 EP1117045A2 (en) | 2001-07-18 |
| EP1117045A3 EP1117045A3 (en) | 2002-12-18 |
| EP1117045B1 true EP1117045B1 (en) | 2007-08-29 |
Family
ID=23906435
Family Applications (1)
| Application Number | Title | Priority Date | Filing Date |
|---|---|---|---|
| EP01300068A Expired - Lifetime EP1117045B1 (en) | 2000-01-10 | 2001-01-05 | Performance monitoring in distributed systems |
Country Status (4)
| Country | Link |
|---|---|
| US (1) | US6751573B1 (en) |
| EP (1) | EP1117045B1 (en) |
| JP (1) | JP2001244953A (en) |
| DE (1) | DE60130158T2 (en) |
Cited By (1)
| Publication number | Priority date | Publication date | Assignee | Title |
|---|---|---|---|---|
| US8458364B2 (en) | 2006-08-02 | 2013-06-04 | Freescale Semiconductor, Inc. | Method for receiving and processing frames and a device having frame receiving and processing capabilities |
Families Citing this family (62)
| Publication number | Priority date | Publication date | Assignee | Title |
|---|---|---|---|---|
| JP4453178B2 (en) * | 2000-09-13 | 2010-04-21 | 日本電気株式会社 | Communication network system and communication network node device |
| US6934766B1 (en) * | 2000-11-02 | 2005-08-23 | Cisco Technology, Inc. | Method and apparatus for exchanging event information between computer systems that reduce perceived lag times by subtracting actual lag times from event playback time |
| US7283568B2 (en) * | 2001-09-11 | 2007-10-16 | Netiq Corporation | Methods, systems and computer program products for synchronizing clocks of nodes on a computer network |
| JP3901484B2 (en) * | 2001-10-05 | 2007-04-04 | 株式会社ジェイテクト | Electric power steering device |
| US7930756B1 (en) | 2001-12-12 | 2011-04-19 | Crocker Steven Toye | Multi-level cryptographic transformations for securing digital assets |
| US8006280B1 (en) | 2001-12-12 | 2011-08-23 | Hildebrand Hal S | Security system for generating keys from access rules in a decentralized manner and methods therefor |
| US7565683B1 (en) | 2001-12-12 | 2009-07-21 | Weiqing Huang | Method and system for implementing changes to security policies in a distributed security system |
| US7921450B1 (en) | 2001-12-12 | 2011-04-05 | Klimenty Vainstein | Security system using indirect key generation from access rules and methods therefor |
| US7921284B1 (en) | 2001-12-12 | 2011-04-05 | Gary Mark Kinghorn | Method and system for protecting electronic data in enterprise environment |
| US7260555B2 (en) | 2001-12-12 | 2007-08-21 | Guardian Data Storage, Llc | Method and architecture for providing pervasive security to digital assets |
| US10360545B2 (en) | 2001-12-12 | 2019-07-23 | Guardian Data Storage, Llc | Method and apparatus for accessing secured electronic data off-line |
| US8065713B1 (en) | 2001-12-12 | 2011-11-22 | Klimenty Vainstein | System and method for providing multi-location access management to secured items |
| US7178033B1 (en) | 2001-12-12 | 2007-02-13 | Pss Systems, Inc. | Method and apparatus for securing digital assets |
| US10033700B2 (en) | 2001-12-12 | 2018-07-24 | Intellectual Ventures I Llc | Dynamic evaluation of access rights |
| US7921288B1 (en) | 2001-12-12 | 2011-04-05 | Hildebrand Hal S | System and method for providing different levels of key security for controlling access to secured items |
| US7380120B1 (en) | 2001-12-12 | 2008-05-27 | Guardian Data Storage, Llc | Secured data format for access control |
| US7950066B1 (en) | 2001-12-21 | 2011-05-24 | Guardian Data Storage, Llc | Method and system for restricting use of a clipboard application |
| US8176334B2 (en) | 2002-09-30 | 2012-05-08 | Guardian Data Storage, Llc | Document security system that permits external users to gain access to secured files |
| NZ518575A (en) * | 2002-04-24 | 2004-08-27 | Open Cloud Ltd | Distributed application server using a peer configuration |
| US7373557B1 (en) * | 2003-04-04 | 2008-05-13 | Unisys Corporation | Performance monitor for data processing systems |
| US8707034B1 (en) | 2003-05-30 | 2014-04-22 | Intellectual Ventures I Llc | Method and system for using remote headers to secure electronic files |
| US7613212B1 (en) * | 2003-06-10 | 2009-11-03 | Atrica Israel Ltd. | Centralized clock synchronization for time division multiplexed traffic transported over Ethernet networks |
| US7570669B2 (en) * | 2003-08-08 | 2009-08-04 | Opnet Technologies, Inc. | Synchronizing packet traces |
| US7703140B2 (en) | 2003-09-30 | 2010-04-20 | Guardian Data Storage, Llc | Method and system for securing digital assets using process-driven security policies |
| US20050091405A1 (en) * | 2003-09-30 | 2005-04-28 | Jerry J. Liu | Method and system for using multiple data type representations to deliver data objects to components in a distributed system |
| US8127366B2 (en) | 2003-09-30 | 2012-02-28 | Guardian Data Storage, Llc | Method and apparatus for transitioning between states of security policies used to secure electronic documents |
| US7379999B1 (en) * | 2003-10-15 | 2008-05-27 | Microsoft Corporation | On-line service/application monitoring and reporting system |
| US7457872B2 (en) * | 2003-10-15 | 2008-11-25 | Microsoft Corporation | On-line service/application monitoring and reporting system |
| WO2005050463A1 (en) * | 2003-11-19 | 2005-06-02 | Nimcat Networks Inc. | Time and data synchronization between network devices |
| US7529979B2 (en) * | 2003-12-12 | 2009-05-05 | International Business Machines Corporation | Hardware/software based indirect time stamping methodology for proactive hardware/software event detection and control |
| US7702909B2 (en) * | 2003-12-22 | 2010-04-20 | Klimenty Vainstein | Method and system for validating timestamps |
| DE10360978A1 (en) | 2003-12-23 | 2005-07-28 | OCé PRINTING SYSTEMS GMBH | Method and control device for displaying diagnostic data of a printer or copier |
| US7380173B2 (en) * | 2004-08-03 | 2008-05-27 | International Business Machines Corporation | Identifying temporal ambiguity in a aggregated log stream |
| DE102004063446A1 (en) * | 2004-12-30 | 2006-07-13 | Landis+Gyr Gmbh | Device for storing events and method for storing events |
| JP4473766B2 (en) * | 2005-04-04 | 2010-06-02 | 株式会社日立製作所 | Computer system, log collection method, and computer program |
| US7269406B2 (en) * | 2005-05-26 | 2007-09-11 | Intel Corporation | Methods and apparatus for providing information indicative of traffic delay of a wireless link |
| US20070219751A1 (en) * | 2006-03-17 | 2007-09-20 | Jonathan Huang | Sensor network data alignment with post-process resampling |
| US20080031283A1 (en) * | 2006-08-07 | 2008-02-07 | Martin Curran-Gray | Time synchronization for network aware devices |
| US20080228459A1 (en) * | 2006-10-12 | 2008-09-18 | Nec Laboratories America, Inc. | Method and Apparatus for Performing Capacity Planning and Resource Optimization in a Distributed System |
| US20080123732A1 (en) * | 2006-11-27 | 2008-05-29 | Rajesh Mamidwar | Method and system for configuring decoding based on detecting transport stream input rate |
| CN101212309B (en) * | 2006-12-30 | 2011-06-15 | 华为技术有限公司 | Method for controlling time stamp of reported event |
| US8174990B2 (en) | 2007-02-16 | 2012-05-08 | International Business Machines Corporation | Mechanism and system for programmable measurement of aggregate metrics from a dynamic set of nodes |
| US8799213B2 (en) * | 2007-07-31 | 2014-08-05 | Oracle International Corporation | Combining capture and apply in a distributed information sharing system |
| US7801852B2 (en) * | 2007-07-31 | 2010-09-21 | Oracle International Corporation | Checkpoint-free in log mining for distributed information sharing |
| US20090089623A1 (en) * | 2007-09-28 | 2009-04-02 | Agilent Technologies, Inc | Event timing analyzer for a system of instruments and method of analyzing event timing in a system of intruments |
| US8090972B2 (en) * | 2007-11-26 | 2012-01-03 | Vestas Wind Systems A/S | Method and system for registering events in wind turbines of a wind power system |
| US8826242B2 (en) * | 2007-11-27 | 2014-09-02 | Microsoft Corporation | Data driven profiling for distributed applications |
| US7818422B2 (en) * | 2007-12-31 | 2010-10-19 | Microsoft Corporation | Real-time monitoring of a routing server |
| AT505630B1 (en) * | 2008-02-05 | 2009-03-15 | Ver Fachhochschule Technikum W | DEVICE FOR COORDINATED TESTING AND TROUBLESHOOTING IN DISTRIBUTED EMBEDDED MICROPROCESSOR SYSTEMS |
| US9230002B2 (en) * | 2009-01-30 | 2016-01-05 | Oracle International Corporation | High performant information sharing and replication for single-publisher and multiple-subscriber configuration |
| US9986268B2 (en) | 2009-03-03 | 2018-05-29 | Mobilitie, Llc | System and method for multi-channel WiFi video streaming |
| US10616619B2 (en) | 2009-03-03 | 2020-04-07 | Mobilitie, Llc | System and method for multi-channel WiFi video streaming |
| EP2482418B1 (en) * | 2011-02-01 | 2018-08-22 | Siemens Aktiengesellschaft | Active desynchronization of switching converters |
| US8521345B2 (en) * | 2011-12-28 | 2013-08-27 | General Electric Company | System and method for rail vehicle time synchronization |
| US9432269B2 (en) * | 2013-04-06 | 2016-08-30 | Citrix Systems, Inc. | Systems and methods for exporting application details using appflow |
| EP3237989A4 (en) * | 2014-12-27 | 2018-07-11 | Intel Corporation | Technologies for synchronized sampling of counters based on a global clock |
| US9665585B2 (en) * | 2015-01-23 | 2017-05-30 | International Business Machines Corporation | Preserving high value entries in an event log |
| JP6281603B2 (en) * | 2016-06-23 | 2018-02-21 | 日本電気株式会社 | Information processing system, information processing method, and information processing program |
| US10104148B2 (en) * | 2017-01-03 | 2018-10-16 | Globalfoundries Inc. | Nanosecond accuracy under precision time protocol for ethernet by using high accuracy timestamp assist device |
| WO2018213594A2 (en) | 2017-05-19 | 2018-11-22 | Walmart Apollo, Llc | System and method for smart facilities monitoring |
| CN109146213B (en) * | 2017-06-16 | 2022-04-12 | 北京航空航天大学 | Spacecraft power system health management verification and evaluation environment system |
| CN110609777B (en) * | 2018-06-15 | 2023-11-03 | 伊姆西Ip控股有限责任公司 | Method, apparatus and computer program product for managing logs |
Family Cites Families (8)
| Publication number | Priority date | Publication date | Assignee | Title |
|---|---|---|---|---|
| JPS6436243A (en) * | 1987-07-31 | 1989-02-07 | Nec Corp | Time unifying system in local area network |
| DE69221487T2 (en) | 1992-08-31 | 1998-03-05 | Hewlett Packard Co | Method and arrangement for monitoring a distributed system |
| GB2296166B (en) * | 1994-11-29 | 1999-07-07 | Plessey Telecomm | Clock synchronisation |
| US5566180A (en) * | 1994-12-21 | 1996-10-15 | Hewlett-Packard Company | Method for recognizing events and synchronizing clocks |
| JPH08321816A (en) * | 1995-05-25 | 1996-12-03 | Nec Eng Ltd | Automatic program control system |
| US5805442A (en) * | 1996-05-30 | 1998-09-08 | Control Technology Corporation | Distributed interface architecture for programmable industrial control systems |
| US5828876A (en) * | 1996-07-31 | 1998-10-27 | Ncr Corporation | File system for a clustered processing system |
| US6205362B1 (en) * | 1997-11-24 | 2001-03-20 | Agilent Technologies, Inc. | Constructing applications in distributed control systems using components having built-in behaviors |
-
2000
- 2000-01-10 US US09/480,041 patent/US6751573B1/en not_active Expired - Fee Related
-
2001
- 2001-01-05 EP EP01300068A patent/EP1117045B1/en not_active Expired - Lifetime
- 2001-01-05 DE DE60130158T patent/DE60130158T2/en not_active Expired - Lifetime
- 2001-01-10 JP JP2001002238A patent/JP2001244953A/en active Pending
Cited By (1)
| Publication number | Priority date | Publication date | Assignee | Title |
|---|---|---|---|---|
| US8458364B2 (en) | 2006-08-02 | 2013-06-04 | Freescale Semiconductor, Inc. | Method for receiving and processing frames and a device having frame receiving and processing capabilities |
Also Published As
| Publication number | Publication date |
|---|---|
| DE60130158D1 (en) | 2007-10-11 |
| DE60130158T2 (en) | 2008-05-21 |
| JP2001244953A (en) | 2001-09-07 |
| EP1117045A2 (en) | 2001-07-18 |
| EP1117045A3 (en) | 2002-12-18 |
| US6751573B1 (en) | 2004-06-15 |
Similar Documents
| Publication | Publication Date | Title |
|---|---|---|
| EP1117045B1 (en) | Performance monitoring in distributed systems | |
| JP2910973B2 (en) | Information collection method, data communication network control system, and data communication network control method | |
| JP2644180B2 (en) | Method of constructing an event driven interface and analyzing its output | |
| US5896524A (en) | Off-line clock synchronization for multiprocessor event traces | |
| US7568023B2 (en) | Method, system, and data structure for monitoring transaction performance in a managed computer network environment | |
| US6714976B1 (en) | Systems and methods for monitoring distributed applications using diagnostic information | |
| US6658367B2 (en) | System for time-bucketing of baselined data collector data | |
| JP2644179B2 (en) | Event driven interface and method for generating event vector | |
| US7924732B2 (en) | Quality of service in IT infrastructures | |
| JP2001243093A (en) | Distributed system | |
| JP3739108B2 (en) | Event processing system | |
| US8560684B2 (en) | Network transaction discovery | |
| EP2486698B1 (en) | Method and system for reconstructing transactions in a communication network | |
| US7523352B2 (en) | System and method for examining remote systems and gathering debug data in real time | |
| US20080235365A1 (en) | Automatic root cause analysis of performance problems using auto-baselining on aggregated performance metrics | |
| EP0661847A2 (en) | Automated benchmarking with self customization | |
| US7254646B2 (en) | Analysis of causal relations between intercommunicating nodes | |
| EP2145239B1 (en) | Diagnostic and trouble-shooting methods in a wireless control and sensor network | |
| JP2001519942A (en) | Systems and methods for monitoring distributed applications | |
| EP1424809B1 (en) | Decentralized SLS monitoring in a differentiated service environment | |
| US20030046031A1 (en) | Baselining of data collector data | |
| JP2002522957A (en) | System and method for monitoring a distributed application using diagnostic information | |
| US20190089616A1 (en) | Path-synchronous performance monitoring of interconnection networks based on source code attribution | |
| CN108462598A (en) | A kind of daily record generation method, log analysis method and device | |
| CN113259364B (en) | Network event correlation analysis method and device and computer equipment |
Legal Events
| Date | Code | Title | Description |
|---|---|---|---|
| PUAI | Public reference made under article 153(3) epc to a published international application that has entered the european phase |
Free format text: ORIGINAL CODE: 0009012 |
|
| AK | Designated contracting states |
Kind code of ref document: A2 Designated state(s): AT BE CH CY DE DK ES FI FR GB GR IE IT LI LU MC NL PT SE TR |
|
| AX | Request for extension of the european patent |
Free format text: AL;LT;LV;MK;RO;SI |
|
| RAP1 | Party data changed (applicant data changed or rights of an application transferred) |
Owner name: AGILENT TECHNOLOGIES INC. |
|
| RAP1 | Party data changed (applicant data changed or rights of an application transferred) |
Owner name: AGILENT TECHNOLOGIES INC. A DELAWARE CORPORATION |
|
| RAP1 | Party data changed (applicant data changed or rights of an application transferred) |
Owner name: AGILENT TECHNOLOGIES, INC. (A DELAWARE CORPORATION |
|
| PUAL | Search report despatched |
Free format text: ORIGINAL CODE: 0009013 |
|
| AK | Designated contracting states |
Kind code of ref document: A3 Designated state(s): AT BE CH CY DE DK ES FI FR GB GR IE IT LI LU MC NL PT SE TR |
|
| AX | Request for extension of the european patent |
Free format text: AL;LT;LV;MK;RO;SI |
|
| 17P | Request for examination filed |
Effective date: 20030331 |
|
| AKX | Designation fees paid |
Designated state(s): DE FR GB |
|
| 17Q | First examination report despatched |
Effective date: 20050119 |
|
| GRAP | Despatch of communication of intention to grant a patent |
Free format text: ORIGINAL CODE: EPIDOSNIGR1 |
|
| GRAS | Grant fee paid |
Free format text: ORIGINAL CODE: EPIDOSNIGR3 |
|
| RAP1 | Party data changed (applicant data changed or rights of an application transferred) |
Owner name: AGILENT TECHNOLOGIES, INC. |
|
| GRAA | (expected) grant |
Free format text: ORIGINAL CODE: 0009210 |
|
| AK | Designated contracting states |
Kind code of ref document: B1 Designated state(s): DE FR GB |
|
| REG | Reference to a national code |
Ref country code: GB Ref legal event code: FG4D |
|
| REF | Corresponds to: |
Ref document number: 60130158 Country of ref document: DE Date of ref document: 20071011 Kind code of ref document: P |
|
| ET | Fr: translation filed | ||
| PGFP | Annual fee paid to national office [announced via postgrant information from national office to epo] |
Ref country code: GB Payment date: 20080229 Year of fee payment: 8 |
|
| PLBE | No opposition filed within time limit |
Free format text: ORIGINAL CODE: 0009261 |
|
| STAA | Information on the status of an ep patent application or granted ep patent |
Free format text: STATUS: NO OPPOSITION FILED WITHIN TIME LIMIT |
|
| PGFP | Annual fee paid to national office [announced via postgrant information from national office to epo] |
Ref country code: FR Payment date: 20080311 Year of fee payment: 8 |
|
| 26N | No opposition filed |
Effective date: 20080530 |
|
| GBPC | Gb: european patent ceased through non-payment of renewal fee |
Effective date: 20090105 |
|
| REG | Reference to a national code |
Ref country code: FR Ref legal event code: ST Effective date: 20091030 |
|
| PG25 | Lapsed in a contracting state [announced via postgrant information from national office to epo] |
Ref country code: GB Free format text: LAPSE BECAUSE OF NON-PAYMENT OF DUE FEES Effective date: 20090105 |
|
| PG25 | Lapsed in a contracting state [announced via postgrant information from national office to epo] |
Ref country code: FR Free format text: LAPSE BECAUSE OF NON-PAYMENT OF DUE FEES Effective date: 20090202 |
|
| PGFP | Annual fee paid to national office [announced via postgrant information from national office to epo] |
Ref country code: DE Payment date: 20130103 Year of fee payment: 13 |
|
| REG | Reference to a national code |
Ref country code: DE Ref legal event code: R119 Ref document number: 60130158 Country of ref document: DE |
|
| REG | Reference to a national code |
Ref country code: DE Ref legal event code: R119 Ref document number: 60130158 Country of ref document: DE Effective date: 20140801 |
|
| PG25 | Lapsed in a contracting state [announced via postgrant information from national office to epo] |
Ref country code: DE Free format text: LAPSE BECAUSE OF NON-PAYMENT OF DUE FEES Effective date: 20140801 |