EP0950960B1 - Usage based methods of traversing and displaying generalized graph structures - Google Patents
Usage based methods of traversing and displaying generalized graph structures Download PDFInfo
- Publication number
- EP0950960B1 EP0950960B1 EP99107559A EP99107559A EP0950960B1 EP 0950960 B1 EP0950960 B1 EP 0950960B1 EP 99107559 A EP99107559 A EP 99107559A EP 99107559 A EP99107559 A EP 99107559A EP 0950960 B1 EP0950960 B1 EP 0950960B1
- Authority
- EP
- European Patent Office
- Prior art keywords
- node
- nodes
- usage
- tree structure
- visited
- Prior art date
- Legal status (The legal status is an assumption and is not a legal conclusion. Google has not performed a legal analysis and makes no representation as to the accuracy of the status listed.)
- Expired - Lifetime
Links
- 238000000034 method Methods 0.000 title claims description 109
- 230000006870 function Effects 0.000 claims description 6
- 239000011159 matrix material Substances 0.000 description 22
- 238000012800 visualization Methods 0.000 description 7
- 230000002457 bidirectional effect Effects 0.000 description 5
- 238000012423 maintenance Methods 0.000 description 5
- 238000000926 separation method Methods 0.000 description 5
- 238000012986 modification Methods 0.000 description 4
- 230000004048 modification Effects 0.000 description 4
- 238000004458 analytical method Methods 0.000 description 3
- 230000000007 visual effect Effects 0.000 description 3
- 238000007792 addition Methods 0.000 description 2
- 230000008859 change Effects 0.000 description 2
- 230000001149 cognitive effect Effects 0.000 description 2
- 238000004891 communication Methods 0.000 description 2
- 238000012886 linear function Methods 0.000 description 2
- 230000007246 mechanism Effects 0.000 description 2
- 238000012544 monitoring process Methods 0.000 description 2
- 238000002910 structure generation Methods 0.000 description 2
- 238000012360 testing method Methods 0.000 description 2
- 238000007794 visualization technique Methods 0.000 description 2
- 235000008694 Humulus lupulus Nutrition 0.000 description 1
- 238000013459 approach Methods 0.000 description 1
- 230000008901 benefit Effects 0.000 description 1
- 238000007796 conventional method Methods 0.000 description 1
- 230000008878 coupling Effects 0.000 description 1
- 238000010168 coupling process Methods 0.000 description 1
- 238000005859 coupling reaction Methods 0.000 description 1
- 230000007423 decrease Effects 0.000 description 1
- 230000003247 decreasing effect Effects 0.000 description 1
- 230000001419 dependent effect Effects 0.000 description 1
- 230000000694 effects Effects 0.000 description 1
- 230000003993 interaction Effects 0.000 description 1
- 238000013507 mapping Methods 0.000 description 1
- 238000003825 pressing Methods 0.000 description 1
- 230000008569 process Effects 0.000 description 1
- 238000012545 processing Methods 0.000 description 1
- 230000007480 spreading Effects 0.000 description 1
- 230000009466 transformation Effects 0.000 description 1
Images


Classifications
-
- G—PHYSICS
- G06—COMPUTING; CALCULATING OR COUNTING
- G06F—ELECTRIC DIGITAL DATA PROCESSING
- G06F16/00—Information retrieval; Database structures therefor; File system structures therefor
- G06F16/90—Details of database functions independent of the retrieved data types
- G06F16/95—Retrieval from the web
- G06F16/955—Retrieval from the web using information identifiers, e.g. uniform resource locators [URL]
- G06F16/9558—Details of hyperlinks; Management of linked annotations
-
- G—PHYSICS
- G06—COMPUTING; CALCULATING OR COUNTING
- G06F—ELECTRIC DIGITAL DATA PROCESSING
- G06F16/00—Information retrieval; Database structures therefor; File system structures therefor
- G06F16/70—Information retrieval; Database structures therefor; File system structures therefor of video data
- G06F16/74—Browsing; Visualisation therefor
- G06F16/748—Hypervideo
-
- G—PHYSICS
- G06—COMPUTING; CALCULATING OR COUNTING
- G06F—ELECTRIC DIGITAL DATA PROCESSING
- G06F16/00—Information retrieval; Database structures therefor; File system structures therefor
- G06F16/90—Details of database functions independent of the retrieved data types
- G06F16/93—Document management systems
- G06F16/94—Hypermedia
-
- Y—GENERAL TAGGING OF NEW TECHNOLOGICAL DEVELOPMENTS; GENERAL TAGGING OF CROSS-SECTIONAL TECHNOLOGIES SPANNING OVER SEVERAL SECTIONS OF THE IPC; TECHNICAL SUBJECTS COVERED BY FORMER USPC CROSS-REFERENCE ART COLLECTIONS [XRACs] AND DIGESTS
- Y10—TECHNICAL SUBJECTS COVERED BY FORMER USPC
- Y10S—TECHNICAL SUBJECTS COVERED BY FORMER USPC CROSS-REFERENCE ART COLLECTIONS [XRACs] AND DIGESTS
- Y10S707/00—Data processing: database and file management or data structures
- Y10S707/99931—Database or file accessing
- Y10S707/99933—Query processing, i.e. searching
Definitions
- the invention is related to the field of displaying generalized graph structures. Specifically, the invention is related to generating a tree structure representation for display of a generalized graph structure, and the invention is related to displaying tree structure representations of a generalized graph structure.
- the invention addresses the problem of laying out large directed graphs, such as World-Wide Web sites, so that the important relationships are exposed.
- the World-Wide Web (“web”) is perhaps the most important information access mechanism to be introduced to the general public in the 20th Century. As larger numbers of organizations rely on the Internet to distribute information to potential consumers and investors, they also realize its potential for distributing and organizing large volumes of data for later retrieval by employees and business partners. A company's web site is rapidly becoming one of its most important business investments.
- a web site As an information repository, a web site generally receives a high amounts of usage. Web site usage patterns that are derived by monitoring how the company's employees use its web site enhance the companies understanding of its business activities. For example, monitoring what product literature the sales force is downloading may be a way to forecast sales. In short, traditional market analysis can be applied to this information resource.
- a web site is a dynamic structure, because its topology as evidenced by its linkage structure, the contents of its pages, and its usage changes continually. Analysts want to be able to analyze the evolving web site.
- Web site administrators and designers have a need to understand the relationship between the web site's usage parameters and its link topology, and vice versa. Since web sites are dynamically changing over time, maintains need to understand how changes to the topology affect usage.
- some conventional web site display methods encode usage information in the visualization
- no conventional methods reference usage information in generating the structure to be displayed from the generalized graph structure.
- no conventional system modifies the positioning of nodes based within a displayed structure upon the nodes usage.
- the World-Wide Web is a complex large directed graph. Visualizing a general directed graph is well-known and difficult problem. In fact, none of the current graph layout algorithms can deal with a 7,000-node graph in a reasonable manner. However, as a sub-domain of directed graph, web site linkage structures tend to be rather hierarchical. That is, while a web site is not a tree, a tree representation often approximates a web site well.
- Breadth-first traversal transforms the web graph into a tree by placing a node as closely to the root node as possible. After obtaining this tree, the structure is then visualized using the disk tree visualization technique.
- a disk tree uses a circular layout to visualize the hierarchy. Each successive circle denotes levels in the tree.
- the layout algorithm runs in two passes: In the first pass, the algorithm traverses the entire hierarchy using post-order traversal. At each node, the algorithm calculates the number of leaf nodes in that sub-tree. So the total number of leaves in the tree is known.
- the algorithm then calculates the amount of angular space to be allocated for each leaf node (360 degrees divided by the total number of leaves).
- the algorithm traverses the hierarchy using breadth-first traversal. At each node, it allocates the amount of angular space for that node by looking to see how many leaf nodes are rooted at that sub-tree. In this manner, each leaf node is guaranteed a fixed amount of angular space.
- the disk tree has several advantages. First, the structure of the tree is visualized compactly, with the pattern easily recognizable. Second, when viewed straight on or at slight angles, there are no occlusion problems since the entire layout lies on a two dimensional plane. Third, unlike cone trees, since it is a two dimensional technique, the third dimension can be utilized for other information, such as time, or a three dimensional glyph at each node. Lastly, the circularity is aesthetically pleasing to the eye.
- the visualization itself actually validates the choice of a preferred breadth first transformation algorithm.
- the high traffic areas are usually concentrated near the root node. This means that the algorithm places easy to reach nodes starting from the root node. As the document gets farther and farther away from the root node, the document has a lesser possibility of being accessed.
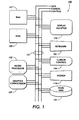
- FIG. 1 illustrates a general purpose computer architecture 100 suitable for implementing the methods according to the invention.
- the general purpose computer 100 includes at least a microprocessor 102, a display monitor 104, and a cursor control device 105.
- the cursor control device 105 can be implemented as a mouse, a joy stick, a series of buttons, or any other input device which allows a user to control position of a cursor or pointer on the display monitor 104.
- the general purpose computer may also include random access memory 107, external storage 103, ROM memory 108, a keyboard 106, a modem 110 and a graphics co-processor 109. All of the elements of the general purpose computer 100 may be tied together by a common bus 101 for transporting data between the various elements.
- the bus 101 typically includes data, address, and control signals.
- the general purpose computer 100 illustrated in Figure 1 includes a single data bus 101 which ties together all of the elements of the general purpose computer 100, there is no requirement that there be a single communication bus 101 which connects the various elements of the general purpose computer 100.
- the microprocessor 102, RAM 107, ROM 108, and graphics co-processor 109 might be tied together with a data bus while the hard disk 103, modem 110, keyboard 106, display monitor 104, and cursor control device 105 are connected together with a second data bus (not shown).
- the first data bus 101 and the second data bus could be linked by a bidirectional bus interface (not shown).
- some of the elements such as the microprocessor 102 and graphics co-processor 109 could be connected to both the first data bus 101 and the second data bus (not shown) and communication between the first and second data bus would occur through the microprocessor 102 and graphics co-processor 109.
- the methods of the invention are thus executable on any general purpose computing architecture such as the 100 illustrated in Figure 1 , but there is clearly no limitation that this architecture is the only one which can execute the methods of the invention.
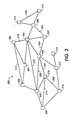
- Figure 2 illustrates a generalized graph structure 200 consisting of fifteen nodes 201 through 215.
- the various nodes 201 through 215 of the generalized graph structure 200 are connected to each other by links, such as those labeled 216 through 225.
- the links connecting the various nodes may either bidirectional or unidirectional.
- a bidirectional link will be represented as a link having no arrows at either end, and a unidirectional link will be denoted by a link having an arrow at one end or the other, which will indicate that a link exists only in the direction that the arrow is pointing.
- link 217 in Figure 2 represents the ability to move from node 202 to node 203, as well as the ability to move from node 203 to node 202.
- link 217 in Figure 2 represents the ability to move from node 202 to node 203, as well as the ability to move from node 203 to node 202.
- link 217 in Figure 2 represents the ability to move from node 202 to node 203, as well as the ability to move from node 203 to node 202.
- link 217 in Figure 2 represents the ability to move from node 202 to node 203, as well as the ability to move from node 203 to node 202.
- Figure 3 illustrates a tree structure representation 300 of the generalized graph structure 200 illustrated in Figure 2 .
- Links 216 through 225 are not shown in the tree structure 300 corresponding to the generalized graph structure 200. Links 216 through 225 were omitted because they create cycles in the generalized graph structure 200.
- a tree structure has no cycles; in other words, there is only one path from any node to any other node. In the tree structure representation 300, there is only one path from any node to any other node because all cycles have been broken.
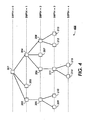
- Figure 4 shows another tree structure representation 400 of the tree structure representation 300 illustrated in Figure 3 .
- node 201 is identified as the root node.
- the root node 201 has a depth of zero.
- the children of the root node 201 are nodes 202, 203, and 204, which exist at a depth of one.
- Node 202 has one child (node 205) and node 204 has three children (nodes 206, 207, and 208).
- Nodes 205 through 208 are at depth two. The depth of any node is determined by the number of links which must be traversed in order to travel back to the root node.
- Nodes 209, 210, 203, 214, 215, 207, 212, and 213 are leaf nodes, because they have no children.
- Figure 5 illustrates a disk tree representation 500 of the tree structure 400 shown in Figure 4 .
- the center point 501 of the disk tree representation 500 corresponds to the root node 201 of the tree structure 400.
- Each of the points 501 through 515 represents one of the nodes 201 through 215.
- the reference numeral corresponding to the point in the disk tree 500 for each node of the tree structure 400 is computed.
- node 201 in Figure 4 is illustrated as node 501 in the disk tree 500
- node 202 is represented by point 502
- node 203 is represented by point 503
- node 215 is represented by point 515.
- Circle 550 contains all points which represent nodes that are at a depth of one from the root node represented by point 501.
- Circle 560 contains all points representing nodes at depth two.
- Circle 570 contains all points representing nodes at depth three, and circle 580 contains all points representing nodes at depth four.
- the angular placement of each point representing a node in the disk tree 500 is determined as follows. The total number of leaf nodes is determined, and the 360° of the circle is divided by that total number of leaf nodes.
- each leaf node thus has 45° of angular space dedicated to it in the disk tree 500.
- the angular placement of a parent node is the angle which bisects the angle formed by its outer most leaf nodes and the root node.
- point 504 representing node 204 has outer most leaves 214 and 213, which correspond to points 514 and 513, respectively, on disk tree 500.
- the angle formed by an outer most leaf 514, the outer most leaf point 513, and the root node 501 is 180°. Therefore, the angle of parent node 504 is the angle bisecting that 180° angle.
- parent point 511 has children points 515 and 514. The children points 515 and 514 together with the root node 501 form a 45° angle, therefore parent point 511 is placed at an angle which bisects that 45° angle.
- the layout of graph structures is performed based upon usage information.
- conventional layout methods are based primarily upon either topology or content
- the methods according to the invention encode additional information by prioritizing (or ranking) usage. These methods provide degree of interest functions for graph visualizations, thereby minimizing cognitive load. While the scope of the invention extends far beyond applications to the web, the web is used to exemplify the methods according to the invention.
- the invention addresses the problem of laying out large directed graphs, such as found in the World-Wide Web, so that the relevant relationships are exposed.
- a usage based traversal turns a general graph into a tree.
- the order of traversal or order of layout or both are chosen based upon usage data such as simple frequencies or cocitation frequencies.
- an intranet view for a company can be dynamically organized.
- additional information is encoded into graph visualizations by laying out graphs based on usage-based information. For example, in information retrieval, hypertext documents are accessed in various frequencies (some are more popular than others). According to the invention, the popularity of an item helps determine the priority the item will receive in the layout of the graph. By coupling the usage data and encoding it into the structural layout of the graph, changes in usage and topology can be viewed at the same time.
- the scope of the invention is not limited to documents on the World-Wide Web, the web as viewed by an administrator of a web site is used as an example to ground the concepts of the invention.
- the invention allows web administrators in charge of maintenance to understand the relationship between a web site's usage patterns and its topology.
- a traditional technique for understanding a complex link structure is to present a visualization or representation of the links and nodes.
- One view of the Web is that of a graph, with documents representing nodes and hyperlinks representing the links between documents. Because of the complexity and sheer number of links, some information is usually filtered or culled to enable effective cognitive visual processing. To ensure that the layout algorithm presents the more important information, these-algorithms often employ degree-of-interest functions.
- the methods according to the invention employ usage information to make layout decisions for a variety of layout algorithms. Some of these algorithms attempt to maximize screen real estate while others function by trying to reveal subtle relationships amongst the elements. Frequency, recency, spacing of accesses, and path information are all forms of usage information which can be referenced according to the methods of the invention. Additionally, derived usage information like need odds and cocitation clustering can also be used, though the invention is not limited to only these forms.
- One method to layout a topology involves starting with a node, called the root node, and spreading out the links radially about the node. The ancillary nodes then repeat until the screen real estate is consumed.
- the layout algorithm may wish to place the highest-used nodes farthest apart from each other so that they have the most growth space. The lowest-used nodes are then placed in the remaining space between the high-usage nodes. The layout continues to place nodes the farthest apart from each other based upon usage values, around the hub. The highest used nodes are optimally separated from each other allowing plenty of screen real estate for their related children nodes to be placed. This is done at the expense of the less used nodes.
- Another layout method according to the invention orders the nodes by usage and then lays them out from high to low (or low to high) to reveal popularity (or deadwood).
- a modified breadth first traversal of a graph encodes usage in its structure.
- the immediate children of the root node are laid out, then their children.
- the order in which the children are visited is not specified in the traversal.
- additional information is encoded into the graph layout simply by choosing a visitation order based on some parameter. For example, the visitation order is determined by sorting nodes based on the amounts of usage (favor popular web pages over less popular ones).
- Another layout algorithm that can be modified to reference usage parameters according to the invention is depth-first traversal, in which nodes in a common ancestry are presented. In this alternative, a vertical slice is presented at the cost of missing nearby neighbors. At each step, the algorithm must determine which children to choose to explore. Similar to the best breadth-first traversal according to the invention, the child that has the highest usage is visited first.
- Usage patterns not only reveal how a document structure is being accessed over an aggregated time-period, but also when collected over time, reveal a flow through the topology. This adds another dimension to the representation. The maintenance personnel can see how usage is changing over time (perhaps due to user changes or external events) and how structural changes affect usage patterns. Comparing these time slices allow the maintenance personnel to discover not only how many people and where they are currently traversing the structure, but also to correlate changes.
- Figure 6 illustrates a generalized graph structure having nine nodes, 1 through 9, and containing many cycles which will be used to illustrate various usage based tree structure generation methods according to the invention.
- bidirectional links between nodes are represented as a pair of unidirectional links.
- node 1 has a link 612 to node 2
- node 2 has a link 621 to node 1.
- Figure 7 illustrates a topology matrix 700 corresponding to the generalized graph structure 600.
- Rows 1 through 9 of the topology matrix 700 correspond to nodes 1 through 9, and columns 1 through 9 of the topology matrix 700 correspond to nodes 1 to 9.
- a topology matrix entry at row i and column i represents the existence or absence of a link from node i to node j.
- node 6 has a link 663 to node 3
- node 7 has a link 678 to node 8.
- the existence of a link from node i to node j is represented as a 1 at row i, column j of the topology matrix 700.
- topology matrix 700 The absence of a link from node i to node j in the generalized graph structure 600 is represented as a 0 in the row i, column j topology matrix 700.
- a topology matrix is generally square, because it specifies linkages from each node to every other node in a generalized graph structure. Diagonal entries of the topology matrix are always zero. Because the links in the generalized graph structure 600 are bidirectional, the topology matrix 700 is symmetric about its diagonal, although there is no requirement that this be the case.
- Figure 8 illustrates a usage parameter vector 800 corresponding to the generalized graph structure 600 shown in Figure 6 .
- the usage parameter for node 1 is 75 at entry 801 of the usage parameter vector 800.
- the usage parameter associated with node 8 is 29 and is found in entry 808 of the usage parameter vector 800.
- the usage parameter vector 800 is simply a list of usage parameters associated with each node of a generalized graph structure.
- an N node generalized graph structure will have an N entry usage parameter vector associated with it.
- the usage parameters in the usage parameter vector 800 thus correspond to measured usages of the corresponding nodes.
- the usage parameter associated with each node could be used to represent the average number of accesses per day of each particular web page in the web site.
- the user parameter associated with each node could represent the sums of the amounts of time that the various users who accessed the page kept the page open. This alternative usage parameter would encode the total dwell time measured by all users who access the page in a given fixed time period.
- the quantity which is encoded by the usage parameter associated with each node can be computed in a variety of separate ways, each of which measures a different type of usage. The methods according to the invention are applicable to any usage parameter that can be conceived and computed for each node.
- usage parameters are most likely normalized to some predefined scale.
- the usage parameters illustrated in Figure 8 are normalized to a scale from 0 to 100.
- Usage parameters could alternatively be normalized, for example, from 0 to 1, or from -1024 to +1024.
- Figure 9 illustrates a usage-based breadth first method 900 for generating a tree structure from a generalized graph structure according to the invention.
- the method 900 begins at step 901 with the claiming of a root node.
- the root node In order to generate a tree structure by a breadth first algorithm, the root node must be specified so that the depth of any node can be calculated relative to the root node.
- the claiming of the root node in step 901 can occur by a variety of mechanisms. For example, a user may place his cursor on a specific node of a generalized graph structure displayed on a computer monitor using his cursor control device and then select the node by pressing a button on the mouse 105. Alternatively, the root node may be claimed by implication from its node name.
- the web home page may have a URL (universal resource locator) which has a semantic structure which indicates that it must be the root node.
- URL www.xerox.com may be parsed by a program implementing the methods according to the invention, and this program may recognize that this web page is the root node of the web site to which the program is being applied by virtue of the name of the node.
- Step 902 merely specifies that the depth of the root node is, by definition, zero. This definition was illustrated in the tree structure 400 in Figure 4 relative to the root node 201 at depth zero.
- the method visits the claimed node having the highest usage parameter associated with it, which is at the current depth and which has not yet already been visited.
- the only node which will have been claimed is the root node, and the root node will also be the only node which exists at the current depth, and it will have not yet been visited. Therefore, the first time that step 903 is encountered in the method 900, the root node is visited.
- the method claims all children of the currently visited node, which have not already been claimed.
- the nodes which are claimed in step 904 can be easily identified by referring to the topology matrix and usage parameter vector.
- the children which should be claimed at step 904 are those nodes which have nonzero entries in the visited node's row of the topology matrix which have not already been claimed.
- step 905 the method 900 determines whether or not there are any additional claimed nodes at the current depth which have not yet been visited.
- the first time that step 905 is encountered in the method 900 the answer to the test presented in 905 will be no, because the only node at the current depth of zero is the root node itself. Therefore, branch 952 takes the method to step 906 where the current depth is incremented.
- the first time that step 906 is encountered in the method 900 the current depth will be set to one.
- the method 900 determines if there are any nodes at the current depth (which was just increased). In other words, test 907 determines whether or not all nodes in the generalized graph structure have been both claimed and visited. If there are no nodes at the current depth, then all nodes have been claimed and visited and branch 954 takes the method to completion at step 908. However, assuming that there are nodes at the newly incremented current depth, branch 953 takes a method back to step 903. At step 903, the claimed node having the highest usage parameter at the current depth is visited. In other words, for all nodes which have been claimed that are at the current depth, the usage parameter is referenced from the usage parameter vector, and the claimed node having the highest usage parameter is selected first for visitation.
- Steps 903, 904, and 905 are repeated for each claimed node in order of decreasing usage parameter associated with the claimed nodes at the current depth.
- the method 900 continues until all nodes have been claimed and visited, and then the method is done at step 908.
- Figure 10 illustrates a tree structure generated from the generalized graph structure 600 shown in Figure 6 by the breadth first method 900 shown in Figure 9 and making reference to the usage parameter vector 800 shown in Figure 8 .
- the user specified node 1 as the root node and nodes 2 and 4 were claimed as the root node's children. After the depth had been incremented to 1, node 2 was visited prior to node 4 because node 2's usage parameter (found in entry 802 of the usage parameter vector) was larger than the usage parameter corresponding to node 4 found at entry 804 of the usage parameter vector 800.
- node 2's usage parameter was 84 while node 4's usage parameter was 51, therefore node 2 was selected for visitation first, since 84 is greater than 51.
- nodes 3 and 5 were claimed as children of node 2.
- node 4 was visited at depth equals one, it claimed node 7 as its child. Then all nodes at depth one had been visited, so the method 900 incremented the depth to two, and node 5 was selected for visitation prior to nodes 3 and 7 because node 5's usage parameter of 86 (found in entry 805 of the usage parameter vector 800) was greater than node 3's usage parameter of 6 and node 7's usage parameter of 44.
- the method 900 claimed nodes 6 and 8 as node 5's children. Then node 7 was visited, but there were no children that could be claimed for node 7. Similarly, node 3 was visited at depth 2, but it could claim no children. So the depth was incremented to 3, and node 6, having usage parameter 96, was visited, and node 9 was claimed as the child of node 6. Node 8 at depth 3 and node 9 at depth 4 could not claim any children when they were visited. After claim 9 was visited, the current depth was incremented to five, but the method 900 determined at step 907 that no nodes existed at this depth, so branch 954 ended the method 900 at step 908.
- FIG 11 illustrates a usage parameter matrix 1100.
- the usage parameter matrix 1100 includes usage parameters pertaining to each of the links in the generalized graph structure 600 shown in Figure 6 .
- the usage parameters found in the usage parameter matrix 1100 specify the amount of measured usage of each of the links shown in the generalized graph structure 600 shown in Figure 6 .
- the amount of usage of link 652, which provides a path from node 5 to node 2 is 28.
- the usage parameter associated with the link from node i to node j is specified by the usage parameter found in row i, column j of the usage parameter matrix 1100.
- the link usage parameters found in the usage parameter matrix 1100 can be referenced instead of the usage parameters found in the usage parameter vector 800 to determine the order of visitation at step 903.
- the usage parameter's associated with links pointing to the claimed children at a node may be referenced as the usage parameter determining the order of visitation of nodes at the same depth. If the link usage parameters shown in usage parameter matrix 1100 are modeling usage of hyperlinks in a nine page web site, then this example is concerned with the hyperlink usage rather than usage of any other individual web pages.
- Figure 12 illustrates a tree structure 1200 generated from the generalized graph structure 600 using the usage parameter matrix 1100 by the method 900 according to the invention.
- the user has selected node 2 as the root node, nodes 1, 3, 5 were claimed as children of the root node 2, and node 3 at depth 1 was visited first because the usage parameter corresponding to links 623 from node 2 to node 3 has a usage parameter of 74, which is greater than the usage parameter of link 621 and the usage parameter of link 625.
- node 3 was visited, it claimed node 6 as its child, and then node 1 was visited at depth 1.
- Node 1 claims node 4 as its child and then node 5 at depth 1 was visited.
- Node 5 claims node 8 as its child, and node 8 at depth 2 was visited first because the usage parameter associated with link 658 was greater than the usage parameter associated with link 636 and greater than the usage parameter associated with link 614. Thus, when node 8 was visited, it claimed node 7 and 9.
- the usage parameter associated with each node could be a weighted linear function of the node usage parameter (such as shown in the usage parameter vector 800) and the link usage parameter (such as shown in the usage parameter matrix 700) to generate a derived usage parameter.
- the products of the link and node usage parameters could be computed and used as the usage parameter, which determines the node visitation order in step 903.
- the products of link usages from the root to a given node could be computed and used as the given node's usage parameters for determination of ordering of visitation at step 903.
- the method 900 illustrated in Figure 9 is only an example of a usage-based breadth first method that can be employed according to the invention.
- the method 900 could be modified so that all sibling nodes of the currently visited node are visited prior to visiting cousin nodes or distantly related nodes that are at the same depth.
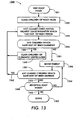
- Figure 13 illustrates a usage-based depth first method of generating a tree structure from a generalized graph structure as an example.
- the root node After a root node has been identified, at step 1301 the root node is visited, and the children of the root node are claimed at 1302.
- the method visits the claimed child having the highest usage parameter which has not yet been visited.
- the method determines whether or not the currently visited node has any children which have not yet been claimed. If unclaimed children exist, branch 1350 claims those children and then step 1303 visits the claimed child having the usage parameter which has not yet been visited. In other words, steps 1303, 1304, and 1305 are performed until the end of a lineage of children has been reached.
- branch 1351 takes the method 1300 to step 1306, where the parent of the currently visited node is revisited.
- the method 1300 determines whether or not the currently visited node has any claimed children which have not yet been visited. If claimed children exist which have not yet been visited, branch 1352 takes a method back to step 1303. However, if there are no claimed children which have not yet been visited, then branch 1353 takes a method 1300 to step 1308. At step 1308, the method 1300 checks to see whether or not the root node is being revisited.
- branch 1354 takes a method 1300 back to step 1306 where the parent of the currently visited node is revisited. If step 1308 determines that the method 1300 is revisiting the root node, branch 1355 takes the method 1300 to completion at step 1309.
- the usage-based depth first method 1300 visits as many nodes in a linked lineage as it can until it reaches a leaf node.
- step 1306 sends the method 1300 back to the leaf node's parent, so that other children of the leaf node's parent can be visited.
- any visited node's entire descendent sub tree will be claimed and visited before any of its siblings are visited.
- Figure 14 illustrates a tree structure 1400 generated from the generalized tree structure 600 using the usage parameter vector 800 shown in Figure 8 by the depth first method 1300
- Node 1 is the root node of the tree structure 1400.
- Nodes 2 and 4 are claimed as children of node 1, and node 2 is visited before node 4 because node 2's usage parameter is higher than node 4's usage parameter.
- nodes 3 and 5 are claimed as its children.
- node 5 is visited because node 5's usage parameter is higher than node 3's usage parameter.
- node 6 and 8 are claimed as its children.
- node 6 is visited because node 6's usage parameter is higher than node 8's usage parameter.
- step 1304 determines that there are no children which can be claimed by node 9, so step 1306 dictates that node 6 is revisited, and step 1307 determines that there are no more claimed children of node 6 which have not yet been visited.
- step 1353 takes the method to step 1308 which determines that node 6 is not the root node.
- step 1354 takes a method back to step 1306 where node 6's parent is revisited.
- node 5 is being revisited.
- Step 1307 determines that there is a claimed child of node 5 which has not yet been visited, namely node 8.
- branch 1352 takes method 1300 back to step 1303 where node 8 is visited.
- node 7 is claimed as its child.
- step 1304 determines that there are no children which node 7 can claim, so step 1306 dictates that node 8 be revisited.
- step 1306 again takes the method back to node 5
- another loop through steps 1307 and 1308 takes the method back to node 2.
- node 3 is visited, node 2 is then revisited, and then the root node 1 is revisited.
- step 1307 determines that there is a claimed child of the root node 1, which has not yet been visited, namely node 4.
- branch 1352 take the method back to step 1303 and node 4 is visited.
- step 1304 determines that there are no children which node 4 can claim, therefore branch 1351 takes a method back to step 1306, so that the root node is again revisited.
- step 1307 determines that all claimed children of the root node have been visited, so branch 1353 takes a method to step 1308, which determines that the method 1300 is revisiting the root node and then branch 1355 takes the method to completion as step 1309.
- the various variations of usage parameters used for determining the order of visitation of children nodes in the depth first method 1300 according to the invention are available as discussed above relative to the usage-based breadth first method 900.
- link usage, node usage, linear or non-linear functions of link and node usage, path usage, as represented by functions of each link from the root to a give node, and a variety of other usage parameters may be employed using the method 1300 illustrated in Figure 13 .
- slight variations of the usage-based depth first method 1300 may be implemented according to the invention.
- Figure 15 illustrates a manner of laying out a display of a tree structure radially about a parent node 1501.
- Nodes 1510, 1520, 1530, 1540, 1560, 1570, 1580, and 1590 are children of parent node 1501.
- the reference numerals have been assigned such that they are monotonically related to the usage parameter of the sibling nodes.
- node 1590 has a higher usage parameter than node 1580.
- the lowest usage node is node 1510.
- the highest used nodes are separated optimally from each other, at the expense of lesser used nodes.
- node 1590 (the highest usage node) is placed 180° away from node 1580 (the second highest used node).
- the lowest used node is placed so as to bisect the angle formed by the two adjacent nodes having the highest total usage.
- Node 1590 ranks 1 and node 1510 ranks 8.
- the lowest used half of the siblings can be laid out such that the lowest used node is placed so as to bisect the angle formed by the two adjacent siblings which have the lowest sum of their rankings.
- node 1590 which ranks one
- node 1570 which ranks three
- that ranking is the lowest ranking (indicating highest usage) of any of the right angles formed by the four highest usage nodes.
- the lowest used node 1510 is placed so as to bisect nodes 1590 and 1570.
- each sibling may be allocated a constant amount of angular space based upon the total number of siblings, and then the highest used half of the siblings may be plotted to achieve optimal separation from each other based upon usage, and then the lowest used half of the siblings may be laid out so as to bisect the angles formed by the highest half of the nodes as described above.
- the highest usage nodes can always be placed 180° from each other and angular space between already laid out adjacent nodes can be divided by two each time a new node is laid out, even if the number of siblings is not an exact power of two.
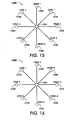
- Figure 16 illustrates another method according to the invention of displaying a group of sibling nodes using their usage parameters to determines their placement about their parent node 1501.
- a certain angle is specified as the angle at which the highest usage node will be placed.
- the 360° of the circle is divided by the total number of sibling nodes.
- the highest usage node is placed as the specified angle designated for, and then the remaining nodes are placed so as to be adjacent to the next highest usage node relative to them.
- the highest usage node is placed at the specified angle, and the second highest usage node is placed adjacent to the highest usage node, the third highest usage node is placed adjacent to the second highest usage node, and so forth, until the lowest usage node is laid out.
- the angular placement of each node is monotonically related to its layout angle relative to its parent.
- Figure 17 illustrates a generalized graph structure 1700 consisting of twenty-three nodes, 1701 through 1723.
- links 1750 through 1762 are eliminated so as to eliminate cycles and thereby create a tree structure.
- Figure 18 illustrates a method of displaying a tree structure using usage rankings according to the invention.
- each sibling is ranked according to its usage parameter.
- the tree structure is laid out based upon the rankings of all the sibling groups within the tree structure.
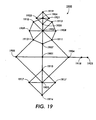
- Figure 19 is a squashed cone tree display of the tree structure derived from the generalized graph structure 1700 shown in Figure 17 .
- the points representing nodes of the generalized graph structure 1700 are labeled with reference numerals which are correspondent to the reference numerals of the nodes shown in Figure 17 .
- node 1723 is displayed as point 1923 in the display 1900.
- the usage parameters associated with the various nodes are inversely related to the reference numeral. For example, amongst a group of sibling nodes 1702 through 1705, node 1702 has the highest usage, and node 1705 has the lowest usage.
- the reference numeral can be viewed as the ranking of the usage parameter relative to its siblings.
- the root node 1901 is placed in the center, and its children nodes 1902, 1903, 1904, and 1905 are laid out according to the optimal separation procedure described above relative to Figure 15 .
- the eight children of node 1902 which are nodes 1906 through 1913, are laid out radially from their center parent 1902 in the manner described above relative to Figure 15 .
- the children of node 1906 namely nodes 1919 through 1922, are laid out so as to achieve optimal separation in the manner described above relative to Figure 15 .
- the children of node 1903 namely 1914 through 1917, are positioned such that the highest ranking and highest usage node 1914 is placed as far away from the center 1901 as possible, and its siblings are placed as described above.
- the child node 1904 is placed as far away as possible from the center 1901 at point 1918.
- the child of point 1918 (node 1923) is placed as far away as possible from node 1904.
- the highest usage node of any group of siblings is preferably place at an angle farthest away from its grandparent node, although there is no requirement according to the invention that this be the case.
- Sibling nodes may be connected to their adjacent siblings via translucent lines to further clarify their sibling relationships. The optional translucent lines are illustrated in Figure 19 , but are not labeled with reference numerals.
- Figure 20 illustrates a disk tree display of the tree structure generated from the generalized graph structure 1700 shown in Figure 17 .
- highest usage nodes are placed at angles closest to the vertical.
- node 2002 is the highest usage node at depth 1
- node 2003 is the next highest usage node at depth 1
- node 2005 is the least used node of depth 1.
- the user can see the nodes at that depth in order of their usage, seeing the most used nodes first. From among siblings 2006 through 2013, node 2006 is the highest usage and node 2013 is the lowest usage.
- each leaf node is assigned a constant amount of angular space in the layout of Figure 20 .
- the layout of Figure 20 measures the layout angle for each child node from the center of the layout of the tree structure. Therefore, the layout angle of each node is measured as the angle formed by a ray extending from the center 2001 to the node and a ray extending from the center 2001 to the vertical (which passes through point 2019 in Figure 19 ).
- squashed cone tree depiction 1900 uses the optimal separation layout technique described with reference to Figure 15
- the disk tree representation 2000 is laid out using the monotonic relationship between ranking and layout angle
- this relationship between sibling placement and type of display algorithm occur.
- a squashed cone tree representation can have sibling placements determined by the method described relative to Figure 16 in which monotonic relationships between layout angles and sibling nodes exist.
- a disk tree representation may employ the optimal separation sibling layout procedure such as described with respect to Figure 15 .
- the visualization methods according to the invention expand the capabilities of web analysis programs in the amount of data they are able to display as well as making the evolutionary patterns of web ecologies more apparent.
Landscapes
- Engineering & Computer Science (AREA)
- Theoretical Computer Science (AREA)
- Databases & Information Systems (AREA)
- Physics & Mathematics (AREA)
- General Engineering & Computer Science (AREA)
- General Physics & Mathematics (AREA)
- Data Mining & Analysis (AREA)
- Multimedia (AREA)
- Business, Economics & Management (AREA)
- General Business, Economics & Management (AREA)
- Human Computer Interaction (AREA)
- Information Retrieval, Db Structures And Fs Structures Therefor (AREA)
- User Interface Of Digital Computer (AREA)
- Image Generation (AREA)
Description
- The invention is related to the field of displaying generalized graph structures. Specifically, the invention is related to generating a tree structure representation for display of a generalized graph structure, and the invention is related to displaying tree structure representations of a generalized graph structure. The invention addresses the problem of laying out large directed graphs, such as World-Wide Web sites, so that the important relationships are exposed.
- The World-Wide Web ("web") is perhaps the most important information access mechanism to be introduced to the general public in the 20th Century. As larger numbers of organizations rely on the Internet to distribute information to potential consumers and investors, they also realize its potential for distributing and organizing large volumes of data for later retrieval by employees and business partners. A company's web site is rapidly becoming one of its most important business investments.
- As an information repository, a web site generally receives a high amounts of usage. Web site usage patterns that are derived by monitoring how the company's employees use its web site enhance the companies understanding of its business activities. For example, monitoring what product literature the sales force is downloading may be a way to forecast sales. In short, traditional market analysis can be applied to this information resource.
- Analysts are interested in not just how the web pages are used, but also the context under which they are placed, such as the linkage structure and the web page content. A web site is a dynamic structure, because its topology as evidenced by its linkage structure, the contents of its pages, and its usage changes continually. Analysts want to be able to analyze the evolving web site.
- Because of analysts' increasing desire to discover and understand users' access patterns, relationships between web page contents, and to efficiently structure web sites' topology, a need exists for a set of visualization tools which aid in the process of web site analysis.
- Displaying large and complex generalized graph structures is a non-trivial task. Conventional approaches of generating a tree structure representation of the generalized graph structure include depth first search and breadth first search which attempt to solve the problem by forming hierarchies based upon the topology of the generalized graph structure.
- Web site administrators and designers have a need to understand the relationship between the web site's usage parameters and its link topology, and vice versa. Since web sites are dynamically changing over time, maintains need to understand how changes to the topology affect usage. Although some conventional web site display methods encode usage information in the visualization, no conventional methods reference usage information in generating the structure to be displayed from the generalized graph structure. Moreover, no conventional system modifies the positioning of nodes based within a displayed structure upon the nodes usage.
- MUKHERJEA S ET AL: "Visualizing the World-Wide Web with the Navigational View Builder "COMPUTER NETWORKS AND ISDN SYSTEMS, NORTH HOLLAND PUBLISHING. AMSTERDAM, NL LNKD-DOI:10.1016/0169-7552(95)00023-Z, vol. 27, no. 6, 1 April 1995 (1995-04-01), pages 1075-1087, XP004013209ISSN: 0169-7552
- It is the object of the present invention to improve traversing and displaying of generalized graph structures. This object is achieved by providing a method for interactively navigating through a generalized graphs structure according to
claim 1. Embodiments of the invention are set forth in the dependent claims. -
-
Figure 1 illustrates a general purpose computer suitable for performing the methods of the invention. -
Figure 2 illustrates a generalized graph structure. -
Figure 3 illustrates a tree structure generated from the generalized graph structure illustrated inFigure 2 . -
Figure 4 is another illustration of the tree structure shown inFigure 3 which shows the depth of each node. -
Figure 5 illustrates a disk tree representation of the tree structure shownFigures 3 and4 . -
Figure 6 illustrates a generalized graph structure having nine nodes and containing many cycles which will be used to illustrate various usage based tree structure generation methods according to the invention. -
Figure 7 illustrates a topology matrix corresponding to the generalized graph structure shown inFigure 6 . -
Figure 8 illustrates a usage parameter vector pertaining to the nodes of the generalized graph structure shown inFigure 6 . -
Figure 9 illustrates a breadth first method for generating a tree structure from a generalized graph structure according to the invention. -
Figure 10 illustrates a tree structure generated from the generalized graph structure shown inFigure 6 by the breadth first method shown inFigure 9 using the node usage parameter vector shown inFigure 8 . -
Figure 11 a usage- parameter matrix pertaining to the links of the generalized graph structure shown inFigure 6 . -
Figure 12 illustrates a tree structure generated from the generalized graph structure shown inFigure 6 by the breadth first method shown inFigure 9 using the link usage parameter matrix shown inFigure 11 . -
Figure 13 illustrates a depth first method for generating a tree structure from a generalized graph structure according to the invention. -
Figure 14 illustrates a tree structure generated from the generalized graph structure shown inFigure 6 by the depth first method shown inFigure 13 using the node usage parameter vector shown inFigure 8 . -
Figure 15 illustrates node placement according to the invention for display of sibling nodes relative to their parent at layout angles such that highest ranking sibling nodes ranked by their usage parameters are optimally separated. -
Figure 16 illustrates node placement according to the invention for display of sibling nodes relative to their parent at layout angles that increase monotonically with the ranking of the sibling nodes ranked by their usage parameters. -
Figure 17 illustrates another generalized graph structure. -
Figure 18 illustrates a method of displaying a tree structure based upon usage according to the invention. -
Figure 19 illustrates a squashed cone tree representation of the generalized graph structure shown inFigure 17 displayed by a method according to the invention. -
Figure 20 illustrates a disk tree representation of the generalized graph structure shown inFigure 17 displayed by a method according to the invention. - The Figures are more fully explained in the following Detailed Description of the Invention. In the Figures, like reference numerals denote the same elements; however, like parts are sometimes labeled with different reference numerals in different Figures in order to clearly describe the invention.
- The World-Wide Web is a complex large directed graph. Visualizing a general directed graph is well-known and difficult problem. In fact, none of the current graph layout algorithms can deal with a 7,000-node graph in a reasonable manner. However, as a sub-domain of directed graph, web site linkage structures tend to be rather hierarchical. That is, while a web site is not a tree, a tree representation often approximates a web site well.
- In analyzing the linkage structure of the web, an analyst may often be concerned in finding the shortest number of hops from one document to another. Breadth-first traversal transforms the web graph into a tree by placing a node as closely to the root node as possible. After obtaining this tree, the structure is then visualized using the disk tree visualization technique. A disk tree uses a circular layout to visualize the hierarchy. Each successive circle denotes levels in the tree. The layout algorithm runs in two passes: In the first pass, the algorithm traverses the entire hierarchy using post-order traversal. At each node, the algorithm calculates the number of leaf nodes in that sub-tree. So the total number of leaves in the tree is known. The algorithm then calculates the amount of angular space to be allocated for each leaf node (360 degrees divided by the total number of leaves). In the second pass, the algorithm traverses the hierarchy using breadth-first traversal. At each node, it allocates the amount of angular space for that node by looking to see how many leaf nodes are rooted at that sub-tree. In this manner, each leaf node is guaranteed a fixed amount of angular space.
- A viewer can gain increased understanding of visualizations if the choices made in mapping data into visual presentations is performed intelligently and strategically. The disk tree has several advantages. First, the structure of the tree is visualized compactly, with the pattern easily recognizable. Second, when viewed straight on or at slight angles, there are no occlusion problems since the entire layout lies on a two dimensional plane. Third, unlike cone trees, since it is a two dimensional technique, the third dimension can be utilized for other information, such as time, or a three dimensional glyph at each node. Lastly, the circularity is aesthetically pleasing to the eye.
- The visualization itself actually validates the choice of a preferred breadth first transformation algorithm. The high traffic areas are usually concentrated near the root node. This means that the algorithm places easy to reach nodes starting from the root node. As the document gets farther and farther away from the root node, the document has a lesser possibility of being accessed.
-
Figure 1 illustrates a generalpurpose computer architecture 100 suitable for implementing the methods according to the invention. Thegeneral purpose computer 100 includes at least amicroprocessor 102, adisplay monitor 104, and acursor control device 105. Thecursor control device 105 can be implemented as a mouse, a joy stick, a series of buttons, or any other input device which allows a user to control position of a cursor or pointer on thedisplay monitor 104. The general purpose computer may also includerandom access memory 107,external storage 103,ROM memory 108, akeyboard 106, amodem 110 and agraphics co-processor 109. All of the elements of thegeneral purpose computer 100 may be tied together by acommon bus 101 for transporting data between the various elements. Thebus 101 typically includes data, address, and control signals. Although thegeneral purpose computer 100 illustrated inFigure 1 includes asingle data bus 101 which ties together all of the elements of thegeneral purpose computer 100, there is no requirement that there be asingle communication bus 101 which connects the various elements of thegeneral purpose computer 100. For example, themicroprocessor 102,RAM 107,ROM 108, and graphics co-processor 109 might be tied together with a data bus while thehard disk 103,modem 110,keyboard 106,display monitor 104, andcursor control device 105 are connected together with a second data bus (not shown). In this case, thefirst data bus 101 and the second data bus (not shown) could be linked by a bidirectional bus interface (not shown). Alternatively, some of the elements, such as themicroprocessor 102 and graphics co-processor 109 could be connected to both thefirst data bus 101 and the second data bus (not shown) and communication between the first and second data bus would occur through themicroprocessor 102 andgraphics co-processor 109. The methods of the invention are thus executable on any general purpose computing architecture such as the 100 illustrated inFigure 1 , but there is clearly no limitation that this architecture is the only one which can execute the methods of the invention. -
Figure 2 illustrates ageneralized graph structure 200 consisting of fifteennodes 201 through 215. Thevarious nodes 201 through 215 of thegeneralized graph structure 200 are connected to each other by links, such as those labeled 216 through 225. The links connecting the various nodes may either bidirectional or unidirectional. Throughout this patent document and in all of its Figures, a bidirectional link will be represented as a link having no arrows at either end, and a unidirectional link will be denoted by a link having an arrow at one end or the other, which will indicate that a link exists only in the direction that the arrow is pointing. For example, link 217 inFigure 2 represents the ability to move fromnode 202 tonode 203, as well as the ability to move fromnode 203 tonode 202. Clearly, several alternative routes exist for moving from a node to another node. Because of the large number of links in a large generalized graph structure, often it is impractical to display all of the links. Therefore, when presenting a user with a visual representation of a generalized graph structure, only a subset of all links that exist in the generalized graph structure are displayed. The subset of links which is chosen for display must show a path from every node in the generalized graph structure to every other node in the generalized graph structure. A tree structure is often used to accomplish this goal. -
Figure 3 illustrates atree structure representation 300 of thegeneralized graph structure 200 illustrated inFigure 2 .Links 216 through 225 are not shown in thetree structure 300 corresponding to thegeneralized graph structure 200.Links 216 through 225 were omitted because they create cycles in thegeneralized graph structure 200. A tree structure has no cycles; in other words, there is only one path from any node to any other node. In thetree structure representation 300, there is only one path from any node to any other node because all cycles have been broken. -
Figure 4 shows anothertree structure representation 400 of thetree structure representation 300 illustrated inFigure 3 . In thetree structure 400,node 201 is identified as the root node. Theroot node 201 has a depth of zero. The children of theroot node 201 arenodes Node 202 has one child (node 205) andnode 204 has three children (nodes Nodes 205 through 208 are at depth two. The depth of any node is determined by the number of links which must be traversed in order to travel back to the root node.Nodes -
Figure 5 illustrates adisk tree representation 500 of thetree structure 400 shown inFigure 4 . Thecenter point 501 of thedisk tree representation 500 corresponds to theroot node 201 of thetree structure 400. Each of thepoints 501 through 515 represents one of thenodes 201 through 215. Specifically, by adding 300 to the reference numeral associated with each node of thetree structure 400, the reference numeral corresponding to the point in thedisk tree 500 for each node of thetree structure 400 is computed. In other words,node 201 inFigure 4 is illustrated asnode 501 in thedisk tree 500,node 202 is represented bypoint 502,node 203 is represented bypoint 503, andnode 215 is represented bypoint 515.Circle 550 contains all points which represent nodes that are at a depth of one from the root node represented bypoint 501.Circle 560 contains all points representing nodes at depth two.Circle 570 contains all points representing nodes at depth three, andcircle 580 contains all points representing nodes at depth four. (The points inFigure 5 display and represent the nodes ofFigure 4 ; thus the term node is sometimes used hereinafter used to refer to the point on a display representing a node.) The angular placement of each point representing a node in thedisk tree 500 is determined as follows. The total number of leaf nodes is determined, and the 360° of the circle is divided by that total number of leaf nodes. In the case ofdisk tree 500, there are eight leaf nodes represented bypoints disk tree 500. The angular placement of a parent node is the angle which bisects the angle formed by its outer most leaf nodes and the root node. For example,point 504 representingnode 204 has outermost leaves points disk tree 500. The angle formed by an outermost leaf 514, the outermost leaf point 513, and theroot node 501 is 180°. Therefore, the angle ofparent node 504 is the angle bisecting that 180° angle. Similarly,parent point 511 has children points 515 and 514. The children points 515 and 514 together with theroot node 501 form a 45° angle, thereforeparent point 511 is placed at an angle which bisects that 45° angle. - According to the invention, the layout of graph structures is performed based upon usage information. Whereas conventional layout methods are based primarily upon either topology or content, the methods according to the invention encode additional information by prioritizing (or ranking) usage. These methods provide degree of interest functions for graph visualizations, thereby minimizing cognitive load. While the scope of the invention extends far beyond applications to the web, the web is used to exemplify the methods according to the invention.
- The invention addresses the problem of laying out large directed graphs, such as found in the World-Wide Web, so that the relevant relationships are exposed. According to the invention, a usage based traversal turns a general graph into a tree. The order of traversal or order of layout or both are chosen based upon usage data such as simple frequencies or cocitation frequencies. Using the methods of the invention, an intranet view for a company can be dynamically organized.
- According to the invention, additional information is encoded into graph visualizations by laying out graphs based on usage-based information. For example, in information retrieval, hypertext documents are accessed in various frequencies (some are more popular than others). According to the invention, the popularity of an item helps determine the priority the item will receive in the layout of the graph. By coupling the usage data and encoding it into the structural layout of the graph, changes in usage and topology can be viewed at the same time.
- While the scope of the invention is not limited to documents on the World-Wide Web, the web as viewed by an administrator of a web site is used as an example to ground the concepts of the invention. The invention allows web administrators in charge of maintenance to understand the relationship between a web site's usage patterns and its topology.
- A traditional technique for understanding a complex link structure is to present a visualization or representation of the links and nodes. One view of the Web is that of a graph, with documents representing nodes and hyperlinks representing the links between documents. Because of the complexity and sheer number of links, some information is usually filtered or culled to enable effective cognitive visual processing. To ensure that the layout algorithm presents the more important information, these-algorithms often employ degree-of-interest functions.
- No conventional systems modify the layout of items based upon their usage characteristics. Web site maintenance personnel and content designers have a need to understand the relationship between the site's usage patterns and its link topology, and vice versa. Since Web sites are dynamic and change over time, maintenance personnel often need to understand how changes to the topology affect usage. By using information from usage patterns, layout algorithms can present a site's topology, reveal how users' paths and usage changes over time (for example., as more users access the structure, as their needs change, and as the underlying topology evolves).
- The methods according to the invention employ usage information to make layout decisions for a variety of layout algorithms. Some of these algorithms attempt to maximize screen real estate while others function by trying to reveal subtle relationships amongst the elements. Frequency, recency, spacing of accesses, and path information are all forms of usage information which can be referenced according to the methods of the invention. Additionally, derived usage information like need odds and cocitation clustering can also be used, though the invention is not limited to only these forms.
- One method to layout a topology according to the invention involves starting with a node, called the root node, and spreading out the links radially about the node. The ancillary nodes then repeat until the screen real estate is consumed. To optimally layout the nodes, the layout algorithm may wish to place the highest-used nodes farthest apart from each other so that they have the most growth space. The lowest-used nodes are then placed in the remaining space between the high-usage nodes. The layout continues to place nodes the farthest apart from each other based upon usage values, around the hub. The highest used nodes are optimally separated from each other allowing plenty of screen real estate for their related children nodes to be placed. This is done at the expense of the less used nodes.
- Another layout method according to the invention orders the nodes by usage and then lays them out from high to low (or low to high) to reveal popularity (or deadwood).
- As an example of usage-based layout, a modified breadth first traversal of a graph according the invention encodes usage in its structure. In a traditional breadth-first traversal based layout, the immediate children of the root node are laid out, then their children. Conventionally, the order in which the children are visited is not specified in the traversal. However, according to the invention, additional information is encoded into the graph layout simply by choosing a visitation order based on some parameter. For example, the visitation order is determined by sorting nodes based on the amounts of usage (favor popular web pages over less popular ones).
- Another layout algorithm that can be modified to reference usage parameters according to the invention is depth-first traversal, in which nodes in a common ancestry are presented. In this alternative, a vertical slice is presented at the cost of missing nearby neighbors. At each step, the algorithm must determine which children to choose to explore. Similar to the best breadth-first traversal according to the invention, the child that has the highest usage is visited first.
- Many other layout combinations are possible according to the invention. For example, instead of walking the graph in a breadth-first or depth-first topological order from a given node, all nodes with a given usage level are displayed as root nodes. With respect to the web, this technique can be used to visualize the set of entry points (the pages people use to enter a site) and the subsequent paths of users from those pages. Then the space between them is allocated based on usage and linkage between the root nodes.
- Usage patterns not only reveal how a document structure is being accessed over an aggregated time-period, but also when collected over time, reveal a flow through the topology. This adds another dimension to the representation. The maintenance personnel can see how usage is changing over time (perhaps due to user changes or external events) and how structural changes affect usage patterns. Comparing these time slices allow the maintenance personnel to discover not only how many people and where they are currently traversing the structure, but also to correlate changes.
-
Figure 6 illustrates a generalized graph structure having nine nodes, 1 through 9, and containing many cycles which will be used to illustrate various usage based tree structure generation methods according to the invention. For the sake of clarity, bidirectional links between nodes are represented as a pair of unidirectional links. For example,node 1 has alink 612 tonode 2, andnode 2 has alink 621 tonode 1. -
Figure 7 illustrates atopology matrix 700 corresponding to thegeneralized graph structure 600.Rows 1 through 9 of thetopology matrix 700 correspond tonodes 1 through 9, andcolumns 1 through 9 of thetopology matrix 700 correspond tonodes 1 to 9. A topology matrix entry at row i and column i represents the existence or absence of a link from node i to node j. For example,node 6 has alink 663 tonode 3, andnode 7 has alink 678 tonode 8. Thus, the existence of a link from node i to node j is represented as a 1 at row i, column j of thetopology matrix 700. The absence of a link from node i to node j in thegeneralized graph structure 600 is represented as a 0 in the row i, columnj topology matrix 700. A topology matrix is generally square, because it specifies linkages from each node to every other node in a generalized graph structure. Diagonal entries of the topology matrix are always zero. Because the links in thegeneralized graph structure 600 are bidirectional, thetopology matrix 700 is symmetric about its diagonal, although there is no requirement that this be the case. -
Figure 8 illustrates ausage parameter vector 800 corresponding to thegeneralized graph structure 600 shown inFigure 6 . The usage parameter fornode 1 is 75 atentry 801 of theusage parameter vector 800. Similarly, the usage parameter associated withnode 8 is 29 and is found inentry 808 of theusage parameter vector 800. Thus, theusage parameter vector 800 is simply a list of usage parameters associated with each node of a generalized graph structure. Generally, an N node generalized graph structure will have an N entry usage parameter vector associated with it. The usage parameters in theusage parameter vector 800 thus correspond to measured usages of the corresponding nodes. For example, if each ofnodes 1 through 9 in thegeneralized graph structure 600 represent web pages in a nine page web site, then the usage parameter associated with each node could be used to represent the average number of accesses per day of each particular web page in the web site. Alternatively, the user parameter associated with each node could represent the sums of the amounts of time that the various users who accessed the page kept the page open. This alternative usage parameter would encode the total dwell time measured by all users who access the page in a given fixed time period. The quantity which is encoded by the usage parameter associated with each node can be computed in a variety of separate ways, each of which measures a different type of usage. The methods according to the invention are applicable to any usage parameter that can be conceived and computed for each node. Therefore, the invention is not limited to any single type of usage parameter, such as frequency or dwell time. Usage parameters are most likely normalized to some predefined scale. For example, the usage parameters illustrated inFigure 8 are normalized to a scale from 0 to 100. Usage parameters could alternatively be normalized, for example, from 0 to 1, or from -1024 to +1024. -
Figure 9 illustrates a usage-based breadth first method 900 for generating a tree structure from a generalized graph structure according to the invention. The method 900 begins atstep 901 with the claiming of a root node. In order to generate a tree structure by a breadth first algorithm, the root node must be specified so that the depth of any node can be calculated relative to the root node. The claiming of the root node instep 901 can occur by a variety of mechanisms. For example, a user may place his cursor on a specific node of a generalized graph structure displayed on a computer monitor using his cursor control device and then select the node by pressing a button on themouse 105. Alternatively, the root node may be claimed by implication from its node name. For example, in a web site, the web home page may have a URL (universal resource locator) which has a semantic structure which indicates that it must be the root node. For example, Xerox Corporation's home web page located at URL www.xerox.com may be parsed by a program implementing the methods according to the invention, and this program may recognize that this web page is the root node of the web site to which the program is being applied by virtue of the name of the node. In any case, once a root node is specified atstep 901, the current depth is set to zero atstep 902. Step 902 merely specifies that the depth of the root node is, by definition, zero. This definition was illustrated in thetree structure 400 inFigure 4 relative to theroot node 201 at depth zero. Atstep 903, the method visits the claimed node having the highest usage parameter associated with it, which is at the current depth and which has not yet already been visited. When thisstep 903 is encountered for the first time during an execution of the method 900, the only node which will have been claimed is the root node, and the root node will also be the only node which exists at the current depth, and it will have not yet been visited. Therefore, the first time that step 903 is encountered in the method 900, the root node is visited. - At
step 904, the method claims all children of the currently visited node, which have not already been claimed. The nodes which are claimed instep 904 can be easily identified by referring to the topology matrix and usage parameter vector. The children which should be claimed atstep 904 are those nodes which have nonzero entries in the visited node's row of the topology matrix which have not already been claimed. - At
step 905, the method 900 determines whether or not there are any additional claimed nodes at the current depth which have not yet been visited. The first time that step 905 is encountered in the method 900, the answer to the test presented in 905 will be no, because the only node at the current depth of zero is the root node itself. Therefore,branch 952 takes the method to step 906 where the current depth is incremented. The first time that step 906 is encountered in the method 900, the current depth will be set to one. - At
step 907, the method 900 determines if there are any nodes at the current depth (which was just increased). In other words, test 907 determines whether or not all nodes in the generalized graph structure have been both claimed and visited. If there are no nodes at the current depth, then all nodes have been claimed and visited andbranch 954 takes the method to completion atstep 908. However, assuming that there are nodes at the newly incremented current depth,branch 953 takes a method back to step 903. Atstep 903, the claimed node having the highest usage parameter at the current depth is visited. In other words, for all nodes which have been claimed that are at the current depth, the usage parameter is referenced from the usage parameter vector, and the claimed node having the highest usage parameter is selected first for visitation. -
Steps step 908. -
Figure 10 illustrates a tree structure generated from thegeneralized graph structure 600 shown inFigure 6 by the breadth first method 900 shown inFigure 9 and making reference to theusage parameter vector 800 shown inFigure 8 . In thetree structure 1000 shown inFigure 10 , the user specifiednode 1 as the root node andnodes node 2 was visited prior tonode 4 becausenode 2's usage parameter (found inentry 802 of the usage parameter vector) was larger than the usage parameter corresponding tonode 4 found atentry 804 of theusage parameter vector 800. Specifically,node 2's usage parameter was 84 whilenode 4's usage parameter was 51, thereforenode 2 was selected for visitation first, since 84 is greater than 51. Whennode 2 is visited,nodes node 2. Whennode 4 was visited at depth equals one, it claimednode 7 as its child. Then all nodes at depth one had been visited, so the method 900 incremented the depth to two, andnode 5 was selected for visitation prior tonodes node 5's usage parameter of 86 (found inentry 805 of the usage parameter vector 800) was greater thannode 3's usage parameter of 6 andnode 7's usage parameter of 44. Whennode 5 was visited, the method 900 claimednodes node 5's children. Thennode 7 was visited, but there were no children that could be claimed fornode 7. Similarly,node 3 was visited atdepth 2, but it could claim no children. So the depth was incremented to 3, andnode 6, havingusage parameter 96, was visited, andnode 9 was claimed as the child ofnode 6.Node 8 atdepth 3 andnode 9 atdepth 4 could not claim any children when they were visited. Afterclaim 9 was visited, the current depth was incremented to five, but the method 900 determined atstep 907 that no nodes existed at this depth, sobranch 954 ended the method 900 atstep 908. -
Figure 11 illustrates ausage parameter matrix 1100. Theusage parameter matrix 1100 includes usage parameters pertaining to each of the links in thegeneralized graph structure 600 shown inFigure 6 . The usage parameters found in theusage parameter matrix 1100 specify the amount of measured usage of each of the links shown in thegeneralized graph structure 600 shown inFigure 6 . For example, the amount of usage oflink 652, which provides a path fromnode 5 tonode 2, is 28. In general, the usage parameter associated with the link from node i to node j is specified by the usage parameter found in row i, column j of theusage parameter matrix 1100. As another example of how the method 900 can be applied to a different measure of usage, the link usage parameters found in theusage parameter matrix 1100 can be referenced instead of the usage parameters found in theusage parameter vector 800 to determine the order of visitation atstep 903. In other words, the usage parameter's associated with links pointing to the claimed children at a node may be referenced as the usage parameter determining the order of visitation of nodes at the same depth. If the link usage parameters shown inusage parameter matrix 1100 are modeling usage of hyperlinks in a nine page web site, then this example is concerned with the hyperlink usage rather than usage of any other individual web pages. -
Figure 12 illustrates atree structure 1200 generated from thegeneralized graph structure 600 using theusage parameter matrix 1100 by the method 900 according to the invention. In thetree structure 1200 shown inFigure 12 , the user has selectednode 2 as the root node,nodes root node 2, andnode 3 atdepth 1 was visited first because the usage parameter corresponding tolinks 623 fromnode 2 tonode 3 has a usage parameter of 74, which is greater than the usage parameter oflink 621 and the usage parameter oflink 625. Whennode 3 was visited, it claimednode 6 as its child, and thennode 1 was visited atdepth 1.Node 1claims node 4 as its child and thennode 5 atdepth 1 was visited.Node 5claims node 8 as its child, andnode 8 atdepth 2 was visited first because the usage parameter associated withlink 658 was greater than the usage parameter associated withlink 636 and greater than the usage parameter associated withlink 614. Thus, whennode 8 was visited, it claimednode - In methods according to the invention, for example, the usage parameter associated with each node could be a weighted linear function of the node usage parameter (such as shown in the usage parameter vector 800) and the link usage parameter (such as shown in the usage parameter matrix 700) to generate a derived usage parameter. Furthermore, the products of the link and node usage parameters could be computed and used as the usage parameter, which determines the node visitation order in
step 903. As another example, the products of link usages from the root to a given node could be computed and used as the given node's usage parameters for determination of ordering of visitation atstep 903. Moreover, the method 900 illustrated inFigure 9 is only an example of a usage-based breadth first method that can be employed according to the invention. Alternatively, the method 900 could be modified so that all sibling nodes of the currently visited node are visited prior to visiting cousin nodes or distantly related nodes that are at the same depth. -
Figure 13 illustrates a usage-based depth first method of generating a tree structure from a generalized graph structure as an example. After a root node has been identified, atstep 1301 the root node is visited, and the children of the root node are claimed at 1302. Atstep 1303, the method visits the claimed child having the highest usage parameter which has not yet been visited. Atstep 1304, the method determines whether or not the currently visited node has any children which have not yet been claimed. If unclaimed children exist,branch 1350 claims those children and then step 1303 visits the claimed child having the usage parameter which has not yet been visited. In other words,steps branch 1351 takes themethod 1300 to step 1306, where the parent of the currently visited node is revisited. Atstep 1307, themethod 1300 determines whether or not the currently visited node has any claimed children which have not yet been visited. If claimed children exist which have not yet been visited,branch 1352 takes a method back tostep 1303. However, if there are no claimed children which have not yet been visited, thenbranch 1353 takes amethod 1300 to step 1308. Atstep 1308, themethod 1300 checks to see whether or not the root node is being revisited. If themethod 1300 is not revisiting the root node, thenbranch 1354 takes amethod 1300 back to step 1306 where the parent of the currently visited node is revisited. Ifstep 1308 determines that themethod 1300 is revisiting the root node,branch 1355 takes themethod 1300 to completion atstep 1309. - Essentially, the usage-based depth
first method 1300 visits as many nodes in a linked lineage as it can until it reaches a leaf node. When themethod 1300 reaches a leaf node,step 1306 sends themethod 1300 back to the leaf node's parent, so that other children of the leaf node's parent can be visited. Essentially, any visited node's entire descendent sub tree will be claimed and visited before any of its siblings are visited. -
Figure 14 illustrates atree structure 1400 generated from thegeneralized tree structure 600 using theusage parameter vector 800 shown inFigure 8 by the depthfirst method 1300Node 1 is the root node of thetree structure 1400.Nodes node 1, andnode 2 is visited beforenode 4 becausenode 2's usage parameter is higher thannode 4's usage parameter. Whennode 2 is visited,nodes node 5 is visited becausenode 5's usage parameter is higher thannode 3's usage parameter. Whennode 5 is visited,node node 6 is visited becausenode 6's usage parameter is higher thannode 8's usage parameter. Whennode 6 is visited,node 9 is claimed as its child, and thennode 9 is visited. Whennode 9 is visited,step 1304 determines that there are no children which can be claimed bynode 9, so step 1306 dictates thatnode 6 is revisited, andstep 1307 determines that there are no more claimed children ofnode 6 which have not yet been visited. So thenbranch 1353 takes the method to step 1308 which determines thatnode 6 is not the root node. So thenbranch 1354 takes a method back to step 1306 wherenode 6's parent is revisited. At this point in themethod 1300,node 5 is being revisited.Step 1307 determines that there is a claimed child ofnode 5 which has not yet been visited, namelynode 8. Thus,branch 1352 takesmethod 1300 back to step 1303 wherenode 8 is visited. Whennode 8 is visited,node 7 is claimed as its child. Whennode 7 is visited,step 1304 determines that there are no children whichnode 7 can claim, so step 1306 dictates thatnode 8 be revisited. Then after going throughsteps step 1306 again takes the method back tonode 5, and another loop throughsteps node 2. Thennode 3 is visited,node 2 is then revisited, and then theroot node 1 is revisited. Afterstep 1306 has dictated that theroot node 1 be revisited,step 1307 determines that there is a claimed child of theroot node 1, which has not yet been visited, namelynode 4. Thus,branch 1352 take the method back tostep 1303 andnode 4 is visited. However,step 1304 determines that there are no children whichnode 4 can claim, thereforebranch 1351 takes a method back tostep 1306, so that the root node is again revisited. This time,step 1307 determines that all claimed children of the root node have been visited, sobranch 1353 takes a method to step 1308, which determines that themethod 1300 is revisiting the root node and thenbranch 1355 takes the method to completion asstep 1309. - The various variations of usage parameters used for determining the order of visitation of children nodes in the depth
first method 1300 according to the invention are available as discussed above relative to the usage-based breadth first method 900. Specifically, link usage, node usage, linear or non-linear functions of link and node usage, path usage, as represented by functions of each link from the root to a give node, and a variety of other usage parameters may be employed using themethod 1300 illustrated inFigure 13 . Moreover, slight variations of the usage-based depthfirst method 1300 may be implemented according to the invention. -
Figure 15 illustrates a manner of laying out a display of a tree structure radially about aparent node 1501.Nodes parent node 1501. For convenience, the reference numerals have been assigned such that they are monotonically related to the usage parameter of the sibling nodes. For example,node 1590 has a higher usage parameter thannode 1580. The lowest usage node isnode 1510. InFigure 15 , the highest used nodes are separated optimally from each other, at the expense of lesser used nodes. Thus, node 1590 (the highest usage node) is placed 180° away from node 1580 (the second highest used node). After the four highest usednodes - At this point, it is useful to consider the rankings of sibling nodes when sorted by their usage parameters.
Node 1590 ranks 1 andnode 1510 ranks 8. Once the highest used half of the siblings have been laid out, the lowest used half of the siblings can be laid out such that the lowest used node is placed so as to bisect the angle formed by the two adjacent siblings which have the lowest sum of their rankings. For example, node 1590 (which ranks one) and node 1570 (which ranks three) have a sum of rankings which equals four, and that ranking is the lowest ranking (indicating highest usage) of any of the right angles formed by the four highest usage nodes. Thus, the lowest usednode 1510 is placed so as to bisectnodes node 1520 is placed opposite the lowest used node, and the remaining members of the lowest used half of the nodes are laid out similarly so as to bisect angles formed by nodes which are among the highest usage half of the sibling nodes. There are a variety of ways according to the invention that this usage-based display can be accomplished. For example, each sibling may be allocated a constant amount of angular space based upon the total number of siblings, and then the highest used half of the siblings may be plotted to achieve optimal separation from each other based upon usage, and then the lowest used half of the siblings may be laid out so as to bisect the angles formed by the highest half of the nodes as described above. In the alternative, the highest usage nodes can always be placed 180° from each other and angular space between already laid out adjacent nodes can be divided by two each time a new node is laid out, even if the number of siblings is not an exact power of two. -
Figure 16 illustrates another method according to the invention of displaying a group of sibling nodes using their usage parameters to determines their placement about theirparent node 1501. In this method, a certain angle is specified as the angle at which the highest usage node will be placed. The 360° of the circle is divided by the total number of sibling nodes. The highest usage node is placed as the specified angle designated for, and then the remaining nodes are placed so as to be adjacent to the next highest usage node relative to them. Thus, the highest usage node is placed at the specified angle, and the second highest usage node is placed adjacent to the highest usage node, the third highest usage node is placed adjacent to the second highest usage node, and so forth, until the lowest usage node is laid out. Thus, the angular placement of each node is monotonically related to its layout angle relative to its parent. -
Figure 17 illustrates ageneralized graph structure 1700 consisting of twenty-three nodes, 1701 through 1723. By pickingnode 1701 as the root and performing a breadth first traversal of thegeneralized tree structure 1700, links 1750 through 1762 are eliminated so as to eliminate cycles and thereby create a tree structure. -
Figure 18 illustrates a method of displaying a tree structure using usage rankings according to the invention. Atstep 1801, for each group of siblings in the tree structure, each sibling is ranked according to its usage parameter. Atstep 1802, the tree structure is laid out based upon the rankings of all the sibling groups within the tree structure. -
Figure 19 is a squashed cone tree display of the tree structure derived from thegeneralized graph structure 1700 shown inFigure 17 . The points representing nodes of thegeneralized graph structure 1700 are labeled with reference numerals which are correspondent to the reference numerals of the nodes shown inFigure 17 . For example,node 1723 is displayed aspoint 1923 in thedisplay 1900. Thus, by adding 200 to the reference numeral shown inFigure 17 , the point representing that referenced node is obtained. InFigure 17 , the usage parameters associated with the various nodes are inversely related to the reference numeral. For example, amongst a group ofsibling nodes 1702 through 1705,node 1702 has the highest usage, andnode 1705 has the lowest usage. Therefore, the reference numeral can be viewed as the ranking of the usage parameter relative to its siblings. InFigure 19 , theroot node 1901 is placed in the center, and itschildren nodes Figure 15 . Similarly, the eight children of node 1902, which arenodes 1906 through 1913, are laid out radially from their center parent 1902 in the manner described above relative toFigure 15 . Similarly, the children ofnode 1906, namely nodes 1919 through 1922, are laid out so as to achieve optimal separation in the manner described above relative toFigure 15 . The children ofnode 1903, namely 1914 through 1917, are positioned such that the highest ranking andhighest usage node 1914 is placed as far away from thecenter 1901 as possible, and its siblings are placed as described above. Thechild node 1904 is placed as far away as possible from thecenter 1901 atpoint 1918. The child of point 1918 (node 1923) is placed as far away as possible fromnode 1904. In general, the highest usage node of any group of siblings is preferably place at an angle farthest away from its grandparent node, although there is no requirement according to the invention that this be the case. Sibling nodes may be connected to their adjacent siblings via translucent lines to further clarify their sibling relationships. The optional translucent lines are illustrated inFigure 19 , but are not labeled with reference numerals. - In
Figure 19 , all siblings are placed a constant radius from their common parent. In the example illustrated inFigure 19 , this radius decreases by a factor of two for each increase of depth that a node incurs in the tree structure. However, there is no requirement that the radii of siblings from their parent be related to depth in this manner. In thedisplay 1900 shown inFigure 19 , the layout angle for each child node is measured from its parent. -
Figure 20 illustrates a disk tree display of the tree structure generated from thegeneralized graph structure 1700 shown inFigure 17 . InFigure 20 , highest usage nodes are placed at angles closest to the vertical. For example,node 2002 is the highest usage node atdepth 1,node 2003 is the next highest usage node atdepth 1, andnode 2005 is the least used node ofdepth 1. Thus, starting at vertical and continuing around each depth circle in a clockwise direction, the user can see the nodes at that depth in order of their usage, seeing the most used nodes first. From among siblings 2006 through 2013, node 2006 is the highest usage andnode 2013 is the lowest usage. As described above with reference toFigure 5 , each leaf node is assigned a constant amount of angular space in the layout ofFigure 20 . The layout ofFigure 20 measures the layout angle for each child node from the center of the layout of the tree structure. Therefore, the layout angle of each node is measured as the angle formed by a ray extending from thecenter 2001 to the node and a ray extending from thecenter 2001 to the vertical (which passes through point 2019 inFigure 19 ). - Although the squashed
cone tree depiction 1900 uses the optimal separation layout technique described with reference toFigure 15 , and although thedisk tree representation 2000 is laid out using the monotonic relationship between ranking and layout angle, there is no requirement according to the invention that this relationship between sibling placement and type of display algorithm occur. For example, although it is not illustrated, a squashed cone tree representation can have sibling placements determined by the method described relative toFigure 16 in which monotonic relationships between layout angles and sibling nodes exist. Similarly, a disk tree representation may employ the optimal separation sibling layout procedure such as described with respect toFigure 15 . - Given the infancy of the web, it is not surprising that the interactions and relationships within web ecologies are not very well understood. As the World-Wide Web continues to grow both in the number of users and the number of documents made accessible, the problem of understanding the correlations between the producers of the information, the characteristics of the information, and the users of the information will most likely remain.
- The visualization methods according to the invention expand the capabilities of web analysis programs in the amount of data they are able to display as well as making the evolutionary patterns of web ecologies more apparent.
- While the various aspects of the invention have been described with reference to several aspects and their embodiments, those embodiments are offered by way of example, not be way of limitation. The foregoing detailed description of the invention has been presented for purposes of illustration and description. It is not intended to be exhaustive or to limit the invention to the precise form disclosed, and obviously many modifications and variations are possible in light of the above teaching. The described embodiments were chosen in order to best explain the principles of the invention and its practical applications to thereby enable others skilled in the art to best utilize the invention in various embodiments and with various modifications as are suited to the particular use contemplated. Those skilled in the art will be enabled by this disclosure will be enabled by this disclosure to make various obvious additions or modifications to the embodiments described herein; those additions and modifications are deemed to lie within the scope of the invention. It is intended that the scope of the invention be defined by the claims appended hereto.
Claims (11)
- A method for interactively navigating through a generalized graph structure (200, 600, 1700) representing a web site linkage structure using a display (104) of a computer (100) having a cursor control device (105) to generate a tree structure (300, 400, 1000, 1200, 1400), the method comprising the steps of:(a) providing a generalized graph structure (200, 600, 1700) comprising a plurality of technically identifiable nodes and a plurality of technically identifiable links between the nodes, whereby each node is connectable to a further one of the nodes by a technically identifiable link;(b) associating to each technically identifiable node a usage parameter comprising need probality, cocitation clustering or functions of both, node and link usage;(c) visiting a claimed technically identifiable node within the generalized graph structure (200, 600, 1700) which has not yet been visited having the highest usage parameter at a current depth from a root node (201); and(d) claiming all children of the claimed technically identifiable node which have not yet been claimed;(f) returning to step (c) if there are any more claimed nodes at the current depth which have not yet been visited;(g) incrementing the current depth if all claimed nodes at the current depth have been visited and if there are any more nodes which have not been visited; and(h) returning to step (c) if step (g) resulted in incrementing the current depth,the method further comprising the steps:(j) displaying the tree structure (300, 400), using said display whereby displaying comprises the steps of:(j1) for each group of sibling technically identifiable nodes in the tree structure (300, 400), ranking the sibling nodes according to the usage parameter; and(j2) positioning each group of sibling technically identifiable nodes in accordance with the rankings of the sibling nodes.
- The method as claimed in one of claim 1, further comprising the step of:(i) prior to step (c), claiming the root node (201), wherein the current depth is zero.
- The method as claimed in claim 1, wherein step (j2) comprises the step of:(j3) laying out the tree structure (300, 400) such that the root node (201) is placed in a center (501, 2001) of a layout (500, 2000) of the tree structure (300, 400) and each child node in the tree structure (300, 400) is placed radially outward at a layout angle which is a function of its ranking.
- The method as claimed in claim 3, wherein the layout angle for each child node is measured from the center (501, 2001) of the layout (500, 2000) of the tree structure (300, 400).
- The method as claimed in claim 3, wherein the layout angle for each child node is measured from its parent.
- The method as claimed in one of claims 3 to 5, wherein the layout angles associated with sibling nodes increase monotonically with the rankings of the sibling nodes.
- The method as claimed in one of claims 3 to 6, wherein the layout angles associated with sibling nodes are determined such that highest ranking sibling nodes are optimally separated.
- The method as claimed in one of claims 3 to 7, wherein all nodes of the tree structure (300, 400) at a given radius (550, 560, 570, 580) from the center (501, 2001) are at an equal depth in the tree structure (300, 400).
- The method as claimed in one of claims 1 to 8, wherein each node's usage parameter is a measure of usage of a link from its parent node to itself.
- A computer-readable storage medium comprising computer-readable program code embodied on said computer-readable storage medium, said computer-readable program code for programming a computer (100) to perform the method as claimed in one of claims 1 to 9.
- An apparatus comprising:a processor (102); anda processor-readable storage medium (103, 107, 108) coupled to the processor (102) containing processor-readable program code for programming the apparatus to perform the method as claimed in one of claims 1 to 9.
Applications Claiming Priority (2)
| Application Number | Priority Date | Filing Date | Title |
|---|---|---|---|
| US62341 | 1998-04-17 | ||
| US09/062,341 US6509898B2 (en) | 1998-04-17 | 1998-04-17 | Usage based methods of traversing and displaying generalized graph structures |
Publications (3)
| Publication Number | Publication Date |
|---|---|
| EP0950960A2 EP0950960A2 (en) | 1999-10-20 |
| EP0950960A3 EP0950960A3 (en) | 2000-03-22 |
| EP0950960B1 true EP0950960B1 (en) | 2012-12-05 |
Family
ID=22041843
Family Applications (1)
| Application Number | Title | Priority Date | Filing Date |
|---|---|---|---|
| EP99107559A Expired - Lifetime EP0950960B1 (en) | 1998-04-17 | 1999-04-15 | Usage based methods of traversing and displaying generalized graph structures |
Country Status (4)
| Country | Link |
|---|---|
| US (1) | US6509898B2 (en) |
| EP (1) | EP0950960B1 (en) |
| JP (1) | JP4355049B2 (en) |
| BR (1) | BR9901367A (en) |
Families Citing this family (164)
| Publication number | Priority date | Publication date | Assignee | Title |
|---|---|---|---|---|
| WO1999046689A1 (en) * | 1998-03-12 | 1999-09-16 | Crossworlds Software, Inc. | Execution of extended activity diagrams by code generation |
| US6628304B2 (en) * | 1998-12-09 | 2003-09-30 | Cisco Technology, Inc. | Method and apparatus providing a graphical user interface for representing and navigating hierarchical networks |
| EP1153353A1 (en) * | 1999-01-19 | 2001-11-14 | BRITISH TELECOMMUNICATIONS public limited company | Data selection system and method therefor |
| US20040078300A1 (en) * | 1999-01-25 | 2004-04-22 | Smith John R. | Method and apparatus for progressive information querying on proprietary data and for the progressive selling of information |
| US6359635B1 (en) | 1999-02-03 | 2002-03-19 | Cary D. Perttunen | Methods, articles and apparatus for visibly representing information and for providing an input interface |
| US6993531B1 (en) * | 1999-02-04 | 2006-01-31 | Naas Aaron J | System and method of routine navigation |
| US6714936B1 (en) | 1999-05-25 | 2004-03-30 | Nevin, Iii Rocky Harry W. | Method and apparatus for displaying data stored in linked nodes |
| US6922829B2 (en) * | 1999-10-12 | 2005-07-26 | Texas Instruments Incorporated | Method of generating profile-optimized code |
| AU1844001A (en) | 1999-11-30 | 2001-06-12 | Maxamine International Pty Ltd | Web map tool |
| GB2357596A (en) * | 1999-12-20 | 2001-06-27 | Univ London | A navigation engine for assessing the quality of a trail between linked pages |
| US6996612B1 (en) | 1999-12-30 | 2006-02-07 | Vignette Corporation | Method of providing information related to activity of a user and a data processing system program product |
| US6665863B1 (en) * | 2000-05-31 | 2003-12-16 | Microsoft Corporation | Data referencing within a database graph |
| US7251687B1 (en) | 2000-06-02 | 2007-07-31 | Vignette Corporation | Method for click-stream analysis using web directory reverse categorization |
| US20020191034A1 (en) * | 2000-06-28 | 2002-12-19 | Sowizral Henry A. | Size conditioned visibility search system and method |
| US7272786B1 (en) | 2000-07-20 | 2007-09-18 | Vignette Corporation | Metadata, models, visualization and control |
| US6915484B1 (en) | 2000-08-09 | 2005-07-05 | Adobe Systems Incorporated | Text reflow in a structured document |
| US7660869B1 (en) | 2000-08-21 | 2010-02-09 | Vignette Software, LLC | Network real estate analysis |
| US7278105B1 (en) | 2000-08-21 | 2007-10-02 | Vignette Corporation | Visualization and analysis of user clickpaths |
| US7149795B2 (en) * | 2000-09-18 | 2006-12-12 | Converged Access, Inc. | Distributed quality-of-service system |
| US7219307B2 (en) * | 2000-09-22 | 2007-05-15 | Jpmorgan Chase Bank | Methods for graphically representing interactions among entities |
| US20020059284A1 (en) * | 2000-10-20 | 2002-05-16 | Ran Bronstein | Method for rapid transfer of data with a multi-spline model |
| FR2817639B3 (en) * | 2000-12-01 | 2003-03-28 | Voyez Vous | METHOD AND SYSTEM FOR DYNAMIC REPRESENTATION OF A SPACE OF CHARACTERIZED OBJECTS FOR RECOMMENDING SUCH OBJECTS OR THEIR CHARACTERISTICS |
| US6931604B2 (en) * | 2000-12-18 | 2005-08-16 | Derek Graham Lane | Method of navigating a collection of interconnected nodes |
| JP2002259446A (en) * | 2000-12-21 | 2002-09-13 | Xerox Corp | System and method for browsing node-link structure based on estimated degree of interest |
| US7076728B2 (en) * | 2000-12-22 | 2006-07-11 | International Business Machines Corporation | Method and apparatus for end-to-end content publishing system using XML with an object dependency graph |
| US20020152244A1 (en) * | 2000-12-22 | 2002-10-17 | International Business Machines Corporation | Method and apparatus to dynamically create a customized user interface based on a document type definition |
| US20020165755A1 (en) * | 2001-03-29 | 2002-11-07 | Kitts Brendan J. | Method of predicting behavior of a customer at a future date and a data processing system readable medium |
| WO2005029365A2 (en) * | 2003-07-07 | 2005-03-31 | Metatomix, Inc. | Surveillance, monitoring and real-time events platform |
| US7058637B2 (en) * | 2001-05-15 | 2006-06-06 | Metatomix, Inc. | Methods and apparatus for enterprise application integration |
| US6856992B2 (en) * | 2001-05-15 | 2005-02-15 | Metatomix, Inc. | Methods and apparatus for real-time business visibility using persistent schema-less data storage |
| US7890517B2 (en) * | 2001-05-15 | 2011-02-15 | Metatomix, Inc. | Appliance for enterprise information integration and enterprise resource interoperability platform and methods |
| US6925457B2 (en) * | 2001-07-27 | 2005-08-02 | Metatomix, Inc. | Methods and apparatus for querying a relational data store using schema-less queries |
| US20030208499A1 (en) * | 2002-05-03 | 2003-11-06 | David Bigwood | Methods and apparatus for visualizing relationships among triples of resource description framework (RDF) data sets |
| JP2003006224A (en) * | 2001-06-26 | 2003-01-10 | Kawasaki Heavy Ind Ltd | Method and device for automatic update of www pages |
| US20030009368A1 (en) * | 2001-07-06 | 2003-01-09 | Kitts Brendan J. | Method of predicting a customer's business potential and a data processing system readable medium including code for the method |
| US6901555B2 (en) * | 2001-07-09 | 2005-05-31 | Inxight Software, Inc. | Tree visualization system and method based upon a compressed half-plane model of hyperbolic geometry |
| KR100561837B1 (en) * | 2001-07-09 | 2006-03-16 | 삼성전자주식회사 | Method for representing image-based rendering information in a 3D scene |
| US7076483B2 (en) * | 2001-08-27 | 2006-07-11 | Xyleme Sa | Ranking nodes in a graph |
| CA2462165A1 (en) * | 2001-10-11 | 2003-04-17 | Visual Sciences, Llc | System, method, and computer program product for processing and visualization of information |
| KR100480272B1 (en) * | 2001-10-31 | 2005-04-07 | 삼성전자주식회사 | A prefix aggregation method for routing coordination protocol in a loosely coupled massively parallel router |
| US7086012B1 (en) | 2001-12-27 | 2006-08-01 | Perttunen Cary D | Representation of weighted tree-related elements |
| USRE48596E1 (en) * | 2002-01-16 | 2021-06-15 | Intel Corporation | Interface engine providing a continuous user interface |
| US6957392B2 (en) * | 2002-01-16 | 2005-10-18 | Laszlo Systems, Inc. | Interface engine providing a continuous user interface |
| US7046248B1 (en) | 2002-03-18 | 2006-05-16 | Perttunen Cary D | Graphical representation of financial information |
| US7203899B2 (en) * | 2002-04-12 | 2007-04-10 | Xerox Corporation | Systems and methods for assessing user success rates of accessing information in a collection of contents |
| US20030222890A1 (en) * | 2002-05-31 | 2003-12-04 | David Salesin | System and method for adaptable presentations |
| US7415452B1 (en) * | 2002-06-21 | 2008-08-19 | Adobe Systems Incorporated | Traversing a hierarchical layout template |
| JP4369868B2 (en) * | 2002-06-28 | 2009-11-25 | オムニチャー, インク. | Acquisition and display of site visit path data |
| US20080201357A1 (en) * | 2003-06-27 | 2008-08-21 | Omniture, Inc. | Page Grouping for Site Traffic Analysis Reports |
| US7627688B1 (en) | 2002-07-09 | 2009-12-01 | Vignette Corporation | Method and system for detecting gaps in a data stream |
| US7603430B1 (en) | 2002-07-09 | 2009-10-13 | Vignette Corporation | System and method of associating events with requests |
| US7461120B1 (en) | 2002-07-09 | 2008-12-02 | Vignette Corporation | Method and system for identifying a visitor at a website server by requesting additional characteristic of a visitor computer from a visitor server |
| US6982682B1 (en) * | 2002-07-29 | 2006-01-03 | Silicon Graphics, Inc. | System and method for managing graphics applications |
| US7140024B2 (en) * | 2002-07-29 | 2006-11-21 | Silicon Graphics, Inc. | System and method for managing graphics applications |
| US7512612B1 (en) | 2002-08-08 | 2009-03-31 | Spoke Software | Selecting an optimal path through a relationship graph |
| US8523575B2 (en) * | 2002-09-02 | 2013-09-03 | Nextthinksoft Pty Ltd. | Recalling items of information |
| CA2501847A1 (en) * | 2002-10-07 | 2004-04-22 | Metatomix, Inc | Methods and apparatus for identifying related nodes in a directed graph having named arcs |
| US7437268B1 (en) | 2002-12-17 | 2008-10-14 | Vignette Corporation | Systems and methods for analyzing data |
| US8694504B2 (en) * | 2003-03-05 | 2014-04-08 | Spore, Inc. | Methods and systems for technology analysis and mapping |
| US7523128B1 (en) | 2003-03-18 | 2009-04-21 | Troux Technologies | Method and system for discovering relationships |
| US20040217983A1 (en) * | 2003-04-09 | 2004-11-04 | Ken Forsse | Process for visually organizing informational concepts and relationships utilizing a matrix |
| FR2853624B1 (en) * | 2003-04-14 | 2005-06-10 | Eads Launch Vehicles | SET OF ELEMENTS, FOLDABLE AND DEPLOYABLE, MOUNTED ON BOARD A SPACE ENGINE |
| US7605813B2 (en) * | 2003-04-22 | 2009-10-20 | International Business Machines Corporation | Displaying arbitrary relationships in a tree-map visualization |
| US7427987B2 (en) * | 2003-04-22 | 2008-09-23 | International Business Machines Corporation | Displaying multi-ownership in a tree-map visualization |
| US20050283753A1 (en) * | 2003-08-07 | 2005-12-22 | Denise Ho | Alert triggers and event management in a relationship system |
| US7268782B2 (en) * | 2003-10-31 | 2007-09-11 | Sap Aktiengesellschaft | Smart radar chart |
| US20050132054A1 (en) * | 2003-12-10 | 2005-06-16 | International Business Machines Corporation | Fine-grained authorization by traversing generational relationships |
| EP1749280A1 (en) * | 2004-01-12 | 2007-02-07 | Allegorithmic | Method and tool for modifying a procedural map |
| JP4537391B2 (en) * | 2004-03-16 | 2010-09-01 | 株式会社ターボデータラボラトリー | Method, information processing apparatus, and program for handling tree-type data structure |
| US7665063B1 (en) | 2004-05-26 | 2010-02-16 | Pegasystems, Inc. | Integration of declarative rule-based processing with procedural programming |
| US7440933B2 (en) * | 2004-06-18 | 2008-10-21 | International Business Machines Corporation | Method for facilitating problem resolution |
| US8131472B2 (en) * | 2004-09-28 | 2012-03-06 | International Business Machines Corporation | Methods for hierarchical organization of data associated with medical events in databases |
| US8892571B2 (en) * | 2004-10-12 | 2014-11-18 | International Business Machines Corporation | Systems for associating records in healthcare database with individuals |
| US20060124569A1 (en) * | 2004-12-10 | 2006-06-15 | Parkins Gary A | Alignment system and method for vertically stored objects |
| US7580922B2 (en) * | 2005-01-04 | 2009-08-25 | International Business Machines Corporation | Methods for relating data in healthcare databases |
| US8335704B2 (en) | 2005-01-28 | 2012-12-18 | Pegasystems Inc. | Methods and apparatus for work management and routing |
| US7890545B1 (en) | 2005-03-31 | 2011-02-15 | Troux Technologies | Method and system for a reference model for an enterprise architecture |
| US8234223B1 (en) | 2005-04-28 | 2012-07-31 | Troux Technologies, Inc. | Method and system for calculating cost of an asset using a data model |
| US7495673B1 (en) * | 2005-06-04 | 2009-02-24 | Shankar S Srinivasan | Resource tepee |
| US7664712B1 (en) | 2005-08-05 | 2010-02-16 | Troux Technologies | Method and system for impact analysis using a data model |
| US8200501B2 (en) * | 2006-01-26 | 2012-06-12 | International Business Machines Corporation | Methods, systems and computer program products for synthesizing medical procedure information in healthcare databases |
| US20070174091A1 (en) * | 2006-01-26 | 2007-07-26 | International Business Machines Corporation | Methods, data structures, systems and computer program products for identifying obsure patterns in healthcare related data |
| US8566113B2 (en) * | 2006-02-07 | 2013-10-22 | International Business Machines Corporation | Methods, systems and computer program products for providing a level of anonymity to patient records/information |
| US20090132232A1 (en) * | 2006-03-30 | 2009-05-21 | Pegasystems Inc. | Methods and apparatus for implementing multilingual software applications |
| US8924335B1 (en) | 2006-03-30 | 2014-12-30 | Pegasystems Inc. | Rule-based user interface conformance methods |
| US8214877B1 (en) | 2006-05-22 | 2012-07-03 | Troux Technologies | System and method for the implementation of policies |
| US7822710B1 (en) | 2006-05-24 | 2010-10-26 | Troux Technologies | System and method for data collection |
| US9202184B2 (en) * | 2006-09-07 | 2015-12-01 | International Business Machines Corporation | Optimizing the selection, verification, and deployment of expert resources in a time of chaos |
| US8054756B2 (en) * | 2006-09-18 | 2011-11-08 | Yahoo! Inc. | Path discovery and analytics for network data |
| US7688748B2 (en) * | 2006-09-22 | 2010-03-30 | The Hong Kong Polytechnic University | Methods and apparatus for ranking a node in a network having a plurality of interconnecting nodes |
| US20080294459A1 (en) * | 2006-10-03 | 2008-11-27 | International Business Machines Corporation | Health Care Derivatives as a Result of Real Time Patient Analytics |
| US8145582B2 (en) * | 2006-10-03 | 2012-03-27 | International Business Machines Corporation | Synthetic events for real time patient analysis |
| US8055603B2 (en) * | 2006-10-03 | 2011-11-08 | International Business Machines Corporation | Automatic generation of new rules for processing synthetic events using computer-based learning processes |
| US7861151B2 (en) | 2006-12-05 | 2010-12-28 | Microsoft Corporation | Web site structure analysis |
| US7765496B2 (en) * | 2006-12-29 | 2010-07-27 | International Business Machines Corporation | System and method for improving the navigation of complex visualizations for the visually impaired |
| US8504922B2 (en) * | 2006-12-29 | 2013-08-06 | Microsoft Corporation | Enhanced user navigation to previously visited areas in a media environment |
| US8812957B2 (en) | 2007-01-31 | 2014-08-19 | Adobe Systems Incorporated | Relevance slider in a site analysis report |
| US8099491B2 (en) * | 2007-01-31 | 2012-01-17 | Adobe Systems Incorporated | Intelligent node positioning in a site analysis report |
| US8694890B2 (en) * | 2007-01-31 | 2014-04-08 | Adobe Sytems Incorporated | Use of color in a site analysis report |
| US7853611B2 (en) * | 2007-02-26 | 2010-12-14 | International Business Machines Corporation | System and method for deriving a hierarchical event based database having action triggers based on inferred probabilities |
| US7792774B2 (en) | 2007-02-26 | 2010-09-07 | International Business Machines Corporation | System and method for deriving a hierarchical event based database optimized for analysis of chaotic events |
| US7970759B2 (en) | 2007-02-26 | 2011-06-28 | International Business Machines Corporation | System and method for deriving a hierarchical event based database optimized for pharmaceutical analysis |
| US8250525B2 (en) | 2007-03-02 | 2012-08-21 | Pegasystems Inc. | Proactive performance management for multi-user enterprise software systems |
| US9047202B1 (en) * | 2007-04-30 | 2015-06-02 | Hewlett-Packard Development Company, L.P. | Creating a relationship tree representing relationships of graphs to enable navigation through the graphs without accessing an input data set |
| US7656405B1 (en) | 2007-05-10 | 2010-02-02 | At&T Corp. | System and method for generating circular layout graphs |
| US7930262B2 (en) * | 2007-10-18 | 2011-04-19 | International Business Machines Corporation | System and method for the longitudinal analysis of education outcomes using cohort life cycles, cluster analytics-based cohort analysis, and probabilistic data schemas |
| US8027956B1 (en) | 2007-10-30 | 2011-09-27 | Troux Technologies | System and method for planning or monitoring system transformations |
| US8823709B2 (en) | 2007-11-01 | 2014-09-02 | Ebay Inc. | User interface framework for viewing large scale graphs on the web |
| US7788280B2 (en) * | 2007-11-15 | 2010-08-31 | International Business Machines Corporation | Method for visualisation of status data in an electronic system |
| US7779051B2 (en) * | 2008-01-02 | 2010-08-17 | International Business Machines Corporation | System and method for optimizing federated and ETL'd databases with considerations of specialized data structures within an environment having multidimensional constraints |
| US9208262B2 (en) * | 2008-02-22 | 2015-12-08 | Accenture Global Services Limited | System for displaying a plurality of associated items in a collaborative environment |
| US8121858B2 (en) * | 2008-03-24 | 2012-02-21 | International Business Machines Corporation | Optimizing pharmaceutical treatment plans across multiple dimensions |
| US8549002B2 (en) * | 2008-05-15 | 2013-10-01 | Oracle International Corporation | Cluster health indicator with dynamic load correlation |
| JP5448576B2 (en) * | 2008-06-03 | 2014-03-19 | キヤノン株式会社 | Display control apparatus, display control method, and program |
| US10481878B2 (en) * | 2008-10-09 | 2019-11-19 | Objectstore, Inc. | User interface apparatus and methods |
| US8832580B2 (en) * | 2008-11-05 | 2014-09-09 | Aurea Software, Inc. | Software with improved view of a business process |
| US8826233B2 (en) * | 2008-11-19 | 2014-09-02 | Sap Ag | Graphical representation of a JAVA bytecode |
| US8843435B1 (en) | 2009-03-12 | 2014-09-23 | Pegasystems Inc. | Techniques for dynamic data processing |
| US7683902B1 (en) | 2009-03-27 | 2010-03-23 | International Business Machines Corporation | Method to visualize performance data of a multi-layered state diagram |
| US8468492B1 (en) | 2009-03-30 | 2013-06-18 | Pegasystems, Inc. | System and method for creation and modification of software applications |
| MX2012003721A (en) | 2009-09-30 | 2012-06-28 | Evan V Chrapko | Systems and methods for social graph data analytics to determine connectivity within a community. |
| US20110099164A1 (en) | 2009-10-23 | 2011-04-28 | Haim Zvi Melman | Apparatus and method for search and retrieval of documents and advertising targeting |
| US8456472B2 (en) | 2010-01-08 | 2013-06-04 | International Business Machines Corporation | Ranking nodes in a graph |
| WO2011106897A1 (en) | 2010-03-05 | 2011-09-09 | Chrapko Evan V | Systems and methods for conducting more reliable assessments with connectivity statistics |
| US9922134B2 (en) * | 2010-04-30 | 2018-03-20 | Www.Trustscience.Com Inc. | Assessing and scoring people, businesses, places, things, and brands |
| CN102870090A (en) * | 2010-05-01 | 2013-01-09 | 核心科技有限公司 | Process entity graphs |
| US8935129B1 (en) * | 2010-06-04 | 2015-01-13 | Bentley Systems, Incorporated | System and method for simplifying a graph'S topology and persevering the graph'S semantics |
| US10394778B2 (en) | 2010-09-03 | 2019-08-27 | Robert Lewis Jackson, JR. | Minimal representation of connecting walks |
| US10318877B2 (en) | 2010-10-19 | 2019-06-11 | International Business Machines Corporation | Cohort-based prediction of a future event |
| US8495108B2 (en) * | 2010-11-30 | 2013-07-23 | International Business Machines Corporation | Virtual node subpool management |
| US8635592B1 (en) | 2011-02-08 | 2014-01-21 | Troux Technologies, Inc. | Method and system for tailoring software functionality |
| US8880487B1 (en) | 2011-02-18 | 2014-11-04 | Pegasystems Inc. | Systems and methods for distributed rules processing |
| US8601025B1 (en) * | 2011-09-28 | 2013-12-03 | Emc Corporation | Techniques using a bidirectional graph for reporting to clients |
| US8443105B1 (en) * | 2011-12-12 | 2013-05-14 | The United States Of America As Represented By The Director, National Security Agency | Device for and method of network routing |
| US9721039B2 (en) * | 2011-12-16 | 2017-08-01 | Palo Alto Research Center Incorporated | Generating a relationship visualization for nonhomogeneous entities |
| US10311106B2 (en) | 2011-12-28 | 2019-06-04 | Www.Trustscience.Com Inc. | Social graph visualization and user interface |
| US9195936B1 (en) | 2011-12-30 | 2015-11-24 | Pegasystems Inc. | System and method for updating or modifying an application without manual coding |
| JP5643462B2 (en) * | 2012-03-02 | 2014-12-17 | インターナショナル・ビジネス・マシーンズ・コーポレーションInternational Business Machines Corporation | Data display device, data display method, and program |
| US9280581B1 (en) | 2013-03-12 | 2016-03-08 | Troux Technologies, Inc. | Method and system for determination of data completeness for analytic data calculations |
| US9799127B2 (en) * | 2014-03-03 | 2017-10-24 | Deep Node, Inc. | Displaying a live stream of events using a dynamically-constructed three-dimensional data tree |
| GB2524073A (en) * | 2014-03-14 | 2015-09-16 | Ibm | Communication method and system for accessing media data |
| US9891801B2 (en) | 2014-05-12 | 2018-02-13 | Sap Se | Visualization and navigation for multi-dimensional hierarchical data |
| US20160071035A1 (en) * | 2014-09-05 | 2016-03-10 | International Business Machines Corporation | Implementing socially enabled business risk management |
| US10469396B2 (en) | 2014-10-10 | 2019-11-05 | Pegasystems, Inc. | Event processing with enhanced throughput |
| CN105488088B (en) * | 2014-12-31 | 2019-05-07 | 哈尔滨安天科技股份有限公司 | Two-dimensional network angular distribution layout method based on tree structure |
| US10191946B2 (en) * | 2015-03-11 | 2019-01-29 | International Business Machines Corporation | Answering natural language table queries through semantic table representation |
| US9578043B2 (en) | 2015-03-20 | 2017-02-21 | Ashif Mawji | Calculating a trust score |
| US10417282B1 (en) * | 2015-07-22 | 2019-09-17 | Wells Fargo Bank, N.A. | Entity mapping |
| US9569558B1 (en) * | 2015-11-25 | 2017-02-14 | International Business Machines Corporation | Method for backfilling graph structure and articles comprising the same |
| US20170235792A1 (en) | 2016-02-17 | 2017-08-17 | Www.Trustscience.Com Inc. | Searching for entities based on trust score and geography |
| US9438619B1 (en) | 2016-02-29 | 2016-09-06 | Leo M. Chan | Crowdsourcing of trustworthiness indicators |
| US9679254B1 (en) | 2016-02-29 | 2017-06-13 | Www.Trustscience.Com Inc. | Extrapolating trends in trust scores |
| US10067853B2 (en) * | 2016-03-15 | 2018-09-04 | Ca, Inc. | Generating a directed graph representing application program execution flow from an execution trace |
| US9721296B1 (en) | 2016-03-24 | 2017-08-01 | Www.Trustscience.Com Inc. | Learning an entity's trust model and risk tolerance to calculate a risk score |
| US10698599B2 (en) | 2016-06-03 | 2020-06-30 | Pegasystems, Inc. | Connecting graphical shapes using gestures |
| WO2017221444A1 (en) * | 2016-06-21 | 2017-12-28 | 国立研究開発法人物質・材料研究機構 | Search system, search method, and physical property database management device |
| US10698647B2 (en) | 2016-07-11 | 2020-06-30 | Pegasystems Inc. | Selective sharing for collaborative application usage |
| US9740368B1 (en) * | 2016-08-10 | 2017-08-22 | Quid, Inc. | Positioning labels on graphical visualizations of graphs |
| US10180969B2 (en) | 2017-03-22 | 2019-01-15 | Www.Trustscience.Com Inc. | Entity resolution and identity management in big, noisy, and/or unstructured data |
| US11048488B2 (en) | 2018-08-14 | 2021-06-29 | Pegasystems, Inc. | Software code optimizer and method |
| CN110516205B (en) * | 2019-07-19 | 2023-04-07 | 平安科技(深圳)有限公司 | Data structure diagram display method and device, computer equipment and storage medium |
| US11526898B2 (en) | 2019-09-05 | 2022-12-13 | Microsoft Technology Licensing, Llc | Dynamic visualization of product usage tree based on raw telemetry data |
| US11347797B2 (en) | 2019-11-19 | 2022-05-31 | Bit Discovery Inc. | Asset search and discovery system using graph data structures |
| US11567945B1 (en) | 2020-08-27 | 2023-01-31 | Pegasystems Inc. | Customized digital content generation systems and methods |
Family Cites Families (3)
| Publication number | Priority date | Publication date | Assignee | Title |
|---|---|---|---|---|
| US5546529A (en) * | 1994-07-28 | 1996-08-13 | Xerox Corporation | Method and apparatus for visualization of database search results |
| JP2861908B2 (en) * | 1996-01-16 | 1999-02-24 | 日本電気株式会社 | Browsing device |
| US5870559A (en) * | 1996-10-15 | 1999-02-09 | Mercury Interactive | Software system and associated methods for facilitating the analysis and management of web sites |
-
1998
- 1998-04-17 US US09/062,341 patent/US6509898B2/en not_active Expired - Lifetime
-
1999
- 1999-04-15 EP EP99107559A patent/EP0950960B1/en not_active Expired - Lifetime
- 1999-04-19 BR BR9901367-3A patent/BR9901367A/en not_active IP Right Cessation
- 1999-04-19 JP JP11094099A patent/JP4355049B2/en not_active Expired - Lifetime
Non-Patent Citations (1)
| Title |
|---|
| MUKHERJEA S ET AL: "Visualizing the World-Wide Web with the Navigational View Builder", COMPUTER NETWORKS AND ISDN SYSTEMS, NORTH HOLLAND PUBLISHING. AMSTERDAM, NL LNKD- DOI:10.1016/0169-7552(95)00023-Z, vol. 27, no. 6, 1 April 1995 (1995-04-01), pages 1075 - 1087, XP004013209, ISSN: 0169-7552 * |
Also Published As
| Publication number | Publication date |
|---|---|
| JPH11327993A (en) | 1999-11-30 |
| EP0950960A2 (en) | 1999-10-20 |
| BR9901367A (en) | 2000-05-09 |
| US6509898B2 (en) | 2003-01-21 |
| JP4355049B2 (en) | 2009-10-28 |
| US20020067360A1 (en) | 2002-06-06 |
| EP0950960A3 (en) | 2000-03-22 |
Similar Documents
| Publication | Publication Date | Title |
|---|---|---|
| EP0950960B1 (en) | Usage based methods of traversing and displaying generalized graph structures | |
| US6369819B1 (en) | Methods for visualizing transformations among related series of graphs | |
| US6151595A (en) | Methods for interactive visualization of spreading activation using time tubes and disk trees | |
| US7043702B2 (en) | Method for visualizing user path through a web site and a path's associated information scent | |
| EP0860786B1 (en) | System and method for hierarchically grouping and ranking a set of objects in a query context | |
| US20040133555A1 (en) | Systems and methods for organizing data | |
| Karnatak et al. | Multicriteria spatial decision analysis in web GIS environment | |
| US7428705B2 (en) | Web map tool | |
| US7130844B2 (en) | System and method for examining, calculating the age of an document collection as a measure of time since creation, visualizing, identifying selectively reference those document collections representing current activity | |
| Eick | Visualizing online activity | |
| Kobayashi et al. | SArF map: Visualizing software architecture from feature and layer viewpoints | |
| AU2005202016A1 (en) | Method and system for determining similarity of objects based on heterogeneous relationships | |
| Yin et al. | Optimization of multi-criteria website structure based on enhanced tabu search and web usage mining | |
| KR20040022425A (en) | Hierarchical data-driven navigation system and method for information retrieval | |
| Desikan et al. | Hyperlink Analysis–Techniques & Applications | |
| Blanchard et al. | Exploratory visualization for association rule rummaging | |
| Alghamdi et al. | Extended user preference based weighted page ranking algorithm | |
| GB2338324A (en) | Information management system | |
| Roberts et al. | Multiform glyph based web search result visualization | |
| Martínez‐Torres et al. | Web site structure mining using social network analysis | |
| Jorge et al. | A Methodology for exploring association models | |
| Catard | Interaction with databases | |
| Choong et al. | Context-based exploitation of data warehouses. | |
| Ma et al. | Effective browsing of the discovered association rules using the Web | |
| Mu et al. | Free-link topology navigation on statistical table objects: metadata schema and user interface |
Legal Events
| Date | Code | Title | Description |
|---|---|---|---|
| PUAI | Public reference made under article 153(3) epc to a published international application that has entered the european phase |
Free format text: ORIGINAL CODE: 0009012 |
|
| AK | Designated contracting states |
Kind code of ref document: A2 Designated state(s): DE FR GB |
|
| AX | Request for extension of the european patent |
Free format text: AL;LT;LV;MK;RO;SI |
|
| PUAL | Search report despatched |
Free format text: ORIGINAL CODE: 0009013 |
|
| AK | Designated contracting states |
Kind code of ref document: A3 Designated state(s): AT BE CH CY DE DK ES FI FR GB GR IE IT LI LU MC NL PT SE |
|
| AX | Request for extension of the european patent |
Free format text: AL;LT;LV;MK;RO;SI |
|
| 17P | Request for examination filed |
Effective date: 20000922 |
|
| AKX | Designation fees paid |
Free format text: DE FR GB |
|
| 17Q | First examination report despatched |
Effective date: 20050627 |
|
| RAP1 | Party data changed (applicant data changed or rights of an application transferred) |
Owner name: GOOGLE INC. |
|
| GRAP | Despatch of communication of intention to grant a patent |
Free format text: ORIGINAL CODE: EPIDOSNIGR1 |
|
| GRAS | Grant fee paid |
Free format text: ORIGINAL CODE: EPIDOSNIGR3 |
|
| GRAA | (expected) grant |
Free format text: ORIGINAL CODE: 0009210 |
|
| AK | Designated contracting states |
Kind code of ref document: B1 Designated state(s): DE FR GB |
|
| REG | Reference to a national code |
Ref country code: DE Ref legal event code: R081 Ref document number: 69944507 Country of ref document: DE Owner name: GOOGLE LLC (N.D.GES.D. STAATES DELAWARE), MOUN, US Free format text: FORMER OWNER: XEROX CORP., STAMFORD, CONN., US Ref country code: GB Ref legal event code: FG4D |
|
| REG | Reference to a national code |
Ref country code: DE Ref legal event code: R096 Ref document number: 69944507 Country of ref document: DE Effective date: 20130131 |
|
| PLBE | No opposition filed within time limit |
Free format text: ORIGINAL CODE: 0009261 |
|
| STAA | Information on the status of an ep patent application or granted ep patent |
Free format text: STATUS: NO OPPOSITION FILED WITHIN TIME LIMIT |
|
| 26N | No opposition filed |
Effective date: 20130906 |
|
| REG | Reference to a national code |
Ref country code: DE Ref legal event code: R097 Ref document number: 69944507 Country of ref document: DE Effective date: 20130906 |
|
| REG | Reference to a national code |
Ref country code: DE Ref legal event code: R082 Ref document number: 69944507 Country of ref document: DE Representative=s name: PROCK, THOMAS, DIPL.-ING. (FH) DR., GB Ref country code: DE Ref legal event code: R082 Country of ref document: DE |
|
| REG | Reference to a national code |
Ref country code: FR Ref legal event code: PLFP Year of fee payment: 18 |
|
| REG | Reference to a national code |
Ref country code: FR Ref legal event code: PLFP Year of fee payment: 19 |
|
| REG | Reference to a national code |
Ref country code: DE Ref legal event code: R082 Ref document number: 69944507 Country of ref document: DE Representative=s name: PROCK, THOMAS, DR., GB Ref country code: DE Ref legal event code: R082 Ref document number: 69944507 Country of ref document: DE Representative=s name: PROCK, THOMAS, DIPL.-ING. (FH) DR., GB Ref country code: DE Ref legal event code: R081 Ref document number: 69944507 Country of ref document: DE Owner name: GOOGLE LLC (N.D.GES.D. STAATES DELAWARE), MOUN, US Free format text: FORMER OWNER: GOOGLE INC., MOUNTAIN VIEW, CALIF., US |
|
| REG | Reference to a national code |
Ref country code: FR Ref legal event code: CJ Effective date: 20180213 Ref country code: FR Ref legal event code: CD Owner name: GOOGLE INC., US Effective date: 20180213 |
|
| REG | Reference to a national code |
Ref country code: FR Ref legal event code: PLFP Year of fee payment: 20 |
|
| PGFP | Annual fee paid to national office [announced via postgrant information from national office to epo] |
Ref country code: DE Payment date: 20180427 Year of fee payment: 20 |
|
| PGFP | Annual fee paid to national office [announced via postgrant information from national office to epo] |
Ref country code: FR Payment date: 20180425 Year of fee payment: 20 |
|
| PGFP | Annual fee paid to national office [announced via postgrant information from national office to epo] |
Ref country code: GB Payment date: 20180427 Year of fee payment: 20 |
|
| REG | Reference to a national code |
Ref country code: DE Ref legal event code: R079 Ref document number: 69944507 Country of ref document: DE Free format text: PREVIOUS MAIN CLASS: G06F0017300000 Ipc: G06F0016000000 |
|
| REG | Reference to a national code |
Ref country code: DE Ref legal event code: R071 Ref document number: 69944507 Country of ref document: DE |
|
| REG | Reference to a national code |
Ref country code: GB Ref legal event code: PE20 Expiry date: 20190414 |
|
| PG25 | Lapsed in a contracting state [announced via postgrant information from national office to epo] |
Ref country code: GB Free format text: LAPSE BECAUSE OF EXPIRATION OF PROTECTION Effective date: 20190414 |
|
| P01 | Opt-out of the competence of the unified patent court (upc) registered |
Effective date: 20230505 |