EP0638869B1 - Procedure for a high-resolution spectral analysis for multichannel observations - Google Patents
Procedure for a high-resolution spectral analysis for multichannel observations Download PDFInfo
- Publication number
- EP0638869B1 EP0638869B1 EP93113022A EP93113022A EP0638869B1 EP 0638869 B1 EP0638869 B1 EP 0638869B1 EP 93113022 A EP93113022 A EP 93113022A EP 93113022 A EP93113022 A EP 93113022A EP 0638869 B1 EP0638869 B1 EP 0638869B1
- Authority
- EP
- European Patent Office
- Prior art keywords
- matrix
- determined
- resolution
- matrices
- spectral analysis
- Prior art date
- Legal status (The legal status is an assumption and is not a legal conclusion. Google has not performed a legal analysis and makes no representation as to the accuracy of the status listed.)
- Expired - Lifetime
Links
Images


Classifications
-
- A—HUMAN NECESSITIES
- A61—MEDICAL OR VETERINARY SCIENCE; HYGIENE
- A61B—DIAGNOSIS; SURGERY; IDENTIFICATION
- A61B5/00—Measuring for diagnostic purposes; Identification of persons
- A61B5/72—Signal processing specially adapted for physiological signals or for diagnostic purposes
- A61B5/7235—Details of waveform analysis
-
- A—HUMAN NECESSITIES
- A61—MEDICAL OR VETERINARY SCIENCE; HYGIENE
- A61B—DIAGNOSIS; SURGERY; IDENTIFICATION
- A61B5/00—Measuring for diagnostic purposes; Identification of persons
- A61B5/24—Detecting, measuring or recording bioelectric or biomagnetic signals of the body or parts thereof
- A61B5/242—Detecting biomagnetic fields, e.g. magnetic fields produced by bioelectric currents
- A61B5/243—Detecting biomagnetic fields, e.g. magnetic fields produced by bioelectric currents specially adapted for magnetocardiographic [MCG] signals
-
- A—HUMAN NECESSITIES
- A61—MEDICAL OR VETERINARY SCIENCE; HYGIENE
- A61B—DIAGNOSIS; SURGERY; IDENTIFICATION
- A61B5/00—Measuring for diagnostic purposes; Identification of persons
- A61B5/24—Detecting, measuring or recording bioelectric or biomagnetic signals of the body or parts thereof
- A61B5/316—Modalities, i.e. specific diagnostic methods
- A61B5/318—Heart-related electrical modalities, e.g. electrocardiography [ECG]
- A61B5/346—Analysis of electrocardiograms
- A61B5/349—Detecting specific parameters of the electrocardiograph cycle
-
- A—HUMAN NECESSITIES
- A61—MEDICAL OR VETERINARY SCIENCE; HYGIENE
- A61B—DIAGNOSIS; SURGERY; IDENTIFICATION
- A61B5/00—Measuring for diagnostic purposes; Identification of persons
- A61B5/72—Signal processing specially adapted for physiological signals or for diagnostic purposes
- A61B5/7235—Details of waveform analysis
- A61B5/7253—Details of waveform analysis characterised by using transforms
Definitions
- the invention relates to a method for high-resolution spectral analysis in multi-channel observations. Spectral analysis methods are required to find and identify - possibly damped - harmonic components in signals of various origins.
- the invention further relates to the use of such a method for the detection of late ventricular potentials in multichannel medical-technical measuring methods in which signals originating from the heart are evaluated. Important examples of this are magnetocardiography (MKG) or electrocardiography (EKG).
- the invention is based on the object of specifying a method for high-resolution spectral analysis in multi-channel observations, with which ventricular late potentials can be detected in single beats.
- the method enables the detection of late ventricular potentials in single beats.
- the method also offers the possibility of spatially localizing pathological changes which are causally related to the development of these late potentials.
- This method has the remarkable advantage of being completely independent of the geometry of the sensor field used.
- Figure 1 shows a schematic representation of the time course of a heartbeat signal, especially the so-called QRS complex and the ST segment following it.
- Figure 2 shows a schematic representation of the compensation of a DC component and a linear trend in the measurement signal.
- FIGS. 3 and 4 show frequency histograms of patients with late potentials determined using the method according to the invention.
- FIGS. 5 and 6 show frequency histograms of patients without late potential determined using the method according to the invention.
- the invention is a new, high-resolution method for estimating several superimposed, possibly damped exponential vibrations from multi-channel, noisy observations.
- the solution according to the invention is based on a state representation of the measurement signals, as a result of which the nonlinear treasure problem is linearly parameterized.
- the method is independent of the spatial arrangement of the sensors used for the measurement data acquisition and can therefore be used for any given, but possibly unknown geometry of the sensor field.
- the method according to the invention is not limited in its applicability to the detection of late ventricular potentials, but can be applied in a similar way to problems of radar or sonar technology, astronomy, the measurement of mobile radio channels or to other problems of seismic or medical signal processing.
- Ventricular late potentials are high-frequency signals with small amplitudes in the terminal part of the QRS complex and in the ST segment of the heartbeat (see FIG. 1). These pathological signal components correspond to a regionally delayed, intermittent spread of excitation. They are often seen in patients with ventricular tachycardia. Their importance for diagnostics lies particularly in the risk assessment of patients with ventricular arrhythmias and in therapy or therapy control.
- the method according to the invention provides a suitable method for the detection of late potentials from multi-channel series of measurements.
- Late potentials can be demonstrated both in electrocardiograms (EKG) and in magnetocardiograms (MKG), whereby the same methods can be used in principle for both types of measurement.
- EKG electrocardiograms
- MKG magnetocardiograms
- MKG biomagnetic
- the method according to the invention can be carried out in two variants, which are based on two different state representations of the signals:
- a first variant of the method according to the invention is based on the so-called extended state representation of the signals.
- the measurement data are in the form of a matrix represented, whereas the other variant of the method according to the invention of the so-called traditional state representation, given by the matrix going out.
- Both representations are mathematically equivalent but have different properties.
- the user of the method according to the invention chooses the representation from these two fundamentally equivalent alternatives, which leads to a square matrix as possible, ie a matrix with the smallest possible difference between the number of rows and columns. Such a choice leads to optimal numerical properties when carrying out the method according to the invention.
- This first variant of the method according to the invention is based on the so-called extended state representation. This variant is accessible to an extension, which is still shown, and by means of which the accuracy of the spectral analysis can be further improved in the absence of attenuation phenomena (vanishing attenuation constants).
- This second variant of the method according to the invention is based on the so-called traditional representation of the state.
- FIGS. 3, 4, 5 and 6 schematically show various frequency histograms that were determined using the method according to the invention.
- 3 and 4 show frequency histograms of patients with late potentials. These can be easily recognized by the accumulation of high frequency components around 200 Hertz.
- Figures 5 and 6, which show frequency histograms of subjects without late potential these clusters are missing at the upper end of the spectrum.
- the user is not only interested in the frequencies and attenuation constants, but also in the amplitudes and phases of the spectral vibrations. These can be calculated in a manner known to the person skilled in the art from complex-value amplitudes of these vibrations.
- the real vibration amplitudes and the associated phases can easily be determined from the complex-valued amplitudes of the spectral frequencies. If the geometry of the sensor field is known, the observed, from Measurement errors freed signals are reconstructed and displayed on a suitable output device, for example on a monitor. The location of the generation of certain signal components can be reconstructed very precisely from the phases of the vibrations and their shifts between the individual sensors. This makes it possible, for example, to precisely determine the origin of a pathological signal component from a single QRS complex of a single heartbeat in the myocardium.
- the complex amplitudes and eigenvalues estimated with the aid of the method according to the invention are considerably more precise than the values determined with known methods for spectral analysis.
- the estimation results of the method according to the invention are furthermore due to the numerically extremely stable mathematical methods such as e.g. B. the singular value decomposition and the eigenvalue decomposition, extremely robust against noise signals which can be superimposed on the measurement signals.
- the expanded status display offers the possibility to additionally improve the estimation accuracy.
- Undamped exponential vibrations are characterized by vanishing real parts of the logarithmic eigenvalues of the matrix F.
- an extended block Hankel matrix can be used be introduced, which takes the place of the matrix Y E. If this matrix is used instead of the matrix Y E , estimates for the frequencies, damping constants, amplitudes and phases of the harmonic components in the measurement data are obtained, the accuracy of which can be compared to the accuracy that can be achieved with linear prediction problems by simultaneously combining forward and backward prediction achieved.
- the method according to the invention for spectral analysis can now be used for the identification of late ventricular potentials in multi-channel MKG or EKG data.
- This application uses the heartbeat as a trigger to extract a relevant data interval, the window of which is located in the terminal part of the QRS complex as shown in FIG. 1.
- To compensate for equal shares and linear trends one can e.g. B. adapt a straight line to the measurement data and then subtract it from the measurement data. This compensation of the direct components and linear trends is shown schematically in FIG. 2.
- the actual high-resolution is now connected to these preprocessing steps Spectral analysis on how it was already presented in this patent application.
- Fig. 1 shows a typical course of the human heartbeat.
- a number of known methods are available to the person skilled in the art for triggering the maximum of the QRS complex.
- a method which is particularly suitable for this is described in the international patent application PCT DE 92/00539, filed on June 30, 1992, published on February 18, 1993 (inventor: P. Strobach).
- the parameters delay ⁇ t and window length L defined in FIG. 1 can be chosen freely (eg by the doctor).
- the data section which lies in the area identified by the parameter L is extracted from all M observed channels.
- the extracted data sections are then approximated by a straight line in each channel, e.g. B. with the help of an adaptation by minimizing the sum of the squares of errors.
- the estimated straight lines are then subtracted from the extracted raw data. This procedure compensates for any direct components that may be present in all M channels and any linear trends that may be present (see FIG. 2).
- the modeling of the heart signal in the extracted data interval as a superimposition of possibly damped, sinusoidal vibrations corresponds to an estimate of the harmonic signal components in the post-QRS area of the heartbeat.
- the methods according to the invention for high-resolution multichannel spectral analysis which have already been described in detail, have proven to be particularly suitable for this application, since, as experiments show, all M sensors of the measurement setup register the same frequencies, but the amplitudes of these vibrations and the phases of these vibrations are different on all channels can.
- a criterion that is independent of the energy of the single heartbeat For this purpose, one squares the singular values and normalizes these squares to the sum of all squared singular values. The relative energy coefficients determined in this way are compared with a predetermined threshold.
- This predefined threshold can be determined using various statistical methods for signal detection, such as, for. B. in the article by M. Wax, T. Kailath, "Detection of Signals by Information Theoretic Criteria", IEEE Trans. Acoust., Speech, Signal Processing, vol. ASSP-33, pp. 387-392, April 1985. It is furthermore expedient to choose the threshold such that there is an even number of dominant singular values, since each real sinusoidal vibration is known to be the sum of two complex exponential vibrations.
- the method according to the invention has been extensively tested on magnetocardiographic data sets.
- the histograms shown in FIGS. 3 to 6 show the dominant frequencies found in four different data sets. The number of frequencies found is shown in a frequency interval above the frequency measured in hearts. The delay ⁇ t was 50 ms, the window length L was 90 ms. 30 measuring channels working in parallel were evaluated. In all four patients there are significant signal components in the range of 15 Hz, corresponding to the swinging out of the QRS complex and 50 Hz, corresponding to the mains frequency. In patients with late potentials, an accumulation of harmonic signal components of around 200 Hz can also be clearly identified (see FIGS. 3 and 4). This cluster in the upper frequency ranges is not present in healthy subjects (see Fig. 4 and 5). By displaying the frequencies found in histogram form, late potentials are therefore very easy to diagnose.
- the attending physician After the attending physician has examined the frequency histogram of a patient, he can look at the frequencies of interest in the data set, e.g. B. look at the synthetic signal.
- a temporal localization of the late potentials i. H. it is possible to state which late potentials occurred in which individual heartbeat.
- a spatial localization of the late potentials is also possible by evaluating the amplitudes and phases in the M sensor channels.
Landscapes
- Health & Medical Sciences (AREA)
- Life Sciences & Earth Sciences (AREA)
- Engineering & Computer Science (AREA)
- Cardiology (AREA)
- Animal Behavior & Ethology (AREA)
- General Health & Medical Sciences (AREA)
- Biophysics (AREA)
- Biomedical Technology (AREA)
- Heart & Thoracic Surgery (AREA)
- Medical Informatics (AREA)
- Molecular Biology (AREA)
- Surgery (AREA)
- Physics & Mathematics (AREA)
- Pathology (AREA)
- Public Health (AREA)
- Veterinary Medicine (AREA)
- Artificial Intelligence (AREA)
- Computer Vision & Pattern Recognition (AREA)
- Physiology (AREA)
- Psychiatry (AREA)
- Signal Processing (AREA)
- Measurement And Recording Of Electrical Phenomena And Electrical Characteristics Of The Living Body (AREA)
- Measuring And Recording Apparatus For Diagnosis (AREA)
- Complex Calculations (AREA)
Description
Die Erfindung betrifft ein Verfahren zur hochauflösenden Spektralanalyse bei mehrkanaligen Beobachtungen. Verfahren zur Spektralanalyse werden benötigt, um - möglicherweise gedämpfte - harmonische Anteile in Signalen verschiedenster Herkunft aufzufinden und zu identifizieren. Die Erfindung betrifft ferner die Verwendung eines solchen Verfahrens zur Detektion von ventrikulären Spätpotentialen in mehrkanaligen medizintechnischen Meßverfahren, bei denen vom Herzen stammende Signale ausgewertet werden. Wichtige Beispiele hierfür sind die Magnetokardiographie (MKG) oder die Elektrokardiographie (EKG).The invention relates to a method for high-resolution spectral analysis in multi-channel observations. Spectral analysis methods are required to find and identify - possibly damped - harmonic components in signals of various origins. The invention further relates to the use of such a method for the detection of late ventricular potentials in multichannel medical-technical measuring methods in which signals originating from the heart are evaluated. Important examples of this are magnetocardiography (MKG) or electrocardiography (EKG).
Bekannte Verfahren zur Spektralanalyse und ihre Verwendung zur Identifikation von Spätpotentialen wurden in den Veröffentlichungen von D.E. Balderson, et. al., "The detection, significance and effect of drugs upon ventricular late potentials", Automedia, vol. 13, pp. 67-96, 1991 und E.J. Berbari, R. Lazzara, "An Introduction to High-Resolution ECG Recordings of Cardiac Late Potentials", Arch. Intern. med., vol. 148, pp. 1859-1863, August 1988, beschrieben. Ferner geben die Aufsatze von S.M. Kay, S.L. Marple, "Spectrum Analysis - A Modern Perspective", Proceedings of the IEEE, Vol. 69, No. 11, November 1981, B.D. Rao, K.S. Arun, "Model based Processing of Signals: A State Space Approach", Proc. IEEE, vol. 80, pp. 283-309, Feb. 1992 sowie S. Haykin, Editor, "Nonlinear Methods of Spectral Analysis", Topics in Applied Physics, vol. 34, Springer-Verlag, 1979, eine gute Übersicht über die bekannten Verfahren zur Spektralanalyse.Known methods for spectral analysis and their use for the identification of late potentials have been described in the publications by D.E. Balderson, et. al., "The detection, significance and effect of drugs upon ventricular late potentials", Automedia, vol. 13, pp. 67-96, 1991 and E.J. Berbari, R. Lazzara, "An Introduction to High-Resolution ECG Recordings of Cardiac Late Potentials", Arch. Intern. med., vol. 148, pp. 1859-1863, August 1988. Furthermore, the essays by S.M. Kay, S.L. Marple, "Spectrum Analysis - A Modern Perspective", Proceedings of the IEEE, Vol. 69, No. November 11, 1981 B.D. Rao, K.S. Arun, "Model Based Processing of Signals: A State Space Approach", Proc. IEEE, vol. 80, pp. 283-309, Feb. 1992 and S. Haykin, Editor, "Nonlinear Methods of Spectral Analysis", Topics in Applied Physics, vol. 34, Springer-Verlag, 1979, a good overview of the known methods for spectral analysis.
Diese bekannten Verfahren haben jeweils bestimmte Stärken und Schwächen. Mit keinem dieser bekannten Verfahren ist es jedoch möglich, ventrikuläre Spätpotentiale in Einzelschlägen unter Verwendung mehrkanaliger Meßdaten nachzuweisen.These known methods each have certain strengths and weaknesses. It is not with any of these known methods however, it is possible to detect late ventricular potentials in single beats using multi-channel measurement data.
Der Erfindung liegt die Aufgabe zugrunde, ein Verfahren zur hochauflösenden Spektralanalyse bei mehrkanaligen Beobachtungen anzugeben, mit dem ventrikuläre Spätpotentiale in Einzelschlägen nachgewiesen werden können.The invention is based on the object of specifying a method for high-resolution spectral analysis in multi-channel observations, with which ventricular late potentials can be detected in single beats.
Diese Aufgabe wird erfindungsgemäß durch ein Spektralanalyseverfahren zur hochauflösenden Spektralanalyse bei mehrkanaligen Beobachtungen mit Merkmalen nach Anspruch 1, 2, 3 oder 4 gelöst. Mit dem Verfahren ist der Nachweis ventrikulärer Spätpotentiale in Einzelschlägen möglich. Das Verfahren bietet ferner die Möglichkeit zur räumlichen Lokalisierung pathologischer Veränderungen, die in ursächlichem Zusammenhang mit der Entstehung dieser Spätpotentiale stehen. Dieses Verfahren hat den bemerkenswerten Vorteil, völlig unabhängig von der Geometrie des verwendeten Sensorfeldes zu sein.This object is achieved according to the invention by a spectral analysis method for high-resolution spectral analysis in multi-channel observations with features according to claim 1, 2, 3 or 4. The method enables the detection of late ventricular potentials in single beats. The method also offers the possibility of spatially localizing pathological changes which are causally related to the development of these late potentials. This method has the remarkable advantage of being completely independent of the geometry of the sensor field used.
Vorteilhafte Weiterbildungen der Erfindung ergeben sich aus den Unteransprüchen.Advantageous developments of the invention result from the subclaims.
Figur 1 zeigt in schematischer Darstellung den zeitlichen Verlauf eines Herzschlagsignals, speziell den sogenannten QRS-Komplex und die ihm nachfolgende ST-Strecke.Figure 1 shows a schematic representation of the time course of a heartbeat signal, especially the so-called QRS complex and the ST segment following it.
Figur 2 zeigt in schematischer Darstellung die Kompensation eines Gleichanteils und eines linearen Trends im Meßsignal.Figure 2 shows a schematic representation of the compensation of a DC component and a linear trend in the measurement signal.
Die Figuren 3 und 4 zeigen mit dem erfindungsgemäßen Verfahren ermittelte Frequenzhistogramme von Patienten mit Spätpotentialen.FIGS. 3 and 4 show frequency histograms of patients with late potentials determined using the method according to the invention.
Die Figuren 5 und 6 zeigen mit dem erfindungsgemäßen Verfahren ermittelte Frequenzhistogramme von Patienten ohne Spätpotentiale.FIGS. 5 and 6 show frequency histograms of patients without late potential determined using the method according to the invention.
Dabei ist jeweils die Zahl der gefundenen Freuquenzen (Ordinate) über der Freuquenz in Hertz (Abszisse) aufgetragen.The number of frequencies found (ordinate) is plotted against the frequency in Hertz (abscissa).
Im folgenden wird die Erfindung anhand bevorzugter Ausführungsbeispiele und mit Hilfe der Figuren näher beschrieben.The invention is described in more detail below on the basis of preferred exemplary embodiments and with the aid of the figures.
Bei der Erfindung handelt es sich um ein neues, hochauflösendes Verfahren zur Schatzung mehrerer überlagerter, möglicherweise gedämpfter Exponentialschwingungen aus mehrkanaligen, rauschbehafteten Beobachtungen. Die erfindungsgemäße Lösung basiert auf einer Zustandsdarstellung der Meßsignale, wodurch das nichtlineare Schatzproblem linear parametrisiert wird. Bemerkenswerterweise ist das Verfahren unabhängig von der räumlichen Anordnung der zur Meßdatenerhebung verwendeten Sensoren und kann daher bei einer beliebigen, vorgegebenen aber möglicherweise unbekannten Geometrie des Sensorfeldes angewendet werden.The invention is a new, high-resolution method for estimating several superimposed, possibly damped exponential vibrations from multi-channel, noisy observations. The solution according to the invention is based on a state representation of the measurement signals, as a result of which the nonlinear treasure problem is linearly parameterized. Remarkably, the method is independent of the spatial arrangement of the sensors used for the measurement data acquisition and can therefore be used for any given, but possibly unknown geometry of the sensor field.
Das erfindungsgemäße Verfahren ist in seiner Anwendbarkeit nicht auf die Detektion von ventrikulären Spätpotentialen beschränkt, sondern kann in ähnlicher Weise auf Probleme der Radar- oder Sonartechnik, der Astronomie, der Vermessung von Mobilfunkkanälen oder auf andere Probleme der seismischen oder medizinischen Signalverarbeitung angewendet werden.The method according to the invention is not limited in its applicability to the detection of late ventricular potentials, but can be applied in a similar way to problems of radar or sonar technology, astronomy, the measurement of mobile radio channels or to other problems of seismic or medical signal processing.
Um das spektrale Schatzproblem mathematisch zu beschreiben, wird angenommen, daß M Sensoren die Summe aus p, möglicherweise gedämpften, Exponentialschwingungen empfangen. Nennt man das am i-ten Sensor (1≦ i ≦ M , mit M>1) zum Zeitpunkt n (mit 0≦ n ≦ N -1) beobachtete Signal y i ( n ), können die rauschfreien Beobachtungen wie folgt beschrieben werden:
Hierbei bezeichnet c ν, i die unbekannte komplexwertige Amplitude der ν-ten Exponentialschwingung im i-ten Kanal, und γν bzw. ων können als Dämpfung bzw. Frequenz der ν-ten Exponentialschwingung interpretiert werden. Offensichtlich können auch reelle Signale behandelt werden, da sich reelle harmonische Schwingungen als Summe zweier (komplexwertiger) Exponentialschwingungen darstellen lassen.To describe the spectral treasure problem mathematically, it is assumed that M sensors receive the sum of p, possibly damped, exponential vibrations. If one calls the signal y i ( n ) observed at the i-th sensor ( 1 ≦ i ≦ M , with M > 1 ) at time n (with 0 ≦ n ≦ N - 1 ), the noise-free observations can be described as follows:
Here, c ν, i denotes the unknown complex-value amplitude of the ν-th exponential oscillation in the i-th channel, and γ ν or ω ν can be interpreted as damping or frequency of the ν-th exponential oscillation. Obviously, real signals can also be treated, since real harmonic vibrations can be represented as the sum of two (complex-valued) exponential vibrations.
Im folgenden werden die Beobachtungen an den M Sensoren zu einem Datenvektor![]()
zusammengefaßt. Hierbei wird folgende Notation verwendet: Spaltenvektoren bzw. Matrizen werden durch fettgedruckte Klein- bzw. Großbuchstaben gekennzeichnet. Transponierte, bzw. transjugierte, Matrizen und Vektoren erhalten den Zusatz T bzw. H.In the following, the observations on the M sensors become a data vector ![]()
summarized. The following notation is used here: Column vectors and matrices are identified by bold lower and upper case letters. Transposed or transjugated matrices and vectors are given the addition T or H.
Ventrikuläre Spätpotentiale sind hochfrequente Signale mit kleinen Amplituden im terminalen Anteil des QRS-Komplexes und in der ST-Strecke des Herzschlags (s. Fig. 1). Diese pathologischen Signalanteile entsprechen einer regional verzögerten, in Abständen erfolgenden Erregungsausbreitungen. Sie werden oft bei Patienten mit ventrikulären Tachykardien erfaßt. Ihre Bedeutung für die Diagnostik liegt insbesondere in der Risikobeurteilung von Patienten mit ventrikulären Arrhythmien und in der Therapie bzw. Therapiekontrolle. Das erfindungsgemäße Verfahren liefert eine geeignete Methode zum Nachweis von Spätpotentialen aus mehrkanaligen Meßreihen.Ventricular late potentials are high-frequency signals with small amplitudes in the terminal part of the QRS complex and in the ST segment of the heartbeat (see FIG. 1). These pathological signal components correspond to a regionally delayed, intermittent spread of excitation. They are often seen in patients with ventricular tachycardia. Their importance for diagnostics lies particularly in the risk assessment of patients with ventricular arrhythmias and in therapy or therapy control. The method according to the invention provides a suitable method for the detection of late potentials from multi-channel series of measurements.
Spätpotentiale lassen sich sowohl in Elektrokardiogrammen (EKG) als auch in Magnetokardiogrammen (MKG) nachweisen, wobei bei beiden Meßarten prinzipiell die gleichen Verfahren angewendet werden können. Im Unterschied zum EKG stehen bei der biomagnetischen (MKG) Messungen jedoch sehr viel mehr Kanäle, typischerweise bis zu 37 gleichzeitig aufgezeichnete Meßkanäle, zur Verfügung. Da die Meßdaten in diesen Kanälen in hohem Maße korreliert sind, bieten sie die Voraussetzung für einen wesentlich zuverlässigeren Nachweis der Spätpotentiale als bei einkanaligen Meßverfahren.Late potentials can be demonstrated both in electrocardiograms (EKG) and in magnetocardiograms (MKG), whereby the same methods can be used in principle for both types of measurement. In contrast to the EKG, there are many more channels in biomagnetic (MKG) measurements, typically up to 37 simultaneously recorded Measuring channels. Since the measurement data in these channels are highly correlated, they offer the prerequisite for a much more reliable detection of the late potentials than with single-channel measurement methods.
Bisher werden Spätpotentiale mit Hilfe von Signalmittelungstechniken, bzw. einer auf der schnellen Fourier Transformation basierenden Frequenzanalyse identifiziert. Diese Verfahren sind jedoch nicht geeignet ventrikuläre Spätpotentiale in Einzelschlägen nachzuweisen.So far, late potentials have been identified using signal averaging techniques or a frequency analysis based on the fast Fourier transformation. However, these methods are not suitable for detecting late ventricular potentials in single beats.
Das erfindungsgemäße Verfahren kann in zwei Varianten ausgeführt werden, welche von zwei unterschiedlichen Zustandsdarstellungen der Signale ausgehen: Eine erste Variante des erfindungsgemäßen Verfahrens geht von der sogenannten erweiterten Zustandsdarstellung der Signale aus. Hierzu werden die Meßdaten in Form einer Matrix
dargestellt, wogegen die andere Variante des erfindungsgemäßen Verfahrens von der sogenannten traditionellen Zustandsdarstellung, gegeben durch die Matrix
ausgeht. Beide Darstellungen sind mathematisch äquivalent haben aber formal unterschiedliche Eigenschaften. In Abhängigkeit von den Werten der Parameter N, M und L wählt der Anwender des erfindungsgemäßen Verfahrens aus diesen beiden grundsätzlich gleichwertigen Alternativen diejenige Darstellung, die auf eine möglichst quadratische Matrix, d.h. eine Matrix mit möglichst kleiner Differenz zwischen Zeilen- und Spaltenzahl, fuhrt. Eine solche Wahl fuhrt nämlich zu optimalen numerischen Eigenschaften bei der Ausführung des erfindungsgemäßen Verfahrens.The method according to the invention can be carried out in two variants, which are based on two different state representations of the signals: A first variant of the method according to the invention is based on the so-called extended state representation of the signals. For this purpose, the measurement data are in the form of a matrix
represented, whereas the other variant of the method according to the invention of the so-called traditional state representation, given by the matrix
going out. Both representations are mathematically equivalent but have different properties. Depending on the values of the parameters N, M and L, the user of the method according to the invention chooses the representation from these two fundamentally equivalent alternatives, which leads to a square matrix as possible, ie a matrix with the smallest possible difference between the number of rows and columns. Such a choice leads to optimal numerical properties when carrying out the method according to the invention.
Im folgenden werden die einzelnen Verfahrensschritte zur Durchführung des erfindungsgemäßen Verfahrens unter Verwendung der oben eingeführten Notation ausführlich dargestellt.The individual method steps for carrying out the method according to the invention are detailed below using the notation introduced above.
Eine erste Variante des erfindungsgemäßen Verfahrens zur hochauflösenden Spektralanalyse ist dadurch gekennzeichnet, daß
- a) M zeitliche Folgen y i ( n ) von Meßdaten der Sensorkanäle 1≦ i ≦ M zu den
Zeitpunkten 0≦ n ≦ N -1 beobachtet und zu einer Matrix Y E der Form
- b) eine Singulärwertzerlegung Y E = U·Σ·V H der Matrix Y E durchgeführt wird, und die Singulärwerte einer Schwellwertoperation unterzogen werden, wodurch alle Singulärwerte von Y E , die dem Betrage nach kleiner sind als der Schwellwert, durch Null ersetzt werden und wonach alle p dominanten, d.h. nicht durch Null ersetzten, Singulärwerte von Y E in der Blockmatrix Σ₁ der Zerlegung

- c) diejenigen Matrizen Θ₁ und Θ₂ bestimmt werden, für die

- d) eine Matrix F bestimmt wird, die eine optimale Lösung des im allgemeinen überbestimmten Gleichungssystems Θ₁·F = Θ₂ ist, wobei die Imaginärteile der natürlichen Logarithmen der Eigenwerte von F die gesuchten spektralen Frequenzen und die Realteile der natürlichen Logarithmen der Eigenwerte von F mit diesen Frequenzen assoziierte Dämpfungskonstanten sind.
- a) M temporal sequences y i ( n ) of measurement data of the sensor channels 1 ≦ i ≦ M observed at the
times 0 ≦ n ≦ N - 1 and to a matrix Y E of the form - b) a singular value decomposition Y E = U · Σ · V H of the matrix Y E is carried out, and the singular values are subjected to a threshold value operation, whereby all singular values of Y E which are smaller in magnitude than the threshold value are replaced by zero and after which all p dominant, ie not replaced by zero, singular values of Y E in the block matrix Σ ₁ of the decomposition
- c) those matrices Θ ₁ and Θ ₂ are determined for
- d) a matrix F is determined, which is an optimal solution of the generally over-determined system of equations Θ ₁ · F = Θ ₂ , the imaginary parts of the natural logarithms of the eigenvalues of F the sought spectral frequencies and the real parts of the natural logarithms of the eigenvalues of F attenuation constants associated with these frequencies.
Somit ist diese erste Variante des erfindungsgemäßen Verfahrens ein Verfahren zur hochauflösenden Spektralanalyse, bei dem M zeitliche Folgen y i ( n ) von Meßdaten der Sensorkanäle 1≦ i ≦ M zu den Zeitpunkten 0≦ n ≦ N -1 beobachtet werden, dadurch gekennzeichnet, daß spektrale Frequenzen und mit diesen Frequenzen assoziierte Dämpfungskonstanten als Imaginär- bzw. Realteile der natürlichen Logarithmen der Eigenwerte einer Matrix F bestimmt werden, die als optimale Lösung eines im allgemeinen überbestimmten Gleichungssystems Θ₁·F = Θ₂ definiert ist, wobei die Matrizen Θ₁ und Θ₂ definiert sind durch die Beziehung
in der ϑ₁ und ϑ₂ jeweils die erste bzw. die letzte Blockmatrix bezeichnen, und in der die Matrizen Σ₁ und U₁ definiert sind durch eine approximative Singulärwertzerlegung
einer Matrix
wobei y( n ) = ( y₁( n ),..., y M ( n )) T , und wobei die approximative Singulärwertzerlegung aus einer ursprünglichen Singulärwertzerlegung Y E = U·Σ·V H dadurch ermittelt wird, daß die Singulärwerte einer Schwellwertoperation unterzogen werden, wodurch alle Singulärwerte von Y E , die dem Betrage nach kleiner sind als der Schwellwert, durch Null ersetzt werden und wonach alle p dominanten, d.h. nicht durch Null ersetzten, Singulärwerte von Y E in der Blockmatrix Σ₁ der approximativen Zerlegung enthalten sind.Thus, this first variant of the method according to the invention is a method for high-resolution spectral analysis, in which M temporal sequences y i ( n ) of measurement data of the sensor channels 1 ≦ i ≦ M are observed at the
in ϑ ₁ and ϑ ₂ denote the first and the last block matrix, respectively, and in which the matrices Σ ₁ and U₁ are defined by an approximate singular value decomposition
a matrix
where y ( n ) = ( y ₁ ( n ), ..., y M ( n )) T , and wherein the approximate singular value decomposition is determined from an original singular value decomposition Y E = U · Σ · V H in that the singular values are subjected to a threshold value operation, whereby all singular values of Y E , which are smaller than the threshold value, are replaced by zero and then all p dominant, ie not replaced by zero, singular values of Y E in the block matrix ₁ ₁ of the approximate decomposition are included.
Diese erste Variante des erfindungsgemäßen Verfahrens basiert auf der sogenannten erweiterten Zustandsdarstellung. Diese Variante ist einer Erweiterung zugänglich, welche noch dargestellt wird, und durch welche sich die Genauigkeit der Spektralanalyse bei Abwesenheit von Dämpfungserscheinungen (verschwindende Dämpfungskonstanten) weiter verbessern läßt.This first variant of the method according to the invention is based on the so-called extended state representation. This variant is accessible to an extension, which is still shown, and by means of which the accuracy of the spectral analysis can be further improved in the absence of attenuation phenomena (vanishing attenuation constants).
Eine grundsätzlich gleichwertige, formal andersartige, zweite Variante des erfindungsgemäßen Verfahrens zur hochauflösenden Spektralanalyse ist dadurch gekennzeichnet, daß
- a) M zeitliche Folgen y i ( n ) von Meßdaten der Sensorkanäle 1≦ i ≦ M zu
den Zeitpunkten 0≦ n ≦ N -1 beobachtet und zu einer Matrix Y T der Form
- b) eine Singulärwertzerlegung Y T = U·Σ·V H der Matrix Y T durchgeführt wird, und die Singulärwerte einer Schwellwertoperation unterzogen werden, wodurch alle Singulärwerte von Y T , die dem Betrage nach kleiner sind als der Schwellwert, durch Null ersetzt werden und wonach alle p dominanten, d.h. nicht durch Null ersetzten, Singulärwerte von Y T in der Blockmatrix Σ₁ der Zerlegung

- c) diejenigen Matrizen Θ₁ und Θ₂ bestimmt werden, für die

- d) eine Matrix F bestimmt wird, die eine optimale Lösung des im allgemeinen überbestimmten Gleichungssystems Θ₁·F = Θ₂ ist, wobei die Imaginärteile der natürlichen Logarithmen der Eigenwerte von F die gesuchten spektralen Frequenzen und die Realteile der natürlichen Logarithmen der Eigenwerte von F mit diesen Frequenzen assoziierte Dämpfungskonstanten sind.
- a) M temporal sequences y i ( n ) of measurement data of the sensor channels 1 ≦ i ≦ M observed at the
times 0 ≦ n ≦ N - 1 and to a matrix Y T of the form - b) a singular value decomposition Y T = U · Σ · V H of the matrix Y T is carried out, and the singular values are subjected to a threshold value operation, whereby all singular values of Y T which are smaller in magnitude than the threshold value are replaced by zero and after which all p dominant, ie not replaced by zero, singular values of Y T in the block matrix Σ ₁ of the decomposition
- c) those matrices Θ ₁ and Θ ₂ are determined for
- d) a matrix F is determined, which is an optimal solution of the generally over-determined system of equations Θ ₁ · F = Θ ₂ , the imaginary parts of the natural logarithms of the eigenvalues of F the sought spectral frequencies and the real parts of the natural logarithms of the eigenvalues of F attenuation constants associated with these frequencies.
Diese zweite Variante des erfindungsgemäßen Verfahrens läßt sich auch beschreiben als ein Verfahren zur hochauflösenden Spektralanalyse, bei dem M zeitliche Folgen y i ( n ) von Meßdaten der Sensorkanäle 1≦ i ≦ M zu den Zeitpunkten 0≦ n ≦ N -1 beobachtet werden, dadurch gekennzeichnet, daß spektrale Frequenzen und mit diesen Frequenzen assoziierte Dämpfungskonstanten als Imaginär- bzw. Realteile der natürlichen Logarithmen der Eigenwerte einer Matrix F bestimmt werden, die als optimale Lösung eines im allgemeinen überbestimmten Gleichungssystems Θ₁·F = Θ₂ definiert ist, wobei die Matrizen Θ₁ und Θ₂ definiert sind durch die Beziehung
in der ϑ₁ und ϑ₂ jeweils die erste bzw. die letzte Blockmatrix bezeichnen, und in der die Matrizen Σ₁ und U₁ definiert sind durch eine approximative Singulärwertzerlegung
einer Matrix
wobei y( n ) = ( y₁( n ),..., y M ( n )) T , und wobei die approximative Singulärwertzerlegung aus einer ursprünglichen Singulärwertzerlegung Y T = U·Σ·V H dadurch ermittelt wird, daß die Singulärwerte einer Schwellwertoperation unterzogen werden, wodurch alle Singulärwerte von Y T , die dem Betrage nach kleiner sind als der Schwellwert, durch Null ersetzt werden und wonach alle p dominanten, d.h. nicht durch Null ersetzten, Singulärwerte von Y T in der Blockmatrix Σ₁ der approximativen Zerlegung enthalten sind.This second variant of the method according to the invention can also be described as a method for high-resolution spectral analysis, in which M temporal sequences y i ( n ) of measurement data of the sensor channels 1 ≦ i ≦ M are observed at the
in ϑ ₁ and ϑ ₂ denote the first and the last block matrix, respectively, and in which the matrices Σ ₁ and U₁ are defined by an approximate singular value decomposition
a matrix
where y ( n ) = ( y ₁ ( n ), ..., y M ( n )) T , and wherein the approximate singular value decomposition is determined from an original singular value decomposition Y T = U · Σ · V H in that the singular values are subjected to a threshold value operation, whereby all singular values of Y T , which are smaller than the threshold value, are replaced by zero and then all p dominant, ie not replaced by zero, singular values of Y T in the block matrix Σ ₁ of the approximate decomposition are included.
Diese zweite Variante des erfindungsgemäßen Verfahrens basiert auf der sogenannten traditionellen Zustandsdarstellung.This second variant of the method according to the invention is based on the so-called traditional representation of the state.
Hiermit sind zwei Varianten des erfindungsgemäßen Verfahrens zur Bestimmung von spektralen Frequenzen und mit diesen assoziierten Dämpfungskonmstanten beschrieben worden. Die Figuren 3, 4, 5 und 6 zeigen in schematischer Weise verschiedene Frequenzhistogramme, die mit dem erfindungsgemäßen Verfahren ermittelt wurden. Dabei zeigen die Figuren 3 und 4 Frequenzhistogramme von Patienten mit Spätpotentialen. Diese sind an der Häufung hoher Frequenzanteile um ca. 200 Hertz leicht zu erkennen. In den Figuren 5 und 6, welche Frequenzhistogramme von Probanden ohne Spätpotentiale zeigen, fehlen diese Häufungen am oberen Ende des Spektrums.Two variants of the method according to the invention for determining spectral frequencies and damping constants associated therewith have been described herewith. FIGS. 3, 4, 5 and 6 schematically show various frequency histograms that were determined using the method according to the invention. 3 and 4 show frequency histograms of patients with late potentials. These can be easily recognized by the accumulation of high frequency components around 200 Hertz. In Figures 5 and 6, which show frequency histograms of subjects without late potential, these clusters are missing at the upper end of the spectrum.
In manchen Fällen ist der Anwender aber nicht nur an den Frequenzen und Dämpfungskonstanten, sondern auch an den Amplituden und Phasen der spektralen Schwingungen interessiert. Diese lassen sich in dem Fachmann bekannter Weise aus komplexwertigen Amplituden dieser Schwingungen berechnen.In some cases, the user is not only interested in the frequencies and attenuation constants, but also in the amplitudes and phases of the spectral vibrations. These can be calculated in a manner known to the person skilled in the art from complex-value amplitudes of these vibrations.
Eine bevorzugte Ausführungsform der Erfindung ist daher in einem Verfahren gemäß der oben beschriebenen ersten Variante zu sehen, die dadurch gekennzeichnet ist, daß die Matrix C der komplexwertigen Amplituden c j,i der mit den spektralen Frequenzen j = 1,...,p assoziierten Schwingungen im Sensorkanal i = 1,...,M durch die Ausführung der folgenden Schritte ermittelt wird:
- a) ausgehend von der Ähnlichkeitstransformation F = S·Λ·S⁻¹ der Matrix F und deren Diagonalform Λ werden die Matrizenaufgestellt und in Blockmatrizen


- b) aus diesen Darstellungen werden die Matrizen

- c) die Matrix C der komplexen Amplituden wird dann nach der Beziehung C = diag { h₁, h₂,..., h p}·X D ermittelt, wobei h T = ( h₁, h₂,..., h p ) den Mittelwert der Zeilenvektoren von

- a) starting from the similarity transformation F = S · Λ · S ⁻ ¹ of the matrix F and its diagonal shape Λ the matrices set up and in block matrices
- b) these representations become the matrices
- c) the matrix C of the complex amplitudes is then determined according to the relationship C = diag { h ₁ , h ₂ , ..., h p } · X D , where h T = ( h ₁ , h ₂ , ..., h p ) the mean of the row vectors of
Dazu gleichwertig ist eine entsprechende Weiterbildung der oben beschriebenen zweiten Variante des erfindungsgemäßen Verfahrens, die dadurch gekennzeichnet ist, daß die Matrix C der komplexwertigen Amplituden c j,i der mit den spektralen Frequenzen j = 1,...,p assoziierten Schwingungen im Sensorkanal i = 1,...,M durch die Ausführung der folgenden Schritte ermittelt wird:
- a) ausgehend von der Ähnlichkeitstransformation F = S·Λ·S⁻¹ der Matrix F und deren Diagonalform Λ werden die Matrizenaufgestellt und in Blockmatrizen


- b) aus diesen Darstellungen werden die Matrizen

- c) die Matrix C der komplexen Amplituden wird dann nach der Beziehung C T = H D · diag { x₁, x₂,..., x p } ermittelt, wobei x = ( x₁, x₂,..., x p ) T den Mittelwert der Spaltenvektoren von [w₁ Λ⁻¹·w₂ Λ⁻²·w₃ ··· Λ-( N - L )·w N - L +1 ] und H D den Mittelwert der Blockmatrizen in

- a) starting from the similarity transformation F = S · Λ · S ⁻ ¹ of the matrix F and its diagonal shape Λ the matrices set up and in block matrices
- b) these representations become the matrices
- c) the matrix C of the complex amplitudes is then {x ₁, x ₂, ... x p} is determined according to the relation C T = H D · diag, where x = (x ₁, x ₂, ..., x p ) T the mean of the column vectors of [ w₁ Λ⁻ ¹ · w₂ Λ⁻ ² · w₃ ··· Λ - ( N - L ) · w N - L + 1 ] and H D the mean of the block matrices in
Aus den komplexwertigen Amplituden der spektralen Frequenzen lassen sich die rellen Schwingungsamplituden und die zugehörigen Phasen leicht bestimmen. Bei bekannter Geometrie des Sensorfeldes können aus diesen Werten die beobachteten, von Meßfehlern befreiten Signale rekonstruiert und an einem geeigneten Ausgabegerät, z.B. an einem Monitor, dargestellt werden. Aus den Phasen der Schwingungen und deren Verschiebungen zwischen den einzelnen Sensoren kann der Ort der Entstehung bestimmter Signalanteile sehr genau rekonstruiert werden. Hierdurch ist es beispielsweise möglich, den Herkunftsort eines pathologischen Signalanteils aus einem einzigen QRS-Komplex eines einzelnen Herzschlags im Myokard genau zu bestimmen.The real vibration amplitudes and the associated phases can easily be determined from the complex-valued amplitudes of the spectral frequencies. If the geometry of the sensor field is known, the observed, from Measurement errors freed signals are reconstructed and displayed on a suitable output device, for example on a monitor. The location of the generation of certain signal components can be reconstructed very precisely from the phases of the vibrations and their shifts between the individual sensors. This makes it possible, for example, to precisely determine the origin of a pathological signal component from a single QRS complex of a single heartbeat in the myocardium.
In allen beschriebenen Verfahrensvarianten ist es besonders vorteilhaft, die Matrix F mit Hilfe der Methode der kleinsten Fehlerquadrate oder mit Hilfe der Methode der kleinsten Gesamtfehlerquadrate (total least squares) zu ermitteln. Die allgemein bekannte mathematische Literatur für Ingenieure gibt dem Fachmann die hierzu nötige Anleitung.In all of the described method variants, it is particularly advantageous to determine the matrix F using the least squares method or using the least least squares method. The well-known mathematical literature for engineers gives the specialist the necessary instructions.
Die mit Hilfe des erfindungsgemäßen Verfahrens geschätzten komplexen Amplituden und Eigenwerte sind wesentlich genauer als die mit bekannten Verfahren zur Spektralanalyse bestimmten Werte. Die Schätzergebnisse des erfindungsgemäßen Verfahrens sind des weiteren wegen der nummerisch äußerst stabilen mathematischen Methoden, wie z. B. der Singulärwertzerlegung und der Eigenwertzerlegung, äußerst robust gegen Rauschsignale die den Meßsignalen überlagert sein können.The complex amplitudes and eigenvalues estimated with the aid of the method according to the invention are considerably more precise than the values determined with known methods for spectral analysis. The estimation results of the method according to the invention are furthermore due to the numerically extremely stable mathematical methods such as e.g. B. the singular value decomposition and the eigenvalue decomposition, extremely robust against noise signals which can be superimposed on the measurement signals.
Im Falle von ungedämpften Exponentialschwingungen (verschwindende Dämpfungskonstanten) bietet die erweiterte Zustandsdarstellung eine Möglichkeit, die Schätzungsgenauigkeit zusätzlich zu verbessern. Ungedämpfte Exponentialschwingungen sind durch verschwindende Realteile der logarithmierten Eigenwerte der Matrix F charakterisiert. In diesem Fall kann eine erweiterte Block-Hankel-Matrix
eingeführt werden, welche anstelle der Matrix Y E tritt. Verwendet man diese Matrix anstelle der Matrix Y E , so ergeben sich Schätzungen für die Frequenzen, Dämpfungskonstanten, Amplituden und Phasen der harmonischen Anteile in den Meßdaten, deren Genauigkeit, vergleichbar ist mit der Genauigkeit, die man bei linearen Prädiktionsproblemen durch gleichzeitige Kombination von Vorwärts- und Rückwärtsprädiktion erreicht. In diesem Fall ist es auch angebracht, das überbestimmte Gleichungssystem zur Bestimmung der Matrix F mit Hilfe eines Optimierungsverfahrens unter Verwendung von Nebenbedingungen zu lösen, welche gewährleisten, daß die logarithmierten Eigenwerte der Matrix F verschwindende Realteile aufweisen. Auf diese Weise erhalt man eine unitäre Matrix F, deren logarithmierte Eigenwerte - wie gewünscht - automatisch rein imaginär sind.In the case of undamped exponential vibrations (vanishing damping constants), the expanded status display offers the possibility to additionally improve the estimation accuracy. Undamped exponential vibrations are characterized by vanishing real parts of the logarithmic eigenvalues of the matrix F. In this case, an extended block Hankel matrix can be used
be introduced, which takes the place of the matrix Y E. If this matrix is used instead of the matrix Y E , estimates for the frequencies, damping constants, amplitudes and phases of the harmonic components in the measurement data are obtained, the accuracy of which can be compared to the accuracy that can be achieved with linear prediction problems by simultaneously combining forward and backward prediction achieved. In this case, it is also appropriate to solve the overdetermined system of equations for determining the matrix F with the aid of an optimization method using secondary conditions, which ensure that the logarithmic eigenvalues of the matrix F have vanishing real parts. In this way, one obtains a unitary matrix F , whose logarithmic eigenvalues - as desired - are automatically purely imaginary.
Das erfindungsgemäße Verfahren zur Spektralanalyse läßt sich nun zur Identifikation von ventrikulären Spätpoentialen in mehrkanaligen MKG- oder EKG-Daten anwenden. Diese Anwendung benutzt den Herzschlag als Trigger zur Extraktion eines relevanten Datenintervalls, dessen Fenster sich wie in Fig. 1 dargestellt, im terminalen Teil des QRS-Komplexes befindet. In einem weiteren Schritt der Vorverarbeitung ist es häufig angebracht, Gleichanteile und lineare Trends in den Meßsignalen unter Anwendung bekannter Vorverarbeitungsverfahren zu eliminieren. Zur Kompensation von Gleichanteilen und linearen Trends kann man z. B. eine Gerade an die Meßdaten anpassen und diese anschließend von den Meßdaten subtrahieren. Diese Kompensation der Gleichanteile und linearen Trends ist schematisch in Fig. 2 dargestellt. An diese Vorverarbeitungsschritte schließt sich nun die eigentliche hochauflösende Spektralanalyse an, wie sie in dieser Patentanmeldung bereits dargestellt wurde.The method according to the invention for spectral analysis can now be used for the identification of late ventricular potentials in multi-channel MKG or EKG data. This application uses the heartbeat as a trigger to extract a relevant data interval, the window of which is located in the terminal part of the QRS complex as shown in FIG. 1. In a further step of preprocessing, it is often appropriate to eliminate constant components and linear trends in the measurement signals using known preprocessing methods. To compensate for equal shares and linear trends one can e.g. B. adapt a straight line to the measurement data and then subtract it from the measurement data. This compensation of the direct components and linear trends is shown schematically in FIG. 2. The actual high-resolution is now connected to these preprocessing steps Spectral analysis on how it was already presented in this patent application.
Fig. 1 zeigt einen typischen Verlauf des menschlichen Herzschlags. Zur Triggerung des Maximums des QRS-Komplexes steht dem Fachmann eine Reihe von bekannten Verfahren zur Verfügung. Ein hierfür besonders geeignetes Verfahren wird in der internationalen Patentanmeldung PCT DE 92/00539, angemeldet am 30.6.92, offengelegt am 18.2.93 (Erfinder: P. Strobach), beschrieben. Die in Fig. 1 definierten Parameter Verzögerung Δ t und Fensterlänge L können (z. B. vom Arzt) frei gewählt werden. Aus allen M beobachteten Kanälen wird im ersten Schritt des erfindungsgemäßen Verfahrens der Datenausschnitt, welcher in dem durch den Paramter L (Fensterlänge) gekennzeichneten Bereich liegt, extrahiert.Fig. 1 shows a typical course of the human heartbeat. A number of known methods are available to the person skilled in the art for triggering the maximum of the QRS complex. A method which is particularly suitable for this is described in the international patent application PCT DE 92/00539, filed on June 30, 1992, published on February 18, 1993 (inventor: P. Strobach). The parameters delay Δ t and window length L defined in FIG. 1 can be chosen freely (eg by the doctor). In the first step of the method according to the invention, the data section which lies in the area identified by the parameter L (window length) is extracted from all M observed channels.
Danach werden in jedem Kanal die extrahierten Datenausschnitte durch eine Gerade approximiert, z. B. mit Hilfe einer Anpassung durch Minimierung der Summe der Fehlerquadrate. Die geschätzten Geraden subtrahiert man anschließend von den extrahierten Rohdaten. Durch diese Vorgehensweise werden in allen M Kanälen möglicherweise vorhandene Gleichanteile und ggf. vorhandene lineare Trends kompensiert (s. Fig. 2).The extracted data sections are then approximated by a straight line in each channel, e.g. B. with the help of an adaptation by minimizing the sum of the squares of errors. The estimated straight lines are then subtracted from the extracted raw data. This procedure compensates for any direct components that may be present in all M channels and any linear trends that may be present (see FIG. 2).
Die Modellierung des Herzsignals im extrahierten Datenintervall als Überlagerung möglicherweise gedämpfter, sinusförmiger Schwingungen entspricht einer Schätzung der harmonischen Signalanteile im Post-QRS-Bereich des Herzschlags. Für diese Anwendung haben sich die bereits ausführlich dargestellten erfindungsgemäßen Verfahren zur hochauflösenden Mehrkanalspektralanalyse als besonders geeignet herausgestellt, da wie Experimente zeigen, alle M Sensoren des Meßaufbaus die gleichen Frequenzen registrieren, die Amplituden dieser Schwingungen und auch die Phasen dieser Schwingungen jedoch an allen Kanälen unterschiedlich sein können.The modeling of the heart signal in the extracted data interval as a superimposition of possibly damped, sinusoidal vibrations corresponds to an estimate of the harmonic signal components in the post-QRS area of the heartbeat. The methods according to the invention for high-resolution multichannel spectral analysis, which have already been described in detail, have proven to be particularly suitable for this application, since, as experiments show, all M sensors of the measurement setup register the same frequencies, but the amplitudes of these vibrations and the phases of these vibrations are different on all channels can.
Um die bei der Singulärwertzerlegung der Blockmatrizen Y dominanten Singulärwerte bestimmen zu können, ist es zweckmäßig ein von der Energie des Einzelherzschlags unabhängiges Kriterium zu verwenden: Hierzu quadriert man die Singulärwerte und normiert diese Quadrate auf die Summe aller quadrierten Singulärwerte. Die so bestimmten relativen Energiekoeffizienten werden mit einer vorgegebenen Schwelle verglichen. Diese vorgegebene Schwelle kann mit verschiedenen statistischen Verfahren zur Signaldetektion bestimmt werden, wie sie z. B. in dem Aufsatz von M. Wax, T. Kailath, "Detection of Signals by Information Theoretic Criteria", IEEE Trans. Acoust., Speech, Signal Processing, vol. ASSP-33, pp. 387-392, April 1985, ausführlich dargestellt sind. Es ist weiterhin zweckmäßig die Schwelle so zu wählen, daß sich eine gerade Anzahl von dominanten Singulärwerten ergibt, den jede reelle sinusförmige Schwingung ist bekanntlich die Summe zweier komplexer Exponentialschwingungen.In order to be able to determine the singular values that are dominant in the singular value decomposition of the block matrices Y, it is advisable to use a criterion that is independent of the energy of the single heartbeat: For this purpose, one squares the singular values and normalizes these squares to the sum of all squared singular values. The relative energy coefficients determined in this way are compared with a predetermined threshold. This predefined threshold can be determined using various statistical methods for signal detection, such as, for. B. in the article by M. Wax, T. Kailath, "Detection of Signals by Information Theoretic Criteria", IEEE Trans. Acoust., Speech, Signal Processing, vol. ASSP-33, pp. 387-392, April 1985. It is furthermore expedient to choose the threshold such that there is an even number of dominant singular values, since each real sinusoidal vibration is known to be the sum of two complex exponential vibrations.
Um die Ergebnisse des Spektralanalyseverfahrens in komfortabler Weise visuell beurteilen zu können, ist es zweckmäßig, die geschätzten harmonischen Signalanteile für jeden analysierten Herzschlag durch Überlagerung zu einem synthetischen Herzschlagsignal zusammenzusetzen und dieses synthetische Signal in geeigneter Weise unter Verwendung herkömmlicher Ausgabegeräte anzuzeigen. Diese Maßnahme ist zwar nicht unbedingt erforderlich, ermöglicht aber eine komfortable optische Auswertung der Schätzergebnisse. Auf diese Weise können Spätpotentiale sowohl räumlich als auch zeitlich im Einzelschlag lokalisiert werden.In order to be able to visually assess the results of the spectral analysis method in a convenient manner, it is expedient to combine the estimated harmonic signal components for each analyzed heartbeat by superimposing them into a synthetic heartbeat signal and to display this synthetic signal in a suitable manner using conventional output devices. Although this measure is not absolutely necessary, it enables a comfortable visual evaluation of the estimation results. In this way, late potentials can be localized both spatially and temporally in a single shot.
Das erfindungsgemäße Verfahren wurde umfangreich an magnetokardiographischen Datensätzen erprobt. Die in den Figuren 3 bis 6 dargestellten Histogramme zeigen die in vier verschiedenen Datensätzen gefundenen dominanten Frequenzen. Hierbei ist die Zahl der gefundenen Frequenzen in einem Frequenzintervall über der Frequenz gemessen in Herz dargestellt. Die Verzögerung Δ t betrug hierbei 50 ms, die Fensterlänge L betrug 90 ms. Es wurden 30 parallel arbeitende Meßkanäle ausgewertet. Bei allen vier Patienten treten deutliche Signalanteile im Bereich von 15 Hz, entsprechend dem Ausschwingen des QRS-Komplexes und 50 Hz, entsprechend der Netzfrequenz auf. Bei Patienten mit Spätpotentialen ist zusätzlich eine Häufung von harmonischen Signalanteilen um etwa 200 Hz eindeutig zu erkennen (s. Fig. 3 und 4). Diese Häufung in den oberen Frequenzbereichen ist bei gesunden Probanden nicht vorhanden (s. Fig. 4 und 5). Durch die Darstellung der gefundenen Frequenzen in Histogrammform sind Spätpotentiale deshalb sehr leicht diagnostizierbar.The method according to the invention has been extensively tested on magnetocardiographic data sets. The histograms shown in FIGS. 3 to 6 show the dominant frequencies found in four different data sets. The number of frequencies found is shown in a frequency interval above the frequency measured in hearts. The delay Δ t was 50 ms, the window length L was 90 ms. 30 measuring channels working in parallel were evaluated. In all four patients there are significant signal components in the range of 15 Hz, corresponding to the swinging out of the QRS complex and 50 Hz, corresponding to the mains frequency. In patients with late potentials, an accumulation of harmonic signal components of around 200 Hz can also be clearly identified (see FIGS. 3 and 4). This cluster in the upper frequency ranges is not present in healthy subjects (see Fig. 4 and 5). By displaying the frequencies found in histogram form, late potentials are therefore very easy to diagnose.
Nachdem der behandelnde Arzt das Frequenzhistogramm eines Patienten begutachtet hat, kann er sich die ihn interessierenden Frequenzen im Datensatz z. B. anhand des synthetischen Signals anschauen. Hierdurch ist eine zeitliche Lokalisierung der Spätpotentiale, d. h. die Angabe, welche Spätpotentiale in welchem einzelnen Herzschlag aufgetreten sind, möglich. Durch Auswertung der Amplituden und Phasen in den M Sensorkanälen ist ferner eine räumliche Lokalisierung der Spätpotentiale möglich.After the attending physician has examined the frequency histogram of a patient, he can look at the frequencies of interest in the data set, e.g. B. look at the synthetic signal. As a result, a temporal localization of the late potentials, i. H. it is possible to state which late potentials occurred in which individual heartbeat. A spatial localization of the late potentials is also possible by evaluating the amplitudes and phases in the M sensor channels.
In dieser Patentanmeldung wurden die folgenden Veröffentlichungen zitiert:The following publications were cited in this patent application:
D.E. Balderson, et. al., "The detection, significance and effect of drugs upon ventricular late potentials", Automedia, vol. 13, pp. 67-96, 1991.D.E. Balderson, et. al., "The detection, significance and effect of drugs upon ventricular late potentials", Automedia, vol. 13, pp. 67-96, 1991.
E.J. Berbari, R. Lazzara, "An Introduction to High-Resolution ECG Recordings of Cardiac Late Potentials", Arch. Intern. med., vol. 148, pp. 1859-1863, August 1988.E.J. Berbari, R. Lazzara, "An Introduction to High-Resolution ECG Recordings of Cardiac Late Potentials", Arch. Intern. med., vol. 148, pp. 1859-1863, August 1988.
S.M. Kay, S.L. Marple, "Spectrum Analysis - A Modern Perspective", Proceedings of the IEEE, Vol. 69, No. 11, November 1981.SM Kay, SL Marple, "Spectrum Analysis - A Modern Perspective", Proceedings of the IEEE, Vol. 69, No. November 11, 1981.
B.D. Rao, K.S. Arun, "Model based Processing of Signals: A State Space Approach", Proc. IEEE, vol. 80, pp. 283-309, Feb. 1992.B.D. Rao, K.S. Arun, "Model Based Processing of Signals: A State Space Approach", Proc. IEEE, vol. 80, pp. 283-309, Feb. 1992.
S. Haykin, Editor, "Nonlinear Methods of Spectral Analysis", Topics in Applied Physics, vol. 34, Springer-Verlag, 1979.S. Haykin, Editor, "Nonlinear Methods of Spectral Analysis", Topics in Applied Physics, vol. 34, Springer Verlag, 1979.
Internationale Patentanmeldung PCT DE 92/00539, angemeldet am 30.6.92, offengelegt am 18.2.93 (Erfinder: P. Strobach)International patent application PCT DE 92/00539, filed on June 30, 1992, published on February 18, 1993 (inventor: P. Strobach)
M. Wax, T. Kailath, "Detection of Signals by Information Theoretic Criteria", IEEE Trans. Acoust., Speech, Signal Processing, vol. ASSP-33, pp. 387-392, April 1985.M. Wax, T. Kailath, "Detection of Signals by Information Theoretic Criteria", IEEE Trans. Acoust., Speech, Signal Processing, vol. ASSP-33, pp. 387-392 April 1985.
Claims (17)
- Method of spectral analysis for multichannel high-resolution spectral analysis, characterized in thata) M chronological sequences y i (n) of measured data of the sensor channels 1≦ i ≦ M , with M>1, are observed at the instants 0≦ n ≦ N -1 and are combined into a matrix Y E of the formula
 b) a singular value resolution Y E = U·Σ·V H of the matrix Y E is carried out, and the singular values are subjected to a threshold value operation, whereby all singular values of Y E which in terms of magnitude are smaller than the threshold value, are replaced by zero and according to which all p singular values of Y E which are dominant, ie. not replaced by zero, are included in the block matrix Σ₁ of the resolution
 c) those matrices ϑ₁ and ϑ₂ are determined for which
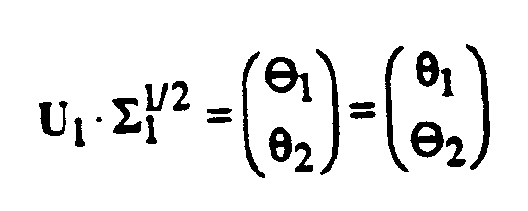 d) a matrix F is determined, which is an optimal solution of the system of equations ϑ₁·F = ϑ₂ which is in general defined with redundancy, the imaginary parts of the natural logarithms of the eigenvalues of F being the sought spectral frequencies and the real parts of the natural logarithms of the eigenvalues of F being attenuation constants associated with these frequencies.
 - Method of spectral analysis for multichannel high-resolution spectral analysis, in which M chronological sequences y i ( n ) of measured data of the sensor channels 1≦ i ≦ M , with M>1, are observed at the instants 0≦ n ≦ N -1 characterized in that spectral frequencies and attenuation constants associated with these frequencies are determined as imaginary and respectively real parts of the natural logarithms of the eigenvalues of a matrix F, which is defined as optimal solution of a system of equations ϑ₁·F = ϑ₂ which is in general defined with redundancy, the matrices ϑ₁ and ϑ₂ being defined by the relation


- Method for spectral analysis for multichannel high-resolution spectral analysis, characterized in thata) M chronological sequences y i ( n ) of measured data of the sensor channels 1≦ i ≦ M , with M>1, are observed at the instants 0≦ n ≦ N -1 and are combined into a matrix Y T of the form
 b) a singular value resolution Y T = U·Σ·V H of the matrix Y T is carried out, and the singular values are subjected to a threshold value operation, whereby all singular values of Y T which in terms of magnitude are smaller than the threshold value are replaced by zero and according to which all p singular values are Y T which are dominant, ie. not replaced by zero, are included in the block matrix Σ₁ of the resolution
 c) those matrices ϑ₁ and ϑ₂ are determined for which
 d) a matrix F is determined, which is an optimal solution of the system of equations ϑ₁·F = ϑ₂ which is in general defined with redundancy, the imaginary parts of the natural logarithms of the eigenvalues of F being the sought spectral frequencies and the real parts of the natural logarithms of the eigenvalues of F being attenuation constants associated with these frequencies.
 - Method of spectral analysis for multichannel high-resolution spectral analysis, in which M chronological sequences y i ( n ) of measured data of the sensor channels 1 ≦ i ≦ M , with M>1, are observed at the instants 0 ≦ n ≦ N - 1 , characterized in that spectral frequencies and attenuation constants associated with these frequencies are determined as imaginary and respectively real parts of the natural logarithms of the eigenvalues of a matrix F, which is defined as optimal solution of a system of equations ϑ₁·F = ϑ₂ which is in general defined with redundancy, the matrices ϑ₁ and ϑ₂ being defined by the relation


- Method according to one of Claims 1 or 2, characterized in that the matrix C of the complex-value amplitudes c j,i of the oscillations, associated with the spectral frequencies j = 1,...,p, in the sensor channel i = 1,...,M is determined by the execution of the following steps:a) proceeding from the similarity transformation F = S·Λ·S⁻¹ of the matrix F and its diagonal form Λ, the matricesare set up and subdivided into block matrices

 b) the matrices
 c) the matrix C of the complex amplitudes is then determined in accordance with the relation C= diag { h₁, h₂,..., h p }·X D , where h T = ( h₁, h₂,..., h p ) designates the mean value of the row vectors of
- Method according to one of Claims 3 or 4, characterized in that the matrix C of the complex-value amplitudes c j,i of the oscillations, associated with the spectral frequencies j = 1,...,p, in the sensor channel i = 1,...,M is determined by the execution of the following steps:a) proceeding from the similarity transformation F = S·Λ·S⁻¹ of the matrix F and its diagonal form Λ, the matricesare set up and are subdivided into block matrices

 b) the matrices
 c) the matrix C of the complex amplitudes is then determined in accordance with the relation C T =H D · diag { x₁, x₂,..., x p }, where x=( x₁, x₂,..., x p ) T designates the mean value of the column vectors of [w₁ Λ⁻¹·w₂ Λ⁻²·w₃ ··· Λ-( N - L )·w N - L +1 ] and H D designates the mean value of the block matrices in
- Method according to one of the preceding claims, in which the matrix F is determined with the aid of the method of least squares.
- Method according to one of the preceding claims, in which the matrix F is determined with the aid of the method of total least squares.
- Method according to one of Claims 1 or 2, in which all attenuation constants are zero and, in place of the matrix Y E , the matrix

- Method according to Claim 9, in which the matrix F is determined subject to the secondary condition that all eigenvalues are of the magnitude one.
- Method according to one of the preceding claims, characterized in that said method is used for the detection of ventricular late potentials in multichannel medicotechnical measurement methods.
- Use according to Claim 11, characterized in that the measured data are obtained by multichannel, chronological sampling of signals originating from the heart, in the terminal portion of the QRS complex and in the ST section.
- Use according to Claim 12, characterized in that before carrying out the high-resolution spectral analysis constant components and linear trends in the measured data are compensated.
- Use according to one of Claims 11 to 13 in conjunction with one of Claims 5 or 6, characterized in that a sensor array having a defined spatial arrangement of the individual sensors is used, and in that the spatial position of a source of specified signal components is determined from the complex amplitudes or, in a manner equivalent thereto, from the real amplitudes and phases of the oscillations, on the basis of the known spatial arrangement of the individual sensors.
- Use according to Claim 14, in which pathological regions in the heart muscle which are associated with the creation of late potentials are localized.
- Use according to one of the preceding claims in conjunction with one of Claims 5 or 6 for the visualization of the harmonic components in the measured data, characterized in that a synthetic signal which is generated by in-phase superposition of the determined oscillations is represented on an output device.
- Electronic data-processing system for carrying out a multichannel high-resolution spectral analysis by a method according to one of Claims 1 to 10.
Priority Applications (4)
| Application Number | Priority Date | Filing Date | Title |
|---|---|---|---|
| DE59300252T DE59300252D1 (en) | 1993-08-13 | 1993-08-13 | Process for high-resolution spectral analysis in multi-channel observations. |
| EP93113022A EP0638869B1 (en) | 1993-08-13 | 1993-08-13 | Procedure for a high-resolution spectral analysis for multichannel observations |
| US08/290,588 US5560367A (en) | 1993-08-13 | 1994-08-15 | Method for high-resolution spectral analysis in multi channel observations using a singular valve decomposition (SVD) matrix technique |
| JP6191602A JPH0798346A (en) | 1993-08-13 | 1994-08-15 | High-resolution spectrum analysis |
Applications Claiming Priority (1)
| Application Number | Priority Date | Filing Date | Title |
|---|---|---|---|
| EP93113022A EP0638869B1 (en) | 1993-08-13 | 1993-08-13 | Procedure for a high-resolution spectral analysis for multichannel observations |
Publications (2)
| Publication Number | Publication Date |
|---|---|
| EP0638869A1 EP0638869A1 (en) | 1995-02-15 |
| EP0638869B1 true EP0638869B1 (en) | 1995-06-07 |
Family
ID=8213175
Family Applications (1)
| Application Number | Title | Priority Date | Filing Date |
|---|---|---|---|
| EP93113022A Expired - Lifetime EP0638869B1 (en) | 1993-08-13 | 1993-08-13 | Procedure for a high-resolution spectral analysis for multichannel observations |
Country Status (4)
| Country | Link |
|---|---|
| US (1) | US5560367A (en) |
| EP (1) | EP0638869B1 (en) |
| JP (1) | JPH0798346A (en) |
| DE (1) | DE59300252D1 (en) |
Cited By (1)
| Publication number | Priority date | Publication date | Assignee | Title |
|---|---|---|---|---|
| CN108680874A (en) * | 2018-04-25 | 2018-10-19 | 浙江工业大学 | A kind of low-intensity magnetic field method for reconstructing based on pulse pump formula atomic magnetic force meter |
Families Citing this family (21)
| Publication number | Priority date | Publication date | Assignee | Title |
|---|---|---|---|---|
| FR2749942B1 (en) * | 1996-06-18 | 1998-09-11 | Sextant Avionique | OPTICAL VELOCIMETRIC PROBE |
| WO1999010757A1 (en) * | 1997-08-22 | 1999-03-04 | Siemens Aktiengesellschaft | Method and device for measuring distance and speed |
| US6272377B1 (en) | 1999-10-01 | 2001-08-07 | Cardiac Pacemakers, Inc. | Cardiac rhythm management system with arrhythmia prediction and prevention |
| US7127290B2 (en) * | 1999-10-01 | 2006-10-24 | Cardiac Pacemakers, Inc. | Cardiac rhythm management systems and methods predicting congestive heart failure status |
| US8000767B2 (en) * | 2004-01-20 | 2011-08-16 | Board Of Trustees Of The University Of Illinois | Magneto-optical apparatus and method for the spatially-resolved detection of weak magnetic fields |
| US7996075B2 (en) * | 2004-10-20 | 2011-08-09 | Cardionet, Inc. | Monitoring physiological activity using partial state space reconstruction |
| US7333392B2 (en) * | 2005-09-19 | 2008-02-19 | Saudi Arabian Oil Company | Method for estimating and reconstructing seismic reflection signals |
| DE102006022056A1 (en) * | 2006-02-20 | 2007-08-30 | Fraunhofer-Gesellschaft zur Förderung der angewandten Forschung e.V. | Device for determining spectral ratio between two signals with two spectrums, which depends on biological size, has computer for computation of wave ratio between spectral value of former spectrum |
| DE102006022055A1 (en) * | 2006-02-20 | 2007-08-30 | Fraunhofer-Gesellschaft zur Förderung der angewandten Forschung e.V. | Device for reducing noise component in time-discrete signal, has primary provisioning unit for provisioning time-discrete signal with noise component, where secondary provisioning device provisions primary time-discrete reference signal |
| DE102006022120A1 (en) * | 2006-02-20 | 2007-09-06 | Fraunhofer-Gesellschaft zur Förderung der angewandten Forschung e.V. | Spread spectrum method for the determination of vital parameters |
| US7729753B2 (en) * | 2006-03-14 | 2010-06-01 | Cardionet, Inc. | Automated analysis of a cardiac signal based on dynamical characteristics of the cardiac signal |
| US8271070B2 (en) * | 2007-10-04 | 2012-09-18 | Siemens Aktiengesellschaft | Method for monitoring myocardial wall thickness |
| US8200319B2 (en) * | 2009-02-10 | 2012-06-12 | Cardionet, Inc. | Locating fiducial points in a physiological signal |
| US20120221296A1 (en) * | 2011-02-26 | 2012-08-30 | Liang Fu | Method for signal decomposition |
| JP5600822B2 (en) * | 2012-01-20 | 2014-10-08 | フラウンホッファー−ゲゼルシャフト ツァ フェルダールング デァ アンゲヴァンテン フォアシュンク エー.ファオ | Apparatus and method for speech encoding and decoding using sinusoidal permutation |
| US8788024B1 (en) * | 2013-03-15 | 2014-07-22 | Apn Health, Llc | Multi-channel cardiac measurements |
| US9078572B2 (en) | 2013-10-30 | 2015-07-14 | Apn Health, Llc | Heartbeat detection and categorization |
| US9078575B2 (en) | 2013-10-30 | 2015-07-14 | Apn Health, Llc | Heartbeat categorization |
| US9314179B1 (en) | 2014-09-25 | 2016-04-19 | Apn Health, Llc | Time transformation of local activation times |
| US10357168B2 (en) | 2016-03-07 | 2019-07-23 | Apn Health, Llc | Time transformation of local activation times |
| CN112953468A (en) * | 2021-01-26 | 2021-06-11 | 浙江工业大学 | Multi-exponential decay sinusoidal signal feedback type under-sampling hardware implementation method |
Family Cites Families (10)
| Publication number | Priority date | Publication date | Assignee | Title |
|---|---|---|---|---|
| SU1194391A1 (en) * | 1983-08-04 | 1985-11-30 | Центральная Научно-Исследовательская Лаборатория 4-Го Главного Управления При Министерстве Здравоохранения Ссср | Method of predicting cardiorrhexis of patients with acute myocardial infarction in case of anterior localization of necrosis focus |
| US4974162A (en) * | 1987-03-13 | 1990-11-27 | University Of Maryland | Advanced signal processing methodology for the detection, localization and quantification of acute myocardial ischemia |
| US5020540A (en) * | 1987-10-09 | 1991-06-04 | Biometrak Corporation | Cardiac biopotential analysis system and method |
| US5215099A (en) * | 1989-06-30 | 1993-06-01 | Ralph Haberl | System and method for predicting cardiac arrhythmia utilizing frequency informatiton derived from multiple segments of the late QRS and the ST portion |
| ATE95618T1 (en) * | 1989-07-14 | 1993-10-15 | Haberl Ralph | EQUIPMENT FOR EVALUATION OF SELECTED SIGNAL COMPONENTS IN PHYSIOLOGICAL MEASUREMENT SIGNALS, PARTICULARLY OF DELATE POTENTIAL IN ELECTROCARDIOGRAM. |
| US5109862A (en) * | 1990-03-19 | 1992-05-05 | Del Mar Avionics | Method and apparatus for spectral analysis of electrocardiographic signals |
| US5348020A (en) * | 1990-12-14 | 1994-09-20 | Hutson William H | Method and system for near real-time analysis and display of electrocardiographic signals |
| US5490516A (en) * | 1990-12-14 | 1996-02-13 | Hutson; William H. | Method and system to enhance medical signals for real-time analysis and high-resolution display |
| US5341811A (en) * | 1991-03-26 | 1994-08-30 | Allegheny-Singer Research Institute | Method and apparatus for observation of ventricular late potentials |
| US5546332A (en) * | 1991-08-09 | 1996-08-13 | Siemens Aktiengesellschaft | Process for compensating for quasi-periodic disturbances of measurement signals |
-
1993
- 1993-08-13 EP EP93113022A patent/EP0638869B1/en not_active Expired - Lifetime
- 1993-08-13 DE DE59300252T patent/DE59300252D1/en not_active Expired - Fee Related
-
1994
- 1994-08-15 JP JP6191602A patent/JPH0798346A/en not_active Withdrawn
- 1994-08-15 US US08/290,588 patent/US5560367A/en not_active Expired - Fee Related
Cited By (2)
| Publication number | Priority date | Publication date | Assignee | Title |
|---|---|---|---|---|
| CN108680874A (en) * | 2018-04-25 | 2018-10-19 | 浙江工业大学 | A kind of low-intensity magnetic field method for reconstructing based on pulse pump formula atomic magnetic force meter |
| CN108680874B (en) * | 2018-04-25 | 2020-05-26 | 浙江工业大学 | Weak magnetic field reconstruction method based on pulse pumping type atomic magnetometer |
Also Published As
| Publication number | Publication date |
|---|---|
| EP0638869A1 (en) | 1995-02-15 |
| JPH0798346A (en) | 1995-04-11 |
| DE59300252D1 (en) | 1995-07-13 |
| US5560367A (en) | 1996-10-01 |
Similar Documents
| Publication | Publication Date | Title |
|---|---|---|
| EP0638869B1 (en) | Procedure for a high-resolution spectral analysis for multichannel observations | |
| EP0355506B1 (en) | Arrangement for measuring local bioelectric currents in biological tissue | |
| DE19827697B4 (en) | Method and system for determining the quality of signals indicative of cardiac function | |
| DE19902253B4 (en) | Method and system for characterizing the quality of cardiac function display signals | |
| DE19511532A1 (en) | Process for locating electrical cardiac activity | |
| EP0000504A1 (en) | Circuit arrangement for the detection and recording of the activity of the uterus | |
| DE2716739A1 (en) | METHOD OF DETECTING SIGNALS | |
| DE19638738B4 (en) | Method for obtaining a diagnostic statement from signals and data of medical sensor systems | |
| EP0828225A1 (en) | Process and means for analysing EEG data | |
| DE19942658A1 (en) | Multivariable artifact assessment | |
| EP1034486B1 (en) | Method for determining at least one diagnostic piece of information from signal patterns of medical sensor systems | |
| DE10042342B4 (en) | Method and device for automatic detection and interpretation of pacemaker-influenced electrocardiograms | |
| DE112014005302T5 (en) | Method and system for determining a respiratory rate | |
| DE10246404B4 (en) | Method and system for measuring T-wave alternations | |
| DE60217786T2 (en) | Method and device for obtaining indices for characterizing atrial arrhythmias | |
| DE4405827A1 (en) | ECG data compression in implanted monitor system | |
| DE102013219117A1 (en) | Correction of capacitive recorded ECG signals in conjunction with measurements with a medical imaging examination device | |
| DE102010030714B4 (en) | Method for determining R waves in an ECG signal, ECG measuring device and magnetic resonance device | |
| DE69732757T2 (en) | Procedure and installation for QRS-Dektektion | |
| DE2717530B2 (en) | Procedure for eliminating interference from signals | |
| EP1048000B1 (en) | Expanded cardiogoniometry | |
| DE10048649A1 (en) | Risikomontoring | |
| DE4326043C2 (en) | Method for localization of electrophysological activities overlaid with high noise | |
| Deogire | Multi lead fetal QRS detection with principal component analysis | |
| DE2109179C3 (en) | Device for detecting shape-changed pulses of a pulse train |
Legal Events
| Date | Code | Title | Description |
|---|---|---|---|
| PUAI | Public reference made under article 153(3) epc to a published international application that has entered the european phase |
Free format text: ORIGINAL CODE: 0009012 |
|
| 17P | Request for examination filed |
Effective date: 19940620 |
|
| AK | Designated contracting states |
Kind code of ref document: A1 Designated state(s): DE FR GB IT NL |
|
| GRAA | (expected) grant |
Free format text: ORIGINAL CODE: 0009210 |
|
| AK | Designated contracting states |
Kind code of ref document: B1 Designated state(s): DE FR GB IT NL |
|
| REF | Corresponds to: |
Ref document number: 59300252 Country of ref document: DE Date of ref document: 19950713 |
|
| PGFP | Annual fee paid to national office [announced via postgrant information from national office to epo] |
Ref country code: NL Payment date: 19950817 Year of fee payment: 5 |
|
| ITF | It: translation for a ep patent filed |
Owner name: STUDIO JAUMANN |
|
| GBT | Gb: translation of ep patent filed (gb section 77(6)(a)/1977) |
Effective date: 19950821 |
|
| ET | Fr: translation filed | ||
| PLBE | No opposition filed within time limit |
Free format text: ORIGINAL CODE: 0009261 |
|
| STAA | Information on the status of an ep patent application or granted ep patent |
Free format text: STATUS: NO OPPOSITION FILED WITHIN TIME LIMIT |
|
| 26N | No opposition filed | ||
| PGFP | Annual fee paid to national office [announced via postgrant information from national office to epo] |
Ref country code: FR Payment date: 19960830 Year of fee payment: 4 |
|
| PG25 | Lapsed in a contracting state [announced via postgrant information from national office to epo] |
Ref country code: GB Free format text: LAPSE BECAUSE OF NON-PAYMENT OF DUE FEES Effective date: 19970813 |
|
| GBPC | Gb: european patent ceased through non-payment of renewal fee |
Effective date: 19970813 |
|
| PG25 | Lapsed in a contracting state [announced via postgrant information from national office to epo] |
Ref country code: FR Free format text: LAPSE BECAUSE OF NON-PAYMENT OF DUE FEES Effective date: 19980430 |
|
| REG | Reference to a national code |
Ref country code: FR Ref legal event code: ST |
|
| PGFP | Annual fee paid to national office [announced via postgrant information from national office to epo] |
Ref country code: DE Payment date: 19981020 Year of fee payment: 6 |
|
| PG25 | Lapsed in a contracting state [announced via postgrant information from national office to epo] |
Ref country code: NL Free format text: LAPSE BECAUSE OF NON-PAYMENT OF DUE FEES Effective date: 19990301 |
|
| NLV4 | Nl: lapsed or anulled due to non-payment of the annual fee |
Effective date: 19990301 |
|
| PG25 | Lapsed in a contracting state [announced via postgrant information from national office to epo] |
Ref country code: DE Free format text: LAPSE BECAUSE OF NON-PAYMENT OF DUE FEES Effective date: 20000601 |
|
| PG25 | Lapsed in a contracting state [announced via postgrant information from national office to epo] |
Ref country code: IT Free format text: LAPSE BECAUSE OF NON-PAYMENT OF DUE FEES Effective date: 20050813 |