EP0465784A2 - Process for automatically detecting and locating a target from a plurality of two dimensional images - Google Patents
Process for automatically detecting and locating a target from a plurality of two dimensional images Download PDFInfo
- Publication number
- EP0465784A2 EP0465784A2 EP91107069A EP91107069A EP0465784A2 EP 0465784 A2 EP0465784 A2 EP 0465784A2 EP 91107069 A EP91107069 A EP 91107069A EP 91107069 A EP91107069 A EP 91107069A EP 0465784 A2 EP0465784 A2 EP 0465784A2
- Authority
- EP
- European Patent Office
- Prior art keywords
- target
- images
- determining
- camera
- camera images
- Prior art date
- Legal status (The legal status is an assumption and is not a legal conclusion. Google has not performed a legal analysis and makes no representation as to the accuracy of the status listed.)
- Withdrawn
Links
Images

Classifications
-
- G—PHYSICS
- G06—COMPUTING; CALCULATING OR COUNTING
- G06T—IMAGE DATA PROCESSING OR GENERATION, IN GENERAL
- G06T7/00—Image analysis
- G06T7/70—Determining position or orientation of objects or cameras
-
- G—PHYSICS
- G06—COMPUTING; CALCULATING OR COUNTING
- G06V—IMAGE OR VIDEO RECOGNITION OR UNDERSTANDING
- G06V10/00—Arrangements for image or video recognition or understanding
- G06V10/20—Image preprocessing
- G06V10/255—Detecting or recognising potential candidate objects based on visual cues, e.g. shapes
Definitions
- This invention relates generally to a process for detecting and locating a target in a series of two- dimensional images generated by an imaging sensor. More particularly, this invention relates to a novel process for the detection and identification of targets through the use of computer image processing of data collected by an imaging sensor. This invention is particularly useful in the detection of underwater targets from an airborne platform.
- imaging sensors are used to search areas (or volumes) for particular types of targets which may pose a threat.
- targets include mines and submarines in the ocean, fixed-wing and rotary-wing aircraft, cruise missiles, and rockets in the air, and buried land mines under the soil.
- imaging sensors provide target images in two dimensions. Images in two dimensions can be made either using passive radiation or using active illumination at wavelenghts ranging from microwaves, millimeter waves, infrared, and invisible to ultraviolet. These two dimensional images display signal intensity and its variation in two spatial dimensions. Gated cameras used to detect signal returns from pulsed sources (imaging radars or visible lidars) can resolve range from the sensor and therefore can spatially sample a volume in three dimensions.
- Imaging sensors exhibiting such target images include, for example, the imaging lidar systems described in U.S. Patent n° 4,862,257 and its corresponding European Patent Application n° 89 908 570.8 (Publication n° 0378669).
- Imaging sensors of the general type described hereinabove typically have a display screen for viewing the detected images (e.g., targets). While a human operator viewing a display screen may provide a highly sensitive and reliable means of detecting targets, in some cases computer image processing will be superior. This is because the computer does not suffer from fatigue and inattentiveness as will be the case for human operators, especially in the environment of an aircraft such as a helicopter where noise, heat and vibration can distract from constant surveillance of the sensor display screen. Also, with multiple camera sensors, the visual data rate may be too high for a human to absorb and process effectively. Finally, the inherent complexity of spatial correlations and target signature correlations between images made at different times will require computer processing. Hence, there is a perceived need for computerized data processing techniques which will automatically (i.e., without human operator assistance) detect and locate preselected targets, particularly targets submerged underwater.
- the prior art processes for automatically detecting and locating a target do not give entire satisfaction and the object of the present invention is to provide an improved processing technique which overcomes or alleviates the drawbacks of the prior art processes.
- a method for processing a plurality of two dimensional camera images of a target having been generated by an imaging sensor having at least one camera, characterized by digitizing the camera images, calculating the mean and the standard deviation about the mean of the camera images and determining whether a target was detected using threshold detection analysis based upon the calculated mean and standard deviation about the mean.
- the present invention processes this series of two dimensional images (made with one or more imaging detectors) in an optimal statistical fashion to reliably detect and locate targets.
- This invention is a process by which the images are mathematically modified to reduce the deterious effects of noise and thereby provide the highest possible probability of detection while simultaneously maintaining a very low probability of false alarm.
- the data processing technique described herein also provides an estimate of the reliability of the dectection, the target location and an output image to be displayed for visual confirmation and perhaps classification by the operator.
- the method of the present invention includes some or all of the following steps : noise reduction, spatial filtering, noise parameter extraction, asymmetric threshold detection, contrast stretching, localization, recognition, range or depth determination and subimage mosaic generation.
- the present invention is particularly well suited for processing two dimensional images of underwater targets generated by an imaging sensor located on an airborne platform whereby the underwater target is precisely and accurately detected, located and identified.
- the image processing techniques of the present invention are particularly well suited for use in conjunction with an imaging lidar system which utilizes a pair of pulsed laser transmitters for increased power and six gated camera detectors.
- the multiple lasers and cameras are optically boresighted to a scanning mirror for increased swath width perpendicular to the heading of the airborne platform.
- Step 2 is the generation of the images by exposing (e.g., gating) the sensor cameras.
- Step 3 the images are digitized and read into a computer.ln Step 4, both the average and the peak intensities are determined for each separate camera image.
- Step 5 the gains of the cameras are adjusted so that optimum intrascene dynamic range is achieved in the next exposure under the assumption that the scene brightness is unchanged. This prevents lack of sensitivity (e.g., gain too low) or saturation (e.g., gain too high).
- Step 6 all images which are of the same scene are coregistered and averaged in order to reduce the background noise level.
- bandpass spatial filtering in two dimensions is used to enhance the target signature and to suppress unwanted high spatial frequency features (especially noise) and also low spatial frequencies (background signal).
- the bandpass spatial filtering can be easily implemented in digital form by replacing bipolar each pixel intensity value with the output of a two dimensional convolution calculation. This two dimensional convolution is determined using the following equation (as described in Pratt, W.K. Digital Image Processing, John Wilex, New York, 1978, pp. 319-323).
- the convolution array for a spatial bandpass filter is typically of the form :
- Step 8 the mean and the standard deviation about the mean of the filtered intensities are determined using the following formulas (as described in Frieden, B.R. Probability, Statistical Optics, and Data Testing, Springer-Verlag, New York, 1983, pp. 234, 246) : and Where
- the result is a mean (I) and RMS a for each image over the X and Y axes.
- Step 9 An important feature of this invention is Step 9 where symmetric or asymmetric threshold detection is performed. This process is shown in detail in FIGURE 2 with reference to Steps 20-32.
- Each pixel intensity I is first scanned in Step 20 to see if it is higher (reflection) or lower (shadow) than the mean intensity value ⁇ . In general, the background intensity level will not be zero.
- the shadow if the signal 1 is more than 5 a below the mean, then the shadow is a probable target (Step 23). If the signal I is more than 3 a below the mean but less than 5 ⁇ , then there is a possible shadow target (Step 25).
- Step 24 If the signal I is found in Step 24 to be less than 3 a below the mean, then the signal I is judged to be due to noise and no detection is declared in Step 26. For signals brighter than the mean from the test in Step 21, a similar set of threshold comparisons is made. If the signal is more than 5 a higher than the mean in Step 27, a probable reflection detection is declared in Step 28. For signals from 3 a to 5 ⁇ higher in Step 29, a possible reflection target is declared in Step 30. Finally, if the signal is less than 3 ⁇ high in Step 29, it is declared to be noise (no detection) in Step 31. The output of this routine is then made available to the continuing processing of Step 32.
- the + 1- 3 a and + 1- 5 a threshold values used therein as examples can be made asymmetrical (the plus and minus values would be unequal), and should be selected to produce the desired false alarm rate (especially the smaller threshold value). Reducing the threshold value will increase the false alarm rate, and increasing the threshold value will reduce the false alarm rate.
- Asymmetrical threshold can in principle reduce the false alarm for asymmetrical noise sources (such as scintillation or other log normal distributions).
- the probability of false alarm can be calculated from the threshold value if the probability density function of the noise is known a priori using the following formula :
- Step 10 the subroutine of FIGURE 2 terminates at Step 10 which is the target detection test. If no target was detected by the process of FIGURE 2, then the data processing method of this invention continues directly with Steps 16-19 which are self-explanatory "housekeeping" tasks including updating the system parameters and status display (Step 16); updating and scrolling the display image (Step 17); transmitting digital data to a recorder and date link encrypter (Step 18); and waiting for the next camera pulse interrupt signal (Step 19). Thereafter, the entire process is repeated when a new set of images has been obtained.
- Step 16-19 are self-explanatory "housekeeping" tasks including updating the system parameters and status display (Step 16); updating and scrolling the display image (Step 17); transmitting digital data to a recorder and date link encrypter (Step 18); and waiting for the next camera pulse interrupt signal (Step 19). Thereafter, the entire process is repeated when a new set of images has been obtained.
- Step 22 is performed wherein the part of the whole image near the target (hereinafter referred to as a "subimage") is streched in contrast to provide the maximum amount of visual information when it is displayed to the operator in Step 17.
- the X and Y coordinates of the target image are determined using either the peak signal pixel location or an intensity centroid calculation. For peak signal location, the subimage matrix area is searched for the largest intensity value, and the row and column numbers of that pixel are used to estimate the target location. A more accurate target location estimate can be made using the following centroid calculations : Where
- the absolute latitude and longitude of the target are calculated using the sensor platform navigation data (e.g., helicopter or other airborne platform navigational instruments) and a correction for the relative target location with respect to the aircraft by knowledge of the aircraft altitude and compass heading, the target depth, the roll and pitch angles of the sensor line of sight, and the angular offsets of the target image within the sensor field of view, the relative latitude and longitude of the target can be calculated with respect to the aircraft.
- the sensor platform navigation data e.g., helicopter or other airborne platform navigational instruments
- the target latitude ⁇ T and longitude 8 T can be found from the following equations :
- Step 13 previous detection records are checked to see if a prior detection was made at the same location (within the accuracy of the navigation system). If such multiple coincidence detections have occurred, then the estimated probability of detection will be increased. Thus, two estimates of "possible” detections may be upgraded to a "probable” detection.
- each detection is composed of images made in two range gates, one of which is either just above or just below the range gate in which the target is located.
- Targets in the range gate will generally be brighter than the background (reflection mode).
- Targets in front of the range gate will be seen in double shadow/obstruction (shadow mode).
- Targets behind the range gate will of course not be detected.
- the truth table in Step 17 compares the target modes in two adjacent range gates for consistency and for determining the actual target range or depth.
- “Fail” means an untypical, inconsistent result which cannot be a real target signature.
- the numbers inside the boxes in Step 34 represent the target location.
- the “2" means within Gate #2 (the lower one), "1 " is within Gate #1 (the upper one), and "0" means the target is closer to the imaging sensor than either of the two gates.
- the boxes in the table in Step 34 also indicate the confidence in the reality of the target detection based on the consistency of the shadow/reflection signature observed.
- Step 15 has now been reached where subimages are assembled to form a larger montage or composite image for display and transmittal purposes.
- FIGURE 4 (Steps 36-43) is a detailed flow chart of Step 15 in FIGURE 1.
- objects that pass both the temporal correlation tests e.g., Was it detected more than once ?) and the signature tests (e.g., Is it a spurious background feature ?) are processed further.
- the subimages may be enhanced using known false color techniques (Step 38), annotated to indicate whether the computer has determined a possible or a probable detection (Step 39), shown at their proper depth (or range) either using alphanumerics or by use of a pseudo - 3D display (Step 40) and/or enlarged to show details on small objects (such as mines) even through the sensor display may show a very large field of view (Step 41).
- small target images can be enlarged by, for example, a factor of 10. That is, the displayed image is "zoomed in" by a factor of 10.
- Each target is shown at its correct location on the sensor display so that spatial relationships with other image features are maintained correctly.
- Step 42 displays a larger subimage with no magnification. This would be appropriate for a submarine, for instance.
- a possible target classification is indicated (for instance, mine or submarine) based upon target size and shape.
- Step 15 the data processing techniques of this invention proceed to update the operator display with sensor health and status data (alphanumerics).
- the mosaic image is added to the display screen and scrolled appropriately if the sensor platform is moving to match the apparent target velocity.
- Step 18 the target data (such as processed subimage, two or three dimensional location and estimated probability of detection) are recorded and also sent over a data link to a remote location for secondary review and classification.
- Step 19 the progress goes into a "wait” state until the next images are obtained at which time the data processing technique of FIGURE 1 is repeated again to process the new images beginning with Step 1.
- the data processing technique described herein is readily understandable by those of ordinary skill in the art and can be easily implemented using existing computer technology. It will provide a reliable and robust target detection, location and classification capability for high data rate imaging sensors such as television cameras, forward looking infrared (FLIR) sensors and imaging lidars.
- high data rate imaging sensors such as television cameras, forward looking infrared (FLIR) sensors and imaging lidars.
- Additional image processing may allow amelioration of the degrading effects of particle distribution inhomogeneities and surface wave focussing/defocussing of the laser beam as it is transmitted into the water. For instance, one picture obtained just below the water surface could be saved, scaled, spatially smoothed to compensate for multiple scattering effects and subtracted from all images at greater depths to remove the laser irradiance variations which limit the target detectability.
Landscapes
- Engineering & Computer Science (AREA)
- Physics & Mathematics (AREA)
- General Physics & Mathematics (AREA)
- Theoretical Computer Science (AREA)
- Multimedia (AREA)
- Computer Vision & Pattern Recognition (AREA)
- Radar Systems Or Details Thereof (AREA)
- Image Processing (AREA)
- Optical Radar Systems And Details Thereof (AREA)
Abstract
A novel data processing technique is provided for detecting and locating a target from a plurality of two- dimensional images generated by an imaging sensor such as an imaging lidar system. This series of two dimensional images (made with one or more imaging detectors) is processed in an optimal statistical fashion to reliably detect and locate targets. The images are mathematically modified to reduce the deleterious effects of noise and thereby provide the highest possible probability of detection while simultaneously maintaining a very low probability of false alarm.
Description
- This invention relates generally to a process for detecting and locating a target in a series of two- dimensional images generated by an imaging sensor. More particularly, this invention relates to a novel process for the detection and identification of targets through the use of computer image processing of data collected by an imaging sensor. This invention is particularly useful in the detection of underwater targets from an airborne platform.
- Various imaging sensors are used to search areas (or volumes) for particular types of targets which may pose a threat. Examples of such targets include mines and submarines in the ocean, fixed-wing and rotary-wing aircraft, cruise missiles, and rockets in the air, and buried land mines under the soil. Such imaging sensors provide target images in two dimensions. Images in two dimensions can be made either using passive radiation or using active illumination at wavelenghts ranging from microwaves, millimeter waves, infrared, and invisible to ultraviolet. These two dimensional images display signal intensity and its variation in two spatial dimensions. Gated cameras used to detect signal returns from pulsed sources (imaging radars or visible lidars) can resolve range from the sensor and therefore can spatially sample a volume in three dimensions. Potential targets within this search volume produce characteristic signatures in the series of images. Examples of imaging sensors exhibiting such target images include, for example, the imaging lidar systems described in U.S. Patent n° 4,862,257 and its corresponding European Patent Application n° 89 908 570.8 (Publication n° 0378669).
- Imaging sensors of the general type described hereinabove typically have a display screen for viewing the detected images (e.g., targets). While a human operator viewing a display screen may provide a highly sensitive and reliable means of detecting targets, in some cases computer image processing will be superior. This is because the computer does not suffer from fatigue and inattentiveness as will be the case for human operators, especially in the environment of an aircraft such as a helicopter where noise, heat and vibration can distract from constant surveillance of the sensor display screen. Also, with multiple camera sensors, the visual data rate may be too high for a human to absorb and process effectively. Finally, the inherent complexity of spatial correlations and target signature correlations between images made at different times will require computer processing. Hence, there is a perceived need for computerized data processing techniques which will automatically (i.e., without human operator assistance) detect and locate preselected targets, particularly targets submerged underwater.
- The prior art processes for automatically detecting and locating a target do not give entire satisfaction and the object of the present invention is to provide an improved processing technique which overcomes or alleviates the drawbacks of the prior art processes.
- According to the present invention there is provided a method for processing a plurality of two dimensional camera images of a target, the images having been generated by an imaging sensor having at least one camera, characterized by digitizing the camera images, calculating the mean and the standard deviation about the mean of the camera images and determining whether a target was detected using threshold detection analysis based upon the calculated mean and standard deviation about the mean.
- The present invention processes this series of two dimensional images (made with one or more imaging detectors) in an optimal statistical fashion to reliably detect and locate targets. This invention is a process by which the images are mathematically modified to reduce the deterious effects of noise and thereby provide the highest possible probability of detection while simultaneously maintaining a very low probability of false alarm. The data processing technique described herein also provides an estimate of the reliability of the dectection, the target location and an output image to be displayed for visual confirmation and perhaps classification by the operator. The method of the present invention includes some or all of the following steps : noise reduction, spatial filtering, noise parameter extraction, asymmetric threshold detection, contrast stretching, localization, recognition, range or depth determination and subimage mosaic generation.
- The present invention is particularly well suited for processing two dimensional images of underwater targets generated by an imaging sensor located on an airborne platform whereby the underwater target is precisely and accurately detected, located and identified.
- The above-discussed and other features and advantages of the present invention will be appreciated and understood by those skilled in the art from the following detailed description and drawings, wherein like elements are numbered alike in the several FIGURES; and wherein :
- FIGURE 1 is a flow chart depicting the image processing technique of the present invention;
- FIGURE 2 is a flow chart depicting the asymmetric threshold detection system of the present invention;
- FIGURE 3 is a flow chart depicting a system for determining target depth; and
- FIGURE 4 is a flow chart depicting a system for generating mosaic subimages.
- While not limited thereto in its utility, the image processing techniques of the present invention are particularly well suited for use in conjunction with an imaging lidar system which utilizes a pair of pulsed laser transmitters for increased power and six gated camera detectors. The multiple lasers and cameras are optically boresighted to a scanning mirror for increased swath width perpendicular to the heading of the airborne platform.
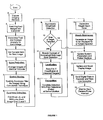
- The imaging processing flow chart in accordance with the present invention is shown in FIGURE 1.
Reference numeral 1 denotes the start or the initialization of the process.Step 2 is the generation of the images by exposing (e.g., gating) the sensor cameras. In Step 3, the images are digitized and read into a computer.ln Step 4, both the average and the peak intensities are determined for each separate camera image. InStep 5, the gains of the cameras are adjusted so that optimum intrascene dynamic range is achieved in the next exposure under the assumption that the scene brightness is unchanged. This prevents lack of sensitivity (e.g., gain too low) or saturation (e.g., gain too high). In Step 6, all images which are of the same scene are coregistered and averaged in order to reduce the background noise level. These multiple images may be derived from multiple exposures in a time series using one camera from simultaneously obtained images using multiple cameras. InStep 7, bandpass spatial filtering in two dimensions is used to enhance the target signature and to suppress unwanted high spatial frequency features (especially noise) and also low spatial frequencies (background signal). The bandpass spatial filtering can be easily implemented in digital form by replacing bipolar each pixel intensity value with the output of a two dimensional convolution calculation. This two dimensional convolution is determined using the following equation (as described in Pratt, W.K. Digital Image Processing, John Wilex, New York, 1978, pp. 319-323).
- Where :
- Q = MxM output (convolved) image matrix
- m1 = row number of Q matrix
- m2 = column number of Q matrix
- ni = row number of F matrix
- n2 = column number of F matrix
- F = NxN input image matrix
- H = LxL convolution matrix
- The convolution array for a spatial bandpass filter is typically of the form :

- In Step 8, the mean and the standard deviation about the mean of the filtered intensities are determined using the following formulas (as described in Frieden, B.R. Probability, Statistical Optics, and Data Testing, Springer-Verlag, New York, 1983, pp. 234, 246) :

and
Where - <F> = me an intensity of image matrix F
- σF = standard deviation about the mean of image matrix F
- The result is a mean (I) and RMS a for each image over the X and Y axes.
- An important feature of this invention is
Step 9 where symmetric or asymmetric threshold detection is performed. This process is shown in detail in FIGURE 2 with reference to Steps 20-32. Each pixel intensity I is first scanned inStep 20 to see if it is higher (reflection) or lower (shadow) than the mean intensity value σ. In general, the background intensity level will not be zero. For the shadow case, if thesignal 1 is more than 5 a below the mean, then the shadow is a probable target (Step 23). If the signal I is more than 3 a below the mean but less than 5 σ, then there is a possible shadow target (Step 25). If the signal I is found inStep 24 to be less than 3 a below the mean, then the signal I is judged to be due to noise and no detection is declared inStep 26. For signals brighter than the mean from the test in Step 21, a similar set of threshold comparisons is made. If the signal is more than 5 a higher than the mean inStep 27, a probable reflection detection is declared inStep 28. For signals from 3 a to 5 σ higher inStep 29, a possible reflection target is declared inStep 30. Finally, if the signal is less than 3 σ high inStep 29, it is declared to be noise (no detection) inStep 31. The output of this routine is then made available to the continuing processing ofStep 32. - It will be appreciated that the + 1- 3 a and + 1- 5 a threshold values used therein as examples can be made asymmetrical (the plus and minus values would be unequal), and should be selected to produce the desired false alarm rate (especially the smaller threshold value). Reducing the threshold value will increase the false alarm rate, and increasing the threshold value will reduce the false alarm rate. Asymmetrical threshold can in principle reduce the false alarm for asymmetrical noise sources (such as scintillation or other log normal distributions). The probability of false alarm can be calculated from the threshold value if the probability density function of the noise is known a priori using the following formula :

Where - Z1 = threshold value; and
- P(Z/Ho) = probability density of photoelectron counts Z given the hypothesis Ho that no target is present is true.
- The above formula is described in Van Trees, H.L., Detection Estimation, a Modular Theory, John Wilex, New York, 1968, pp. 23-31. For a gaussian probability distribution, for example

- Referring again to FIGURE 1, the subroutine of FIGURE 2 terminates at
Step 10 which is the target detection test. If no target was detected by the process of FIGURE 2, then the data processing method of this invention continues directly with Steps 16-19 which are self-explanatory "housekeeping" tasks including updating the system parameters and status display (Step 16); updating and scrolling the display image (Step 17); transmitting digital data to a recorder and date link encrypter (Step 18); and waiting for the next camera pulse interrupt signal (Step 19). Thereafter, the entire process is repeated when a new set of images has been obtained. - However, if a target was detected in
Step 10, (either a probable or possible shadow or a probable or possible reflection), then Step 22 is performed wherein the part of the whole image near the target (hereinafter referred to as a "subimage") is streched in contrast to provide the maximum amount of visual information when it is displayed to the operator inStep 17. InStep 12, the X and Y coordinates of the target image are determined using either the peak signal pixel location or an intensity centroid calculation. For peak signal location, the subimage matrix area is searched for the largest intensity value, and the row and column numbers of that pixel are used to estimate the target location. A more accurate target location estimate can be made using the following centroid calculations :

Where - X = target centroid location in X coordinate
- Y = target centroid location in Y coordinate
- Also, in
Step 12, the absolute latitude and longitude of the target are calculated using the sensor platform navigation data (e.g., helicopter or other airborne platform navigational instruments) and a correction for the relative target location with respect to the aircraft by knowledge of the aircraft altitude and compass heading, the target depth, the roll and pitch angles of the sensor line of sight, and the angular offsets of the target image within the sensor field of view, the relative latitude and longitude of the target can be calculated with respect to the aircraft. - The target latitude ΦT and longitude 8T can be found from the following equations :
- N = cos-' [cos (P) . cos (R)]
- r = (A + d/n) . sin (N)
-


- Where :
- P = Sensor line of sight pitch angle (+ is forward)
- R = Sensor line of sight roll angle (+ is to left)
- n = Sea water index of refraction (1.34295)
- N = Sensor line of sight nadir angle
- r = Horizontal separation of aircraft and target
- A = Aircraft altitude
- C = Aircraft compass heading (+ is clockwise from North)
- 8R = Angle of plane containing sensor line of sight and nadir with aircraft heading direction ( + is counterclockwise from heading)
- ' P A = Aircraft latitude
- 8A = Aircraft longitude, and
- RE = Radius of Earth
- In
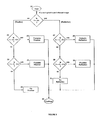
Step 13, previous detection records are checked to see if a prior detection was made at the same location (within the accuracy of the navigation system). If such multiple coincidence detections have occurred, then the estimated probability of detection will be increased. Thus, two estimates of "possible" detections may be upgraded to a "probable" detection. - For imaging lidar sensors such as the Imaging Lidar System of U.S. Patent n° 4,862,257 the target range of depth may also be determined in
Step 14, which is shown in detail in FIGURE 3. Referring now to FIGURE 3 and beginning with Step 33, each detection is composed of images made in two range gates, one of which is either just above or just below the range gate in which the target is located. Targets in the range gate will generally be brighter than the background (reflection mode). Targets in front of the range gate will be seen in double shadow/obstruction (shadow mode). Targets behind the range gate will of course not be detected. The truth table inStep 17 compares the target modes in two adjacent range gates for consistency and for determining the actual target range or depth. "Fail" means an untypical, inconsistent result which cannot be a real target signature. The numbers inside the boxes inStep 34 represent the target location. The "2" means within Gate #2 (the lower one), "1 " is within Gate #1 (the upper one), and "0" means the target is closer to the imaging sensor than either of the two gates. The boxes in the table inStep 34 also indicate the confidence in the reality of the target detection based on the consistency of the shadow/reflection signature observed. - Referring again to FIGURE 1,
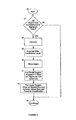
Step 15 has now been reached where subimages are assembled to form a larger montage or composite image for display and transmittal purposes. FIGURE 4 (Steps 36-43) is a detailed flow chart ofStep 15 in FIGURE 1. Upon starting inStep 36 in FIGURE 4, objects that pass both the temporal correlation tests (e.g., Was it detected more than once ?) and the signature tests (e.g., Is it a spurious background feature ?) are processed further. The subimages may be enhanced using known false color techniques (Step 38), annotated to indicate whether the computer has determined a possible or a probable detection (Step 39), shown at their proper depth (or range) either using alphanumerics or by use of a pseudo - 3D display (Step 40) and/or enlarged to show details on small objets (such as mines) even through the sensor display may show a very large field of view (Step 41). For instance, small target images can be enlarged by, for example, a factor of 10. That is, the displayed image is "zoomed in" by a factor of 10. Each target, however, is shown at its correct location on the sensor display so that spatial relationships with other image features are maintained correctly. For large targets or for a series of contiguous small targets, Step 42 displays a larger subimage with no magnification. This would be appropriate for a submarine, for instance. Finally inStep 42, a possible target classification is indicated (for instance, mine or submarine) based upon target size and shape. - Returning again to FIGURE 1, after creating the mosaic of subimages in
Step 15, the data processing techniques of this invention proceed to update the operator display with sensor health and status data (alphanumerics). InStep 17, the mosaic image is added to the display screen and scrolled appropriately if the sensor platform is moving to match the apparent target velocity. InStep 18, the target data (such as processed subimage, two or three dimensional location and estimated probability of detection) are recorded and also sent over a data link to a remote location for secondary review and classification. - Finally, in
Step 19, the progress goes into a "wait" state until the next images are obtained at which time the data processing technique of FIGURE 1 is repeated again to process the new images beginning withStep 1. - The data processing technique described herein is readily understandable by those of ordinary skill in the art and can be easily implemented using existing computer technology. It will provide a reliable and robust target detection, location and classification capability for high data rate imaging sensors such as television cameras, forward looking infrared (FLIR) sensors and imaging lidars.
- Additional image processing may allow amelioration of the degrading effects of particle distribution inhomogeneities and surface wave focussing/defocussing of the laser beam as it is transmitted into the water. For instance, one picture obtained just below the water surface could be saved, scaled, spatially smoothed to compensate for multiple scattering effects and subtracted from all images at greater depths to remove the laser irradiance variations which limit the target detectability.
Claims (20)
1. A method for processing a plurality of two dimensional camera images of a target, the images having been generated by an imaging sensor having at least one camera, characterized by digitizing the camera images, calculating the mean and the standard deviation about the mean of the camera images; and determining whether a target was detected using threshold detection analysis based upon the calculated mean and standard deviation about the mean.
2. The method as claimed in claim 1 characterized by calculating the average and peak intensities for each camera image; and adjusting the gain of the at least on camera subsequent to calculating the average and peak intensities wherein optimum intrascene dynamic range is achieved in the next camera exposure.
3. The method as claimed in claim 1 or 2 characterized by the step of reducing the noise level of the camera images.
4. The method as claimed in claim 3 characterized in that said noise reduction step further comprises coregistering and averaging all images which are of the same scene wherein background noise level is reduced.
5. The method as claimed in anyone of the preceding claims 1 to 4 characterized by the step of spatially filtering the camera images.
6. The method as claimed in claim 5 characterized in that said spatial filtering step further comprises filtering the camera images to enhance any target signature and suppress undesired high and low spatial frequencies.
7. The method as claimed in claim 6 characterized in that said filtering step further comprises bandpass spatial filtering wherein each pixel intensity value is replaced with the output of a two dimensional spatial convolution calculation.
8. The method as claimed in claim 1 characterized in that the second process step comprises the further steps of determining if each pixel intensity in each filtered image is lower than the intensity value defining a potential target shadow or higher than the intensity value defining a potential target reflection.
9. The method as claimed in claim 8 characterized by the step of determining if the potential target shadow is an actual target or due to noise by comparing said pixel intensity to a range of first preselected threshold values in the event that each pixel intensity in each filtered image defines a target shadow; and determining if the potential target reflection is an actual target or due to noise by comparing said pixel intensity to a range of second preselected threshold values in the event that each pixel intensity in each filtered image defines a target reflection.
10. The method as claimed in claim 9 characterized in that said first preselected values are equal to said second preselected values, but have opposing signs defining symmetric values.
11. The method as claimed in claim 9 characterized in that said first preselected values are not equal to said second preselected values defining asymmetric values.
12. The method as claimed in claim 9 characterized by the step of determining the probability of false alarms as a function of the first and second preselected threshold values and as a function of the probability density function of the noise.
13. The method as claimed in anyone of the preceding claims 1 to 12 wherein a target has been detected in the camera images characterized by the steps of streching in contrast a portion of the image near the target defining a subimage.
14. The method as claimed in anyone of the preceding claims 1 to 12 wherein a target has been detected in the camera images characterized by the step of determining the X and Y coordinates of the target.
15. The method as claimed in claim 14 characterized in that said X and Y coordinates are determined using either the peak signal pixel location or an intensity centroid calculation.
16. The method as claimed in anyone of the preceeding claims 1 to 15 wherein the imaging sensor is located on an airborne platform having onboard navigational instruments characterized by the step of determining absolute latitude and longitude of the target using onboard navigational instruments and a correction for the target location relative to the airborne platform.
17. The method as claimed in claim 14 or 15 characterized by the step of correlating the target location with previous target detections in the same location to increase probability of detection.
18. The method as claimed in anyone of the preceding claims 1 to 12 wherein a target has been detected in the camera images characterized by the step of determining target depth zone.
19. The method as claimed in claim 18 characterized in that the step of determining target depth zone comprises comparing images from at least two adjacent range gates and determining which range gate target is present as a function of whether the target is a shadow or reflection or not present in each of the adjacent range gates.
20. The method as claimed in anyone of the preceeding claims 1 to 12 wherein a target has been detected in the camera images characterized by the step of combining subimages of the target into a composite mosaic.
Applications Claiming Priority (2)
| Application Number | Priority Date | Filing Date | Title |
|---|---|---|---|
| US565424 | 1990-08-10 | ||
| US07/565,424 US5267329A (en) | 1990-08-10 | 1990-08-10 | Process for automatically detecting and locating a target from a plurality of two dimensional images |
Publications (2)
| Publication Number | Publication Date |
|---|---|
| EP0465784A2 true EP0465784A2 (en) | 1992-01-15 |
| EP0465784A3 EP0465784A3 (en) | 1994-02-16 |
Family
ID=24258533
Family Applications (1)
| Application Number | Title | Priority Date | Filing Date |
|---|---|---|---|
| EP91107069A Withdrawn EP0465784A2 (en) | 1990-08-10 | 1991-05-02 | Process for automatically detecting and locating a target from a plurality of two dimensional images |
Country Status (4)
| Country | Link |
|---|---|
| US (1) | US5267329A (en) |
| EP (1) | EP0465784A2 (en) |
| CA (1) | CA2040743A1 (en) |
| IL (1) | IL97924A (en) |
Cited By (2)
| Publication number | Priority date | Publication date | Assignee | Title |
|---|---|---|---|---|
| EP0952552A2 (en) * | 1998-04-22 | 1999-10-27 | Tektronix, Inc. | Method for generating 2-D images from 3-D video data |
| GB2485359A (en) * | 2010-11-10 | 2012-05-16 | J T Consultancy Ltd | A Simulator Including A Controller And A Means For 3-Dimensional Position Recognition Using Correlation |
Families Citing this family (22)
| Publication number | Priority date | Publication date | Assignee | Title |
|---|---|---|---|---|
| JP2919284B2 (en) * | 1994-02-23 | 1999-07-12 | 松下電工株式会社 | Object recognition method |
| US5850352A (en) * | 1995-03-31 | 1998-12-15 | The Regents Of The University Of California | Immersive video, including video hypermosaicing to generate from multiple video views of a scene a three-dimensional video mosaic from which diverse virtual video scene images are synthesized, including panoramic, scene interactive and stereoscopic images |
| US5805742A (en) * | 1995-08-16 | 1998-09-08 | Trw Inc. | Object detection system with minimum-spanning gradient filter for scene clutter suppression |
| US5675661A (en) * | 1995-10-12 | 1997-10-07 | Northrop Grumman Corporation | Aircraft docking system |
| WO1997016807A1 (en) * | 1995-10-31 | 1997-05-09 | Sarnoff Corporation | Method and apparatus for image-based object detection and tracking |
| US5635662A (en) * | 1996-02-07 | 1997-06-03 | The United States Of America As Represented By The Secretary Of The Navy | Method and apparatus for avoiding detection by a threat projectile |
| US5989087A (en) * | 1996-06-28 | 1999-11-23 | The United States Of America As Represented By The Secretary Of The Navy | Lidar detection using shadow enhancement |
| US6570587B1 (en) | 1996-07-26 | 2003-05-27 | Veon Ltd. | System and method and linking information to a video |
| US6064768A (en) * | 1996-07-29 | 2000-05-16 | Wisconsin Alumni Research Foundation | Multiscale feature detector using filter banks |
| US5956436A (en) * | 1997-05-23 | 1999-09-21 | Umax Data Systems Inc. | Method for dynamically scanning an image |
| WO1999036904A1 (en) * | 1998-01-16 | 1999-07-22 | Thresholds Unlimited, Inc. | Head up display and vision system |
| US6394557B2 (en) * | 1998-05-15 | 2002-05-28 | Intel Corporation | Method and apparatus for tracking an object using a continuously adapting mean shift |
| JP3525896B2 (en) * | 1999-03-19 | 2004-05-10 | 松下電工株式会社 | Three-dimensional object recognition method and bin picking system using the same |
| US6199471B1 (en) * | 1999-05-21 | 2001-03-13 | The United States Of America As Represented By The Secretary Of The Navy | Method and system for determining the probable location of a contact |
| GB2368482B (en) * | 2000-10-26 | 2004-08-25 | Hewlett Packard Co | Optimal image capture |
| JP2004054435A (en) * | 2002-07-17 | 2004-02-19 | Toshiba Corp | Hypermedia information presentation method, hypermedia information presentation program and hypermedia information presentation device |
| US7609877B2 (en) * | 2006-02-09 | 2009-10-27 | The United States Of America As Represented By The Secretary Of The Navy | Tactical image parameter adjustment method for stereo pair correlation |
| US9373051B2 (en) * | 2012-06-14 | 2016-06-21 | Insitu, Inc. | Statistical approach to identifying and tracking targets within captured image data |
| US9380275B2 (en) | 2013-01-30 | 2016-06-28 | Insitu, Inc. | Augmented video system providing enhanced situational awareness |
| CN104050662B (en) * | 2014-05-30 | 2017-04-12 | 清华大学深圳研究生院 | Method for directly obtaining depth image through light field camera one-time imaging |
| JP6722521B2 (en) * | 2016-06-23 | 2020-07-15 | 古野電気株式会社 | Underwater detection system |
| CN112179210B (en) * | 2020-08-31 | 2022-09-02 | 河北汉光重工有限责任公司 | Method for correcting shot hit deviation of naval gun |
Citations (1)
| Publication number | Priority date | Publication date | Assignee | Title |
|---|---|---|---|---|
| EP0354782A2 (en) * | 1988-08-12 | 1990-02-14 | Sumitomo Wiring Systems, Ltd. | Image processor for detecting incomplete articles |
Family Cites Families (10)
| Publication number | Priority date | Publication date | Assignee | Title |
|---|---|---|---|---|
| US3947833A (en) * | 1974-11-20 | 1976-03-30 | The United States Of America As Represented By The Secretary Of The Navy | Automatic target detection system |
| US4497065A (en) * | 1982-07-12 | 1985-01-29 | Westinghouse Electric Corp. | Target recognition system enhanced by active signature measurements |
| US4550435A (en) * | 1983-06-07 | 1985-10-29 | Rca Corporation | Multilevel thresholding for target tracking apparatus |
| US4739401A (en) * | 1985-01-25 | 1988-04-19 | Hughes Aircraft Company | Target acquisition system and method |
| US4736439A (en) * | 1985-05-24 | 1988-04-05 | The United States Of America As Represented By The Secretary Of The Navy | Image preprocessing by modified median filter |
| US4970660A (en) * | 1985-07-05 | 1990-11-13 | Motorola, Inc. | Accumulated statistics constant false alarm rate method and device |
| US4845500A (en) * | 1988-03-25 | 1989-07-04 | Sperry Marine Inc. | Radar video detector and target tracker |
| US4862257A (en) * | 1988-07-07 | 1989-08-29 | Kaman Aerospace Corporation | Imaging lidar system |
| US4920412A (en) * | 1988-12-22 | 1990-04-24 | Sperry Marine Inc. | Atmospheric obscurant penetrating target observation system with range gating |
| US4964721A (en) * | 1989-10-12 | 1990-10-23 | Kaman Aerospace Corporation | Imaging lidar system |
-
1990
- 1990-08-10 US US07/565,424 patent/US5267329A/en not_active Expired - Fee Related
-
1991
- 1991-04-18 CA CA002040743A patent/CA2040743A1/en not_active Abandoned
- 1991-04-23 IL IL9792491A patent/IL97924A/en not_active IP Right Cessation
- 1991-05-02 EP EP91107069A patent/EP0465784A2/en not_active Withdrawn
Patent Citations (1)
| Publication number | Priority date | Publication date | Assignee | Title |
|---|---|---|---|---|
| EP0354782A2 (en) * | 1988-08-12 | 1990-02-14 | Sumitomo Wiring Systems, Ltd. | Image processor for detecting incomplete articles |
Non-Patent Citations (1)
| Title |
|---|
| PROCEEDINGS OF THE SPIE,1988 ;MULTISPECTRAL IMAGE PROCESSING AND ENHANCEMENT,ORLANDO(US) 6-8 APRIL 1988 vol. 933 , 1988 pages 32 - 44 ARIDGIDES ET AL. 'CORRELATED BACKGROUND ADAPTIVE CLUTTER SUPPRESSION AND NORMALIZATION TECHNIAUES' * |
Cited By (4)
| Publication number | Priority date | Publication date | Assignee | Title |
|---|---|---|---|---|
| EP0952552A2 (en) * | 1998-04-22 | 1999-10-27 | Tektronix, Inc. | Method for generating 2-D images from 3-D video data |
| EP0952552A3 (en) * | 1998-04-22 | 2001-09-26 | Tektronix, Inc. | Method for generating 2-D images from 3-D video data |
| GB2485359A (en) * | 2010-11-10 | 2012-05-16 | J T Consultancy Ltd | A Simulator Including A Controller And A Means For 3-Dimensional Position Recognition Using Correlation |
| GB2485359B (en) * | 2010-11-10 | 2012-10-31 | J T Consultancy Ltd | A simulator including a method and apparatus for determining the co-ordinates of an object in two dimensions |
Also Published As
| Publication number | Publication date |
|---|---|
| US5267329A (en) | 1993-11-30 |
| IL97924A (en) | 1995-10-31 |
| CA2040743A1 (en) | 1992-02-11 |
| EP0465784A3 (en) | 1994-02-16 |
| IL97924A0 (en) | 1992-06-21 |
Similar Documents
| Publication | Publication Date | Title |
|---|---|---|
| US5267329A (en) | Process for automatically detecting and locating a target from a plurality of two dimensional images | |
| US7916933B2 (en) | Automatic target recognition system for detection and classification of objects in water | |
| EP0494700B1 (en) | Imaging lidar system for shallow and coastal water | |
| GB2546140B (en) | UAV detection | |
| US5243541A (en) | Imaging lidar system for shallow and coastal water | |
| US20030198364A1 (en) | Video search and rescue device | |
| Wallace EURASIP Member et al. | Full waveform analysis for long-range 3D imaging laser radar | |
| GB2297008A (en) | Visual recognition system for ladar sensors | |
| Rowe et al. | Change detection for linear features in aerial photographs using edge-finding | |
| JPH0862317A (en) | Detection of image base using measured value of clutter and signal-to-clutter ratio,tracking system and processing method | |
| US5233415A (en) | Imaging lidar employing transmitter referencing | |
| RU2639321C1 (en) | Optical-electronic object detecting system | |
| US20030140775A1 (en) | Method and apparatus for sighting and targeting a controlled system from a common three-dimensional data set | |
| Steinvall et al. | Simulation and modeling of laser range profiling and imaging of small surface vessels | |
| Bers et al. | Laser radar system for obstacle avoidance | |
| Stevenson et al. | Testing the helicopter obstacle avoidance system | |
| Caimi et al. | Developments in laser-line scanned undersea surface mapping and image analysis systems for scientific applications | |
| Wright et al. | Multi-sensor data fusion for seafloor mapping and ordnance location | |
| Hafiza et al. | Advancement of Underwater Surveying and Scanning Techniques: A Review | |
| Cheranyov et al. | Methods of Detecting Small Unmanned Aerial Vehicles | |
| Shi et al. | Multi-modal netted sensor fence for homeland security | |
| Hough | Detection and Location System for Laser Interference with Aircraft | |
| Cook | Results of ladar ATR captive flight testing experiments | |
| Brisson | A methodology to detect and classify underwater unexploded ordnance in DIDSON sonar images | |
| Armbruster et al. | Navigation Sensor Accuracy Requirements for Emerging Laser Radar Applications |
Legal Events
| Date | Code | Title | Description |
|---|---|---|---|
| PUAI | Public reference made under article 153(3) epc to a published international application that has entered the european phase |
Free format text: ORIGINAL CODE: 0009012 |
|
| AK | Designated contracting states |
Kind code of ref document: A2 Designated state(s): AT BE CH DE DK ES FR GB GR IT LI LU NL SE |
|
| PUAL | Search report despatched |
Free format text: ORIGINAL CODE: 0009013 |
|
| AK | Designated contracting states |
Kind code of ref document: A3 Designated state(s): AT BE CH DE DK ES FR GB GR IT LI LU NL SE |
|
| STAA | Information on the status of an ep patent application or granted ep patent |
Free format text: STATUS: THE APPLICATION IS DEEMED TO BE WITHDRAWN |
|
| 18D | Application deemed to be withdrawn |
Effective date: 19940817 |