EP0366309A2 - Colour image quantization system - Google Patents
Colour image quantization system Download PDFInfo
- Publication number
- EP0366309A2 EP0366309A2 EP89310452A EP89310452A EP0366309A2 EP 0366309 A2 EP0366309 A2 EP 0366309A2 EP 89310452 A EP89310452 A EP 89310452A EP 89310452 A EP89310452 A EP 89310452A EP 0366309 A2 EP0366309 A2 EP 0366309A2
- Authority
- EP
- European Patent Office
- Prior art keywords
- color
- space
- spaces
- division
- list
- Prior art date
- Legal status (The legal status is an assumption and is not a legal conclusion. Google has not performed a legal analysis and makes no representation as to the accuracy of the status listed.)
- Granted
Links
- 238000013139 quantization Methods 0.000 title claims abstract description 31
- 239000003086 colorant Substances 0.000 claims abstract description 91
- 230000001419 dependent effect Effects 0.000 claims abstract description 3
- 238000000034 method Methods 0.000 claims description 70
- 238000004364 calculation method Methods 0.000 claims description 17
- 238000005070 sampling Methods 0.000 claims description 12
- 238000003860 storage Methods 0.000 claims description 9
- 238000004040 coloring Methods 0.000 claims description 2
- 230000000593 degrading effect Effects 0.000 claims description 2
- 230000001174 ascending effect Effects 0.000 claims 2
- 241000282979 Alces alces Species 0.000 claims 1
- 238000010586 diagram Methods 0.000 description 27
- 238000012545 processing Methods 0.000 description 18
- 238000013507 mapping Methods 0.000 description 9
- 230000003044 adaptive effect Effects 0.000 description 5
- 238000003780 insertion Methods 0.000 description 3
- 230000037431 insertion Effects 0.000 description 3
- FFBHFFJDDLITSX-UHFFFAOYSA-N benzyl N-[2-hydroxy-4-(3-oxomorpholin-4-yl)phenyl]carbamate Chemical compound OC1=C(NC(=O)OCC2=CC=CC=C2)C=CC(=C1)N1CCOCC1=O FFBHFFJDDLITSX-UHFFFAOYSA-N 0.000 description 2
- 238000012217 deletion Methods 0.000 description 2
- 230000037430 deletion Effects 0.000 description 2
- 238000009826 distribution Methods 0.000 description 2
- 238000013459 approach Methods 0.000 description 1
- 238000001514 detection method Methods 0.000 description 1
- 230000006866 deterioration Effects 0.000 description 1
- 238000009792 diffusion process Methods 0.000 description 1
- 238000005303 weighing Methods 0.000 description 1
Images


Classifications
-
- H—ELECTRICITY
- H04—ELECTRIC COMMUNICATION TECHNIQUE
- H04N—PICTORIAL COMMUNICATION, e.g. TELEVISION
- H04N1/00—Scanning, transmission or reproduction of documents or the like, e.g. facsimile transmission; Details thereof
- H04N1/46—Colour picture communication systems
- H04N1/64—Systems for the transmission or the storage of the colour picture signal; Details therefor, e.g. coding or decoding means therefor
- H04N1/644—Systems for the transmission or the storage of the colour picture signal; Details therefor, e.g. coding or decoding means therefor using a reduced set of representative colours, e.g. each representing a particular range in a colour space
Definitions
- color displays often employ a color lookup table (LUT) (see Figure 12).
- LUT color lookup table
- a frame buffer can store all the intensities of red, green and blue components of image data
- a color LUT becomes unnecessary; the data read from the frame buffer is used directly for video signals for the color display.
- each of the red, the green and the blue components is represented by 8 bits, and thus 24 bits are required for one pel of the image data.
- the frame buffer requires enormous amounts of storage, and becomes expensive.
- a colour LUT can be utilised, in which the contents of the frame buffer are used as color indexes to address the LUT.
- the contents of the LUT representing red, green and blue components of color are read and utilized as video signals for the color display. Therefore, it is sufficient for the pel data in the frame buffer to just accommodate the number of entries of the color LUT. For example, in a case where the number of entries of the color LUT or the number of colors simultaneously displayed on the color display is 256, the pel data of the frame buffer can be represented by 8 bits (1 byte).
- color LUT-type displays that can simultaneously display 8, 16, 32 or 256 colors.
- a color image may have a greater number of color than the number of colors available for display (for example, a color image, where the intensity of each of the red, green and blue component is represented by 8 bits, has 16.7 million colors), it is important to be able to select the optimum number of simultaneously displayed colors, to cause as little deterioration of image quality as possible, and to map the original colors of the color image to those selected colors simultaneously displayable.
- Such a technique is called color image quantization.
- color quantization can be broadly divided into uniform sampling and adaptive sampling.
- Uniform sampling performs quantization by uniformly dividing a color space, and giving a representative color to each divided space; reloading of a LUT is not necessary once the representative color for each divided space has been loaded.
- a disadvantage of this technique is that image quality is significantly degraded for an input image whose colors are not uniformly distributed in a color-space, but are locally clustered.
- color-space means various spaces such as RGB space (Red, Green, Blue space), HLS space (Hue, Lightness, Saturation space), CYMB space (Cyan, Yellow, Magenta, Black space) and L*u*v space).
- L*u*v space means a color-space which is arranged so that color difference sensed by a human corresponds to a distance in the space, and is also called a uniform color-space.
- Adaptive sampling is a technique where the contents of a lookup table change according to an input image to perform the optimum quantization.
- Various adaptive sampling methods have been proposed, but all perform quantization by the following four steps. (Here we assume that an input image is defined in an RGB space).
- Step 2 and subsequent steps determine the image quality, but the key steps for the quantization itself are Steps 2 and 3; the quality of the quantization depends on Step 2 where "k" representative colors are selected, and Step 3 where colors "close” to remaining colors are selected from the "k” representative colors, and assigned.
- Step 4 error diffusion utilising errors of the quantization of dithering (a random noise method) are also used in many cases.
- Step 2 A known technique for performing Step 2 is listed in the following.
- P. Heckbert "Color Image Quantization for Frame Buffer Display,” ACM SIGGRAPH, July, 1982 discloses the popularity algorithm and the median cut algorithm.
- the former is a method that sorts a histogram in descending order of frequency, and selects "k" colors from the top as the representative colors. This method is simple, but has a noticeable disadvantage that the image quality significantly deteriorates if many colors are distributed with equal frequency.
- the latter is a method that calculates maximum and minimum values in each direction of R, G, and B components, and splits the space with their median value recursively. Extra time is necessary to find the maximum and the minimum values in each direction of R, G, and B components, and, if the median values are given in real numbers, a major amount of processing time is required because of real number calculation. If they are given in integers, there is the disadvantage that errors may be caused whether they are truncated or rounded.
- U. S. Patent No. 4,654,720 discloses the population equalization algorithm. It is a method that selects "k" representative colors while finding neighbourhood spaces which render the frequency of the "k” colors as equal as possible in the color-space. This method provides excellent image quality, but a lot of time is necessary to merge the neighbourhood spaces depending on the input image, and an enormous amount of storage is required.
- US 4, 710, 806 discloses a fixed are and chromaticity based algorithm. It is a method in which a fixed area is provided in a color lookup table in advance, entries whose values appear in the fixed area are removed from the histogram before a histogram is generated based on the ratio between R, G, and B (chromaticity), and representative colors are found according to peak values appearing therein. Colors in a region with constant chromaticity and varying lightness are mainly selected by utilizing the characteristic of the human eye that is sensitive to the lightness.
- Existence or nonexistence of the fixed area depends on an input image, so that it may be an advantage or a disadvantage.
- a major drawback is that this technique requires a lot of processing time because real number calculation is involved in a series of processes such as generation of the histogram for brightness and detection of the peaks (particularly, calculation of angles such as arc cosine).
- Step 3 involves finding neighbourhood representative color for those remaining colors with more than one entry in the histogram.
- the technique described in US 4, 654, 720 processes them through merge while incrementing the distance as 1-st neighbourhood, 2-nd neighbourhood, and so on.
- Other approaches find representative neighbourhood colours by introducing some measures of distance (for example, Euclidean distance in the RGB space). The distance calculation involved in finding the neighbourhood is a time-consuming process.
- the present invention provides a means for processing both Steps 2 and 3 utilising an adaptive sampling method at a high speed.
- the processing time and the storage required for quantization are proportional to the number of colors simultaneously displayable on the color display, and are not affected by the number of colors and the distribution of colors specific to the original image. Due to the decrease in storage required the invention can be implemented on a personal computer.
- a color image quantization system is presented in which selection of representative color data to be loaded into a look up table are determined by division of an original color space to generate child-color spaces, which in turn are repeatedly divided until at least k child-color spaces have been generated, where k equals the number of addresses to the LUT, the order in which the color spaces are divided being dependent upon the frequency of original image pels whose color lies within each color space.
- the order of color-space division is determined by the value of a space-occupying number for a color-space, the number being obtained by calculating the number of pels of the original image with colors that lie within the color-space and multiplying the calculation by a weighting-factor corresponding to the level of the division, the level being related to the number of times the original color-space has been divided to yield the color-space.
- the weighting-factor becomes larger as the division level becomes higher, and the color-spaces are divided in descending order of space-occupying number.
- a method and apparatus for color image quantization which selects "k" display colors from 2 ⁇ ni colors obtained by assigning n i bits to represent the intensity level of each of "a" kinds of basic color (1 ⁇ i ⁇ a); and quantizies an original color image comprising a number of pels for which any one of the said 2 ⁇ ni colors may be assigned so that it may be displayed with the said "k" display colors:
- a kind of basic color are typically those basic colors such as red, green and blue.
- the scope of the invention is not limited to an image consisting of only these color components.
- a component such as ground surface temperature may be included as a basic component.
- an image to be quantized could be called a multi-dimensional multi-value image.
- color image is used for convenience.
- the invention can apply to a multi-dimensional multi-value image, it is described as an apparatus for simple color image quantization by exemplifying a color-space consisting of red, green and blue components.
- Figure 1 shows a schematic of apparatus for color image quantization.
- the apparatus broadly consists of four units; a histogram generator, a representative color selector, a neighbourhood representative color mapping device, and an index image generator. It is assumed that each of the red, green and blue components of an original image to be displayed is "n" bits, and that a display utilising a color LUT selects and displays "k" colors (hereinafter called “representative colors”) from a color-space consisting of "m” bits for each of the red, green, and blue components.
- the apparatus performs quantization of a color image and the following describes the processing sequence in conjunction with each of the above units.
- the histogram generator receives an original image to be displayed, finds the frequency of colors used in the image, and outputs a histogram.
- the original image being received is represented by "n" bits for each of the red (R), the green (G), and the blue (B) components, and the histogram output has "m” bits for each of R, G, and B (n ⁇ m).
- Figure 2 shows an example of a histogram
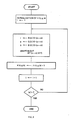
- Figure 3 illustrates the processing sequence of the histogram generator.
- N indicates the number of pels in the original image
- R(i), G(i) and B(i) indicate the i-th pel data of the original image ("n" bits for each of R, G and B), respectively
- r, g, and b indicate data consisting of only significant "m” bits taken from data of R(i), G(i) and B(i), respectively
- H (r, g, b) indicates the frequency of use (count value) for elements (r, g, b) in a color-space represented by "m" bits for each of the red, the green, and the blue components.
- Step 2 the representative color selector recursively divides into eight the color-space represented by "m" bits for each of the red, the green, and the blue components, and finally obtains "k" divided color-spaces from which the representative colors are selected.
- the color-space is recursively divided into eight so that the number of pels (frequency of use) assigned in each divided color-space may become as nearly equal as possible.
- a divided color-space management list and a division priority management list are introduced to implement the above.
- the embodiment herein treats a three-dimensional space having red, green, and blue components, the space is divided into eight, and the divided color-space management list has an eight-branch (oct-tree) structure.
- the list will be a four-branch (quad-tree) structure if the space is two-dimensional, or a 16-branch structure if it is four-dimensional.
- FIG 4 shows the relation between the color-space and eight divided spaces.
- each of the red, the green, and the blue components has a value in a range from the lower limit of 0 to the upper limit of 2 m - 1.
- the entire color-space is divided into eight.
- the eight divided spaces are number from (1) to (8) according to the numbering practice as shown in Figure 4. They are called child color-spaces (child-octants) to the original color-space.
- the original space is called a parent color-space (parent-octant) to those child color-spaces (1) to (8).
- Each child color-space is further subject to division into eight. As division is repeated, the difference between the lower and the upper limits becomes smaller.
- Each element (node) in the divided color-space management list (node) has the following information for controlling each child color-space:
- the level in the tree structure (1) has a value of up to "m" at the deepest level. At the level “m,” the upper limit coincides with the lower limit. This means that the space cannot be divided any more at the level "m.”
- the space-occupying number (3) can be found by multiplying the frequency of use in the histogram found in Step 1 by a weighing-factor determined according to the depth of the tree structure (level) (1).
- the color index of a color LUT (4) and the representative color (5) are set in Step 2 or 3.
- the pointers (6) and (7) are pointers connecting the parent color-space and the child color-space according to the numbering rules shown in Figure 4 when the parent color-space is divided into eight child color-spaces, and back pointers enabling easy reference from a child color space generated through division to the parent color space.
- all the pointers of (7) are empty (NULL).
- NULL empty
- the color space is not assigned for a memory for its control, and is treated as an empty (NULL) space. Therefore, some of the pointers to the child color-spaces may be empty (NULL).
- the division priority management list is used to determine which space should be divided into eight next, while a color-space is recursively divided into eight.
- Figure 7 shows a division priority management list.
- Each element of the list is rearranged in descending order of the space-occupying number whenever a color-space is divided into eight.
- each element (node) of the list has the following three pointers:
- Figure 8 shows the process in which a color-space is divided two-dimensionally for easy understanding.
- the numerals in the divided color-space of Figure 8 indicate examples of the space-occupying number.
- a color-space is divided into four, and provides four child-color spaces.
- the above-mentioned divided color-space management list as well as the division priority management list are generated, so that the elements are arranged in descending order of the space-occupying number (proc-1 in Figures 8 and 9).
- a child-space (A) at the top of the division priority management list pointed by the division priority controlling pointer (CPTR), or having the largest space-occupying number is selected as the object of division, and divided into four.
- the divided color-space management list is updated in the same manner as above, and the division priority management list is rearranged and updated for its elements in the descending order of the space-occupying number (proc-2 in Figures 8 and 9). Such a process of division into four is recursively repeated until the number of divided color-spaces reaches "k" (the number of representative colors).
- the division of a color-space may be stopped at the moment when the number of color-spaces registered in the division priority management list reaches "k," and Steps 3 and 4 are started.
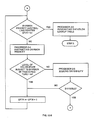
- a child color-space to be divided is selected in the following manner. First, assuming that a child color-space at the top of the division priority management list pointed by CPTR (P in Figure 10) is divided into four, if the largest value of the space-occupying numbers for these four child color-spaces is larger than than that of the space-occupying number for a child color-space (R) at the end of the current division priority management list, the color-space (P) at the top of the division priority management list is divided into four. Otherwise, CPTR moves to the second child color-space (Q), which is then selected as the object of the division and divided into four. The same process is repeated, and the process of Step 2 is completed when CPTR points to the k-th child color-space R.
- the representative color selector determines representative colors from colors contained in "k" child color-spaces in the final division priority management list generated in Step 2, and sets color indexes of the representative colors to corresponding "k" child color-spaces in the divided color-space management list. It also generates a color lookup table (LUT) that is a correlation table of the representative colors and the color indexes (see Figure 11A). The color indexes are also set in the corresponding entries in the histogram.
- LUT color lookup table
- Step 3 Mapping to neighborhood representative color
- the neighbourhood representative color mapping device determines representative colors closest to those of the original image, and sets indexes of the representative colors in the histogram generated in Step 1 (see Figure 11B).
- Step 3 consists of the following two major processes.
- the color index of the child color space having the largest space-occupying number among those with representative colors is recursively set as its color index.
- Neighbourhood representative colors for mapping are determined in the following manner for entries of the histogram generated in Step 1 whose use frequency is non-zero, and which are not selected as the representative colors.
- the index image generator replaces the color of each pel of the original image to an index of the representative color by referring to the histogram with indexes of the representative colors generated in Step 3 to generate an index image in which a pel sequence is represented by an index sequence.
- Figure 13 shows a more detailed process flow of the representative color selector. It has six processors. Input signals, output signals and processing procedure of each processor are described below.
- Processor 2-1 (processor for generating a divided child color-space)
- the processor 2-1 receives the divided color-space data to be divided and the histogram as input signals, and outputs child color-space data as output signals.
- the contents of the input and the output signals are provided as follows:
- the CPU of the processor 2-1 executes the following operation.
- Figure 14 shows the procedure of operation (i).
- Figure 15 shows a circuit used for the procedure of operation (ii).
- an input signal string is sequentially represented by a set of four elements, (i, j, k, SW), and an output signal string is represented by a set of two elements, (k, (i + j)/2) or ((i + j)/2, k).
- the processor 2-2 receives a divided color-space to be inserted as input signals, and generates a division priority management list inserted with the divided color-space as the output signals.
- VAL (i) is integer data values which are sorted in the descending order.
- the space-occupying number is given by the following equation: Space-governing number ⁇ (Total number of frequency of use of color contained in the divided color-space) x (Weighing-factor corresponding to the level of the divided color-space)
- Figure 17 shows the processing procedure of the processor 2-2.
- the processor 2-3 receives the current division priority management list as input signals, and generates a division priority management list, the entry at the end of which is deleted, as the output signals.
- the processor 2-4 receives the division priority controlling pointer CPTR and the division priority management list as the input signals, and generates divided color-spaces (octants) as the output signals.
- Processor 2-5 (processor for judging divisibility)
- the processor 2-5 receives a divided color-space, which is a candidate of division, a division priority management list and a histogram as the input signals, and generates judgment value whether or not it can be divided as the output signals.
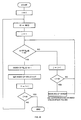
- Figure 18 shows the processing procedure.
- the processor 2-5 includes the processor 2-1.
- Processor 2-6 (processor for generating a color LUT)
- the processor 2-6 receives the division priority management list, the divided color-space management list and the histogram as the input signals, and generates a color lookup table and an updated divided color-space management list as the output signals.
- N e is the number of non-zero entries in the histogram H (r, g, b).
- the processor 2-6 has the following two major processes.
- the processing flow of Figure 20 determines an average value obtained from color data of colors contained in a representative color-space weighed by the frequency of use of that color, as a representative color.
- a color with the highest frequency in the representative color-space may be selected as the representative color, but the process as shown in Figure 20 is preferable when taking image quality into consideration.
- a color index is set to a corresponding entry in the histogram.
- Figure 21 shows the processing flow of the neighbourhood representative color mapping device.
- the device has two processors. The following shows input signals, output signals, and processing flows of each processor.
- Processor 3-1 (processor for providing color index to parent color-space)
- the processor 3-1 receives the divided color-space management list as the input signals, sets a color index of a child color-space with the largest space-occupying number to the parent color-space in the list, and generates an updated divided color-space management list as the output signals.
- This processor can be very simply described by using recursive processing. Only an initial value and the root divided color-space of the divided color-space management list are given as the input signals. Then, the process is performed in the flow as shown in Figure 22. However, it is assumed that large integers are set in the divided color-space management list for the divided color-spaces other than those having the index values (value of 1 to K) set by the processor 2-6. Because a child color-space with the largest space-occupying number appears at the top of the division priority management list, it corresponds to the space with the smallest index value.
- Processor 3-2 (processor for generating color index portion of a histogram)
- the processor 3-2 receives a histogram with a color index having non-zero entries of N e ( Figure 11B), a color lookup table having "k" color indexes, and the divided color-space management list as the input signals, and generates an updated histogram with color indices.
- I (r, g, b) (histogram with color index (color index portion): integer data)
- Figure 23 shows the processing flow of the processor 3-2. As shown in the figure, the process for providing the color index of the neighbourhood representative color is performed by traversing the divided color-space management list provided with the color index as described above.
- a histogram (4 bits for each of R, G, and B) is created from the original image ( Figure 24).
- a single circle represents each divided color-space, the upper part of which indicates the frequency of use of the contained color, while the lower part indicates the color index in the color LUT.
- the divided color-space management list actually contains the space-occupying number, the total number of frequency of use of colors contained in each space is indicated in the figure for convenience.
- a double circle represents a divided color-space remaining in the division priority management list obtained in Step 2 which a color index was assigned to in advance.
- An index image is created by using applicable color index values, which are determined by referring to the color indexed histogram based on the values of r, g, and b (4 bit values that were made the entries of the histogram in Step 1) of the original image while scanning it.
- the division priority management list is updated, its elements are rearranged in descending order of space-occupying number, so that the division priority controlling pointer (CPTR) points to an element as close to the top of the list as possible, or the one with as large a space-occupying number as possible.
- the division priority management list is not necessarily sorted. Of course, in that case, the process for determining the element pointed by the CPTR is more complicated.
- the entries of the histogram store data of corresponding color indexes.
- the color-space subject to the division is not limited to three dimensions.
- an equal number of bits are assigned to each basic component, it is possible that a color-space to be subject to division in which the number of bits assigned to a basic component differs from that for another component.
- the number of divisions for each time other than 2 may be set for the basic component in its axial direction.
- the number of divisions for each time may be intentionally set to a number other than 8.
- This invention provides a high-speed method and an apparatus for color image quantization utilizing an adaptive sampling technique in which the processing time is substantially determined by the number of simultaneously displayed colors to be selected, but is not affected by the number of colors or the color distribution in the original image.
- Factors contributing to the improvement in the speed of color image quantization are that all calculations necessary for selecting the representative colors can be performed by integer operation, and that there is no need for calculation of the distance mapping to neighbouring representative colors.
- All that is required as data are a histogram, a divided color-space management list, and a division priority management list, so that the required storage capacity may be small. Accordingly the invention can be implemented on a personal computer.
- the divisibility of a color-space can be determined by introducing a weighing-factor which depends on the division level, so that, in a case where the original image does not have coloring that is not uniformly distributed in color-space, but has a number of local peaks, it is possible to avoid dropping of the colors representing a color group that are of low density in the color-space, but are widely distributed (they are often colors for accent). Therefore, it is possible to prevent degrading of the quantized image.
Abstract
Description
- At the present time color displays often employ a color lookup table (LUT) (see Figure 12). However, if a frame buffer can store all the intensities of red, green and blue components of image data, a color LUT becomes unnecessary; the data read from the frame buffer is used directly for video signals for the color display. Frequently, however, each of the red, the green and the blue components is represented by 8 bits, and thus 24 bits are required for one pel of the image data. In cases such as this the frame buffer requires enormous amounts of storage, and becomes expensive.
- To overcome this problem a colour LUT, can be utilised, in which the contents of the frame buffer are used as color indexes to address the LUT. The contents of the LUT representing red, green and blue components of color are read and utilized as video signals for the color display. Therefore, it is sufficient for the pel data in the frame buffer to just accommodate the number of entries of the color LUT. For example, in a case where the number of entries of the color LUT or the number of colors simultaneously displayed on the color display is 256, the pel data of the frame buffer can be represented by 8 bits (1 byte).
- At present, there are color LUT-type displays that can simultaneously display 8, 16, 32 or 256 colors. When utilising such displays a color image may have a greater number of color than the number of colors available for display (for example, a color image, where the intensity of each of the red, green and blue component is represented by 8 bits, has 16.7 million colors), it is important to be able to select the optimum number of simultaneously displayed colors, to cause as little deterioration of image quality as possible, and to map the original colors of the color image to those selected colors simultaneously displayable. Such a technique is called color image quantization.
- As described by P. Heckbert in "Color Image Quantization for Frame Buffer Display," ACM SIGGRAPH '82, pp. 297 - 307, July, 1982, color quantization can be broadly divided into uniform sampling and adaptive sampling. Uniform sampling performs quantization by uniformly dividing a color space, and giving a representative color to each divided space; reloading of a LUT is not necessary once the representative color for each divided space has been loaded. A disadvantage of this technique is that image quality is significantly degraded for an input image whose colors are not uniformly distributed in a color-space, but are locally clustered. (Here, the term color-space means various spaces such as RGB space (Red, Green, Blue space), HLS space (Hue, Lightness, Saturation space), CYMB space (Cyan, Yellow, Magenta, Black space) and L*u*v space).
- J. Tajima "Uniform Color Scale Applications to Computer Graphics," COMPUTER VISION, GRAPHICS, AND IMAGE PROCESSING, vol. 21, No. 3, pp. 305 - 325, March, 1983 discloses uniform sampling in an L*u*v space. L*u*v space means a color-space which is arranged so that color difference sensed by a human corresponds to a distance in the space, and is also called a uniform color-space.
- Adaptive sampling is a technique where the contents of a lookup table change according to an input image to perform the optimum quantization. Various adaptive sampling methods have been proposed, but all perform quantization by the following four steps. (Here we assume that an input image is defined in an RGB space).
- Step 1: Sample an input image represented by each n bits for of R, G, and B in a space with each "m" bits for each of R, G, and B (generally, m <= n), and generate a histogram.
- Step 2: Select colors to be loaded in the lookup table ("k" colors) (generally, 23m >= k).
- Step 3: Perform mapping from the sampled "m" bit RGB space to the lookup table.
- Step 4: Assign the corresponding color in the lookup table to each pel of the input image.
-
Step 2 and subsequent steps determine the image quality, but the key steps for the quantization itself areSteps Step 2 where "k" representative colors are selected, andStep 3 where colors "close" to remaining colors are selected from the "k" representative colors, and assigned. InStep 4, error diffusion utilising errors of the quantization of dithering (a random noise method) are also used in many cases. - A known technique for performing
Step 2 is listed in the following. P. Heckbert "Color Image Quantization for Frame Buffer Display," ACM SIGGRAPH, July, 1982 discloses the popularity algorithm and the median cut algorithm. The former is a method that sorts a histogram in descending order of frequency, and selects "k" colors from the top as the representative colors. This method is simple, but has a noticeable disadvantage that the image quality significantly deteriorates if many colors are distributed with equal frequency. - The latter is a method that calculates maximum and minimum values in each direction of R, G, and B components, and splits the space with their median value recursively. Extra time is necessary to find the maximum and the minimum values in each direction of R, G, and B components, and, if the median values are given in real numbers, a major amount of processing time is required because of real number calculation. If they are given in integers, there is the disadvantage that errors may be caused whether they are truncated or rounded.
- U. S. Patent No. 4,654,720 discloses the population equalization algorithm. It is a method that selects "k" representative colors while finding neighbourhood spaces which render the frequency of the "k" colors as equal as possible in the color-space. This method provides excellent image quality, but a lot of time is necessary to merge the neighbourhood spaces depending on the input image, and an enormous amount of storage is required.
- US 4, 710, 806 discloses a fixed are and chromaticity based algorithm. It is a method in which a fixed area is provided in a color lookup table in advance, entries whose values appear in the fixed area are removed from the histogram before a histogram is generated based on the ratio between R, G, and B (chromaticity), and representative colors are found according to peak values appearing therein. Colors in a region with constant chromaticity and varying lightness are mainly selected by utilizing the characteristic of the human eye that is sensitive to the lightness. Existence or nonexistence of the fixed area depends on an input image, so that it may be an advantage or a disadvantage. However, a major drawback is that this technique requires a lot of processing time because real number calculation is involved in a series of processes such as generation of the histogram for brightness and detection of the peaks (particularly, calculation of angles such as arc cosine).
-
Step 3, involves finding neighbourhood representative color for those remaining colors with more than one entry in the histogram. The technique described in US 4, 654, 720 processes them through merge while incrementing the distance as 1-st neighbourhood, 2-nd neighbourhood, and so on. Other approaches find representative neighbourhood colours by introducing some measures of distance (for example, Euclidean distance in the RGB space). The distance calculation involved in finding the neighbourhood is a time-consuming process. - The present invention provides a means for processing both
Steps - A color image quantization system is presented in which selection of representative color data to be loaded into a look up table are determined by division of an original color space to generate child-color spaces, which in turn are repeatedly divided until at least k child-color spaces have been generated, where k equals the number of addresses to the LUT, the order in which the color spaces are divided being dependent upon the frequency of original image pels whose color lies within each color space. This arrangement achieves the advantage that the number of pels (frequency of use) assigned in each divided color-space becomes as nearly equal as possible and image quality is maintained.
- In a preferred embodiment the order of color-space division is determined by the value of a space-occupying number for a color-space, the number being obtained by calculating the number of pels of the original image with colors that lie within the color-space and multiplying the calculation by a weighting-factor corresponding to the level of the division, the level being related to the number of times the original color-space has been divided to yield the color-space. In one arrangement the weighting-factor becomes larger as the division level becomes higher, and the color-spaces are divided in descending order of space-occupying number.
- A method and apparatus for color image quantization is presented which selects "k" display colors from 2Σni colors obtained by assigning ni bits to represent the intensity level of each of "a" kinds of basic color (1 ≦ i ≦ a); and quantizies an original color image comprising a number of pels for which any one of the said 2Σni colors may be assigned so that it may be displayed with the said "k" display colors:
- (a) Inputting the original image, sample in a color-space defined by assigning mi (mi ≦ ni) bits representing the intensity level of each of the "a" kinds of basic color,
and generating an a-dimension histogram, - (b)Repeating dividing a color-space into X child-spaces, when calculating a space-occupying number by:
calculating the number of pels assigned for colors within each generated child-space, referring to the histogram,
and multiplying the calculation result by a weighing-factor corresponding to a level of the division, - (c) Preparing a tree-structured list which describes a parent-child relationship of color-spaces, and updating the list by registering a newly generated color space each time a color space is divided,
- (d) Selecting "k" color spaces as representative color spaces in the descending order of the space-occupying number, among those located at ends of the tree-structured list,
- (e) Selecting a representative color for each of the said "k" representative color-spaces, and providing the representative color with an index,
- (f) For a color other than the representative color within each of the said "k" representative color-spaces, giving the index assigned for the representative color of the color-space,
for a color within a color-space other than the said representative color-spaces in the said tree-structured list, finding a representative color-space located close to the color-space, and giving it the index assigned for the found representative color-space, and - (g) For each pel in the said original image, obtaining an index given to the color assigned for the pel, and storing it in a storage device.
- The above-mentioned "a" kinds of basic color are typically those basic colors such as red, green and blue. However, the scope of the invention is not limited to an image consisting of only these color components. For example, in the field of remote sensing, a component such as ground surface temperature may be included as a basic component. In this regard, an image to be quantized could be called a multi-dimensional multi-value image. However, in the following, the term "color image" is used for convenience.
- A specific embodiment of the invention will now be described with the aid of the accompanying diagrams in which:
- Figure 1 is a diagram schematically showing the entire constitution of an embodiment according to the invention.
- Figure 2 is a diagram illustrating a histogram created by
Step 1. - Figure 3 is a flowchart for generating the histogram in
Step 1. - Figure 4 is a diagram illustrating the relationship between the RGB space and the divided color-spaces.
- Figure 5 is a conceptual diagram of a divided color-space management list.
- Figure 6 is a diagram illustrating a weighing-factor for finding a space-occupying number.
- Figure 7 is a conceptual diagram of a division priority management list.
- Figure 8 is a diagram two-dimensionally illustrating the process for dividing a color-space.
- Figures 9 and 10 are diagrams illustrating the process for generating the division priority management list.
- Figure 11 is a diagram illustrating a color-indexed histogram and a color lookup table.
- Figure 12 is a diagram schematically illustrating a color display using the color LUT technique.
- Figure 13 is a diagram illustrating the process flow of
Step 2 in detail. - Figure 14 is a diagram illustrating the process for calculating the tree-structured level of a child color-space (processor 2-1).
- Figure 15 is a diagram illustrating the process for calculating a range of a color-space occupied by a child color-space (processor 2-1).
- Figure 16 is a diagram illustrating the process for calculating the frequency of use of colors (counts) in the child color-space (processor 2-1).
- Figure 17 is a diagram illustrating the process for inserting and sorting the division priority management list (processor 2-2).
- Figure 18 is a diagram illustrating the process of the divisibility check (processor 2-5).
- Figure 19 is a diagram illustrating the process for setting color indices in the color lookup table (processor 2-6).
- Figure 20 is a diagram illustrating the process for setting color data in the color lookup table (processor 2-6).
- Figure 21 is a diagram illustrating the processing flow of
Step 3 in detail. - Figure 22 is a diagram illustrating the process for providing the color indices with the parent color-space (processor 3-1).
- Figure 23 is a diagram illustrating the process for setting the color indexes in the color indexed histogram (processor 3-2).
- Figure 24 is a diagram illustrating an example of the histogram.
- Figures 25 and 28 are diagrams illustrating examples of data for divided color-spaces after division into eight.
- Figures 26, and 29 through 35 are diagrams illustrating the process for generating the division priority management list.
- Figure 27 is a diagram illustrating an example of the divided color-space management list.
- Figure 36 through 38 are diagrams illustrating an example of final divided color-space management list.
- Although the invention can apply to a multi-dimensional multi-value image, it is described as an apparatus for simple color image quantization by exemplifying a color-space consisting of red, green and blue components.
- Figure 1 shows a schematic of apparatus for color image quantization. The apparatus broadly consists of four units; a histogram generator, a representative color selector, a neighbourhood representative color mapping device, and an index image generator. It is assumed that each of the red, green and blue components of an original image to be displayed is "n" bits, and that a display utilising a color LUT selects and displays "k" colors (hereinafter called "representative colors") from a color-space consisting of "m" bits for each of the red, green, and blue components. The apparatus performs quantization of a color image and the following describes the processing sequence in conjunction with each of the above units.
- The histogram generator receives an original image to be displayed, finds the frequency of colors used in the image, and outputs a histogram. The original image being received is represented by "n" bits for each of the red (R), the green (G), and the blue (B) components, and the histogram output has "m" bits for each of R, G, and B (n ≧ m). Figure 2 shows an example of a histogram, and Figure 3 illustrates the processing sequence of the histogram generator. In Figure 3, N indicates the number of pels in the original image, R(i), G(i) and B(i) indicate the i-th pel data of the original image ("n" bits for each of R, G and B), respectively, r, g, and b indicate data consisting of only significant "m" bits taken from data of R(i), G(i) and B(i), respectively, and H (r, g, b) indicates the frequency of use (count value) for elements (r, g, b) in a color-space represented by "m" bits for each of the red, the green, and the blue components. Once
Step 1 is completed,Step 2 is started. - In
Step 2, the representative color selector recursively divides into eight the color-space represented by "m" bits for each of the red, the green, and the blue components, and finally obtains "k" divided color-spaces from which the representative colors are selected. In this case, the color-space is recursively divided into eight so that the number of pels (frequency of use) assigned in each divided color-space may become as nearly equal as possible. - A divided color-space management list and a division priority management list are introduced to implement the above.
- Because the embodiment herein treats a three-dimensional space having red, green, and blue components, the space is divided into eight, and the divided color-space management list has an eight-branch (oct-tree) structure. The list will be a four-branch (quad-tree) structure if the space is two-dimensional, or a 16-branch structure if it is four-dimensional.
- Figure 4 shows the relation between the color-space and eight divided spaces. At the time when the color image quantization process is started, each of the red, the green, and the blue components has a value in a range from the lower limit of 0 to the upper limit of 2m - 1. First, the entire color-space is divided into eight. For the sake of convenience, the eight divided spaces are number from (1) to (8) according to the numbering practice as shown in Figure 4. They are called child color-spaces (child-octants) to the original color-space.
- The original space is called a parent color-space (parent-octant) to those child color-spaces (1) to (8).
- If the lower and the upper limits of the red, the green, and the blue components of a parent color-space are represented by (Rmin, Rmax), (Gmin, Gmax), and (Bmin, Bmax), those of the child color spaces are automatically defined according to the following rule.
- (Rmin, (Rmin + Rmax)/2), (Gmin, (Gmin + Gmax)/2), (Bmin, (Bmin + Bmax)/2)
- ((Rmin + Rmax)/2, Rmax), (Gmin, (Gmin+ Gmax)/2), (Bmin, (Bmin + Bmax)/2)
- (Rmin, (Rmin + Rmax)/2), ((Gmin + Gmax)/2, Gmax), (Bmin, (Bmin + Bmax)/2)
- ((Rmin + Rmax)/2, Rmax), ((Gmin + Gmax)/2), Gmax), (Bmin, (Bmin + Bmax)/2)
- (Rmin, (Rmin + Rmax)/2), (Gmin, (Gmin + Gmax)/2), ((Bmin + Bmax)/2, Bmax)
- ((Rmin + Rmax)/2, Rmax), (Gmin, (Gmin + Gmax)/2), ((Bmin + Bmax)/2, Bmax)
- (Rmin, (Rmin + Rmax)/2), ((Gmin + Gmax)/2, Gmax), ((Bmin + Bmax)/2, Bmax)
- ((Rmin + Rmax)/2, Rmax), ((Gmin + Gmax)/2, Gmax), ((Bmin + Bmax)/2, Bmax)
- Each child color-space is further subject to division into eight. As division is repeated, the difference between the lower and the upper limits becomes smaller.
- Thus, a tree structure as shown in Figure 5 is obtained. It is the divided color-space management list that controls this tree structure.
- Each element (node) in the divided color-space management list (node) has the following information for controlling each child color-space:
- (1) Depth of the tree structure (level)
- (2) Upper and lower limits of the red, the green, and the blue components of a child color-space.
- (3) Space-occupying number
- (4) Color index of a color lookup table (LUT)
- (5) Representative color (red, green, and blue)
- (6) Pointer to the parent color-space
- (7) Pointers to eight child color-spaces
- The level in the tree structure (1) has a value of up to "m" at the deepest level. At the level "m," the upper limit coincides with the lower limit. This means that the space cannot be divided any more at the level "m." The space-occupying number (3) can be found by multiplying the frequency of use in the histogram found in
Step 1 by a weighing-factor determined according to the depth of the tree structure (level) (1). Figure 6 shows an example of weighing-factor rules for m = 4. The color index of a color LUT (4) and the representative color (5) are set inStep - The division priority management list is used to determine which space should be divided into eight next, while a color-space is recursively divided into eight.
- Figure 7 shows a division priority management list. Each element of the list is rearranged in descending order of the space-occupying number whenever a color-space is divided into eight. Thus, each element (node) of the list has the following three pointers:
- (1) Pointer to a corresponding color-space element (node) in the divided color-space management list
- (2) Pointer to an element (node) that has a space-occupying number smaller than its space-occupying number, but is closest to it
- (3) Pointer to an element (node) that has a space-occupying number larger than its space-occupying number, but is closes to it
- Figure 8 shows the process in which a color-space is divided two-dimensionally for easy understanding. The numerals in the divided color-space of Figure 8 indicate examples of the space-occupying number.
- First, a color-space is divided into four, and provides four child-color spaces. At the time, the above-mentioned divided color-space management list as well as the division priority management list are generated, so that the elements are arranged in descending order of the space-occupying number (proc-1 in Figures 8 and 9).
- Then, a child-space (A) at the top of the division priority management list pointed by the division priority controlling pointer (CPTR), or having the largest space-occupying number is selected as the object of division, and divided into four. The divided color-space management list is updated in the same manner as above, and the division priority management list is rearranged and updated for its elements in the descending order of the space-occupying number (proc-2 in Figures 8 and 9). Such a process of division into four is recursively repeated until the number of divided color-spaces reaches "k" (the number of representative colors).
- In a case where "k" is a very large number, the division of a color-space may be stopped at the moment when the number of color-spaces registered in the division priority management list reaches "k," and Steps 3 and 4 are started.
- However, to attain further improvement of the image quality, division of the color-space, and update of the divided color-space management list and the division priority management list are further repeated.
- When the number of the divided color-spaces becomes larger than "k," as shown in Figure 10, a color-space which is (k + 1) or behind in priority is deleted from the division priority management list.
- In addition, after the number of the divided color-spaces becomes larger than "k," a child color-space to be divided is selected in the following manner. First, assuming that a child color-space at the top of the division priority management list pointed by CPTR (P in Figure 10) is divided into four, if the largest value of the space-occupying numbers for these four child color-spaces is larger than than that of the space-occupying number for a child color-space (R) at the end of the current division priority management list, the color-space (P) at the top of the division priority management list is divided into four. Otherwise, CPTR moves to the second child color-space (Q), which is then selected as the object of the division and divided into four. The same process is repeated, and the process of
Step 2 is completed when CPTR points to the k-th child color-space R. - The representative color selector determines representative colors from colors contained in "k" child color-spaces in the final division priority management list generated in
Step 2, and sets color indexes of the representative colors to corresponding "k" child color-spaces in the divided color-space management list. It also generates a color lookup table (LUT) that is a correlation table of the representative colors and the color indexes (see Figure 11A). The color indexes are also set in the corresponding entries in the histogram. - The neighbourhood representative color mapping device determines representative colors closest to those of the original image, and sets indexes of the representative colors in the histogram generated in Step 1 (see Figure 11B).
Step 3 consists of the following two major processes. - To a non-end parent color-space in the generated divided color-space management list having child ponters, the color index of the child color space having the largest space-occupying number among those with representative colors is recursively set as its color index.
- Neighbourhood representative colors for mapping are determined in the following manner for entries of the histogram generated in
Step 1 whose use frequency is non-zero, and which are not selected as the representative colors. - a) If any brother color-space, which means color-spaces having the same parent color space, is selected as a representative color, its color index is provided.
- b) If there is no such color space, the color index of the representative color of the parent color-space set in
Process 1 is provided. - c) Thus, each node in the divided color-space management list, or each color-space is provided with one color index. Then, it is sufficient to find an end node, to which the color of the entry with non-zero frequency of use in the histogram belongs, by traversing the divided color-space management list for each entry, and to set the index provided for the node to the entry.
- The index image generator replaces the color of each pel of the original image to an index of the representative color by referring to the histogram with indexes of the representative colors generated in
Step 3 to generate an index image in which a pel sequence is represented by an index sequence. - Now, a detailed explanation of the representative the color selector in
Step 2 of the above-mentioned embodiment, and the neighbourhood representative color mapping device inStep 3, is given. It should be noted that the processor described in the following may be constituted by dedicated hardware, or by a software routine. - Figure 13 shows a more detailed process flow of the representative color selector. It has six processors. Input signals, output signals and processing procedure of each processor are described below.
- The processor 2-1 receives the divided color-space data to be divided and the histogram as input signals, and outputs child color-space data as output signals. The contents of the input and the output signals are provided as follows:
-
- (1) Level of ϑin (integer data)
- (2) Rmin, Rmax of ϑin (integer data)
- (3) Gmin, Gmax of ϑin (integer data)
- (4) Bmin, Bmax of ϑin (integer data)
- (5) Three-dimensional histogram H (r, g, b) (integer data)
- The following is outputted for j = 1 to 8.
- (1) Level of ϑout (j)
- (2) Rmin, Rmax of ϑout (j)
- (3) Gmin, Gmax of ϑout (j)
- (4) Bmin, Bmax of ϑout (j)
- (5) Counts of the histogram for ϑout (j), that is, total number of the frequency of use of color (integer data)
- The CPU of the processor 2-1 executes the following operation.
- (i) Calculation of ϑout (j) level
- (ii) Calculation of Rmin, Rmax, Gmin, Gmax, Bmin, Bmax, of ϑout (j)
- (iii) Calculation of total number of the frequency of use of color in ϑout (j)
- Figure 14 shows the procedure of operation (i).
- Figure 15 shows a circuit used for the procedure of operation (ii).
- For the sake of simplicity, an input signal string is sequentially represented by a set of four elements, (i, j, k, SW), and an output signal string is represented by a set of two elements, (k, (i + j)/2) or ((i + j)/2, k). By using these, the entire operation process of (ii) is given as follows (the left side of the arrow indicating the output string, and the right side indicating the input string):
- (Rmin, Rmax) _ (Rmin of ϑin, Rmax of ϑin, Rmin of ϑin, ON)
(Gmin, Gmax) _ (Gmin of ϑin, Gmax of ϑin, Gmin of ϑin, ON)
(Bmin, Bmax) _ (Bmin of ϑin, Bmax of ϑin, Bmin of ϑin, ON) - (Rmin, Rmax) _ (Rmin of ϑin, Rmax of ϑin, Rmin of ϑin, OFF)
(Gmin, Gmax) _ (Gmin of ϑin, Gmax of ϑin, Gmin of ϑin, ON)
(Bmin, Bmax) _ (Bmin of ϑin, Bmax of ϑin, Bmin of ϑin, ON) - (Rmin, Rmax) _ (Rmin of ϑin, Rmax of ϑin, Rmin of ϑin, ON)
(Gmin, Gmax) _ (Gmin of ϑin, Gmax of ϑin, Gmax of ϑin, OFF)
(Bmin, Bmax) _ (Bmin of ϑin, Bmax of ϑin, Bmin of ϑin, ON) - (Rmin, Rmax) _ (Rmin of ϑin, Rmax of ϑin, Rmax of ϑin, OFF)
(Gmin, Gmax) _ (Gmin of ϑin, Gmax of ϑin, Gmax of ϑin, OFF)
(Bmin, Bmax) _ (Bmin of ϑin, Bmax of ϑin, Bmin of ϑin, ON) - (Rmin, Rmax) _ (Rmin of ϑin, Rmax of ϑin, Rmin of ϑin, ON)
(Gmin, Gmax) _ (Gmin of ϑin, Gmax of ϑin, Gmin of ϑin, ON)
(Bmin, Bmax) _ (Bmin of ϑin, Bmax of ϑin, Bmax of ϑin, OFF) - (Rmin, Rmax) _ (Rmin of ϑin, Rmax of ϑin, Rmax of ϑin, OFF)
(Gmin, Gmax) _ (Gmin of ϑin, Gmax of ϑin, Gmax of ϑin, ON)
(Bmin, Bmax) _ (Bmin of ϑin, Bmax of ϑin, Bmax of ϑin, OFF) - (Rmin, Rmax) _ (Rmin of ϑin, Rmax of ϑin, Rmin of ϑin, ON)
(Gmin, Gmax) _ (Gmin of ϑin, Gmax of ϑin, Gmax of ϑin, OFF)
(Bmin, Bmax) _ (Bmin of ϑin, Bmax of ϑin, Bmax of ϑin, OFF) - (Rmin, Rmax) _ (Rmin of ϑin, Rmax of ϑin, Rmax of ϑin, OFF)
(Gmin, Gmax) _ (Gmin of ϑin, Gmax of ϑin, Gmax of ϑin, OFF)
(Bmin, Bmax) _ (Bmin of ϑin, Bmax of ϑin, Bmax of ϑin, OFF) - The operation of (iii) is processed in the flow shown in Figure 16 by using the output signals of (ii).
- The processor 2-2 receives a divided color-space to be inserted as input signals, and generates a division priority management list inserted with the divided color-space as the output signals.
-
- (1) Level of ϑin (integer data) ... being represented by "levelin"
- (2) Total number of the frequency of use of color in ϑin (integer data)
- (3) ID of ϑin (integer data)
- (4) m (data of number of bits in a histogram)
- (5) Nin (number of entries in the division priority management list: before insertion)
-
- (1) Nout (number of entries in the division priority management list: after insertion)
- (2) ID (i) (ID of the i-th child color-space in the list (1 ≦ i ≦ Nout) : integer data)
- (3) VAL (i) (space-occupying number for the i-th child color-space in the list)
- Wherein VAL (i) is integer data values which are sorted in the descending order. The space-occupying number is given by the following equation:
Space-governing number ≡ (Total number of frequency of use of color contained in the divided color-space) x (Weighing-factor corresponding to the level of the divided color-space) - The weighing-factor provides weighing (m + 1 - level) times for the direction of each axis of an RGB space according to the level of the divided color-space so that it can accommodate division of a "m" bits space. It indicates how many times a wider area the space has than the state where it is exactly divided into "m" in the direction of the axis (m = level). Because the RGB space is in fact three-dimensional, the weighing-factor is defined as (m + 1 - level)³.
- Figure 17 shows the processing procedure of the processor 2-2.
- The processor 2-3 receives the current division priority management list as input signals, and generates a division priority management list, the entry at the end of which is deleted, as the output signals.
-
- (1) Nin (number of entries in the division priority management list: before deletion)
- (2) ID (i) (ID of the i-th divided color-space in the list (1 ≦ i ≦ Nin) : integer data)
- (3) VAL (i) (space-occupying number for the i-th divided color-space in the list)
-
- (1) Nout (number of entries in the division priority management list: after deletion)
- (2) ID (i) (ID of the i-th divided color-space in the list (1 ≦ i ≦ Nout) : integer data)
- (3) VAL (i) (space-occupying number for the i-th divided color-space in the list)
- The processor 2-4 receives the division priority controlling pointer CPTR and the division priority management list as the input signals, and generates divided color-spaces (octants) as the output signals.
-
- (1) CPTR (division priority controlling pointer: integer data)
- (2) N (number of entries in the division priority management list: integer data)
- (3) ID (i) (ID of the i-th divided color-space in the list (1 ≦ i ≦ N) : integer data)
-
- (1) Level of ϑout (integer data)
- (2) Rmin, Rmax of ϑout (integer data)
- (3) Gmin, Gmax of ϑout (integer data)
- (4) Bmin, Bmax of ϑout (integer data)
- (5) Total number of frequency of use of colors in ϑout (integer data)
- The processor 2-5 receives a divided color-space, which is a candidate of division, a division priority management list and a histogram as the input signals, and generates judgment value whether or not it can be divided as the output signals.
-
- (1) Level of ϑin (integer data) .... (being represented by levelin)
- (2) Total number of frequency of use of colors in ϑin (integer data)
- (3) m (data of number of bits in a histogram)
- (4) N (number of entries in the division priority management list: integer data)
- (5) ID (i) (ID of the i-th divided color-space in the list (1 ≦ i ≦ N) : integer data)
- (6) VAL (i) (space-occupying number for the i-th divided color-space in the list)
- (7) H (r, g, b) (value data of a 3m bit histogram)
- (1) Judgment value (ON or OFF)
- Figure 18 shows the processing procedure. As shown in the figure, the processor 2-5 includes the processor 2-1.
- The processor 2-6 receives the division priority management list, the divided color-space management list and the histogram as the input signals, and generates a color lookup table and an updated divided color-space management list as the output signals.
-
- (1) K (number of entries in the divided color-space management list: integer data)
- (2) ID (i) (ID of the i-th divided color-space in the list (1 ≦ i ≦ K) : integer data)
- (3) M (total number of divided color-spaces in the divided color-space management list: integer data)
- (4) ID of ϑin (j) (integer data)
- (5) H (r, g, b) (histogram: integer data)
- (6) Rmin, Rmax, Gmin, Gmax, Bmin, Bmax of ϑin (j) (integer data)
-
- (1) R (i) (value of red of the i-th index (1 ≦ i ≦ K): integer data)
- (2) G (i) (value of green of the i-th index: integer data)
- (3) B (i) (value of blue of the i-th index: integer data)
- (4) Index value of ϑout (j) (integer data)
- Although the total number of the divided color-spaces in the divided color-space management list is represented by M herein, it always has a relation of K ≦ M ≦ Ne where Ne is the number of non-zero entries in the histogram H (r, g, b).
- In this processor, only "K" out of M output signals of ϑout (j) (1 ≦ j ≦ M) are actually set with values.
- The processor 2-6 has the following two major processes.
- (i) Scan the division priority management list, and set a color index value of a corresponding divided color-space in the table.
- (ii) Scan the division priority management list, and set color data (r, g, b) of a corresponding color index value in the table.
- In fact, both (i) and (ii) can be concurrently calculated. Figures 19 and 20 show their processing flows.
- The processing flow of Figure 20 determines an average value obtained from color data of colors contained in a representative color-space weighed by the frequency of use of that color, as a representative color. Of course, a color with the highest frequency in the representative color-space may be selected as the representative color, but the process as shown in Figure 20 is preferable when taking image quality into consideration.
- Once the representative color is determined, a color index is set to a corresponding entry in the histogram.
-
- Figure 21 shows the processing flow of the neighbourhood representative color mapping device. The device has two processors. The following shows input signals, output signals, and processing flows of each processor.
- The processor 3-1 receives the divided color-space management list as the input signals, sets a color index of a child color-space with the largest space-occupying number to the parent color-space in the list, and generates an updated divided color-space management list as the output signals.
-
- (1) Index value of ϑin (integer data)
- (2) ID of ϑin (integer data)
- (3) Parent color-space flag of ϑin (integer data)
- (4) Child color-space ID of ϑin (integer data)
- (5) M (total number of divided color-spaces: integer data)
- (1) Index value of ϑout (j)
- This processor can be very simply described by using recursive processing. Only an initial value and the root divided color-space of the divided color-space management list are given as the input signals. Then, the process is performed in the flow as shown in Figure 22. However, it is assumed that large integers are set in the divided color-space management list for the divided color-spaces other than those having the index values (value of 1 to K) set by the processor 2-6. Because a child color-space with the largest space-occupying number appears at the top of the division priority management list, it corresponds to the space with the smallest index value.
- The processor 3-2 receives a histogram with a color index having non-zero entries of Ne (Figure 11B), a color lookup table having "k" color indexes, and the divided color-space management list as the input signals, and generates an updated histogram with color indices.
-
- (1) H (r, g, b) (frequency of use portion of a histogram: integer data)
- (2) I (r, g, b) (color index portion of the histogram: integer data)
- (3) Index value of ϑin (integer data)
- (4) ID of ϑin (integer data)
- (5) Parent color-space flag of ϑin (integer data)
- (6) Child color-space ID of ϑin (integer data)
- (7) M (total number of divided color-spaces: integer data)
- (8) R (i), G (i), B (i) (color lookup table: integer data)
- (9) K (number of colors to be given: integer data)
- (1) I (r, g, b) (histogram with color index (color index portion): integer data)
- Figure 23 shows the processing flow of the processor 3-2. As shown in the figure, the process for providing the color index of the neighbourhood representative color is performed by traversing the divided color-space management list provided with the color index as described above.
- Examples of output results from each step are indicated by assuming that an original image has 256 pels, the number of representative colors k = 10, number of bits of each component of red, green and blue of a color space for a histogram m = 4.
- A histogram (4 bits for each of R, G, and B) is created from the original image (Figure 24).
-
- (1) Because the number of non-zero entries in the histogram (15) is larger than k(10), the color-space is divided into eight by the processor 2-1. Figure 25 shows the result. Figures 26 and 27 show the division priority management list and the divided color-space management list at that moment, respectively.
- (2) It is assumed that N is the number of elements in the division priority management list. Because N < k (N = 4, k = 10), the color-space (2) is selected as the color-space subject to the dividing process. Then, it is divided into eight. It should be noted that notation (2)-(1) means that the parent is divided color-space (2) and the child is (1). Figure 28 shows the result of division.
The processor 2-2 inserts and sorts these child-spaces. The divided color-spaces are arranged in the descending order of the space-occupying number that is the total number of the frequency of use of color weighed by level. The weighing-factor is given by the rule shown in Figure 6.
Thus, the division priority management list shown in Figure 29 is obtained. The value in the parentheses is obtained by multiplying the total frequency number by the weighing-factor (space-occupying number). - (3) Because N < k (N = 8, k = 10), the divided color-space (8) is selected as the divided color-space subject to the dividing process, and divided into eight. The resultant division priority management list is shown in Figure 30.
- (4) Because N < k (N = 9, k = 10), the divided color-space (8)-(2) is selected as the divided color-space subject to the dividing process, and divided into eight. The resultant division priority management list is shown in Figure 31.
- (5) Because N = k is attained, the processor 2-5 subsequently checks the divisibility in the dividing process.
Because CPTR is not equal to k, the divided color-space (2)-(2) is selected as the divided color-space subject to the dividing process.
Divisibility check:
Assuming that (2)-(2) is divided, the child color space with the highest frequency is (2)-(2)-(1). The value of it multiplied with the weighing-factor is 8*50 = 400, which is larger than the space-occupying number (8) for the last entry of the division priority management list. Thus, it is actually divided. The resultant division priority management list is shown in Figure 32.
At that moment, because N > k, divided color-spaces M = N - k are deleted from the end of the division priority management list by the processor 2-3. That is, the entry of (2)-(2)-(6) is deleted. - (6) Because CPTR is not equal to k, the divided color-space (2)-(8) is selected as the divided color-space subject to the dividing process.
Divisibility check:
Assuming that (2)-(8) is divided, the child color space with the highest frequency is (2)-(8)-(3). The value of it multiplied with the weighing-factor is 8*30 = 240, which is larger than the value of the last entry (8) of the division priority management list. Thus, it is actually divided. The resultant division priority management list is shown in Figure 33.
At that moment, because N > k is attained again, divided color-spaces only to the number of M = N - k (= 2) are deleted from the end of the division priority management list by the processor 2-3. - (7) The dividing process is sequentially executed up to the divided color-spaces (2)-(4), (3), (8)-(2)-(1), and (2)-(6) in exactly the same manner, the division priority management list is as shown in Figure 34.
Until this point, CPTR always points to the top element. However, if the divided color-space (2)-(2)-(1) is then selected and checked for divisibility, the one with the highest frequency of supposed child color-spaces is (2)-(2)-(1)-(7). However, the value multiplied with the weighing-factor is only 50. This is smaller than the value of the end of the division priority management list. Therefore, it is not divided. Thus, CPTR _CPTR + 1 is attained, which means that the divided color-space (2)-(2)-(1) is selected as the first object for output. - (8) Because CPTR (2) is not equal to k, it is intended to perform a similar dividing process with the divisibility check. The divisibility check judges that neither divided color-space of (2)-(4)-(7) nor (2)-(6)-(4) can be divided any more, and CPTR is incremented twice and becomes 4.
Because the color-space (8)-(6)-(2) that is one of supposed color-spaces of the divided color-space (8)-(6) has the largest space-occupying number (160), the color-space (8)-(6) is actually divided, and its child color-spaces are inserted and sorted in the division priority management list. The same is true of the divided color-space (3)-(8). Because the supposed color-space (3)-(8)-(4) has the space-occupying number of 160, the color-space (3)-(8) is actually divided, and its child color-spaces are inserted and sorted in the division priority management list. At that moment, the list after the CPTR is as shown in Figure 35. - (9) Then, all of the divided color-spaces pointed by the CPTR are rejected in the divisibility check, so that only the CPTR is repeatedly incremented and reaches the divided color-space (2)-(5) at the end of the division priority management list. Thus, CPTR = k is attained. Finally, the processor 2-6 provides color indices for the representative colors (r, g, b) corresponding to divided color-spaces from the top of the division priority management list.
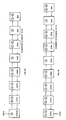
- The divided color-space management list obtained is shown in Fig. 3.
- In the figure, a single circle represents each divided color-space, the upper part of which indicates the frequency of use of the contained color, while the lower part indicates the color index in the color LUT. Although the divided color-space management list actually contains the space-occupying number, the total number of frequency of use of colors contained in each space is indicated in the figure for convenience. A double circle represents a divided color-space remaining in the division priority management list obtained in
Step 2 which a color index was assigned to in advance. - (1) The first process in
Step 3 is one in which each non-end node in the divided color-space management list of Figure 36 is set with the child divided color-space of the highest frequency of use from its divided color-spaces, or the one with the largest space-occupying number. Figure 37 shows the result of the setting. - (2) The second process in
Step 3 is one in which the color index is set for the end node for which the color index is not yet set while looking for it in the neighbourhood. (No calculation is made for distance.) Its rule is to:
<a> First, look for a brother divided color-space (from the closest one), and
<b> If there is no brother, or if a color index is not set for a brother, if any, look for the color index that was set to the parent color-space in the above first process. - In this example, the result of setting is as shown in Figure 38 according to <a>.
- At this moment, all color indices are found, and there is no case where <b> is applied.
Even if, as in the case of the divided color-space (8)-(2)-(3), no index is set for the brother (8)-(2)-(1) in the initial stage, the color index is set inStep 1, so that there is no need to refer to the parent color-space (8)-(2) by applying the rule <b>.
Subsequently, as described, color indexes are provided for non-zero entries in the histogram for which no color index is yet provided by traversing the divided color-space management list determined as in Figures 36 through 38. These color indices are then set in the histogram. - An index image is created by using applicable color index values, which are determined by referring to the color indexed histogram based on the values of r, g, and b (4 bit values that were made the entries of the histogram in Step 1) of the original image while scanning it.
Although a specific embodiment has been described a number of variations may be possible. - For example, in the above embodiment, whenever the division priority management list is updated, its elements are rearranged in descending order of space-occupying number, so that the division priority controlling pointer (CPTR) points to an element as close to the top of the list as possible, or the one with as large a space-occupying number as possible. However, the division priority management list is not necessarily sorted. Of course, in that case, the process for determining the element pointed by the CPTR is more complicated.
- In addition, in the above embodiment, the entries of the histogram store data of corresponding color indexes. However, it is possible to create a correlation table between the color and the color index separate from the histogram.
- Furthermore, even if the embodiment described, it is a matter of course that some steps may be changed in the sequence of the process. For example, setting of the color indexes in the histogram may be conducted in
Step 3 for all entries. - As previously stated, the color-space subject to the division is not limited to three dimensions. In the above embodiment, although an equal number of bits are assigned to each basic component, it is possible that a color-space to be subject to division in which the number of bits assigned to a basic component differs from that for another component. In this case, the number of divisions for each time other than 2 may be set for the basic component in its axial direction. Of course, in the three-dimensional cubic color-space, as in the above embodiment, the number of divisions for each time may be intentionally set to a number other than 8.
- This invention provides a high-speed method and an apparatus for color image quantization utilizing an adaptive sampling technique in which the processing time is substantially determined by the number of simultaneously displayed colors to be selected, but is not affected by the number of colors or the color distribution in the original image.
- Factors contributing to the improvement in the speed of color image quantization are that all calculations necessary for selecting the representative colors can be performed by integer operation, and that there is no need for calculation of the distance mapping to neighbouring representative colors.
- All that is required as data are a histogram, a divided color-space management list, and a division priority management list, so that the required storage capacity may be small. Accordingly the invention can be implemented on a personal computer.
- In addition, it is arranged that the divisibility of a color-space can be determined by introducing a weighing-factor which depends on the division level, so that, in a case where the original image does not have coloring that is not uniformly distributed in color-space, but has a number of local peaks, it is possible to avoid dropping of the colors representing a color group that are of low density in the color-space, but are widely distributed (they are often colors for accent). Therefore, it is possible to prevent degrading of the quantized image.
Claims (10)
and generating an a-dimension histogram,
calculating the number of pels assigned for colors within each generated child-space, referring to the histogram,
and multiplying the calculation result by a weighing-factor corresponding to a level of the division,
for a color within a color-space other than the said representative color-spaces in the said tree-structured list, finding a representative color-space located close to the color-space, and giving it the index assigned for the found representative color-space.
and generating an a-dimension histogram,
calculating the number of pels assigned for colors within each generated child-space, referring to the said histogram,
and multiplying the calculation result by a weighing-factor corresponding to a level of the division,
selecting said color-space as the representative color space if it is not divisible, or
selecting said color-space as the object of division if it is divisible,
for the representative color of the color-space,
for a color within a color-space other than the said representative color-spaces in the said tree-structured list, finding a representative color-space located close to the color-space, and giving it the index assigned for the found representative color-space,
and generating an a-dimension histogram,
and multiplying the calculation result by a weighing-factor corresponding to a level of the division,
for colors in the color-space not registered in said second list, for finding a color-space in said second list located in the neighbourhood of said color-space by scanning said first list, and providing it with the index provided for the representative color of said found color-space; and
and generating an a-dimension histogram,
and multiplying said calculation result by a weighing-factor corresponding to a level of the division,
further evenly dividing a child-color space with a large space-occuping number into X so that the space-occupying numbers of the child color-spaces are balanced, and
executing the operations of (b2), (b3) and (b4),
In addition, it is arranged that the divisibility of a color-space can be determined by introducing a weighing-factor which depends on the division level, so that, in a case where the original image does not have coloring that is not uniformly distributed in the color-space, but has a number of local peaks, it is possible to avoid dropping of the colors representing a color group that are of low density in the color-space, but are widely distributed (they are often colors for accent). Therefore, it is possible to prevent degrading of the quality of the quantized image.
Applications Claiming Priority (2)
| Application Number | Priority Date | Filing Date | Title |
|---|---|---|---|
| JP63269514A JPH087553B2 (en) | 1988-10-27 | 1988-10-27 | Color image quantization method and apparatus |
| JP269514/88 | 1988-10-27 |
Publications (3)
| Publication Number | Publication Date |
|---|---|
| EP0366309A2 true EP0366309A2 (en) | 1990-05-02 |
| EP0366309A3 EP0366309A3 (en) | 1991-08-28 |
| EP0366309B1 EP0366309B1 (en) | 1995-06-07 |
Family
ID=17473466
Family Applications (1)
| Application Number | Title | Priority Date | Filing Date |
|---|---|---|---|
| EP89310452A Expired - Lifetime EP0366309B1 (en) | 1988-10-27 | 1989-10-12 | Colour image quantization system |
Country Status (4)
| Country | Link |
|---|---|
| US (1) | US5049986A (en) |
| EP (1) | EP0366309B1 (en) |
| JP (1) | JPH087553B2 (en) |
| DE (1) | DE68922959D1 (en) |
Cited By (12)
| Publication number | Priority date | Publication date | Assignee | Title |
|---|---|---|---|---|
| EP0580302A2 (en) * | 1992-07-22 | 1994-01-26 | International Business Machines Corporation | Method and apparatus for generating a color palette |
| US5331439A (en) * | 1992-03-10 | 1994-07-19 | Scitex Corporation Ltd. | Apparatus and method for color transformation |
| EP0923037A1 (en) * | 1997-12-12 | 1999-06-16 | Hewlett-Packard Company | Common pruned radial and pruned tetrahedral interpolation hardware implementation |
| US5966474A (en) * | 1997-12-12 | 1999-10-12 | Hewlett-Packard Company | Non-symmetric radial and non-symmetric pruned radial interpolation |
| US6031642A (en) * | 1997-12-12 | 2000-02-29 | Hewlett-Packard Company | Tetrahedral and pruned tetrahedral interpolation |
| US6040925A (en) * | 1997-12-12 | 2000-03-21 | Hewlett-Packard Company | Radial and pruned radial interpolation |
| US6040926A (en) * | 1997-12-12 | 2000-03-21 | Hewlett-Packard Company | Common non-symmetric pruned radial and non-symmetric pruned tetrahedral interpolation hardware implementation |
| US6049400A (en) * | 1997-12-12 | 2000-04-11 | Hewlett-Packard Company | Non-symmetric tetrahedral and non-symmetric pruned tetrahedral interpolation |
| WO2004040520A1 (en) * | 2002-11-01 | 2004-05-13 | Cae Inc. | Method and apparatus for providing calligraphic light point display |
| EP1514237A1 (en) * | 2001-03-20 | 2005-03-16 | Konan Technology Inc. | Method for abstracting histogram of hsv color |
| EP1518220A1 (en) * | 2002-05-13 | 2005-03-30 | Genesis Microchip, Inc. | Apparatus and method for multi-resolution color mapping for display devices |
| EP2046064A1 (en) * | 2006-10-05 | 2009-04-08 | Panasonic Corporation | Light emitting display device |
Families Citing this family (48)
| Publication number | Priority date | Publication date | Assignee | Title |
|---|---|---|---|---|
| US5222154A (en) * | 1991-06-12 | 1993-06-22 | Hewlett-Packard Company | System and method for spot color extraction |
| US5365252A (en) * | 1991-09-23 | 1994-11-15 | Ricoh Company, Ltd. | Color quantization apparatus and method for frame buffer display |
| US5684897A (en) * | 1992-02-19 | 1997-11-04 | Ezel Inc. | Method for quantizing color image data by minimizing least squares error of binary coding |
| US5509111A (en) * | 1992-04-27 | 1996-04-16 | International Business Machines Corporation | Color image region management system and color image region management method and color image region retrieval method |
| US5418895A (en) * | 1992-11-25 | 1995-05-23 | Eastman Kodak Company | Method for displaying a high quality digital color image on a limited color display |
| JP3268512B2 (en) * | 1993-03-03 | 2002-03-25 | セイコーエプソン株式会社 | Image processing apparatus and image processing method |
| US5508718A (en) * | 1994-04-25 | 1996-04-16 | Canon Information Systems, Inc. | Objective-based color selection system |
| US5615320A (en) * | 1994-04-25 | 1997-03-25 | Canon Information Systems, Inc. | Computer-aided color selection and colorizing system using objective-based coloring criteria |
| JPH08163129A (en) * | 1994-12-09 | 1996-06-21 | Nippon Telegr & Teleph Corp <Ntt> | Multi-address function realizing method |
| US5734744A (en) * | 1995-06-07 | 1998-03-31 | Pixar | Method and apparatus for compression and decompression of color data |
| US5982990A (en) * | 1995-07-20 | 1999-11-09 | Hewlett-Packard Company | Method and apparatus for converting color space |
| US6043909A (en) | 1996-02-26 | 2000-03-28 | Imagicolor Corporation | System for distributing and controlling color reproduction at multiple sites |
| US7728845B2 (en) * | 1996-02-26 | 2010-06-01 | Rah Color Technologies Llc | Color calibration of color image rendering devices |
| US6081276A (en) * | 1996-11-14 | 2000-06-27 | International Business Machines Corporation | Method and apparatus for creating a color name dictionary and for querying an image by color name |
| AU9119098A (en) * | 1997-08-25 | 1999-03-16 | Richard A. Holub | A system for distributing and controlling color reproduction at multiple sites |
| US6518981B2 (en) * | 1997-11-12 | 2003-02-11 | Canon Kabushiki Kaisha | Generating and using a color palette |
| US6256409B1 (en) | 1998-10-19 | 2001-07-03 | Sony Corporation | Method for determining a correlation between images using multi-element image descriptors |
| US6445834B1 (en) | 1998-10-19 | 2002-09-03 | Sony Corporation | Modular image query system |
| US6236406B1 (en) * | 1998-10-21 | 2001-05-22 | Sony Corporation | Three-dimensional color space display |
| US6262710B1 (en) * | 1999-05-25 | 2001-07-17 | Intel Corporation | Performing color conversion in extended color polymer displays |
| KR100364753B1 (en) * | 1999-11-19 | 2002-12-16 | 엘지전자 주식회사 | Method of quantization of bin value of color histogram |
| US6618500B1 (en) | 1999-12-07 | 2003-09-09 | Sony Corporation | Color conversion matrix based on minimal surface theory |
| KR100422697B1 (en) * | 1999-12-27 | 2004-03-12 | 엘지전자 주식회사 | Color Space Quantization Descriptor |
| US7102648B1 (en) | 2000-04-11 | 2006-09-05 | Rah Color Technologies Llc | Methods and apparatus for calibrating a color display |
| US6522780B1 (en) | 2000-12-15 | 2003-02-18 | America Online, Inc. | Indexing of images and/or text |
| US6522779B2 (en) | 2000-12-15 | 2003-02-18 | America Online, Inc. | Representing an image with a posterized joint histogram |
| US6671402B1 (en) | 2000-12-15 | 2003-12-30 | America Online, Inc. | Representing an image with weighted joint histogram |
| US6522782B2 (en) | 2000-12-15 | 2003-02-18 | America Online, Inc. | Image and text searching techniques |
| US6556710B2 (en) | 2000-12-15 | 2003-04-29 | America Online, Inc. | Image searching techniques |
| US7079684B2 (en) * | 2001-12-05 | 2006-07-18 | Oridus, Inc. | Method and apparatus for color quantization of images employing a dynamic color map |
| US7636468B2 (en) * | 2003-11-10 | 2009-12-22 | Microsoft Corporation | System for customer and automatic color management using policy controls |
| JP5032911B2 (en) * | 2007-07-31 | 2012-09-26 | キヤノン株式会社 | Image processing apparatus and image processing method |
| US9076068B2 (en) * | 2010-10-04 | 2015-07-07 | Datacolor Holding Ag | Method and apparatus for evaluating color in an image |
| JP2012213134A (en) * | 2011-03-24 | 2012-11-01 | Sony Corp | Image processing device and method |
| CN109951714B (en) * | 2013-04-08 | 2022-11-11 | 杜比国际公司 | Method for encoding and decoding a LUT and corresponding devices |
| US11109036B2 (en) | 2013-10-14 | 2021-08-31 | Microsoft Technology Licensing, Llc | Encoder-side options for intra block copy prediction mode for video and image coding |
| RU2666635C2 (en) | 2013-10-14 | 2018-09-11 | МАЙКРОСОФТ ТЕКНОЛОДЖИ ЛАЙСЕНСИНГ, ЭлЭлСи | Features of base colour index map mode for video and image coding and decoding |
| MX2016004705A (en) | 2013-10-14 | 2016-07-18 | Microsoft Technology Licensing Llc | Features of intra block copy prediction mode for video and image coding and decoding. |
| WO2015100726A1 (en) | 2014-01-03 | 2015-07-09 | Microsoft Corporation | Block vector prediction in video and image coding/decoding |
| US10390034B2 (en) | 2014-01-03 | 2019-08-20 | Microsoft Technology Licensing, Llc | Innovations in block vector prediction and estimation of reconstructed sample values within an overlap area |
| US11284103B2 (en) | 2014-01-17 | 2022-03-22 | Microsoft Technology Licensing, Llc | Intra block copy prediction with asymmetric partitions and encoder-side search patterns, search ranges and approaches to partitioning |
| US9699468B2 (en) * | 2014-02-10 | 2017-07-04 | Microsoft Technology Licensing, Llc | Adaptive screen and video coding scheme |
| US10542274B2 (en) | 2014-02-21 | 2020-01-21 | Microsoft Technology Licensing, Llc | Dictionary encoding and decoding of screen content |
| CN105493505B (en) | 2014-06-19 | 2019-08-06 | 微软技术许可有限责任公司 | Unified intra block duplication and inter-frame forecast mode |
| EP3202150B1 (en) | 2014-09-30 | 2021-07-21 | Microsoft Technology Licensing, LLC | Rules for intra-picture prediction modes when wavefront parallel processing is enabled |
| CN106664405B (en) | 2015-06-09 | 2020-06-09 | 微软技术许可有限责任公司 | Robust encoding/decoding of escape-coded pixels with palette mode |
| US10986349B2 (en) | 2017-12-29 | 2021-04-20 | Microsoft Technology Licensing, Llc | Constraints on locations of reference blocks for intra block copy prediction |
| CN113613007B (en) * | 2021-07-19 | 2024-03-05 | 青岛信芯微电子科技股份有限公司 | Three-dimensional color lookup table generation method and display device |
Citations (2)
| Publication number | Priority date | Publication date | Assignee | Title |
|---|---|---|---|---|
| EP0159691A2 (en) * | 1984-04-27 | 1985-10-30 | International Business Machines Corporation | Color image display system |
| EP0183564A2 (en) * | 1984-11-30 | 1986-06-04 | Sony Corporation | Image forming apparatus |
Family Cites Families (4)
| Publication number | Priority date | Publication date | Assignee | Title |
|---|---|---|---|---|
| US4694404A (en) * | 1984-01-12 | 1987-09-15 | Key Bank N.A. | High-speed image generation of complex solid objects using octree encoding |
| US4689669A (en) * | 1984-11-27 | 1987-08-25 | Sony Corporation | Color graphics data processing apparatus |
| US4887151A (en) * | 1986-06-30 | 1989-12-12 | Canon Kabushiki Kaisha | Encoding apparatus for color image data with block-by-block individual quantizing or individual encoding of luminosity, structure, and color information |
| US4907075A (en) * | 1987-07-28 | 1990-03-06 | International Business Machines Corporation | Method for selecting colors |
-
1988
- 1988-10-27 JP JP63269514A patent/JPH087553B2/en not_active Expired - Lifetime
-
1989
- 1989-10-12 DE DE68922959T patent/DE68922959D1/en not_active Expired - Lifetime
- 1989-10-12 EP EP89310452A patent/EP0366309B1/en not_active Expired - Lifetime
- 1989-10-26 US US07/427,680 patent/US5049986A/en not_active Expired - Fee Related
Patent Citations (2)
| Publication number | Priority date | Publication date | Assignee | Title |
|---|---|---|---|---|
| EP0159691A2 (en) * | 1984-04-27 | 1985-10-30 | International Business Machines Corporation | Color image display system |
| EP0183564A2 (en) * | 1984-11-30 | 1986-06-04 | Sony Corporation | Image forming apparatus |
Non-Patent Citations (2)
| Title |
|---|
| IEEE GLOBAL TELECOMMUNICATIONS CONFERENCE, Houston, TX, 1st - 4th December 1986, vol. 2, pages 1138-1142; G. HOULE et al.: "Quantization of color images for display on graphics terminals" * |
| SYSTEMS AND COMPUTERS IN JAPAN, vol. 19, no. 3, March 1988, pages 73-78, New York, US; T. AGUI et al.: "Speed-up algorithm of color image quantization" * |
Cited By (19)
| Publication number | Priority date | Publication date | Assignee | Title |
|---|---|---|---|---|
| US5331439A (en) * | 1992-03-10 | 1994-07-19 | Scitex Corporation Ltd. | Apparatus and method for color transformation |
| US5412491A (en) * | 1992-03-10 | 1995-05-02 | Scitex Corporation Ltd. | Apparatus and method for color transformation |
| EP0580302A2 (en) * | 1992-07-22 | 1994-01-26 | International Business Machines Corporation | Method and apparatus for generating a color palette |
| EP0580302A3 (en) * | 1992-07-22 | 1994-09-14 | Ibm | Method and apparatus for generating a color palette |
| US5434957A (en) * | 1992-07-22 | 1995-07-18 | International Business Machines Corporation | Method and apparatus for generating a color palette |
| US6031642A (en) * | 1997-12-12 | 2000-02-29 | Hewlett-Packard Company | Tetrahedral and pruned tetrahedral interpolation |
| US5966474A (en) * | 1997-12-12 | 1999-10-12 | Hewlett-Packard Company | Non-symmetric radial and non-symmetric pruned radial interpolation |
| US6028683A (en) * | 1997-12-12 | 2000-02-22 | Hewlett-Packard Company | Common pruned radial and pruned tetrahedral interpolation hardware implementation |
| EP0923037A1 (en) * | 1997-12-12 | 1999-06-16 | Hewlett-Packard Company | Common pruned radial and pruned tetrahedral interpolation hardware implementation |
| US6040925A (en) * | 1997-12-12 | 2000-03-21 | Hewlett-Packard Company | Radial and pruned radial interpolation |
| US6040926A (en) * | 1997-12-12 | 2000-03-21 | Hewlett-Packard Company | Common non-symmetric pruned radial and non-symmetric pruned tetrahedral interpolation hardware implementation |
| US6049400A (en) * | 1997-12-12 | 2000-04-11 | Hewlett-Packard Company | Non-symmetric tetrahedral and non-symmetric pruned tetrahedral interpolation |
| EP1514237A4 (en) * | 2001-03-20 | 2008-04-23 | Konan Technology Inc | Method for abstracting histogram of hsv color |
| EP1514237A1 (en) * | 2001-03-20 | 2005-03-16 | Konan Technology Inc. | Method for abstracting histogram of hsv color |
| EP1518220A4 (en) * | 2002-05-13 | 2008-03-12 | Genesis Microchip Inc | Apparatus and method for multi-resolution color mapping for display devices |
| EP1518220A1 (en) * | 2002-05-13 | 2005-03-30 | Genesis Microchip, Inc. | Apparatus and method for multi-resolution color mapping for display devices |
| WO2004040520A1 (en) * | 2002-11-01 | 2004-05-13 | Cae Inc. | Method and apparatus for providing calligraphic light point display |
| EP2046064A1 (en) * | 2006-10-05 | 2009-04-08 | Panasonic Corporation | Light emitting display device |
| EP2046064A4 (en) * | 2006-10-05 | 2009-10-21 | Panasonic Corp | Light emitting display device |
Also Published As
| Publication number | Publication date |
|---|---|
| JPH02116893A (en) | 1990-05-01 |
| DE68922959D1 (en) | 1995-07-13 |
| EP0366309B1 (en) | 1995-06-07 |
| EP0366309A3 (en) | 1991-08-28 |
| JPH087553B2 (en) | 1996-01-29 |
| US5049986A (en) | 1991-09-17 |
Similar Documents
| Publication | Publication Date | Title |
|---|---|---|
| EP0366309B1 (en) | Colour image quantization system | |
| EP1014699B1 (en) | Method of selecting colors for pixels within blocks for block truncation encoding | |
| US4710806A (en) | Digital display system with color lookup table | |
| US5142272A (en) | Method and apparatus for processing display color signal | |
| EP0565795B1 (en) | Indexed processing of color image data | |
| US6011540A (en) | Method and apparatus for generating small, optimized color look-up tables | |
| EP0159691B1 (en) | Color image display system | |
| US6518981B2 (en) | Generating and using a color palette | |
| US5331439A (en) | Apparatus and method for color transformation | |
| US6766051B2 (en) | Adaptive tree-base lookup for non-separably divided color tables | |
| US20030011612A1 (en) | Method for representing a digital color image using a set of palette colors based on detected important colors | |
| US5130701A (en) | Digital color representation | |
| US5596510A (en) | Table-based linear interpolation for color correction system and method | |
| US6707938B2 (en) | Principal axis look-up for color correction | |
| US5666436A (en) | Method and apparatus for transforming a source image to an output image | |
| US6836563B2 (en) | Computer-readable medium and program for quantizing a data set, method and apparatus for quantizing a data set | |
| JPH10276337A (en) | Color image processor | |
| Burger et al. | Color images | |
| US6002795A (en) | Method and apparatus for transforming a source image to an output image | |
| US6295137B1 (en) | Method of color correction using multi-level halftoning | |
| US6980221B2 (en) | Method for representing a digital color image using a set of palette colors | |
| JPH0822532A (en) | Color picture processor for subtractive color processing | |
| KR0155925B1 (en) | Digital color image | |
| JP2952329B2 (en) | Image processing method | |
| Chang et al. | A dynamic color palette for color images coding |
Legal Events
| Date | Code | Title | Description |
|---|---|---|---|
| PUAI | Public reference made under article 153(3) epc to a published international application that has entered the european phase |
Free format text: ORIGINAL CODE: 0009012 |
|
| AK | Designated contracting states |
Kind code of ref document: A2 Designated state(s): DE FR GB |
|
| 17P | Request for examination filed |
Effective date: 19900820 |
|
| PUAL | Search report despatched |
Free format text: ORIGINAL CODE: 0009013 |
|
| AK | Designated contracting states |
Kind code of ref document: A3 Designated state(s): DE FR GB |
|
| 17Q | First examination report despatched |
Effective date: 19930722 |
|
| GRAA | (expected) grant |
Free format text: ORIGINAL CODE: 0009210 |
|
| AK | Designated contracting states |
Kind code of ref document: B1 Designated state(s): DE FR GB |
|
| PG25 | Lapsed in a contracting state [announced via postgrant information from national office to epo] |
Ref country code: FR Effective date: 19950607 |
|
| REF | Corresponds to: |
Ref document number: 68922959 Country of ref document: DE Date of ref document: 19950713 |
|
| PG25 | Lapsed in a contracting state [announced via postgrant information from national office to epo] |
Ref country code: DE Effective date: 19950908 |
|
| PGFP | Annual fee paid to national office [announced via postgrant information from national office to epo] |
Ref country code: GB Payment date: 19950926 Year of fee payment: 7 |
|
| EN | Fr: translation not filed | ||
| PLBE | No opposition filed within time limit |
Free format text: ORIGINAL CODE: 0009261 |
|
| STAA | Information on the status of an ep patent application or granted ep patent |
Free format text: STATUS: NO OPPOSITION FILED WITHIN TIME LIMIT |
|
| 26N | No opposition filed | ||
| PG25 | Lapsed in a contracting state [announced via postgrant information from national office to epo] |
Ref country code: GB Effective date: 19961012 |
|
| GBPC | Gb: european patent ceased through non-payment of renewal fee |
Effective date: 19961012 |