EP0365352A2 - Method of, and apparatus for, NMR spectroscopic metabolite imaging and quantification - Google Patents
Method of, and apparatus for, NMR spectroscopic metabolite imaging and quantification Download PDFInfo
- Publication number
- EP0365352A2 EP0365352A2 EP89310840A EP89310840A EP0365352A2 EP 0365352 A2 EP0365352 A2 EP 0365352A2 EP 89310840 A EP89310840 A EP 89310840A EP 89310840 A EP89310840 A EP 89310840A EP 0365352 A2 EP0365352 A2 EP 0365352A2
- Authority
- EP
- European Patent Office
- Prior art keywords
- sample
- ijk
- nmr
- volume
- coil
- Prior art date
- Legal status (The legal status is an assumption and is not a legal conclusion. Google has not performed a legal analysis and makes no representation as to the accuracy of the status listed.)
- Withdrawn
Links
Images


Classifications
-
- G—PHYSICS
- G01—MEASURING; TESTING
- G01R—MEASURING ELECTRIC VARIABLES; MEASURING MAGNETIC VARIABLES
- G01R33/00—Arrangements or instruments for measuring magnetic variables
- G01R33/20—Arrangements or instruments for measuring magnetic variables involving magnetic resonance
- G01R33/44—Arrangements or instruments for measuring magnetic variables involving magnetic resonance using nuclear magnetic resonance [NMR]
- G01R33/48—NMR imaging systems
- G01R33/483—NMR imaging systems with selection of signals or spectra from particular regions of the volume, e.g. in vivo spectroscopy
- G01R33/485—NMR imaging systems with selection of signals or spectra from particular regions of the volume, e.g. in vivo spectroscopy based on chemical shift information [CSI] or spectroscopic imaging, e.g. to acquire the spatial distributions of metabolites
-
- G—PHYSICS
- G01—MEASURING; TESTING
- G01R—MEASURING ELECTRIC VARIABLES; MEASURING MAGNETIC VARIABLES
- G01R33/00—Arrangements or instruments for measuring magnetic variables
- G01R33/20—Arrangements or instruments for measuring magnetic variables involving magnetic resonance
- G01R33/28—Details of apparatus provided for in groups G01R33/44 - G01R33/64
- G01R33/32—Excitation or detection systems, e.g. using radio frequency signals
- G01R33/36—Electrical details, e.g. matching or coupling of the coil to the receiver
- G01R33/3628—Tuning/matching of the transmit/receive coil
Definitions
- the present invention relates to nuclear magnetic resonance (NMR) spectroscopy and, for example, to novel methods for 1-, 2-, and 3-dimensional metabolite imaging and quantification using NMR spectroscopy.
- NMR nuclear magnetic resonance
- NMR nuclear magnetic resonance
- a method for spectroscopy metabolite imaging utilizes the steps of: applying to a desired portion of a sample a pulsed phase-encoding linear magnetic gradient signal in at least one of the three orthogonal dimensions of a Cartesian coordinate set, prior to acquisition of free-induction-decay NMR response signals from the sample portion; substantially eliminating from at least the sample portion eddy current fields induced responsive to the phase-encoding gradient pulses; maximizing the signal-to-noise ratio of the NMR response signals; and displaying the data resulting from Fourier transformation of the received response data.
- a high-field NMR imaging system is provided with self-shielded gradient coils, to substantially remove eddy-current effects, and a maximized SNR quadrature-driven volume RF coil is utilized for both transmission of the excitation RF pulses and reception of the RF response signals.
- the acquired FID data is filtered and a Fourier transform reconstruction, of dimension d ′ equal to one greater than the number d of spatial dimensions to be displayed, is performed, prior to phase and baseline correction of the data for the image to be displayed.
- a nuclear magnetic resonance (NMR) imaging system 10 utilizes a large magnet 11 having an open bore 11a therethrough, in which bore is provided a static magnetic field B O , of magnitude on the order of about 1.5 Tesla.
- This static field is oriented along the longitudinal, or Z, axis of the cylindrical bore. While any volumetric coordinate system can be used, we have found it advantageous to use a Cartesian coordinate system, as illustrated.
- a "whole-body" radio-frequency (RF) coil 14 is positioned within the bore of the gradient coil set 12, and is used at least for transmitting to an enclosed sample 15 an excitation RF magnetic field B1, responsive to a RF signal in coil cable 14a. Responsive to immersion in the magnetic field and to excitation with a radio-frequency signal of proper characteristics, sample 15 re-radiates a RF response signal, which may be received by the RF coil 14, and the like, for subsequent processing.
- RF radio-frequency
- the complete NMR imaging system 10 includes a computer means 16, having a suitable amount of random-access memory (RAM) means 16-1, disc memory means 16-2 and an array processor means 16-3; computer means 16 interfaces with an input/output console means 17.
- Computer 16 has a port 16a for interfacing to a data bus means 18 for sending and receiving data to, inter alia , gradient power supply means 20x, 20y and 20z, each providing the proper driving current to an associated one of the X, Y or Z gradient coils 12x, 12y or l2z.
- the gradient coils are of the self-shielded variety, as described and claimed in co-pending U.S.
- the volume RF coil may be a quadrature coil 14-1, operating with RF interface means 22 (including a pair of balun means 22a-1 and 22a-2, with suitable half-wavelength cables and a quadrature hybrid means 22b, diode T/R means 22c-1 and 22c-2, characteristic-impedance load means 22d, quarter-wavelength cable 22e and a low-noise amplifier (LNA) means 22f) as known to the art for properly connecting a NMR transmitter means 23 and receiver means 24 to a common antenna means 14-1.
- LNA low-noise amplifier
- Each of the transmitter means 23 and receiver means 24 also receives commands from bus means 18 and at least receiver means 24 also provides data back to computer means 16 via the data bus 18.
- the NMR response signal (emitted by the sample 15 to be studied) may, alternatively, be received with a surface coil means 14-2, having at least one surface coil each connected directly to its own means 22f′, and the like, for connection directly to receiver means 24.
- the signal-to-noise ratio (SNR) of the received signal is maximized by utilizing either a properly dimensioned surface coil or a maximized-SNR volume coil means 14-1 (such as one with a length less than 2 sample diameters long, as described and claimed in co-pending U.S. Application Serial No.
- An array of a plurality of surface coils, with at least one LNA, can be used if the array has been designed to maximize SNR [such as the array described and claimed in US-A-4825162 (Application 130,046, filed December 7, 1987) incorporated herein in its entirety by reference]. Additional details concerning the system 10 can be found in our U.S. Patent 4, 689,563, entitled "High-Field Nuclear Magnetic Resonance Imaging/Spectroscopy System", issued August 25, 1987, and incorporated herein in its entirety by reference.
- yet another alternative RF coil arrangement employs coaxial coplanar surface coils.
- This arrangement is ideally suited for, but not restricted to, spectroscopy studies involving the human torso, such as of the heart, liver, and the like.
- the quadrature volume coil arrangement is disconnected at points P1 and P2 (Fig. 1b), LNA 22f′ is connected to point P2, and coil 14-2 is disconnected from point P3.
- Surface coil 14-3 is now connected to point P1 and used at least for transmitting RF excitation field B1 (for example in the Y direction) to sample 15.
- the dimensions of coil 14-3 e.g.
- S t ⁇ 40 cm. are chosen such as to provide a substantially uniform RF field B1 over the sensitive volume of a first receive coil 14-4, located adjacent to the region of the interest in the sample 15.
- the diameter D r of the receive coil is chosen to be comparable to the depth from the surface of the organ or tissue of most interest.
- coils 14-4 and 14-4′ can each be one of a coaxial pair of circular coils, each with a diameter D r of about 10 cm., as would be suitable for heart studies; the field profiles of respective coil 14-4 or coil 14-4′ are depicted for the X-Y plane and the Y-Z plane, respectively in Figure 3a or Figure 3b.
- the sensitive volume of the coil over which B1 ⁇ 0.1 of its maximum falls in a region 26a and 26a′ over which B1 changes by not more than 25%.
- Transmit coil 14-3 may include diode blocking means 22c-3 which effectively turns the coil off during the response RF signal detection portion (e.g. time interval T s , as will be shown in Figure 4).
- receive coils 14-4 can include tuned diode blocking means 22c-4, comprised of a tuned series resonant circuit (with inductance 27a and capacitance 27b) at the NMR frequency of the surface coil, in order to effectively turn the detection coil off during a transmission portion (e.g. time interval T t in Figure 4) of an NMR spectroscopy study.
- the impedance of coils 14-3 and 14-4 in the presence of sample 15 can be adjusted to approximately the optimum output impedance of transmitter 23 and the input impedance (Zi) of LNA 22f using a capacitive divider means 22c-5.
- Additional coaxial coplanar coils 14-4′ and the like may be added to detect NMR signals from other nuclei.
- cardiac-gating transducer means 28 scan provide a gate signal to data port 29, of the bus, to permit NMR spectroscopy (and imaging) pulse sequences to be applied synchronous to selected periods in the cardiac cycle.
- spectroscopic metabolite images are obtained by operating system 10 in accordance with the gradient and RF signals shown in Figure 4.
- Suitable signal sequences include those described and claimed in our U.S. Patent 4,506,223, issued March 19, 1985, and incorporated herein in its entirety by reference.
- a spatially-selected NMR pulse uses a RF pulse signal 30, shown as being of a truncated sinc form, in conjunction with a non-zero G Z gradient lobe 32; both signals 30 and 32 occur in a time interval T t , commencing at a time t0, with the RF signal peaking at a mid-pulse time t1, and both RF signal pulse and gradient lobe terminating substantially at a time t2 thereafter.
- RF pulse 30 may be a 90° NMR pulse, or alternatively may be adjusted to maximize the detected NMR signal, in which case the pulse angle may be less than 90°, depending on the pulse sequence repetition period T R .
- This initial pulse selects a slab with a small Z-axis width in the sample, so that spectroscopic information in the two dimensions of the selected plane (here, the X and Y dimensions) can be spatially encoded via the subsequent phase-encoding G X and G Y gradient lobes 34 and 36, respectively.
- G X and G Y gradient lobe 34 and 36 magnitudes as shown by the broken line portions, different columns and rows of pixels in the X and Y directions are encoded.
- a Z-gradient G Z refocussing lobe 38 of substantially constant amplitude (the amplitude associated with the center of the Z slab) is provided while this two-dimensional spatial encoding sequence occurs.
- the amplitude of the G Z rephasing lobe 38 can be varied, as shown by the broken-line portions thereof, to also vary the responses in the Z direction.
- a single direction of spatial encoding say, the X direction only, then a zero value of Y-direction gradient lobe 36 and Z direction gradient lobe 38 would be utilized with the various sequential phase-encoding values of X-direction gradient lobe 34.
- the 1, 2 or 3-dimension spatial encoding gradient lobes occur from time t2 to a spatial-encoding temporal endpoint time t3 occurring at a fixed delay time interval T d after the spatially-selective pulse midpoint time t1.
- the free-induction decay (FID) signal 40 begins substantially at the gradient lobe endpoint time t3, at which time the received data is gated on, by a gating function 42 lasting for a time interval T s , to be digitized starting at time t3 and ceasing at a sequence ending time t4. It is only the gated data 40′, from time t3 to time t4, that is returned to the system computational means 16 for processing.
- This Fourier transform is performed both with respect to the spatial gradient amplitudes and also with respect to time, to yield the spectroscopic image consisting of d spatial dimensions and one chemical-shift dimension, respectively. It will be seen that omission of a phase-encoding gradient in one or more of the spatial dimensions will result in a corresponding loss of spatial discrimination in those dimensions.
- a particularly useful spectroscopic imaging sequence uses only one such phase-encoding gradient applied in the direction of the surface coil axis. Then, a 2DFT, with respect to gradient amplitude and time, yields spectra as a function of axial depth below the surface coil plane; localization in the other two spatial dimensions is provided by the inherent sensitivity profile of the surface coil, and the removal of gradient encoding in these other 2 dimensions reduces imaging time.
- FIG. 5a a set of intensity/chemical-shift-frequency spectra are shown, as the results of the (d+1)-DFT processing of the data from each of a plurality n of voxels, V i , where 1 ⁇ i ⁇ n.
- Figure 5a can show, for example, a set of spectra for voxels with one combination of eight different X values and four different Y values in a XY plane, for a single Z thickness.
- a relatively long time interval TR must usually be used between sequence repetitions of the total of N x ⁇ N y repetitions (where N x is the number of voxels in the X direction and N y is the number of voxels in the Y direction, for each of N Z different planes).
- the sequence is repeated but with a different one of the N Z slices, or planes, being excited by a frequency offset selective-excitation pulse applied in the presence of gradient G z lobe 32 followed by rephasing lobe 38, at a repetition period of T R /N z .
- the RF pulse amplitude 30 may be adjusted to compensate for the nonuniformity on a slice-by-slice basis.
- the latter compensation is achieved by weighting the pulse amplitudes for each slice according to either the average B1 field in the slice or the particular B1 field in the slice at the level of an organ of interest (with field B1 being deduced from the information in Fig. 3 herein, in Fig. 3 of US application 202,624, (European Patent Application 89305663.0) or the like).
- Figure 5b shows a 3DFT set of spectra for a single-Z-thickness volume through the head with "cells" C i,j having one (i) of eight different X-axis voxel values and one (j) of eight different Y-axis voxel values.
- a total of 64 cells are defined (by eight different lobe 34 amplitudes and eight different lobe 36 amplitudes); a spectrum is provided for each cell.
- a display may be superimposed of the periphery of the body portion being imaged. This outline 55 may be from an image taken prior, during, or after to the spectroscopic imaging procedure.
- a sample vial 57 having a known concentration of a known metabolite, can be placed in a known position (e.g. in front of the patient's head, as on a headband) so that a particular spectrum 57 is of a voxel (e.g. cell C5,2) containing only the known concentration sample (and air), and not any portion of the sample-to-be-imaged.
- a standard of known concentration having a T2* relaxation time much greater than the phase-encoding gradient application delay time interval T d , is located within the imaging field-of-view, but outside of the sample.
- Metabolite concentrations can now be quantified by comparison of the intensity of spectral components.
- 31P standards of several cm3 vials of 1M solutions of phosphoric acid, of methylene diphosphonic acid or of phosphonitrilic chloride trimer available from Aldrich Chemical Company: see J.K.
- Figure 6 illustrates one possible form for the display and presentation of the spectroscopic imaging information acquired by use of the present invention.
- a slice-selective, 8x8 voxel, 256 point 3DFT imaging sequence has been used, with T d of about 2.7 mSec. (with about 2.2 msec. used for the slice-selective gradient refocussing lobe and the phase-encoding gradient lobes, including rise and fall times), and a 10 cm. diameter surface detection coil.
- the NMR pulse power was adjusted to maximize the SNR in 31P spectra derived from the entire selected image slice in the absence of phase-encoding gradients immediately prior to commencement of the spectroscopic imaging procedure.
- absorption mode spectra were inverse-transformed, exponentially-multiplied (12 Hz line-broadening), zero-filled, retransformed, phase-corrected (zero and first order), and baseline-flattened.
- GASS steady state
- the 1H NMR signal from the selected spectroscopic image slice was also used to shim the magnet homogeneity prior to the 31P procedure, which used the depth-resolved surface coil spectroscopy (DRESS) response signal acquisition procedure, as described and claimed in U.S. Patent 4,629,988, issued December 16, 1986 and incorporated herein in its entirety by reference.
- the 1H image 60 is divided into a matrix of pixels P r,c where r is the row number (1 ⁇ r ⁇ 8) and is the column number (1 ⁇ c ⁇ 8). While spectra are available (as seen in Figure 5) for all 64 voxels in the spectroscopic image, we chose to display only 8 here, so that they could be enlarged to show detail.
- the spectra S 7,3 and S 7,4 of predominantly muscle-containing pixels P 7,3 and P 7,4 clearly show large amounts of both PCr and ATP, which are not present in the spectra S 8,2 and S 8,3 of predominantly fat-containing pixels P 8,2 and P 8,3 .
- the line 62 dividing pixel rows 7 and 8 has been so positioned as to cause these two pairs of pixels to have completely different forms of material therein.
- Pixels, such as P 6,5 or P 7,8 having a combination of muscle and fat have spectra (e.g. S 6,5 or S 7,8 ) in which the concentrations of PCr and ATP are "smeared".
Landscapes
- Physics & Mathematics (AREA)
- Spectroscopy & Molecular Physics (AREA)
- Optics & Photonics (AREA)
- High Energy & Nuclear Physics (AREA)
- Condensed Matter Physics & Semiconductors (AREA)
- General Physics & Mathematics (AREA)
- Magnetic Resonance Imaging Apparatus (AREA)
Abstract
Description
- The present invention relates to nuclear magnetic resonance (NMR) spectroscopy and, for example, to novel methods for 1-, 2-, and 3-dimensional metabolite imaging and quantification using NMR spectroscopy.
- It is highly desirable to utilize spatially-localized in-vivo nuclear magnetic resonance (NMR) spectroscopy to acquire information about the distribution of certain low-abundance or low-sensitivity elements, such as ³¹P and the like. By providing direct and non-invasive access to information about the concentration of relatively high-energy phosphate metabolites and other phosphorus compounds in living cells in normal and disease-comprised tissues, the state of the medical diagnostic arts can be advanced. Current techniques for localizing the desired NMR spectroscopy signals in human and intact animals has either invariably utilized small surface NMR detection systems, or been restricted to data acquisition from only a single selected volume element (voxel) at any one time. Thus, the acquisition of in-vivo spectroscopic images, where the term "image" is utilized to signify a display of the spatial variation of one or more physical properties, such as chemical shift spectra, which images are spatially resolved in 1, 2 or 3 dimensions (1D, 2D, 3D) has for many years proved impractical with NMR techniques monitoring free-induction-decay (FID) response signals and employing 2D, 3D and 4D Fourier transformation (FT), such as the techniques proposed by Brown et al. in U.S. Patent 4,319,910 (1982). It will be understood that since each chemical shift spectrum itself has two dimensions (signal intensity and chemical shift, in parts per million or ppm.), the images involved in the present invention all have one more dimension d′ than is usually displayed. While it is known to acquire spectroscopic images of certain elements, such as ³¹P, by the utilization of 2D, 3D and 4D FT techniques, employing NMR spin echoes, such as described in U.S. Patents 4,506,223 and 4,567,440, these techniques are unsuitable for observing spatial distribution of important ³¹P metabolites that have T₂ values so short as to decay substantially away during the spin-echo time interval. To date, these techniques have not allowed images to be obtained of short-T₂ metabolites, such as adenosine triphosphate (ATP), phosphodiesters (PD), and the like. Additionally, even those ³¹P metabolites which have been observed, such as phosphocreatine (PCr), inorganic phosphate (Pi) and phosphomonoesters (PM), are observed as spectral signals attenuated by the different T₂ decays and may not provide an accurate measure of the relative concentration of these metabolites. Additionally, reported scan times of up to four hours for 2D localized ³¹P spectroscopy, using a spiu-echo 3DFT method, are too long for reasonable human patient studies and, in fact, no actual patient studies utilizing these techniques appear to have been reported. It is therefore highly desirable to provide a method of, and apparatus for, obtaining a NMR spectroscopic metabolic image with full-body volume, multiple-voxel localization, especially to voxels of size from about 4 cm³ to about 40 cm³, of substantially undistorted FID spectral data. It is also highly desirable, since metabolite resonances are derived directly from free-induction decays with minimal timing delays, that the integrated FID signals be so obtained as to more accurately represent the relative concentrations and absolute values of the metabolites present.
- In accordance with the present invention, a method for spectroscopy metabolite imaging utilizes the steps of: applying to a desired portion of a sample a pulsed phase-encoding linear magnetic gradient signal in at least one of the three orthogonal dimensions of a Cartesian coordinate set, prior to acquisition of free-induction-decay NMR response signals from the sample portion; substantially eliminating from at least the sample portion eddy current fields induced responsive to the phase-encoding gradient pulses; maximizing the signal-to-noise ratio of the NMR response signals; and displaying the data resulting from Fourier transformation of the received response data.
- In a presently preferred embodiment, a high-field NMR imaging system is provided with self-shielded gradient coils, to substantially remove eddy-current effects, and a maximized SNR quadrature-driven volume RF coil is utilized for both transmission of the excitation RF pulses and reception of the RF response signals. The acquired FID data is filtered and a Fourier transform reconstruction, of dimension d′ equal to one greater than the number d of spatial dimensions to be displayed, is performed, prior to phase and baseline correction of the data for the image to be displayed.
- Accordingly, it is an object of the present invention to provide a novel method of, and apparatus for, NMR spectroscopic metabolite imaging and quantification.
- A better understanding of the present invention will become apparent upon a reading of the following, illustrative, detailed description, when considered in conjunction with the drawings.
-
- Figure 1a is a perspective view of the bore of a NMR magnet and of the various coils and direction conventions utilized therewith;
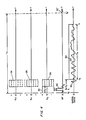
- Figure 1b is a schematic block diagram of an illustrative NMR imaging system in accordance with the principles of the present invention;
- Figure 2a is a schematic view of a nested set of coaxial surface coils used in one embodiment of the invention;
- Figure 2b is a schematic diagram of a surface detection coil used on one embodiment of the invention;
- Figure 3a is a graph illustrating the spatial variation of the transverse RF field, B₁, and hence the NMR sensitivity, of one example of a surface detection coil;
- Figure 3b is a graph illustrating the spatial variation of the RF magnetic field B₁ produced by one example of a transmit surface coil;
- Figure 4 is a set of time-related gradient magnetic field, radio frequency and gated data waveforms, employed one presently preferred embodiment of the method of the present invention;
- Figure 5a is a perspective view of a multi-dimen sional set of chemical shift image data (from the human head) after Fourier transformation;
- Figure 5b is a set of chemical-shift spectra arranged in accordance with voxels of a sample (a human head) being imaged; and
- Figure 6 is a schematic view of a portion of human anatomy (the heart) and of the various chemical shift spectra derived from various voxels within the anatomy, and useful in understanding the utility of the present invention.
- Referring initially to Figure 1a, a nuclear magnetic resonance (NMR)
imaging system 10 utilizes alarge magnet 11 having an open bore 11a therethrough, in which bore is provided a static magnetic field BO, of magnitude on the order of about 1.5 Tesla. This static field is oriented along the longitudinal, or Z, axis of the cylindrical bore. While any volumetric coordinate system can be used, we have found it advantageous to use a Cartesian coordinate system, as illustrated. Within magnet bore 11a is positioned a set ofgradient coils 12, havingindividual input cables coil 14 is positioned within the bore of the gradient coil set 12, and is used at least for transmitting to an enclosedsample 15 an excitation RF magnetic field B₁, responsive to a RF signal in coil cable 14a. Responsive to immersion in the magnetic field and to excitation with a radio-frequency signal of proper characteristics,sample 15 re-radiates a RF response signal, which may be received by theRF coil 14, and the like, for subsequent processing. - As best seen in Figure 1b, in addition to the
main magnet 11, the completeNMR imaging system 10 includes a computer means 16, having a suitable amount of random-access memory (RAM) means 16-1, disc memory means 16-2 and an array processor means 16-3; computer means 16 interfaces with an input/output console means 17.Computer 16 has aport 16a for interfacing to a data bus means 18 for sending and receiving data to, inter alia, gradient power supply means 20x, 20y and 20z, each providing the proper driving current to an associated one of the X, Y orZ gradient coils wavelength cable 22e and a low-noise amplifier (LNA) means 22f) as known to the art for properly connecting a NMR transmitter means 23 and receiver means 24 to a common antenna means 14-1. Each of the transmitter means 23 and receiver means 24 also receives commands frombus means 18 and at least receiver means 24 also provides data back to computer means 16 via thedata bus 18. The NMR response signal (emitted by thesample 15 to be studied) may, alternatively, be received with a surface coil means 14-2, having at least one surface coil each connected directly to itsown means 22f′, and the like, for connection directly to receiver means 24. Advantageously, the signal-to-noise ratio (SNR) of the received signal is maximized by utilizing either a properly dimensioned surface coil or a maximized-SNR volume coil means 14-1 (such as one with a length less than 2 sample diameters long, as described and claimed in co-pending U.S. Application Serial No. 202,624, filed June 6, 1988) (EP-A-334660;) operated in true-quadrature mode, and used with an ultra-low-noise preamplifier, having a noise figure typically less than about 0.5dB (such as described and claimed in co-pending US application Serial No. 172,828, filed March 25, 1988)(European Patent Application 89305663.0); both of these applications are assigned to the assignee of the present invention and are incorporated herein in their entireties by reference. An array of a plurality of surface coils, with at least one LNA, can be used if the array has been designed to maximize SNR [such as the array described and claimed in US-A-4825162 (Application 130,046, filed December 7, 1987) incorporated herein in its entirety by reference]. Additional details concerning thesystem 10 can be found in our U.S.Patent 4, 689,563, entitled "High-Field Nuclear Magnetic Resonance Imaging/Spectroscopy System", issued August 25, 1987, and incorporated herein in its entirety by reference. - Referring now to Figure 2a, yet another alternative RF coil arrangement employs coaxial coplanar surface coils. This arrangement is ideally suited for, but not restricted to, spectroscopy studies involving the human torso, such as of the heart, liver, and the like. In this mode of operation, the quadrature volume coil arrangement is disconnected at points P₁ and P₂ (Fig. 1b),
LNA 22f′ is connected to point P₂, and coil 14-2 is disconnected from point P₃. Surface coil 14-3 is now connected to point P₁ and used at least for transmitting RF excitation field B₁ (for example in the Y direction) to sample 15. The dimensions of coil 14-3 (e.g. St≃40 cm.) are chosen such as to provide a substantially uniform RF field B₁ over the sensitive volume of a first receive coil 14-4, located adjacent to the region of the interest in thesample 15. The diameter Dr of the receive coil is chosen to be comparable to the depth from the surface of the organ or tissue of most interest. For example, if surface coil 14-3 of a square shape, with St≃40cm., then coils 14-4 and 14-4′ can each be one of a coaxial pair of circular coils, each with a diameter Dr of about 10 cm., as would be suitable for heart studies; the field profiles of respective coil 14-4 or coil 14-4′ are depicted for the X-Y plane and the Y-Z plane, respectively in Figure 3a or Figure 3b. Thus, it is evident from Figure 3a that the sensitive volume of the coil over which B₁ ≧ 0.1 of its maximum, falls in aregion inductance 27a andcapacitance 27b) at the NMR frequency of the surface coil, in order to effectively turn the detection coil off during a transmission portion (e.g. time interval Tt in Figure 4) of an NMR spectroscopy study. The impedance of coils 14-3 and 14-4 in the presence ofsample 15 can be adjusted to approximately the optimum output impedance oftransmitter 23 and the input impedance (Zi) ofLNA 22f using a capacitive divider means 22c-5. Additional coaxial coplanar coils 14-4′ and the like may be added to detect NMR signals from other nuclei. For example, it may be desirable to provide a ¹H NMR detection coil coil 14-4′ of the same diameter as the ³¹P receive coil 14-4, so as to acquire ¹H NMR images from the same sensitive volume in the sample from which spectra are acquired, in order to determine the anatomy from which the spectra derive. With coaxially-positioned coils there is no need to move the subject when switching from imaging to NMR spectroscopy examinations; all that is required is to disconnect coil 14-4 fromLNA 22f′ at point P₄ and in its place connect coil 14-4′, via a λ/2 cable 22g, tuned to the new NMR frequency (e.g. the ¹H frequency). - For spectroscopy studies and metabolite quantification in the heart, cardiac-gating transducer means 28 scan provide a gate signal to data port 29, of the bus, to permit NMR spectroscopy (and imaging) pulse sequences to be applied synchronous to selected periods in the cardiac cycle.
- In accordance with one aspect of the invention, spectroscopic metabolite images are obtained by
operating system 10 in accordance with the gradient and RF signals shown in Figure 4. Suitable signal sequences include those described and claimed in our U.S. Patent 4,506,223, issued March 19, 1985, and incorporated herein in its entirety by reference. For a three-dimensional (i.e. d=2 spatial dimensions) image, a spatially-selected NMR pulse uses aRF pulse signal 30, shown as being of a truncated sinc form, in conjunction with a non-zero GZ gradient lobe 32; bothsignals RF pulse 30 may be a 90° NMR pulse, or alternatively may be adjusted to maximize the detected NMR signal, in which case the pulse angle may be less than 90°, depending on the pulse sequence repetition period TR. This initial pulse selects a slab with a small Z-axis width in the sample, so that spectroscopic information in the two dimensions of the selected plane (here, the X and Y dimensions) can be spatially encoded via the subsequent phase-encoding GX and GY gradient lobes 34 and 36, respectively. By varying the GX and GY gradient lobe 34 and 36 magnitudes, as shown by the broken line portions, different columns and rows of pixels in the X and Y directions are encoded. A Z-gradient GZ refocussing lobe 38 of substantially constant amplitude (the amplitude associated with the center of the Z slab) is provided while this two-dimensional spatial encoding sequence occurs. In the event that a three-dimensional volume (d=3) spatially-encoded image is desired, the amplitude of the GZ rephasing lobe 38 can be varied, as shown by the broken-line portions thereof, to also vary the responses in the Z direction. Similarly, if a single direction of spatial encoding is desired, say, the X direction only, then a zero value of Y-direction gradient lobe 36 and Zdirection gradient lobe 38 would be utilized with the various sequential phase-encoding values ofX-direction gradient lobe 34. The 1, 2 or 3-dimension spatial encoding gradient lobes occur from time t₂ to a spatial-encoding temporal endpoint time t₃ occurring at a fixed delay time interval Td after the spatially-selective pulse midpoint time t₁. The free-induction decay (FID) signal 40 begins substantially at the gradient lobe endpoint time t₃, at which time the received data is gated on, by agating function 42 lasting for a time interval Ts, to be digitized starting at time t₃ and ceasing at a sequence ending time t₄. It is only thegated data 40′, from time t₃ to time t₄, that is returned to the system computational means 16 for processing. - After the set of response RF signals is received and digitized, a (d′)-DFT, where d′=(d+1) and d is the number of the spatial dimensions (1, 2 or 3), of the data set is performed. This Fourier transform is performed both with respect to the spatial gradient amplitudes and also with respect to time, to yield the spectroscopic image consisting of d spatial dimensions and one chemical-shift dimension, respectively. It will be seen that omission of a phase-encoding gradient in one or more of the spatial dimensions will result in a corresponding loss of spatial discrimination in those dimensions. If a single surface coil 14-2 (see Figure 1b) is used, a particularly useful spectroscopic imaging sequence uses only one such phase-encoding gradient applied in the direction of the surface coil axis. Then, a 2DFT, with respect to gradient amplitude and time, yields spectra as a function of axial depth below the surface coil plane; localization in the other two spatial dimensions is provided by the inherent sensitivity profile of the surface coil, and the removal of gradient encoding in these other 2 dimensions reduces imaging time. A typical set of localized spectra can be acquired in about 10 minutes, with 20cm.³ voxel resolution, dependent upon the depth of the voxel, utilizing a 6-10 cm. diameter surface coil for ³¹P studies at about 25.86 MHz. in a static magnetic field BO=1.5T imaging system.
- Referring now to Figure 5a, a set of intensity/chemical-shift-frequency spectra are shown, as the results of the (d+1)-DFT processing of the data from each of a plurality n of voxels, Vi, where 1≦i≦n. In the illustrated spectral set, each
individual spectrum 50i is data obtained from one of the n (here, n=32) voxels of the sample. Thus, Figure 5a can show, for example, a set of spectra for voxels with one combination of eight different X values and four different Y values in a XY plane, for a single Z thickness. As was seen, since spatial information can be encoded in 1, 2 or all 3 spatial dimensions with the use of 1, 2 or all 3 phase-encoded gradients, omission of any one phase-encoding gradient results in a corresponding loss of spatial discrimination in that dimension. However, the loss of spatial discrimination is compensated for by the reduced time necessary for acquisition of the data. A particularly useful three-spatial-dimensional (volume or d=3) spectroscopic imaging method uses the sequence of Figure 4, with selective excitation of only that Z-axis slice then being imaged, when studying metabolites, such as the ³¹P metabolites, with relative long T₁ relaxation times (e.g. longer than 1 second). Because of the long relaxation time, a relatively long time interval TR must usually be used between sequence repetitions of the total of Nx·Ny repetitions (where Nx is the number of voxels in the X direction and Ny is the number of voxels in the Y direction, for each of NZ different planes). Rather than waste the relaxation time interval, the sequence is repeated but with a different one of the NZ slices, or planes, being excited by a frequency offset selective-excitation pulse applied in the presence of gradient Gz lobe 32 followed by rephasinglobe 38, at a repetition period of TR/Nz. By filling the entire relaxation delay interval with interleaved excitations of different slices of the desired volume, the minimum time required for acquiring a volumetric spectroscopic image is reduced, compared to the other method. In addition, this method has two other advantages compared to the 4DFT (d=3) three-dimensional volume encoding method above: first, for small Nz (e.g. Nz≦8) this method results in significantly less artefactual signals bleeding into selected slices from adjacent slices. Second, in situations where the RF excitation field B₁ is nonuniform, as for example occurs when using the maximal SNR volume coil described in copending U.S. application Serial No. 202,624 (European Patent Application 89305663.0) (filed June 6, 1988), or when exciting the sample with a surface coil whose field is nonuniform across the region of interest in the sample, theRF pulse amplitude 30 may be adjusted to compensate for the nonuniformity on a slice-by-slice basis. In practice, the latter compensation is achieved by weighting the pulse amplitudes for each slice according to either the average B₁ field in the slice or the particular B₁ field in the slice at the level of an organ of interest (with field B₁ being deduced from the information in Fig. 3 herein, in Fig. 3 of US application 202,624, (European Patent Application 89305663.0) or the like). - Figure 5b shows a 3DFT set of spectra for a single-Z-thickness volume through the head with "cells" Ci,j having one (i) of eight different X-axis voxel values and one (j) of eight different Y-axis voxel values. Thus, a total of 64 cells are defined (by eight
different lobe 34 amplitudes and eightdifferent lobe 36 amplitudes); a spectrum is provided for each cell. To aid in interpreting the array of spectra, a display may be superimposed of the periphery of the body portion being imaged. Thisoutline 55 may be from an image taken prior, during, or after to the spectroscopic imaging procedure. Asample vial 57, having a known concentration of a known metabolite, can be placed in a known position (e.g. in front of the patient's head, as on a headband) so that aparticular spectrum 57 is of a voxel (e.g. cell C5,2) containing only the known concentration sample (and air), and not any portion of the sample-to-be-imaged. Thus, a standard of known concentration, having a T₂* relaxation time much greater than the phase-encoding gradient application delay time interval Td, is located within the imaging field-of-view, but outside of the sample. The location of the metabolite of interest is denoted in three dimensions by a subscript ijk corresponding to its voxel coordinates (i,j,k); similarly, the location of the standard is denoted by a subscript lmn corresponding to its voxel coordinates (l,m,n). Metabolite concentrations can now be quantified by comparison of the intensity of spectral components. The concentration Aijk(p) of a particular metabolite R in a volume of sample Vijk, compared to a small volume Vs of known standard s of concentration Almn(s) in the otherwise-empty-of-sample volume Vlmn(≧Vs), is
Aijk(p)=(Sijk(p)·exp(-Td/T₂*(s))/Slmn(s)·exp(-Td/T₂*(p))
·(Vijk/Vs)·Almn(s)·Rijk-lmn
·(F(T₁(s),αlmn)/F(T₁(p),αijk))
where: Sijk(p) and Slmn(s) are the integrated NMR signal intensities of the respective metabolite P in voxel (i,j,k) and standard s in voxel (l,m,n); Vs is the volume of the standard in voxel (l,m,n); Rijk-lmn is the ratio of sensitivity of the imaging system (e.g. due to the NMR RF coil and other position-sensitive factors) at the sample voxel (i,j,k) to the standard-bearing voxel (l,m,n); T₂*(p) and T₂*(s) are the decary time constants of the transverse NMR magnetization of metabolite P in voxel (i,j,k) and standard s in voxel (l,m,n) in the absence of imaging gradients but including both intrinsic and instrumental contributions; and F(T₁(s), αlmn) and F(T₁(p),αijk) are the T₁ saturation factors given by
F(T₁,α)=((1-exp(-TR/T₁))sinα)/(1-cosα·exp(-TR/T₁)), corresponding to the standard s with a T₁ of T₁(s) and NMR flip angle αlmn in voxel (l,m,n), and metabolite P with a T₁ of T₁(P) in voxel (i,j,k) experiencing a flip angle αijk. The flip angle αabc in any voxel (a,b,c) is easily calculated from the B₁ curves of the excitation coil, since αabc is proportional to B1abc where B1abc is the B₁ at (a,b,c). If T₂*(p) and T₂*(s) are much greater than Td, or if
T₂*(p)=T₂*(s), then
Aijk(p)=Almn(s)·Rijk-lmn·(Vijk/Vs)·(Sijk(p)/Slmn(s))
·F(T₁(s),αlmn)/F(T₁(p),αijk).
We have successfully used ³¹P standards of several cm³ vials of 1M solutions of phosphoric acid, of methylene diphosphonic acid or of phosphonitrilic chloride trimer (available from Aldrich Chemical Company: see J.K. Gard & J.J.H. Ackerman, Journal of Magnetic Resonance Vol. 51 pp 124-127, 1983); images in an 8x8 3DFT array were obtained and quantified in about 30 minutes for 27 cm³ and 64 cm³ voxels in the brain, using the, optimized SNR volume coil, and in 10-15 minutes for 20 cm³ voxels in the heart using the coaxial surface coil set, and cardiac gating. - Figure 6 illustrates one possible form for the display and presentation of the spectroscopic imaging information acquired by use of the present invention. Here, a slice-selective, 8x8 voxel, 256 point 3DFT imaging sequence has been used, with Td of about 2.7 mSec. (with about 2.2 msec. used for the slice-selective gradient refocussing lobe and the phase-encoding gradient lobes, including rise and fall times), and a 10 cm. diameter surface detection coil. The NMR pulse power was adjusted to maximize the SNR in ³¹P spectra derived from the entire selected image slice in the absence of phase-encoding gradients immediately prior to commencement of the spectroscopic imaging procedure. Following data acquisition and three-dimensional FT reconstruction, absorption mode spectra were inverse-transformed, exponentially-multiplied (12 Hz line-broadening), zero-filled, retransformed, phase-corrected (zero and first order), and baseline-flattened. The location of a pixel Pr,c having the anatomy of interest, relative to each spectroscopic image, was determined by a conventional (e.g. gradient-recalled acquisition in the steady state (GRASS)) technique of ¹H NMR imaging using a whole body ¹H NMR coil emplaced about the ³¹P NMR coil, and without moving the subject at all; a ³¹P coil, at 25.9 MHz in a 1.5T magnet, was found to be fairly transparent to the 63.9 MHz ¹H signals. The ¹H NMR signal from the selected spectroscopic image slice was also used to shim the magnet homogeneity prior to the ³¹P procedure, which used the depth-resolved surface coil spectroscopy (DRESS) response signal acquisition procedure, as described and claimed in U.S. Patent 4,629,988, issued December 16, 1986 and incorporated herein in its entirety by reference. The
¹H image 60 is divided into a matrix of pixels Pr,c where r is the row number (1≦r≦8) and is the column number (1≦c≦8). While spectra are available (as seen in Figure 5) for all 64 voxels in the spectroscopic image, we chose to display only 8 here, so that they could be enlarged to show detail. The spectra S7,3 and S7,4 of predominantly muscle-containing pixels P7,3 and P7,4 clearly show large amounts of both PCr and ATP, which are not present in the spectra S8,2 and S8,3 of predominantly fat-containing pixels P8,2 and P8,3. Note that theline 62dividing pixel rows - While several presently preferred embodiments of our novel methods of, and apparatus for, spectroscopic metabolite imaging and quantification have been described in detail herein, many modifications and variations will now be apparent to those skilled in the art. For example, additional details can be had by reference to an article, "Human in Vivo Phosphate Metabolite Imaging with ³¹P NMR", in Magnetic Reson. in
Medicine 7, pp 319-336 (1988), which is incorporated herein in its entirety by reference.
Claims (30)
Aijk(p)=Almn(s)·(Vijk/Vs)·(Sijk(p)·exp(-Td/T₂*(s))/(Slmn(s)
·exp)(-Td/T₂*(p))·F(T₁(s),αlmn)/F(T₁(p),αijk)·Rijk-lmn,
where: Almn(s) is the concentration of the standard; Vs or Vijk is the volume of respective standard or sample in an associated respective voxel volume; Sijk(p) or Slmn(s) is the integrated NMR signal intensity of the respective p-th metabolite in volume Vijk or the standard in the volume Vlmn; Td is the gradient delay time interval; T₂ is the spin-spin relaxation time constant of the desired p-th metabolite; and Rijk-lmn is the ratio of sensitivity of the imaging system at the sample volume to the standard-bearing volume.
means for providing through the sample a static magnetic field BO in a first direction of a coordinate set;
means for providing radio-frequency (RF) field to excite NMR response signals from at least a desired portion of the sample;
means for applying to at least a desired portion of the sample a combination of d, where d=1,2 or 3, phase-encoding magnetic field gradients, each in a different direction in the coordinate set, to define a d-dimensional set of voxels within the sample portion, in a manner to substantially eliminate from at least the desired sample portion eddy currents induced responsive to any phase-encoding gradient;
means for acquiring a free-induction-decay (FID) NMR response signal from each of the different voxels of the set within the sample portion; and
means for processing the SNR-maximized FID response signals set to obtain a displayable image of the spectral information contained in at least one of the FID response signals.
Aijk(p)=Almn(s)·(Vijk/Vs)·(Sijk(p)·exp(-Td/T₂*(s))/(Slmn(s)
·exp)(-Td/T₂*(p))·F(T₁(s),αlmn)/F(T₁(p),αijk)·Rijk-lmn,
where: Almn(s) is the concentration of the standard; Vs or Vijk is the volume of respective standard or sample in an associated respective voxel volume; Sijk(p) or Slmn(s) is the integrated NMR signal intensity of the respective p-th metabolite in volume Vijk or the standard in volume Vlmn; Td is the gradient delay time interval; T₂ is the spin-spin relaxation time constant of the desired metabolite; and Rijk-lmn is the ratio of sensitivity of the imaging system at the sample volume to the standard-bearing volume.
Applications Claiming Priority (2)
| Application Number | Priority Date | Filing Date | Title |
|---|---|---|---|
| US07/260,633 US4881032A (en) | 1988-10-21 | 1988-10-21 | Method of, and apparatus for, NMR spectroscopic metabolite imaging and quantification |
| US260633 | 1994-06-16 |
Publications (2)
| Publication Number | Publication Date |
|---|---|
| EP0365352A2 true EP0365352A2 (en) | 1990-04-25 |
| EP0365352A3 EP0365352A3 (en) | 1991-02-06 |
Family
ID=22989962
Family Applications (1)
| Application Number | Title | Priority Date | Filing Date |
|---|---|---|---|
| EP19890310840 Withdrawn EP0365352A3 (en) | 1988-10-21 | 1989-10-20 | Method of, and apparatus for, nmr spectroscopic metabolite imaging and quantification |
Country Status (4)
| Country | Link |
|---|---|
| US (1) | US4881032A (en) |
| EP (1) | EP0365352A3 (en) |
| JP (1) | JPH02159249A (en) |
| IL (1) | IL91955A0 (en) |
Cited By (1)
| Publication number | Priority date | Publication date | Assignee | Title |
|---|---|---|---|---|
| WO2001079874A1 (en) * | 2000-04-18 | 2001-10-25 | F. Hoffmann-La Roche Ag | Method for increasing the throughput of nmr spectrometers |
Families Citing this family (18)
| Publication number | Priority date | Publication date | Assignee | Title |
|---|---|---|---|---|
| FR2621125B1 (en) * | 1987-09-28 | 1989-12-08 | Thomson Cgr | GRADIENT COIL SYSTEM FOR NMR MACHINE |
| US5201311A (en) * | 1989-08-11 | 1993-04-13 | General Electric Company | Spatially-localized chemical-reaction-rate NMR spectroscopic imaging |
| JPH03173531A (en) * | 1989-12-01 | 1991-07-26 | Hitachi Ltd | Method and device for eddy current compensation of magnetic resonance imaging device |
| US5707875A (en) * | 1994-08-11 | 1998-01-13 | Hitachi, Ltd. | 170-Labeled phosphoric acid compound and method and apparatus for selective observation of nuclear magnetic resonance signals using the compound |
| US5500592A (en) * | 1994-10-31 | 1996-03-19 | General Electric Company | Absolute metabolite concentrations from poorly spatially-resolved MR response signals |
| US5578921A (en) * | 1995-01-10 | 1996-11-26 | Board Of Trustees Of The Leland Stanford Junior University | Magnetic resonance imaging using three-dimensional spectral-spatial excitation |
| US5898306A (en) * | 1997-04-09 | 1999-04-27 | Regents Of The University Of Minnesota | Single circuit ladder resonator quadrature surface RF coil |
| CA2418111C (en) * | 2000-08-22 | 2011-04-19 | Randell L. Mills | 4 dimensional magnetic resonance imaging |
| IL147221A (en) | 2001-12-20 | 2010-11-30 | Given Imaging Ltd | Device, system and method for image based size analysis |
| US6983181B2 (en) * | 2002-05-01 | 2006-01-03 | General Electric Company | Spatial encoding MR data of a moving subject using a higher-order gradient field |
| CN100568015C (en) * | 2003-10-31 | 2009-12-09 | 皇家飞利浦电子股份有限公司 | B1 field control in the magnetic resonance imaging |
| US20090030618A1 (en) * | 2005-04-12 | 2009-01-29 | The General Hospital Corporation | System, method and software arrangement for analyzing and correlating molecular profiles associated with anatomical structures |
| US8263043B2 (en) * | 2006-04-14 | 2012-09-11 | Carnegie Mellon University | Cellular labeling and quantification for nuclear magnetic resonance techniques |
| US8324898B2 (en) * | 2008-11-14 | 2012-12-04 | University Of Southern California | Tailored radiofrequency pulses for uniform saturation in magnetic resonance imaging |
| EP2740073B1 (en) | 2011-06-17 | 2017-01-18 | Quantitative Imaging, Inc. | Methods and apparatus for assessing activity of an organ and uses thereof |
| KR101351584B1 (en) * | 2012-09-26 | 2014-01-22 | 연세대학교 산학협력단 | The method and apparatus for removing distortion by lipid from a magnetic resonance image |
| WO2016077757A1 (en) * | 2014-11-13 | 2016-05-19 | Brigham And Womens's Hospital, Inc. | System and method for locally correlated spectroscopy for assessing medical disorders |
| US10254361B2 (en) * | 2016-09-16 | 2019-04-09 | General Electric Company | Systems and methods for disconnecting an MRI RF coil |
Citations (4)
| Publication number | Priority date | Publication date | Assignee | Title |
|---|---|---|---|---|
| US4567440A (en) * | 1983-06-09 | 1986-01-28 | Haselgrove John C | Vivo P-31 NMR imaging of phosphorus metabolites |
| EP0186392A2 (en) * | 1984-12-12 | 1986-07-02 | Yale University | An apparatus and method for unambiguously determining the presence of substances in a sample by NMR and producing an NMR image thereof |
| EP0237105A2 (en) * | 1986-03-06 | 1987-09-16 | Philips Patentverwaltung GmbH | Method for determining the spectral distribution of nuclear magnetization in a limited region of the volume |
| EP0261743A2 (en) * | 1986-09-26 | 1988-03-30 | Philips Patentverwaltung GmbH | Method for determining the spectral distribution of nuclear magnetization in a limited region of the volume |
Family Cites Families (12)
| Publication number | Priority date | Publication date | Assignee | Title |
|---|---|---|---|---|
| DE2846832B1 (en) * | 1978-10-27 | 1980-02-07 | Hoechst Ag | Trace element fertilizer pastes and process for their preparation |
| GB2124388B (en) * | 1982-07-28 | 1986-02-12 | Picker Int Ltd | Nuclear magnetic resonance method and apparatus |
| US4506223A (en) * | 1982-11-22 | 1985-03-19 | General Electric Company | Method for performing two-dimensional and three-dimensional chemical shift imaging |
| US4629988A (en) * | 1984-07-02 | 1986-12-16 | General Electric Company | Method of imaging by depth-resolved surface coil spectroscopy |
| US4728893A (en) * | 1985-07-31 | 1988-03-01 | The Regents Of The University Of California | Increased signal-to-noise ratio in magnetic resonance images using synthesized conjugate symmetric data |
| US4689560A (en) * | 1985-08-16 | 1987-08-25 | Picker International, Inc. | Low R.F. dosage magnetic resonance imaging of high velocity flows |
| US4683431A (en) * | 1985-08-16 | 1987-07-28 | Picker International, Inc. | Magnetic resonance imaging of high velocity flows |
| GB8528357D0 (en) * | 1985-11-18 | 1985-12-24 | Picker Int Ltd | Nuclear magnetic resonance imaging |
| US4709212A (en) * | 1986-01-03 | 1987-11-24 | General Electric Company | Method of enhancing image signal-to-noise ratio by combining NMR images of differing pulse sequence timing |
| US4740753A (en) * | 1986-01-03 | 1988-04-26 | General Electric Company | Magnet shimming using information derived from chemical shift imaging |
| US4698591A (en) * | 1986-01-03 | 1987-10-06 | General Electric Company | Method for magnetic field gradient eddy current compensation |
| US4737716A (en) * | 1986-02-06 | 1988-04-12 | General Electric Company | Self-shielded gradient coils for nuclear magnetic resonance imaging |
-
1988
- 1988-10-21 US US07/260,633 patent/US4881032A/en not_active Expired - Fee Related
-
1989
- 1989-10-12 IL IL91955A patent/IL91955A0/en not_active IP Right Cessation
- 1989-10-20 JP JP1271949A patent/JPH02159249A/en active Pending
- 1989-10-20 EP EP19890310840 patent/EP0365352A3/en not_active Withdrawn
Patent Citations (4)
| Publication number | Priority date | Publication date | Assignee | Title |
|---|---|---|---|---|
| US4567440A (en) * | 1983-06-09 | 1986-01-28 | Haselgrove John C | Vivo P-31 NMR imaging of phosphorus metabolites |
| EP0186392A2 (en) * | 1984-12-12 | 1986-07-02 | Yale University | An apparatus and method for unambiguously determining the presence of substances in a sample by NMR and producing an NMR image thereof |
| EP0237105A2 (en) * | 1986-03-06 | 1987-09-16 | Philips Patentverwaltung GmbH | Method for determining the spectral distribution of nuclear magnetization in a limited region of the volume |
| EP0261743A2 (en) * | 1986-09-26 | 1988-03-30 | Philips Patentverwaltung GmbH | Method for determining the spectral distribution of nuclear magnetization in a limited region of the volume |
Non-Patent Citations (1)
| Title |
|---|
| MAGNETIC RESONANCE IN MEDICINE, vol. 7, no. 3, July 1988, pages 319-336, Duluth, MN, US; P.A. BOTTOMLEY et al.: "Human in vivo phosphate metabolite imaging with 31P NMR" * |
Cited By (3)
| Publication number | Priority date | Publication date | Assignee | Title |
|---|---|---|---|---|
| WO2001079874A1 (en) * | 2000-04-18 | 2001-10-25 | F. Hoffmann-La Roche Ag | Method for increasing the throughput of nmr spectrometers |
| EP1158307A1 (en) * | 2000-04-18 | 2001-11-28 | F.Hoffmann-La Roche Ag | Method for increasing the throughput of NMR spectrometers |
| US6504368B2 (en) | 2000-04-18 | 2003-01-07 | Hoffmann-La Roche Inc. | Spectroscopic measurement method using NMR |
Also Published As
| Publication number | Publication date |
|---|---|
| EP0365352A3 (en) | 1991-02-06 |
| JPH02159249A (en) | 1990-06-19 |
| IL91955A0 (en) | 1990-07-12 |
| US4881032A (en) | 1989-11-14 |
Similar Documents
| Publication | Publication Date | Title |
|---|---|---|
| US4881032A (en) | Method of, and apparatus for, NMR spectroscopic metabolite imaging and quantification | |
| US4585992A (en) | NMR imaging methods | |
| Bottomley | Spatial localization in NMR spectroscopy in vivo | |
| Barfuss et al. | In vivo magnetic resonance imaging and spectroscopy of humans with a 4 T whole‐body magnet | |
| Moonen et al. | Comparison of single‐shot localization methods (STEAM and PRESS) for in vivo proton NMR spectroscopy | |
| US5711300A (en) | Real time in vivo measurement of temperature changes with NMR imaging | |
| US5770943A (en) | Method for measuring and compensating for spatially and temporally varying magnetic fields induced by eddy currents | |
| Bendel et al. | 31P spectroscopic zeugmatography of phosphorus metabolites | |
| US5709208A (en) | Method and system for multidimensional localization and for rapid magnetic resonance spectroscopic imaging | |
| US6559642B2 (en) | Calibration method for use with sensitivity encoding MRI acquisition | |
| US4698592A (en) | MRI of chemical shift spectra within limited inner volume | |
| Barfuss et al. | Whole-body MR imaging and spectroscopy with a 4-T system. | |
| Beaulieu et al. | Diffusion‐weighted MR microscopy with fast spin‐echo | |
| US20040239324A1 (en) | Method and system for accelerated imaging using parallel MRI | |
| US5064638A (en) | Simultaneous multinuclear magnetic resonance imaging and spectroscopy | |
| Maudsley et al. | Spin echo 31P spectroscopic imaging in the human brain | |
| US7197353B2 (en) | Sensitivity encoding MRI acquisition method | |
| US4567440A (en) | Vivo P-31 NMR imaging of phosphorus metabolites | |
| EP0900388B1 (en) | Method for spectroscopic magnetic resonance imaging | |
| US5201311A (en) | Spatially-localized chemical-reaction-rate NMR spectroscopic imaging | |
| Gonen et al. | Hybrid three dimensional (1D‐Hadamard, 2D‐chemical shift imaging) phosphorus localized spectroscopy of phantom and human brain | |
| US20010056231A1 (en) | High resolution MRI imaging of brain functions | |
| US4832037A (en) | Multi-region in-vivo magnetic resonance spectroscopy | |
| Grissom | Improving high-field MRI using parallel excitation | |
| Andrew | Nuclear magnetic resonance and the brain |
Legal Events
| Date | Code | Title | Description |
|---|---|---|---|
| PUAI | Public reference made under article 153(3) epc to a published international application that has entered the european phase |
Free format text: ORIGINAL CODE: 0009012 |
|
| AK | Designated contracting states |
Kind code of ref document: A2 Designated state(s): DE FR GB NL |
|
| PUAL | Search report despatched |
Free format text: ORIGINAL CODE: 0009013 |
|
| AK | Designated contracting states |
Kind code of ref document: A3 Designated state(s): DE FR GB NL |
|
| 17P | Request for examination filed |
Effective date: 19910715 |
|
| 17Q | First examination report despatched |
Effective date: 19940203 |
|
| STAA | Information on the status of an ep patent application or granted ep patent |
Free format text: STATUS: THE APPLICATION IS DEEMED TO BE WITHDRAWN |
|
| 18D | Application deemed to be withdrawn |
Effective date: 19940817 |