EP0086429B1 - Cardiogoniometric process and cardiogoniometer therefore - Google Patents
Cardiogoniometric process and cardiogoniometer therefore Download PDFInfo
- Publication number
- EP0086429B1 EP0086429B1 EP83101139A EP83101139A EP0086429B1 EP 0086429 B1 EP0086429 B1 EP 0086429B1 EP 83101139 A EP83101139 A EP 83101139A EP 83101139 A EP83101139 A EP 83101139A EP 0086429 B1 EP0086429 B1 EP 0086429B1
- Authority
- EP
- European Patent Office
- Prior art keywords
- lead
- vector
- point
- points
- values
- Prior art date
- Legal status (The legal status is an assumption and is not a legal conclusion. Google has not performed a legal analysis and makes no representation as to the accuracy of the status listed.)
- Expired
Links
Images


Classifications
-
- A—HUMAN NECESSITIES
- A61—MEDICAL OR VETERINARY SCIENCE; HYGIENE
- A61B—DIAGNOSIS; SURGERY; IDENTIFICATION
- A61B5/00—Measuring for diagnostic purposes; Identification of persons
- A61B5/24—Detecting, measuring or recording bioelectric or biomagnetic signals of the body or parts thereof
- A61B5/316—Modalities, i.e. specific diagnostic methods
- A61B5/318—Heart-related electrical modalities, e.g. electrocardiography [ECG]
- A61B5/339—Displays specially adapted therefor
- A61B5/341—Vectorcardiography [VCG]
-
- A—HUMAN NECESSITIES
- A61—MEDICAL OR VETERINARY SCIENCE; HYGIENE
- A61B—DIAGNOSIS; SURGERY; IDENTIFICATION
- A61B5/00—Measuring for diagnostic purposes; Identification of persons
- A61B5/24—Detecting, measuring or recording bioelectric or biomagnetic signals of the body or parts thereof
- A61B5/316—Modalities, i.e. specific diagnostic methods
- A61B5/318—Heart-related electrical modalities, e.g. electrocardiography [ECG]
- A61B5/327—Generation of artificial ECG signals based on measured signals, e.g. to compensate for missing leads
Definitions
- the invention relates to a method for determining and displaying a space vector related to the heart, which represents the vector of the electric field that is formed by the activity of the heart, based on measured values that are recorded at derivation points on the body, from which measured values A potential difference is formed for every two derivation points.
- the disadvantage of this method is that it is difficult to arrange the electrodes on the patient in such a way that the vector can be calculated optimally. Larger errors can therefore still be expected, especially if the electrodes are not at the corners of the right-angled triangle. In addition, only the projection of the vector onto a plane in which the real vector is not exactly located is determined in this way.
- the invention as characterized in the claims solves the problem of creating a method with which, from the smallest possible number of derivation points, measured values are derived which allow the room vector with its amount and its position in the room to be determined as precisely as possible.
- the advantages achieved by the invention can essentially be seen in the fact that the space vector can be determined with sufficient accuracy in this manner from measured values at only four derivation points. Subsequent corrections as are known from the previously used methods are no longer necessary.
- the method according to the invention is thus much easier to carry out than the previous methods, in which about twelve derivation points were required and which thus gave even less precise results. This also results in a considerable economic advantage for the users of such processes.
- the invention also makes it possible for the first time to generate orthogonal derivatives of the space vector of the heart in a system with an oblique-aggravate plane, without the need for subsequent corrections.
- the path to a new model of the dipole moment opens when one turns away from the individual derivative and takes the electrical conditions into account as a whole in a plane formed by three derivation points. If one uses the term closed mesh in the EKG, for example in the form of Nehb's leads D, A, J, and considers the electrical conditions in this triangle, the size of the excursions of the electrocardiograph can be approximated to a relative measure of the size of the dipole moment are closed. Of course, the simultaneous swings, whether large or small, will always add up to zero, according to the Kirchchhoff mesh rule indicated above.
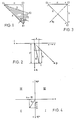
- FIG. 1 shows the four-point derivation system according to the invention.
- the tetrahedral lead system to be understood in the spatial sense shows the four electrode attachment points E1, E2, E3 and E4.
- These derivation points are connected as follows: (E1, E2) as an inferior pair I, where E1 corresponds to the point for determining the voltage V4 according to Wilson, namely 5 ICR (intercostal space) and MCL (medioclavicular line), and the point lying sagittally to E1 E2 corresponds to the point for determining the voltage V8 according to Wilson.
- the derivation point E3 is perpendicular to point E1 at intervals of 1 / ⁇ 12 times E1 E2; this derivative is the vertical one, labeled V.
- the horizontal pair of leads (E3, E4) labeled H is arranged horizontally to the right of the patient at a distance of 1 / ⁇ 12 times E1: E2. Then there is the dorsal lead (D2, E4) and the anterior lead (E1, E4), whose distance from each other is determined by the aforementioned proportions.
- An additional solder from the derivation point E3 to the anterior is z. designated.
- a / I forms the oblique-sagital x, y plane, Z / A the frontal y, z plane and Z / I the z, x plane.
- the pairing of the derivation points E2 / and E3 is not taken into account as belonging to an unused level or as a redundant pair. However, this does not mean that diagnostically relevant information cannot be derived from this derivation.
- Two derivation points namely E3 and E2 are relatively uncritical in their relative position to the patient's heart, ie manipulation scatter within certain limits when the electrodes are applied each lead to the same end result.
- the derivation point with the electrode E3 lies vertically above the cardiac tip electrode E1 - the position of which, by the way, has to be determined very precisely - on relatively flexible tissue. Above all when the patient changes position during the measurement, this derivation point E3 is shifted to a different position relative to the geometry applied and thus also to the heart. However, this does not lead to incorrect measurements, so that the electrode E3 which is most exposed to the positional shifts can be regarded as an electrically adaptive electrode.
- the vector loop in healthy people runs from the top right to the front bottom left and after turning backwards back to the front top right, i.e. the vector loop lies more or less in or parallel to a plane inclined to the sagittal (according to FIG. 1, the area between the three derivation points E1, E2 and E4).
- ECG recordings in this level must therefore react very sensitively to changes in the vector loop, which has been confirmed on far more than 2000 ECG measurements.
- This plane is used for the construction of two perpendicular projections x and y and the front plane for the construction of the projection perpendicular to the Nehb plane z o .
- the third axis in the orthogonal system requires an additional vector projection that is perpendicular to these two axes.
- This projection z ° is obtained by the derivation in the frontal triangle of the points E1, E3, E4, the points E1 and E4 representing the front derivation points of the oblique-sagittal triangle.
- Point E3 is chosen such that its distance from points E1 and E4 is the same and there is a right angle between these two lines, as shown in FIG. This gives you a right-angled, isosceles triangle.
- this projection z ° of the vector can be represented trigonometrically as (V - H) - sin 45 °, the vector lying below the Nehb plane if the magnitude is positive. with a negative sign above the Nehb level.
- the z o axis is positive downwards, negative upwards and always perpendicular to the oblique-sagittal plane, ie perpendicular to the x and y axes.
- the three orthogonal projections x, y and z are:
- the space vectors are designated 1 and 2, their projections on the x, y and z axes with x 1 , y 1 , z 1 and with x ⁇ , y 2 and z 2 , respectively, which sizes belong to an orthogonal, spatial coordinate system .
- the maximum vector of depolarization is therefore the point of the vector loop of QRS whose sum is the largest of the squares of the three projections x, y and z, that is:
- the position of the maximum vectors of QRS and T in space is also of interest, which is why the projections of the vectors into the oblique-sagittal plane on the one hand and into the frontal plane on the other must be determined.
- the spatial coordinate axes are denoted in a mathematically unusual way;
- the x, y and z axes are relatively assigned to the human body, the origin of the coordinates being located approximately centrally in the torso.
- the axis running up and down in body length is the y-axis; the negative y-axis points upwards towards the head and the positive y-axis points downwards.
- the horizontal axis is the x-axis, with the positive x-axis extending to the right and vice versa the negative x-axis.
- the z-axis runs across the body from front to back, namely the positive z-axis from the center of the body to the front and the negative z-axis emerging from the back. This corresponds to the usual convention; the orthogonal system used for the invention corresponds to the x, y, z o system shown in FIG. 1, it is inclined at 45 ° to the sagittal.
- the oblique-sagittal plane - determined by the axes x and y - is divided into 360 °, whereby 0 ° are determined horizontally backwards, 90 ° downwards left, 180 ° forwards and minus 90 ° upwards right; this fact is shown in FIG. 4.
- the conversion of the rectangular coordinates x and y into the polar coordinates is carried out according to the following formulas, the polar angle in the oblique-sagittal plane being denoted by a.
- the process for converting the right-angled coordinates z and y in the frontal plane is exactly the same by choosing the y-axis of the oblique-sagittal plane as the basis. Zero degrees is therefore at the bottom left, 180 degrees at the top right.
- the base in the frontal plane is therefore 45 ° to the body axis, i.e. diagonally sagittal, and not horizontal as in Frank's derivatives.
- the polar angle in the frontal plane is denoted by ⁇ . This angle ⁇ gives the exact projection of the vector on the frontal plane; if ⁇ is positive, the vector runs below the oblique-sagittal plane, if it is negative, above it.
- the determination of the maximum vectors of QRS and T based on the derivatives D, A, I and H, A and V, d. h the utilization of the electrical lead signals is the task of the cardiogoniometer according to the invention.
- the five derivation signals D (dorsal), A (anterior), I (inferior), H (horizontal) and V (vertical) are formed from the four measuring points E1, E2, E3, E4 (FIG. 1) and according to the formulas mentioned above 1, 2 and 3 converted to the three projections x, y and z.
- the three resulting, time-dependent, electrical signals form three curves corresponding to the projections, which are measured, squared and summed at intervals of, for example, three milliseconds and finally these values are stored in a memory for further use; in this example, this then relates on the one hand to the values QRS and on the other hand to the values T. After the value T, the zero line is determined between the T-wave and the following P-wave of the next stroke and corresponding corrections are made if necessary all the stored values refer to the determined zero value. The maximum sum square of x 1 , y 1 and z 1 on the one hand and of x 2 , y 2 and z 2 on the other hand is determined.
- the cardiogoniometer calculates the cos ⁇ according to formula 4 and uses it to determine the arccos ⁇ .
- the angle ⁇ of a specific single heartbeat is thus provided almost immediately.
- the angles ⁇ R, aT, ⁇ R and ⁇ T are then also calculated in the cardiogoniometer on the basis of formulas 7 to 10 and these data, including the basic data x 1 , y l , z 1 , x 2 , y 2 , and z 2, are stored. Eleven parameters can be provided from the same heartbeat, and the beat interval is still available as the twelfth parameter. Alternatively, the problem of the slowly fluctuating zero line can also be solved with a digital or analog high-pass filter.
- the projections x, y and z can be recorded simultaneously on a three-channel electrocardiograph (FIG. 9). Those signal complexes that the cardiogoniometer has calculated are marked on the strip containing the curves.
- a display that is based on the usual display of the EKG and, on the other hand, also contains a graphic representation of some calculated data or actual projections of the leads.
- a deviation of the vectors from this electrical center (indicated by a longer vector arrow according to FIG. 6 ') to the front, back, up and down and finally also to the rear surface (this means the representation on the spherical surface according to FIG. 6') means one pathological finding.
- Typical displacements of the R vector e.g. B. with the block diagrams, LSB or RSB, LAFB or BFB as well as with R losses after infarcts.
- any repolarization disorder will manifest itself in the deviation of the T vector in the opposite direction to the lesion focus.
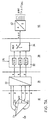
- Figures 7A and 7B show a simplified representation of the device for performing the method.
- the first stage, labeled 10 shows the derivatives as they are also shown in FIG. 1.
- These leads are obtained by the lead method according to the invention with the help of four thorax electrodes E1 to E4 and a ground electrode, which is preferably attached to the right arm.
- thorax electrodes E1 to E4 and a ground electrode, which is preferably attached to the right arm.
- a ground electrode which is preferably attached to the right arm.
- the unspecified derivation between the points E2 and E3 is not used as belonging to the projection plane of no interest or is omitted as a redundant pairing.
- the five leads used are designated H for horizontal, D for dorsal, V for vertical, I for inferior and A for anterior.
- the electrical signals of these five derivations obtained are led from the derivation stage 10 to the coordinate transformation stage 20, in which the projections sought are made in an orthogonal system. This is carried out by a preferably analog network 22, wherein three linearly independent derivatives can also be processed directly in a digitizing coordinate transformation stage 20.
- the projections x, y, z now obtained pass from the coordinate transformation stage 20 into a scanning stage 30, where they are scanned by a scanning circuit 32 (sample-and-hold circuit).
- the scanning stage 30 also includes a multiplex circuit 34 for the parallel-to-series conversion of the projections obtained.
- the data of the individual projections that now occur serially arrive in a digitizing stage 40 which is represented in a simplified representation by an analog-digital converter 42.
- the x, u and z projections are digitized in this stage, for example with 8-bit resolutions; this resolution has proven to be sufficiently good for the usual practical purposes, but a 16-bit or even higher resolution could also be provided for the refined representation of the measurements or for the search for still unknown effects within the electrical signals.
- the digitized projections are symbolically represented with (x, y, z) dig .
- FIG. 7B shows in a very simplified representation the main part 50 of the cardiogoniometer in which the digitized projections (X, y, z) are digly converted into the corresponding meaningful sizes.
- these are the angle Phi, this is the true angle in the space between the QRS and T maximum vectors, then that on the underlying coordinate system, which is not orthogonal in the method according to the invention - the derivatives are not orthogonal, but probably the recycled as data x from the derivatives calculated projections, y, z -, aR related values, aT, R and Sst SS as well as the, for example, derived between two flanks ORS-beat interval of the heart.
- the cardiogoniometer part 50 is represented by a memory 52 which stores the current heartbeat data with random access, a memory 54 containing the processing program, the microprocessor 56 required for data management, which can be of the Motorola type 6800, for example, as is also the case in the cardiogoniometer described is, and in a symbolic representation, a switching network 58, z. B. a bus system for providing the data of interest from a buffer, not shown, which of course can also be carried out serially from the cardiogoniometer.
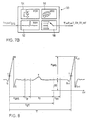
- FIG. 8 serves to illustrate the time-dependent process steps of a heartbeat interval.
- the typical image of an ECG curve is shown in sections, namely in the time period from a fully recorded QRS complex to a partially recorded aRS +1 complex.
- the steep OR flank is particularly suitable for triggering functional processes.
- the baseline of the curve is measured, then averaged and compared with the electrical neutral point zero volt (OV).
- This baseline voltage BS serves as a correction value for all amplitude-dependent variables, such as the QRS magnitude M QRS shown ; it actually represents the biological zero line.
- FIG. 9 now shows the cardiogoniometer device in detail.
- the electrical measured values of the five derivatives D, A, I, V, H, pass through individual input amplifiers 24 to an analog computer network 25, which essentially represents the circuit for coordinate transformation 22, in which computer network the projections x, y, z according to the formulas given determined and the signals of the projection variables are provided.
- These signals are then amplified in output amplifiers 26 in such a way that they can be recorded in a cardiograph or its writer running in parallel.
- a manifold 29 is provided for this.
- the x, y, z signals are fed via respective amplifiers 31 to the sample-and-hold circuits 32, the sample times of which are determined via the line 35 by a control program via the control circuit 53.
- the multiplexer 34 must be controlled to sample the pending signals, which is done via the line 36 through the same control network 53.
- This described circuit part comprises the analog signal processing, the analog signals occurring in the analog / digital converter 42 being converted to digital data. In the specified embodiment, as already mentioned, an 8-bit resolution was chosen, which, however, can be expanded to 16-bit without much additional effort.
- the digital data processing then comprises an input circuit 51, a data memory 52 and a control program memory 54 and an associated microprocessor 56.
- a memory with random access is used for the data storage, and a memory of the EPROM type is preferably used for storing the control program.
- the stored data relate to the digitized cardiac rhythm curves according to FIG. 8, while the control program is shown in principle in the structure diagram of the procedure in FIG. 11.
- This network is shown in FIG. 10 and comprises the components of the x, y, z input amplifiers 31, the outputs of which are connected to the respective sample and hold circuits 32, which in turn are connected from the input circuit 51 to the microcomputer via the here Control network 53, not shown, and the feed line 35 are synchronized.
- the multiplexer receives channel selection commands 0.1 and a multiplexer trigger command 0.1 from the digital input circuit 51, and the input amplifiers 31 and an intermediate amplifier 38 are also deactivated the same circuit driven in terms of gain.
- the cardiac rhythm signals to be digitized from the multiplexer 34 are amplified in the amplifier 38 and brought to the analog / digital converter 42.
- the analog / digital converter is also connected to the input circuit 51 via a line for indicating the status; the input circuit 51 starts the analog / digital converter by means of a converter signal via another line.
- the input circuit 51 is connected to the microcomputer as usual via three bus systems, the data bus, the address bus and the control bus.
- FIG. 11 finally shows a Jackson structure diagram of the method in a greatly simplified form.
- M. Jackson's structograms are read from top to bottom and left to right. If you follow this structogram, you can see a lem phase in the first step of the figure on the left, which is the adaptation of the device to the patient, which then results in parameters for the amplification, sampling intervals and stroke intervals. Three to six cycles according to FIG. 8 are used for this.
- the time interval between two heartbeats and the respective patient-specific adaptation of the different time windows shown in FIG. 8 are obtained from the beat interval. This is followed by data acquisition, from which the trigger points, the detection of the heartbeat and the offset correction primarily result.
- the heartbeat signals are continuously sampled, for example at 3 ms intervals.
- the measured values of a heartbeat period are only saved and evaluated after detection of the trigger point. This trigger point is determined by exceeding a predetermined slope of the QR flank.
- Trigger point search and heartbeat detection are repeated now and later, which is indicated in the form of a small star in the top right of the function block. With the data conversion speed of the discussed embodiment, every third heartbeat can be easily detected. With the necessary additional effort, every heartbeat can also be recorded.
- the processing of the signals relates to the calculation of the maximum vectors R and T, the calculation of the quantities Phi, aR, aT, ⁇ R, ⁇ T, etc., as well as the data conversion and preparation. Finally, the calculated sizes are used for evaluation in so-called online advertisements.
- H. Measured value displays for diagnosis during measurement on the patient often referred to as the bedside method. This includes the measurement data output on a digital display, the output of the same and further data on a printer for registration and for archiving purposes, as well as the output on a screen for tracking a graphic representation.
- so-called offline evaluations that is to say away from the patient, stored signals from the memory 52 are made available for further data processing, for example statistics, etc., which can be transferred to mass storage and further evaluated with correspondingly complex programs in larger computers.
- the QRS vector corresponds to the so-called electrical heart axis.
- Their position in space is characterized qualitatively today with the terms transverse position, steep position, horizontal position, over-rotated link type, etc.
- cardiogoniometry KGM provides a direction that is clearly defined in space. Even small changes in this direction can be demonstrated over time, e.g. B. increases or decreases in cardiac dilatation, increases or decreases in cardiac hypertrophies, development of a left anterior, fascicular block, etc.; all of this before any significant change is noticed in the standard electrocardiogram, that is to say in measurements according to the prior art.
- Changes in the QRS vector in the acute experiment such as changing the position of the QRS vector in the left side position or after exercise or after administration of medications such as.
- latent coronary insufficiency can be manifested by reducing the coronary flow, e.g. B. after administration of nitroglycerin - nitroglycerin leads on the one hand to a lowering of the preload and the stroke volume, thus also to a reduction in blood pressure, on the other hand to an increase in heart rate. Both effects lead to a reduction in the coronary flow, which is particularly effective in already slightly stenosed coronaries. This causes the T vector to migrate from the ischemic myocardial site weq. This effect is so clear that ergometry is not necessary for coronary patients.
- the T vector can migrate in a more or less limited area.
- This previously mentioned and designated floating effect is found in the cardiogoniometric series measurements according to the invention. This effect is extremely sensitive and can e.g. B. even after short cardiac arrests, e.g. B. after carotid sinus pressure, demonstrated.
- cardiogoniometry should also serve well for monitoring cardiac patients in the monitoring stations and for patients after myocardial infarctions or cardiac operations.
- Cardiogoniometry as a non-invasive, completely side effect-free examination method is also suitable for regular, annual heart monitoring for early detection of latent coronary insufficiency in patients at risk of myocardial infarction, such as smokers, diabetics, managers and hypercholesterolemics. Since the method is very sensitive to coronary artery circulatory disorders, it should also be suitable for checking cardiac drugs.
Landscapes
- Health & Medical Sciences (AREA)
- Life Sciences & Earth Sciences (AREA)
- Cardiology (AREA)
- Animal Behavior & Ethology (AREA)
- Public Health (AREA)
- Pathology (AREA)
- Engineering & Computer Science (AREA)
- Biomedical Technology (AREA)
- Heart & Thoracic Surgery (AREA)
- Medical Informatics (AREA)
- Molecular Biology (AREA)
- Surgery (AREA)
- Physics & Mathematics (AREA)
- General Health & Medical Sciences (AREA)
- Biophysics (AREA)
- Veterinary Medicine (AREA)
- Measurement And Recording Of Electrical Phenomena And Electrical Characteristics Of The Living Body (AREA)
- Electrotherapy Devices (AREA)
- Measuring Pulse, Heart Rate, Blood Pressure Or Blood Flow (AREA)
- Automatic Analysis And Handling Materials Therefor (AREA)
- Optical Record Carriers And Manufacture Thereof (AREA)
- Investigating Or Analysing Materials By Optical Means (AREA)
- Medicines Containing Material From Animals Or Micro-Organisms (AREA)
- Liquid Crystal Substances (AREA)
- Preparation Of Compounds By Using Micro-Organisms (AREA)
- Peptides Or Proteins (AREA)
Abstract
Description
Die Erfindung betrifft ein Verfahren zur Ermittlung und Darstellung eines auf das Herz bezogenen Raumvektors, der den Vektor des elektrischen Feldes darstellt, das durch die Aktivitaet des Herzens gebildet wird, ausgehend von Messwerten, die an Ableitungspunkten am Koerper erfasst werden, wobei aus den Messwerten an je zwei Ableitungspunkten je eine Potentialdifferenz gebildet wird.The invention relates to a method for determining and displaying a space vector related to the heart, which represents the vector of the electric field that is formed by the activity of the heart, based on measured values that are recorded at derivation points on the body, from which measured values A potential difference is formed for every two derivation points.
Ein solches Verfahren ist zum Beispiel aus der Zeitschrift « Instrumentenkunde ", Jahrgang 57, April 1937, H.E. und W. Hollmann : « Neue elektrokardiographische Registriermethoden", Seiten 147-167 bekannt. Diese Veroeffentlichung zeigt, dass drei Ableitungspunkte, und somit drei Elektroden, zur Erfassung von Messwerten am menschlichen Koerper so anzuordnen sind, dass diese Ableitungspunkte Ecken eines gleichseitigen Dreiecks bilden. Der geometrische Mittelpunkt dieses Dreiecks soll dabei mit dem Schwerpunkt des Herzens zusammenfallen. Zwischen je zwei Elektroden werden dann Spannungsdifferenzen gemessen, die man auch als Potentialdifferenzen bezeichnet. Diese Potentialdifferenzen werden als Projektionen eines Vektors auf die Seiten dieses Dreiecks aufgefasst. Ausgehend von diesen Projektionen werden Betrag und Richtung dieses Vektors in der Ebene dieses Dreiecks ermittelt. Dieser Vektor gibt Aufschluss ueber die Spannungen in einem elektrischen Feld, das durch das Herz erzeugt wird.Such a method is known, for example, from the magazine "Instrumentenkunde " ,
Der Nachteil dieses Verfahrens besteht darin, dass sich aus den genannten Potentialdifferenzen nur dann ein Vektor berechnen laesst, wenn die Potentiale an solchen Stellen gemessen werden, die zusammen Ecken eines gleichseitigen Dreiecks bilden. Veriaesst man diese Anordnung, so treten Fehler auf. Zudem wird auf diese Weise auch nur eine Projektion dieses Vektors auf eine Ebene ermittelt, was weitere Fehler zur Folge hat, denn der genannte Vektor liegt in Wirklichkeit nicht in dieser Ebene. Insbesondere laesst sich dieses Verfahren fuer rechtwinklige Ableitungssysteme nicht verwenden.The disadvantage of this method is that a vector can only be calculated from the potential differences mentioned if the potentials are measured at those points which together form corners of an equilateral triangle. Failure to do so will result in errors. In addition, only a projection of this vector onto a plane is determined in this way, which results in further errors, because the vector mentioned is not in this plane in reality. In particular, this method cannot be used for right-angled drainage systems.
Aus dem Buch von J. Patzold: « Kompendium Elektromedizin; Grundlagen, Technik, Anwendungen », Siemens, 1976 Berlin, Seiten 17 bis 20, sind zur Messung von elektrischen Spannungen am menschlichen Koerper weitere Ableitungspunkte bekannt. Diese von Nehb vorgeschlagenen Ableitungspunkte liegen in einer Ebene, die schraeg-sagittal das Herz schneidet. Die daraus abgeleiteten Potentialdifferenzen werden aber jede fuer sich als Skalare gedeutet und sind als Ergaenzung zu bekannten weiteren, aus anderen Punkten am Koerper abgeleiteten Potentialdifferenzen gedacht.From the book by J. Patzold: «Kompendium Elektromedizin; Fundamentals, technology, applications », Siemens, 1976 Berlin, pages 17 to 20, further derivation points are known for measuring electrical voltages on the human body. These derivation points proposed by Nehb lie in a plane that cuts the heart obliquely. The potential differences derived from this are, however, each interpreted as scalars and are intended as a supplement to known further potential differences derived from other points on the body.
Der Nachteil dieses bekannten Verfahrens besteht darin, dass die einzelnen Potentialdifferenzen nur jede fuer sich betrachtet werden und allenfalls etwas ueber die Arbeit des Herzens aussagen sollen. Dagegen werden sie nicht zur Ermittlung eines Raumvektors herangezogen.The disadvantage of this known method is that the individual potential differences are only considered individually and should at most say something about the work of the heart. In contrast, they are not used to determine a space vector.
Ferner ist aus der Zeitschrift « Philips Technische Rundschau », Band 21, Nr. 2, 1959-1960, G. C. E. Burger et al : « Vektorelektrokardiographie », Seiten 51-65, bekannt, dass das Herz als Dipol aufgefasst und der Dipol als Vektor dargestellt werden kann. Unter der Voraussetzung, dass Potentiale an Elektroden gemessen werden, die so am Koerper eines Patienten angeordnet sind, dass sie Ecken eines rechtwinkligen Dreiecks bilden, wird ferner eine Beziehung zwischen gemessenen Potentialdifferenzen und dem Dipolvektor angegeben. Die gemessenen Potentialdifferenzen werden dabei als skalares Produkt aus der Projektion des Dipolvektors auf eine Seite des rechtwinkligen Dreiecks und aus einem weiteren Vektor betrachtet.Furthermore, it is known from the magazine "Philips Technische Rundschau", Volume 21, No. 2, 1959-1960, GCE Burger et al: "Vector Electrocardiography", pages 51-65, that the heart is understood as a dipole and the dipole is represented as a vector can be. Provided that potentials are measured on electrodes which are arranged on the body of a patient in such a way that they form corners of a right-angled triangle, a relationship between measured potential differences and the dipole vector is also specified. The measured potential differences are considered as a scalar product from the projection of the dipole vector onto one side of the right-angled triangle and from another vector.
Der Nachteil dieses Verfahrens besteht aber darin, dass es schwierig ist, die Elektroden am Patienten so anzuordnen, dass die Berechnung des Vektors optimal erfolgen kann. Es ist somit immer noch mit groesseren Fehlern zu rechnen, insbesondere dann, wenn die Elektroden nicht an den Ecken des rechtwinkligen Dreieckes liegen. Zudem wird auf diese Weise auch nur die Projektion des Vektors auf eine Ebene ermittelt, in der der wirkliche Vektor auch nicht genau liegt.However, the disadvantage of this method is that it is difficult to arrange the electrodes on the patient in such a way that the vector can be calculated optimally. Larger errors can therefore still be expected, especially if the electrodes are not at the corners of the right-angled triangle. In addition, only the projection of the vector onto a plane in which the real vector is not exactly located is determined in this way.
Die Erfindung wie sie in den Patentanspruechen gekennzeichnet ist loest die Aufgabe, ein Verfahren zu schaffen mit denen, aus einer moeglichst geringen Anzahl Ableitungspunkte, Messwerte abgeleitet werden, die es erlauben, den Raumvektor mit seinem Betrag und seiner Lage im Raum moeglichst genau zu bestimmen.The invention as characterized in the claims solves the problem of creating a method with which, from the smallest possible number of derivation points, measured values are derived which allow the room vector with its amount and its position in the room to be determined as precisely as possible.
Die durch die Erfindung erreichten Vorteile sind im wesentlichen darin zu sehen, dass aus Messwerten an nur vier Ableitungspunkten auf diese Art der Raumvektor genuegend genau ermittelt werden kann. Nachtraegliche Korrekturen wie sie aus den bisher verwendeten Verfahren bekannt sind, entfallen. Damit ist das erfindungsgemaesse Verfahren wesentlich einfacher durchzufuehren als die bisherigen Verfahren, bei denen etwa zwoelf Ableitungspunkte benoetigt wurden und die damit noch weniger genaue Resultate ergaben. Daraus ergibt sich auch ein erheblicher wirtschaftlicher Vorteil fuer die Anwender solcher Verfahren. Die Erfindung erlaubt es zudem erstmals orthogonale Ableitungen des Raumvektors der Herzens in einem System mit einer schraegsagittalen Ebene zu erzeugen und zwar ohne nachtraegliche Korrekturen zu benoetigen.The advantages achieved by the invention can essentially be seen in the fact that the space vector can be determined with sufficient accuracy in this manner from measured values at only four derivation points. Subsequent corrections as are known from the previously used methods are no longer necessary. The method according to the invention is thus much easier to carry out than the previous methods, in which about twelve derivation points were required and which thus gave even less precise results. This also results in a considerable economic advantage for the users of such processes. The invention also makes it possible for the first time to generate orthogonal derivatives of the space vector of the heart in a system with an oblique-aggravate plane, without the need for subsequent corrections.
Die Erfindung wird nun mit Hilfe nachfolgend aufgeführter Figuren erklärt. Es zeigen :
- Fig. 1 das Vierpunkte-Ableitungssystem gemäss der Erfindung,
- Fig. 2 die Darstellung einer Projektion und Bildung eines Summenvektors daraus,
- Fig. 3 die Bildung der Frontalebene mit drei Ableitungen,
- Fig. 4 ein Quadrantenschema der schräg-sagittalen Ebene,
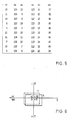
- Fig. 5 einen Ausdruck von Herzparametern,
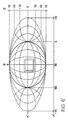
- Fig. 6, 6' die Festlegung eines statistischen Normalbereichs für T- und R-Vektorrichtungen in kartesischer und polarer Koordinatendarstellung,
- Fig. 7A, 7B in Prinzipdarstellung die Vorrichtung zur Durchführung des Verfahrens gemäss der Erfindung,
- Fig. 8 einen Ausschnitt aus einer EKG-Kurve,
- Fig. 9 ein Blockdiagramm einer Ausführungsform des Kardiogoniometers,
- Fig. 10 eine Detaildarstellung aus
Figur 9, und - Fig. 11 ein Struktogramm der Verfahrens.
- 1 shows the four-point derivation system according to the invention,
- 2 shows the representation of a projection and formation of a sum vector therefrom,
- 3 shows the formation of the frontal plane with three derivatives,
- 4 shows a quadrant diagram of the oblique-sagittal plane,
- 5 shows a printout of cardiac parameters,
- 6, 6 'the definition of a statistical normal range for T and R vector directions in Cartesian and polar coordinate representation,
- 7A, 7B in principle the device for performing the method according to the invention,
- 8 shows a section of an EKG curve,
- 9 is a block diagram of an embodiment of the cardiogoniometer.
- 10 shows a detailed illustration from FIG. 9, and
- 11 shows a structure diagram of the method.
Vor dem Eingehen auf die einzelnen Details soll noch in kommentierender Weise eine Uebersicht über einige wichtige Punkte gegeben werden.Before going into the individual details, an overview of some important points should be given in a commentary manner.
Der Weg zu einer neuen Modellvorstellung des Dipolmomentes öffnet sich, wenn man sich von der Einzelableitung abwendet und die elektrischen Verhältnisse in einer durch drei Ableitungspunkte gebildeten Ebene als Ganzes in Betracht zieht. Verwendet man im EKG den Begriff der geschlossenen Masche, beispielsweise in Form der Nehb'schen Ableitungen D, A, J, und betrachtet die elektrischen Verhältnisse in diesem Dreieck, so kann aus der Grösse der Ausschläge des elektrokardiographen näherungsweise auf ein relatives Mass für die Grösse des Dipolmoments geschlossen werden. Natürlich werden die Simultanausschläge, ob gross oder klein, immer die Summe Null ergeben, entsprechend der oben angedeuteten kirchhoff'schen Maschenregel. Betrachtet man nun aber die durch die drei Ableitungen gegebenen Potentialdifferenzen als Teilvektoren und addiert sie alle drei nach den Regeln der vektoriellen Addition, indem man die Grösse der Auschläge und ihre Polarität einerseits, aber auch die Ableitungsrichtung andererseits berücksichtigt, so erhält man einen Summenvektor, den man im hier vorgestellten Modell als Dipolmoment des Herzens in seiner Gesamtheit bezeichnen kann,The path to a new model of the dipole moment opens when one turns away from the individual derivative and takes the electrical conditions into account as a whole in a plane formed by three derivation points. If one uses the term closed mesh in the EKG, for example in the form of Nehb's leads D, A, J, and considers the electrical conditions in this triangle, the size of the excursions of the electrocardiograph can be approximated to a relative measure of the size of the dipole moment are closed. Of course, the simultaneous swings, whether large or small, will always add up to zero, according to the Kirchchhoff mesh rule indicated above. However, if one considers the potential differences given by the three derivatives as partial vectors and adds all three according to the rules of vectorial addition, taking into account the size of the deflections and their polarity on the one hand, but also the direction of the derivative on the other hand, we get a sum vector, the in the model presented here one can call the dipole moment of the heart in its entirety,
![]()
![]()
Aufgrund dieser neuen Konzeption ist es möglich, von vier herznahen Ableitungspunkten aus und ohne Vorschaltung eines wie bis anhin notwendigen Widerstandsnetzwerkes drei orthogonale Projektionen x, y und z zu konstruieren.Thanks to this new concept, it is possible to construct three orthogonal projections x, y and z from four cardiac derivation points and without connecting a resistance network, which was previously necessary.
Auch dieses neue Modell der Vektorkonstruktion kann naturgemäss nicht den Anspruch auf absolute Genauigkeit erheben. Dies beruht auf der inhomogenen Leitfähigkeit des das Herz umgebenden Gewebes, das für den einzelnen Patienten jedoch eine konstante Grösse darstellt, so dass man auf deren Korrektur verzichten kann, wie dies auch bei allen empirischen, sogenannten kubischen Systemen (Schellong, Duchosal, usw.) der Fall ist. Infolge der Inhomogenität des elektrischen Feldes und damit der Unkenntnis des Feldlinienverlaufes an den Ableitungspunkten gemäss Erfindung ist die Bestimmung des Dipols, sowohl was die Magnitude als auch die Richtung anbetrifft, wohl nicht ganz genau, aber für den einzelnen Patienten konstant und über Jahre reproduzierbar (was anhand von hunderten von Messungen ermittelt worden ist). Dieses Resultat ergab sich nicht zuletzt durch die einfache und anwendungssichere Ableitungstechnik gemäss der Erfindung.Naturally, this new model of vector construction cannot claim absolute accuracy. This is due to the inhomogeneous conductivity of the tissue surrounding the heart, which, however, represents a constant size for the individual patient, so that correction can be dispensed with, as is the case with all empirical, so-called cubic systems (Schellong, Duchosal, etc.) the case is. Due to the inhomogeneity of the electric field and thus the ignorance of the field line at the derivation points according to the invention, the determination of the dipole, both in terms of the magnitude and the direction, is probably not exactly accurate, but constant for the individual patient and reproducible over years (which based on hundreds of measurements). This result resulted not least from the simple and safe application technique according to the invention.
Figur 1 zeigt das Vier-Punkte-Ableitungssystem gemäss Erfindung. Das im räumlichen Sinne zu verstehende, tetraederförmige Ableitungssystem zeigt die vier Elektrodenansatzstellen E1, E2, E3 und E4. Verbunden sind diese Ableitungspunkte jeweils folgendermassen : (E1, E2) als inferiores Paar I, wobei E1 dem Punkt zur Ermittlung der Spannung V4 nach Wilson entspricht, und zwar 5 ICR (Intercostalraum) und MCL (Medioclavicularlinie), und der zu E1 sagittal liegende Punkt E2 dem Punkt zur Ermittlung der Spannung V8 nach Wilson entspricht. Lotrecht über dem Punkt E1 ist im Abstand von 1/\12 mal E1 E2 der Ableitungspunkt E3; diese Ableitung ist die vertikale, mit V bezeichnete. Das horizontale, mit H bezeichnete Ableitungspaar (E3, E4) ist waagerecht nach der rechten Patientenseite im Abstand von 1/\12 mal E1 : E2 angeordnet. Dann wäre noch die dorsale, mit D bezeichnete Ableitung (E2, E4) sowie die anteriore, mit A bezeichnete Ableitung (E1, E4) zu nennen, deren Abstand zueinander durch die vorgenannten proportionalitäten festgelegt ist. Ein zusätzliches Lot vom Ableitungspunkt E3 auf die Anteriore wird mit z. bezeichnet. In dieser Darstellung bildet dann A/I die schräg-sagitalle x, y-Ebene, Z/A die frontale y, z-Ebene und Z/I die z, x-Ebene. Die Paarung der Ableitungspunkte E2/ und E3 wird als einer unbenützten Ebene zugehörig sowie auch als redundantes Paar nicht berücksichtigt. Das heisst jedoch nicht, dass nicht auch aus dieser Ableitung diagnostisch relevante Information zu entnehmen ist.Figure 1 shows the four-point derivation system according to the invention. The tetrahedral lead system to be understood in the spatial sense shows the four electrode attachment points E1, E2, E3 and E4. These derivation points are connected as follows: (E1, E2) as an inferior pair I, where E1 corresponds to the point for determining the voltage V4 according to Wilson, namely 5 ICR (intercostal space) and MCL (medioclavicular line), and the point lying sagittally to E1 E2 corresponds to the point for determining the voltage V8 according to Wilson. The derivation point E3 is perpendicular to point E1 at intervals of 1 / \ 12 times E1 E2; this derivative is the vertical one, labeled V. The horizontal pair of leads (E3, E4) labeled H is arranged horizontally to the right of the patient at a distance of 1 / \ 12 times E1: E2. Then there is the dorsal lead (D2, E4) and the anterior lead (E1, E4), whose distance from each other is determined by the aforementioned proportions. An additional solder from the derivation point E3 to the anterior is z. designated. In this representation, A / I forms the oblique-sagital x, y plane, Z / A the frontal y, z plane and Z / I the z, x plane. The pairing of the derivation points E2 / and E3 is not taken into account as belonging to an unused level or as a redundant pair. However, this does not mean that diagnostically relevant information cannot be derived from this derivation.
Zwei Ableitungspunkte, nämlich E3 und E2 sind in ihrer relativen Lage zum Herzen des Patienten verhältnismässig unkritisch, d. h. Manipulationsstreuungen innerhalb gewisser Grenzen beim Anbringen der Elektroden führen jeweils zum selben Endresultat. Lotrecht über der Herzspitzenelektrode E1 - deren Lage übrigens recht genau bestimmt werden muss - kommt auf verhältnismässig verschlieblichem Gewebe der Ableitungspunkt mit der Elektrode E3 zu liegen. Vor allen Dingen bei Lageänderungen des Patienten während der Messung wird dieser Ableitungspunkt E3 relativ zur angelegten Geometrie und damit auch zum Herzen in eine jeweils andere Lage verschoben. Dies führt jedoch nicht zu Fehlmessungen, so dass die am meisten den Lageverschiebungen ausgesetzte Elektrode E3 als eine elektrisch adaptive Elektrode betrachtet werden kann. Sie ist gegen Verschiebung des Gewebes beziehungsweise Lokalisierungsfehler wenig empfindlich, was als Vorteil der Messung angesehen werden kann. Die Messung wird bei Lageänderung des Patienten nicht wesentlich beeinflusst. Zur begrifflichen Präzisierung für das Nachfolgende soll noch erwähnt werden, dass zwischen x, y, z-Projektionen und den entsprechenden elektrischen Ableitungen beziehungsweise deren Signalen jeweils unterschieden wird.Two derivation points, namely E3 and E2, are relatively uncritical in their relative position to the patient's heart, ie manipulation scatter within certain limits when the electrodes are applied each lead to the same end result. The derivation point with the electrode E3 lies vertically above the cardiac tip electrode E1 - the position of which, by the way, has to be determined very precisely - on relatively flexible tissue. Above all when the patient changes position during the measurement, this derivation point E3 is shifted to a different position relative to the geometry applied and thus also to the heart. However, this does not lead to incorrect measurements, so that the electrode E3 which is most exposed to the positional shifts can be regarded as an electrically adaptive electrode. It is not very sensitive to tissue displacement or localization errors, which can be seen as an advantage of the measurement. The measurement is not significantly affected when the patient changes position. As a conceptual clarification for the following, it should be mentioned that between x, y, z projections and the a distinction is made between corresponding electrical derivatives or their signals.
Die Elektroden werden für die Ableitung gemäss der Erfindung folgendermassen am Patienten angelegt :
- 1. E1 entsprechend dem Punkt für die Spannung V4 (Wilson) = 5 ICR und MCL ;
- 2. E2 sagittal zu E1 (entsprechend dem Punkt für die Spannung V8 Wilson) ;
- 3. E3 lotrecht über E1 im Abstand 0.7 - E1 E2 ;
- 4. E4 waagerecht nach der rechten Patientenseite im Abstand von 0.7 · E1 E2 ;
- 5. die Masseelektrode wird vorzugsweise am rechten Arm des Patienten angebracht.
- 1. E1 corresponding to the point for voltage V4 (Wilson) = 5 ICR and MCL;
- 2. E2 sagittal to E1 (corresponding to the point for voltage V8 Wilson);
- 3. E3 perpendicular over E1 at a distance of 0.7 - E1 E2;
- 4. E4 horizontally to the right of the patient at a distance of 0.7 · E1 E2;
- 5. The ground electrode is preferably attached to the patient's right arm.
Dies ist ein bevorzugstes Vorgehen zum Anlegen der Elektroden am Patienten. Dabei sei noch speziell darauf hingewiesen, dass für die Herzdiagnose an Tieren nur die für das bestimmte Tier geltende geometrische Elektrodenkonfiguration zur Ableitung angewendet und zur Bestimmung der orthogonalen Ableitungen lediglich die Koordinatentransformationsstufe mit adäquaten Parametern versehen werden muss. Die Erfindung eignet sich also gleichermassen für die Herzdiagnose vom Mensch und Tier.This is a preferred procedure for placing the electrodes on the patient. It should also be pointed out that for cardiac diagnosis in animals, only the geometric electrode configuration for the specific animal, which is applicable to the derivation, must be used, and only the coordinate transformation level must be provided with adequate parameters for the determination of the orthogonal derivations. The invention is therefore equally suitable for the heart diagnosis of humans and animals.
Die Vektorschleife beim Herzgesunden verläuft von vorne oben rechts nach vorne unten links und nach Wendung gegen hinten wieder zurück nach vorne oben rechts, d. h. die Vektorschleife liegt mehr oder weniger in oder parallel einer zur Sagittalen geneigten Ebene (gemäss Figur 1 die Fläche zwischen den drei Ableitungspunkten E1, E2 und E4). EKG-Ableitungen in dieser Ebene müssen somit auf Veränderungen der Vektorschleife sehr sensibel reagieren, was an weit über 2000 EKG-Messungen bestätigt wurde. Diese Ebene wird zur Konstruktion zweier senkrecht aufeinanderstehender Projektionen x und y und die Frontalebene zur Konstruktion der senkrecht auf der Nehb'schen Ebene stehenden Projektion zo benutzt.The vector loop in healthy people runs from the top right to the front bottom left and after turning backwards back to the front top right, i.e. the vector loop lies more or less in or parallel to a plane inclined to the sagittal (according to FIG. 1, the area between the three derivation points E1, E2 and E4). ECG recordings in this level must therefore react very sensitively to changes in the vector loop, which has been confirmed on far more than 2000 ECG measurements. This plane is used for the construction of two perpendicular projections x and y and the front plane for the construction of the projection perpendicular to the Nehb plane z o .
Damit ein rechtwinkliges Ableitungsdreieck erhalten wird, was aus trigonometrischen Gründen Vorteile bietet, wählt man als dorsalen Ableitungspunkt des zur Sagittalen geneigten Dreiecks nicht den Punkt V7, wie Nehb es tat, sondern E2 entsprechend V8, der schräg-sagittal zu Punkt V4 entsprechend E1 (= Herzspitze) liegt. Damit erhält man über der Herzspitze einen rechten Winkel, die Ableitung A steht senkrecht zur Ableitung I gemäss der Ublichen EKG-Terminologie; zudem ist dieser Ableitungspunkt V8 entsprechend E2 eindeutig bestimmbar und leicht zu finden, ein Teilaspekt des Ableitungssystems gemäss Erfingung. Mit der Wahl des Punktes V8 nach Wilson als dorsalen Ableitungspunkt erhalten wir mit den Punkten EI-E2-E4 eine Ebene definiert, die im Folgenden schräg-sagitalle ebene genannt wird. Die von Nehb eingeführten Ableitungsbezeichnungen D, A und I werden beibehalten.So that a right-angled derivative triangle is obtained, which offers advantages for trigonometric reasons, one does not choose point V7 as Nehb did as the dorsal derivative of the triangle inclined to the sagittal, but E2 according to V8, the oblique-sagittal to point V4 according to E1 (= Apex). This gives a right angle over the apex of the heart, lead A is perpendicular to lead I according to the usual ECG terminology; in addition, this derivation point V8 can be clearly determined and easily found according to E2, a partial aspect of the derivation system according to the invention. With the choice of point V8 according to Wilson as the dorsal derivation point, we get with the points E I -E2-E 4 a plane defined, which is called oblique-sagital plane in the following. The derivation designations D, A and I introduced by Nehb are retained.
Wählt man die y-Achse des hier besprochenen orthogonalen Systems parallel zur Ableitung A und die x-Achse parallel zur Ableitung I, so darf die Ableitung A nicht als Projektion des Vektors auf die Achse y und die Ableitung J nicht als Projektion des Vektors auf die Achse x angenommen werden. Es müssen vielmehr zur Vektorkonstruktion alle drei Ableitungen D, A und I vektoriell addiert werden in der Form V = D + A + I Den so gebildeten Summationsvektor projiziert man dann auf die x- und y-Achse, wie dies in Figur 2 dargestellt ist. Gemäss trigonometischer berechnung erhält man folgende Formeln :![]()
![]()
![]()
![]()
Als dritte Achse im orthogonalen System braucht man eine zusätzliche Vektorprojektion, die senkrecht auf diesen zwei Achsen steht. Diese Projektion z° erhält man durch die ableitung im frontalen Dreieck der Punkte E1, E3, E4, wobei die Punkte E1 und E4 die vorderen Ableitungspunkte des schräg- sagittalen Dreiecks darstellen. Punkt E3 wird so gewählt, dass seine Distanz von den Punkten E1 und E4 gleich gross ist und zwischen diesen zwei Linien ein rechter Winkel besteht, wie die in Figur 3 dargestellt ist. Damit erhält man ein rechtwinkliges, gleichschenkliges Dreieck. In diesem Dreieck gelten folgende Ableitungen : von Punkt E4 zu Punkt E3 die horizontale Ableitung H, von Punkt E3 zu Punkt E1 die vertikale Ableitung V und von Punkt E1 zu Punkt E4 die anteriore Ableitung A, welche mit der Ableitung A im schräg-sagittalen Dreieck D, A, I identisch ist. Auch in diesem frontalen Dreieck kann man nach dem gleichen Vorgang einen Vektor konstruieren, indem man die simultanausschläge der drei Ableitungen vorzeichen- und achsengerecht zur vektorsummation aneinanderreiht. Was von diesem Summenvektor nun interessiert, ist seine Projektion auf die in der figur 3 angegebene z°-Achse. Diese zo-Achse ist nichts anderes als die Senkrechte vom Punkt E3 auf die Ableitung A und damit auf die Nehb'sche Ebene. Da diese Senkrechte die Winkelhalbierende des rechten Winkels in Punkt E3 darstellt, lässt sich diese Projektion z° des Vektors trigonometrisch darstellen als (V - H) - sin 45°, wobei bei positivem Vorzeichen dieser Grösse der Vektor unter der Nehb'schen Ebene liegt, bei negativem Vorzeichen über der Nehb'schen Ebene. Anders ausgedrückt : die zo-Achse ist somit nach unten gerichtet positiv, nach oben gerichtet negativ und stets senkrecht auf der schrägsagittalen Ebene, d. h. senkrecht zu den Achsen x und y. Zusammenfassend kann gesagt werden, die drei orthogonalen Projektionen x, y und z lauten somit :![]()
![]()
![]()
![]()
![]()
![]()
Die Berechnung der Maximalvektoren von QRS und T und die Bestimmung des Raumwinkels ϕ zwischen diesen beiden Maximalvektoren wird gemäss dem üblichen raumtrigonometrischen Vorgehen durchgeführt :The calculation of the maximum vectors of QRS and T and the determination of the solid angle ϕ between these two maximum vectors is carried out according to the usual spatial trigonometric procedure:
Die Raumvektoren seien bezeichnet mit 1 und 2, deren Projektionen auf die x-, y- und z-Achse mit x1, y1, z1 bzw. mit xε, y2 und z2, welche Grössen einem orthogonalen, räumlichen Koordinatensystem angehören.The space vectors are designated 1 and 2, their projections on the x, y and z axes with x 1 , y 1 , z 1 and with xε, y 2 and z 2 , respectively, which sizes belong to an orthogonal, spatial coordinate system .
Die zur Vektorberechnung gebräuchliche Formel für den Raumwinkel ϕ lautet :
Im Zähler erhält man das Skalarprodukt und im Nenner das Produkt der Absolutwerte der beiden Vektoren. Damit beträgt die Länge des Vektors 1 :![]()
- die Länge des Vektors 2 beträgt :

- the length of the
vector 2 is:
Der Maximalvektor der Depolarisation ist somit derjenige Punkt der Vektorschleife von QRS, dessen Summe der Quadrate der drei Projektionen x, y und z am grössten ist, also :![]()
![]()
Das selbe gilt für den Maximalvektor der T-Schleife :![]()
![]()
Neben dem Winkel ϕ interessiert auch die Lage der Maximalvektoren von QRS und T im Raume, weshalb die Projektionen der Vektoren in die schräg-sagittale Ebene einerseits und in die Frontalebene anderereits bestimmt werden müssen. Dabei ist zu bemerken, dass aus historischen Gründen in der Elektrokardiographie, insbesondere in der Vektorkardiographie, die Raumkoordinatenachsen in mathematisch nicht üblichem Sinne bezeichnet sind; die x-, y- und z-Achsen sind relativ dem menschlichen Körper zugeordnet, wobei der Koordinatenursprung ungefähr zentral im Torso zu liegen kommt. Die in der Körperlänge nach unter und oben verlaufende Achse ist die y-Achse; die negative y-Achse zeigt nach oben gegen den Kopf und die positive y-Achse zeigt nach unten. Die horizontale Achse ist die x-Achse, wobei nach rechts sich die positive x-Achse erstreckt, umgekehrt nach links die negative x-Achse. Quer durch den Körper von vorne nach hinten verläuft die z-Achse, und zwar von der Körpermitte nach vorne die positive z-Achse und nach hinten aus dem Rücken austretend die negative z-Achse. Dies entspricht der üblichen Konvention ; das für die Erfindung verwendete orthogonale System entspricht dem in Figur 1 gezeigten x, y, zo-System, es ist um 45° zur Sagittalen geneigt.In addition to the angle ϕ, the position of the maximum vectors of QRS and T in space is also of interest, which is why the projections of the vectors into the oblique-sagittal plane on the one hand and into the frontal plane on the other must be determined. It should be noted that for historical reasons in electrocardiography, in particular in vector cardiography, the spatial coordinate axes are denoted in a mathematically unusual way; The x, y and z axes are relatively assigned to the human body, the origin of the coordinates being located approximately centrally in the torso. The axis running up and down in body length is the y-axis; the negative y-axis points upwards towards the head and the positive y-axis points downwards. The horizontal axis is the x-axis, with the positive x-axis extending to the right and vice versa the negative x-axis. The z-axis runs across the body from front to back, namely the positive z-axis from the center of the body to the front and the negative z-axis emerging from the back. This corresponds to the usual convention; the orthogonal system used for the invention corresponds to the x, y, z o system shown in FIG. 1, it is inclined at 45 ° to the sagittal.
Die schräg-sagittale Ebene - durch die Achsen x und y bestimmt - wird in 360° aufgeteilt, wobei 0° horizontal nach hinten, 90° nach unten links, 180° nach vorne und minus 90° nach oben rechts festgelegt werden ; dieser Sachverhalt ist in Figur 4 dargestellt. Die Umwandlung der rechtwinkligen Koordinaten x und y in die Polarkoordinaten erfolgt nach folgenden Formeln, wobei der Polarwinkel in der schräg-sagittalen Ebene mit a bezeichnet ist.![]()
![]()
![]()
![]()
![]()
![]()
![]()
![]()
Ein Beispiel : x betrage -10, y + 15. Dieser Vektor muss im II. Quadranten liegen :![]()
![]()
Dieses Beispiel ist im Quadrantenschema eingetragen (Fig. 4).This example is entered in the quadrant scheme (Fig. 4).
Genau gleich verfährt man mit der Umwandlung der rechtwinkligen Koordinaten z und y in der Frontalebene, indem man die y-Achse der schräg-sagittalen Ebene als Basis wählt. Null Grad ist somit links unten, 180° rechts schräg oben. Die Basis in der Frontalebene liegt somit 45° zur Körperachse, also schräg-sagittal, und nicht horizontal wie bei den Frank'schen Ableitungen. Der Polarwinkel in der Frontalebene wird mit β bezeichnet. Dieser Winkel β gibt die genaue Projektion des Vektors auf die Frontalebene ; ist β positiv, verläuft der Vektor unter der schräg-sagittalen Ebene, ist er negativ, über dieser.The process for converting the right-angled coordinates z and y in the frontal plane is exactly the same by choosing the y-axis of the oblique-sagittal plane as the basis. Zero degrees is therefore at the bottom left, 180 degrees at the top right. The base in the frontal plane is therefore 45 ° to the body axis, i.e. diagonally sagittal, and not horizontal as in Frank's derivatives. The polar angle in the frontal plane is denoted by β. This angle β gives the exact projection of the vector on the frontal plane; if β is positive, the vector runs below the oblique-sagittal plane, if it is negative, above it.
Die Ermittlung der Maximalvektoren von QRS und von T aufgrund der Ableitungen D, A, I und H, A und V, d. h die Verwertung der elektrischen Ableitungssignale, ist Aufgabe des Kardiogoniometers gemäss der Erfindung. Von der vier Messpunkten E1, E2, E3, E4 (Figur 1) werden die fünf Ableitungssignale D (Dorsal), A (Anterior), I (Inferior), H (Horizontal) und V (Vertikal) gebildet und gemäss der oben genannten Formeln 1, 2 und 3 zu den drei Projektionen x, y und z gewandelt. Die drei daraus entstehenden, zeitabhängigen, elektrischen Signale bilden drei, den Projektionen entsprechende Kurvenzüge, die in Zeitabständen von beispielsweise drei Millisekunden ausgemessen, quadriert und summiert werden und schliesslich diese Werte in einem Speicher zur Weiterverwertung gespeichert werden ; dies bezieht sich in diesem Beispiel dann einerseits auf die Werte QRS und andererseits auf die Werte T. Nach dem Wert T wird zwischen der T-Welle und der folgenden P-Welle des nächsten Schlages die Null-Linie ermittelt und entsprechende Korrekturen vorgenommen, wenn nötig alle die gespeichterten Werte auf den ermittelten Null-Wert bezogen. Das Maximale Summenquadrat von x1, y1 und z1 einerseits und von x2, y2 und z2 andererseits wird ermittelt. Aufgrund dieser Daten errechnet das Kardiogoniometer dann den cos ϕ nach Formel 4 und bestimmt daraus den arccos ϕ. Es wird also beinahe unmittelbar der Winkel ϕ eines bestimmten einzigen Herzschlages bereitgestellt. Anschliessend werden im Kardiogoniometer auch die Winkel αR, aT, βR und βT aufgrund der Formeln 7 bis 10 errechnet und diese Daten inklusive der Basisdaten x1, yl, z1, x2, y2, und z2 abgespeichert. Von ein und demselben Herzschlag sind damit elf Parameter bereitstellbar und als zwöflter Parameter steht noch das Schlagintervall zur Verfügung. Alternativ kann das Problem der langsam schwankenden Null-Linie auch mit einem digitalen oder analogen Hochpassfilter gelöst werden.The determination of the maximum vectors of QRS and T based on the derivatives D, A, I and H, A and V, d. h the utilization of the electrical lead signals is the task of the cardiogoniometer according to the invention. The five derivation signals D (dorsal), A (anterior), I (inferior), H (horizontal) and V (vertical) are formed from the four measuring points E1, E2, E3, E4 (FIG. 1) and according to the formulas mentioned above 1, 2 and 3 converted to the three projections x, y and z. The three resulting, time-dependent, electrical signals form three curves corresponding to the projections, which are measured, squared and summed at intervals of, for example, three milliseconds and finally these values are stored in a memory for further use; in this example, this then relates on the one hand to the values QRS and on the other hand to the values T. After the value T, the zero line is determined between the T-wave and the following P-wave of the next stroke and corresponding corrections are made if necessary all the stored values refer to the determined zero value. The maximum sum square of x 1 , y 1 and z 1 on the one hand and of x 2 , y 2 and z 2 on the other hand is determined. Based on this data, the cardiogoniometer then calculates the cos ϕ according to
Zur Kontrolle des Kardiogoniometers im Betrieb können beispeilsweise gleichzeitig die Projektionen x, y und z auf einem Drei-Kanal-Elektrokardiographen mitgeschrieben werden (Figur 9). Diejenigen Signalkomplexe, die der Kardiogoniometer errechnet hat, werden auf dem die Kurvenzüge enthaltenden Streifen markiert. Damit steht einerseits eine Anzeige zur Verfügung, die sich an die übliche Darstellung des EKG anlehnt und andererseits zugleich eine graphische Darstellung einiger errechneter Daten bzw. wirklicher Projektionen der Ableitungen enthält.To check the cardiogoniometer during operation, for example, the projections x, y and z can be recorded simultaneously on a three-channel electrocardiograph (FIG. 9). Those signal complexes that the cardiogoniometer has calculated are marked on the strip containing the curves. Thus, on the one hand, there is a display that is based on the usual display of the EKG and, on the other hand, also contains a graphic representation of some calculated data or actual projections of the leads.
In einer verwendeten Ausführungsform des Kardiogoniometers werden sechs Messgrössen Phi, aR, βR, aT, βt sowie das Schlagintervall auf einem Drucker fortlaufend ausgedruckt (Figur 5). Auf diese Weise wird zirka jeder dritte Herzschlag ausgemessen. Es können also in kurzer zeit am Patienten Serienmessungen durchgeführt werden, die es erlauben, statistische Werte wie Mittelwert und Standardabweichung zu bestimmen.In one embodiment of the cardiogoniometer used, six measured variables Phi, aR, βR, aT, βt and the stroke interval are printed out continuously on a printer (FIG. 5). In this way, approximately every third heartbeat is measured. Series measurements can thus be carried out on the patient in a short time, which allow statistical values such as mean value and standard deviation to be determined.
Als Beispiel wurden die Normwerte an einem Kollektiv von hundert herzgesunden Probanden ermittelt, welche folgende Kriterien erfüllen :
- 1. Klinish keine Anhaltspunkte für eine organisches Herzleiden.
- 2. Normales EKG in den zwölf Standardableitungen gemäss Stand der Technik.
- 3. Ueber zehn Herzschläge konstante Werte aller fünf Parameter cp, aR, aT, βR und βT gemäss der Erfindung, wobei die Streuung kleiner als ±5° ist, was bedeutet, dass bei jedem Herzschlage De- und Repolarisation den gleichen « elektrischen Weg » nehmen. Die so ermittelten Werte lauten für

- 1. Klinish no evidence of an organic heart condition.
- 2. Normal ECG in the twelve standard leads according to the state of the art.
- 3. Over ten heartbeats constant values of all five parameters cp, aR, aT, βR and βT according to the invention, the scatter being less than ± 5 °, which means that with each heartbeat, de- and repolarization have the same «electrical path» to take. The values determined in this way are for
Wählt man ± 2 Standardabweichungen als Normgrenzen, ergeben sich folgende Normwerte (aufgerundet) für Herzgesunde in Rückenlage :
- Phi = 0°
bis 31° - aR = 65°
bis 115° - βR = + 25°bis -10°
- aT = 75°
bis 120° - βT = + 20° bis―15°
- Phi = 0 ° to 31 °
- aR = 65 ° to 115 °
- βR = + 25 ° to -10 °
- aT = 75 ° to 120 °
- βT = + 20 ° to ― 15 °
In diesem Kollektiv finden sich 56 Männer und 44 Frauen ; das Alter der Probanden lag zwischen 14 und 89 Jahren. Mit plus/minus zwei Standardabweichungen sind 95,4 % der Fälle statistisch erfasst.In this collective there are 56 men and 44 women; the age of the subjects was between 14 and 89 years. With plus / minus two standard deviations, 95.4% of the cases are recorded statistically.
Die Maximalvektoren von De- und Repolarisation liegen beim Normalen somit sehr nahe beieinander, der wahre Winkel im Raum Phi beträgt 0° bis 310 (15° +/-16°). Bei einem Winkel kleiner als 31° können aber trotzdem pathologische Verhältnisse vorliegen, wenn sowohl die De- wie auch Repolarisation gestört sind. Als Sehr wichtig erweist sich somit die Ortung von Rmax und Tmax in Bezug auf die Saggital- und Frontalebene. Diese liegen in einem kleinen Umkreis um die mittlere Axillarlinie (Winkel α = 90°) und wenig unter oder über der schrägsagittalen Ebene (Winkel β 0°). Figur 6 zeigt in einer grafischen Darstellung diesen eben beschriebenen Sachverhalt.The maximum vectors of de- and repolarization are thus very close to one another in normal, the true angle in space Phi is 0 ° to 310 (15 ° +/- 16 °). At an angle of less than 31 °, pathological conditions can nevertheless exist if both the de- and repolarization are disturbed. The location of Rmax and T max in relation to the sagittal and frontal plane has proven to be very important. These lie in a small radius around the middle axillary line (angle α = 90 °) and a little below or above the obliquely sagittal plane (angle β 0 °). FIG. 6 shows this situation just described in a graphic representation.
Ein Abweichen der Vektoren von diesem elektrischen Zentrum (gemäss Figur 6' durch einen längeren Vektorpfeil angedeutet) nach vorne, hinten, oben und unten und schliesslich auch noch auf die Hinterfläche (damit ist die Darstellung auf der Kugeloberfläche gamäss Figur 6' gemeint) bedeutet einen pathologischen Befund. So finden sich typische Verlagerungen des R-Vektors, z. B. bei den Blockbildern, LSB bzw. RSB, LAFB oder BFB sowie auch bei R-Verlusten nach Infarkten. Andererseits wird jede Repolarisationsstörung sich im Abweichen des T-Vektors in der Gegenrichtung zum Herd der Läsion manifestieren.A deviation of the vectors from this electrical center (indicated by a longer vector arrow according to FIG. 6 ') to the front, back, up and down and finally also to the rear surface (this means the representation on the spherical surface according to FIG. 6') means one pathological finding. Typical displacements of the R vector, e.g. B. with the block diagrams, LSB or RSB, LAFB or BFB as well as with R losses after infarcts. On the other hand, any repolarization disorder will manifest itself in the deviation of the T vector in the opposite direction to the lesion focus.
In Linksseitenlage verlagert sich das Herz meist um ungefähr 10° nach hinten. Die Normwerte verschieben sich also was den Winkel a betrifft um 10° nach hinten auf:![]()
![]()
Die bisher verbreitete Vorstellung, dass in Linkslage Durchblutungsstörungen der rechten Koronararterie (RCA) sich manifestieren könnten, hat sich bei Anwendung der Erfindung in Vergleichen mit Koronarogrammen von Koronarkranken bestätigt, und zwar so: in Linksseitenlage kommt es bei Ischämie im Gebiet der re.Koronararterie zum Abweichen des T-Vektors nach vorne (aT wird grösser als 110°). Damit kommt es auch zu einer Oeffnung bzw. Vergrösserung des Winkels Phi, welcher ja den wahren Winkel im Raum zwischen den Maximalvektoren QRS und T bezeichnet. Ein KGM in Linkslage als kleiner Funktionstest der RCA sollte deshalb routinemässig immer mitgeschrieben werden.The previously widespread notion that circulatory disorders of the right coronary artery (RCA) could manifest itself in the left position has been confirmed when the invention is applied in comparison with coronarograms of coronary patients, namely as follows: in the left side position, ischemia occurs in the area of the right coronary artery Deviation of the T vector to the front (aT becomes greater than 110 °). This also leads to an opening or enlargement of the angle Phi, which denotes the true angle in the space between the maximum vectors QRS and T. A KGM in the left position as a small function test of the RCA should therefore always be routinely recorded.
Serienmessungen bei Patienten mit Koronarinsuffizienz zeigen bei technisch einwandfreien Projektionen x, y, z ein mehr oder weniger starkes Schwanken der Werte für den T-Vektor. Die Standardabweichung von zehn Messungen liegt also über dem arbitrarisch festgelegten Wert 5°, und dies ist wahrscheinlich ein Hinweis für das Vorliegen einer Myokardischämie. Erstmals konnte dieses Phänomen des « floating " bei einem Patienten im status anginosus kurz von Auftreten eines Vorderwandinfarktes mit Hilfe des Kardiogoniometers und Ableitungsverfahren gemäss Erfindung beobachtet werden.Series measurements in patients with coronary insufficiency show a more or less strong fluctuation of the values for the T vector when the projections x, y, z are technically perfect. The standard deviation of ten measurements is therefore above the arbitrarily determined value of 5 °, and this is probably an indication of the presence of myocardial ischemia. For the first time, this phenomenon of "floating" could be observed in a patient with status anginosus shortly from the occurrence of a front wall infarction with the help of the cardiogoniometer and derivation method according to the invention.
Die Figuren 7A und 7B zeigen in vereinfachter Darstellung die Vorrichtung zur Druchführung des Verfahrens. In Figur 7A ist die Informationsgewinnung ab dem' meschlichen Körper bis zu Digitalisierung in vier apparative Stufen 10, 20, 30 und 40 aufgeteilt. Die erste mit 10 bezeichnete Stufe zeigt die Ableitungen, wie sie auch in Figur 1 dargestellt sind. Diese Ableitungen werden nach dem Ableitungsverfahren gemäss der Erfindung mit Hilfe von vier Thorax-Elektroden E1 bis E4 und einer Masse-Elektrode, die vorzugsweise am rechten Arm befestigt ist, gewonnen. Von den aus diesem Tetraeder prinzipiell gewinnbaren sechs Ableitungen sind deren drei linear unabhängig, und es werden in diesem Beispiel fünf verwendet ; die nicht näher bezeichnete Ableitung zwischen den Punkten E2 und E3 wird als zur nicht interessierenden Projektionsebene gehörend nicht benützt bzw. als redundante Paarung weggelassen. Die benützten fünf Ableitungen sind mit H für Horizontal, D für Dorsal, V für Vertikal, I für Inferior und A für Anterior bezeichnet. Die elektrischen Signale dieser fünf gewonnen Ableitungen werden von der Ableitungsstufe 10 in die Koordinatentransformationsstufe 20 geführt, in der die gesuchten Projektionen in ein orthogonales System vorgenommen werden. Dies wird durch ein vorzugsweise analoges Netzwerk 22 durchgeführt, wobei auch direkt drei linear unabhängige Ableitungen in einer digitalisierenden Koordinatentransformationsstufe 20 verarbeitet werden können. Die nun gewonnen Projektionen x, y, z gelangen von der Koordinatentransformationsstufe 20 in eine Abtaststufe 30, wo sie von einer Abtastschaltung 32 (Sample-and-Hold-Schaltung) abgetastet werden. Zur Abtaststufe 30 gehört auch eine Multiplexschaltung 34 zur Parallel-in-Serie-Umsetzung der gewonnen Projektionen.Figures 7A and 7B show a simplified representation of the device for performing the method. In Figure 7A, the acquisition of information from the 'meschlichen body to apparative to digitization in four
Von der Abtaststufe 30 gelangen die nun seriell anfallenden Daten der Einzelprojektionen in eine Digitalisierstufe 40, die in vereinfachter Darstellung durch einen Analog-Digitalumsetzer 42 dargestellt ist. Die x-, u- und z-Projektionen werden in dieser Stufe beispielsweise mit 8-Bit-Auflösungen digitalisiert ; diese Auflösung hat sich für die üblichen praktischen Zwecke als genügend gut erwiesen, doch könnten zur verfeinerten Darstellung der Messungen bzw. zum Aufsuchen noch unbekannter Effekte innerhalb der elektrischen Signale auch eine 16-Bit- oder noch höhere Auflösung vorgesehen sein. Symbolisch sind die digitalisierten Projektionen mit (x, y, z)dig dargestellt.From the
Figur 7B zeigt nun in sehr vereinfachter Darstellung den Hauptteil 50 des Kardiogoniometers in welchem die digitalisierten Projektionen (X, y, z)dig in die entsprechenden aussagekräftigen Grössen umgesetzt werden. Gemäss dem vorher beschriebenen Beispiel sind dies der Winkel Phi, das ist der wahre Winkel im Raum zwischen den QRS- und T-Maximalvektoren, dann die auf das zugrundegelegte Koordinatensystem, das im Verfahren gemäss der Erfindung kein orthogonales ist - die Ableitungen sind nicht orthogonal, wohl aber die als Daten verwerteten, aus den Ableitungen errechneten Projektionen x, y, z -, bezogenen Werte aR, aT, ßR und ßT sowie das beispielsweise zwischen je zwei ORS-Flanken abgeleitete Schlagintervall des Herzens. Der Kardiogoniometerteil 50 ist dargestellt durch einen, die aktuellen Herzschlagdaten festhaltenden Speicher 52 mit wahlfreiem Zugriff, einen das Verarbeitungsprogramm enthaltenden Speicher 54, der für das Datenmanagement notwendige Mikroprozessor 56, der beispielsweise vom Motorola-Typ 6800 sein kann, wie er dies im beschriebenen Kardiogoniometer auch ist, sowie in symbolischer Darstellung ein Schaltnetzwerk 58, z. B. ein Bussystem zur Bereitstellung der interessierenden Daten aus einem nicht dargestellten Zwischenspeicher, welche natürlich auch seriell aus dem Kardiogoniometer herausgeführt werden können. Streng genommen fallen diese Daten erst nach dem Umsetzen in peripheren Geräten wie beispielsweise in einer Anzeigeeinheit, einem Drucker, einem Bildschirm an, doch soll diese sehr vereinfachte Darstellung eine überhaupt nicht ins Detail gehende Uebersicht bringen, wie es von den am Patienten angebrachten Elektroden durch Signal- sowie Datenverarbeitung zu den diagnostisch sehr aussagefähigen Resultaten kommt.FIG. 7B shows in a very simplified representation the
Figur 8 dient zur Veranschaulichung der zeitabhängigen Verfahrensschritte eines Herzschlagintervalls. Das typische Bild einer EKG-Kurve ist ausschnittsweise dargestellt, und zwar in der Zeitdauer von einem vollerfassten QRS-Komplex zu einem teilerfassten aRS+1-Komplex. Die steile OR-Flanke eigent sich erfahrungsgemäss besonders gut zur Triggerung von Funktionsabläufen. Mit der QR-Triggerung an einer Schwelle 1 beginnt die Messung des Schlagintervalls r sowie die Aufteilung von T = (QRS bis QRS+1)t in diverse Zeitfenster tons; tp; tT; tov; tQT, d. h. in einzeln abzuspeichernde Intervalle, wobei die Zeitdauer tov eine zentrale Rolle spielt; an dieser Stelle wird die Basislinie des Kurvenzuges gemessen, dann gemittelt und mit dem elektrischen Neutralpunkt Null-Volt (OV) verglichen. Diese Basislinienspannung BS dient als Korrekturwert für sämtliche amplitudenabhängigen Grössen wie beispielsweise die eingezeichnete QRS-Magnitude MQRS ; sie stellt eigentlich die biologische Null-Linie dar.FIG. 8 serves to illustrate the time-dependent process steps of a heartbeat interval. The typical image of an ECG curve is shown in sections, namely in the time period from a fully recorded QRS complex to a partially recorded aRS +1 complex. Experience shows that the steep OR flank is particularly suitable for triggering functional processes. With QR triggering on a
Figur 9 zeigt nunmehr detailliert die Kardiogoniometereinrichtung. Die elektrischen Messwerte der fünf Ableitungen D, A, I, V, H, gelangen über einzelne Eingangsverstärker 24 auf ein Analogrechennetzwerk 25, das im wesentlichen die Schaltung zur Koordinatentransformation 22 darstellt, in welchem Rechennetzwerk die Projektionen x, y, z gemäss der angegebenen Formeln ermittelt und die Signale der Projektionsgrössen bereitgestellt werden. Diese Signale werden anschliessend in Ausgangsverstärkern 26 deswegen verstärkt, dass sie in einem parallel laufenden Kardiographen bzw. dessen Schreiber mitgeschrieben werden können. Dafür ist eine Sammelleitung 29 vorgesehen.Figure 9 now shows the cardiogoniometer device in detail. The electrical measured values of the five derivatives D, A, I, V, H, pass through
Die x-, y-, z-Signale werden über jeweilige Verstärker 31 den Sample-and-Hold-Schaltungen 32 zugeführt, deren Sample-Zeiten über die Leitung 35 von einem Steuerungsprogramm via die Steuerungsschaltung 53 bestimmt werden. Synchron dazu muss der Multiplexer 34 zum Abtasten der anstehenden Signale gesteuert werden, was über die Leitung 36 durch das gleiche Steuerungsnetzwerk 53 geschieht. Dieser beschriebene Schaltungsteil umfasst die Analogsignal-Verarbeitung, wobei die anfallenden Analogsignale im Analog-/Digitalwandler 42 zu digitalen Daten umgesetzt werden. In der angegebenen Ausführungsform wurde, wie schon erwähnt, eine 8-Bit-Auflösung gewählt, die jedoch ohne grossen Zusatzaufwand auf 16-Bit erweitert werden kann. Die digitale Datenverarbeitung umfasst dann eine Eingangsschaltung 51, einen Datenspeicher 52 und einen Steuerprogrammspeicher 54 sowie einen dazugehörigen Mikroprozessor 56. Für die Datenspeicherung wird ein Speicher mit wahlfreiem Zugriff verwendet, für die Speicherung des Steuerprogramms verwendet man vorzugsweise einen Speicher vom EPROM-Typ. Die gespeicherten Daten beziehen sich, wie in Figur 7B dargestellt, auf die digitalisierten Herzrhythmuskurven gemäss Figur 8, während das Steuerprogramm in prinzipieller Darstellung im Struktogramm des Verfarhens in Figur 11 dargestellt ist.The x, y, z signals are fed via
Vor der Beschreibung des Struktogramms soll noch auf eine detailliertere Darstellung des Analog/ Digitaladaptermoduls verwiesen werden. Dieses Netzwerk ist in Figur 10 dargestellt und umfasst die Bausteine der x-, y-, z-Eingangsverstärker 31, deren Ausgänge mit den jeweiligen Sample-and-Hold-Schaltungen 32 verbunden sind, die wiederum von der Eingangsschaltung 51 zum Mikrocomputer über das hier nicht dargestellte Steuerungsnetzwerk 53 und die Zuleitung 35 synchronisiert sind. Der Multiplexer empfängt neben den drei x-, y-, z-Datensignalen, hier noch in analoger Form, Kanalwählbefehle 0,1 sowie einen Multiplexer-Auslösebefehl 0,1 durch die digitale Eingangsschaltung 51, ebenso werden die Eingangsverstärker 31 sowie eine Zwischenverstärker 38 aus der gleichen Schaltung bezüglich der Verstärkung angesteuert. Die zu digitalisierenden Herzrhythmussignale aus dem Multiplexer 34 werden, wie schon erwähnt, im Verstärker 38 zwischenverstärkt und auf den Analog-/Digitalwandler 42 gebracht. Der Analog-/Digitalwandler steht mit der Eingangsschaltung 51 nebst dem Datenbus zusätzlich noch über eine Leitung für die Statusangabe in Verbindung ; die Eingangsschaltung 51 startet den Analog-/Digitalwandler mittels eines Convertsignals über eine andere Leitung. Die Eingangsschaltung 51 ist mit dem Mikrocomputer wie üblich über drei Bussysteme verbunden, dem Datenbus, dem Adressenbus und dem Kontrollbus.Before describing the structure diagram, reference should be made to a more detailed representation of the analog / digital adapter module. This network is shown in FIG. 10 and comprises the components of the x, y,
Figur 11 zeigt schliesslich ein Jackson-Struktogramm des Verfahrens in starker Vereinfachung. Struktogramme nach M. Jackson werden von oben nach unten und von links nach rechts gelesen. Folgt man diesem Struktogramm, so sieht man links in der Figur in einem ersten Schritt eine Lemphase, das ist die Adaptation des Gerätes an den Patienten, woraus dann Parameter für die Verstärkung, Abtastintervalle und Schlagintervalle resultieren. Dazu werden drei bis sechs Zyklen gemäss Figur 8 aufgewendet.FIG. 11 finally shows a Jackson structure diagram of the method in a greatly simplified form. M. Jackson's structograms are read from top to bottom and left to right. If you follow this structogram, you can see a lem phase in the first step of the figure on the left, which is the adaptation of the device to the patient, which then results in parameters for the amplification, sampling intervals and stroke intervals. Three to six cycles according to FIG. 8 are used for this.
Aus dem Schlagintervall erhält man die Zeitmessung zwischen zwei Herzschlägen sowie die jeweils patientenspezifische Adaptation der verschiedenen, in Figur 8 dargestellten Zeitfenster. Anschliessend erfolgt eine Datenerfassung, aus welcher die Triggerpunkte, das Erfassen des Herzschlages, und die Offsetkorrektur primär resultieren. Die Herzschlagsignale werden kontinuierlich abgetastet, beispielsweise in 3ms Abständen. Die Messwerte einer Herzschlagperiode werden erst nach Detektion des Triggerpunktes abgespeichert und ausgewertet. Dieser Triggerpunkt wird bestimmt durch das Ueberschreiten einer vorgegebenen Steilheit der QR-Flanke. Triggerpunktsuche und Herzschlagerfassen werden nun und später ständig wiederholt, was in Form eines kleinen Sterns oben rechts im Funktionsblock angegeben ist. Bei der Datenumsetzungsgeschwindigkeit der besprochenen Ausführungsform lässt sich leicht jeder dritte Herzschlag erfassen. Mit dem nötigen Zusatzaufwand kann auch jeder Herzschlag erfasst werden. Die Verarbeitung der Signale bezieht sich in der vorläufigen Entwicklungsstufe auf das Berechnen der Maximalvektoren R und T, Berechnen der Grössen Phi, aR, aT, βR, βT, usw. sowie auf die Datenkonversion und -aufbereitung. Schliesslich gelangen die errechneten grössen zur Beurteilung in sogenannte Online-Anzeigen, d. h. Messwertanzeigen zur Diagnose während der Messung am Patienten, gerne Bedside-Methode genannt. Darunter fallen die Messdatenausgabe auf einer Digitalanzeige, die Ausgabe derselben und weiterer Daten auf einen Drucker zur Registrierung und für Archivzwecke sowie die Ausgabe auf einen Bildschirm zur Verfolgung einer grafischen Darstellung. Dann werden in sogenannten Offline-Auswertungen, also weg vom Patienten, gespeicherte Signale aus dem Speicher 52 für weitere Datenverarbeitung bereitgestellt beispielsweise Statistiken, usw., die auf Massenspeicher übertragen mit entsprechend aufwendigen Programmen in grösseren Computern weiter ausgewertet werden können.The time interval between two heartbeats and the respective patient-specific adaptation of the different time windows shown in FIG. 8 are obtained from the beat interval. This is followed by data acquisition, from which the trigger points, the detection of the heartbeat and the offset correction primarily result. The heartbeat signals are continuously sampled, for example at 3 ms intervals. The measured values of a heartbeat period are only saved and evaluated after detection of the trigger point. This trigger point is determined by exceeding a predetermined slope of the QR flank. Trigger point search and heartbeat detection are repeated now and later, which is indicated in the form of a small star in the top right of the function block. With the data conversion speed of the discussed embodiment, every third heartbeat can be easily detected. With the necessary additional effort, every heartbeat can also be recorded. In the preliminary development stage, the processing of the signals relates to the calculation of the maximum vectors R and T, the calculation of the quantities Phi, aR, aT, βR, βT, etc., as well as the data conversion and preparation. Finally, the calculated sizes are used for evaluation in so-called online advertisements. H. Measured value displays for diagnosis during measurement on the patient, often referred to as the bedside method. This includes the measurement data output on a digital display, the output of the same and further data on a printer for registration and for archiving purposes, as well as the output on a screen for tracking a graphic representation. Then, in so-called offline evaluations, that is to say away from the patient, stored signals from the
Mit Hilfe der Elektrokardiographie gemäss Stand der Technik ist es, da sie nur Messungen in einer Ebene tätigt, nicht möglich, die elektrischen Vorgänge des Herzens am gleichen Herzschlag ganz zu erfassen. Dies ist nur mit einem dreidimensionalen Ableitungssystem möglich, eben der Vektorkärdiographie. Die Kardiogoniometrie als erste Stufe einer Bedside-Vektorkardiographie verwendet nun ein neues, technisch so einfaches, dreidimensionales Ableitungssystem, dass damit die dreidimensionale Erfassung der elektrischen Vorgänge am Krankenbett in Serie möglich wird. Sie erfasst vorerst einzig die Maximalvektoren der QRS-Schlinge und der T-Schlinge. Der Informationsgehalt dieser beiden Messgrössen ist aber schon sehr gross.With the aid of electrocardiography according to the prior art, since it only takes measurements in one plane, it is not possible to fully grasp the electrical processes of the heart on the same heartbeat. This is only possible with a three-dimensional derivation system, namely vector cardiography. Cardiogoniometry, the first stage of bedside vector cardiography, now uses a new, three-dimensional lead system that is so technically simple that it enables the three-dimensional recording of electrical processes at the bedside in series. For the time being, it only records the maximum vectors of the QRS loop and the T loop. However, the information content of these two parameters is very high.
Bis heute war es auch nicht möglich, komplexere Auswertungen von gemessenen Werten gleich am Krankenbett zu erhalten. Ueblich ist, wie dies beispielsweise in der US-PS-4.106.495 von Harold Kennedy 1977 vorgeschlagen ist, Messdaten am Körper zu sammeln und aufzuzeichnen, um sie anschliessend mit mehr oder weniger Zeitabstand auf einem Rechensystem auszuwerten. Nicht selten war ein Patient schon tot, bevor seine Daten zur Auswertung an die Reihe kamen. Die praktisch unmittelbare Erfassung, Verwertung und Darstellung der komplexen Zusammenhänge innerhalb eines oder nur weniger Herzschläge entspricht einem Bedürfnis. Die Online-Auswertung ermöglicht sozusagen in Echtzeit, bei Medikamentenanwendung auf dem Ergometer und bei Manipulationen aller Art die Reaktion des Herzens zu beobachten, beispielsweise auf dem Bildschirm.To date, it has not been possible to obtain more complex evaluations of measured values right at the bedside. It is customary, as is proposed, for example, in US Pat. No. 4,106,495 by Harold Kennedy 1977, to collect and record measurement data on the body in order to then evaluate it on a computer system with a more or less time interval. It was not uncommon for a patient to be dead before it was time for his data to be evaluated. The practically immediate recording, utilization and representation of the complex relationships within one or only a few heartbeats corresponds to a need. The online evaluation makes it possible to observe the heart's reaction in real time, for example when using medication on the ergometer and with manipulations of all kinds, for example on the screen.
Der QRS-Vektor entspricht der sogenannten elektrischen Herzachse. Ihre Lage im Raum wird heute qualitativ mit den Begriffen Querlage, Steillage, Horizontallage, überdrehter Linkstyp, usw. charakterisiert. Statt dieser qualitativen Bezeichnungen liefert die Kardiogoniometrie (KGM) eine eindeutig im Raum definierte Richtung. Schon kleine Veränderungen dieser Richtung lassen sich somit im Laufe der Zeit nachweisen, z. B. zu- oder Abnahmen von Herzdilatationen, Zu- oder Abnahmen von Herzhypertrophien, Entwicklung eines linksanterioren, faszikulären Blockes, usw. ; dies alles, bevor im Standard-Elektrokardiogramm, also bei Messungen gemäss dem Stand der Technik, irgendeine wesentliche Aenderung zu bemerken ist. Veränderungen der QRS-Vektors im Akutversuch, wie beispielsweise Lagewechsel des QRS-Vektors in Linksseitenlage oder nach Belastung oder nach Verabreichung von Medikamenten wie z. B. Nitroglyzerin, lassen lokale, kleine Zirkulationsstörungen in den Septalästen der Koronararterien nachweisen.The QRS vector corresponds to the so-called electrical heart axis. Their position in space is characterized qualitatively today with the terms transverse position, steep position, horizontal position, over-rotated link type, etc. Instead of these qualitative names, cardiogoniometry (KGM) provides a direction that is clearly defined in space. Even small changes in this direction can be demonstrated over time, e.g. B. increases or decreases in cardiac dilatation, increases or decreases in cardiac hypertrophies, development of a left anterior, fascicular block, etc.; all of this before any significant change is noticed in the standard electrocardiogram, that is to say in measurements according to the prior art. Changes in the QRS vector in the acute experiment, such as changing the position of the QRS vector in the left side position or after exercise or after administration of medications such as. B. nitroglycerin, local, small circulation disorders in the septal branches of the coronary arteries are detected.
Lageveränderungen des T-Vektors erlauben einen Einblick in die Verhältnisse der Repolarisation des Herzens, d. h. geben Hinweise auf Stoffwechselstörungen oder Durchblutungsstörungen im Myokard. Besteht eine Ischämie der Hinterwand (RCA), findet sich der R-Vektor nicht mehr im Normbezirk, sondern weiter vorne, umgekehrt aber bei einer Ischämie der Vorderwand (LCA) findet er sich ausserhalb der Normgrenze mehr hinten. Natürlich zeigen sich diese Veränderungen auch bei lokalisierten Stoffwechseltstörungen der Hinter- bzw. Vorderwand. Ist das Myokard in Ruhe noch genügend durchblutet, so ist der T-Vektor möglicherweise noch nicht aus der Normgrenze abgewichen. Hier kann die relative Ischämie, also eine latente Koronarinsuffizienz manifest gemacht werden, durch Verminderung des Koronardurchflusses, z. B. nach Gabe von Nitroglyzerin - Nitroglyzerin führt einerseits zu einer Senkung des preload und des Schlagvolumens, damit auch zu einer Blutdrucksenkung, andererseits zu einer Herzschlagfrequenzzunahme. Beide Effekte führen zu einer Verminderung des Koronardurchflusses, welcher sich besonders in bereits leicht stenosierten Koronarien auswirkt. Damit kommt es zu einem Abwandern des T-Vektors von der ischämischen Myokardstelle weq. Dieser Effekt ist so eindeutig, dass bei Koronarkranken auf die Ergometrie verzichtet werden kann.Changes in the position of the T vector allow an insight into the conditions of the repolarization of the heart, ie give indications of metabolic disorders or circulatory disorders in the myocardium. If there is an ischemia of the posterior wall (RCA), the R-vector is no longer located in the normal district, but further ahead, but conversely, in the case of ischemia of the anterior wall (LCA), it is located more behind the normal limit. Of course, these changes are also evident in localized metabolic disorders of the rear or front wall. If the myocardium is still sufficiently supplied with blood at rest, the T-vector may not yet have deviated from the normal limit. Here the relative ischemia, i.e. latent coronary insufficiency, can be manifested by reducing the coronary flow, e.g. B. after administration of nitroglycerin - nitroglycerin leads on the one hand to a lowering of the preload and the stroke volume, thus also to a reduction in blood pressure, on the other hand to an increase in heart rate. Both effects lead to a reduction in the coronary flow, which is particularly effective in already slightly stenosed coronaries. This causes the T vector to migrate from the ischemic myocardial site weq. This effect is so clear that ergometry is not necessary for coronary patients.
Ist eine Koronarstenose nicht vollständig (Verschluss), kann es zu einem Wandern des T-Vektors in einem mehr oder weniger begrenzten Gebiet kommen. Diesen schon vorher erwähnten und mit Floating bezeichneten Effekt findet man die kardiogoniometrischen Serien messungen gemäss Erfindung. Dieser Effekt ist äusserst sensibel und kann, z. B. auch nach kurzen Herzstillständen, z. B. nach karotis-Sinusdruck, demonstriert werden.If a coronary stenosis is incomplete (occlusion), the T vector can migrate in a more or less limited area. This previously mentioned and designated floating effect is found in the cardiogoniometric series measurements according to the invention. This effect is extremely sensitive and can e.g. B. even after short cardiac arrests, e.g. B. after carotid sinus pressure, demonstrated.
Da diese beiden Vektoren sehr sensibel auf jegliche Zirkulationsstörungen im Herzen reagieren, dürfte die Kardiogoniometrie auch zur Ueberwachung von Herzpatienten in den Ueberwachungsstationen und bei Patienten nach Myokardinfrakten oder Herzoperationen gute Dienste leisten.Since these two vectors react very sensitively to any circulatory disturbances in the heart, cardiogoniometry should also serve well for monitoring cardiac patients in the monitoring stations and for patients after myocardial infarctions or cardiac operations.
Die Kardiogoniometrie als nichtinvasive, völlig nebenwirkungsfreie Ontersuchungsmethode eignet sich ebenfalls zur regelmässigen, alljährlichen Herzkontrolle zur frühzeitigen Erfassung latenter Koronarinsuffizienzen bei Myokardinfarkt-gefährdeten Patienten, wie es beispielsweise Raucher, Diabetiker, Manager und Hypercholesterinämiker sind. Da die Methode sehr empfindlich auf Durchblutungsstörungen der Koronararterien unmittelbar reagiert, dürfte sie sich auch zur Ueberprüfung von herzaktiven Medikamenten eignen.Cardiogoniometry as a non-invasive, completely side effect-free examination method is also suitable for regular, annual heart monitoring for early detection of latent coronary insufficiency in patients at risk of myocardial infarction, such as smokers, diabetics, managers and hypercholesterolemics. Since the method is very sensitive to coronary artery circulatory disorders, it should also be suitable for checking cardiac drugs.
Da im Kardiogoniometer nicht bloss die Maximalvektoren, sondern beide Vektorschlingen in toto gespeichert sind, können, wie schon erwähnt, in Offline-Verfahren weitere Grössen gewonnen werden ; beispielsweise beliebige Zeitintervalle wie tORmax und QR oder tQTmax und QT, die Darstellung eines Vektors X zur zeit tX, beispielsweise Initialvektoren ; dann ist auch die Visionalisierung auf einem Bildschirm, und zwar nicht bloss der Maximalvektoren, sondern auch der ganzen Schleife von QRS und T, einzeln oder in Serie zur Sichtbarmachung, beispielsweise eines allfälligen Floatings, möglich. Es ist der eigentliche Weg zu einer wirklich genauen und völlig computerisierten Herzdiagnostik, wobei die Ausführungsform des vorgestellten, beschriebenen Kardiogoniometers der handlichen Grösse wegen ausserordentlich praktisch im Ambulanten Betrieb eingesetzt werden kann.Since not only the maximum vectors, but both vector loops are stored in toto in the cardiogoniometer, as already mentioned, further sizes can be obtained in offline processes; for example any time intervals such as tOR max and QR or tQT max and QT, the representation of a vector X at time t X, for example initial vectors; Then it is also possible to visualize on a screen, not just the maximum vectors, but also the entire loop of QRS and T, individually or in series for visualization, for example of a possible floating. It is the actual way to a really precise and completely computerized cardiac diagnosis, whereby the embodiment of the cardiogoniometer described, because of its handy size, can be used extremely practically in outpatient operation because of its handy size.
Claims (6)
Priority Applications (1)
| Application Number | Priority Date | Filing Date | Title |
|---|---|---|---|
| AT83101139T ATE45279T1 (en) | 1982-02-12 | 1983-02-07 | PROCEDURE FOR CARDIOGONIOMETRY AND CARDIOGONIOMETER TO THIS. |
Applications Claiming Priority (2)
| Application Number | Priority Date | Filing Date | Title |
|---|---|---|---|
| CH89882 | 1982-02-12 | ||
| CH898/82 | 1982-02-12 |
Publications (3)
| Publication Number | Publication Date |
|---|---|
| EP0086429A2 EP0086429A2 (en) | 1983-08-24 |
| EP0086429A3 EP0086429A3 (en) | 1984-10-17 |
| EP0086429B1 true EP0086429B1 (en) | 1989-08-09 |
Family
ID=4197748
Family Applications (1)
| Application Number | Title | Priority Date | Filing Date |
|---|---|---|---|
| EP83101139A Expired EP0086429B1 (en) | 1982-02-12 | 1983-02-07 | Cardiogoniometric process and cardiogoniometer therefore |
Country Status (9)
| Country | Link |
|---|---|
| US (2) | US4569357A (en) |
| EP (1) | EP0086429B1 (en) |
| JP (1) | JPS58212431A (en) |
| AT (1) | ATE45279T1 (en) |
| AU (1) | AU570402B2 (en) |
| CA (1) | CA1228647A (en) |
| DE (1) | DE3380343D1 (en) |
| IL (1) | IL67815A (en) |
| ZA (1) | ZA83791B (en) |
Cited By (2)
| Publication number | Priority date | Publication date | Assignee | Title |
|---|---|---|---|---|
| WO2023036447A1 (en) | 2021-09-13 | 2023-03-16 | Mycor Gmbh | Method and device for determining excitation potentials of the human heart |
| EP4239648A2 (en) | 2018-09-10 | 2023-09-06 | Cardisio GmbH | Method for cardiac monitoring |
Families Citing this family (51)
| Publication number | Priority date | Publication date | Assignee | Title |
|---|---|---|---|---|
| EP0150352B1 (en) * | 1984-01-25 | 1988-06-29 | WILLI STUDER AG Fabrik für elektronische Apparate | Method of determining the beginning and the end of a physiological signal displayed as a closed loop |
| KR940002772B1 (en) * | 1984-08-31 | 1994-04-02 | 가부시기가이샤 히다찌세이사꾸쇼 | Semiconductor integrated circuit and its manufacturing method |
| DE3536658A1 (en) * | 1985-10-15 | 1987-04-16 | Kessler Manfred | METHOD FOR REPRESENTING ELECTROCARDIOGRAPHIC VALUES |
| EP0278215A1 (en) * | 1987-01-22 | 1988-08-17 | Studer Revox Ag | Method and device for processing signals from a physiologically generated electric field |
| CN1009330B (en) * | 1987-03-30 | 1990-08-29 | 创建基立有限公司 | A kind of computer electrical signal detection blood processor |
| US4850370A (en) * | 1987-07-22 | 1989-07-25 | Dower Gordon E | Method and apparatus for sensing and analyzing electrical activity of the human heart |
| US5010889A (en) * | 1988-02-04 | 1991-04-30 | Bloodline Technology | Intelligent stethoscope |
| US5218969A (en) * | 1988-02-04 | 1993-06-15 | Blood Line Technology, Inc. | Intelligent stethoscope |
| US4961428A (en) * | 1988-05-02 | 1990-10-09 | Northeastern University | Non-invasive method and apparatus for describing the electrical activity of the surface of an interior organ |
| US4949725A (en) * | 1988-07-01 | 1990-08-21 | Bio-Logic Systems Corporation | Apparatus and method for displaying electrical activity generated within a living body |
| US4934374A (en) * | 1988-12-29 | 1990-06-19 | Trustees Of The University Of Pennsylvania | Method of analyzing cardiac data using correlation plots |
| US4947857A (en) * | 1989-02-01 | 1990-08-14 | Corazonix Corporation | Method and apparatus for analyzing and interpreting electrocardiograms using spectro-temporal mapping |
| US5046504A (en) * | 1989-02-01 | 1991-09-10 | Corazonix Corporation | Method and apparatus for analyzing and interpreting electrocardiograms using spectro-temporal mapping |
| US5012815A (en) * | 1989-02-02 | 1991-05-07 | Yale University | Dynamic spectral phonocardiograph |
| EP0443120A1 (en) * | 1990-01-22 | 1991-08-28 | Studer Revox Ag | Method of determining measurements from a human or animal body |
| US5058598A (en) * | 1990-08-03 | 1991-10-22 | Nicklas John M | Method and apparatus for synthesizing leads of an electrocardiogram |
| US5127401A (en) * | 1990-11-09 | 1992-07-07 | Medtronic, Inc. | Method of and apparatus for multi-vector pacing artifact detection |
| US5231990A (en) * | 1992-07-09 | 1993-08-03 | Spacelabs, Medical, Inc. | Application specific integrated circuit for physiological monitoring |
| US5803084A (en) * | 1996-12-05 | 1998-09-08 | Olson; Charles | Three dimensional vector cardiographic display and method for displaying same |
| US20020029001A1 (en) * | 1997-03-12 | 2002-03-07 | Anderson John Mccune | Apparatus for body surface mapping |
| US5987348A (en) * | 1997-07-23 | 1999-11-16 | Philips Electronics North America Corporation | ECG triggered MR imaging method and apparatus |
| US6278890B1 (en) | 1998-11-09 | 2001-08-21 | Medacoustics, Inc. | Non-invasive turbulent blood flow imaging system |
| US6193668B1 (en) | 1997-11-10 | 2001-02-27 | Medacoustics, Inc. | Acoustic sensor array for non-invasive detection of coronary artery disease |
| US6052615A (en) * | 1998-08-17 | 2000-04-18 | Zymed Medical Instrumentation, Inc. | Method and apparatus for sensing and analyzing electrical activity of the human heart using a four electrode arrangement |
| US6358214B1 (en) * | 1998-08-19 | 2002-03-19 | Misha Tereschouk | ECG scanner |
| US6261237B1 (en) | 1998-08-20 | 2001-07-17 | Medacoustics, Inc. | Thin film piezoelectric polymer sensor |
| AU2004201785B2 (en) * | 1999-03-01 | 2007-10-25 | Harris Corporation | Low Profile Acoustic sensor array and sensors with pleated transmission lines and related methods |
| US7037268B1 (en) | 1999-03-01 | 2006-05-02 | Medacoustics, Inc. | Low profile acoustic sensor arry and sensors with pleated transmission lines and related methods |
| US6438409B1 (en) * | 1999-03-25 | 2002-08-20 | Medtronic, Inc. | Methods of characterizing ventricular operations and applications thereof |
| US6804550B1 (en) * | 1999-09-29 | 2004-10-12 | Draeger Medical Systems, Inc. | Method and apparatus for frank lead reconstruction from derived chest leads |
| US6496720B1 (en) | 2000-01-28 | 2002-12-17 | Koninklijke Philips Electronics N.V. | Process for sensing and analyzing electrical activity of the human heart utilizing one lead system with an egg monitor designed for use with another lead system |
| AU4599801A (en) * | 2000-03-22 | 2001-10-03 | Bosko Bojovic | Method and system for ecg recording via telephone |
| US6505067B1 (en) * | 2000-11-22 | 2003-01-07 | Medtronic, Inc. | System and method for deriving a virtual ECG or EGM signal |
| US6754523B2 (en) * | 2000-11-28 | 2004-06-22 | J. Gerald Toole | Method of analysis of the electrocardiogram |
| US6584352B2 (en) | 2000-12-27 | 2003-06-24 | Medtronic, Inc. | Leadless fully automatic pacemaker follow-up |
| US6766190B2 (en) | 2001-10-31 | 2004-07-20 | Medtronic, Inc. | Method and apparatus for developing a vectorcardiograph in an implantable medical device |
| US6760615B2 (en) | 2001-10-31 | 2004-07-06 | Medtronic, Inc. | Method and apparatus for discriminating between tachyarrhythmias |
| WO2003057031A1 (en) | 2002-01-07 | 2003-07-17 | Ernst Sanz | Method for creating cardiometric parameters, which can be used, in particular, for diagnostic purposes |
| US6884218B2 (en) * | 2002-12-09 | 2005-04-26 | Charles W. Olson | Three dimensional vector cardiograph and method for detecting and monitoring ischemic events |
| US7107093B2 (en) * | 2003-04-29 | 2006-09-12 | Medtronic, Inc. | Use of activation and recovery times and dispersions to monitor heart failure status and arrhythmia risk |
| GB0317947D0 (en) | 2003-07-31 | 2003-09-03 | Mar Reynolds Medical Del Ltd | Reduced electrode electrocardiography system |
| US7141987B2 (en) * | 2003-10-07 | 2006-11-28 | Quantum Applied Science And Research, Inc. | Sensor system for measurement of one or more vector components of an electric field |
| US8412314B2 (en) * | 2005-04-25 | 2013-04-02 | Charles Olson | Location and displaying an ischemic region for ECG diagnostics |
| US7751874B2 (en) | 2005-04-25 | 2010-07-06 | Charles Olson | Display for ECG diagnostics |
| US7542795B2 (en) * | 2005-08-01 | 2009-06-02 | The General Electric Company | Vector superimposition and graphical display of physiological data without or before analysis |
| US8363048B2 (en) * | 2006-11-16 | 2013-01-29 | General Electric Company | Methods and apparatus for visualizing data |
| US8725255B2 (en) * | 2006-11-17 | 2014-05-13 | Cardiac Pacemakers, Inc. | Cardiac resynchronization therapy optimization using cardiac activation sequence information |
| KR101247049B1 (en) * | 2011-08-03 | 2013-04-01 | 엘지전자 주식회사 | Dish washer and air break thereof |
| US9895079B2 (en) * | 2012-09-26 | 2018-02-20 | Biosense Webster (Israel) Ltd. | Electropotential mapping |
| WO2015130596A1 (en) * | 2014-02-27 | 2015-09-03 | Zoll Medical Corporation | Vcg vector loop bifurcation |
| US11523766B2 (en) | 2020-06-25 | 2022-12-13 | Spacelabs Healthcare L.L.C. | Systems and methods of analyzing and displaying ambulatory ECG data |
Family Cites Families (17)
| Publication number | Priority date | Publication date | Assignee | Title |
|---|---|---|---|---|
| CH274612A (en) * | 1949-06-13 | 1951-04-15 | Felix Dr Schennetten | Electrode arrangement on electrocardiographs. |
| FR1237702A (en) * | 1953-07-11 | 1960-08-05 | Improvements to electro-medical devices | |
| US3186403A (en) * | 1962-11-13 | 1965-06-01 | Itt | Perspective vectorcardioscope |
| US3534727A (en) * | 1967-03-24 | 1970-10-20 | Nasa | Biomedical electrode arrangement |
| DE1933185A1 (en) * | 1968-07-11 | 1970-03-12 | Mueszeripari Ki | Process for the direct determination of the size and direction of spatial heart vectors and facility for carrying out the process |
| US3884221A (en) * | 1969-06-10 | 1975-05-20 | George Eastman | Method for the construction and diagnosis of three dimensional ectocariagrams |
| US3822696A (en) * | 1971-09-29 | 1974-07-09 | Battelle Development Corp | Electrocardiography st analyzer and method |
| US3991747A (en) * | 1972-06-23 | 1976-11-16 | Albert L. Stanly | Portable cardiac monitoring system and method |
| DE2348241A1 (en) * | 1972-09-25 | 1974-04-04 | Freyer Richard | DEVICE FOR EXAMINING THE ELECTRICAL ACTIVITY OF THE HUMAN HEART |
| US4085407A (en) * | 1976-04-28 | 1978-04-18 | Health Technology Laboratories, Inc. | Data plotter |
| US4106495A (en) * | 1977-04-11 | 1978-08-15 | Del Mar Avionics | Vectorcardiographic method for ambulatory patients |
| FR2393370B1 (en) * | 1977-05-31 | 1980-09-19 | Inst Nat Sante Rech Med | APPARATUS FOR ACQUIRING AND PRETREATING ELECTROCARDIOGRAPHIC OR VECTOCARDIOGRAPHIC DATA |
| CH632403A5 (en) * | 1977-09-08 | 1982-10-15 | Avl Ag | METHOD AND DEVICE FOR DETERMINING SYSTOLIC TIME INTERVALS. |
| US4136690A (en) * | 1977-10-31 | 1979-01-30 | Del Mar Avionics | Method and apparatus for vector analysis of ECG arrhythmias |
| DE2819999C2 (en) * | 1978-05-08 | 1980-03-27 | Dr.-Ing. J.F. Toennies Erben Kg, 7800 Freiburg | Method and arrangement for the representation of electrical space curves and space images |
| DE2908424C2 (en) * | 1978-05-08 | 1980-12-18 | Dr.-Ing. J.F. Toennies Erben Kg, 7800 Freiburg | Method and arrangement for the representation of electrical space curves |
| JPS5558154A (en) * | 1978-10-24 | 1980-04-30 | Toshimitsu Mushiya | Electronic diagnosis device |
-
1983
- 1983-02-01 IL IL67815A patent/IL67815A/en unknown
- 1983-02-02 AU AU10927/83A patent/AU570402B2/en not_active Ceased
- 1983-02-07 EP EP83101139A patent/EP0086429B1/en not_active Expired
- 1983-02-07 AT AT83101139T patent/ATE45279T1/en active
- 1983-02-07 ZA ZA83791A patent/ZA83791B/en unknown
- 1983-02-07 DE DE8383101139T patent/DE3380343D1/en not_active Expired
- 1983-02-07 US US06/464,765 patent/US4569357A/en not_active Expired - Fee Related
- 1983-02-11 CA CA000421431A patent/CA1228647A/en not_active Expired
- 1983-02-12 JP JP58020569A patent/JPS58212431A/en active Granted
-
1985
- 1985-12-04 US US06/804,454 patent/US4697597A/en not_active Expired - Fee Related
Cited By (3)
| Publication number | Priority date | Publication date | Assignee | Title |
|---|---|---|---|---|
| EP4239648A2 (en) | 2018-09-10 | 2023-09-06 | Cardisio GmbH | Method for cardiac monitoring |
| WO2023036447A1 (en) | 2021-09-13 | 2023-03-16 | Mycor Gmbh | Method and device for determining excitation potentials of the human heart |
| WO2023037006A1 (en) | 2021-09-13 | 2023-03-16 | Mycor Gmbh | Method and device for determining excitation potentials of the human heart |
Also Published As
| Publication number | Publication date |
|---|---|
| ZA83791B (en) | 1983-10-26 |
| EP0086429A2 (en) | 1983-08-24 |
| US4569357A (en) | 1986-02-11 |
| JPS58212431A (en) | 1983-12-10 |
| CA1228647A (en) | 1987-10-27 |
| US4697597A (en) | 1987-10-06 |
| EP0086429A3 (en) | 1984-10-17 |
| IL67815A0 (en) | 1983-06-15 |
| AU1092783A (en) | 1983-08-18 |
| AU570402B2 (en) | 1988-03-17 |
| IL67815A (en) | 1988-01-31 |
| JPH0347092B2 (en) | 1991-07-18 |
| ATE45279T1 (en) | 1989-08-15 |
| DE3380343D1 (en) | 1989-09-14 |
Similar Documents
| Publication | Publication Date | Title |
|---|---|---|
| EP0086429B1 (en) | Cardiogoniometric process and cardiogoniometer therefore | |
| EP0223049B1 (en) | Method and apparatus for displaying electrocardiographic data | |
| DE69729960T2 (en) | DEVICE FOR THE MAPPING OF BODY SURFACE POTENTIALS | |
| DE19808985B4 (en) | Method and device for biomagnetic field measurement | |
| DE4304269B4 (en) | Apparatus for non-invasive detection, digital recording and processing of cardiac electrical signals | |
| DE69533124T2 (en) | Device for analyzing and monitoring infarcts and myocardial ischemia | |
| DE60035733T2 (en) | Apparatus and method for the quantitative determination of the change in an electrocardiogram signal | |
| EP0000504B1 (en) | Circuit arrangement for the detection and recording of the activity of the uterus | |
| DE60125115T2 (en) | Method and device for characterizing heart tissue by means of local electrograms | |
| EP1047987B1 (en) | Method and device for representing and monitoring functional parameters of a physiological system | |
| DE60210086T2 (en) | REAL TIME HIGH FREQUENCY QRS ELECTROCARDIOGRAPH | |
| EP1904973B1 (en) | Method, device and computer programme for evaluating images of a cavity | |
| DE602004010917T2 (en) | DEVICE AND METHOD FOR CORDLESS RECORDING, TELECOMMUNICATIONS TRANSMISSION AND DATA PROCESSING WITH THREE SPECIAL ECG CABLES | |
| DE602005002326T2 (en) | Biomagnetic measuring device | |
| DE102007046259B4 (en) | Device with reduced electrode system and specific ECG interpretation | |
| DE60207127T2 (en) | Apparatus for measuring a plurality of electrical signals from the body of a patient | |
| DE10221642B4 (en) | Method and control device for controlling a tomographic image recording device | |
| DE60318804T2 (en) | Device for analyzing a signal, in particular a physiological signal, e.g. an ECG signal | |
| DE69531728T2 (en) | DEVICE FOR MEASURING AND EVALUATING THE ELECTRICAL STABILITY OF THE HEART | |
| DE102007017953A1 (en) | Multi-tier device for cardiac and patient monitoring data analysis | |
| EP1059875B1 (en) | Evaluation system for obtaining diagnostic information from the signals and data of medical sensor systems | |
| DE102007057885A1 (en) | Patient physiological data e.g. electrocardiogram signal data, analyzing method, involves comparing analysis of patient physiological data with analysis of model patient data ,and identifying morphology of patient physiological data | |
| EP0582885A2 (en) | Procedure to classify field patterns | |
| DE10065578A1 (en) | Method of identifying electrode placement | |
| DE69630638T2 (en) | Method and device for correcting non-physiological changes in EKG signals |
Legal Events
| Date | Code | Title | Description |
|---|---|---|---|
| PUAI | Public reference made under article 153(3) epc to a published international application that has entered the european phase |
Free format text: ORIGINAL CODE: 0009012 |
|
| PUAI | Public reference made under article 153(3) epc to a published international application that has entered the european phase |
Free format text: ORIGINAL CODE: 0009012 |
|
| AK | Designated contracting states |
Designated state(s): AT BE CH DE FR GB IT LI LU NL SE |
|
| PUAL | Search report despatched |
Free format text: ORIGINAL CODE: 0009013 |
|
| AK | Designated contracting states |
Designated state(s): AT BE CH DE FR GB IT LI LU NL SE |
|
| 17P | Request for examination filed |
Effective date: 19850319 |
|
| 17Q | First examination report despatched |
Effective date: 19860630 |
|
| R17C | First examination report despatched (corrected) |
Effective date: 19870210 |
|
| ITF | It: translation for a ep patent filed |
Owner name: DE DOMINICIS & MAYER S.R.L. |
|
| GRAA | (expected) grant |
Free format text: ORIGINAL CODE: 0009210 |
|
| AK | Designated contracting states |
Kind code of ref document: B1 Designated state(s): AT BE CH DE FR GB IT LI LU NL SE |
|
| REF | Corresponds to: |
Ref document number: 45279 Country of ref document: AT Date of ref document: 19890815 Kind code of ref document: T |
|
| REF | Corresponds to: |
Ref document number: 3380343 Country of ref document: DE Date of ref document: 19890914 |
|
| GBT | Gb: translation of ep patent filed (gb section 77(6)(a)/1977) | ||
| ET | Fr: translation filed | ||
| PLBE | No opposition filed within time limit |
Free format text: ORIGINAL CODE: 0009261 |
|
| STAA | Information on the status of an ep patent application or granted ep patent |
Free format text: STATUS: NO OPPOSITION FILED WITHIN TIME LIMIT |
|
| 26N | No opposition filed | ||
| ITTA | It: last paid annual fee | ||
| PGFP | Annual fee paid to national office [announced via postgrant information from national office to epo] |
Ref country code: GB Payment date: 19920113 Year of fee payment: 10 |
|
| PGFP | Annual fee paid to national office [announced via postgrant information from national office to epo] |
Ref country code: AT Payment date: 19920123 Year of fee payment: 10 |
|
| PGFP | Annual fee paid to national office [announced via postgrant information from national office to epo] |
Ref country code: LU Payment date: 19920130 Year of fee payment: 10 |
|
| PGFP | Annual fee paid to national office [announced via postgrant information from national office to epo] |
Ref country code: SE Payment date: 19920224 Year of fee payment: 10 |
|
| PGFP | Annual fee paid to national office [announced via postgrant information from national office to epo] |
Ref country code: DE Payment date: 19920226 Year of fee payment: 10 |
|
| PGFP | Annual fee paid to national office [announced via postgrant information from national office to epo] |
Ref country code: FR Payment date: 19920227 Year of fee payment: 10 |
|
| PGFP | Annual fee paid to national office [announced via postgrant information from national office to epo] |
Ref country code: NL Payment date: 19920229 Year of fee payment: 10 |
|
| PGFP | Annual fee paid to national office [announced via postgrant information from national office to epo] |
Ref country code: CH Payment date: 19920507 Year of fee payment: 10 |
|
| EPTA | Lu: last paid annual fee | ||
| PGFP | Annual fee paid to national office [announced via postgrant information from national office to epo] |
Ref country code: BE Payment date: 19930201 Year of fee payment: 11 |
|
| PG25 | Lapsed in a contracting state [announced via postgrant information from national office to epo] |
Ref country code: LU Free format text: LAPSE BECAUSE OF NON-PAYMENT OF DUE FEES Effective date: 19930207 Ref country code: GB Effective date: 19930207 Ref country code: AT Effective date: 19930207 |
|
| PG25 | Lapsed in a contracting state [announced via postgrant information from national office to epo] |
Ref country code: SE Effective date: 19930208 |
|
| PG25 | Lapsed in a contracting state [announced via postgrant information from national office to epo] |
Ref country code: LI Effective date: 19930228 Ref country code: CH Effective date: 19930228 |
|
| PG25 | Lapsed in a contracting state [announced via postgrant information from national office to epo] |
Ref country code: NL Effective date: 19930901 |
|
| GBPC | Gb: european patent ceased through non-payment of renewal fee |
Effective date: 19930207 |
|
| NLV4 | Nl: lapsed or anulled due to non-payment of the annual fee | ||
| PG25 | Lapsed in a contracting state [announced via postgrant information from national office to epo] |
Ref country code: FR Effective date: 19931029 |
|
| REG | Reference to a national code |
Ref country code: CH Ref legal event code: PL |
|
| PG25 | Lapsed in a contracting state [announced via postgrant information from national office to epo] |
Ref country code: DE Effective date: 19931103 |
|
| REG | Reference to a national code |
Ref country code: FR Ref legal event code: ST |
|
| PG25 | Lapsed in a contracting state [announced via postgrant information from national office to epo] |
Ref country code: BE Effective date: 19940228 |
|
| BERE | Be: lapsed |
Owner name: SANZ ERNST Effective date: 19940228 |
|
| EUG | Se: european patent has lapsed |
Ref document number: 83101139.0 Effective date: 19930912 |