CN116246755A - Fine anatomical structure quantitative analysis tool based on fine-grained network nano-level image - Google Patents
Fine anatomical structure quantitative analysis tool based on fine-grained network nano-level image Download PDFInfo
- Publication number
- CN116246755A CN116246755A CN202310041744.7A CN202310041744A CN116246755A CN 116246755 A CN116246755 A CN 116246755A CN 202310041744 A CN202310041744 A CN 202310041744A CN 116246755 A CN116246755 A CN 116246755A
- Authority
- CN
- China
- Prior art keywords
- fine
- image
- quantitative
- anatomical structure
- data
- Prior art date
- Legal status (The legal status is an assumption and is not a legal conclusion. Google has not performed a legal analysis and makes no representation as to the accuracy of the status listed.)
- Pending
Links
Images


Classifications
-
- G—PHYSICS
- G16—INFORMATION AND COMMUNICATION TECHNOLOGY [ICT] SPECIALLY ADAPTED FOR SPECIFIC APPLICATION FIELDS
- G16H—HEALTHCARE INFORMATICS, i.e. INFORMATION AND COMMUNICATION TECHNOLOGY [ICT] SPECIALLY ADAPTED FOR THE HANDLING OR PROCESSING OF MEDICAL OR HEALTHCARE DATA
- G16H30/00—ICT specially adapted for the handling or processing of medical images
-
- G—PHYSICS
- G06—COMPUTING; CALCULATING OR COUNTING
- G06F—ELECTRIC DIGITAL DATA PROCESSING
- G06F16/00—Information retrieval; Database structures therefor; File system structures therefor
- G06F16/50—Information retrieval; Database structures therefor; File system structures therefor of still image data
- G06F16/51—Indexing; Data structures therefor; Storage structures
-
- G—PHYSICS
- G06—COMPUTING; CALCULATING OR COUNTING
- G06F—ELECTRIC DIGITAL DATA PROCESSING
- G06F16/00—Information retrieval; Database structures therefor; File system structures therefor
- G06F16/50—Information retrieval; Database structures therefor; File system structures therefor of still image data
- G06F16/53—Querying
- G06F16/532—Query formulation, e.g. graphical querying
-
- G—PHYSICS
- G06—COMPUTING; CALCULATING OR COUNTING
- G06V—IMAGE OR VIDEO RECOGNITION OR UNDERSTANDING
- G06V10/00—Arrangements for image or video recognition or understanding
- G06V10/70—Arrangements for image or video recognition or understanding using pattern recognition or machine learning
- G06V10/77—Processing image or video features in feature spaces; using data integration or data reduction, e.g. principal component analysis [PCA] or independent component analysis [ICA] or self-organising maps [SOM]; Blind source separation
- G06V10/774—Generating sets of training patterns; Bootstrap methods, e.g. bagging or boosting
-
- G—PHYSICS
- G06—COMPUTING; CALCULATING OR COUNTING
- G06V—IMAGE OR VIDEO RECOGNITION OR UNDERSTANDING
- G06V10/00—Arrangements for image or video recognition or understanding
- G06V10/70—Arrangements for image or video recognition or understanding using pattern recognition or machine learning
- G06V10/77—Processing image or video features in feature spaces; using data integration or data reduction, e.g. principal component analysis [PCA] or independent component analysis [ICA] or self-organising maps [SOM]; Blind source separation
- G06V10/80—Fusion, i.e. combining data from various sources at the sensor level, preprocessing level, feature extraction level or classification level
- G06V10/806—Fusion, i.e. combining data from various sources at the sensor level, preprocessing level, feature extraction level or classification level of extracted features
-
- G—PHYSICS
- G06—COMPUTING; CALCULATING OR COUNTING
- G06V—IMAGE OR VIDEO RECOGNITION OR UNDERSTANDING
- G06V10/00—Arrangements for image or video recognition or understanding
- G06V10/70—Arrangements for image or video recognition or understanding using pattern recognition or machine learning
- G06V10/82—Arrangements for image or video recognition or understanding using pattern recognition or machine learning using neural networks
-
- G—PHYSICS
- G06—COMPUTING; CALCULATING OR COUNTING
- G06V—IMAGE OR VIDEO RECOGNITION OR UNDERSTANDING
- G06V20/00—Scenes; Scene-specific elements
- G06V20/70—Labelling scene content, e.g. deriving syntactic or semantic representations
-
- G—PHYSICS
- G16—INFORMATION AND COMMUNICATION TECHNOLOGY [ICT] SPECIALLY ADAPTED FOR SPECIFIC APPLICATION FIELDS
- G16H—HEALTHCARE INFORMATICS, i.e. INFORMATION AND COMMUNICATION TECHNOLOGY [ICT] SPECIALLY ADAPTED FOR THE HANDLING OR PROCESSING OF MEDICAL OR HEALTHCARE DATA
- G16H50/00—ICT specially adapted for medical diagnosis, medical simulation or medical data mining; ICT specially adapted for detecting, monitoring or modelling epidemics or pandemics
- G16H50/20—ICT specially adapted for medical diagnosis, medical simulation or medical data mining; ICT specially adapted for detecting, monitoring or modelling epidemics or pandemics for computer-aided diagnosis, e.g. based on medical expert systems
-
- Y—GENERAL TAGGING OF NEW TECHNOLOGICAL DEVELOPMENTS; GENERAL TAGGING OF CROSS-SECTIONAL TECHNOLOGIES SPANNING OVER SEVERAL SECTIONS OF THE IPC; TECHNICAL SUBJECTS COVERED BY FORMER USPC CROSS-REFERENCE ART COLLECTIONS [XRACs] AND DIGESTS
- Y02—TECHNOLOGIES OR APPLICATIONS FOR MITIGATION OR ADAPTATION AGAINST CLIMATE CHANGE
- Y02A—TECHNOLOGIES FOR ADAPTATION TO CLIMATE CHANGE
- Y02A90/00—Technologies having an indirect contribution to adaptation to climate change
- Y02A90/10—Information and communication technologies [ICT] supporting adaptation to climate change, e.g. for weather forecasting or climate simulation
Landscapes
- Engineering & Computer Science (AREA)
- Theoretical Computer Science (AREA)
- Health & Medical Sciences (AREA)
- Physics & Mathematics (AREA)
- Medical Informatics (AREA)
- General Physics & Mathematics (AREA)
- Databases & Information Systems (AREA)
- General Health & Medical Sciences (AREA)
- Computer Vision & Pattern Recognition (AREA)
- Evolutionary Computation (AREA)
- Multimedia (AREA)
- Software Systems (AREA)
- Data Mining & Analysis (AREA)
- Public Health (AREA)
- Computing Systems (AREA)
- Artificial Intelligence (AREA)
- Epidemiology (AREA)
- General Engineering & Computer Science (AREA)
- Biomedical Technology (AREA)
- Primary Health Care (AREA)
- Mathematical Physics (AREA)
- Computational Linguistics (AREA)
- Pathology (AREA)
- Nuclear Medicine, Radiotherapy & Molecular Imaging (AREA)
- Radiology & Medical Imaging (AREA)
- Medical Treatment And Welfare Office Work (AREA)
Abstract
The invention provides a millimeter-micron level image fine anatomical structure analysis tool based on a fine-grained network, which is used for developing an artificial intelligent analysis mode suitable for millimeter-micron level fine anatomical structures of different special departments based on a fine-grained image quantitative analysis network by constructing a standardized image fine anatomical structure database and integrating the analysis mode into an intelligent analysis system for the millimeter-micron level fine image structure of a medical image.
Description
[ field of technology ]
The patent relates to the field of medical image analysis based on a deep learning network, in particular to a millimeter-micrometer level image fine anatomical structure analysis tool based on a fine granularity network.
[ background Art ]
The medical image can provide indispensable important information for clinical diagnosis of diseases, disease screening, diagnosis and treatment design and prognosis judgment. With the advent of the precise medical era, the clinical significance of many millimeter-micron level fine anatomical structures in medical images, such as the size of aneurysms, the number of small bronchi, the size of pulmonary nodules, classification of the labial side bone walls of the upper anterior teeth, etc., is continuously mined, and the size of each specialized fine anatomical structure is often less than 10mm, but the quantitative and semi-quantitative features of the number, size, classification, morphology, position, etc. have important clinical guideline significance: in clinic, the probability of benign and malignant can be predicted according to whether the lung nodule diameter in the CT image exceeds 6 mm; the corresponding intervention means are selected according to the size of the cerebral aneurysm in angiography, so that the risk of rupture of the aneurysm with the diameter smaller than 7mm is small, and the conservative treatment is prone to be carried out; the number of small bronchi with the diameter smaller than 2mm in the lung CT is related to physiological and pathological changes such as physiological lung function loss, idiopathic pulmonary fibers and the like; the brain metastasis fine focus of malignant tumor is found and treated in early stage, so that the survival rate and life quality of patients are improved; the thickness classification of the anterior labial bone wall on the oral cavity is closely related to the decision and prognosis of immediate planting. Therefore, quantitative and semi-quantitative analysis of fine anatomy is becoming a major concern for clinical specialty.
The current millimeter-micrometer image anatomical structure is mainly analyzed by a doctor manually in a quantitative manner, and is influenced by a plurality of factors including doctor factors (film reading experience, professional background knowledge, visual resolution and the like), image equipment factors (image resolution and contrast, artifacts and noise, image preprocessing and the like), and patient factors (anatomical structure variation or loss, shooting body position and the like). Quantitative analysis of fine anatomy remains a current clinical challenge compared to quantitative analysis of large-sized anatomy. Firstly, the quantitative analysis of the millimeter-micron image anatomical structure is affected by the factors, the manual analysis has subjective errors, standardized analysis flow and repeatable results are difficult to form, and further optimization and development of accurate medicine are limited; secondly, the millimeter-micron image anatomical structure has larger individual difference, and the manual quantitative analysis consumes a great amount of time and labor cost, which is not beneficial to fully utilizing medical resources and improving medical efficiency; in addition, the area occupied by the fine anatomical structure in the image is relatively small, and is influenced by factors such as image resolution, artifacts and the like, redundant interference information is difficult to be removed by doctors with inexperienced experience, and accurate positioning and target structure analysis are performed, so that a large misdiagnosis rate is caused.
With the development of deep learning, studies have been attempted to realize intelligent quantitative analysis of fine anatomy by using artificial intelligence methods, such as segmenting and measuring the size of cerebral aneurysms on two-dimensional MRI images using U-net; the retinal nerve fiber layer thickness was predicted on SD-OCT images using Resnet to determine if the patient had glaucoma. However, such artificial intelligence analysis tools also suffer from a number of disadvantages: firstly, the micron-millimeter image fine anatomical structure is represented as pixel-subpixel level features in a medical image, and the model is difficult to accurately extract the features and perform quantitative analysis; secondly, the tool needs to manually divide the region of interest for machine training, and has high requirements on manpower and time cost in data annotation; in addition, tool diagnostic accuracy varies, and most of the accuracy is not satisfactory. At present, a generalized paradigm of artificial intelligence quantitative analysis of a fine anatomical structure is lacking, and the development trend of medical digitization and precision is not met.
The fine-grained network is a neural network for analyzing the fine objects of the two-dimensional images, and compared with a conventional deep learning model utilizing global information, the fine-grained network focuses on local information with distinguishing significance, so that the regional positioning and feature extraction capabilities of the fine-grained network are far better than those of the conventional model, and the fine-grained network has great potential in analysis and discrimination of fine anatomical structures. The fine granularity image identification is to realize finer subclassification on the basis of distinguishing basic categories, and the essence of the fine granularity image identification is to locate a local area with target distinguishing property, and perform feature extraction on the local area to complete training and learning of a classifier. However, the current fine-grained image recognition method is only used for the recognition and classification of fine objects, and a method for quantitative analysis of fine anatomical structures is still lacking.
[ invention ]
In order to lighten the burden of a clinician in analyzing an image fine anatomical structure, reduce the error of manual measurement and analysis, improve the fine feature extraction capability and precision of a deep learning model and realize the quantitative analysis of the image fine anatomical structure, the invention utilizes a millimeter-micrometer level image fine anatomical structure analysis tool based on a fine-grained network, and aims at least solving one of the technical problems existing in the prior art:
1. by constructing a standardized image fine anatomical structure database, the problem of error between image samples caused by the factor difference of image equipment is solved;
2. by constructing and training a fine-granularity image analysis network tool, the problems that artificial intelligence is difficult to locate fine anatomical structures in imaging, fully extract image features in micro-areas and quantitatively analyze the image features are solved;
3. the weak supervision learning mode is adopted, so that the problem that the analysis of the fine anatomical structure of the artificial intelligent image consumes a great deal of labor time and cost for data annotation in the past is solved;
4. based on a fine-granularity image analysis network, developing an artificial intelligent analysis mode suitable for millimeter-micron level fine anatomical structures of different specialized departments, and integrating the artificial intelligent analysis mode into an intelligent analysis system for the millimeter-micron level fine image structure of the medical image.
The invention adopts the technical scheme that:
a millimeter-micrometer scale image fine anatomy analysis tool based on a fine-grained network, comprising the steps of:
s1, constructing a standardized image fine anatomical structure database
S1.1 standardized collection of medical images
Collecting the imaging data required by each department in disease diagnosis and treatment, wherein in the imaging data collection process, professional personnel are required to control the quality of the image picture, and the imaging data with blurring and artifacts are screened out, so that the collected imaging data can accurately reflect the quantitative and semi-quantitative characteristics of the corresponding fine anatomical structure;
s1.2, constructing a standardized fine anatomical structure image database:
classifying and storing the standardized imaging data collected in the step S1.1 according to the source and type of the imaging data, selecting the section which is most favorable for diagnosis and characteristic observation according to the analysis requirements of different specialized departments on the corresponding fine anatomical structures, and carrying out image interception to obtain a standard two-dimensional image of the fine anatomical structures;
s1.3, an extraction, measurement and labeling module of a fine anatomical structure:
importing the standard two-dimensional image of the fine anatomical structure obtained in the step S1.2 into data quantitative analysis software, extracting, measuring and marking indexes by systematically trained personnel to obtain quantitative data of the fine anatomical structure, wherein the size of the fine anatomical structure is generally smaller than 10mm; according to the quantitative data and clinical semantics, a corresponding semi-quantitative category label of the fine anatomical structure is given; the extracted quantitative data and/or semi-quantitative labels are stored in a specified path in a form or text format;
S1.4, constructing a standardized image fine anatomical structure database:
matching the standard two-dimensional image of the fine anatomical structure obtained in the step S1.2 with the quantitative data and the semi-quantitative label obtained in the step S1.3, and associating the standard two-dimensional image, the quantitative data and the semi-quantitative label of the patient by taking the patient information from which the image is obtained as a main key to construct a standardized image fine anatomical structure database;
s2, constructing an image fine anatomical structure quantitative analysis module carrying with a fine granularity image recognition network
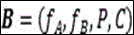
The fine anatomy quantitative analysis module for constructing a fine granularity image recognition network model is mainly composed of the following parts: the device comprises a data input unit, a feature extraction unit, a feature fusion unit and a data quantization analysis unit; the fine-grained image recognition network model comprises a BiCNN model, an RCNN model, a RACNN model, a MA-CNN model, a PA-CNN model and the like, wherein the BiCNN model (a bilinear convolutional neural network (Bilinear Convolutional Neural Networks, biCNN) is a fine-grained image recognition network based on high-order feature complementation) is taken as an example, and the BiCNN model isBThe method specifically comprises the following steps: feature extraction unit fFeature fusion unitPData quantization analysis unitCThe following is shown:
s2.1, construction data input Unit
Automatically reading a two-dimensional image and corresponding data in a standardized image fine anatomical structure database constructed in the step S1.4 by adopting a python sentence, and converting the two-dimensional image in the standardized fine anatomical structure database into matrix information by a data input unit to be input into a feature extraction unit;
s2.2, construction of a feature extraction Unit
The method comprises the steps of adopting a convolutional neural network trunk as a feature extraction unit, additionally adding a feature extraction enhancement module comprising APN and/or RPN, inputting matrix information in a data input unit in the step S2.1 into the convolutional neural network trunk to obtain a feature map containing fine anatomical structure quantization information, and inputting matrix information in the data input unit in the step S2.1 into 2 parallel CNN network trunks to obtain 2 feature maps containing fine anatomical structure quantization information if 2 parallel CNN network trunks are adopted as feature extraction units;
s2.3, construction of a feature fusion Unit
The feature fusion unit comprises a bilinear pooling layer, a gradient lifting loss function and/or a full connection layer, and the fine anatomical structure quantitative information feature map obtained in the step S2.2 is input into the feature fusion unit to perform feature fusion and dimension reduction operation, so that important features are ensured not to be lost; taking a bilinear pooling layer (bilinear pooling) and a full-connection layer as a feature fusion unit as an example, inputting the fine anatomical structure quantization information feature map obtained in the step S2.2 into the feature fusion unit to obtain the same picture IThe same spatial position in the same position of 2 feature maps in (a)lCapturing the paired relationship between feature channels to enhance the network discrimination capability as follows:

then all the positions are put againlIs added by the feature outer product matrix to obtain a fused feature mapϕ(I)The following is shown:

and then fusing the featuresϕ(I)Vector expansion is performedL2 regularization operation, ensuring that important features are not lost, as follows:


s2.4, constructing a data quantitative analysis unit
A softmax layer was used as a data quantification analysis unit: inputting the fusion characteristics obtained in the step S2.3 into a softmax layer, mapping the output of the unit into a (0, 1) interval by the softmax layer, calculating selected loss functions to obtain different types of prediction probabilities, and obtaining quantitative analysis results of a plurality of fine anatomical structures through a given threshold T, wherein the quantitative analysis results comprise quantitative data and semi-quantitative data;
s3, training a fine-granularity image recognition module with image fine anatomical structure quantitative analysis capability
S3.1, constructing a fine anatomical structure quantitative analysis module
The training sample set is put into the image fine anatomy structure quantitative analysis module carrying the fine granularity image recognition network in the step S2 for training and verification, and the image fine anatomy structure quantitative analysis module is constructed;
S3.2, performance evaluation of fine anatomical structure quantitative analysis module
Inputting the test data set into the image fine anatomical structure quantitative analysis module described in the step S3.1, and evaluating the output quantitative analysis result;
s4, constructing an intelligent analysis system for millimeter-micrometer level fine image structure
And (3) constructing an intelligent analysis system for the millimeter-micrometer level fine image structure on the basis of the image fine anatomical structure quantitative analysis module obtained in the step (S3).
In a further development, in step S1.1, the imaging data should accurately reflect quantitative and semi-quantitative characteristics of the number, size, classification, morphology, and location of the corresponding fine anatomical structures.
In a further development, in step S1.1, the source of the imaging data comprises CT, CBCT, PET-CT, MRI and/or ultrasound image US types.
In a further development, in step S1.2, the imaging data is preprocessed, including cropping, rotation, contrast adjustment, etc., of the picture before classifying and storing the imaging data.
In a further development, the quantitative data in step S1.3 comprise the size, number, area of the fine anatomy; semi-quantitative class labels include classification, subclass, morphology, location of fine anatomy.
In a further improvement, the convolutional neural network backbone adopted in the step S2.2 comprises a LeNet-5, vgg16, resNet, denseNet or GoogleNet convolutional neural network model; the parallel convolutional neural network backbone in step S2.2 comprises a multi-layer convolutional layer (convolutional layer) and a max pooling layer (maxpooling); after the matrix information in the data input unit in step S2.1 is input into the convolutional neural network trunk, the convolutional neural network trunk performs feature extraction and downsampling through the convolutional layer and the maximum pooling layer to obtain a quantized information feature map containing fine anatomical structures, for example, after the matrix information in the data input unit in step S2.1 is input into 2 parallel CNN network trunks, the 2 CNN network trunks perform feature extraction and downsampling through the convolutional layer and the maximum pooling layer to obtain 2 quantized information feature maps containing fine anatomical structures.
In a further development, in step S2.4, the quantitative analysis results of the fine anatomy include quantitative data including size, area, number and semi-quantitative data including classification, subclass, location, morphology.
In a further improvement scheme, in step S3.1, the training sample set is put into the image fine anatomical structure quantitative analysis module carrying the fine-granularity image recognition network in step S2 for training and verification, and the generalization performance and the prediction performance of the model are improved by adopting the technical methods of data augmentation, resampling, K-fold cross verification and/or model integration.
In a further improvement, in step S3.2, the performance evaluation of the quantitative analysis result includes the following performance evaluation indexes: average absolute error, root mean square error, accuracy, precision, sensitivity, specificity, positive predictive value, negative predictive value, F1-score, AUROC, and AUPRC.
In a further improvement, the specific method of step S4 is as follows:
inputting a standard two-dimensional image which meets the image fine anatomical structure required by the step S1.2, outputting a corresponding quantitative analysis result through a fine-granularity image recognition module which is trained in the step S3 and has the quantitative analysis capability of the image fine anatomical structure, and finally applying an analysis tool to a mobile terminal to assist a clinician to complete intelligent analysis of the image fine anatomical structure which is applicable to different special departments, such as screening, diagnosis, disease evaluation and the like.
Compared with the prior art, the invention has the beneficial effects that:
(1) According to the invention, the data set annotation is carried out by the deep learning technology without consuming a great deal of manpower time cost, so that the high-efficiency, automatic and quantitative analysis of the image fine anatomical structure can be realized, the workload of a clinician is effectively reduced, and the medical working efficiency is improved;
(2) The invention uses a fine-grained network as a basic framework, adopts a weak supervision learning mode, and has stronger capability of accurately positioning and extracting fine structural features than other artificial intelligent analysis tools;
(3) The invention can effectively reduce analysis errors caused by insufficient experience of doctors in quantitative analysis of the image fine anatomical structure, and can assist the development of accurate medical treatment and high-level medical treatment;
(4) The invention can be applied to mobile terminal auxiliary doctors to carry out quantitative analysis of fine anatomical structures, break space-time limit, provide expert analysis diagnosis results and timely referral suggestions for patients in primary hospitals and community hospitals with scarce medical resources, and is beneficial to promoting medical resource equalization development.
The invention is described in further detail below with reference to the attached drawings and detailed description:
[ description of the drawings ]
FIG. 1 is a schematic of the overall workflow of the present invention;
FIG. 2 is a schematic diagram of a workflow for constructing a standardized image fine anatomy database in accordance with the present invention;
FIG. 3 is a schematic diagram of a system for quantitatively analyzing a fine anatomical structure of an image constructed to carry a fine-grained image recognition network according to the present invention;
FIG. 4 is a schematic workflow diagram of training a fine-grained image recognition module with image fine-grained structure quantitative analysis capability according to the invention.
[ detailed description ] of the invention
For a better description of the objects, technical solutions and advantages of the present invention, the present invention will now be described in further detail with reference to examples.
Various embodiments and aspects of the present application will be described with reference to details discussed below, which are illustrated in the accompanying drawings. The following description and drawings are illustrative of the application and are not to be construed as limiting the application. Numerous specific details are described to provide a thorough understanding of various embodiments of the present application. However, in some instances, well-known or conventional details are not described in order to provide a concise discussion of embodiments of the present application.
Reference in the specification to "one embodiment" or "an embodiment" means that a particular feature, structure, or characteristic described in connection with the embodiment can be included in at least one embodiment of the application. The appearances of the phrase "in one embodiment" in various places in the specification are not necessarily all referring to the same embodiment.
It should be understood that the detailed description is presented herein for purposes of illustration only and is not intended to limit the scope of the application. It should be noted that, in the case of no conflict, the embodiments and features of the embodiments in the present application may be combined with each other. Accordingly, those of ordinary skill in the art will recognize that various changes and modifications of the various embodiments described herein can be made without departing from the scope and spirit of the disclosure.
Unless otherwise defined, all terms (including technical and scientific terms) used herein have the same meaning as commonly understood by one of ordinary skill in the art to which this application belongs. It will be further understood that terms, such as those defined in commonly used dictionaries, should be interpreted as having a meaning that is consistent with their meaning in the context of the relevant art and/or the present specification and will not be interpreted in an idealized or overly formal sense unless expressly so defined herein.
Furthermore, note that: (1) some steps may be selectively performed; (2) The steps may not be limited to the specific order set forth herein; (3) certain steps may be performed in a different order; and (4) certain steps may be performed simultaneously.
1. Example 1
Aiming at the fine anatomical structure of the anterior labial bone wall on the oral cavity, a millimeter-micrometer level image fine anatomical structure analysis tool based on a fine-grained network is established, as shown in fig. 1, and comprises the following steps:
s1, constructing a standardized image fine anatomical structure database, as shown in figure 2,
s1.1 and oral CBCT standardized collection module
Acquiring CBCT medical image data shot by the same center, the same machine and the same technical parameter scheme, collecting the CBCT medical image data shot by a NewTomVG oral cavity CBCT system in the same hospital, after removing CBCT medical image data with poor quality such as blurring, artifacts and the like, exporting a CBCT file through software, acquiring image data comprising the upper and lower jawbone and teeth of a patient, and storing the acquired data in a DICOM format in a specified path according to a standard naming method;
S1.2, constructing a standardized database of facial front teeth imaging on the oral cavity
The standardized CBCT file obtained in the step S1.1 is imported into planting simulation software coDaignostix, and a standardized screenshot process is designed according to a clinical analysis mode of the anterior labial side bone wall on the oral cavity, and the specific implementation is as follows: (1) respectively taking an occlusion plane and a human body midline as a horizontal reference plane and a vertical reference plane of the three-dimensional reconstruction model; (2) on the cross section of the three-dimensional reconstruction model, taking the cementum boundary of each front tooth of the upper jaw as a horizontal plane, and drawing a dental arch curve according to the center of the dental pulp cavity of each tooth; (3) selecting a tooth position to be analyzed, and cutting out a maximum sagittal plane of the tooth as a standard section, wherein the section comprises a labial bone wall and a related measurement reference mark; (4) converting the selected section into a TIFF format, storing the TIFF format in a specified path according to a standard naming method, and performing screenshot according to the standard flow to obtain an on-oral anterior tooth standardized imaging database;
s1.3, extraction, measurement and labeling module of anterior labial bone wall on oral cavity
The person subjected to systematic training introduces the standardized two-dimensional image of the front teeth on the oral cavity obtained in the step S1.2 into Adobe Illustrator, adjusts the size of the picture by taking a standard graduated scale in the two-dimensional image as a reference, and measures the thickness of the labial bone wall at the 2mm horizontal plane of the root side of the cementum boundary by using a straight line tool to obtain quantitative data of the labial bone wall of the front teeth on the oral cavity; according to the difference of the thickness of the lip side bone wall of the front tooth on the oral cavity, dividing the lip side bone wall into a thin type (1 mm) and a thick type (1 mm or more), and endowing each picture with a corresponding bone quantity grade label to obtain a semi-quantitative type label of the lip side bone wall of the front tooth on the oral cavity;
S1.4, constructing a standardized database of the labial side bone wall of the anterior teeth on the oral cavity
Matching the standard two-dimensional image of the anterior labial bone wall on the oral cavity obtained in the step S1.2 with the label of the labial bone wall thickness and bone quantity grade of 2mm below the cementum boundary obtained in the step S1.3, and associating the standard two-dimensional image, quantitative index and clinical semantic label of the patient with the patient information from which the image is derived as a main key to construct a standard database of the anterior labial bone wall on the oral cavity;
s2, constructing a semi-quantitative analysis module of the labial bone wall of the front tooth on the oral cavity carrying a fine-grained image recognition network, as shown in figure 3,
constructing a semi-quantitative analysis module of the labial bone wall of the anterior teeth on the oral cavity based on a BiCNN model, wherein the BiCNN modelBThe method specifically comprises the following steps: feature extraction unitfFeature fusion unitPData quantization analysis unitCThe following is shown:

s2.1, constructing an upper anterior labial side bone wall data input unit
Automatically reading data in a standardized database of the anterior labial side bone wall of the oral cavity by adopting a python statement, and converting a standard two-dimensional image of the anterior labial side bone wall into matrix information by a data input unit to input the matrix information into a BiCNN network;
s2.2, constructing an upper anterior labial bone wall feature extraction unit
2 parameter parallel VGG16 main network is adopted as a feature extraction unit, specifically, a standard two-dimensional image of the lateral bone wall of the upper anterior labia is input into the feature extraction unit, and 2 feature graphs can be outputf A ,f B In the embodiment, the VGG16 backbone network is selected to only keep a convolution layer and a maximum pooling layer so as to fully extract the image characteristics of the lateral bone wall of the upper front tooth lip;
s2.3, constructing an upper anterior labial bone wall feature fusion unit
A bilinear pooling layer (bilinear pooling) is adopted as an upper anterior labial side bone wall characteristic fusion unit, and specifically, the bilinear fusion layer obtains the same picture for the upper anterior labial side bone wall characteristic extraction unit in the step S2.2IThe same spatial position in the same position of 2 feature maps in (a)lCapturing the paired relationship between feature channels to enhance the network discrimination capability as follows:

then all the positions are put againlIs added by the feature outer product matrix to obtain a fused feature mapϕ(I)The following is shown:

and then fusing the featuresϕ(I)Vector expansion is performedL2 regularization operation, ensuring that important features are not lost, as follows:


then inputting the fused feature map into a full-connection layer, mapping the distributed features into a sample marking space, and greatly reducing the influence of the feature position on the classification of the labial bone wall;
S2.4, constructing a semi-quantitative classification unit of the lateral bone wall of the labia of the upper front tooth
The softmax layer is used as an upper anterior labial bone wall semi-quantitative classification unit, the fusion characteristic obtained in the step S2.3 is input into the softmax layer, the softmax layer maps the output of the unit to a (0, 1) interval to obtain the prediction probability of upper anterior labial bone wall thickness thin classification, and the threshold T is set to be 0.5 to obtain the upper anterior labial bone wall thickness parting result;
s3, training a fine-grained image recognition module with semi-quantitative analysis of the labial bone wall of the front teeth on the oral cavity, as shown in figure 4,
s3.1, constructing a fine anatomical structure quantitative analysis module
Dividing the standardized database of the anterior labial side bone wall on the oral cavity obtained in the step S1.4 into a training set and a testing set according to the proportion of 9:1, inputting the training set into a BiCNN model for continuous training of an analysis module, and carrying out model training and optimization by combining the model and the data characteristics in the following manner: (1) data augmentation: rotating, translating, turning, shearing and the like are carried out on the training set image so as to enlarge the training set and enhance the robustness of the model; (2) resampling: aiming at the characteristic of unbalanced front tooth image data category, a resampling method is used for improving the prediction performance; (3) the 5-fold cross validation method comprises the following steps: dividing the training set into 5 mutually exclusive subsets, sequentially selecting 4 subsets as the training set, and repeating training for 5 times by using the rest 1 subset as the verification set to reduce the risk of overfitting; (5) model integration: the prediction structure of the sub-model is synthesized by adopting an average method so as to improve the classification precision of the module, and finally, a semi-quantitative analysis module of the lateral bone wall of the upper anterior labia with high precision, high robustness and high feasibility is constructed;
S3.2, evaluation of performance of semi-quantitative analysis module of labial bone wall of anterior teeth on oral cavity
Inputting the test set into the performance index of the semi-quantitative analysis module of the upper anterior labial bone wall of the oral cavity in the step S3.1, and adopting various performance evaluation indexes including accuracy, sensitivity, specificity, F1-score, AUROC, AUPRC and the like to comprehensively evaluate the performance of the semi-quantitative analysis network of the upper anterior labial bone wall and evaluate the performance of the semi-quantitative analysis module of the upper anterior labial bone wall of the oral cavity by various indexes.
S4, constructing a millimeter-micrometer level intraoral anterior labial side bone wall semi-quantitative intelligent analysis system
On the basis of the semi-quantitative analysis module of the upper anterior labial bone wall obtained in the step S3, an intelligent analysis system of the upper anterior labial bone wall is constructed, specifically, a standard two-dimensional image of the upper anterior labial bone wall meeting the requirements of the step S1.2 is input, the thickness classification of the labial bone wall can be obtained, and codes are applied to a mobile terminal, so that an stomatologist can be assisted in completing preoral dental implant evaluation and operation scheme decision.
2. Example 2
For the fine anatomy of the ophthalmic choroid, a millimeter-micrometer scale image fine anatomy analysis tool based on a fine-grained network was established, as shown in fig. 1, comprising the steps of:
S1, constructing a standardized image fine anatomical structure database, as shown in figure 2,
s1.1, constructing a standardized fundus choroid database
Acquiring fundus choroidal OCT images from the same center, the same machine and the same scanning parameters, specifically, collecting fundus OCT images shot by using a Heidelberg SPECTRALIS optical coherence tomography (Spectralis OCT) from the same hospital, and acquiring imaging data of fundus chorionic OCT after eliminating poor eyeball positioning and the like and having poor noise quality and the like;
s1.2, constructing a standardized fundus choroidal imaging database
Scanning the fundus choroid OCT image obtained in the step S1.1 in the horizontal and vertical directions of a macular fovea, and obtaining a standard two-dimensional image of the fundus choroid after image interception; according to the standard naming method, storing the standard two-dimensional image of the fundus choroid in a specified path;
s1.3, choroid extraction, measurement and labeling module
The trained staff imports the standard two-dimensional image of the fundus choroid obtained in step S1.2 into measurement software to measure the thickness of the choroid under different points, specifically, the fundus choroid thickness is defined as the vertical distance from the outer edge of the high reflection line of the retinal pigment epithelium layer to the inner surface of the sclera, and the measurement points are the central fovea of the macula, the upper, lower, nasal and temporal sides of the macula are 750 microns away from the central fovea;
S1.4 construction of a standardized choroidal database
Matching the standard two-dimensional image data of the fundus choroid obtained in the step S1.2 with the choroid thickness under each measuring site obtained in the step S1.3, specifically, associating the standard two-dimensional image and quantitative index of the patient with the patient information from which the image is derived as a main key, and constructing a standardized fundus choroid database;
s2, constructing a fundus choroid thickness quantitative analysis module carrying a fine-granularity image recognition network, as shown in figure 3,
constructing a fundus choroid thickness quantitative analysis module based on a BiCNN model, wherein the BiCNN model isBThe method specifically comprises the following steps: feature extraction unitfFeature fusion unitPData quantization analysis unitCThe following is shown:

s2.1, constructing a fundus image choroidal data input unit
Automatically reading data in a standardized fundus image vein database by adopting a python sentence, and converting a standard two-dimensional image of the standardized fundus image into matrix information by a data input unit to input the matrix information into a BiCNN network;
s2.2, constructing a fundus image choroidal feature extraction unit
Adopts 2 parameter parallel VGG16 main network as feature extraction unit, specifically, inputs the standard two-dimensional image of fundus choroid into feature extraction In the taking unit, 2 parts of characteristic diagrams can be outputf A ,f B In the embodiment, the VGG16 backbone network is selected to only keep a convolution layer and a maximum pooling layer so as to fully extract the image characteristics of the standard two-dimensional image of the fundus choroid;
s2.3, constructing a characteristic fusion unit of fundus choroid
Adopts bilinear pooling layer (bilinear pooling) as standard two-dimensional image feature fusion unit of fundus choroid, and specifically, the bilinear fusion layer obtains the same picture for the fundus image choroid feature extraction unit in step S2.2IThe same spatial position in the same position of 2 feature maps in (a)lCapturing the paired relationship between feature channels to enhance the network discrimination capability as follows:

then all the positions are put againlIs added by the feature outer product matrix to obtain a fused feature mapϕ(I)The following is shown:

and then fusing the featuresϕ(I)Vector expansion is performedL2 regularization operation, ensuring that important features are not lost, as follows:


then inputting the fused characteristic map into a full-connection layer, mapping the distributed characteristic to a sample marking space, and greatly reducing the influence of the characteristic position on the quantitative analysis of the choroid of the fundus image;
s2.4, constructing a data quantitative analysis unit
A softmax layer was used as a data quantification analysis unit: inputting the fusion characteristics obtained in the step S2.3 into a softmax layer, mapping the output of the unit into a (0, 1) interval by the softmax layer, calculating a selected loss function to obtain different types of prediction probabilities, and obtaining a choroid quantification thickness result of an analysis site through a given threshold T;
s3, training a fine-granularity image recognition module with the image fine anatomy structure quantitative analysis capability, as shown in figure 4,
s3.1, training fine granularity image analysis network
The training sample set is put into the image fine anatomy structure quantitative analysis module carrying the fine granularity image recognition network in the step S2 for training and verification, and the image fine anatomy structure quantitative analysis module is constructed;
s3.2, performance evaluation of fine anatomical structure quantitative analysis module
Inputting the test data set into the image fine anatomical structure quantitative analysis module described in the step S3.1, and evaluating the output quantitative analysis result, wherein specific analysis indexes comprise: average absolute error, root mean square error, etc.;
s4, constructing an intelligent analysis system for millimeter-micrometer level fine image structure
On the basis of the image fine anatomical structure quantitative analysis module obtained in the step S3, an intelligent analysis system of the millimeter-micrometer level fine image structure is constructed, and an analysis tool is applied to a mobile terminal to assist a clinician in completing intelligent analysis of the fine anatomical structure of the ophthalmic choroid.
3. Example 3
For the fine anatomy of the liver cirrhosis regeneration nodule, a millimeter-micrometer scale image fine anatomy analysis tool based on a fine-grained network is established, as shown in fig. 1, comprising the following steps:
s1, constructing a standardized image fine anatomical structure database, as shown in figure 2,
s1.1, constructing a standardized liver cirrhosis regeneration nodule fine anatomical structure database
Acquiring liver ultrasonic contrast images shot by the same center, the same machine and the same technical parameter scheme; specifically, the liver ultrasound contrast images shot by the Philips-iU22 system are collected in the same hospital, and after poor-quality liver ultrasound contrast data such as artifacts, blurring and the like are removed, liver ultrasound imaging data are obtained;
s1.2, constructing a fine anatomical structure image database of a standardized liver cirrhosis regeneration node
Selecting eight liver ultrasonic standard sections from the standard two-dimensional image of the liver cirrhosis regeneration node obtained in the step S1.1, wherein the eight liver ultrasonic standard sections comprise a first liver gate displayed by an under-rib oblique section, a second liver gate displayed by an under-rib oblique section, a left outside angle displayed by an under-xiphoid transverse cutting, left lobe interlobe cracks displayed by an under-xiphoid sagittal cutting, a long axis section of a left lobe trans-abdominal aorta displayed by an under-xiphoid sagittal cutting, a middle crack displayed by an under-rib oblique cutting, a diaphragm top displayed by an under-rib oblique cutting, and a right lobe interlobe displayed by an under-rib oblique cutting, and performing image screenshot to obtain a standard two-dimensional image of liver ultrasonic radiography;
S1.3 extraction, measurement and labeling module for liver cirrhosis regeneration nodule
Importing the standard two-dimensional image of the liver ultrasound contrast obtained in the step S1.2 into ultrasound image analysis software by systematically trained personnel, measuring the number and the size of the regenerated nodules under each ultrasound section by using an analysis software tool, specifically measuring the length and the width of the regenerated nodules seen in each ultrasound section, uniformly measuring the number of the regenerated nodules seen in each ultrasound interface in millimeter units; storing the measured quantitative index in a designated path;
s1.4, constructing a standardized liver cirrhosis regeneration nodule ultrasound contrast database
Matching the standard two-dimensional image of liver ultrasonic radiography obtained in the step S1.2 with the regenerated nodule size under each ultrasonic section obtained in the step S1.3, and associating the standard two-dimensional image and quantitative index of the patient by taking the patient information from which the image is obtained as a main key to construct a standardized liver cirrhosis regenerated nodule ultrasonic database;
s2, constructing a liver cirrhosis regeneration nodule quantitative analysis module carrying a fine-grained image recognition network, as shown in figure 3,
constructing a liver cirrhosis regeneration nodule quantitative analysis module based on a BiCNN model, wherein the liver cirrhosis regeneration nodule quantitative analysis module is arranged in the BiCNN model BThe method specifically comprises the following steps: feature extraction unitfFeature fusion unitPData quantization analysis unitCThe following is shown:

s2.1, constructing an ultrasonic contrast data input unit of a liver cirrhosis regeneration nodule
Automatically reading data in a standard liver cirrhosis regeneration nodule ultrasound contrast database by using a python sentence, and converting a standard two-dimensional image of liver ultrasound contrast into matrix information by a data input unit to be input into a BiCNN network;
s2.2, constructing a liver cirrhosis regeneration nodule feature extraction unit
2 parameter parallel VGG16 backbone network is adopted as a feature extraction unit, specifically, a standard two-dimensional image of liver ultrasonic radiography is input into the feature extraction unit, and 2 feature images can be outputf A ,f B In the embodiment, the VGG16 backbone network is selected to only keep a convolution layer and a maximum pooling layer so as to fully extract the image characteristics of liver ultrasonic radiography;
s2.3, constructing liver cirrhosis regeneration nodule feature fusion unit
Adopts bilinear pooling layer (bilinear pooling) as liver cirrhosis regeneration nodule feature fusion unit, and specifically, the bilinear fusion layer obtains the same picture for the liver cirrhosis regeneration nodule feature extraction unit in step S2.2IThe same spatial position in the same position of 2 feature maps in (a) lCapturing the paired relationship between feature channels to enhance the network discrimination capability as follows:

then all the positions are put againlIs added by the feature outer product matrix to obtain the fused featureDrawing of the figureϕ(I)The following is shown:

and then fusing the featuresϕ(I) Vector expansion is performedL2 regularization operation, ensuring that important features are not lost, as follows:


then inputting the fused feature map into a full-connection layer, mapping the distributed features into a sample marking space, and greatly reducing the influence of the feature position on the identification of the liver cirrhosis regeneration nodule in the ultrasonic contrast image;
s2.4, constructing a data quantitative analysis unit
A softmax layer was used as a data quantification analysis unit: inputting the fusion characteristics obtained in the step S2.3 into a softmax layer, mapping the output of the unit to a (0, 1) interval by the softmax layer, calculating a selected loss function to obtain different types of prediction probabilities, and outputting the number and the size of the regenerated nodules in the designated liver ultrasonic radiography image through a given threshold T;
s3, training a fine-granularity image recognition module with the image fine anatomy structure quantitative analysis capability, as shown in figure 4,
s3.1, training fine granularity image analysis network
The training sample set is put into the image fine anatomy structure quantitative analysis module carrying the fine granularity image recognition network in the step S2 for training and verification, and the image fine anatomy structure quantitative analysis module is constructed;
s3.2, performance evaluation of fine anatomical structure quantitative analysis module
Inputting the test data set into the image fine anatomical structure quantitative analysis module described in the step S3.1, and evaluating the output quantitative analysis result, wherein the evaluation indexes comprise absolute error, root mean square error, accuracy, precision, sensitivity and the like;
s4, constructing an intelligent analysis system for millimeter-micrometer level fine image structure
On the basis of the image fine anatomical structure quantitative analysis module obtained in the step S3, an intelligent analysis system of the millimeter-micrometer level fine image structure is constructed, an analysis tool is applied to a mobile terminal, a clinician is assisted to complete intelligent quantitative analysis of the liver cirrhosis regeneration nodule fine anatomical structure, and the intelligent quantitative analysis system is beneficial to rapidly and accurately giving disease diagnosis in clinical practice.
While the present invention has been described in detail with reference to the above embodiments, it will be apparent to those skilled in the art from this disclosure that various changes or modifications can be made therein without departing from the spirit and scope of the invention as defined in the following claims. Accordingly, the detailed description of the disclosed embodiments is to be taken only by way of illustration and not by way of limitation, and the scope of protection is defined by the content of the claims.
Claims (10)
1. A millimeter-micrometer scale image fine anatomical structure analysis tool based on a fine-grained network, comprising the steps of:
s1, constructing a standardized image fine anatomical structure database
S1.1 standardized collection of medical images
Collecting the imaging data required by each department in disease diagnosis and treatment, wherein in the imaging data collection process, professional personnel are required to control the quality of the image picture, and the imaging data with blurring and artifacts are screened out, so that the collected imaging data can accurately reflect the quantitative and semi-quantitative characteristics of the corresponding fine anatomical structure;
s1.2, constructing a standardized fine anatomical structure image database
Classifying and storing the standardized imaging data collected in the step S1.1 according to the source and type of the imaging data, selecting the section which is most favorable for diagnosis and characteristic observation according to the analysis requirements of different specialized departments on the corresponding fine anatomical structures, and carrying out image interception to obtain a standard two-dimensional image of the fine anatomical structures;
s1.3, extraction, measurement and labeling module of fine anatomical structure
Importing the standard two-dimensional image of the fine anatomical structure obtained in the step S1.2 into data quantitative analysis software, and extracting, measuring and marking indexes by systematically trained personnel to obtain quantitative data of the fine anatomical structure; according to the quantitative data and clinical semantics, a corresponding semi-quantitative category label of the fine anatomical structure is given;
S1.4, constructing a standardized image fine anatomical structure database
Matching the standard two-dimensional image of the fine anatomical structure obtained in the step S1.2 with the quantitative data and the semi-quantitative label obtained in the step S1.3, and associating the standard two-dimensional image, the quantitative data and the semi-quantitative label of the patient by taking the patient information from which the image is obtained as a main key to construct a standardized image fine anatomical structure database;
s2, constructing an image fine anatomical structure quantitative analysis module carrying with a fine granularity image recognition network
The fine anatomy quantitative analysis module for constructing a fine granularity image recognition network model is mainly composed of the following parts: the device comprises a data input unit, a feature extraction unit, a feature fusion unit and a data quantization analysis unit;
s2.1, construction data input Unit
The two-dimensional images and corresponding data in the standardized image fine anatomical structure database constructed in the step S1.4 are automatically read by adopting computer sentences, and the two-dimensional images in the standardized fine anatomical structure database are converted into matrix information by a data input unit and are input into a feature extraction unit;
s2.2, construction of a feature extraction Unit
The method comprises the steps of (1) inputting matrix information in a data input unit in step S2.1 into a convolutional neural network trunk by taking the convolutional neural network trunk as a feature extraction unit to obtain a feature map containing quantitative information of a fine anatomical structure;
s2.3, construction of a feature fusion Unit
The feature fusion unit comprises a bilinear pooling layer, a gradient lifting loss function and/or a full connection layer, and the fine anatomical structure quantitative information feature map obtained in the step S2.2 is input into the feature fusion unit to perform feature fusion and dimension reduction operation, so that important features are ensured not to be lost;
s2.4, constructing a data quantitative analysis unit
A softmax layer was used as a data quantification analysis unit: inputting the fusion characteristics obtained in the step S2.3 into a softmax layer, mapping the output of the unit into a (0, 1) interval by the softmax layer, calculating selected loss functions to obtain different types of prediction probabilities, and obtaining quantitative analysis results of a plurality of fine anatomical structures through a given threshold T, wherein the quantitative analysis results comprise quantitative data and semi-quantitative data;
s3, training a fine-granularity image recognition module with image fine anatomical structure quantitative analysis capability
S3.1, constructing a fine anatomical structure quantitative analysis module
The training sample set is put into the image fine anatomy structure quantitative analysis module carrying the fine granularity image recognition network in the step S2 for training and verification, and the image fine anatomy structure quantitative analysis module is constructed;
S3.2, performance evaluation of fine anatomical structure quantitative analysis module
Inputting the test data set into the image fine anatomical structure quantitative analysis module described in the step S3.1, and evaluating the output quantitative analysis result;
s4, constructing an intelligent analysis system for millimeter-micrometer level fine image structure
And (3) constructing an intelligent analysis system for the millimeter-micrometer level fine image structure on the basis of the image fine anatomical structure quantitative analysis module obtained in the step (S3).
2. The tool of claim 1, wherein in step S1.1, the imaging data is used to accurately reflect quantitative and semi-quantitative characteristics of the number, size, classification, morphology and location of the corresponding fine anatomical structures.
3. A millimeter-micrometer scale image fine anatomy analysis tool based on fine-grained network according to claim 1 characterized in that in step S1.1 the source of imaging data comprises CT, CBCT, PET-CT, MRI and/or US types.
4. The tool of claim 1, wherein in step S1.2, the image data is preprocessed, including cropping, rotation, and contrast adjustment, before classifying and storing the image data.
5. The fine-grained network-based millimeter-micron level image fine-anatomy analysis tool of claim 1, wherein the quantified data in step S1.3 includes the size, number, and area of fine anatomy; semi-quantitative class labels include classification, subclass, morphology, location of fine anatomy;
in step S2.4, the quantitative analysis results of the fine anatomy include quantitative data including size, area, number and semi-quantitative data including classification, subclass, location, morphology.
6. The fine-grain network-based millimeter-micron level image fine-anatomy analysis tool according to claim 1, wherein the convolutional neural network backbone employed in step S2.2 comprises a LeNet-5, vgg16, resNet, denseNet or GoogleNet convolutional neural network model; in the step S2.2, the parallel convolutional neural network trunk comprises a plurality of convolutional layers and a maximum pooling layer; an additional feature extraction enhancement module is arranged in the step S2.2 and comprises APN and/or RPN; after the matrix information in the data input unit in step S2.1 is input into the convolutional neural network trunk, the convolutional neural network trunk performs feature extraction and downsampling through the convolutional layer and the maximum pooling layer, and a feature map containing fine anatomical structure quantization information is obtained.
7. The fine-grained network-based millimeter-micron level image fine-anatomy analysis tool according to claim 1, wherein the fine-grained image recognition network model is a BiCNN model, an RCNN model, a RACNN model, a MA-CNN model, or a PA-CNN model.
8. The millimeter-micrometer level image fine anatomy analysis tool based on the fine-grained network according to claim 1, wherein in step S3.1, the training sample set is put into the image fine anatomy quantitative analysis module with the fine-grained image recognition network in step S2 for training and verification, and the generalization performance and the prediction performance of the model are improved by adopting the technical methods of data augmentation, resampling, K-fold cross verification and/or model integration.
9. The tool for analyzing fine anatomical structures based on millimeter-micrometer level images of fine-grained network according to claim 1, wherein in step S3.2, the performance evaluation of the quantitative analysis result comprises the following performance evaluation indexes: average absolute error, root mean square error, accuracy, precision, sensitivity, specificity, positive predictive value, negative predictive value, F1-score, AUROC, and AUPRC.
10. The millimeter-micrometer scale image fine anatomical structure analysis tool based on fine-grained network according to claim 1, wherein the specific method of step S4 is as follows:
inputting a standard two-dimensional image which meets the requirement of the step S1.2 and outputting a corresponding quantitative analysis result through a fine-granularity image recognition module which is trained in the step S3 and has the quantitative analysis capability of the image fine anatomical structure, and finally, applying an analysis tool to a mobile terminal to assist a clinician to finish intelligent analysis of the image fine anatomical structure which is applicable to different specialized departments.
Priority Applications (1)
| Application Number | Priority Date | Filing Date | Title |
|---|---|---|---|
| CN202310041744.7A CN116246755A (en) | 2023-01-28 | 2023-01-28 | Fine anatomical structure quantitative analysis tool based on fine-grained network nano-level image |
Applications Claiming Priority (1)
| Application Number | Priority Date | Filing Date | Title |
|---|---|---|---|
| CN202310041744.7A CN116246755A (en) | 2023-01-28 | 2023-01-28 | Fine anatomical structure quantitative analysis tool based on fine-grained network nano-level image |
Publications (1)
| Publication Number | Publication Date |
|---|---|
| CN116246755A true CN116246755A (en) | 2023-06-09 |
Family
ID=86634222
Family Applications (1)
| Application Number | Title | Priority Date | Filing Date |
|---|---|---|---|
| CN202310041744.7A Pending CN116246755A (en) | 2023-01-28 | 2023-01-28 | Fine anatomical structure quantitative analysis tool based on fine-grained network nano-level image |
Country Status (1)
| Country | Link |
|---|---|
| CN (1) | CN116246755A (en) |
-
2023
- 2023-01-28 CN CN202310041744.7A patent/CN116246755A/en active Pending
Similar Documents
| Publication | Publication Date | Title |
|---|---|---|
| Agrawal et al. | Artificial intelligence in dentistry: past, present, and future | |
| JP5763172B2 (en) | Diagnosis support system using panoramic X-ray photograph and diagnosis support program using panoramic X-ray photograph | |
| CN111310851A (en) | Artificial intelligence ultrasonic auxiliary system and application thereof | |
| CN112037913B (en) | Periodontitis intelligent detection system based on convolutional neural network | |
| CN113962311A (en) | Knowledge data and artificial intelligence driven ophthalmic multi-disease identification system | |
| CN109255354B (en) | Medical CT-oriented computer image processing method and device | |
| Yuan et al. | Personalized design technique for the dental occlusal surface based on conditional generative adversarial networks | |
| CN113284126B (en) | Method for predicting hydrocephalus shunt operation curative effect by artificial neural network image analysis | |
| Kong et al. | Automated maxillofacial segmentation in panoramic dental x-ray images using an efficient encoder-decoder network | |
| Sheng et al. | Transformer-based deep learning network for tooth segmentation on panoramic radiographs | |
| WO2021209887A1 (en) | Rapid, accurate and machine-agnostic segmentation and quantification method and device for coronavirus ct-based diagnosis | |
| Chen et al. | Missing teeth and restoration detection using dental panoramic radiography based on transfer learning with CNNs | |
| CN112927187A (en) | Method for automatically identifying and positioning focal cortical dysplasia epileptic focus | |
| CN115222674A (en) | Detection device for intracranial aneurysm rupture risk based on multi-dimensional feature fusion | |
| CN113889229A (en) | Construction method of medical image diagnosis standard based on human-computer combination | |
| CN116844733B (en) | Medical data integrity analysis method based on artificial intelligence | |
| CN116524248B (en) | Medical data processing device, method and classification model training device | |
| CN112635067A (en) | Deep learning-based diagnosis method for bone metastasis tumor in nuclide bone imaging | |
| CN116246755A (en) | Fine anatomical structure quantitative analysis tool based on fine-grained network nano-level image | |
| Chen et al. | Automatic and visualized grading of dental caries using deep learning on panoramic radiographs | |
| CN113469987A (en) | Dental X-ray image lesion area positioning system based on deep learning | |
| Motie et al. | Application of Artificial Intelligence in Diagnosing Oral and Maxillofacial Lesions, Facial Corrective Surgeries, and Maxillofacial Reconstructive Procedures | |
| CN113223699A (en) | Method and system for constructing screening model for lumbar vertebra osteopenia and osteoporosis | |
| CN116168845B (en) | Image data processing cooperative motion system | |
| CN115909470B (en) | Deep learning-based full-automatic eyelid disease postoperative appearance prediction system and method |
Legal Events
| Date | Code | Title | Description |
|---|---|---|---|
| PB01 | Publication | ||
| PB01 | Publication | ||
| SE01 | Entry into force of request for substantive examination | ||
| SE01 | Entry into force of request for substantive examination |