CN112716471A - System and method for assessing vascular remodeling - Google Patents
System and method for assessing vascular remodeling Download PDFInfo
- Publication number
- CN112716471A CN112716471A CN202011270578.0A CN202011270578A CN112716471A CN 112716471 A CN112716471 A CN 112716471A CN 202011270578 A CN202011270578 A CN 202011270578A CN 112716471 A CN112716471 A CN 112716471A
- Authority
- CN
- China
- Prior art keywords
- foot
- patient
- sensor
- blood flow
- population
- Prior art date
- Legal status (The legal status is an assumption and is not a legal conclusion. Google has not performed a legal analysis and makes no representation as to the accuracy of the status listed.)
- Pending
Links
- 238000000034 method Methods 0.000 title claims abstract description 95
- 208000032594 Vascular Remodeling Diseases 0.000 title description 2
- 230000008081 blood perfusion Effects 0.000 claims abstract description 58
- 238000001228 spectrum Methods 0.000 claims abstract description 28
- 230000001131 transforming effect Effects 0.000 claims abstract description 3
- 230000003287 optical effect Effects 0.000 claims description 43
- 230000000302 ischemic effect Effects 0.000 claims description 28
- 238000004458 analytical method Methods 0.000 claims description 11
- 238000009792 diffusion process Methods 0.000 claims description 8
- 238000004497 NIR spectroscopy Methods 0.000 claims description 5
- 238000009543 diffuse optical tomography Methods 0.000 claims description 5
- 238000000691 measurement method Methods 0.000 claims description 5
- 238000005100 correlation spectroscopy Methods 0.000 claims description 3
- 230000000250 revascularization Effects 0.000 abstract description 12
- 210000002683 foot Anatomy 0.000 description 139
- 230000017531 blood circulation Effects 0.000 description 116
- 238000005259 measurement Methods 0.000 description 83
- 210000001519 tissue Anatomy 0.000 description 82
- 208000027418 Wounds and injury Diseases 0.000 description 63
- 206010052428 Wound Diseases 0.000 description 62
- 230000010412 perfusion Effects 0.000 description 50
- 230000002792 vascular Effects 0.000 description 44
- 238000002266 amputation Methods 0.000 description 37
- 210000001367 artery Anatomy 0.000 description 36
- 208000028867 ischemia Diseases 0.000 description 34
- 210000003491 skin Anatomy 0.000 description 34
- 239000000523 sample Substances 0.000 description 29
- 239000000835 fiber Substances 0.000 description 28
- 239000013307 optical fiber Substances 0.000 description 28
- 206010028980 Neoplasm Diseases 0.000 description 25
- 238000011282 treatment Methods 0.000 description 24
- 238000004891 communication Methods 0.000 description 22
- 230000029663 wound healing Effects 0.000 description 21
- 238000002560 therapeutic procedure Methods 0.000 description 19
- 210000003128 head Anatomy 0.000 description 18
- 230000000875 corresponding effect Effects 0.000 description 17
- 230000002093 peripheral effect Effects 0.000 description 17
- 210000004204 blood vessel Anatomy 0.000 description 16
- 230000001684 chronic effect Effects 0.000 description 16
- 206010012601 diabetes mellitus Diseases 0.000 description 16
- 208000037265 diseases, disorders, signs and symptoms Diseases 0.000 description 16
- 210000003414 extremity Anatomy 0.000 description 16
- 230000006870 function Effects 0.000 description 16
- 238000001356 surgical procedure Methods 0.000 description 16
- 206010034576 Peripheral ischaemia Diseases 0.000 description 15
- QVGXLLKOCUKJST-UHFFFAOYSA-N atomic oxygen Chemical compound [O] QVGXLLKOCUKJST-UHFFFAOYSA-N 0.000 description 15
- 201000010099 disease Diseases 0.000 description 15
- 229910052760 oxygen Inorganic materials 0.000 description 15
- 239000001301 oxygen Substances 0.000 description 15
- 238000002639 hyperbaric oxygen therapy Methods 0.000 description 14
- 239000000853 adhesive Substances 0.000 description 13
- 230000001070 adhesive effect Effects 0.000 description 13
- 238000002399 angioplasty Methods 0.000 description 13
- 238000005311 autocorrelation function Methods 0.000 description 13
- 230000035876 healing Effects 0.000 description 13
- 230000010355 oscillation Effects 0.000 description 13
- 238000002079 electron magnetic resonance spectroscopy Methods 0.000 description 12
- 239000000463 material Substances 0.000 description 12
- 238000012544 monitoring process Methods 0.000 description 12
- 238000012360 testing method Methods 0.000 description 12
- 230000001457 vasomotor Effects 0.000 description 12
- 210000000459 calcaneus Anatomy 0.000 description 11
- 210000002465 tibial artery Anatomy 0.000 description 11
- 239000010410 layer Substances 0.000 description 10
- 230000035515 penetration Effects 0.000 description 10
- 208000005764 Peripheral Arterial Disease Diseases 0.000 description 9
- 208000030831 Peripheral arterial occlusive disease Diseases 0.000 description 9
- 210000004369 blood Anatomy 0.000 description 9
- 239000008280 blood Substances 0.000 description 9
- 238000001514 detection method Methods 0.000 description 9
- 238000013152 interventional procedure Methods 0.000 description 9
- 210000002414 leg Anatomy 0.000 description 9
- 230000003902 lesion Effects 0.000 description 9
- 238000012545 processing Methods 0.000 description 9
- 208000008960 Diabetic foot Diseases 0.000 description 8
- 210000003423 ankle Anatomy 0.000 description 8
- 230000036770 blood supply Effects 0.000 description 8
- 230000008569 process Effects 0.000 description 8
- 230000001681 protective effect Effects 0.000 description 8
- 238000012216 screening Methods 0.000 description 8
- 210000003813 thumb Anatomy 0.000 description 8
- 208000025865 Ulcer Diseases 0.000 description 7
- 238000002428 photodynamic therapy Methods 0.000 description 7
- 230000011664 signaling Effects 0.000 description 7
- 230000000007 visual effect Effects 0.000 description 7
- 238000004364 calculation method Methods 0.000 description 6
- 238000002512 chemotherapy Methods 0.000 description 6
- 230000006378 damage Effects 0.000 description 6
- 238000013461 design Methods 0.000 description 6
- 238000007726 management method Methods 0.000 description 6
- 239000000203 mixture Substances 0.000 description 6
- 239000002245 particle Substances 0.000 description 6
- 210000005259 peripheral blood Anatomy 0.000 description 6
- 239000011886 peripheral blood Substances 0.000 description 6
- 238000000926 separation method Methods 0.000 description 6
- 238000007619 statistical method Methods 0.000 description 6
- 231100000397 ulcer Toxicity 0.000 description 6
- 208000032064 Chronic Limb-Threatening Ischemia Diseases 0.000 description 5
- 230000008901 benefit Effects 0.000 description 5
- 230000003111 delayed effect Effects 0.000 description 5
- 238000010586 diagram Methods 0.000 description 5
- 230000000694 effects Effects 0.000 description 5
- 239000012530 fluid Substances 0.000 description 5
- 230000036541 health Effects 0.000 description 5
- 230000001771 impaired effect Effects 0.000 description 5
- 230000006872 improvement Effects 0.000 description 5
- 210000003141 lower extremity Anatomy 0.000 description 5
- 210000003205 muscle Anatomy 0.000 description 5
- 230000035945 sensitivity Effects 0.000 description 5
- GEVPIWPYWJZSPR-UHFFFAOYSA-N tcpo Chemical compound ClC1=CC(Cl)=CC(Cl)=C1OC(=O)C(=O)OC1=C(Cl)C=C(Cl)C=C1Cl GEVPIWPYWJZSPR-UHFFFAOYSA-N 0.000 description 5
- 230000035899 viability Effects 0.000 description 5
- 206010048554 Endothelial dysfunction Diseases 0.000 description 4
- 206010021143 Hypoxia Diseases 0.000 description 4
- 208000018262 Peripheral vascular disease Diseases 0.000 description 4
- 210000001736 capillary Anatomy 0.000 description 4
- 230000001010 compromised effect Effects 0.000 description 4
- 230000008694 endothelial dysfunction Effects 0.000 description 4
- 230000007954 hypoxia Effects 0.000 description 4
- 208000015181 infectious disease Diseases 0.000 description 4
- 238000002347 injection Methods 0.000 description 4
- 239000007924 injection Substances 0.000 description 4
- 229910052751 metal Inorganic materials 0.000 description 4
- 239000002184 metal Substances 0.000 description 4
- 201000001119 neuropathy Diseases 0.000 description 4
- 230000007823 neuropathy Effects 0.000 description 4
- 230000000399 orthopedic effect Effects 0.000 description 4
- 208000033808 peripheral neuropathy Diseases 0.000 description 4
- 230000002829 reductive effect Effects 0.000 description 4
- 230000004044 response Effects 0.000 description 4
- 239000003229 sclerosing agent Substances 0.000 description 4
- 238000012706 support-vector machine Methods 0.000 description 4
- 208000024891 symptom Diseases 0.000 description 4
- 230000009466 transformation Effects 0.000 description 4
- 230000007704 transition Effects 0.000 description 4
- 238000002604 ultrasonography Methods 0.000 description 4
- 208000032843 Hemorrhage Diseases 0.000 description 3
- 206010022562 Intermittent claudication Diseases 0.000 description 3
- 208000002193 Pain Diseases 0.000 description 3
- 230000009471 action Effects 0.000 description 3
- 208000034158 bleeding Diseases 0.000 description 3
- 230000000740 bleeding effect Effects 0.000 description 3
- 230000036772 blood pressure Effects 0.000 description 3
- 208000024980 claudication Diseases 0.000 description 3
- 238000000576 coating method Methods 0.000 description 3
- 230000007547 defect Effects 0.000 description 3
- 210000000852 deltoid muscle Anatomy 0.000 description 3
- 230000001419 dependent effect Effects 0.000 description 3
- 238000009795 derivation Methods 0.000 description 3
- 210000000624 ear auricle Anatomy 0.000 description 3
- 238000005516 engineering process Methods 0.000 description 3
- 238000011156 evaluation Methods 0.000 description 3
- 238000002594 fluoroscopy Methods 0.000 description 3
- 210000000474 heel Anatomy 0.000 description 3
- 238000003384 imaging method Methods 0.000 description 3
- 239000007943 implant Substances 0.000 description 3
- 208000014674 injury Diseases 0.000 description 3
- 230000010354 integration Effects 0.000 description 3
- 230000014759 maintenance of location Effects 0.000 description 3
- 230000004089 microcirculation Effects 0.000 description 3
- 238000012986 modification Methods 0.000 description 3
- 230000004048 modification Effects 0.000 description 3
- 238000010606 normalization Methods 0.000 description 3
- 230000036407 pain Effects 0.000 description 3
- 230000002980 postoperative effect Effects 0.000 description 3
- 238000004321 preservation Methods 0.000 description 3
- 238000001959 radiotherapy Methods 0.000 description 3
- 238000007634 remodeling Methods 0.000 description 3
- 210000002027 skeletal muscle Anatomy 0.000 description 3
- 230000004083 survival effect Effects 0.000 description 3
- 230000002123 temporal effect Effects 0.000 description 3
- 210000005166 vasculature Anatomy 0.000 description 3
- 210000003462 vein Anatomy 0.000 description 3
- 200000000007 Arterial disease Diseases 0.000 description 2
- 201000001320 Atherosclerosis Diseases 0.000 description 2
- 206010061688 Barotrauma Diseases 0.000 description 2
- 108091005515 EGF module-containing mucin-like hormone receptors Proteins 0.000 description 2
- LFQSCWFLJHTTHZ-UHFFFAOYSA-N Ethanol Chemical compound CCO LFQSCWFLJHTTHZ-UHFFFAOYSA-N 0.000 description 2
- 206010017711 Gangrene Diseases 0.000 description 2
- 102000001554 Hemoglobins Human genes 0.000 description 2
- 108010054147 Hemoglobins Proteins 0.000 description 2
- 206010020565 Hyperaemia Diseases 0.000 description 2
- 206010030113 Oedema Diseases 0.000 description 2
- 208000006735 Periostitis Diseases 0.000 description 2
- 208000012641 Pigmentation disease Diseases 0.000 description 2
- 238000000692 Student's t-test Methods 0.000 description 2
- 208000000558 Varicose Ulcer Diseases 0.000 description 2
- 208000009443 Vascular Malformations Diseases 0.000 description 2
- 230000004913 activation Effects 0.000 description 2
- 230000001154 acute effect Effects 0.000 description 2
- 230000032683 aging Effects 0.000 description 2
- 238000013528 artificial neural network Methods 0.000 description 2
- 238000013475 authorization Methods 0.000 description 2
- 230000005540 biological transmission Effects 0.000 description 2
- 210000000988 bone and bone Anatomy 0.000 description 2
- 210000003169 central nervous system Anatomy 0.000 description 2
- 230000008859 change Effects 0.000 description 2
- 239000011248 coating agent Substances 0.000 description 2
- 238000002591 computed tomography Methods 0.000 description 2
- 238000007405 data analysis Methods 0.000 description 2
- 238000013500 data storage Methods 0.000 description 2
- 230000034994 death Effects 0.000 description 2
- 238000001212 derivatisation Methods 0.000 description 2
- 230000006866 deterioration Effects 0.000 description 2
- 238000011161 development Methods 0.000 description 2
- 230000018109 developmental process Effects 0.000 description 2
- 239000003814 drug Substances 0.000 description 2
- 229940079593 drug Drugs 0.000 description 2
- 238000013535 dynamic contrast enhanced MRI Methods 0.000 description 2
- 238000013399 early diagnosis Methods 0.000 description 2
- 210000003743 erythrocyte Anatomy 0.000 description 2
- 210000003195 fascia Anatomy 0.000 description 2
- 239000011888 foil Substances 0.000 description 2
- 230000000004 hemodynamic effect Effects 0.000 description 2
- 230000002427 irreversible effect Effects 0.000 description 2
- 238000011542 limb amputation Methods 0.000 description 2
- 201000002818 limb ischemia Diseases 0.000 description 2
- 230000033001 locomotion Effects 0.000 description 2
- 230000007774 longterm Effects 0.000 description 2
- 239000011159 matrix material Substances 0.000 description 2
- 208000010125 myocardial infarction Diseases 0.000 description 2
- 230000001537 neural effect Effects 0.000 description 2
- 210000000056 organ Anatomy 0.000 description 2
- 206010033675 panniculitis Diseases 0.000 description 2
- 230000007170 pathology Effects 0.000 description 2
- 210000003460 periosteum Anatomy 0.000 description 2
- 231100000572 poisoning Toxicity 0.000 description 2
- 230000000607 poisoning effect Effects 0.000 description 2
- 239000004848 polyfunctional curative Substances 0.000 description 2
- 230000009979 protective mechanism Effects 0.000 description 2
- 230000005855 radiation Effects 0.000 description 2
- 208000022064 reactive hyperemia Diseases 0.000 description 2
- 238000002278 reconstructive surgery Methods 0.000 description 2
- 230000010410 reperfusion Effects 0.000 description 2
- 238000002271 resection Methods 0.000 description 2
- 238000000518 rheometry Methods 0.000 description 2
- 238000005070 sampling Methods 0.000 description 2
- 238000004611 spectroscopical analysis Methods 0.000 description 2
- 210000004304 subcutaneous tissue Anatomy 0.000 description 2
- 239000000126 substance Substances 0.000 description 2
- 230000035488 systolic blood pressure Effects 0.000 description 2
- 238000012353 t test Methods 0.000 description 2
- 230000001225 therapeutic effect Effects 0.000 description 2
- 230000036962 time dependent Effects 0.000 description 2
- 230000000699 topical effect Effects 0.000 description 2
- 238000000844 transformation Methods 0.000 description 2
- 230000008733 trauma Effects 0.000 description 2
- 230000001228 trophic effect Effects 0.000 description 2
- 238000012795 verification Methods 0.000 description 2
- ZQFGRJWRSLZCSQ-ZSFNYQMMSA-N verteporfin Chemical compound C=1C([C@@]2([C@H](C(=O)OC)C(=CC=C22)C(=O)OC)C)=NC2=CC(C(=C2C=C)C)=NC2=CC(C(=C2CCC(O)=O)C)=NC2=CC2=NC=1C(C)=C2CCC(=O)OC ZQFGRJWRSLZCSQ-ZSFNYQMMSA-N 0.000 description 2
- 229960003895 verteporfin Drugs 0.000 description 2
- 238000010146 3D printing Methods 0.000 description 1
- 208000022211 Arteriovenous Malformations Diseases 0.000 description 1
- 206010007560 Cardiac failure high output Diseases 0.000 description 1
- 208000024172 Cardiovascular disease Diseases 0.000 description 1
- 206010010356 Congenital anomaly Diseases 0.000 description 1
- 208000027205 Congenital disease Diseases 0.000 description 1
- 208000032131 Diabetic Neuropathies Diseases 0.000 description 1
- 208000032928 Dyslipidaemia Diseases 0.000 description 1
- 208000005189 Embolism Diseases 0.000 description 1
- 206010015866 Extravasation Diseases 0.000 description 1
- 238000000729 Fisher's exact test Methods 0.000 description 1
- WQZGKKKJIJFFOK-GASJEMHNSA-N Glucose Natural products OC[C@H]1OC(O)[C@H](O)[C@@H](O)[C@@H]1O WQZGKKKJIJFFOK-GASJEMHNSA-N 0.000 description 1
- 206010020649 Hyperkeratosis Diseases 0.000 description 1
- 206010020772 Hypertension Diseases 0.000 description 1
- 208000032382 Ischaemic stroke Diseases 0.000 description 1
- 206010024500 Limb malformation Diseases 0.000 description 1
- 208000017170 Lipid metabolism disease Diseases 0.000 description 1
- 208000008589 Obesity Diseases 0.000 description 1
- 241000935974 Paralichthys dentatus Species 0.000 description 1
- 208000031481 Pathologic Constriction Diseases 0.000 description 1
- 208000010378 Pulmonary Embolism Diseases 0.000 description 1
- 241001362551 Samba Species 0.000 description 1
- 208000034189 Sclerosis Diseases 0.000 description 1
- 206010070834 Sensitisation Diseases 0.000 description 1
- 206010040893 Skin necrosis Diseases 0.000 description 1
- 229920002125 Sokalan® Polymers 0.000 description 1
- 208000006011 Stroke Diseases 0.000 description 1
- 208000002847 Surgical Wound Diseases 0.000 description 1
- 208000007536 Thrombosis Diseases 0.000 description 1
- 208000032109 Transient ischaemic attack Diseases 0.000 description 1
- 206010057469 Vascular stenosis Diseases 0.000 description 1
- 230000002159 abnormal effect Effects 0.000 description 1
- 230000006978 adaptation Effects 0.000 description 1
- 239000012790 adhesive layer Substances 0.000 description 1
- 239000002390 adhesive tape Substances 0.000 description 1
- 230000002411 adverse Effects 0.000 description 1
- 238000011256 aggressive treatment Methods 0.000 description 1
- 229910052782 aluminium Inorganic materials 0.000 description 1
- XAGFODPZIPBFFR-UHFFFAOYSA-N aluminium Chemical compound [Al] XAGFODPZIPBFFR-UHFFFAOYSA-N 0.000 description 1
- 210000003484 anatomy Anatomy 0.000 description 1
- 239000002246 antineoplastic agent Substances 0.000 description 1
- 238000013459 approach Methods 0.000 description 1
- 238000000149 argon plasma sintering Methods 0.000 description 1
- 238000003491 array Methods 0.000 description 1
- 230000004872 arterial blood pressure Effects 0.000 description 1
- 230000005744 arteriovenous malformation Effects 0.000 description 1
- 210000000544 articulatio talocruralis Anatomy 0.000 description 1
- 230000003143 atherosclerotic effect Effects 0.000 description 1
- 210000001142 back Anatomy 0.000 description 1
- 230000004888 barrier function Effects 0.000 description 1
- 230000006399 behavior Effects 0.000 description 1
- 238000005452 bending Methods 0.000 description 1
- WQZGKKKJIJFFOK-VFUOTHLCSA-N beta-D-glucose Chemical compound OC[C@H]1O[C@@H](O)[C@H](O)[C@@H](O)[C@@H]1O WQZGKKKJIJFFOK-VFUOTHLCSA-N 0.000 description 1
- 230000002146 bilateral effect Effects 0.000 description 1
- 238000009530 blood pressure measurement Methods 0.000 description 1
- 210000004556 brain Anatomy 0.000 description 1
- 244000309466 calf Species 0.000 description 1
- 201000011510 cancer Diseases 0.000 description 1
- 230000009084 cardiovascular function Effects 0.000 description 1
- 230000015556 catabolic process Effects 0.000 description 1
- 239000000919 ceramic Substances 0.000 description 1
- 238000006243 chemical reaction Methods 0.000 description 1
- 239000003795 chemical substances by application Substances 0.000 description 1
- 238000000546 chi-square test Methods 0.000 description 1
- 210000001072 colon Anatomy 0.000 description 1
- 239000004020 conductor Substances 0.000 description 1
- 239000002872 contrast media Substances 0.000 description 1
- 230000002596 correlated effect Effects 0.000 description 1
- 239000002537 cosmetic Substances 0.000 description 1
- 230000008878 coupling Effects 0.000 description 1
- 238000010168 coupling process Methods 0.000 description 1
- 238000005859 coupling reaction Methods 0.000 description 1
- 229940127089 cytotoxic agent Drugs 0.000 description 1
- 230000006735 deficit Effects 0.000 description 1
- 238000003745 diagnosis Methods 0.000 description 1
- 238000002059 diagnostic imaging Methods 0.000 description 1
- 230000010339 dilation Effects 0.000 description 1
- 238000004141 dimensional analysis Methods 0.000 description 1
- 230000003292 diminished effect Effects 0.000 description 1
- 238000009826 distribution Methods 0.000 description 1
- 230000002497 edematous effect Effects 0.000 description 1
- 230000002500 effect on skin Effects 0.000 description 1
- 230000003073 embolic effect Effects 0.000 description 1
- 230000003511 endothelial effect Effects 0.000 description 1
- 230000007613 environmental effect Effects 0.000 description 1
- 210000003238 esophagus Anatomy 0.000 description 1
- 238000000802 evaporation-induced self-assembly Methods 0.000 description 1
- 230000036251 extravasation Effects 0.000 description 1
- 238000001506 fluorescence spectroscopy Methods 0.000 description 1
- 230000004907 flux Effects 0.000 description 1
- 239000006260 foam Substances 0.000 description 1
- 210000004744 fore-foot Anatomy 0.000 description 1
- 210000000199 free tissue flap Anatomy 0.000 description 1
- 210000001035 gastrointestinal tract Anatomy 0.000 description 1
- 239000008103 glucose Substances 0.000 description 1
- 238000001631 haemodialysis Methods 0.000 description 1
- 230000000322 hemodialysis Effects 0.000 description 1
- 208000019271 high output heart failure Diseases 0.000 description 1
- 230000004054 inflammatory process Effects 0.000 description 1
- 238000003780 insertion Methods 0.000 description 1
- 230000037431 insertion Effects 0.000 description 1
- 238000002697 interventional radiology Methods 0.000 description 1
- 230000005865 ionizing radiation Effects 0.000 description 1
- 210000003127 knee Anatomy 0.000 description 1
- 208000030175 lameness Diseases 0.000 description 1
- 230000013016 learning Effects 0.000 description 1
- 230000000670 limiting effect Effects 0.000 description 1
- 238000012417 linear regression Methods 0.000 description 1
- 238000004599 local-density approximation Methods 0.000 description 1
- 230000004807 localization Effects 0.000 description 1
- 210000005075 mammary gland Anatomy 0.000 description 1
- 230000007246 mechanism Effects 0.000 description 1
- 230000001404 mediated effect Effects 0.000 description 1
- 238000013160 medical therapy Methods 0.000 description 1
- 210000004088 microvessel Anatomy 0.000 description 1
- 230000002107 myocardial effect Effects 0.000 description 1
- 239000002086 nanomaterial Substances 0.000 description 1
- 230000008035 nerve activity Effects 0.000 description 1
- 208000015122 neurodegenerative disease Diseases 0.000 description 1
- 150000002825 nitriles Chemical class 0.000 description 1
- 238000012148 non-surgical treatment Methods 0.000 description 1
- 235000020824 obesity Nutrition 0.000 description 1
- 238000011275 oncology therapy Methods 0.000 description 1
- 230000003534 oscillatory effect Effects 0.000 description 1
- 230000003647 oxidation Effects 0.000 description 1
- 238000007254 oxidation reaction Methods 0.000 description 1
- 210000003695 paranasal sinus Anatomy 0.000 description 1
- 230000036961 partial effect Effects 0.000 description 1
- 230000037361 pathway Effects 0.000 description 1
- 239000000049 pigment Substances 0.000 description 1
- 229920001296 polysiloxane Polymers 0.000 description 1
- 238000002600 positron emission tomography Methods 0.000 description 1
- 238000007781 pre-processing Methods 0.000 description 1
- 230000002265 prevention Effects 0.000 description 1
- 208000037821 progressive disease Diseases 0.000 description 1
- 230000000750 progressive effect Effects 0.000 description 1
- 230000002035 prolonged effect Effects 0.000 description 1
- 208000002815 pulmonary hypertension Diseases 0.000 description 1
- 238000007674 radiofrequency ablation Methods 0.000 description 1
- 230000000637 radiosensitizating effect Effects 0.000 description 1
- 238000011084 recovery Methods 0.000 description 1
- 230000009467 reduction Effects 0.000 description 1
- 238000011160 research Methods 0.000 description 1
- 230000029058 respiratory gaseous exchange Effects 0.000 description 1
- 238000012552 review Methods 0.000 description 1
- 230000037390 scarring Effects 0.000 description 1
- 230000008313 sensitization Effects 0.000 description 1
- 238000002603 single-photon emission computed tomography Methods 0.000 description 1
- 210000000813 small intestine Anatomy 0.000 description 1
- 230000000391 smoking effect Effects 0.000 description 1
- 229960000776 sodium tetradecyl sulfate Drugs 0.000 description 1
- UPUIQOIQVMNQAP-UHFFFAOYSA-M sodium;tetradecyl sulfate Chemical compound [Na+].CCCCCCCCCCCCCCOS([O-])(=O)=O UPUIQOIQVMNQAP-UHFFFAOYSA-M 0.000 description 1
- 239000000243 solution Substances 0.000 description 1
- 238000010183 spectrum analysis Methods 0.000 description 1
- 230000002269 spontaneous effect Effects 0.000 description 1
- 230000036262 stenosis Effects 0.000 description 1
- 208000037804 stenosis Diseases 0.000 description 1
- 230000004936 stimulating effect Effects 0.000 description 1
- 230000000638 stimulation Effects 0.000 description 1
- 210000002784 stomach Anatomy 0.000 description 1
- 210000000434 stratum corneum Anatomy 0.000 description 1
- 210000000398 surgical flap Anatomy 0.000 description 1
- 230000002889 sympathetic effect Effects 0.000 description 1
- 238000012731 temporal analysis Methods 0.000 description 1
- 238000000015 thermotherapy Methods 0.000 description 1
- 230000002537 thrombolytic effect Effects 0.000 description 1
- 230000000451 tissue damage Effects 0.000 description 1
- 231100000827 tissue damage Toxicity 0.000 description 1
- 238000010937 topological data analysis Methods 0.000 description 1
- 231100000331 toxic Toxicity 0.000 description 1
- 230000002588 toxic effect Effects 0.000 description 1
- 238000012546 transfer Methods 0.000 description 1
- 201000010875 transient cerebral ischemia Diseases 0.000 description 1
- 238000011269 treatment regimen Methods 0.000 description 1
- 208000001072 type 2 diabetes mellitus Diseases 0.000 description 1
- 230000036269 ulceration Effects 0.000 description 1
- 210000001364 upper extremity Anatomy 0.000 description 1
- 210000000689 upper leg Anatomy 0.000 description 1
- 210000004291 uterus Anatomy 0.000 description 1
- 230000003966 vascular damage Effects 0.000 description 1
- 230000006492 vascular dysfunction Effects 0.000 description 1
- 238000007631 vascular surgery Methods 0.000 description 1
- 239000002550 vasoactive agent Substances 0.000 description 1
- 208000037997 venous disease Diseases 0.000 description 1
- 210000001835 viscera Anatomy 0.000 description 1
- 229910052724 xenon Inorganic materials 0.000 description 1
- FHNFHKCVQCLJFQ-UHFFFAOYSA-N xenon atom Chemical compound [Xe] FHNFHKCVQCLJFQ-UHFFFAOYSA-N 0.000 description 1
Images


Classifications
-
- A—HUMAN NECESSITIES
- A61—MEDICAL OR VETERINARY SCIENCE; HYGIENE
- A61B—DIAGNOSIS; SURGERY; IDENTIFICATION
- A61B5/00—Measuring for diagnostic purposes; Identification of persons
- A61B5/02—Detecting, measuring or recording pulse, heart rate, blood pressure or blood flow; Combined pulse/heart-rate/blood pressure determination; Evaluating a cardiovascular condition not otherwise provided for, e.g. using combinations of techniques provided for in this group with electrocardiography or electroauscultation; Heart catheters for measuring blood pressure
- A61B5/026—Measuring blood flow
- A61B5/0261—Measuring blood flow using optical means, e.g. infrared light
-
- A—HUMAN NECESSITIES
- A61—MEDICAL OR VETERINARY SCIENCE; HYGIENE
- A61B—DIAGNOSIS; SURGERY; IDENTIFICATION
- A61B5/00—Measuring for diagnostic purposes; Identification of persons
- A61B5/02—Detecting, measuring or recording pulse, heart rate, blood pressure or blood flow; Combined pulse/heart-rate/blood pressure determination; Evaluating a cardiovascular condition not otherwise provided for, e.g. using combinations of techniques provided for in this group with electrocardiography or electroauscultation; Heart catheters for measuring blood pressure
- A61B5/02007—Evaluating blood vessel condition, e.g. elasticity, compliance
-
- A—HUMAN NECESSITIES
- A61—MEDICAL OR VETERINARY SCIENCE; HYGIENE
- A61B—DIAGNOSIS; SURGERY; IDENTIFICATION
- A61B5/00—Measuring for diagnostic purposes; Identification of persons
- A61B5/68—Arrangements of detecting, measuring or recording means, e.g. sensors, in relation to patient
- A61B5/6801—Arrangements of detecting, measuring or recording means, e.g. sensors, in relation to patient specially adapted to be attached to or worn on the body surface
- A61B5/6813—Specially adapted to be attached to a specific body part
- A61B5/6829—Foot or ankle
-
- A—HUMAN NECESSITIES
- A61—MEDICAL OR VETERINARY SCIENCE; HYGIENE
- A61B—DIAGNOSIS; SURGERY; IDENTIFICATION
- A61B5/00—Measuring for diagnostic purposes; Identification of persons
- A61B5/68—Arrangements of detecting, measuring or recording means, e.g. sensors, in relation to patient
- A61B5/6801—Arrangements of detecting, measuring or recording means, e.g. sensors, in relation to patient specially adapted to be attached to or worn on the body surface
- A61B5/683—Means for maintaining contact with the body
- A61B5/6832—Means for maintaining contact with the body using adhesives
-
- G—PHYSICS
- G16—INFORMATION AND COMMUNICATION TECHNOLOGY [ICT] SPECIALLY ADAPTED FOR SPECIFIC APPLICATION FIELDS
- G16H—HEALTHCARE INFORMATICS, i.e. INFORMATION AND COMMUNICATION TECHNOLOGY [ICT] SPECIALLY ADAPTED FOR THE HANDLING OR PROCESSING OF MEDICAL OR HEALTHCARE DATA
- G16H50/00—ICT specially adapted for medical diagnosis, medical simulation or medical data mining; ICT specially adapted for detecting, monitoring or modelling epidemics or pandemics
- G16H50/20—ICT specially adapted for medical diagnosis, medical simulation or medical data mining; ICT specially adapted for detecting, monitoring or modelling epidemics or pandemics for computer-aided diagnosis, e.g. based on medical expert systems
-
- A—HUMAN NECESSITIES
- A61—MEDICAL OR VETERINARY SCIENCE; HYGIENE
- A61B—DIAGNOSIS; SURGERY; IDENTIFICATION
- A61B5/00—Measuring for diagnostic purposes; Identification of persons
- A61B5/0059—Measuring for diagnostic purposes; Identification of persons using light, e.g. diagnosis by transillumination, diascopy, fluorescence
- A61B5/0075—Measuring for diagnostic purposes; Identification of persons using light, e.g. diagnosis by transillumination, diascopy, fluorescence by spectroscopy, i.e. measuring spectra, e.g. Raman spectroscopy, infrared absorption spectroscopy
-
- A—HUMAN NECESSITIES
- A61—MEDICAL OR VETERINARY SCIENCE; HYGIENE
- A61B—DIAGNOSIS; SURGERY; IDENTIFICATION
- A61B5/00—Measuring for diagnostic purposes; Identification of persons
- A61B5/02—Detecting, measuring or recording pulse, heart rate, blood pressure or blood flow; Combined pulse/heart-rate/blood pressure determination; Evaluating a cardiovascular condition not otherwise provided for, e.g. using combinations of techniques provided for in this group with electrocardiography or electroauscultation; Heart catheters for measuring blood pressure
- A61B5/026—Measuring blood flow
- A61B5/0265—Measuring blood flow using electromagnetic means, e.g. electromagnetic flowmeter
-
- A—HUMAN NECESSITIES
- A61—MEDICAL OR VETERINARY SCIENCE; HYGIENE
- A61B—DIAGNOSIS; SURGERY; IDENTIFICATION
- A61B5/00—Measuring for diagnostic purposes; Identification of persons
- A61B5/68—Arrangements of detecting, measuring or recording means, e.g. sensors, in relation to patient
- A61B5/6801—Arrangements of detecting, measuring or recording means, e.g. sensors, in relation to patient specially adapted to be attached to or worn on the body surface
- A61B5/683—Means for maintaining contact with the body
- A61B5/6831—Straps, bands or harnesses
-
- A—HUMAN NECESSITIES
- A61—MEDICAL OR VETERINARY SCIENCE; HYGIENE
- A61B—DIAGNOSIS; SURGERY; IDENTIFICATION
- A61B5/00—Measuring for diagnostic purposes; Identification of persons
- A61B5/72—Signal processing specially adapted for physiological signals or for diagnostic purposes
- A61B5/7235—Details of waveform analysis
- A61B5/7246—Details of waveform analysis using correlation, e.g. template matching or determination of similarity
-
- A—HUMAN NECESSITIES
- A61—MEDICAL OR VETERINARY SCIENCE; HYGIENE
- A61B—DIAGNOSIS; SURGERY; IDENTIFICATION
- A61B5/00—Measuring for diagnostic purposes; Identification of persons
- A61B5/72—Signal processing specially adapted for physiological signals or for diagnostic purposes
- A61B5/7235—Details of waveform analysis
- A61B5/7253—Details of waveform analysis characterised by using transforms
- A61B5/7257—Details of waveform analysis characterised by using transforms using Fourier transforms
-
- A—HUMAN NECESSITIES
- A61—MEDICAL OR VETERINARY SCIENCE; HYGIENE
- A61B—DIAGNOSIS; SURGERY; IDENTIFICATION
- A61B5/00—Measuring for diagnostic purposes; Identification of persons
- A61B5/72—Signal processing specially adapted for physiological signals or for diagnostic purposes
- A61B5/7235—Details of waveform analysis
- A61B5/7253—Details of waveform analysis characterised by using transforms
- A61B5/726—Details of waveform analysis characterised by using transforms using Wavelet transforms
-
- A—HUMAN NECESSITIES
- A61—MEDICAL OR VETERINARY SCIENCE; HYGIENE
- A61B—DIAGNOSIS; SURGERY; IDENTIFICATION
- A61B5/00—Measuring for diagnostic purposes; Identification of persons
- A61B5/72—Signal processing specially adapted for physiological signals or for diagnostic purposes
- A61B5/7271—Specific aspects of physiological measurement analysis
- A61B5/7282—Event detection, e.g. detecting unique waveforms indicative of a medical condition
Landscapes
- Health & Medical Sciences (AREA)
- Life Sciences & Earth Sciences (AREA)
- Engineering & Computer Science (AREA)
- Medical Informatics (AREA)
- Public Health (AREA)
- Biomedical Technology (AREA)
- Physics & Mathematics (AREA)
- Pathology (AREA)
- General Health & Medical Sciences (AREA)
- Heart & Thoracic Surgery (AREA)
- Molecular Biology (AREA)
- Surgery (AREA)
- Animal Behavior & Ethology (AREA)
- Biophysics (AREA)
- Veterinary Medicine (AREA)
- Physiology (AREA)
- Cardiology (AREA)
- Hematology (AREA)
- Vascular Medicine (AREA)
- Data Mining & Analysis (AREA)
- Databases & Information Systems (AREA)
- Epidemiology (AREA)
- Primary Health Care (AREA)
- Artificial Intelligence (AREA)
- Computer Vision & Pattern Recognition (AREA)
- Psychiatry (AREA)
- Signal Processing (AREA)
- Mathematical Physics (AREA)
- Electromagnetism (AREA)
- Spectroscopy & Molecular Physics (AREA)
- Measuring Pulse, Heart Rate, Blood Pressure Or Blood Flow (AREA)
- Measuring And Recording Apparatus For Diagnosis (AREA)
- External Artificial Organs (AREA)
- Investigating Or Analysing Materials By Optical Means (AREA)
- Magnetic Resonance Imaging Apparatus (AREA)
Abstract
Systems and methods for assessing revascularization are disclosed herein. In some cases, the method may include one or more of the following steps: measuring blood perfusion as a function of time to obtain time-series data, mathematically transforming the time-series data into a power spectrum, calculating at least one parameter of the power spectrum within a specific frequency range, and distinguishing the at least one calculated parameter from the first population and the second population.
Description
The present application is a divisional application having a parent application with application number 2014800542145 and application date 2014 8/14 entitled "system and method for assessing revascularization".
Technical Field
The present disclosure relates to measurement of blood flow in tissues, particularly in the feet or other extremities.
Background
Rapidly aging populations in developed countries lead to an increased prevalence of age-related degenerative diseases, such as peripheral arterial disease and type 2 diabetes. Manifestations of these diseases include tissue ischemia, chronic wounds, and diabetic foot ulcers, where lack of appropriate treatment may lead to infection, gangrene, and in the case of foot ischemia, partial or complete amputation of one or both feet.
Peripheral Arterial Disease (PAD) is a progressive disease in which narrowed or blocked arteries reduce blood flow to the extremities. PAD can result from atherosclerosis, inflammatory processes leading to stenosis, embolism or thrombosis and is associated with smoking, diabetes, dyslipidemia and hypertension. PAD, if untreated, can lead to Critical Limb Ischemia (CLI), where blood flow to the extremities (usually the legs and feet) is impaired to the extent that: tissue damage causes the ensuing ulcer, gangrene or limb defect. PAD patients are also at disproportionately high risk of other cardiovascular diseases such as myocardial infarction and stroke, and death as a consequence of these diseases. With the worldwide increase in the incidence of diabetes, the treatment of CLI and the prevention of disability and limb impairment caused by it has become a significant health priority.
Peripheral vascular intervention procedures using intravascular (minimally invasive) intervention, open surgery, or a combination of both, are the only currently available methods to restore perfusion to the extremities of PAD patients. Medical management can only help to slow the progression of the disease, if at all. However, clinicians currently lack intraoperative tools to properly assess perfusion in real time at the affected tissue (typically on the foot) to reliably guide the performance of an interventional procedure. Prior techniques for measuring blood perfusion include Skin Perfusion Pressure (SPP), Doppler Ultrasound (DUX), and transcutaneous blood oxygen monitoring (TCOM). Each technique has one or more disadvantages. SPP only provides perfusion data in the dermal layer of the skin, requires that skin temperature be normalized to 44 ℃, is affected by skin pigmentation, and is unreliable for edematous patients. SPP also requires the use of a pressure cuff, which further limits its utility as a real-time perfusion assessment tool during peripheral vascular interventional procedures. DUX did not assess tissue perfusion, but measured blood flow in large vessels (>1.5 mm). TCOM requires the patient to be placed in hyperbaric oxygen making it incompatible with a catheter/operating room. Furthermore, TCOM does not provide real-time revascularization data because it takes about 4 to 6 weeks to reach equilibrium for the measurement.
There is therefore a need for non-invasive real-time measurements of blood perfusion within a range of vessel sizes and in the tissue supplied by these vessels. In particular, there is a need for non-invasive real-time measurement of blood perfusion in the foot that can be reliably performed while an interventional procedure is in progress and used to inform decision makers during the procedure.
Ischemia is a disease in which a restriction in the blood supply to a tissue results in a shortage of oxygen and glucose, causing irreversible damage to the tissue. If found too late, reperfusion of blood by various treatment regimens, thrombolysis or surgery would only further increase the damage to the tissue, rather than save the tissue. For example, one of the most common sites of ischemia is the foot. In this case, early detection and diagnosis of an ischemic foot at risk is imperative, before the injury becomes irreversible. Currently, the most common way to diagnose ischemic feet is ABI (ankle brachial index), which compares the blood pressure of the arm with the blood pressure of the ankle. In some cases, an ABI measurement of less than 0.9 is indicative of an ischemic foot. However, ABI measurements are highly dependent on operator protocol, i.e. different values can be obtained when measurements are performed on a subject who is sitting or supine or when the operator uses different measurement protocols/equipment. ABI also produces a measure of false increases in patients with diabetes, calcified vessels in patients undergoing hemodialysis, or if there is extensive distal arterial damage below the ankle joint (Yamada et al, J VASC Surg 2008; 47: 318-23).
Chronic wounds are non-healing wounds that show little or no improvement after four weeks or do not heal within eight weeks. In practice, patients may have chronic wounds that remain open for more than a year. There are 3700 tens of thousands of people worldwide affected by chronic wounds, mainly in the lower extremities. In the united states alone, chronic wounds have affected 650 million patients and cost $ 14 million in 2010. Since chronic wounds are associated with aging diseases such as diabetes and obesity, the need for medical care for chronic wound management has increased with increased acceptance by the elderly in developed countries. Early diagnosis of chronic ischemic wounds of the lower extremities is particularly important because it has a major impact in determining whether conservative wound management (e.g. bandages and moist dressings) is adequate, or whether more aggressive treatment is required to prevent further wound deterioration so that amputation may occur, etc.
Conservative treatment of wounds (e.g., bandage moist dressings) is sufficient to promote wound healing if blood perfusion of the tissue surrounding the wound is not compromised beyond a minimum threshold at which passive healing occurs. In cases where perfusion is compromised, however, improper use of conservative wound therapy can result in a time lag between the first appearance of a wound in a clinical setting and effective therapy commensurate with the severity of the wound condition.
The only most important determinant of tissue viability in a wound is its blood supply. The ability to assess blood perfusion around the wound bed allows clinical decisions to be made: (a) if the tissue is viable, conservative therapy is continued, or (b) if the blood perfusion is too severely compromised to be successfully conservative therapy, earlier progress is made to more advanced wound care products such as chemical debriders, or advanced wound therapy such as topical negative pressure, hyperbaric oxygen therapy ("HBOT"), etc. In appropriate cases, the patient may undergo revascularization directly by peripheral interventional surgery. Therefore, a blood perfusion monitor that can facilitate early placement of a patient into conservative or aggressive wound therapy is highly desirable.
HBOT involves the administration of oxygen at 2-2.5 times sea level in a hyperbaric chamber. Patients may be prescribed up to 40 HBOTs, and usually 3-4 times per week, to maximize oxygen delivery to chronic wound tissue. Such treatments are expensive and not without risk; side effects include barotrauma to the ear and sinuses, paranasal sinuses, and central nervous system oxygen poisoning. (AVIAT Space Environ Med., 2000; 71 (2): 119-24). In addition, a retrospective study of 1144 patients (Wound Rep Reg 2002; 10: 198- & 207) indicated that 24.4% of chronic Wound patients did not benefit from this study. Thus, a diagnostic device that is better able to predict the success of hyperbaric oxygen therapy in chronic wound treatment would help avoid unnecessary and useless treatments and achieve significant cost savings in a medical system.
In the case of ischemic feet requiring amputation, there is a need for a new diagnostic tool that better guides decisions about the level of amputation by predicting the potential success of amputation wound healing. Amputation is usually performed on patients with critical limb ischemia who cannot be treated with revascularization surgery, or on patients with diabetic progressive ulcers or venous ulcers. About 85-90% of lower limb amputations in developed countries are caused by peripheral vascular disease, and poor wound healing accounts for 70% of the problematic conditions caused by amputations. Due to the lack of optimized tools to predict amputation healing, physicians must make subjective judgments about the optimal amputation position, and since the pressure is to maximize the preservation of the limb, it is not uncommon for patients to require subsequent amputations with taller legs when the first amputation wound fails to heal. The rate of healing of below-knee amputations ranges between 30 and 92%, while the rate of re-amputation is as high as 30%. Therefore, there is a need for accurate tools for predicting successful amputation healing to help physicians more accurately determine the location of the amputation, which will result in maximum limb preservation while avoiding the trauma and cost of re-amputation.
Tissue flaps are commonly used to cover defects in wounds during surgery, particularly in orthopedics. They may be pedicled flaps (i.e., having their own vascular pedicles to supply blood to the flap), or free flaps (i.e., free flaps) that require connection to the microvasculature of the receiving site to ensure adequate blood supply. Both types of skin flaps are extremely dependent on blood perfusion therein to make the flap viable. The need for close monitoring of flap perfusion, especially within the first few hours to days after reconstructive surgery, and the early detection of perfusion loss will help guide the patient to further surgery as needed to ensure continued viability of the flap. It would therefore be useful if a diagnostic tool could potentially be used to continuously monitor the blood perfusion of a flap during the post-operative phase and prevent the loss of the flap due to delayed detection of ischemia of the flap.
Currently, diagnostic devices for wound care on the market include doppler ultrasound (e.g. as described in EP0814700a 1), transcutaneous oxygen monitors (TCOM or TcPO)2) (as described for example in WO1980002795a 1) and skin perfusion pressure gauges (SPP) (as described for example in CA 2238512C), each of which has serious disadvantages that limit the effectiveness of applying the correct therapy to chronic wound patients. Doppler ultrasound only measures in large vessels (>1.5 mm). TCOM measurements do not correlate optimally with the state of the Wound (Wound 2009; 21 (11): 310-. This is particularly true for TCOM measurements, as it is affected by a number of factors, including local edema, anatomical localization, thickness of the epidermal stratum corneum and leg dependence (Figoni et al, J.Rehab Research Development 2006; 43(7) 891-. Furthermore, the test results are heavily influenced by humidity and temperature levels (Podiatry Today 2012; 25(7) 84-92). Lo et al (Wound 2009: 21(11)310-316) reported that skin perfusion pressure (measured by laser Doppler) appears to be a more accurate predictor of Wound healing versus TcPO 2; SPP, however, can only provide data of limited depth and requires normalization of skin temperature to 44 ℃, which is sensitive to skin pigments and unreliable for edema.
More recently, the use of Diffuse Speckle Contrast Analysis (DSCA) to measure blood perfusion in real time in units of absolute BFI ("blood flow index") in tissue depths up to 2 centimeters (2cm) has been developed (for more detailed description see U.S. provisional application No. 61/755700 filed on 23/1/2013 and U.S. provisional application No. 61/830256 filed on 3/6/2013, which are incorporated herein by reference in their entirety). The focus of the present application is the use of DSCA to generate additional information, such as low frequency oscillation data that can form the basis of a calibration index, which can guide clinical decisions in the treatment of ischemia.
Disclosure of Invention
A system for assessing peripheral blood flow during a peripheral vascular intervention, the system comprising: a support structure configured to be positioned on a patient's foot; a Diffuse Optical Flow (DOF) sensor carried by the support structure; an analyzer configured to analyze data from the DOF sensor for determining absolute and/or relative blood flow at a location near the DOF sensor when the support structure is positioned at the patient's foot; and a feedback device configured to provide a signal indicative of the absolute and/or relative blood flow determined by the analyzer.
In some embodiments, the support structure may include a retaining ring and an adhesive material, or only an adhesive material. In some embodiments, the support structure may include a strap with the DOF sensor attached thereto. In some embodiments, the DOF sensors may be arranged such that when the support structure is positioned on a patient foot, at least two DOF sensors are on different topographical regions of the foot including different foot vessel regions. In some embodiments, the DOF sensors may be arranged such that when the support structure is positioned on a patient foot, at least five DOF sensors are on different topological regions of the foot including different foot vessel regions. In some embodiments, the analyzer may include a software autocorrelator. In some embodiments, the analyzer may include a hardware autocorrelator. In some embodiments, the signal indicative of absolute and/or relative blood flow may be visual, auditory, or tactile. In some embodiments, the system may be configured to provide signals indicative of absolute and/or relative blood flow in substantially real time. In some embodiments, the system may be configured to provide a signal indicative of absolute and/or relative blood flow within 1 second from the measurement.
Also disclosed herein is a method for real-time assessment of peripheral blood flow during a peripheral vascular interventional procedure, the method comprising: disposing at least one Diffuse Optical Flow (DOF) sensor near a location on a patient's foot; obtaining measurements of intensity fluctuations from the DOF sensor; analyzing the obtained measurements to determine absolute and/or relative blood flow rates at the location; and signaling the determined absolute and/or relative blood flow rate to an operator.
In some embodiments, the step of providing the at least one DOF sensor comprises placing a support structure on a patient's foot, the DOF sensor being carried by the support structure. In some embodiments, the method may further include positioning a plurality of DOF sensors near a corresponding plurality of locations on the patient's foot. In some embodiments, the plurality of locations includes at least two, three, four, five, or more locations corresponding to different topological locations in the foot including different foot vessel regions. In some embodiments, the plurality of locations includes at least five locations corresponding to five different topological locations in the foot including different foot vessel regions. In some embodiments, the step of signaling comprises providing a visual, audible or tactile indicia representative of absolute and/or relative blood flow. In some embodiments, said step of signaling the determined absolute and/or relative blood flow rate to the operator may be performed in less than 1 second from the measurement.
Also disclosed is a method of assessing peripheral blood flow during a peripheral vascular interventional procedure, the method comprising: disposing a plurality of Diffuse Optical Flow (DOF) sensors near a respective plurality of locations on a patient's body extremity, wherein at least two locations correspond to different topological locations in the foot including different foot vessel regions; determining an absolute and/or relative blood flow rate at each of a plurality of locations at the end of the patient's body; and signaling the determined absolute and/or relative blood flow rate to an operator.
In some embodiments, the body end is a foot. In some embodiments, the body end is a hand. In some embodiments, the step of signaling is performed in substantially real time. In some embodiments, the determined absolute and/or relative blood flow rates may be utilized to assess the efficacy of the interventional procedure.
Also disclosed herein is a patient interface for supporting a plurality of Diffuse Optical Flow (DOF) sensors in optical communication with a patient's foot, comprising: a bracket configured to be mountable on and carried by a foot; at least three DOF sensors carried by the stent, each sensor corresponding to a separate topological location in the foot comprising a vascular region selected from the group consisting of: the plantar medial arterial blood vessel region; a transverse plantar artery vascular region; the vascular region of the calcaneal branch of the posterior tibial artery; the vascular region of the calcaneal branch of the peroneal artery; and the vascular area of the dorsalis pedis artery.
In some embodiments, the patient interface may comprise at least four sensors carried by the stent, each sensor corresponding to a separate topological location in the foot comprising a vascular region selected from the group consisting of. In some embodiments, the stent may include a retaining ring and an adhesive material. In some embodiments, the holder may include an optical source fiber and an optical detector fiber. In some embodiments, the source optical fiber and the photodetector optical fiber may further comprise at least one coupler for releasably coupling the sensor to an analyzer. In some embodiments, the patient interface may include a fiber optic cable including a plurality of pairs of source optical fibers and photodetector optical fibers, each pair connected to a separate sensor. In some embodiments, each sensor is releasably carried by the bracket.
Also disclosed herein is a system for evaluating peripheral blood perfusion, the system comprising: a support structure configured to be positioned on a foot of a patient; a diffuse light sensor carried by the support structure; an analyzer configured to analyze data from the diffuse light sensor to characterize blood flow or composition at a location proximate the diffuse light sensor when the support structure is positioned on the patient's foot; and feedback means configured to provide a signal indicative of said blood flow or composition determined by the analyzer.
Also disclosed herein is a method for real-time assessment of peripheral blood, the method comprising: disposing at least one diffuse light sensor near a location on a patient's foot; obtaining a measurement of scattered light; analysing the resulting measurements to characterise the blood flow rate and/or composition at the location; and signaling the determined flow rate and/or composition to an operator.
Also disclosed is a method for assessing peripheral blood flow during a peripheral vascular interventional procedure, the method comprising: providing a respective plurality of diffuse light sensors near a plurality of locations at an end of a patient's body, wherein at least two locations correspond to different topological locations in the foot including different foot vessel regions; characterizing a blood flow rate and/or composition at each of a plurality of locations at an end of a patient's body; and signaling the blood flow rate and/or composition to an operator.
Also disclosed herein is a patient interface for supporting a plurality of diffuse light sensors in optical communication with a patient's foot, comprising: a bracket configured to be mountable on and carried by a foot; at least three sensors carried by the stent, each sensor corresponding to a separate topological location in the foot comprising a vascular region selected from the group consisting of: the plantar medial arterial blood vessel region; a transverse plantar artery vascular region; the vascular region of the calcaneal branch of the posterior tibial artery; the vascular region of the calcaneal branch of the peroneal artery; and the vascular area of the dorsalis pedis artery.
A system for using a low frequency oscillation index ("LFI") as a diagnostic indicator of ischemic tissue management in blood flow measurements is disclosed. In some embodiments, blood perfusion may be measured as a function of time to provide time series data. Measurement of blood perfusion can be achieved by a number of different techniques, including but not limited to: scattering correlation spectroscopy (DCS), speckle contrast analysis (DSCA), diffuse optical tomography, near infrared spectroscopy, or doppler flow meters. In some embodiments, blood perfusion may be measured using non-optical techniques, such as by electrical or magnetic blood flow measurement techniques. In some embodiments, blood perfusion can be measured at a depth of at least about 1 millimeter below the skin. In some embodiments, blood perfusion can be measured at a depth of at least about 3 millimeters below the skin. In some embodiments, blood perfusion can be measured at a depth of at least about 5 millimeters below the skin. The tissue of interest may be in the lower limb generally, particularly if the system is used to assess peripheral vascular disease. In other applications, the tissue of interest may be a surgical tissue flap used in orthopedic surgery.
The resulting time series data can then be analyzed to obtain relevant parameters for use in clinical applications. For example, the time series data may be transformed into a power spectrum. In some embodiments, the time series data may be transformed into a power spectrum using a fourier transform. In some embodiments, a fast fourier transform may be used. In other embodiments, the power spectrum may be obtained using a wavelet transform.
Once the power spectrum is obtained, one or more parameters may be calculated and used to guide clinical decisions. In some embodiments, the parameter may be calculated from the power spectrum over a particular frequency range. In some embodiments, the frequency range may be between about 0.001 hertz and about 1000 hertz, between about 0.001 hertz and about 0.1 hertz, between about 0.045 hertz and about 0.01 hertz, or between about 0.001 hertz and 0.045 hertz. The calculated parameter may be the area under the power spectrum curve in a specific frequency range. In some embodiments, the calculated parameter may be the local maximum power of the power spectrum in a particular frequency range.
In other embodiments, the calculated parameter may be a Pearson correlation coefficient calculated between time series data of blood flow obtained from at least two locations of the patient. In some cases, the two locations may be the calcaneus and the arm, respectively. In other cases, the location may be the medial plantar aspect and the arm.
In yet another embodiment, the calculated parameter may be a Pearson correlation coefficient calculated between frequency domain spectra obtained from at least two locations of the patient.
In some embodiments, the calculated parameter may be relative power.
In some embodiments, the calculated parameters may be processed by a State Vector Machine (SVM).
The calculated parameters can then be used in any of a number of clinical assessments. For example, the calculated parameters may be used to distinguish between healthy and ischemic limbs, such as healthy and ischemic feet. This parameter may be used in some embodiments to identify patients who may have endothelial or other vascular dysfunction that may affect wound healing. In some embodiments, the calculated parameters may be used to screen claudication patients for interventional therapy. In some embodiments, the calculated parameters may be used to predict the likelihood of success of conservative wound therapy. In some embodiments, the calculated parameters may be used to determine the need for advanced wound treatment or interventional procedures, such as balloon angioplasty or vascular surgery. The calculated parameters may also be used in some embodiments to predict the likelihood of success in amputation healing. In some embodiments, the calculated parameters may be used to predict the likelihood of success of hyperbaric oxygen therapy for the treatment of chronic wound healing. In some embodiments, the calculated parameters may be used to predict the likelihood of success of a surgical skin flap. In some embodiments, the calculated parameters may be used to predict the uptake of a drug.
The measurements may be obtained locally at a target site, such as a patient's foot. In some embodiments, mathematical transformations of the time series data and/or calculation of the parameters may also be performed locally. In some embodiments, the mathematical transformation and/or calculation of the parameters may be performed remotely from the measurement site. For example, measurements may be obtained locally, and the obtained time series data may be sent to a remote location for further processing. In some embodiments, this may enable remote monitoring of the patient. The time series data may be obtained by a probe worn by the patient, while a monitoring physician or other individual may be remotely located and the resulting time series data may be received for further processing and evaluation. In various embodiments, the processing (e.g., mathematical transformations and parameter calculations) may be performed in software, in hardware, or in some combination thereof. In some embodiments, the processing may be performed on a local device, such as a general purpose computer, while in other embodiments the processing may be performed over a distributed network.
Also disclosed herein is a system for distinguishing between at least a first population and a second population. The system may include one or more processors configured to receive blood perfusion measurements as a function of time to obtain time series data; mathematically transforming the time series data into a power spectrum; calculating at least one parameter of the power spectrum in a specific frequency range; and/or using the at least one calculated parameter as a difference between the first population and the second population. The first population and the second population may comprise two patient populations, e.g., a healthy control group and an ischemic population. The system may further comprise at least one optical and/or non-optical sensor configured to measure blood perfusion as a function of time. The optical sensor may comprise a diffuse optical flow sensor. The processor may be configured to mathematically transform the time series data into a power spectrum using a fourier transform, a fast fourier transform, or a wavelet transform. The particular frequency range may be, for example, between about 0.001 hertz and about 1000 hertz, between about 0.001 hertz and about 0.1 hertz, between about 0.045 hertz and about 0.1 hertz, or between about 0.001 hertz and 0.045 hertz. The parameter may be, for example, the area under the power spectrum curve in a particular frequency range, or the local maximum power of the power spectrum in the frequency range of interest.
Also disclosed herein is a method for distinguishing between at least a first population and a second population. The method may comprise the steps of: measuring blood perfusion as a function of time to obtain time series data; calculating statistical parameters from the time series data; and using at least one of said statistical parameters as a difference between said first population and said second population.
In some embodiments, various statistical parameters may be determined from the obtained data relating to blood flow of one, two or more patients or patient populations, including one or more of standard deviation, mean, median, mode, correlation coefficient, linear regression, Z score (Z score), P value (P value), Chi-Squared test, and Fisher's exact test.
Blood flow may be measured using optical (e.g., scattering optics) and/or non-optical flow sensors. A system for distinguishing between at least a first population and a second population is also disclosed. The system may include a processor module configured to receive blood perfusion measurements as a function of time to obtain time series data; calculating at least one statistical parameter from the time series data; a frequency range; and using at least one calculated parameter as a difference between the first population and the second population. The sensor may be configured to send the blood perfusion measurement to the processor through a wired or wireless connection.
Also disclosed herein is a computer-implemented method for distinguishing between at least a first population and a second population. The method may include any number of the following steps: detecting a blood flow rate at a first anatomical location; sending data relating to the blood flow rate to a module; detecting blood perfusion at a second anatomical location; determining a second blood flow index at a second anatomical location; calculating a ratio of the first blood flow index to the second blood flow index; and determining whether the ratio corresponds to a characteristic of the first population or the second population by comparing the ratio to a predetermined threshold. The method may further comprise the step of providing a signal to an operator related to the ratio. The first anatomical location may be a foot and the second anatomical location may be a location that is not directly perfused by an artery of the foot. The second anatomical location may be selected from the group consisting of: thumb, earlobe, upper arm, and thenar. The first population may be, for example, an ischemic population and the second population may be, for example, a non-ischemic population.
Also disclosed herein is a system for distinguishing between at least a first population and a second population. The system may include a processor configured to perform one or more of the following: receiving blood perfusion data from a first sensor at a first anatomical location; determining a first blood flow index at a first anatomical location; receiving blood perfusion data of a second sensor at a second anatomical location; determining a second blood flow index at a second anatomical location; calculating a ratio of the first blood flow index to the second blood flow index; and determining whether the ratio corresponds to a characteristic of the first population or the second population by comparing the ratio to a predetermined threshold. The system may further include a first sensor configured to obtain blood perfusion data from a first anatomical location, and a second sensor configured to obtain blood perfusion data from a second anatomical location.
Also disclosed herein is a computer-implemented method for distinguishing between at least a first population and a second population. The method may include any number of the following steps: detecting a blood flow rate at the first anatomical location; sending data related to the blood flow rate to a module configured to analyze the data related to the blood flow rate; calculating a value derived from data relating to the blood flow rate; determining whether the calculated value corresponds to a characteristic of the first population or the second population by comparing the ratio to a predetermined threshold; and providing a signal related to the calculated value to an operator. The first anatomical location may be a foot. The calculation of the value may include calculating a statistical parameter from data related to the blood flow rate, or characterizing the blood flow rate as a function of a particular time interval. The statistical parameter may be, for example, the standard deviation. The method may further comprise calculating the value, including calculating a power spectrum from data relating to the blood flow rate, or calculating a ratio derived from data relating to the blood flow rate.
Also disclosed herein is a system for distinguishing between at least a first population and a second population. The system may include any number of the following: a module configured to receive blood flow rate data from a first sensor at a first anatomical location; calculating a value derived from data relating to the blood flow rate; determining whether the calculated value corresponds to a characteristic of the first population or the second population by comparing the ratio to a predetermined threshold; and providing a signal to the operator related to the calculated value.
Drawings
Fig. 1A shows the vascular area of the foot.
Fig. 1B shows five measurement points on the foot, each point corresponding to one of the vessel regions shown in fig. 1A.
Fig. 1C shows the arterial branch supplying the vascular region of the foot.
Fig. 1D to 1H show measurements with a Diffuse Optical Flow (DOF) sensor at each of the five measurement positions of fig. 1B.
Fig. 2 is a block diagram of a system for measuring the flow of a turbid medium.
FIG. 3 is a schematic illustration of diffuse light penetration and detection in multiple layers of tissue.
Fig. 4 is a graph of autocorrelation functions for different flow rates.
Fig. 5A is a graph of two Blood Flow Indices (BFIs) during a cuff occlusion protocol.
Fig. 5B is a graph illustrating a derived autocorrelation function of the two BFIs of fig. 5A.
Fig. 6 is a graph of two BFIs during a cuff occlusion protocol.
Fig. 7A illustrates various elements of a perfusion monitoring system according to some embodiments.
Fig. 7B shows an embodiment of a DSCA perfusion monitor console and instrumentation box.
Fig. 7C shows an embodiment of a low profile sensor.
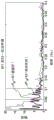
Fig. 8A shows raw BFI data (raw time series BFI data) measured at the plantar inner portions of two persons' feet, one healthy and the other having an indicator of limb ischemia, while fig. 8B shows equivalent power spectrum data (fourier transform of raw time series BFI data) at the same person.
Fig. 9A and 9B show box line plots of low frequency oscillation index (LFI) from 26 healthy persons and 26 ischemic patients evaluated in two different ways: fig. 9A is based on maximum value (LFIM) and fig. 9B is based on area (LFIA).
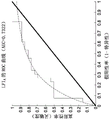
Fig. 10A and 10B show Receiver Operating Characteristic (ROC) curves for LFIM and LFIA, respectively, measured in the plantar Medial (MP) region.
Fig. 11 shows a ROC curve for a 5-dimensional SVM using BFI input parameters of a patient.
Fig. 12 shows Flow Transition Levels (FTLs) associated with a time series BFI, e.g., FTL derivation (derivitization) from time series DSCA Blood Flow Index (BFI) data, where intensities are measured at a frame rate of 60 Hz.
The 5 minute standard deviation of the intraplantar BFI data sampled at 1Hz and 2Hz was calculated and the resulting ROC curve is shown in FIGS. 13A and 13B. FIG. 13A shows ROC for the standard deviation of BFI @1 Hz; FIG. 13B shows ROC for the standard deviation of BFI @2 Hz.
The standard deviation of BFI from the calcaneus and arm also showed significant differences between healthy and ischemic patients, but not the plantar-medial-intense. The p-values for the three positions are compared in fig. 14A to 14C, which are box plots of the FTLs at the plantar medial, heel and arm regions, respectively. Fig. 14A shows a box line diagram of a Flow Transition Level (FTL) of an inner sole region. Fig. 14B shows a box line diagram of the FTL in the heel region. Fig. 14C shows a box plot of the FTL in the arm area. Fig. 14D shows FTL values for a large number of patients (including healthy persons and ischemic patient population).
Fig. 15A is a schematic diagram of a side-emitting DOF sensor.
Figure 15B shows a protective sleeve.
Fig. 15C shows a protective sheath with multiple embedded side-emitting DOF sensors.
Fig. 15D shows another embodiment of the DOF sensor with a retaining ring and adhesive material.
Fig. 15E shows a detailed view of the DOF sensor head shown in fig. 15D.
Fig. 16 is a flow chart of a method for analyzing absolute and/or relative blood flow.
Fig. 17A to 17C illustrate one embodiment of a DOF sensor with a horizontal sensor head.
Fig. 18A through 18D illustrate another embodiment of a DOF sensor with a horizontal sensor head.
Fig. 19 shows the DOF sensor attached to the patient's foot.
Fig. 20 shows the DOF sensor attached to the patient's hand.
Detailed description of the preferred embodiments
Diffuse light flow sensor
There are many techniques that rely on measuring the diffusion of light to characterize blood flow (which may also be referred to herein as blood perfusion). These techniques include Diffusion Correlation Spectroscopy (DCS) and Diffuse Speckle Contrast Analysis (DSCA). Both DCS and DSCA may be used to measure relative and/or absolute blood flow. Other techniques rely on measuring the diffusion of light to detect other characteristics of the tissue, such as biochemical components, the concentration of oxygenated and deoxygenated hemoglobin, and the like. Such techniques include diffuse spectroscopy (DOS), Diffuse Optical Tomography (DOT), and near infrared spectroscopy (NIRS).
As used herein, a "diffuse light sensor" includes any sensor configured to characterize blood properties in tissue via a measurement of diffuse light. Thus, diffuse light sensors include DCS, DSCA, DOS, DOT and NIRS sensors. As used herein, the term "diffuse light flow sensor" includes any sensor configured to characterize blood flow in tissue. Thus, Diffuse Optical Flow (DOF) sensors include DCS and DSCA sensors.
Near-infrared diffusion-related spectroscopy (DCS) is an emerging technology for continuous, non-invasive measurement of blood flow in biological tissues. In the past decade or so, DCS technology has been developed to non-invasively measure blood flow information in deep tissue vessels such as the brain, muscles and mammary glands. In contrast to some other blood flow measurement techniques, such as Positron Emission Tomography (PET), Single Photon Emission Computed Tomography (SPECT), and xenon enhanced computed tomography (XeCT), DCS uses non-ionizing radiation and does not require contrast agents. It does not interfere with commonly used medical devices such as pacemakers and metal implants. Therefore, it has potential in cancer therapy monitoring and bedside monitoring in a clinical setting.
The DCS system may include: a light source, such as a laser having a long coherence length; a detector, such as a photon counting Avalanche Photodiode (APD) or photomultiplier tube (PMT); and an autocorrelator. In various embodiments, the autocorrelator may take the form of hardware or software. As one of the central components of the DCS system, the autocorrelator calculates an autocorrelation function of the temporal fluctuation of the light intensity obtained from the detector.
However, DCS can suffer from long integration times, high cost, and low number of channels being measured simultaneously. One factor contributing to these limitations is the reliance on very sensitive photodetectors and subsequent autocorrelation calculations. Diffuse Speckle Contrast Analysis (DSCA) is a newer technology that provides an improved flow measurement system that enables cost-effective, real-time measurements using statistical analysis without relying on autocorrelation analysis on fast time-series data. Such statistical analysis may be implemented using a multi-pixel image sensor in the spatial domain or a slow counter in the time domain. Multi-pixel image sensors can also be used for temporal analysis, with single or multiple pixels as individual detectors, which is particularly suitable for multi-channel applications. In various embodiments, this method may be used to measure blood flow, either absolute, relative, or both.
DSCA may be implemented in the spatial and time domains. For the spatial domain dsca (dsca), the original speckle image is first obtained from the sample surface. The raw speckle images may first be normalized by a background of smooth intensity, which may be averaged over a certain number of speckle images. The speckle contrast Ks is defined as the ratio of the standard deviation to the mean intensity, K, over a number of detectors or pixelsS=σs/ <I>Where the subscript s refers to the spatial variable, as opposed to the time domain. Quantity Ks and field autocorrelation function g1(τ) is relevant, as follows:

where V is the intensity variation across the image and T is the exposure time of the image sensor. By using a known solution of the correlation diffusion equation in a semi-infinite medium, the formal relationship between flow velocity and Ks can be derived. Found in the body tissue in the range of flow, flow and 1/KS 2The relationship between is substantially linear, 1/K, with increasing flow rateS 2And is increased.
Another way to implement this speckle contrast principle for blood flow meters is to use statistical analysis on time series data obtained by integration over time. This time domain analysis is referred to herein as tDSCA. the integration time of tDSCA may be considered to be similar to the exposure time of the image sensor in sDSCA. In the case of tDSCA, a detector with moderate sensitivity comprising an integrating circuit may be used. For example, each pixel on a CCD chip can be used for this purpose, as each CCD pixel will retain accumulated photoelectrons for a given exposure time. Thus, multiple single mode fibers can be placed directly on some locations of a single CCD chip, resulting in a multi-channel tDSCA system without losing any temporal resolution. The number of channels is limited only by the CCD chip size, the pixel size, and the area of each fiber tip. In some embodiments, tDSCA may use sensitive detectors such as Avalanche Photodiodes (APDs) and/or photomultiplier tubes (PMTs), and slow counters such as those included in data acquisition cards with USB connections, but extending this embodiment to multi-channel instruments is expensive and bulky. Time series data in either way can be obtained by repeating the measurements, for example 25 measurements can be made in succession, after which the data can be statistically analyzed to determine flow rate. In a1 millisecond exposure time configuration, a flow index may be obtained every 25 milliseconds, resulting in about 40 hertz operation.
The statistical analysis of the time series data may be substantially the same as described above with respect to dsca, except that the statistics (mean intensity and standard deviation of intensity) are calculated in the time domain rather than in the spatial domain. As a result, tDSCA may provide lower temporal resolution than sDSCA. However, the detector area for tDSCA may be significantly smaller than that of dsca. Corresponding to the spatial domain, instrumentation and analysis of the tDSCA approach is significantly simpler and less computationally intensive than traditional DCS techniques.
Both DCS and DSCA techniques can be used to assess absolute and/or relative blood flow in the foot on a real-time basis, providing an important tool for interventional radiologists and vascular surgeons to treat ischemia in the foot. Using current tools in the operating room, physicians can often assess through fluoroscopy whether an intervention, such as balloon angioplasty, is successful in opening and achieving patency of the arteries of the limb. However, it is a clinical experience that patency of a structure observed by fluoroscopy is not a reliable indicator of successful reperfusion of an ulcerated wound, ischemic tissue (e.g., black toe) or other topological area in which clinical manifestations reside in the foot. To enhance fluorescence data of arterial patency, multiple DOF sensors used in DCS or DSCA systems may be placed in different topological areas of the foot to assess absolute and/or relative blood flow in the different areas. For example, each topological region can correspond to a different foot vascular region.
The vascular region is a three-dimensional portion of tissue provided by an arterial source or expelled by its accompanying veins. It may include skin, fascia, muscle or bone. The vascular region of the foot is shown in fig. 1A. Below the knee, there are three main arteries: anterior tibial artery, posterior tibial artery, and peroneal artery. At least three independent branches given by the posterior tibial artery: the calcaneal artery, the medial plantar artery, the lateral plantar artery, each branch supplying a different part of the foot. The anterior tibial artery feeds the anterior ankle and continues as the dorsal artery, which feeds many parts of the dorsal foot. The calcaneus branch of the fibular artery supplies the lateral and plantar heels. The anterior peroneal artery branches across the anterior upper ankle on the medial side. As a result, the foot vascular region includes: a blood vessel region of the medial plantar artery, a blood vessel region of the lateral plantar artery, a blood vessel region of the calcaneal branch of the posterior tibial artery, a blood vessel region of the calcaneal branch of the peroneal artery, and a blood vessel region of the dorsalis pedis artery. There is some controversy over whether there is a separate sixth foot vascular region corresponding to the anterior traversing branch of the fibular artery.
Fig. 1B shows five measurement points on the foot, each corresponding to one of the foot vascular regions shown in fig. 1A. By detecting blood flow at each of these locations, blood flow from different arteries can be assessed independently. For example, the blood flow measurement at point a (see fig. 1D) represents blood flow from the dorsum pedis artery and the anterior tibial artery. Similarly, the blood flow measurement at point B (see fig. 1E) corresponds to the medial plantar artery, while point C (see fig. 1F) corresponds to the lateral plantar artery, point D (see fig. 1G) corresponds to the calcaneal branch of the posterior tibial artery, and point E (see fig. 1H) corresponds to the calcaneal branch of the peroneal artery.
Fig. 1C is a branched view of an artery supplying the blood vessel region of the foot. Blood flow measurement points a-E are shown terminating the respective arterial branches, although in practice the measurement points need not be at the extreme ends of the respective arteries. As mentioned above, measurement at any point a to E may provide valuable clinical information about local perfusion.
Topology-based peripheral vascular interventions, such as peripheral vascular interventions for vascular regions, have recently been developed and show promising performance compared to conventional interventions, in particular in terms of improved limb rescue rates. Systems employing multiple DOF sensors may provide real-time feedback of changes in perfusion at different topological locations of the foot, e.g., vessel region by vessel region, so that an interventional radiology or vascular surgeon may immediately assess whether a particular intervention at a target artery has successfully restored adequate blood perfusion to a target topological region of the foot where an ulcerated wound, ischemic tissue or other clinical manifestation is.
Fig. 2 is a block diagram of a system for measuring a turbid medium. The sample 102 includes a heterogeneous matrix therein. Within the matrix is an embedded fluid layer with randomly ordered micro-circulation channels through which small particles 207 move in a non-ordered fashion. For example, in some embodiments, the sample may be body tissue with a complex network of peripheral arteries and capillaries. The light source 108 injects light into the sample 102. The detector 110 may detect light scattered by the moving particles 207 in the micro-circulation channel. The detector 110 may be positioned to receive light from the light source into the sample and diffuse through the sample. In some embodiments, the detector may be coupled to the sample by a single mode optical fiber. In some embodiments, the detector may be a multi-pixel image sensor, such as a CCD camera, for imaging a region of the sample. In other embodiments, the detector may be a photon counting Avalanche Photodiode (APD) or a photomultiplier tube (PMT). When the particles flow in random directions, the scattering of light from the light source 108 will vary, resulting in fluctuations in the intensity that can be detected by the detector 110.
The analyzer 112 is coupled to the detector 110 and is configured to receive signals from the detector 110. Analyzer 112 may include an autocorrelator that measures the time domain intensity autocorrelation function of the light received by detector 110. The autocorrelation function can be used to obtain the scattering and flow characteristics of small particles flowing in the sample 102. The time-dependent intensity fluctuations reflect the time-dependent density fluctuations of the small particles 207, and accordingly the autocorrelation function may be used to determine the flow velocity in the sample 102. In some embodiments, a hardware autocorrelator may be used, while in other embodiments, a software autocorrelator may be used. The flow rate or other characteristic determined by the analyzer 112 may be output to a display 114. The measured quantity may be provided to the operator via the display 114. In various embodiments, the operator may be a clinician, diagnostician, surgeon, surgical assistant nurse, or other medical personnel. In some embodiments, the measurements may be provided via display 114 in substantially real-time. In some embodiments, the measurement may be provided via display 114 within about 1 second from the time the measurement, i.e., within about 1 second from the time the scattered light is detected by the detector, may be provided via display 114. In various embodiments, the measurement may be provided in less than about 10 minutes, less than about 5 minutes, less than about 1 minute, less than about 30 seconds, less than about 10 seconds, or less than about 1 second from the time of measurement.
In some embodiments, a software autocorrelator may be used, as described above. This may advantageously provide additional flexibility compared to a hardware autocorrelator, as it allows for data preprocessing. The software autocorrelator also reduces the cost of the DCS system while also reducing the size and improving the form factor. The ability to pre-process the data may also improve the accuracy of the measurement.
FIG. 3 is a schematic illustration of diffuse light penetration and detection in multiple layers of tissue. As shown, both the light source 202 and the detector 204 are located near a portion of tissue 206. As described above, in some embodiments, optical fibers may be used to couple one or both of the light source and the detector to the tissue. The tissue 206 is multilayered, including an upper layer 208 with no fluid therein, and a deep layer 210 with fluid therein. The plurality of light scattering particles 212 flow within capillary vessels of the fluid layer 210 and may include, for example, red blood cells. Light 214 exits from the light source 202 and is diffused as it passes through the tissue 206. As shown, a portion of the light 214 is diffused so that it is incident on the detector 204. The light 214 may follow a generally crescent shaped path from the light source 202 to the detector 204. The penetration depth of the light 214 detected by the detector 204 depends on the distance between the light source and the detector. As the distance increases, the penetration depth generally increases. In various embodiments, the separation distance may be between about 0.5 centimeters to about 10 centimeters, or in some embodiments, between about 0.75 centimeters to about 5 centimeters. Preferably, in other embodiments, the separation distance may be between about 1 cm and about 3 cm. In various embodiments, the separation distance may be less than about 10cm, less than about 9 cm, less than about 8 cm, less than about 7 cm, less than about 6 cm, less than about 5 cm, less than about 4 cm, less than about 3 cm, less than about 2cm, less than about 1 cm, less than about 0.9 cm, less than about 0.8 cm, less than about 0.7 cm, less than about 0.5 cm, less than about 0.4 cm, less than about 0.3 cm, less than about 0.2 cm, or less than about 0.1 cm. The penetration depth may vary, for example, in some embodiments the sensor may have a penetration depth of between about 0.5 cm and about 5 cm, or in some embodiments between about 0.75 cm and about 3 cm. Preferably, the penetration depth may be between about 5 millimeters and about 1.5 centimeters in other embodiments. Of course, the tissue optical properties of the various layers, as well as the intensity, wavelength, or other characteristics of the light source, also affect the penetration depth. These variations may allow for adjustment of the depth of the measurement based on the body part being analyzed, the particular patient, or other considerations. The measurements obtained by the detector 204 may then be processed and analyzed to calculate an autocorrelation function. As shown in fig. 4, the autocorrelation function may be used to determine the flow velocity in the tissue.
FIG. 4 is a graph of the autocorrelation function for different flow rates, where a steeper decay of the autocorrelation curve indicates a faster flow rate. The curve of the autocorrelation is plotted on a semi-logarithmic scale in the figure. As is generally known in the art, blood flow data may be analyzed by fitting individual autocorrelation curves into a model, such as a semi-infinite multilayer diffusion model. The fitted autocorrelation curve may then provide a relative blood flow rate, which may be usefully applied during peripheral interventional procedures such as balloon angioplasty or surgery, or as a diagnostic tool.
Diffuse Optical Flow (DOF) sensors (which, as noted above, may include either or both DCS and DSCA sensors) may be particularly useful in measuring the microcirculatory system, for example, in measuring blood perfusion of the foot. This technique can be additionally improved by employing the concept of foot topology. One example of topological analysis of blood flow in the foot incorporates the concept of the blood vessel area of the foot as described above.
In many cases, prior to vascular intervention, an interventional radiologist or vascular surgeon images the vessel of interest, for example using fluoroscopy, computed tomography, ultrasound, or other imaging techniques. Through such imaging, several potential occlusions or lesions may be identified. Peripheral interventions such as balloon angioplasty, arteriotomy, or surgical bypasses/implants may be used to reopen one or more identified occlusions or lesions ("targeted lesions") in an effort to restore perfusion to the affected area of the foot. For these peripheral interventions to be successful in rescuing the limb, the blood perfusion must reach a sufficient level to allow the foot wound to heal. Without a real-time perfusion monitor, the physician has no way of determining whether the intervention has achieved sufficient perfusion for wound healing or a radical improvement. This problem is addressed using real-time measurements of blood perfusion at various topological locations of the foot, as described herein. It provides real-time objective quantitative perfusion data so that the physician can determine whether a particular intervention at a target lesion has successfully restored perfusion in the topological area of the foot on which the wound is located. If it has been determined that the perfusion in the desired topological region has reached an acceptable level, the physician may avoid the additional risks associated with further intervention and end the procedure. Alternatively, if the specific intervention at the target lesion does not result in any perfusion improvement measured by the real-time perfusion monitor, the physician will thus be guided to carry over the additional risk of advancing to the secondary target lesion. The use of a real-time perfusion monitor thus avoids the situation where a peripheral intervention procedure is terminated prematurely before the desired perfusion improvement is achieved. It also guides the physician which target lesion in the desired topological area of the foot (at the time of revascularization) produces the greatest perfusion improvement. This real-time knowledge would in turn inform the physician of the optimal location for using a drug eluting balloon or other device to prolong the patency of the blood vessel in which the lesion is located.
Although changes in perfusion can be seen directly from changes in the shape of the autocorrelation function, a potentially more efficient way of defining a Blood Flow Index (BFI), also referred to herein as a Blood Perfusion Index (BPI), has been developed. Fig. 5A is a graph of two such BFIs over time during a cuff occlusion protocol. The dashed vertical lines indicate the start and stop times of cuff inflation. The upper graph shows the BFI calculated from the vertical crossings of the autocorrelation curves, while the lower graph shows the BFI calculated from the horizontal crossings of the autocorrelation curves. Fig. 5B is a graph illustrating the calculated BFI for these two different methods. The solid line represents zero flow reference data and the dotted line represents real-time autocorrelation data. The vertical cross indicator compares the value of the y-axis (g) of the real-time autocorrelation data at a given time2) And reference data. For example, the first indicator may be calculated as 1/g2Or 1.5-g2. The level crossing indicator compares the time between the autocorrelation data and the reference data for a given flow rateThe difference between them. For example, the second indicator may be calculated as log (t)2/t1)。
A graph, such as that shown in fig. 5A, or other such indicia of blood flow, may be displayed to the operator in real time by audible, visual, or tactile feedback. The physician may thereby be provided with substantially real-time feedback regarding the efficacy of the peripheral intervention. For example, during balloon angioplasty, a physician may monitor the BFI measured at a particular location of the foot. The BFI will decrease when the balloon is inflated and increase after deflation. After repeated inflation of the balloon to perform angioplasty, the BFI should be increased relative to the pre-operative baseline, indicating that the angioplasty procedure has resulted in improved perfusion at the target tissue of the foot. The lack of increased BFI relative to the pre-operative baseline indicates that the balloon angioplasty was not successful in restoring perfusion. Providing such feedback in real time is a great benefit to the physician performing the vascular intervention. Rather than waiting hours or days after the procedure to determine if perfusion has improved, during which the foot may deteriorate to a point that amputation is required, the use of DOF sensors at selected foot positions during the angioplasty procedure can provide immediate feedback, allowing the physician to continue, modify, or end the procedure as needed. As described above, in various embodiments, the feedback may be provided within less than about 10 minutes, less than about 5 minutes, less than about 1 minute, less than about 30 seconds, less than about 10 seconds, or less than about 1 second from the measurement. In some embodiments, success of revascularization surgery can be indicated by an increase in BFI by about or at least about 5%, 10%, 15%, 20%, 25%, 30%, 35%, 40%, 45%, 50%, 55%, 60%, 65%, 70%, 75%, 80% compared to the BFI value prior to surgery.
While the above examples relate to balloon dilation, utilizing DOF sensors to assess blood flow (whether relative, absolute, or both) in the foot may be advantageously used before, during, or after a number of different interventions. For example, the DOF sensor may be used to assist in interventions such as rotational atherectomy, delivery of breakdown materials including but not limited to tPA, bypass surgery, stent or graft placement, or any other intervention.
In addition to the real-time monitoring of blood perfusion in the operating room described above, the derivative index based on raw blood perfusion data generated by DCS or DSCA may also be used as a tool in an in-hospital or out-patient setting, e.g. for direct appropriate wound or ulcer treatment based on the tissue perfusion level of the patient, or for screening critical thresholds for peripheral arterial disease by measuring blood perfusion in extremities (e.g. feet). Such derivative indices include the foot thumb index ("FTI"), the Low frequency oscillation index ("LFI") and its two parameters "LFIA"and" LFIM", and support vector machine index (" SVM ") and fluid transition level (" FTL "). These derivatization indices are described below and will be collectively referred to as "derivatization indicators". In certain embodiments, the functional time reference in one or more derivative indices may be, for example, between about 15 seconds and about 15 minutes, between about 30 seconds and about 5 minutes, between about 30 seconds and about 2 minutes, or about 30 seconds, 45 seconds, 1 minute, 1.5 minutes, 2 minutes, 2.5 minutes, 3 minutes, 4 minutes, 5 minutes, 6 minutes, 7 minutes, 8 minutes, 9 minutes, 10 minutes, or a range involving any two of the foregoing values.
Index of the thumb of the foot ("FTI")
As described elsewhere in this application, blood flow measurements may be taken before and after an intervention, for example before and after angioplasty such as balloon angioplasty, by absolute BFI measurements or relative BFI readings. However, by finding the ratio of the absolute BFI in the foot to the absolute BFI in another reference location of the body, such as but not limited to the thumb, earlobe, upper arm (deltoid/shoulder area) or palm (thenar), alternatives to perfusion measurements may be found. For ease of reference, this alternative measurement is referred to herein as the FTI (foot thumb index).
The FTI may address the difficulty of comparing absolute BFI readings from one person to another, taking into account variability caused by different physiological and environmental factors such as room temperature, skin/tissue temperature, hemoglobin concentration, time of day, skin pigmentation, etc. It thus allows calibration towards a standardized value or range of values that serves as a basis for distinguishing ischemic and non-ischemic tissue. This normalization will provide reference values for normal and abnormal populations and does not require normalization of temperature or ambient pressure as is required in laser doppler or transoxygen measurements.
Referring to fig. 6, the upper graph shows a relative BFI chart reflecting perfusion of the plantar medial vascular region of a patient's foot undergoing cuff occlusion as measured by DSCA, with cuff periods labeled between vertical lines. The lower panel shows the FTI or the plantar-medial BFI normalized against the thumb BFI of the same patient during cuff occlusion. As shown in fig. 6, the unnormalized values reflect the absolute BFI readings and the FTI (normalized) values (between the two vertical marks) reflect the FTI during the cuff. The 0.91 listed in figure 6 refers to the average of the BFI before cuff occlusion (to the left of the first vertical line).
In some embodiments, a comparison of the calculated FTI to a predetermined threshold is used to distinguish between a first population (e.g., a population with a characteristic disease or risk factor for a characteristic disease, such as an ischemic population) and a second population (e.g., a population without a characteristic disease or risk factor for a characteristic disease, such as a non-ischemic population; or a population with a different disease or risk factor for a different disease). In some embodiments, the subject may be determined to fall into a characteristic population, such as an ischemic population, if the FTI is less than about 0.90, 0.88, 0.86, 0.84, 0.82, 0.80, 0.78, 0.76, 0.74, 0.72, 0.70, 0.68, 0.66, 0.64, 0.62, 0.60, 0.58, 0.56, 0.54, 0.52, 0.50, 0.48, 0.46, 0.44, 0.42, 0.40 or less.
Low frequency oscillation index ('LFI')
LFI is a measurement indicator related to low frequency oscillations LFO observed in hemodynamic measurements such as blood flow, oxygen, volume and pressure measurements. The current literature describes two different sources of LFO, namely those derived from meyer waves (Mayer waves) and vasomotor waves. Meyer wave is a spontaneous oscillation in arterial blood pressure, whose oscillations are significantly correlated with oscillations of sympathetic nerve activity. Vasomotor waves, on the other hand, are oscillations produced by the walls of blood vessels. The key difference is that meier waves are driven by neural activity, whereas vasomotor waves are characteristic of the autonomous behavior of the vessel wall, unrelated to neural activity.
Similar observations have been made in earlier studies, despite the more basic laser Doppler tools (Schmidt et al, J VASC Surg 1993; 18: 207-15 and Stansberry et al, Diabetes Care; July 1996; 19, 7: 715-21). In the case of blood flow, vasomotor induced oscillations can be measured by laser doppler velocimetry, but only on a small spatial scale. In a clinical sense, this means that laser doppler cannot penetrate beyond the skin level to measure deep tissue perfusion. With the development of scattered spot contrast analysis (DSCA), which can use a CCD as a detector to integrate transmitted light intensity, plus statistical analysis to retrieve blood flow data per minute, it is now possible to overcome the limitations of laser doppler to measure LFO of up to 2cm depth or in some embodiments larger tissues. Relative to laser doppler, the tissue volume measured at DSCA is orders of magnitude larger, and therefore the observed LFO is more sensitive to the pathology of the microcirculation.
Studies by Rucker et al (Rucker et al, Am J Physiol Heart Circ,2000) have shown that under critical perfusion conditions (when arterial blood supply is reduced to the point of ischemia), vasomotor and blood flow movement in skeletal muscle maintains trophic functions to surrounding tissues such as skin, subcutaneous tissue and periosteum, which are free of this protective mechanism or are insufficiently protected. Furthermore, impaired endothelial dysfunction as seen in diabetes directly impairs vasomotor function (Kolluru et al, Intl J of vasular, 2012), leading to delayed vessel remodeling and wound healing. It therefore follows: measurements of local oxygen pressure alone (TcPO2) or perfusion blood pressure alone at the Skin (SPP) do not reflect the critical nature of ischemia of the underlying tissue to the point where wound healing can be accurately predicted. LFO assessment of deep tissue perfusion (e.g. up to 2cm) is a direct measure of microvascular vasomotor function in the tissue and is likely to be an excellent indicator of wound healing.
The effects of these underlying pathologies also illustrate a significant correlation between the derivation index and ischemia. In healthy patients, there are larger deviations and variations in blood perfusion due to healthier and more elastic vessels. Also, their cardiovascular function is likely to be stronger and therefore result in greater changes in blood perfusion. In contrast, ischemic patients may have a variety of complications, including diminished heart volume and calcified microvessels, resulting in less vigorous blood perfusion fluctuations.
As described in more detail above, and as described in the published specification of U.S. application 2014/0052006a1, which is incorporated herein by reference in its entirety, optical measurement techniques such as Diffuse Speckle Contrast Analysis (DSCA) can be used to measure real-time blood perfusion in absolute BFI ("blood flow index") units in tissue depths up to 2 centimeters (2 cm). However, the BFI reading does not represent the full range of information that can be obtained from the raw data. In addition to BFI, vital information about the health of the microvascular vessel can be extracted by evaluating characteristics of the BFI signal, including but not limited to analyzing the power spectrum and statistical properties of the BFI signal.
DSCA measurement in healthy and ischemic feet
BFI measurements of blood perfusion were made from 68 individuals of both groups. The first group included 30 healthy volunteers, while the second group included 38 patients seeking lameness, amputation follow-up or general foot treatment. Of the healthy volunteers, 4 were excluded because the BMI > 28. For the patient group, 2 were excluded due to incorrect fiber optic connection of the device, 2 were excluded due to known venous disease, and 8 were excluded due to normal readings of Ankle Brachial Index (ABI) and/or Toe Brachial Index (TBI) plus a clinical indicator assessed by the physician as lacking ischemia, or indicating the presence of a clinical indicator distant from ischemia. The data thus obtained is based on a comparison of 26 measurements in the healthy group and 26 measurements in the patient group.
In the healthy group, there were 11 men and 15 women, with an age range between 22 and 46, with an average age of 31. In the patient group, there were 14 men and 12 women, the age ranged between 53 and 82, with a mean age of 68.
Data acquisition
In some embodiments, a system for assessing blood flow includes a support structure configured to be positioned at an anatomical location of a patient, one or more sensors carried by the support structure, an analyzer configured to analyze data from the sensors to determine absolute and/or relative blood flow at a location proximate the sensors, and a feedback device configured to provide a signal indicative of the absolute and/or relative blood flow determined by the analyzer. In some embodiments, as shown in fig. 7A, the system 700 may be arranged in a distributed configuration, including at least two subsections, such as a console 702 disposed in a mobile cart, with an extended bundle adapter 708 connected to a conduit balcony 701. The bundle adapter 708 is configured to interface with the patient contacting sensor 704 (e.g., via sensor wire 706), and may also interface to the console 702 via conduit 707. Placing the bundle adapter 708 in proximity to the patient on the catheter hub 701 may simplify connection/disconnection of the sensor 704 to/from the system and application of the sensor 704 to the patient. Any of the connections described and illustrated may be wired or wireless connections. The cluster adapter 708 may be passive, providing only a remote connection point to the sensor 704 that contacts the patient; or may be active including active circuitry and optical components that may include (but are not limited to) sensor detection, authentication, authorization hardware/software; contact verification hardware/software; one, two or more laser sources (e.g., 1, 2, 3, 4, 5 or more laser sources); one, two or more photodetectors (e.g., 1, 2, 3, 4, 5, or more photodetectors); a central processing unit; a display; a touch screen; a keyboard/button; an audio/video annunciator; a power source; a data storage; wireless/wired/fiber optic network interfaces; an input/output connector/interface; a gesture recognition interface, and so on. The console 702 may include active circuitry and optical components, which may include (but are not limited to) sensor detection, authentication, authorization hardware/software; contact verification hardware/software; one, two or more laser sources (e.g., 1, 2, 3, 4, 5 or more laser sources); one, two or more photodetectors (e.g., 1, 2, 3, 4, 5, or more photodetectors); a central processing unit; a display; a touch screen; a keyboard/button; an audio/video annunciator; a power source; a data storage; wireless/wired/fiber optic network interfaces; an input/output connector/interface; a gesture recognition interface, and so on.
The patient contacting sensor may be configured as a single (one-time) use disposable device or a multiple use device. Single-use embodiments may be implemented using the following methods, including but not limited to: time limited activation based on a unique serial number on the package, process limited activation based on an embedded identification circuit, a frangible connector, a frangible patient contact assembly, a mechanically, chemically or optically degraded light/time/air sensitive material, a keyed resistive/impedance circuit, a custom keyed connector, or any anti-counterfeiting method that can be adapted for such an application, or any combination thereof.
The instrument for BFI and LFO measurements may be, for example, a DSCA perfusion monitor, which in certain embodiments may be a 3-channel monitor. Each of the 3 channels may be connected to a sensor comprising a laser source and a detector by a laser fiber. Fig. 7B-7C illustrate one embodiment of such a device and a low-profile sensor 1304 attached to the foot via Tegaderm adhesive tape 1306(3M company, usa). Fig. 7B shows an embodiment at console 1300 and meter box 1302. Fig. 7C illustrates an embodiment of a low-profile sensor 1304.
Each volunteer/patient was asked to sit down and the sensor locations were determined on the plantar medial and calcaneus areas of the foot to avoid calluses, and on the deltoid of the arm. Local temperature readings were taken at the medial plantar, calcaneus and deltoid muscles using a non-contact skin imager (Ti9, Fluke). The sensors are then fixed to each of the medial plantar, calcaneus, and deltoid muscles, respectively. Once the three sensors are fixed, the BFI data is recorded for 5 minutes for a sitting patient with both feet hanging down. Thereafter, the patient was asked to lie in a supine position and the BFI data was re-recorded for 5 minutes. Finally, the sensor was isolated and the temperature was read once at three sites. All readings were taken on the right side of the body unless the right foot or forefoot had been amputated, or the patient's left leg presented clinical evidence of more severe ischemia than the right leg, such as a chronic non-healing wound on the left foot, extreme claudication of the left leg without symptoms in the right leg, angiographically defined vascular stenosis in the left limb vessels, and so forth.
And (3) power spectrum analysis:
the 5 minute time series BFI data (total data set of 300 points) obtained at a sampling frequency of 1Hz for a patient in a supine position was normalized by dividing it by its average value and then subjected to a fast fourier transform to obtain a power spectrum.
By way of example, FIG. 8A shows raw BFI data (raw time series BFI data) measured on the plantar medial portion of two human feet, one healthy and the other with symptoms of limb ischemia, while FIG. 8B shows equivalent power spectrum data (Fourier transform of raw time series BFI data) for the same human (Fourier transform based on maximum peak signal (LFI)M) Is indicated by an arrow).
There are also a number of parameters/characteristics that can be obtained from the power spectrum, and several examples are listed in the following table:
table 1: examples of parameters that may be derived/extracted from the BFI power spectrum.


One-dimensional data analysis of power spectra
Two parameters for one-dimensional analysis of the power spectrum were evaluated based on the characteristics of the low frequency oscillation index ("LFI") in the frequency band between 0.045Hz and 0.10Hz and as described above. LFIMDefined as being in the 0.045-0.10Hz frequency bandMaximum amplitude and assumes that most Low Frequency Oscillatory (LFO) signals are interpreted by a single peak in the band between 0.045-0.10 Hz. In other words, it assumes that the frequency of the LFO signal does not change significantly over a 5 minute data acquisition time. In contrast, LFIADefined as the area under the curve in the 0.045-0.10Hz band, is a more suitable metric if it is assumed that the frequency of the LFO varies significantly in this frequency range during the acquisition time. In some embodiments, other frequency bands may be used for a particular index depending on the desired clinical outcome. For example, in some embodiments, the frequency may be less than 0.15Hz, or less than about 0.10 Hz.
Results
LFI calculated for each volunteer/patient using BFI data obtained during the studyMAnd LFIAThe measurements are shown in FIGS. 9A and 9B, respectively. Fig. 9A and 9B show box line plots of low frequency oscillation index (LFI) from 26 healthy persons and 26 ischemic patients evaluated in two different ways: FIG. 9A shows maximum-based (LFI)M) And the FIG. 9B coefficients are area based (LFI)A). The bilateral t-test (t-test) p-values (p-value) for the Medial Plantar (MP), calcaneus (C) and deltoid (ARM) were respectively: for LFIM0.00027, 0.022, 0.20, and for LFIA0.0015, 0.016 and 0.41. The box plot was plotted using MatLab, where the horizontal line in the box represents the median value, while the box represents the 25 to 75 percentile value, and the cross-line is the outlier.
Receiver Operating Characteristic (ROC) curves were plotted to assess the diagnostic accuracy of this test in distinguishing ischemic from normal populations. In the ROC curve, the true positive rate (sensitivity) is plotted as a function of the false positive rate (100-specificity) for different cut points. Each point on the ROC curve represents a sensitivity/specificity pair corresponding to a particular decision threshold. One metric used to determine the accuracy of the test is the area under the curve (AUC) of the ROC curve: AUC of 0.9 to 1 represents perfect discrimination, while AUC of 0.5 represents a worthless test. The ROC curve for the test with perfect discrimination (no overlap in the two distributions) passes through the upper left corner (100% sensitivity, 100% specificity) and AUC is 1. Thus, the closer the ROC curve is to the upper left corner, the higher the overall accuracy of the test.
FIGS. 10A and 10B show, respectively, measurements in the plantar Medial (MP) region for LFIMAnd LFIAReceiver Operating Characteristic (ROC) curve. For LFIMAnd LFIAThe lower points of the curves (AUC) of (a) are 0.7805 and 0.7322, respectively. The dashed line is the result of a non-linear curve fit.
Since MP shows the LFI for use in FIGS. 9A-9BMAnd LFIAMinimum p-values for both cases, MP data were used to plot ROC curves in fig. 10A-10B. The AUC of the ROC curve of about 0.75 or higher represents a reasonably good discriminatory power. In contrast, Figoni et al (J. Rehab Res Dev 2006: 43(7) 891-. However, patients in the ischemic group of the Figoni study experienced extreme ischemia, where amputation decisions had been made at a much higher level above the site where TcPO2 was measured. However, the patients in the above study were typical patients in an outpatient setting, and no one needed amputation at the time of testing. Although there was a difference in the degree of ischemia between the subjects in this study and the finoni study, the AUC between these studies was similar suggesting that LFI has a greater ability to distinguish subtle differences in the degree of ischemia than TcPO 2.
The data in FIGS. 9A-10B demonstrate LFIMThe ability to distinguish healthy foot tissue from ischemic foot tissue may be superior to LFI in certain situationsAAnd the distinction is particularly apparent when the measurement is in the plantar medial region of the foot, where the p-value is statistically valid and is as small as 0.00027, or even less.
The difference between healthy and ischemic plantar inner tissues is, in some cases, when LFI is usedMAre statistically more effective as correlation indices. Without being limited by theory, a possible explanation for this may be in the LFIMRelative to LFIAThe fact that more overview insight is provided.In other words, LFIMIs a measure of the maximum amplitude change and it is expected that healthy vessels will have higher elasticity and better rheology of blood flow will exhibit higher LFIMThe value is obtained. In contrast, LFIAIs an average measure of LFO, which means that it averages a number of vibrational changes in the vessel to one represented by the area under the curve. In view of LFIAIt is also possible to distinguish between healthy and ischemic tissue, LFIAIt is possible to indeed reflect the overall function of elasticity and rheology over a period of time. It may simply be, for a 5 minute reading, as used in this study, an LFIMIs ratio LFIAA more distinguishable index. This assumption is made by the sum of LFIACompared with using LFIMThe associated smaller p value is supported. In some embodiments, longer or shorter read periods may be utilized, such as about 1, 2, 3, 4, 6, 7, 8, 9, 10, 15, 20, 25, or 30 minutes, as non-limiting examples.
This distinction, as shown in fig. 9A-9B, is most clearly visible on the medial side of the sole in some cases, as compared to the calcaneus region and the deltoid muscle of the foot. The medial plantar blood vessels depend on the full plantar arch for blood supply, and it is at this level that occlusive arterial disease is most common. The medial plantar aspect is therefore more susceptible to ischemia than the calcaneal vasculature which is doubly fed by the peroneal and tibiofemoral vessels. The deltoid region is much less affected than the foot, if at all, because significant upper limb arterial disease is rare in atherosclerosis and/or diabetes.
In some embodiments, an LFI of less than about 130, 127.5, 125, 122.5, 120, 117.5, 115, 112.5, 110, 107.5, 105, 102.5, 100, 97.5, 95, 92.5, 90, 87.5, 85, 82.5, 80, 77.5, 75, 72.5, 70, 67.5, 65, 62.5, 60, 57.5, 55, 52.5, 50, or less isAThe value, which may be a predetermined discrimination cutoff between the first population and the second population, represents a risk factor for a characteristic or disease characteristic, e.g., ischemia, such as critical ischemia, and informs the clinician by prompting an audible, visual, or other signal, e.g.Visually on the display.
In some embodiments, an LFI of less than about 15, 14.5, 14, 13.5, 13, 12.5, 12, 11.5, 11, 10.5, 10, 9.5, 9, 8.5, 8, 7.5, 7, 6.5, 6, or lessMThe value may be a predetermined discrimination cutoff between the first population and the second population, represent a risk factor for a characteristic or disease characteristic, such as ischemia, e.g., critical ischemia, and be communicated to the clinician by prompting an audible, visual, or other signal, e.g., visually on a display.
Multidimensional data analysis of power spectra
In addition to the parameters LFI described aboveMAnd LFIAIn addition, there are other parameters or methods of analyzing BFI data that may be used for the purpose of differentiating between two patient populations. In some embodiments, multiple independent parameters may be used in combination to more accurately identify the population to which the patient belongs.
Analysis of the multi-dimensional dataset may be facilitated by using various strategies, including but not limited to the use of Artificial Neural Networks (ANNs), Extreme Learning Machines (ELMs), and Support Vector Machines (SVMs). In particular, SVMs are devices that define a hyperplane in a multidimensional space that distinguishes between two populations. In some embodiments, the SVM may be used to process a multidimensional input including parameters such as, but not limited to, relative signal power in a particular frequency band of a particular anatomical BFI signal, absolute signal power in a particular frequency band of a particular anatomical BFI signal, and/or correlation coefficients between band-pass filtered BFI signals.
In some embodiments, the SVM may utilize one, two or more of the following five independent inputs from each patient (as set forth in table 1) from the above data set: band pass (0.001Hz to 0.110Hz) relative power of the calcaneus BFI; band pass (0.001Hz to 0.110Hz) relative power of the plantar medial BFI; band pass (0.471Hz to 0.478Hz) absolute power of deltoid BFI; band pass (0.471Hz to 0.478Hz) absolute power of plantar inner BFI; and/or band pass (0.341Hz to 0.351Hz) correlation coefficients between the deltoid and the plantar medial BFI.
In one embodiment, the SVM achieves an accuracy of 0.961 and a sensitivity of 0.961 and specificity of 0.961 when run on the same dataset for 26 healthy persons/26 ischemic patients. The ROC for this SVM is shown in fig. 11, which shows the ROC curve for a 5-dimensional SVM using patient BFI input parameters as described in the previous paragraph.
Statistical analysis of BFI signals:
in some embodiments, statistical parameters of the BFI signal may also be used as a difference. The flow transition level "FTL" is the standard deviation of the BFI signal calculated at 2 Hz. Fig. 12 shows how it is derived from and related to the time series BFI, e.g. FTL derivation from time series DSCA Blood Flow Index (BFI) data, where the intensity is measured at a frame rate of 60 Hz. Other frame rates, such as 30Hz, may also be used depending on the duration selected.
The standard deviation of the 5 minute intraplantar BFI data sampled at 1Hz and 2Hz was calculated and the resulting ROC curves are shown in fig. 13A and 13B. FIG. 13A shows ROC for the standard deviation of BFI @1 Hz; FIG. 13B shows the ROC of the standard deviation of BFI @2 HZ. As noted elsewhere herein, the amount of time data sampled may be selected according to the desired clinical result, such as about 30 seconds, 45 seconds, 1 minute, 75 seconds, 90 seconds, 105 seconds, 2 minutes, 3 minutes, 4 minutes, 5 minutes, or other time intervals. Other frequencies than 1Hz or 2Hz may be used as well, such as frequencies between about 0.5Hz to about 10Hz or between about 1Hz to about 10 Hz.
If the standard deviation of BFI at 2Hz is focused and the data set is shortened and analyzed, a slow deterioration in the AUC is observed to drop to 2 minutes and sharply at 1 minute. The results are shown in Table 2.
Table 2: FTL AUC dependency on sample time/data set size.
| Sampling time | AUC for |
| 5 minutes | 0.9645 |
| 4 minutes | 0.9633 |
| 3 minutes | 0.9554 |
| 2 minutes | 0.9241 |
| 1 minute | 0.7428 |
The standard deviation of BFI from the calcaneus and arm also showed significant differences between healthy and ischemic patients, but not as intense as the medial plantar aspect. The p-values for the three positions are compared in fig. 14A to 14C, which are boxplots of the FTL in the plantar medial, calcaneus and arm regions, respectively.
Evaluation results
An AUC of the ROC curve of about 0.75 or greater indicates reasonably good identification capability, and an AUC exceeding 0.90 is considered excellent in some embodiments. In contrast, Figoni et al (J. Rehab Res Dev 2006: 43(7) 891-. However, patients in the ischemic group of the Figoni study experienced extreme ischemia, where amputation decisions had been made at a much higher level above the site where TcPO2 was measured. However, the patients in the above study were typical patients in an outpatient setting, and no one needed amputation at the time of testing. Fig. 14D shows a plot of FTL values obtained in a study with healthy persons and ischemic patients represented on the Y-axis and patient numerical identifiers represented on the X-axis.
Despite this difference in the degree of ischemia between subjects relative to the Figoni study, LFI was usedMMay be similar to the finoni study, indicating that LFI has a greater ability to differentiate between subtle differences in the degree of ischemia compared to TcPO 2. When multiple parameters are utilized in our SVM, an AUC of 0.969 or better can be achieved, far exceeding the performance reported by tcPO 2.
By using an FTL (BFI @2Hz standard deviation), an AUC of 0.9645 can be achieved with a single parameter from a single sensor located on the plantar inner side. This greatly simplifies the measurement in some cases and can increase the utility and ease of use of the technique for clinical diagnostic and/or screening applications.
In some embodiments, FTL values below about 10, 9.75, 9.5, 9.25, 9, 8.75, 8.5, 8.25, 8, 7.75, 7.5, 7.25, 7, 6.75, 6.5, 6.25, 6, 5.75, 5.5, 5.25, 5, 4.75, 4.5, 4.25, 4, 3.75, 3.5, 3.25, 3, 2.75, 2.5, 2.25, 2, or less can serve as a predetermined discrimination cutoff between the first population and the second population and represent a risk factor for one characteristic or disease characteristic, e.g., ischemia, such as severe ischemia, and notify the clinician by prompting for audible, visual, or other signals, such as visually on a display.
Referring back to fig. 1D-1H, the DOF sensors may be placed separately at different topological regions of the foot, for example the DOF sensors may be placed at each foot vessel region by using separate support structures. However, in another embodiment, multiple DOF sensors may be incorporated into a single support structure for simultaneously measuring different foot regions, such as the foot vascular region. One such embodiment is shown in fig. 15A through 15C. A side-emitting DOF sensor is shown in fig. 15A. As shown, light from the light source may enter the sensor 602 through an input optical cable 604 and may exit the sensor 602 through an output optical cable 606 toward the detector. In some embodiments, the input fiber optic cable and the output fiber optic cable may be bundled together. Rather than orienting the fiber optic cables perpendicular to the surface of the tissue under test, in the side-emitting sensors the fiber optic cables are substantially parallel with a built-in prism, mirror or other optical element redirecting light downward toward the tissue. As a result, the DOF sensor 602 may lie flat against the surface of the region under test, with the fiber optic cables 604 and 606 extending substantially parallel to the surface. The overall effect is a lower attitude DOF sensor with improved comfort, flexibility and form factor.
As used herein, the term "sensor" refers to the end of the DOF system that is in contact with a sample, e.g., a patient's skin. The sensor may include an input optical fiber coupled to a light source and an output optical fiber coupled to a detector. In other embodiments, the sensor may include a receptacle configured to removably receive such an optical fiber. The sensor defines a point at which the incident light is incident on the sample surface and a point at which scattered light from the sample surface is detected. In the illustrated embodiment, the DOF sensor 602 is substantially flat. However, other shapes are possible in various embodiments. For example, the DOF sensor may provide a curved surface, e.g. having a contour corresponding to the contour of the patient's body. For example, the DOF sensor may include a concave surface to correspond to the curvature of the arch of the wearer's foot. In some embodiments, the DOF sensor may be malleable to allow bending and flexing to correspond to the patient's body. As described above, the separation distance between the light source and the detector affects the penetration depth of the measurement light. More specifically, the significant distance is between the location at which light is injected on the tissue surface and the location at which light is detected on the tissue surface. Thus, the side-emitting DOF sensor 602 may be modified to provide for different penetration depths, depending on the body part from which blood flow is to be measured. If the DOF sensor is adapted to measure relatively deep blood flow, the light source-detector separation may be larger than the separation for DOF sensors adapted to measure relatively shallow blood flow. In some embodiments, the distance may be varied in a single DOF sensor. For example, a mechanism may be provided to allow the light source input fiber and/or the detector output fiber to move along the length of the DOF sensor to modify the distance between them. For example, in some embodiments, the light source input fiber may be substantially fixed relative to the sensor, while the detector output fiber is movable. Conversely, in some embodiments, the detector output fiber may be substantially fixed relative to the sensor, while the light source input fiber is movable. In some embodiments, the movable optical fiber is slidable along the sensor, with latches, screws, detents, or other structures provided to releasably secure the position of the movable optical fiber after a preselected distance has been set. In some embodiments, the movable optical fiber may be mounted to a bracket that is threadedly engaged with the screw such that rotation of the screw causes the bracket and, thus, the movable optical fiber to be advanced closer to or away from the fixed optical fiber. Various other configurations are also possible. In other embodiments, various optical components within the interior of the DOF sensor may be provided to vary the effective light source-detector distance. For example, the position of the optical fiber may be fixed, while an internal prism or mirror or other optical element may be adjusted to direct light (incident light from a light source or scattered light from a detector) to or from a different location.
Figure 15B shows, as an example of a support structure, a protective sleeve 608 designed to cover the patient's foot. As shown in fig. 15C, multiple side-emitting DOF sensors 602 may be carried by the protective sheath. In some embodiments, the side-emitting DOF sensors 602 are disposed at locations corresponding to different foot vessel regions. Since each DOF sensor 602 can be made thin and flexible, they can be sewn or otherwise attached to the protective sheath 608 in the appropriate location. The fibers may be bundled and directed out of the protective sleeve 608 and connected to an analyzer. With this design, the application of multiple DOF sensors on a patient's foot can be fast and substantially easy to operate, which is particularly advantageous in the cluttered environment of an operating room or catheter laboratory.
15D and 15E illustrate another example of a support structure and DOF sensor. As shown, DOF sensor 610 includes a bundle of wires 612 extending therefrom. The bundled conductors 612 include both input and output fibers, as described above. The retaining ring 614 is configured to peripherally surround the bottom surface of the DOF sensor 610. The retaining ring 614 may be secured to a surface (e.g., a patient's skin) by an adhesive pad 616. The adhesive pad 616 may take a variety of forms including, for example, TegadermTMA film. In other embodiments, an adhesive material is deposited on the retaining ring without the use of an additional adhesive pad.
As shown, the retaining ring 614 may define an aperture configured to receive the DOF sensor 610 therein. In various embodiments, the retention ring 614 may include one or more retention elements configured to releasably mate with corresponding retention elements on the DOF sensor 610. Whereby engagement of the corresponding retaining element releasably locks the sensor 610 in position relative to the retaining ring 614. In various embodiments, latches, screws, detents, or other structures may be provided to releasably secure DOF sensor 610 to retaining ring 614.
Various other support structures are possible. For example, in some embodiments, the DOF sensor may be carried by a series of straps configured to wrap around the patient's foot to properly position the DOF sensor relative to the foot topology region, e.g., the desired measurement region of a different foot vessel region. In some embodiments, the DOF sensor may be carried by a sheet of flexible material to wrap around the patient's foot. In some embodiments, the support structure may be configured to carry one, two, three, four, five, or more DOF sensors. In some embodiments, two or more support structures may be provided for a single patient. For example, a first support structure may carry two DOF sensors and be positioned on a first portion of a patient's foot, while a second support structure may carry two additional DOF sensors and be positioned on a second portion of the patient's foot. In various embodiments, the support structure may be wearable, for example, it may be a garment such as a protective sleeve, a shoe, or the like. In some embodiments, the support structure may comprise one strip or a series of strips. In other embodiments, the support structure may include an adhesive material through which the one or more DOF sensors may be attached to the patient's skin. For example, in some embodiments, each DOF sensor may be equipped with an adhesive on the tissue-facing side in order to ensure that the sensor contacts the skin. In some embodiments, mechanical pressure may be applied to the DOF sensors to ensure that they are pressed against the skin-for example, an external wrap may be used, or the elasticity of a protective sleeve or other foot covering may itself be sufficient to ensure that the DOF sensors remain adequately on the skin. In some embodiments, the DOF sensor may be embedded in a foot plate sensor used by, for example, a podiatrist. The patient may step on the foot plate and one or more DOF sensors carried by the foot plate may measure absolute and/or relative blood flow at various locations of the foot.
In some embodiments, each DOF sensor may be carried by a different support structure. In other embodiments, the support structure may be configured to carry any number of DOF sensors, such as two, three, four, five, or more. In various embodiments, the support structure may be configured such that when the support structure is positioned on a patient's foot, the position of the DOF sensor corresponds to different topological locations in the foot including the selected foot vessel region. The support structure may be configured to carry DOF sensors corresponding to any combination of topological locations in the foot, including the foot vascular region. For example, in one embodiment, the support structure may be configured to carry a DOF sensor adapted to measure blood flow at the calcaneal branch of the posterior tibial artery and at the calcaneal branch of the peroneal artery. In another embodiment, the support structure may be configured to carry a DOF sensor adapted to measure blood flow at the medial plantar artery, the lateral plantar artery, the calcaneal branch of the posterior tibial artery. Various other configurations are also possible, such that the support structure can be customized to provide a DOF sensor at a desired measurement location.
Fig. 16 is a flow chart of a method for analyzing relative blood flow. The process 700 begins at block 702 with placing at least one DOF sensor on a patient's foot at a location corresponding to a vessel region of the foot. As described above, in some embodiments, multiple such DOF sensors may be placed at different locations on the patient's foot or elsewhere on the patient's body. In some embodiments, multiple such DOF sensors may be used to obtain simultaneous measurements from different topological locations in the foot, including different vascular regions. Process 700 continues to block 704 where a measurement of absolute and/or relative blood flow is obtained using the DOF sensor. As described above, the DOF technique may provide an autocorrelation function to represent absolute and/or relative blood flow within the tissue. The process 700 continues to block 706 where absolute and/or relative blood flow is signaled to the operator. For example, the signal may be provided via visual, auditory, or tactile communication. In some embodiments, absolute and/or relative blood flow may be signaled to the operator in substantially real time, e.g., within 1 second from the measurement. In some embodiments, a display may be provided to display an autocorrelation function, a Blood Flow Index (BFI) table, or other indicator of absolute and/or relative blood flow. Such a display may provide real-time feedback to the operator to guide decisions in the procedure.
As described above, sensor head designs for DOF sensors have traditionally employed optical fibers with metal or ceramic ferrules to protect the fiber tips, and thus typical sensor head designs are limited to vertical contact schemes where the light output from the optical fibers is directly coupled to the sample. The vertical fiber design has a number of disadvantages in applications for blood perfusion monitoring: it increases the volume, height and positional instability of the sensor head; it may require additional cradle means to achieve consistent contact with the skin; and for these reasons it may cause discomfort to the patient after prolonged administration.
Thus, it is advantageous to implement with a low profile, substantially horizontal contact sensor head, which is both simple and cost effective. Fig. 17A to 17C illustrate an embodiment of such a DOF sensor head. Fig. 17A shows a schematic cross section of a sensor head 800, while fig. 17B and 17C show plan views of two possible embodiments of the sensor head 800. As shown, the support structure includes a receiving member 804 having a groove to receive the optical fiber 806 therein and a reflective member 808 having a reflective surface. As shown, the optical fiber 806 is applied horizontally to the surface of the sample 810 and a portion of the fiber body is placed within the recess of the receiving member 806, the distal tip of the optical fiber 806 being configured to be positioned between the surface of the sample 810 and the reflective surface of the reflective member 808. Light output from the source fiber tip is reflected off of the reflective surface in the gap and directed toward the sample 810. For a detector fiber, the opposite occurs: only those light paths that fall within the cone of acceptance angles will be reflected off the reflecting surface and collected by the fiber. In some embodiments, the reflective surface may comprise a sheet of aluminum foil mounted to a compliant backing such as a rubber, silicone or foam pad. It should be appreciated that a wide range of materials may be used as reflectors, including metal foils, metal sheets, light reflective coatings, interference gratings, nanostructure element materials, or any other material having suitable optical properties.
The planar DOF sensor places an optical fiber in optical communication with a sample when applied to the sample. In some embodiments, an optically transparent sterile barrier including at least one optically transparent layer may be placed between the optical fiber and the sample. The at least one optically transparent layer may be configured with an adhesive coating to facilitate attachment of the planar DOF sensor to a sample/tissue surface. For example, the surgical tape may include a bracket configured to receive the DOF sensor thereon and to couple the DOF sensor to the specimen.
Fig. 18A to 18D illustrate an embodiment of a support device fabricated using three-dimensional printing, with a stent comprising an adhesive layer disposed between a patient/tissue and an optical fiber. Fig. 18A and 18B illustrate a support member 902, while fig. 18C and 18D illustrate top and bottom views, respectively, of a sensor head 900 having a layer of surgical tape 912 that can be disposed between the skin of a patient and an optical fiber. In fig. 18C and 18D, the tips of the reflector pads 908 and optical fibers 906 are masked by the adhesive backing of the surgical tape 912. In other embodiments, the at least one optically transparent layer may be free of an adhesive coating, and the planar DOF sensor may then be mounted to the sample by using surgical tape, mechanical clamps, adjustable straps, or other means.
Fig. 19 shows the multiple DOF sensor 1000 attached to a patient's foot. On a healthy human foot, the light source-detector are separated by about 1.5 cm, and arterial cuff occlusion protocol observations show typical changes in blood perfusion-i.e., a sudden decrease and arrest during occlusion, and a rapid overshoot and subsequent return to baseline values after cuff pressure is released. Fig. 20 shows the DOF sensor attached to a patient's hand. The computer screen shows the reduction of blood perfusion and subsequent reactive hyperemia during arterial cuff occlusion, indicating healthy blood flow in the hand. In the illustrated graph, two sets of cuff occlusions are shown, which have two different reactive hyperemia peaks.
Advantages of the planar DOF sensor head include its low weight, stability during long-term use, and a higher level of patient comfort. Its performance is unaffected compared to the vertical sensor head design, and it can be used in any light transmission measurement system of semi-infinite geometry.
Some embodiments may also include memory to store measured or calculated data (such as, but not limited to, BFI, FTI, raw DOF signals) and include the ability to receive/transmit measured or calculated data to/from at least one website/database. The at least one website/database may provide patient and physician access to measured or calculated data, process/analyze the data, and provide notifications to clinicians and/or patients. These notifications may include, but are not limited to: alerts that the patient should seek medical advice, updates new patient data to the clinician for review, etc. The data may be stored in a manner that complies with and is applicable to standards for electronic health records for hospitals and diabetes/feet/elderly/community care centers. Such a system may enable clinicians, caregivers, and family members to remotely monitor patients, and may be particularly useful in resource-limited areas where contact and access to a clinical care center is limited and/or difficult. By remotely assessing the health of a patient, it will be possible to improve clinical care by ensuring that only the necessary visits need to be made.
In some embodiments, systems and components as described herein may take the form of a computing system that communicates with one or more computing systems and/or one or more data sources via one or more networks. The computing system may be used to implement one or more of the systems and methods described herein. While various embodiments are described herein that illustrate computing systems and components, it will be appreciated that the functionality provided in the components and modules (which may also be referred to herein as engines) of the computing systems may be combined into fewer components and modules or further separated into additional components and modules. For example, the communication engine may include a first module in communication with a diagnostic imaging modality (modality), and a second module in communication with a target modality. The modules may include, for example, various components such as software components, object-oriented software components, class components and task components, processes, functions, attributes, procedures, subroutines, segments of program code, drivers, firmware, microcode, circuitry, data, databases, data structures, tables, arrays, and variables. Any of the modules may be executed by one or more CPUs.
The software modules may be compiled and linked to an executable program installed in a dynamically linked library or may be written in an interpreted programming language such as BASIC, Perl, or Python. It should be understood that the software modules may be invoked by other modules or by themselves, and/or may be activated in response to a detected event or interrupt. The software instructions may be embedded in firmware, such as an EPROM. It will also be appreciated that a hardware module may comprise connected logic units, such as gates and flip-flops, and/or may comprise a programmable unit, such as a programmable gate array or a processor. The modules described herein may be implemented in software modules, but may also be implemented in hardware or firmware. Generally, the modules described herein refer to logical modules that may be combined with other modules or divided into sub-modules, regardless of their physical structure or storage content. Further, all methods described herein may be executed as instructions on a CPU and may result in the manipulation or transformation of data.
In some embodiments, the hardware components of the system include a CPU, which may include one, two, or more conventional microprocessors. The system also includes memory, such as random access memory ("RAM") for temporarily storing information and read only memory ("ROM") for permanently storing information, and mass storage devices, such as hard disk drives, flash drives, floppy disks or optical disk storage devices. Typically, the modules of the system are connected using a standards-based bus system. In various embodiments, the standard-based bus system may be, for example, a peripheral component interconnect ("PCI"), a micro-channel, a small computer system interface ("SCSI"), an industry Standard architecture ("ISA"), and an extended ISA ("EISA") architecture.
According to some embodiments, the system may be operably coupled to a target modality, such as an electronic medical record ("EMR"). The EMR may be any software or hardware-software system configured to store and provide access to electronic medical data. According to various embodiments, the EMR may be at least one of an electronic medical record, an electronic health record, and the like. In some embodiments, the system and its components may be operatively coupled to a target modality, which may be an email or other messaging modality; SAMBA, Windows, or other file sharing modalities; FTP or SFTP server modalities; a VPN; a printer; and the like.
A system according to some embodiments may include one, two or more software modules, a logic engine, numerous databases, and a computer network configured to provide users with access to the various modalities and/or EMRs described herein. The system may be configured to be able to record or not record patient data. While the system may allow for upgrading or reconfiguring an existing processing system, changes to existing databases and business information system tools are not necessarily required. The system may be implemented or integrated into an existing medical information management system, such as an EMR, without altering the EMR, and possibly with other modalities without altering the modality's communication system.
According to some embodiments, the system may be a software or hardware-software system. For example, the system may include a communication engine configured to receive and transmit medical information operatively coupled to an information converter configured to present diagnostic medical information in a suitable format suitable for storage in the EMR of the patient; a worklist engine configured to create a user-selectable task list from user-selectable orders collected in the EMR in the medical diagnostic mode; and an event log configured by user selectable errors in transaction logging and/or data transmission and/or data conversion performed by the system.
According to some embodiments, the communication engine may be any software or hardware-software system configured to receive and/or transmit data. The communication engine may be configured to send and receive data over various network interfaces, including wired and wireless networks or a combination thereof, such as over ethernet, 802.11x, bluetooth, FireWire, GSM, CDMA, LTE, and so forth. The communications engine may also be configured to transmit and/or receive data using file transfer protocols such as the TCP/IP protocol, as well as various encryption protocols such as WEP, WPA2, and/or the like.
Further, in some implementations, the communication engine may be configured as an active or passive module. When the communication engine is passive, it may be configured to be discoverable by various elements of a larger medical management system. In this manner, the communication engine may be configured to receive commands or requests from the medical diagnostic modality for a user-selected patient such that the communication engine may send the request to the EMR, receive patient data for the particular patient from the EMR, and transmit the patient data from the EMR to the medical diagnostic modality. As such, the communication engine is only configured to receive and transmit data. In some embodiments, the communication engine is not configured to collect, or mine data from EMRs or medical diagnostic modalities.
Clinical application
The examples of DSCA derivative indices provide a direct assessment of the patient's microvascular vasomotor. Vascular endothelial dysfunction caused by diabetes (Kolluru et al, Intl J of Vascular Med 2012) disrupts normal vasomotor leading to delayed vessel remodeling and wound healing. The derivative index may therefore provide a means in certain embodiments to better assess the healing capabilities of patients (including diabetic and non-diabetic) to guide optimal utilization of wound care treatments. Other uses of the derivative index may be, for example, for screening patients for peripheral vascular disease, determining the efficacy of revascularization procedures, such as bypass, stent, graft, angioplasty, or other procedures, whether intra-or post-operative; predicting the response of advanced wound therapy, such as hyperbaric oxygen, and determining the optimal location of amputation. Other applications of this technique include, for example, the evaluation of orthopedic implants or flaps for tissue survival. In some embodiments, the DOF sensor may be used to assess blood flow at the foot, ankle, calf, thigh, hand, arm, neck, or other anatomical location. In some embodiments, the DOF sensor may be positioned within the body, e.g., in a natural orifice, such as in the esophagus, stomach, small intestine, colon, or uterus, to assess blood flow. In various such embodiments, the DOF sensors may be arranged according to vessel region theory.
Ischemic foot screening
One, two or more derivative indices may be used as a tool for screening ischemic feet, particularly in diabetic patients where the presence of neuropathy as part of the progression of diabetic disease means that claudication is often not a reliable manifestation of the severity of underlying peripheral arterial disease, e.g., patients are feeling no pain due to diabetic neuropathy, not because of the absence of atherosclerotic disease.
Since the screening tool should ideally be small, compact, inexpensive, widely deployed, and usable by minimally trained personnel, the system for screening ischemic feet may in some embodiments be implemented as a small, battery-powered, portable blood perfusion monitoring station that includes a single sensor attached to the patient's foot for measuring a duration of time, such as 10 seconds to 10 minutes. The recorded time series of blood perfusion can then be processed by an internal processor into a power spectrum. Alternatively, the time series data may be measured remotely to a distributed computing network for processing. The results of the calculated one or more derivative indices may then be reported directly to a physician's office or a caregiver for further follow-up. In addition, the caregiver or doctor can access the results remotely via the internet, smartphone, or other telecommunications device. Patients with vascular endothelial dysfunction and/or ischemia can then be referred to a primary care center for more direct assessment and treatment.
Diabetic feet are also at risk of ulcers combining ischemia and high plantar pressure from biomechanical changes in the foot, as well as neuropathy. In clinical practice, the combination of these three factors results in a diagnostic risk ("DFAR") for an ulcerated diabetic foot. Every year, 25% of diabetics are therefore diagnosed as being at risk of ulcers, and 50% of such diagnosed patients subsequently suffer from large or small amputations of foot tissue.
Some methods measure three diagnostic indicators, ankle brachial index ("ABI"), respectively, may be used to measure ischemia, while a pressure foot plate may be used to measure plantar pressure, and a pressure sensitive monofilament tied at a predetermined pressure but not felt by the patient to be applied may be used to diagnose neuropathy. These methods have several disadvantages, including: (a) ABI measurements are highly variable depending on the surgical protocol, which varies from hospital to hospital. The position of the patient is extremely important because ankle systolic pressure is affected by body position-ankle systolic pressure is 1mmHg higher for every 1 inch lower than heart; (b) the presence of calcified vessels in diabetic feet can produce a pseudo-high reading of ABI; and (c) the physician's workflow can be stacked on the physician's desk, as three different reports of ischemia, plantar pressure, and neuropathy that require a physician qualified to subjectively interpret on a case-by-case basis to determine that a diabetic foot is at risk. It typically takes 30 minutes or more for the physician to perform these tests and make a diagnostic decision.
Some embodiments described herein include one, two, or more flow sensors, such as Diffuse Optical Flow (DOF) sensors, configured to measure one, two, or more parameters related to blood flow, and operably connected to one, two, or more anatomical regions of interest, such as a foot or a hand. These sensors are in operable wired or wireless communication with a hardware console unit configured to receive parameters from the sensors and to make predetermined calculations as described elsewhere herein. Some embodiments described herein include a pressure-sensitive foot plate in which has been embedded at least one Diffuse Optical Flow (DOF) sensor head and optionally at least one DOF fiducial sensor head, the DOF sensor head being in optical communication with a vascular region or other topological location of a patient's foot for making measurements based on one or more derivative indices, and the DOF fiducial sensor head being applicable to a suitable location of the patient, such as the thumb or earlobe, to obtain a reference reading for computing an FTI. The device may generate quantitative readings of the absolute values BFI and/or FTI and/or any other derivative indices and plantar pressure for each foot, each parameter having objective threshold criteria to indicate whether one foot requires further physician examination and treatment or prior intervention. The device represents a simple, objective and intuitive method of diagnosing diabetic feet at risk of ulcers in a manner that removes operator-to-operator variation and avoids multiple tests. In some embodiments, to generate a report of relevant data, the patient need only stand on the foot plate apparatus for a short period of time, e.g., about 30 seconds, to hold the sticky sensor head in place on the thumb or other reference point. This simple outpatient tool can be conveniently used by nurses, clinicians, physical therapists, etc. in the diabetes or foot care community to more effectively shunt at-risk diabetic feet, thereby alleviating workflow congestion caused by the long-term shortage of physicians in many elderly communities around the world.
Guiding wound treatment
Current techniques for assessing wound healing potential are suboptimal. The TcPO2 measurement has been shown to be a poor predictor of HBOT results (Fife et al, Wound Rep Reg 2002; 10: 198-. Skin perfusion pressure is actually superior to TcPO2 in wound healing prediction (Lo et al, Wounds 2009), although with diagnostic accuracy of less than 80% for SPP cut-off of <30mmHg (castraunouvo et al, JVS 1997).
TcPO2 and SPP may never reach the highest level of diagnostic accuracy required by the clinical community, as both are limited by the fact that they are measured only at skin depth. Studies by Rucker et al have shown (Rucker et al, Am J Physiol Heart Circ,2000) that under critical perfusion conditions it is the vasomotor and blood flow movements in skeletal muscle that maintain trophic functions on surrounding tissues such as skin, subcutaneous tissue and periosteum that are devoid of this protective mechanism. Furthermore, impaired endothelial dysfunction as seen in diabetes directly impairs vasomotor function (Kolluru et al, Intl J of Vascular Med 2012), resulting in delayed vessel remodeling and wound healing. It follows that measurement of local blood oxygen pressure alone (TcPO2) or perfusion pressure in the skin alone (SPP) does not reflect the critical nature of ischemia in underlying tissues and therefore does not optimally provide a local index/prediction of wound healing.
In contrast, the derivative index directly measures vasomotor function in tissues at depths much greater than that of the skin (up to 2cm), and thus has the potential to be a superior predictor of wound healing, and a powerful tool for appropriate therapies to guide wound healing. In some embodiments, blood flow may be measured at a depth of greater than about 2mm, 4mm, 6mm, 8mm, 10mm, 12mm, 14mm, 16mm, 18mm, 20mm, or more.
Conservative treatment of wounds (e.g., bandages, moist dressings) is sufficient to promote wound healing if the blood perfusion of the tissue surrounding the wound is not impaired beyond a minimum threshold at which passive healing occurs. However, in cases where perfusion is thus compromised, inappropriate use of conservative wound therapy can result in a time lag between the first appearance of the wound and the effective therapy being clinically set commensurate with the severity of the wound symptoms. The TIME model of wound care (tissue viability, infection control, moisture, epithelialization) emphasizes an early diagnosis of tissue viability or other parameters in the wound, which will then drive the therapeutic pathways towards wound healing. One of the most important determinants of tissue viability in a wound is its blood supply. The ability to assess blood perfusion around a wound bed allows clinical decisions to be made: (a) if the tissue is viable, conservative therapy is continued, or (b) if the blood perfusion is too severely impaired to succeed in conservative therapy, progress is made to more advanced wound care products such as chemical debriders, or advanced wound therapy such as topical negative pressure, hyperbaric oxygen therapy, etc. In more severe cases, patients may undergo revascularization directly by peripheral intervention surgery.
Guiding amputation height
The derivative index may also be used to predict the success of amputation treatment. Amputation is usually performed in patients with critical limb ischemia that cannot be treated with revascularization surgery, as well as in patients with diabetic foot ulcers or venous ulcers. 85-90% of lower limb amputations in developed countries are caused by peripheral vascular disease, and poor wound healing accounts for 70% of the complications resulting from amputation. Despite the use of prior art in the field to assess amputation height, the rate of healing of below-knee amputations ranges between 30% and 92%, and as high as 30% of re-amputation rate. If blood perfusion at the amputation level is insufficient to support wound healing, the amputated wound cannot heal. When this occurs, the surgical wound is ruptured, often with additional infection, and may increase the revised amputation of the leg amputation at a higher elevation, or increase the patient's morbidity and delay patient recovery and prosthesis set-up. The ability to measure blood perfusion using one or more derivative indices may enable a physician to better predict successful amputation healing at different heights of the leg to be amputated. This will guide the physician to obtain the appropriate height of the amputation by objective criteria to minimize the patient's pain and affliction while maximizing the preservation of the limb.
Screening for hyperbaric oxygen therapy
Hyperbaric oxygen therapy to aid in the healing of chronic non-healing wounds is currently guided by TcPO2 measurements in the skin surrounding the wound bed before and after the application of 100% oxygen. HBOT involves the application of oxygen in the chamber on the order of 2-2.5 times the sea level. The application of oxygen as a therapy over a long period of time is not only expensive, but is associated with a number of undesirable side effects, such as barotrauma to the ear and sinuses, oxygen poisoning of the sinuses and central nervous system (Aviat Space Enviorn Med. 2000; 71 (2): 119-24). Furthermore, a retrospective study (Wound Rep Reg 2002; 10: 198- "207) of 1144 patients indicated that 24.4% of chronic Wound patients receiving HBOT did not benefit from it. Thus, there is a need to better predict the success of HBOT for any given individual. Since the measurement of the derivative index is performed at tissue depths well below the skin, it has the potential to be able to identify patients who are very unsuitable for HBOT.
Surgical flap assessment
A further application of the derivative index in clinical practice is in surgery, especially in orthopedics, where pedicled or free tissue flaps are used to cover the wound defect. Skin, muscle fascia, and musculoskeletal flaps are used to reconstruct tissue defects that may result from trauma, surgical tumors, infection, or congenital diseases. These flaps rely on the blood supply from the native blood vessels or from the revascularization of the vascularized blood vessels in the vicinity of the receiving tissue bed to keep them alive. Both types of flaps (pedicled and free) are extremely dependent on blood perfusion in them for the flap to survive. Skin flap perfusion needs to be closely monitored after reconstructive surgery, especially within the first few hours to days, and early detection of perfusion loss will help guide the patient to further surgery as needed to ensure continued flap survival. Monitoring the perfusion of these flaps by sensors or surface sensors within the flap tissue can guide the physician into early interventions that can preserve flap survival. The derivative index can potentially be used to continuously monitor the blood perfusion of the flap during the post-operative period to prevent the loss of the flap due to delayed detection of ischemia of the flap.
Intravascular and/or intraluminal tissue probes for guiding various therapy decisions
In another embodiment, a DOF sensor for blood flow assessment, e.g. for intravascular use, comprises at least two optical fibers configured to transmit/receive optical signals at their distal ends, the sensor being delivered by a percutaneous and/or endoluminal device to an organ or tissue bed allowing DCS or DSCA measurement of blood perfusion within a tissue volume in optical communication with the at least two optical fibers. Such intravascular sensors may be configured to have a small cross-section similar to a guidewire of about 0.01 to about 0.04 inches (or about 250 micrometers to about 1 millimeter). The intravascular sensor can be placed in a flexible sheath to protect it during delivery and to facilitate insertion of the probe into the target tissue, after which the sheath can be partially retracted or the distal head portion of the probe extended beyond the distal end of the sheath so as to place the ends of the at least two optical fibers in optical communication with the tissue to be measured for perfusion.
Intravascular and/or intraluminal tissue probes can make real-time measurements of blood perfusion in internal organs or tissues to guide decisions for various medical therapies, including current treatment protocols for cancer treatment and vascular malformations. These embodiments are described in more detail below. In some embodiments, the systems and methods disclosed herein can be used to diagnose and assess the efficacy of various therapeutic interventions for a wide variety of indications, including transient ischemic attacks and acute ischemic stroke (as well as the efficacy of neuro-interventional revascularization procedures, such as angioplasty or stent placement), ischemic bowel, pulmonary embolism, myocardial infarction, and the like. In some embodiments, the systems and methods may also measure active bleeding (e.g., GI (gastrointestinal tract) bleeding) and confirm its cessation. Other indications are described below.(a) Measuring the effects of tumor vasculature and its photodynamic therapy and tumor sensitization measurement before RF ablation
The following articles mention the need to assess tumor blood flow in guided radiation therapy, chemotherapy and photodynamic therapy and are incorporated herein by reference in their entirety. (int.J. radiation Oncology bone. Phys 2003V 55, No.4, pp 1066-1073, "nitrile oxide-mediated increase in tumor blood flow and oxidation of tumor expressed in muscles by stimulating muscles with electric pulsesOxygenating transplanted tumors) ", b.f. jordan, Bernard Gallez, etc.; the Oncology 2008, 13: 631-644 "Use of H2 15O-PET and DCE-MRI to measure tumor blood flow(H2 1 5Use of O-PET and DCE-MRI in measuring tumor blood flow) ", Adrianus J de Langen et al; radiat RES 2003Oct 160(4) 452-9 "Blood flow dynamic after photodynamic therapy with verteporfin in RIF-1tumor (hemodynamics after photodynamic therapy with verteporfin in RIF-1 tumors), Chen B Poque et al. In short the potential for successful chemotherapy is higher in well perfused tumors. This prior knowledge can be used to identify patients who are likely to respond well to treatment and to make such patients more confident of chemotherapy treatment. Quantitative measurement of tumor blood flow may also help calculate the dose of chemotherapeutic agent to be delivered, particularly when such chemotherapy is delivered directly into the tumor by intraluminal or intravascular devices. This would help to avoid unnecessary and painful chemotherapy for patients who are unlikely to benefit from treatment due to the poor vasculature of their tumors.
Perfusion has also shown a key role in the success rate of thermotherapy like radiotherapy and photodynamic therapy. Hypoxia in tumors has been shown to reduce dependence on non-surgical treatment modalities such as radiation and chemotherapy. The hypoxia may be caused by reduced tumor perfusion (diffusion-related hypoxia) or by changes in red blood cell flux (acute hypoxia). Increased tumor perfusion by various means, such as the use of vasoactive agents, carbopol respiration, and electrical stimulation of skeletal muscle around the tumor, has been experimentally demonstrated to have radiosensitizing effects. The principle of photodynamic therapy (PDT) is to use light of a specific wavelength to cause vascular damage to a tumor and to cause ischemia of the tumor, even if a starved tumor lacks blood supply. Thus, the success of PDT is assessed by the extent to which ischemia is achieved as described above. The ability to measure tumor blood flow by intravascular or intraluminal devices can thus facilitate the direct use of these methods to enhance tumor response or to assess tumor response to these non-surgical therapies.
(b) Treating vascular malformationsDuring which an intravascular and/or intraluminal probe is used to guide the injection of sclerosant and embolic agents
Needle
Vascular malformations ("VM"), such as arteriovenous malformations, are networks of abnormally small blood vessels that are spontaneously formed or that are generated either congenital or post-traumatic to create alternate conduits of blood flow between arteries, veins and capillaries, bypassing the normal blood flow from arteries through the capillary bed of an organ or tissue and thence into veins. Clinical indicators for treating VM include local symptoms of pain, bleeding or ulceration at the site of VM, significant myocardial strain from large volumes of blood flowing within these lesions (including high-output heart failure). Treatment of surface VM may also be required for cosmetic reasons.
Treatment of VM involves the injection of a sclerosing agent such as absolute alcohol or sodium tetradecyl sulfate, which is toxic to the vessel and causes sclerosis or scarring to close off small vessels within the VM, through an intravascular microcatheter. This may be the only operation or as part of a surgical procedure in which the volume of blood flowing within the VM is reduced prior to surgical resection. It must be noted in this procedure that over-injection of sclerosing agent may result in extravasation into normal blood vessels, causing significant damage such as skin necrosis, limb loss, acute pulmonary hypertension, or even death. The challenge faced by the physician is that a balance must be struck between injecting enough hardener to shut down the VM completely, but not so much that the hardener leaks out causing other serious damage. Real-time perfusion monitoring of the VM may signal when blood flow has stopped within the VM or sufficiently reduced to allow surgical resection without significant blood loss. This may indicate to the physician that sufficient sclerosing agent has been injected and avoid further injections, thereby reducing the risk of adverse consequences.
Various other modifications, adaptations, and alternative designs are of course possible in light of the above teachings. It is, therefore, to be understood that within the scope of the appended claims, the invention may be practiced otherwise than as specifically described herein. It is contemplated that various combinations or subcombinations of the specific features and aspects of the embodiments disclosed above may be made and still fall within the scope of one or more aspects of the invention. In addition, any particular feature, aspect, method, property, characteristic, quality, property, element, or the like disclosed herein in connection with one embodiment may be used in all other embodiments described herein. It should therefore be understood that various features and aspects of the disclosed embodiments can be combined with or substituted for one another in order to form varying modes of the disclosed inventions. Accordingly, applicants desire that the scope of the invention disclosed herein should not be limited by the particular disclosed embodiments described above. Further, while the invention is susceptible to various modifications and alternative forms, specific embodiments thereof have been shown in the drawings and are herein described in detail. It should be understood, however, that the invention is not to be limited to the particular forms or methods disclosed, but to the contrary, the invention is to cover all modifications, equivalents, and alternatives falling within the spirit and scope of the various embodiments described and the appended claims. Any methods disclosed herein need not be performed in the order recited. The methods disclosed herein include certain actions performed by a physician; however, they may also include any third party instructions for these actions, whether explicit or implicit. For example, an action such as "differentiating between two populations" includes "indicating that a distinction is made between two populations". Also disclosed herein are any and all overlaps, subranges, and combinations thereof. Statements such as "up to," "at least," "greater than," "less than," "between," and the like include the recited number. As used herein, terms such as "approximately," "about," and "substantially" include the recited number (e.g., about 10% to 10%) and indicate that quantities close to the recited number still perform the desired function or achieve the desired result. For example, the terms "approximately," "about," and "substantially" may refer to an amount that is within less than 10%, within less than 5%, within less than 1%, within less than 0.1%, and within less than 0.01% of the recited amount.
Claims (10)
1. A computer-implemented method for distinguishing between at least a first population and a second population, the method comprising:
measuring blood perfusion as a function of time to obtain time series data;
mathematically transforming the time series data into a power spectrum;
calculating at least one parameter of the power spectrum within a specific frequency range; and
taking the at least one calculated parameter as a difference between the first population and the second population.
2. The method of claim 1, wherein at least the first and second populations comprise two patient populations.
3. The method according to claim 1 or 2, wherein the first population comprises a healthy control group and the second population comprises an ischemic population.
4. A method according to any of claims 1-3, wherein the step of measuring the blood perfusion as a function of time comprises using an optical measurement method.
5. The method of claim 4, wherein the optical method is diffusion correlation spectroscopy.
6. The method according to claim 4, wherein the optical method is diffuse spot contrast analysis.
7. The method of claim 4, wherein the optical method is diffuse optical tomography.
8. The method according to claim 4, wherein the optical method is near infrared spectroscopy.
9. The method of claim 4, wherein the optical method is a laser Doppler rheometer.
10. A method according to any preceding claim, wherein the step of measuring blood perfusion as a function of time comprises using a non-optical measurement method.
Applications Claiming Priority (5)
| Application Number | Priority Date | Filing Date | Title |
|---|---|---|---|
| US201361865977P | 2013-08-14 | 2013-08-14 | |
| US61/865,977 | 2013-08-14 | ||
| US201361888790P | 2013-10-09 | 2013-10-09 | |
| US61/888,790 | 2013-10-09 | ||
| CN201480054214.5A CN105636512B (en) | 2013-08-14 | 2014-08-14 | System and method for assessing vascular remodeling |
Related Parent Applications (1)
| Application Number | Title | Priority Date | Filing Date |
|---|---|---|---|
| CN201480054214.5A Division CN105636512B (en) | 2013-08-14 | 2014-08-14 | System and method for assessing vascular remodeling |
Publications (1)
| Publication Number | Publication Date |
|---|---|
| CN112716471A true CN112716471A (en) | 2021-04-30 |
Family
ID=52468749
Family Applications (2)
| Application Number | Title | Priority Date | Filing Date |
|---|---|---|---|
| CN202011270578.0A Pending CN112716471A (en) | 2013-08-14 | 2014-08-14 | System and method for assessing vascular remodeling |
| CN201480054214.5A Active CN105636512B (en) | 2013-08-14 | 2014-08-14 | System and method for assessing vascular remodeling |
Family Applications After (1)
| Application Number | Title | Priority Date | Filing Date |
|---|---|---|---|
| CN201480054214.5A Active CN105636512B (en) | 2013-08-14 | 2014-08-14 | System and method for assessing vascular remodeling |
Country Status (11)
| Country | Link |
|---|---|
| US (5) | US20150073271A1 (en) |
| EP (1) | EP3033005A4 (en) |
| JP (1) | JP2016533814A (en) |
| KR (1) | KR102383056B1 (en) |
| CN (2) | CN112716471A (en) |
| AU (1) | AU2014307691A1 (en) |
| CA (1) | CA2921206A1 (en) |
| MX (1) | MX2016001866A (en) |
| RU (1) | RU2016108615A (en) |
| SG (1) | SG11201601019TA (en) |
| WO (1) | WO2015022583A2 (en) |
Cited By (2)
| Publication number | Priority date | Publication date | Assignee | Title |
|---|---|---|---|---|
| CN114159026A (en) * | 2021-11-09 | 2022-03-11 | 刘明明 | Evaluation method for microcirculation function of kidney |
| CN114569105A (en) * | 2022-04-29 | 2022-06-03 | 天津工业大学 | Cerebral blood flow detection method based on diffusion coherent spectrum image |
Families Citing this family (38)
| Publication number | Priority date | Publication date | Assignee | Title |
|---|---|---|---|---|
| US9636025B2 (en) | 2012-08-15 | 2017-05-02 | Nanyang Technological University | Systems and methods for pedal revascularization assessment |
| US11206990B2 (en) | 2013-01-23 | 2021-12-28 | Pedra Technology Pte Ltd | Deep tissue flowmetry using diffuse speckle contrast analysis |
| CN107205624B (en) | 2014-10-29 | 2019-08-06 | 光谱Md公司 | Reflective multispectral time discrimination optics imaging method and equipment for tissue typing |
| US10070796B2 (en) * | 2015-02-04 | 2018-09-11 | General Electric Company | Systems and methods for quantitative microcirculation state monitoring |
| CN107613851A (en) * | 2015-04-09 | 2018-01-19 | 通用医疗公司 | System and method for monitoring absolute CBF |
| US10952622B2 (en) * | 2015-11-01 | 2021-03-23 | Elfi-Tech Ltd. | Method and apparatus for hemodynamically characterizing a neurological or fitness state by dynamic light scattering (DLS) |
| WO2017136773A1 (en) | 2016-02-04 | 2017-08-10 | Canon U.S.A., Inc. | Diffusing wave spectroscopy with heterodyne detection |
| CA3018567C (en) * | 2016-04-06 | 2024-01-16 | Laser Associated Sciences, Inc. | System for blood flow measurement with affixed laser speckle contrast analysis |
| US10842422B2 (en) | 2016-07-21 | 2020-11-24 | University Of Kentucky Research Foundation | Compact low-cost fiberless diffuse speckle contrast flow-oximeter |
| US11717255B2 (en) | 2016-08-05 | 2023-08-08 | Cimon Medical As | Ultrasound blood-flow monitoring |
| US20180064392A1 (en) * | 2016-09-07 | 2018-03-08 | Empire Technology Development Llc | Detection of foot edema through in-shoe pressure sensors |
| CN106779084B (en) * | 2016-09-30 | 2019-07-09 | 广州英康唯尔互联网服务有限公司 | Machine learning system and method |
| DE102016219709B3 (en) * | 2016-10-11 | 2018-03-01 | Siemens Healthcare Gmbh | Method for determining a perfusion data set, and X-ray device, computer program and electronically readable data carrier |
| JP2018068428A (en) * | 2016-10-25 | 2018-05-10 | ソニー株式会社 | Information processing device, information processing method, and program |
| KR102283395B1 (en) * | 2017-02-03 | 2021-07-30 | 브루인 바이오메트릭스, 엘엘씨 | Determination of susceptibility to diabetic foot ulcers |
| WO2018160963A1 (en) | 2017-03-02 | 2018-09-07 | Spectral Md, Inc. | Machine learning systems and techniques for multispectral amputation site analysis |
| US11690570B2 (en) | 2017-03-09 | 2023-07-04 | Smith & Nephew Plc | Wound dressing, patch member and method of sensing one or more wound parameters |
| AU2018231597A1 (en) * | 2017-03-09 | 2019-09-19 | Smith & Nephew Plc | Device, apparatus and method of determining skin perfusion pressure |
| WO2019070560A1 (en) * | 2017-10-02 | 2019-04-11 | Cascade Ultrasound Llc | Vascular flow diagnostic system |
| WO2019155224A2 (en) * | 2018-02-07 | 2019-08-15 | Norwegian University Of Science And Technology (Ntnu) | Ultrasound blood-flow monitoring |
| WO2019157290A1 (en) | 2018-02-09 | 2019-08-15 | Bruin Biometrics, Llc | Detection of tissue damage |
| RU2686951C1 (en) * | 2018-03-30 | 2019-05-06 | Федеральное государственное бюджетное образовательное учреждение высшего образования Читинская государственная медицинская академия Министерства здравоохранения российской федерации | Method for prediction of diabetic foot development |
| RU2683564C1 (en) * | 2018-07-09 | 2019-03-28 | Федеральное государственное бюджетное образовательное учреждение высшего образования Читинская государственная медицинская академия Министерства здравоохранения российской федерации | Method for prediction of developing diabetic foot syndrome |
| EP3849401A1 (en) | 2018-09-12 | 2021-07-21 | Smith & Nephew plc | Device, apparatus and method of determining skin perfusion pressure |
| EP3622882A1 (en) * | 2018-09-14 | 2020-03-18 | Fundació Institut de Ciències Fotòniques | System and computer-implemented method for detecting and categorizing pathologies through an analysis of pulsatile blood flow |
| GB2591899B (en) | 2018-10-11 | 2022-03-09 | Bruin Biometrics Llc | Device with disposable element |
| US11257591B2 (en) * | 2018-10-12 | 2022-02-22 | Rce Technologies, Inc. | Transdermal optical detection of cardiac biomarkers |
| WO2020123724A1 (en) | 2018-12-14 | 2020-06-18 | Spectral Md, Inc. | Machine learning systems and methods for assessment, healing prediction, and treatment of wounds |
| EP3899463A4 (en) | 2018-12-14 | 2022-12-21 | Spectral MD, Inc. | System and method for high precision multi-aperture spectral imaging |
| EA202192127A1 (en) * | 2019-01-31 | 2021-12-31 | ФЛОУ СиПиАр ИНК. | DEVICE AND METHOD FOR CALCULATION OF OXYGENATED BLOOD FLOW RATE |
| CN109920500A (en) * | 2019-02-26 | 2019-06-21 | 南宁市第二人民医院 | A kind of PCI postoperative patient continuity care platform based on wechat |
| AU2020236749A1 (en) * | 2019-03-11 | 2021-10-07 | Pedra Technology Pte. Ltd. | Systems and methods for providing real-time perfusion guided targets for peripheral interventions |
| JP7308076B2 (en) * | 2019-05-17 | 2023-07-13 | 拓則 島崎 | Vascular access abnormality detector |
| US11723599B2 (en) * | 2019-08-13 | 2023-08-15 | Tawaun Bell | Lower extremity diagnostic device |
| CN113017569B (en) * | 2021-03-09 | 2022-06-03 | 四川大学华西医院 | Skin wound healing condition inspection system based on spectral sub-band time domain autocorrelation |
| EP4307994A1 (en) * | 2021-03-18 | 2024-01-24 | Washington University | Hemodilution detector |
| WO2022269497A1 (en) * | 2021-06-21 | 2022-12-29 | David Mikulis | A method and system for determining a perfusion metric using deoxyhemoglobin as a contrast agent |
| WO2023110471A1 (en) * | 2021-12-16 | 2023-06-22 | Koninklijke Philips N.V. | Improved diagnosis and treatment selection through tissue property determination using ballooning, imaging and digital twins |
Family Cites Families (16)
| Publication number | Priority date | Publication date | Assignee | Title |
|---|---|---|---|---|
| ATE135179T1 (en) * | 1989-10-31 | 1996-03-15 | Gert Nilsson | ARRANGEMENT AND METHOD FOR MEASURING AND REPRESENTING FLOWS OF FLUID, IN PARTICULAR THE FLOW OF BLOOD THROUGH A BODY ORGAN |
| SE468925B (en) * | 1991-08-22 | 1993-04-19 | Gert Nilsson | A METHOD AND APPARATUS SHOULD REDUCE THE DISTANCE-BASED FACTOR IN Saturation of STRAIGHT MOVEMENTS WITH AN IMAGING LASER-DOUBLE TECHNIQUE, SPECIFICALLY IN SEATING BLOOD PERFUSION THROUGH |
| JP5076203B2 (en) * | 2001-06-21 | 2012-11-21 | 学校法人日本大学 | Vascular disease inspection device and bypass vascular diagnosis device |
| GB2413078C (en) * | 2004-01-08 | 2012-08-15 | Dialog Devices Ltd | A system or method for assessing a subject's pedalblood circulation. |
| US7520860B2 (en) * | 2005-04-13 | 2009-04-21 | Marie G. Johnson | Detection of coronary artery disease using an electronic stethoscope |
| US7460900B1 (en) * | 2005-09-14 | 2008-12-02 | Pacesetter, Inc. | Method and apparatus for detecting ischemia using changes in QRS morphology |
| GB0603006D0 (en) * | 2006-02-15 | 2006-03-29 | Dialog Devices Ltd | Assessing blood supply to a peripheral portion of an animal |
| US8219210B2 (en) * | 2006-10-02 | 2012-07-10 | Cardiac Pacemakers, Inc. | Method and apparatus for identification of ischemic/infarcted regions and therapy optimization |
| JP2008154804A (en) * | 2006-12-25 | 2008-07-10 | Cyber Firm Inc | Device for discriminating living body condition, and laser blood flowmeter |
| WO2009008745A2 (en) * | 2007-07-06 | 2009-01-15 | Industrial Research Limited | Laser speckle imaging systems and methods |
| US20090287076A1 (en) * | 2007-12-18 | 2009-11-19 | Boyden Edward S | System, devices, and methods for detecting occlusions in a biological subject |
| WO2010055405A2 (en) * | 2008-11-14 | 2010-05-20 | Apollo Medical Imaging Technology Pty Ltd | Method and system for mapping tissue status of acute stroke |
| WO2010096447A2 (en) * | 2009-02-17 | 2010-08-26 | Board Of Regents, The University Of Texas System | Quantitative imaging with multi-exposure speckle imaging (mesi) |
| US8628477B2 (en) * | 2009-07-31 | 2014-01-14 | Nellcor Puritan Bennett Ireland | Systems and methods for non-invasive determination of blood pressure |
| GB0921477D0 (en) * | 2009-12-08 | 2010-01-20 | Moor Instr Ltd | Apparatus for measuring blood parameters |
| US20120130215A1 (en) * | 2010-05-05 | 2012-05-24 | Ilya Fine | Optical measurement of parameters related to motion of light-scattering particles within a fluid by manipulating analog electrical signals |
-
2014
- 2014-08-14 SG SG11201601019TA patent/SG11201601019TA/en unknown
- 2014-08-14 WO PCT/IB2014/002521 patent/WO2015022583A2/en active Application Filing
- 2014-08-14 JP JP2016533967A patent/JP2016533814A/en active Pending
- 2014-08-14 CN CN202011270578.0A patent/CN112716471A/en active Pending
- 2014-08-14 MX MX2016001866A patent/MX2016001866A/en unknown
- 2014-08-14 CN CN201480054214.5A patent/CN105636512B/en active Active
- 2014-08-14 AU AU2014307691A patent/AU2014307691A1/en not_active Abandoned
- 2014-08-14 KR KR1020167006091A patent/KR102383056B1/en active IP Right Grant
- 2014-08-14 US US14/460,231 patent/US20150073271A1/en not_active Abandoned
- 2014-08-14 EP EP14836211.4A patent/EP3033005A4/en not_active Withdrawn
- 2014-08-14 RU RU2016108615A patent/RU2016108615A/en unknown
- 2014-08-14 CA CA2921206A patent/CA2921206A1/en not_active Abandoned
-
2016
- 2016-12-13 US US15/377,864 patent/US20170311819A1/en not_active Abandoned
-
2018
- 2018-02-08 US US15/892,300 patent/US20180368705A1/en not_active Abandoned
-
2019
- 2019-05-01 US US16/400,668 patent/US20200093382A1/en not_active Abandoned
-
2022
- 2022-06-24 US US17/808,956 patent/US20230148888A1/en active Pending
Cited By (2)
| Publication number | Priority date | Publication date | Assignee | Title |
|---|---|---|---|---|
| CN114159026A (en) * | 2021-11-09 | 2022-03-11 | 刘明明 | Evaluation method for microcirculation function of kidney |
| CN114569105A (en) * | 2022-04-29 | 2022-06-03 | 天津工业大学 | Cerebral blood flow detection method based on diffusion coherent spectrum image |
Also Published As
| Publication number | Publication date |
|---|---|
| EP3033005A4 (en) | 2017-07-12 |
| CA2921206A1 (en) | 2015-02-19 |
| JP2016533814A (en) | 2016-11-04 |
| AU2014307691A1 (en) | 2016-03-17 |
| CN105636512A (en) | 2016-06-01 |
| KR20160103972A (en) | 2016-09-02 |
| US20180368705A1 (en) | 2018-12-27 |
| CN105636512B (en) | 2020-11-24 |
| WO2015022583A3 (en) | 2015-09-11 |
| WO2015022583A2 (en) | 2015-02-19 |
| US20230148888A1 (en) | 2023-05-18 |
| US20150073271A1 (en) | 2015-03-12 |
| KR102383056B1 (en) | 2022-04-05 |
| MX2016001866A (en) | 2016-06-14 |
| US20200093382A1 (en) | 2020-03-26 |
| SG11201601019TA (en) | 2016-03-30 |
| EP3033005A2 (en) | 2016-06-22 |
| US20170311819A1 (en) | 2017-11-02 |
| RU2016108615A (en) | 2017-09-18 |
Similar Documents
| Publication | Publication Date | Title |
|---|---|---|
| US20230148888A1 (en) | Systems and methods for revascularization assessment | |
| US20210244295A1 (en) | Systems and methods for pedal revascularization assessment | |
| US10506943B2 (en) | Methods and systems for monitoring intrabody tissues | |
| US20210030283A1 (en) | Systems and methods for providing real-time perfusion guided targets for peripheral interventions | |
| US20100036209A1 (en) | Circulatory monitoring systems and methods | |
| US20100036269A1 (en) | Circulatory monitoring systems and methods | |
| US20100036268A1 (en) | Circulatory monitoring systems and methods | |
| CA2914368C (en) | Systems and methods for pedal revascularization assessment | |
| US20100036263A1 (en) | Circulatory monitoring systems and methods | |
| US20230277079A1 (en) | Methods and systems for monitoring intrabody tissues | |
| IL239240A (en) | Methods and systems for monitoring intrabody tissues |
Legal Events
| Date | Code | Title | Description |
|---|---|---|---|
| PB01 | Publication | ||
| PB01 | Publication | ||
| SE01 | Entry into force of request for substantive examination | ||
| SE01 | Entry into force of request for substantive examination |