CN107850478B - Method for determining left eigenvector in flow coriolis flowmeter - Google Patents
Method for determining left eigenvector in flow coriolis flowmeter Download PDFInfo
- Publication number
- CN107850478B CN107850478B CN201580081969.9A CN201580081969A CN107850478B CN 107850478 B CN107850478 B CN 107850478B CN 201580081969 A CN201580081969 A CN 201580081969A CN 107850478 B CN107850478 B CN 107850478B
- Authority
- CN
- China
- Prior art keywords
- driver
- flow
- signal
- frequency
- relative phase
- Prior art date
- Legal status (The legal status is an assumption and is not a legal conclusion. Google has not performed a legal analysis and makes no representation as to the accuracy of the status listed.)
- Active
Links
Images


Classifications
-
- G—PHYSICS
- G01—MEASURING; TESTING
- G01F—MEASURING VOLUME, VOLUME FLOW, MASS FLOW OR LIQUID LEVEL; METERING BY VOLUME
- G01F1/00—Measuring the volume flow or mass flow of fluid or fluent solid material wherein the fluid passes through a meter in a continuous flow
- G01F1/76—Devices for measuring mass flow of a fluid or a fluent solid material
- G01F1/78—Direct mass flowmeters
- G01F1/80—Direct mass flowmeters operating by measuring pressure, force, momentum, or frequency of a fluid flow to which a rotational movement has been imparted
- G01F1/84—Coriolis or gyroscopic mass flowmeters
- G01F1/8409—Coriolis or gyroscopic mass flowmeters constructional details
- G01F1/8436—Coriolis or gyroscopic mass flowmeters constructional details signal processing
-
- G—PHYSICS
- G01—MEASURING; TESTING
- G01F—MEASURING VOLUME, VOLUME FLOW, MASS FLOW OR LIQUID LEVEL; METERING BY VOLUME
- G01F25/00—Testing or calibration of apparatus for measuring volume, volume flow or liquid level or for metering by volume
- G01F25/10—Testing or calibration of apparatus for measuring volume, volume flow or liquid level or for metering by volume of flowmeters
Abstract
A method and apparatus for a flow meter (5) is provided. The method includes the steps of placing material into the flow tube (130,130') while exciting a vibrational mode of the flow tube (130, 130'). Exciting a vibration mode of the flow tube (130,130') comprises the steps of: periodically driving a first driver (180L) with a first signal, and periodically driving a second driver (180R) with a second signal, wherein the second driver (180R) is driven substantially in phase with the first driver (180L), but wherein the drive amplitude modulation signal of the first driver (180L) reaches a maximum amplitude when the drive amplitude modulation signal of the second driver (180R) reaches a minimum amplitude, and the drive amplitude modulation signal of the first driver (180L) reaches a minimum amplitude when the drive amplitude modulation signal of the second driver (180R) reaches a maximum amplitude. The method further includes the steps of measuring the relative phase between the first detector (170L) and the second detector (170R) and determining the relative phase of the right eigenvector of the flow tube (130, 130').
Description
Technical Field
The present invention relates to the field of flow meters, and in particular Coriolis (Coriolis) flow meters.
Background
Mass flow rate is measured in a coriolis flow meter by vibrating a fluid transport tube(s) in a sinusoidal motion and measuring the time delay (or phase angle) between the vibrational response at two or more locations on the tube(s). For practical situations, the time delay varies linearly with the mass flow rate, however, the time delay is typically not zero at zero mass flow. There is typically a zero flow delay or offset caused by many factors, such as, for example, non-proportional damping, residual deflection response, electromagnetic crosstalk, or phase delay in the instrument electronics.
This zero flow offset is typically corrected by measuring the zero flow offset during a zero flow condition and subtracting the measured offset from subsequent measurements made during flow. If the zero flow offset is held constant, this will be sufficient to correct the zero flow offset problem. Unfortunately, the zero flow offset may be affected by small changes in the ambient environment (e.g., temperature) or changes in the piping system through which the material flows. A change in zero flow offset will cause an error in the measured flow rate. During normal operation, there may be long periods of time between no-flow conditions, and the flow meter can only be calibrated by zeroing the meter only during these no-flow conditions. A change in the zero offset over time may therefore cause significant errors in the measurement flow.
The operation of a coriolis flow meter may be described using mathematical formulas as described more fully in U.S. patent nos. 7,441,469 and 7,706,987, both assigned to Micro Motion, Inc and hereby incorporated by reference. The overall system of first order differential equations describing the motion of a linear system is:

in equation (1), M and K are the mass and stiffness matrices of the system, and C is the overall damping matrix that may have a damping-induced symmetric component and a Coriolis-induced obliquely symmetric component.


An analysis of the equations of motion can be obtained by looking at equations 1 and 2. The generalized eigenvalue problem associated with equation (2) may be for the right eigenvector Solving such that:

for symmetric A and B matrices, the eigenvectors can be used to diagonalize, or decouple the equations of motion. The decoupling equation is easily solved. For example, for an asymmetric system, where C comprises a coriolis matrix, the right eigenvector does not diagonalize the equation of motion, resulting in a coupled equation. The coupling equations are more difficult to solve and prevent the solution. The left eigenvector is needed to diagonalize the asymmetric a or B matrix. The following derivative illustrates this process. The left eigenvector is obtained by solving the following generalized eigenvector problem:

m and K will be substantially symmetrical with respect to the coriolis flow meter. For no flow, C will also be symmetric, and thus the system matrices a and B will be symmetric. In this case, equations (3) and (4) are equal, and the left and right eigenvectors are the same. The associated asymmetry of the C matrix causes the left and right eigenvectors to be different when flow is present.
Consider the jth right feature vector:

and the ith left feature vector.

Pre-multiplying equation (5) And multiplying equation (6) by
 And two scores are subtracted:

by multiplying equation (5) by And equation (6) is multiplied by
 And turning to the same procedure, it can be shown that:

equations (7) and (8) show matrices that pre-multiply and post-multiply the system matrix A or B with the left eigenvector, respectively And a matrix of right eigenvectors
 The system matrix is diagonalized.

The fact that the left and right eigenvector matrices diagonalize the system matrix means that both the right and left eigenvector sets are linearly independent. Either set can be used as the basis for the coordinate system for this response. Identifying the difference between the left and right eigenvectors is due to the obliquely symmetric coriolis matrix forming one basis of the present invention.
The mass, stiffness, and damping matrices of the simulated non-coriolis effect are symmetric with respect to the mathematical model of the flow meter. For a no-flow system, the left and right eigenvectors are the same (within an arbitrary scale factor). However, the coriolis force associated with the flow manifests itself in the mathematical model as a diagonally symmetric damping matrix (the transpose is the negative of the original matrix). The diagonally symmetric coriolis matrix causes the left and right eigenvectors of the system to be different. For a flow system without non-proportional damping, the relative phase between different coefficients of the left eigenvector is equal and opposite to the relative phase between the same coefficients on the right eigenvector. For a system with asymmetric damping, the phase values are shifted equally for both the left and right eigenvectors, but the difference remains the same.
Thus, if the phase signature of the left and right eigenvectors can be accurately measured, this signature allows the phase to be attributable to zero offset from asymmetric damping and the phase to be attributable to the material flow to be distinguished, eliminating the associated zero offset error. In general, there is a need for a system and method for accurately calibrating zero flow offset during flow.
Disclosure of Invention
A method is provided that includes placing a material in a flow tube while exciting a vibration mode of the flow tube. Exciting a vibration mode of the flow tube comprises the steps of: the first driver is periodically driven with a first signal and the second driver is periodically driven with a second signal, wherein the second driver is driven substantially in phase with the first driver, and wherein the drive amplitude modulation signal of the first driver reaches a maximum amplitude when the drive amplitude modulation signal of the second driver reaches a minimum amplitude and the drive amplitude modulation signal of the first driver reaches a minimum amplitude when the drive amplitude modulation signal of the second driver reaches a maximum amplitude. Further, exciting the vibrational mode of the flow tube comprises the steps of measuring the relative phase between the first pickoff and the second pickoff and determining the relative phase of the right eigenvector of the flow tube.
A method is provided that includes flowing material through a flow tube while periodically exciting a vibration mode of the flow tube such that a drive amplitude modulation signal of a first driver reaches a maximum amplitude when a drive amplitude modulation signal of a second driver reaches a minimum amplitude, and the drive amplitude modulation signal of the first driver reaches a minimum amplitude when the drive amplitude modulation signal of the second driver reaches a maximum amplitude. The method further comprises the following steps: measuring the relative motion of the vibrating flow tube, measuring the relative phase of the right eigenvector while exciting the vibration mode of the flow tube, and using the relative phase of the right eigenvector corrected by zero offset to determine the material flow through the flow tube. The left eigenvector relative phase of the flow tube is also used to determine the new zero offset without stopping the flow of material through the flow tube. In addition, the material flow through the flow tube is determined using the relative phase of the right eigenvector corrected by the new zero offset.
A vibratory flow meter is provided that includes a flow meter assembly including one or more flow tubes and first pickoff sensors and second pickoff sensors, and first and second drivers configured to vibrate the one or more flow tubes. Meter electronics is coupled to the first pickoff sensor and the second pickoff sensor and to the first driver and the second driver, wherein the meter electronics is configured to provide a first signal to the first driver and a second signal to the second driver, wherein the second driver is driven substantially in phase with the first driver, wherein the drive amplitude modulation signal of the first driver reaches a maximum amplitude when the drive amplitude modulation signal of the second driver reaches a minimum amplitude and the drive amplitude modulation signal of the first driver reaches a minimum amplitude when the drive amplitude modulation signal of the second driver reaches a maximum amplitude, and wherein the meter electronics is further configured to measure a relative phase between the first pickoff and the second pickoff and determine a relative phase of a right eigenvector of the flow tube.
Aspect(s)
An aspect of the method according to the embodiment includes: placing a material into the flow tube while exciting a vibration mode of the flow tube, wherein exciting the vibration mode of the flow tube comprises the steps of: periodically driving a first driver with a first signal; periodically driving a second driver with a second signal, wherein the second driver is driven substantially in phase with the first driver, wherein the drive amplitude modulation signal of the first driver reaches a maximum amplitude when the drive amplitude modulation signal of the second driver reaches a minimum amplitude, and the drive amplitude modulation signal of the first driver reaches a minimum amplitude when the drive amplitude modulation signal of the second driver reaches a maximum amplitude; measuring a relative phase between the first detector and the second detector; and determining the relative phase of the right eigenvector of the flow tube.
Preferably, the method further comprises: measuring a frequency shift that occurs between when the drive amplitude modulation signal of the first driver reaches a maximum amplitude and when the drive amplitude modulation signal of the second driver reaches a maximum amplitude; shifting the first signal with a phase shift; adjusting the first signal phase offset until the frequency shift is substantially undetectable; and determining the relative phase of the left eigenvector coefficients from the phase shift of the first signal required to render the frequency shift substantially undetectable.
Preferably, the step of determining the actual flow of material through the flow tube further comprises: determining an uncorrected material flow through the flow tube using the relative phase of the right eigenvector; and determining a zero offset for the flow of material through the flow tube by comparing the uncorrected flow to the actual flow.
Preferably, the method further comprises using the right eigenvector relative phase corrected by zero offset to determine material flow through the flow tube.
Preferably, the method further comprises determining the relative phase of the right eigenvector; and determining a zero offset for the flow of material through the flow tube by weighted averaging the relative phase of the right eigenvector with the relative phase of the left eigenvector.
Preferably, the method further comprises estimating a frequency shift caused by the drive cycling; and associating the frequency shift with the stream.
Preferably, the frequency is estimated using a frequency modulated second order infinite impulse response adaptive notch filter.
Preferably, the method further comprises inputting a notch filter sharpness (α) parameter into the meter electronics; inputting the modulation frequency (fm) parameter of the notch filter into the meter electronics; determining a notch filter adaptation (λ) parameter based on a notch filter modulation frequency (fm) parameter and a sharpness (α) parameter; and inputting the detector signal to an adaptive notch filter, wherein the adaptive notch filter has a center frequency adapted to minimize the filter output.
Preferably, the output of the notch filter is demodulated at the cycle frequency.
Preferably, the method further comprises co-locating the first driver with the first detection sensor; and the second driver and the second detection sensor are arranged at the same position.
Preferably, the step of periodically driving the first driver with the first signal comprises sinusoidally driving the first driver, and wherein the step of periodically driving the second driver with the first signal comprises sinusoidally driving the second driver.
An aspect of the method according to the embodiment includes: flowing material through the flow tube while periodically exciting a vibration mode of the flow tube such that the drive amplitude modulation signal of the first driver reaches a maximum amplitude when the drive amplitude modulation signal of the second driver reaches a minimum amplitude and the drive amplitude modulation signal of the first driver reaches a minimum amplitude when the drive amplitude modulation signal of the second driver reaches a maximum amplitude; measuring relative motion of the vibrating flow tube; measuring the relative phase of the right eigenvector and simultaneously exciting the vibration mode of the flow tube; determining material flow through the flow tube using the relative phase of the right eigenvector corrected by zero offset; determining a new zero offset using the relative phase of the left eigenvector for the flow tube without stopping the flow of material through the flow tube; and using the relative phase of the right eigenvector corrected by the new zero offset to determine the material flow through the flow tube.
Preferably, the method further comprises co-locating the first driver with the first detection sensor; and the second driver and the second detection sensor are arranged at the same position.
According to one aspect, a vibratory flow meter comprises: a flow meter comprising one or more flow tubes and first and second pickoff sensors; a first driver and a second driver configured to vibrate one or more flow tubes; and meter electronics coupled to the first pickoff sensor and the second pickoff sensor and coupled to the first driver and the second driver, wherein the meter electronics is configured to provide a first signal to the first driver and a second signal to the second driver, wherein the second driver is driven substantially in phase with the first driver, wherein the drive amplitude modulation signal of the first driver reaches a maximum amplitude when the drive amplitude modulation signal of the second driver reaches a minimum amplitude, and the drive amplitude modulation signal of the first driver reaches a minimum amplitude when the drive amplitude modulation signal of the second driver reaches a maximum amplitude, and wherein the meter electronics is further configured to measure a relative phase between the first pickoff and the second pickoff and determine a relative phase of a right eigenvector of the flow tube.
Preferably, the meter electronics is configured to measure a frequency shift that occurs between when the drive amplitude modulation signal of the first driver reaches a maximum amplitude and when the drive amplitude modulation signal of the second driver reaches a maximum amplitude, to shift the first signal with the frequency shift, to adjust the first signal shift until the frequency shift is substantially undetectable, and to determine the relative phase of the left eigenvector coefficients from the first signal shift required to make the frequency shift substantially undetectable.
Preferably, the meter electronics is further configured to determine an uncorrected flow of material through the one or more flow tubes using the relative phase of the right eigenvector, and determine a zero offset for the flow of material through the one or more flow tubes by comparing the uncorrected flow to the actual flow.
Preferably, the meter electronics is further configured to determine the material flow through the one or more flow tubes using the relative phase of the right eigenvector corrected by the zero offset.
Preferably, the meter electronics is further configured to determine a relative phase of the right eigenvector, and determine a zero offset for the flow of material through the one or more flow tubes by weighted averaging the relative phase of the right eigenvector with the relative phase of the left eigenvector.
Preferably, the meter electronics is further configured to estimate a frequency shift caused by the drive cycle and associate the frequency shift with the flow.
Preferably, the vibratory flow meter comprises a frequency modulated second order infinite impulse response adaptive notch filter, wherein the meter electronics is configured to perform the frequency transfer estimation.
Preferably, the meter electronics is further configured to receive a notch filter sharpness parameter and a notch filter modulation frequency, wherein the meter electronics is configured to determine a notch filter adaptation rate parameter based on the sharpness parameter and the notch filter modulation frequency; and receiving the detector signal in an adaptive notch filter, wherein the adaptive notch filter has a center frequency adapted to minimize the filter output.
Preferably, the output of the notch filter is demodulated at the cycle frequency.
Preferably, the first driver and the first detection sensor are arranged at the same position; and the second driver and the second detection sensor are arranged at the same position.
Preferably, the first signal comprises a sinusoid.
Preferably, the filter comprises a plurality of adaptable filter coefficients.
Drawings
FIG. 1 is a vibratory flow meter according to an embodiment;
FIG. 2A is a top view of a flow tube in an undeflected position in an exemplary embodiment of the invention;
FIG. 2B is a top view of a flow tube in a deflected position corresponding to a primary bending mode in an exemplary embodiment of the invention;
FIG. 2C is a top view of the flow tube in a deflected position corresponding to a torsional mode due to Coriolis force in an exemplary embodiment of the invention;
FIG. 3 shows an example of converting phase to frequency;
FIG. 4 illustrates a prior art binary phase switching;
FIG. 5A shows a drive signal according to an embodiment;
FIG. 5B illustrates periodic phase switching according to an embodiment;
fig. 5C shows an amplitude modulated signal according to an embodiment;
FIG. 6 is a flow diagram illustrating determining a relative phase of a right eigenvector according to an embodiment;
FIG. 7 is a flow diagram illustrating determining a relative phase of a left eigenvector according to an embodiment;
FIG. 8 is a flow diagram illustrating real-time zero offset recalibration of a flow meter during flow according to an embodiment;
FIG. 9 shows a comparison of left eigenvector induced frequencies between a Hilbert filter and an adaptive notch filter according to an embodiment;
FIG. 10 is a flow diagram illustrating an improved frequency modulated adaptive notch filter according to an embodiment; and
fig. 11 is a flow chart illustrating a method of suppressing a torsional mode according to an embodiment.
Detailed Description
Fig. 1-11 and the following description depict specific examples to teach those skilled in the art how to make and use the best mode of the invention. Many conventional aspects have been simplified or omitted for purposes of teaching the principles of the invention. Those skilled in the art will recognize variations of these examples that fall within the scope of the invention. Those skilled in the art will appreciate that the features described below can be combined in various ways to form multiple variations of the invention. As a result, the invention is not limited to the specific examples described below, but only by the claims and their equivalents.
Residual deflection, electromagnetic crosstalk, and electronic measurement system characteristics all contribute to zero offset. One explanation for these effects is that they introduce errors in the measurement of the right eigenvector phase. If the drive mode (right eigenvector) can be measured accurately, then non-proportional damping will be the only effect causing zero offset, and this error will be easily distinguished from flow effects using the left and right eigenvector Δ t information.
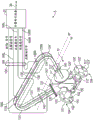
Fig. 1 shows a vibratory flow meter 5 according to an embodiment. The flow meter 5 includes a sensor assembly 10 and meter electronics 20 coupled to the sensor assembly 10. The sensor assembly 10 is responsive to the mass flow rate and density of the process material. Meter electronics 20 is connected to sensor assembly 10 via leads 100 to provide density, mass flow rate, and temperature information, among other information, over communication link 26. A coriolis flowmeter structure is described, but it will be clear to those skilled in the art that the present invention can also be operated as a vibrating tube densitometer.
The sensor assembly 10 includes manifolds 150 and 150', flanges 103 and 103' with flange necks 110 and 110', parallel flow tubes 130 and 130', first and second drivers 180L and 180R, and first and second pickoff sensors 170L and 170R. The first and second drivers 180L and 180R are spaced apart on one or more flow tubes 130 and 130'. Further, in some embodiments, the sensor assembly 10 may include a temperature sensor 190. The flow tubes 130 and 130 'have two substantially straight inlet legs 131 and 131' and outlet legs 134 and 134 'that converge toward each other at the flow tube mounting blocks 120 and 120'. The flow tubes 130 and 130' are bent at two symmetrical locations along their length and are substantially parallel throughout their length. Brace bars 140 and 140' serve to define an axis W about which each flow tube oscillates and a substantially parallel axis W. It should be noted that in an embodiment, the first driver 180L may be co-located with the first detection sensor 170L, and the second driver 180R may be co-located with the second detection sensor 170R.
The side legs 131,131' and 134,134' of the flow tubes 130 and 130' are fixedly attached to the flow tube mounting blocks 120 and 120', and these blocks are in turn fixedly attached to the manifolds 150 and 150 '. This provides a continuous closed material path through the sensor assembly 10.
When flanges 103 and 103' having holes 102 and 102' are connected via inlet end 104 and outlet end 104' to a process line (not shown) that carries the process material to be measured, the material enters end 104 of the meter via orifice 101 in flange 103 and is conducted through manifold 150 to flow tube mounting block 120 having surface 121. Within manifold 150, the material is divided and routed via flow tubes 130 and 130'. After exiting the flow tubes 130 and 130', the process material is recombined into a single stream within the manifold 150' and then sent to the effluent end 104' which is connected to a process line (not shown) by a flange 103' having bolt holes 102 '.
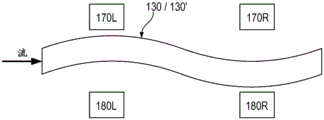
Fig. 2A-2C show top views of flow tubes 130,130' configured to accommodate material flowing therethrough. 180L and 180R are two drivers (also referred to as actuators) spaced along the flow tubes 130, 130'. In a preferred mode, the two drivers are symmetrically spaced about the axial center of the flow tube. The driver is configured to impart a force to the flow tubes 130,130 'to excite multiple vibration modes in the flow tubes 130, 130'. The forces may be substantially coherent (e.g., limited to narrow frequencies), or may be broadband. The driver may be a known device, such as a magnet attached to the flow tube, and a coil attached to a reference through which, for example, a vibrating current passes without limitation.
170L and 170R depict two sensors (also referred to as pickoffs) co-located with the drivers 180L and 180R. The sensors are configured to generate a plurality of signals representative of the position and movement of the flow tubes 130, 130'. The sensors may include a variety of devices such as coil-type velocity transducers, optical or ultrasonic motion sensors, laser sensors, accelerometers, inertial velocity sensors, and the like. In this embodiment, there are two sensors, each shown co-located with one of the drivers 180L, 180R. Other configurations with more than two sensors are also possible.
Fig. 2A shows the flow tubes 130,130' in an undeflected state. By driving the actuators with equal power, the main bending mode of the flow tube can be excited. U.S. patent No. 6,092,429 entitled "Driver for Vibrating a Vibrating Flow Tube," assigned to Micro Motion, Inc and incorporated herein by reference, discloses drivers 180L,180R configured to excite different vibration modes in a Flow Tube. Fig. 2B shows the flow tubes 130,130' in a deflected state corresponding to the main bending mode of the flow tubes. The vibration mode also corresponds to a condition of material flow that does not pass through the flow tube. The deflection of the flow tubes 130,130' in fig. 2B and 2C is exaggerated for clarity. The actual deflection of the flow tubes 130,130' will be much smaller. As the material flows through the vibrating flow tubes 130,130', the flowing material causes Coriolis forces to be generated. The coriolis force deflects the flow tubes 130,130' and excites additional vibration modes. Fig. 2C shows the primary vibration mode excited by the coriolis force. The relative phase difference of the deflections between the sensors 170L and 170R can be used to determine the material flow through the flow tubes 130, 130'. In the no-flow state (as shown in fig. 2B), there is no flow-induced phase difference detected between 170L and 170R. It should be noted, however, that there may be a phase difference caused by the zero offset state. Once the material flows through the flow tubes 130,130', there will be a flow induced phase difference between 170L and 170R. The measured phase difference detected between 170L and 170R is a measure of the relative phase of the right eigenvector of the system and is proportional to the material flow through the flow tube. Make it Equal to the relative phase of the right eigenvector,
 is the measured phase of the vibration of the flow tube at the
 sensor 170L, and for the measured phase of the vibration of the flow tube at
 sensor 170R, then:

the time difference Δ t may be calculated by dividing the phase difference by the vibration frequency ω.

The time difference Δ t is also proportional to the material flow through the flow tube and is a measurement commonly used in mass flow meters. A more accurate determination of the material flow through the flowtubes 130,130' may be calculated by correcting the measured material flow by a zero offset (ZeroOffset) amount to derive a corrected Δ t, Δ tC:

In one exemplary embodiment of the invention, during normal operation, two drivers 180L,180R are used to excite the main bending mode of the flow tube. An example of the material flow through the flow tube is determined by the following process: measuring the relative phase of the right eigenvector, and converting into delta t domain delta tRAnd correcting the value by a zero offset correction amount to determine a corrected Δ tR, ΔtRC,

In an embodiment, the flow tube is excited by periodically driving a first driver and periodically driving a second driver, wherein the first driver and the second driver are amplitude modulated out of phase with each other. In an embodiment, both drivers 180L,180R are periodically driven at a frequency corresponding to resonance. The drive signal is amplitude modulated at a much lower frequency. The lower frequency is the cycle frequency of the phase/frequency transfer followed by demodulation. The drive amplitude modulation signals are out of phase (at the cycle frequency). The drive signals of the various drivers at the resonant/drive frequency are substantially identical signals and multiplied by the corresponding modulation signals. The periodic sweep may be sinusoidal, square, sawtooth, etc. At the location of the flow tube, a measurement of the phase between the drive signal and the vibration can be made. These measurements are used to determine the relative phase of the left eigenvector of the system. In an embodiment, the frequency shift that occurs between when the drive amplitude modulation signal of the first driver (180L) reaches a maximum amplitude and when the drive amplitude modulation signal of the second driver (180R) reaches a maximum amplitude is measured and input into the meter electronics 20. The drive signal driving the first driver 180L is then shifted in phase shift. Then, a frequency shift occurring between when the drive amplitude modulation signal of the first driver (180L) reaches the maximum amplitude and when the drive amplitude modulation signal of the second driver (180R) reaches the maximum amplitude is measured. If the frequency shift is substantially zero, no adjustment is required. However, if the frequency shift occurring between when the drive amplitude modulation signal of the first driver (180L) reaches the maximum amplitude and when the drive amplitude modulation signal of the second driver (180R) reaches the maximum amplitude is still detectable, the first signal is shifted again until the frequency shift occurring between when the drive amplitude modulation signal of the first driver (180L) reaches the maximum amplitude and when the drive amplitude modulation signal of the second driver (180R) reaches the maximum amplitude is substantially undetectable. Once this occurs, the relative phase between the left eigenvector coefficients is calculated from the signal offset required to make the frequency shift substantially undetectable.
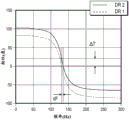
Turning to fig. 3, it will be clear that the principal difficulty inherent in this approach is that the phase to frequency conversion of the system is quite sharp, meaning that small frequency changes occur in relatively large phase changes across the meter, which are also difficult to convert. As a result, the required frequency accuracy is rather strict, on the order of nanohertz. This prior art approach to phase switching effectively switches between the drivers 180L,180R in a binary manner. This is shown in fig. 4. This requires waiting at least a few seconds (15-30) for signal attenuation before observing a new frequency from the newly switched driver. This long delay is not practical for available systems. When such abrupt drive transitions are used to continue cycling the drive back and forth, the system transient response to the transition is never actually fully attenuated, which ends up obscuring the desired drive frequency change. This feature of phase to frequency conversion is particularly pronounced when the flow meter 5 is driven with a closed loop feedback signal, as the one or more pickoff signals are scaled and fed back to generate the drive signal. Under this feedback drive scheme, something that would be an additional phase change characteristic of the open loop of the system instead manifests as a shift in the drive frequency. This is inherent in the nature of the feedback drive system, as the phase of the open loop system must by definition match the phase in the feedback part of the system, so matching these phases requires a change in the drive frequency, which automatically falls out of the closed loop controller. As described above, since a relatively large amount of phase variation appears as a relatively small frequency shift, the challenge of observing phase effects in closed loop drives is too high, since frequency variations are typically too small to be detected.
Turning to fig. 5A-5C, an embodiment is shown in which the drive amplitude is cycled periodically to minimize transient signals. This approach minimizes the slope of the drive amplitude change over time (given the required cycle frequency) and thus minimizes the impulse impact on the system. With this approach, the drive is only temporarily completely on one drive or the other. Fig. 5A shows the substantially in-phase nature of the two drive signals. Fig. 5B shows an amplitude modulated signal. Fig. 5C shows an amplitude modulated drive signal in which the amplitude of the first driver reaches a maximum when the amplitude of the second driver reaches a minimum, and the amplitude of the first driver reaches a minimum when the amplitude of the second driver reaches a maximum.
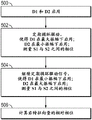
Fig. 6 is a flow chart illustrating the determination of the relative phase of the right eigenvector of the system in an exemplary embodiment. At step 500, during normal operation, two drivers 180L,180R are used to excite vibration of the flow tube. Drivers 180L and 180R cycle periodically, with 180R being driven at a minimum amplitude when 180L is at a maximum amplitude, and vice versa. At step 502, the driver 180L cycles to excite at maximum amplitudeThe flow tube vibrates and 180R cycles to excite the flow tube vibration at a minimum amplitude. During this time, the phase between the detection sensor 170L and the detection sensor 170R is measured. This will be referred to as phase difference 。
。
At step 504, when the drive is cycled periodically, driver 180L excites vibration of the flow tube at a minimum amplitude and 180R excites vibration of the flow tube at a maximum amplitude. The phase between the detection sensor 170L and the detection sensor 170R is measured. It should be noted that the phase difference between the pickoff sensors 170R,170L may be measured continuously, or may be measured at separate time periods. In any event, this will be referred to as phase difference 。
。
At step 506, the relative phase of the right eigenvector is computed. In an embodiment, system noise and phase caused by residual flexibility of higher frequency modes is attenuated by weighting the average phase signal such that the average phase In an embodiment may be calculated as:

however, other equations than equation (14) may be conceived.
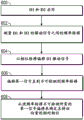
Fig. 7 is a flow chart illustrating the determination of the relative phase of the left eigenvector in an exemplary embodiment. At step 600, during normal operation, two drivers are used to excite vibration of the flow tube. Drivers 180L and 180R cycle periodically, with 180R being driven at a minimum amplitude when 180L is at a maximum amplitude, and vice versa. At step 602, the frequency shift between the drive signals used by the driver 180L and the driver 180R is measured.
At step 604, the first signal is shifted in phase shift while driving the periodic cycle. At step 606, the first signal is shifted until the frequency shift is substantially undetectable. At step 608, the relative phase of the left eigenvector coefficients is determined from the first signal offset required to make the frequency shift substantially undetectable.
FIG. 8 is a flow chart illustrating real-time zero offset recalibration of a flow meter during flow in an exemplary embodiment. In step 700, during normal operation, two drivers 180L,180R are used to periodically excite the vibration of the flow tube. An uncorrected relative Δ t for the right feature vector is determined. The uncorrected relative at of the right eigenvector is then corrected by using the zero offset. The flow through the meter is determined using the corrected relative Δ t of the right eigenvector. At step 702, the relative Δ t of the left feature vector is periodically determined. The relative Δ t of the left eigenvector can be corrected for residual crosstalk and electronic crosstalk effects. At step 704, the relative Δ t of the left eigenvector and the uncorrected Δ t of the right eigenvector are used to determine a new zero offset. The new zero offset replaces the old zero offset and the process resumes at step 700. By calculating and bringing a new zero offset into the meter, the meter recalibrates for a new zero flow condition during material flow through the meter.
In one exemplary embodiment, the determination of when to recalibrate may be done by using a fixed time interval between calibrations. In another exemplary embodiment, recalibration may be accomplished when a change in the environment or piping system is detected. For example, recalibration may be performed when the temperature changes by more than a threshold amount. The determination of when to recalibrate may be a combination of a periodic clock and detecting environmental changes. The time period between recalibrations may be shorter in systems requiring higher accuracy than in systems with less stringent accuracy requirements. Switching between drivers 180L and 180R to measure the relative phase of the left diagnostic vector does not indicate that normal operation of the flow meter should be interrupted (i.e., the flow is measured using the right eigenvector). In yet another example, the flow meter only monitors for changes to zero, so embodiments of a zero verification tool can be envisioned. This is useful in many applications, such as, but not limited to, for example, transport surveillance, where zero variation is not allowed unless in certain circumstances.
However, as mentioned, a problem encountered in prior art approaches involves isolating phase effects caused by the switching drivers 180L,180R from other transient effects from the controller. Specifically, when the drivers 180L,180R suddenly switch, the system may react with an undesirable transient response. The drive controller tends to intensify these step changes in the system. When this abrupt drive transition is used for continuous back and forth cycling, the transient response of the system to the transition tends to be never attenuated, so the desired drive frequency change is blurred. Another problem is the sensitivity of the frequency measurement. If one only examines the original frequency signal while cycling the drivers 180L,180R, the associated variations are disturbed by noise effects. Signal processing methods and electronic devices are described in U.S. patent No. 5,734,112, assigned to Micro Motion, Inc and incorporated herein by reference.
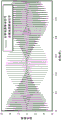
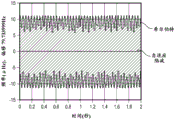
The signal processor relies on frequency estimates of the flow tube bending mode vibrations for the various deltat calculations to be made. Hubert filter-based approaches for estimating frequency are known from the prior art, but prove too noisy for the desired accuracy. In an embodiment, the sinusoidal cycling approach may be augmented with an improved frequency estimator filter. In particular, a modified adaptive notch frequency estimator is used. The adaptive notch frequency estimator provides a much more accurate frequency estimate than the hilbert filter. Fig. 9 shows the left eigenvector induced frequency variation using two frequency estimators, hilbert filter (H) and adaptive notch filter (AN). The adaptive notch filter is more clear, which is particularly clear when the phase of the left eigenvector is adjusted out of phase. Noise is present when using a hilbert filter with a standard deviation more than 500 times larger than the adaptive notch filter.
In an embodiment, the adaptive notch filter comprises a frequency modulated second order infinite impulse response filter applied to the incoming signal with a center frequency adapted to minimize the output. For pure tone signals this will be when the frequency of the filter matches the frequency of the input signal. For polyphonic signals, the filter locks to the maximum tone present. Beyond the adapted center frequency, the performance of the filter is controlled by two design parameters: the sharpness a of the filter and the adaptation of the frequency a. In an embodiment, the sharpness (α) remains a static design parameter and is typically defined during the manufacturing stage. The adaptation rate (λ) parameter of the frequency affects the sensitivity of the frequency modulated signal. In an exemplary embodiment, the modulation frequency of the adaptive notch filter is defined according to the following expression:

wherein:
α = sharpness of filter
Adaptation of λ = frequency
dt = sample rate of filter
fm = modulation frequency.
Thus, given a sample rate, a value, and a modulation frequency fm, a suitable value for the adaptation rate of the frequency (λ) can be found as:

in this way, the frequency modulation tracks several orders of magnitude more accurately at a known modulation frequency than with a common prior art adaptive notch filter.
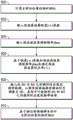
Fig. 10 is a flow chart illustrating the use of an improved frequency modulated adaptive notch filter according to an embodiment. Finally, a frequency estimate is calculated from the relative phase of the left eigenvector. In step 900, the relative phase of the left eigenvector is calculated. At step 902, a sharpness parameter α is input to a filter, which corresponds to the response time of the filter. In an embodiment, the parameter is determined at the time of meter assembly and verification. At step 904, the notch filter modulation frequency (fm) is input into the filter. At step 906, an adaptation parameter (λ) is calculated based on the sharpness (α) and notch filter modulation frequency (fm) parameters. In an exemplary embodiment, expression (15) is used for this calculation, but other expressions are contemplated and embodiments are not limited to expression (15). Step 908 corresponds to outputting a frequency shift that occurs between when the drive amplitude modulation signal of the first driver (180L) reaches a maximum amplitude and when the drive amplitude modulation signal of the second driver (180R) reaches a maximum amplitude, and shifting the first drive signal by a phase shift offset. This is accompanied by adjusting the first signal offset until a frequency shift is substantially undetectable. At step 910, the relative phase of the left eigenvector coefficients is determined from the first signal offset required to make the frequency shift substantially undetectable.
In another related embodiment, as described above, instead of using a pure frequency estimator, the frequency modulated signal is taken at a known modulation frequency. Considering a frequency modulated signal, where the fixed modulation is known at frequency ωcThe following:

in an embodiment, the objective is to measure Δ ω, and one method for this measurement comprises comparing the signal y with a time-delayed version of itself, and calculating the phase difference :
:

Since the phase is defined as the integral of the frequency, in an exemplary embodiment, without limitation, the phase may be calculated as:

due to modulation frequency omegacAs is known, the time delay Δ t is chosen to be one-quarter of the period of the modulation frequency, so:

expression (19) is simplified as:

this represents the DC value plus the sine at the modulation frequency, whose amplitude is proportional to Δ ω. Thus, the amplitude of the frequency modulation at the known modulation frequency can be obtained by comparing the phase of the signal with a suitably attenuated version of itself and calculating the amplitude of the resulting sinusoidal frequency modulation. It will therefore be clear that this technique detects modulation at the desired frequency, but provides rejection of most out-of-band noise.
In the above embodiment, the two drivers 180L,180R are used to determine the relative Δ t of the left feature vector. In yet another embodiment, only a single driver is used at a time. For example, driving a single driver 180L, measuring the phase at the pickoff sensor 170L, and then driving another driver 180R and then measuring the phase at the same pickoff 170L may be used to allow for the unique contribution to each driver to be identified. An inherent drawback of a lightly damped flow meter arises from its taking up to 5 minutes and possibly even longer for the response from the first driver to decay, which is required before the second driver can be activated. In many real-world scenarios, this is effectively a useless approach due to the long time delay, as the environmental conditions can change fast enough to discard any measurements. Thus, embodiments provide a solution to this time delay problem.
In an embodiment, the driving force is calibrated to improve system accuracy. In conventional single-drive meters, the sensor is designed to be balanced with a drive coil located at a node of the mode shape of the torsional mode. By doing so, it is extremely difficult that the driver directly excites the torsional mode, and therefore the direct torsional mode excitation does not significantly affect the drive phase measured at the pickoff sensors 170L,170R, thereby removing one potential source of zero error in the flow measurement. However, with the dual driver approach, the drivers 180L,180R are not located at the torsional mode nodes, and thus there is a risk of directly exciting the torsional mode. Therefore, direct torsional mode excitation is a significant problem. The relative torsional mode response (compared to the drive mode response) may vary with density and temperature. Thus, if the drive mode is relatively close to the torsional mode, the relative response of the torsional mode will increase. This is not a pure zero effect but depends at least in part on the flow error of the drive frequency. If the torsional mode is not excited to begin, such as due to the driver being placed on a single drive meter, this source of error is eliminated.
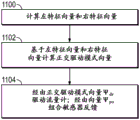
Thus, in an embodiment, the driving force projection vector (Ψ) is selecteddr) And the detector mode filter vector (Ψ)po) Which corrects for any system gain and allows driving of the drive mode while suppressing the torsional mode, is primarily aimed at suppression of the torsional mode in both the drivers 180L,180R and the pickoff sensors 170L,170R (as shown in fig. 11). This is an improvement over standard single drive meters that themselves only allow for suppression at the drive but do not prevent the pickoff sensors 170L,170R from measuring torsional mode response.
To excite the drive mode but not the torsional mode, the torsional mode shape (i.e., eigenvectors) of the resulting residual matrix are obtained at step 1100. Orthogonal drive mode vectors are designed using the torsional mode left and right eigenvectors (i.e., pick-off and driver modes) on the hand, as shown in step 1102. In an embodiment, this is done using the following equation:

by passing through the vector ΨdrDriving a dual-drive meter and via vector ΨpoCombining the pickoff sensors 170L,170R for feedback, as in step 1104, achieves the desired suppression of torsional modes because:

although it is desirable to measure torsional mode shape, in an alternative embodiment, only drive mode data is used. This approach is similar to that described above, but additionally assumes that the driven meter is balanced so the drive and torsional mode shapes are substantially:

these are then destroyed only by the transducer gain (corrupt) so that

Thus, for a symmetric flowmeter, the left and right eigenvectors are measured as described above, so estimates of the torsional modes of the left and right eigenvectors can also be estimated. From this point on, the same approach as highlighted above is used to arrive at the driver projection vector and detector modal filter vector, which suppresses the torsional modes. Either approach is suitable for metrology calibration (initial factory calibration or field calibration). To avoid directly exciting the torsional mode, the driver and/or detector gains are adjusted to obtain a more stable flow estimate. While these methods are well suited for dual drive systems, they may be applicable to systems having more than two drives 180L,180R and/or more than two pickoff sensors 170L, 170R.
For a dual drive flow meter, unwanted electronic zero drift caused by the offset between the front end circuitry of the left and right pickoff channels can be a problem that interferes with the accuracy of the flow meter. Of course, zero drift, for example, without limitation, can be compensated by the methods described above, but these methods alone do not address another source of inaccuracy resulting from known drifts in phase and amplitude on analog-to-digital (a/D) converters and input and digital-to-analog (D/a) converters and corresponding output circuits affecting flow measurements. In an embodiment, phase and amplitude drifts associated with the A/D and D/A converters are compensated.
The a/D converters typically receive analog signals from their respective flow tube sensor output signals. The processor applies a control signal to the a/D converter and receives digitized sample values from the a/D converter. For example, and without limitation, the processor may determine the Δ t value from the phase difference between the sampling channels. The D/a converter then converts the digital signal value to an analog signal proportional to the mass flow rate. Those of ordinary skill in the art will readily recognize that the clock signals required by the various components may be generated by any well-known clock generation technique, such as a crystal-controlled oscillator, or any of several commercially available clock generation integrated circuits.
The a/D converter is typically embedded within a single integrated circuit having a plurality of converters and a single communication bus connected to the DPS processor. This helps to ensure that the phase relationship between the sampled signals is due to the coriolis effect of the vibrating flow tube, rather than the effect of the signal traces routed on the printed circuit board to physically separate the a/D converter circuits. Many such stereoscopic a/D converter chips are known to those skilled in the art. One example of such a chip is the crystalline semiconductor CS5329, 2-channel stereo a/D converter device. As described above, these signal processing methods and electronic devices are more fully described in U.S. patent No. 5,734,112.
As is well known in the art, the input phase offset is simply an electronic zero. The constant offset in phase between the two input channels can simply be subtracted before converting at into a stream. Historically, input phase drift has been largely addressed by the exact matching of input circuit components. On the other hand, input amplitude excursions, which are not a big problem for standard single drive flow meters, are important to address dual drive meters. It is desirable to ensure that the modal filter vector derived from the detector signal is optimised. Even if the picker positions (i.e., the eigenvector coefficients at the pick-off sensors 170L, 170R) are symmetric, the input circuits of the pick-off sensors 170L,170R and the a/D converters may have deviations or offsets from each other.
Similarly, input amplitude excursions are not a significant problem for standard single drive flowmeters and are generally ignored. The detector amplitude is used for drive control, with the maximum detector signal being used as the amplitude feedback signal. Smart meter verification typically measures a substantial difference between the right picker stiffness and the left picker stiffness. This offset is addressed by normalizing the stiffness to the factory reference stiffness of the individual pickups, ignoring any amplitude offset.
It is desirable to ensure that the modal filter vector derived from the pick-off signals is optimised. This assumes that the picker positions (i.e., the eigenvector coefficients at the pickoff sensors 170L, 170R) are symmetric. However, the input circuits of the detection sensors 170L,170R and the a/D converters may have a deviation or offset from each other. A preliminary calibration of the input circuit can be achieved and during this calibration step one detector can be fed to both channels simultaneously. The software gain is therefore adjustable to ensure that the front-end circuit reads the same voltage. This calibration step is typically done in the calculation of modal filter vectors and can be easily implemented in a production environment. With an exact match of the components required to minimize phase drift, it is reasonable to expect that the amplitude drift will be negligible. In an embodiment, the current measurement through the dual drives is the input, and the input circuit for the current measurement and the A/D converter can be calibrated as the pickoff input channel. In some embodiments, the calibration current measurements include additional hardware on the embedded electronic device, such as, for example and without limitation, a relay or an externally accessible jumper.
Amplitude offsets in the two output channels of drivers 180L,180R will excite residual bending of the torsional mode, resulting in interference signals. The calibration output circuit is accomplished in an embodiment by sending the same signal to both drive channels. The measured currents may then be compared and the gain on one of the output channels may be adjusted until the measured currents are equal. This will ensure that the output currents of the two drivers 180L,180R are equal, after which the force projection vector as described above can be accurately calculated. Thus, in case the electronic device components/signals are correctly matched, the amplitude drift will be negligible.
The above detailed description of embodiments is not an exhaustive description of all embodiments contemplated by the inventors to be within the scope of the invention. Indeed, those skilled in the art will recognize that certain elements of the above-described embodiments may be variously combined or eliminated to produce further embodiments, and that such further embodiments fall within the scope and teachings of the invention. Those of ordinary skill in the art will also recognize that the above-described embodiments may be combined in whole or in part to create additional embodiments within the scope and teachings of the present invention. Thus, while specific embodiments of, and examples for, the invention are described herein for illustrative purposes, various equivalent modifications are possible within the scope of the invention, as those skilled in the relevant art will recognize. The teachings provided herein are applicable to other vibratory systems and not just the embodiments described above and shown in the figures. The scope of the invention should, therefore, be determined only by the following claims.
Claims (23)
1. A method of determining a left feature vector, comprising:
placing a material into a flow tube while exciting a vibration mode of the flow tube, wherein exciting the vibration mode of the flow tube comprises the steps of:
periodically driving a first driver with a first signal;
periodically driving a second driver with a second signal, wherein the second driver is driven in phase with the first driver, wherein the drive amplitude modulation signal of the first driver reaches a maximum amplitude when the drive amplitude modulation signal of the second driver reaches a minimum amplitude, and the drive amplitude modulation signal of the first driver reaches a minimum amplitude when the drive amplitude modulation signal of the second driver reaches a maximum amplitude;
measuring a relative phase between the first detector and the second detector;
determining a relative phase of a right eigenvector of the flow tube; measuring a frequency shift that occurs between when the drive amplitude modulation signal of the first driver reaches a maximum amplitude and when the drive amplitude modulation signal of the second driver reaches a maximum amplitude;
shifting the first signal with a phase shift;
adjusting a first signal offset until the frequency shift is undetectable; and
determining a relative phase of a left eigenvector coefficient from the first signal offset required to make the frequency shift undetectable.
2. The method of claim 1, wherein the step of determining the actual flow of the material through the flow tube further comprises:
determining an uncorrected flow of the material through the flow tube using the relative phase of the right eigenvector; and
determining a zero offset for the flow of the material through the flow tube using the phase of the left eigenvector coefficients.
3. The method of claim 2, further comprising:
determining material flow through the flow tube using the relative phase of the right eigenvector corrected by the zero offset.
4. The method of claim 1, further comprising:
determining a relative phase of the right eigenvector; and
determining a zero offset for the flow of the material through the flow tube by weighted averaging the relative phase of the right eigenvector with the relative phase of the left eigenvector.
5. The method of claim 1, further comprising:
estimating a frequency shift caused by the driver cycling; and
associating the frequency shift with a stream.
6. The method of claim 5, wherein the frequency is estimated using a frequency modulated second order infinite impulse response adaptive notch filter.
7. The method of claim 6, further comprising:
inputting a notch filter sharpness (α) parameter into meter electronics;
inputting a notch filter modulation frequency (fm) parameter into the meter electronics;
determining a notch filter adaptation rate (λ) parameter based on the notch filter modulation frequency (fm) parameter and the sharpness (α) parameter; and
a detector signal is input into the adaptive notch filter, wherein the adaptive notch filter has a center frequency adapted to minimize the filter output.
8. The method of claim 6, wherein the output of the notch filter is demodulated at a cyclic frequency.
9. The method of claim 1, further comprising:
the first driver and the first detection sensor are arranged at the same position; and
the second driver and the second detection sensor are arranged at the same position.
10. The method of claim 1, wherein the step of periodically driving the first driver with the first signal comprises sinusoidally driving the first driver, and wherein the step of periodically driving the second driver with the second signal comprises sinusoidally driving the second driver.
11. A method of determining material flow through a flow tube, comprising:
flowing material through a flow tube while periodically exciting a vibration mode of the flow tube such that a drive amplitude modulation signal of a first driver reaches a maximum amplitude when a drive amplitude modulation signal of a second driver reaches a minimum amplitude, and the drive amplitude modulation signal of the first driver reaches a minimum amplitude when the drive amplitude modulation signal of the second driver reaches a maximum amplitude;
measuring relative motion of the vibrating flow tube;
measuring the relative phase of the right eigenvector while exciting a vibration mode of the flow tube;
determining material flow through the flow tube using the relative phase of the right eigenvector corrected by zero offset;
determining a new zero offset using the relative phase of the left eigenvector of the flow tube without stopping the flow of material through the flow tube; and
determining the material flow through the flow tube using the relative phase of the right eigenvector corrected by the new zero offset.
12. The method of claim 11, further comprising:
the first driver and the first detection sensor are arranged at the same position; and
the second driver and the second detection sensor are arranged at the same position.
13. A vibratory flow meter (5), comprising:
a flow meter assembly (10) including one or more flow tubes (130,130') and first (170L) and second (170R) pickoffs;
a first driver (180L) and a second driver (180R) configured to vibrate the one or more flow tubes (130, 130'); and
meter electronics (20) coupled to the first pickoff sensor (170L) and the second pickoff sensor (170R), and to the first driver (180L) and the second driver (180R), wherein the meter electronics (20) is configured to provide a first signal to the first driver (180L) and a second signal to the second driver (180R), wherein the second driver (180R) is driven in phase with the first driver (180L), wherein a drive amplitude modulation signal of the first driver (180L) reaches a maximum amplitude when a drive amplitude modulation signal of the second driver (180R) reaches a minimum amplitude, and a drive amplitude modulation signal of the first driver (180L) reaches a minimum amplitude when a drive amplitude modulation signal of the second driver (180R) reaches a maximum amplitude, and wherein the meter electronics (20) is further configured to measure a relative phase between a first detector (170L) and a second detector (170R), determine a relative phase of a right eigenvector of the flow tube, measure a frequency shift that occurs between when a drive amplitude modulation signal of the first driver (180L) reaches a maximum amplitude and when a drive amplitude modulation signal of the second driver (180R) reaches a maximum amplitude, shift the first signal with a phase shift, adjust a first signal shift until the frequency shift is undetectable, and determine a phase of a left eigenvector coefficient of the first signal shift required to make the frequency shift undetectable.
14. The vibratory flow meter (5) of claim 13, with the meter electronics (20) being further configured to determine an uncorrected flow of material through the one or more flow tubes (130,130') using the relative phase of the right eigenvector and to determine a zero offset for the flow of material through the one or more flow tubes (130,130') using the phase of the left eigenvector coefficient.
15. The vibratory flow meter (5) of claim 14, with the meter electronics (20) being further configured to determine material flow through the one or more flow tubes (130,130') using the relative phase of the right eigenvector corrected by the zero offset.
16. The vibratory flow meter (5) of claim 13, with the meter electronics (20) being further configured to determine a relative phase of a right eigenvector, and determine a zero offset for the flow of material through the one or more flow tubes (130,130') by weighted averaging the relative phase of the right eigenvector with the relative phase of the left eigenvector.
17. The vibratory flow meter (5) of claim 16, with the meter electronics (20) being further configured to estimate a frequency shift caused by driver cycling and to correlate the frequency shift to flow.
18. The vibratory flowmeter (5) of claim 17, comprising a frequency modulated second order infinite impulse response adaptive notch filter, wherein the meter electronics (20) is configured to perform frequency transfer estimation.
19. The vibratory flow meter (5) of claim 17, with the meter electronics (20) being further configured to receive a notch filter sharpness (a) parameter and a notch filter modulation frequency (fm), with the meter electronics (20) being configured to determine a notch filter adaptation (λ) parameter based on the notch filter modulation frequency (fm) and the sharpness (a) parameter; and receiving the detected signal in an adaptive notch filter, wherein the adaptive notch filter has a center frequency adapted to minimize the filter output.
20. The vibratory flow meter (5) of claim 19, with the output of the notch filter being demodulated at a cycle frequency.
21. The vibratory flow meter (5) of claim 13, with the first driver (180L) being co-located with the first pickoff sensor (170L) and with the second driver (180R) being co-located with the second pickoff sensor (170R).
22. The vibratory flow meter (5) of claim 13, with the first signal comprising a sinusoid.
23. The vibratory flow meter (5) of claim 18, with the filter comprising a plurality of filter coefficients.
Applications Claiming Priority (1)
| Application Number | Priority Date | Filing Date | Title |
|---|---|---|---|
| PCT/US2015/042265 WO2017019016A1 (en) | 2015-07-27 | 2015-07-27 | A method of determining the left eigenvectors in a flowing coriolis flowmeter |
Publications (2)
| Publication Number | Publication Date |
|---|---|
| CN107850478A CN107850478A (en) | 2018-03-27 |
| CN107850478B true CN107850478B (en) | 2020-11-10 |
Family
ID=53765636
Family Applications (1)
| Application Number | Title | Priority Date | Filing Date |
|---|---|---|---|
| CN201580081969.9A Active CN107850478B (en) | 2015-07-27 | 2015-07-27 | Method for determining left eigenvector in flow coriolis flowmeter |
Country Status (5)
| Country | Link |
|---|---|
| US (1) | US10788348B2 (en) |
| EP (1) | EP3329229B1 (en) |
| JP (1) | JP6615311B2 (en) |
| CN (1) | CN107850478B (en) |
| WO (1) | WO2017019016A1 (en) |
Families Citing this family (6)
| Publication number | Priority date | Publication date | Assignee | Title |
|---|---|---|---|---|
| CA3067199C (en) * | 2017-06-14 | 2023-05-16 | Micro Motion, Inc. | A notch filter in a vibratory flow meter |
| FR3074913B1 (en) * | 2017-12-08 | 2019-11-22 | Sagemcom Energy & Telecom Sas | METHOD FOR MEASURING A SPEED OF A FLUID |
| WO2020014140A1 (en) * | 2018-07-11 | 2020-01-16 | Micro Motion, Inc. | Method of determining total prove time |
| WO2021255034A1 (en) | 2020-06-18 | 2021-12-23 | Endress+Hauser Flowtec Ag | Vibronic measuring system |
| DE102020131649A1 (en) | 2020-09-03 | 2022-03-03 | Endress + Hauser Flowtec Ag | Vibronic measuring system |
| US11885663B2 (en) * | 2020-12-23 | 2024-01-30 | Endress+Hauser Flowtec Ag | Flowmeter calibration system and method |
Family Cites Families (13)
| Publication number | Priority date | Publication date | Assignee | Title |
|---|---|---|---|---|
| JPH07295605A (en) * | 1994-04-19 | 1995-11-10 | Recon Opt Inc | Method and equipment that is adjusted automatically to stabilize plant |
| JP3252641B2 (en) * | 1994-09-13 | 2002-02-04 | 富士電機株式会社 | Phase difference measuring device |
| US5734112A (en) | 1996-08-14 | 1998-03-31 | Micro Motion, Inc. | Method and apparatus for measuring pressure in a coriolis mass flowmeter |
| US6199022B1 (en) * | 1997-07-11 | 2001-03-06 | Micro Motion, Inc. | Drive circuit modal filter for a vibrating tube flowmeter |
| US6092429A (en) | 1997-12-04 | 2000-07-25 | Micro Motion, Inc. | Driver for oscillating a vibrating conduit |
| MY124536A (en) * | 2000-03-14 | 2006-06-30 | Micro Motion Inc | Initialization algorithm for drive control in a coriolis flowmeter |
| DE10138323C1 (en) * | 2001-08-10 | 2003-04-17 | Danfoss As | Mass flow meter and method for measuring a mass flow |
| JP3925694B2 (en) * | 2001-10-25 | 2007-06-06 | 横河電機株式会社 | Coriolis mass flow meter |
| WO2006031215A1 (en) | 2004-09-09 | 2006-03-23 | Micro Motion, Inc. | A method and apparatus for measuring flow through a conduit by measuring coriolis coupling between two vibration modes |
| EP1794549B1 (en) * | 2004-09-27 | 2019-03-27 | Micro Motion, Inc. | In-flow determination of left and right eigenvectors in a coriolis flowmeter |
| DE102007028209A1 (en) | 2007-06-15 | 2008-12-18 | Endress + Hauser Flowtec Ag | Method for measuring and / or monitoring a flow parameter and corresponding device |
| DE102011012498A1 (en) * | 2010-11-19 | 2012-05-24 | Krohne Messtechnik Gmbh | Method for operating resonant measuring system, particularly in form of coriolis mass flow meter or in form of density measuring device, involves determining measured value for amplitude-dependent state variable of multi-phase medium |
| CA2837874C (en) * | 2011-06-27 | 2018-08-28 | Micro Motion, Inc. | Vibratory flow meter and zero check method |
-
2015
- 2015-07-27 CN CN201580081969.9A patent/CN107850478B/en active Active
- 2015-07-27 WO PCT/US2015/042265 patent/WO2017019016A1/en active Application Filing
- 2015-07-27 EP EP15745123.8A patent/EP3329229B1/en active Active
- 2015-07-27 US US15/745,040 patent/US10788348B2/en active Active
- 2015-07-27 JP JP2018504120A patent/JP6615311B2/en active Active
Also Published As
| Publication number | Publication date |
|---|---|
| US10788348B2 (en) | 2020-09-29 |
| EP3329229B1 (en) | 2020-09-02 |
| JP6615311B2 (en) | 2019-12-04 |
| US20180266864A1 (en) | 2018-09-20 |
| WO2017019016A1 (en) | 2017-02-02 |
| EP3329229A1 (en) | 2018-06-06 |
| JP2018526627A (en) | 2018-09-13 |
| CN107850478A (en) | 2018-03-27 |
Similar Documents
| Publication | Publication Date | Title |
|---|---|---|
| CN107850478B (en) | Method for determining left eigenvector in flow coriolis flowmeter | |
| KR101201392B1 (en) | Vibratory flow meter and method for determining a fluid temperature of a flow material | |
| KR100976233B1 (en) | Diagnostic apparatus and methods for a coriolis flow meter | |
| AU2014278632B2 (en) | Vibratory flowmeter and method for meter verification | |
| KR100973772B1 (en) | In-flow determination of left and right eigenvectors in a coriolis flowmeter | |
| CN107850479B (en) | Non-resonant circulation for coriolis flowmeters | |
| CN107850477B (en) | Ramp time free vibratory flowmeter test tone | |
| AU2018437114B2 (en) | Determining a decay characteristic of a meter assembly | |
| KR102528999B1 (en) | Meter electronics and methods for verification diagnostics on flow meters |
Legal Events
| Date | Code | Title | Description |
|---|---|---|---|
| PB01 | Publication | ||
| PB01 | Publication | ||
| SE01 | Entry into force of request for substantive examination | ||
| SE01 | Entry into force of request for substantive examination | ||
| REG | Reference to a national code |
Ref country code: HK Ref legal event code: DE Ref document number: 1252846 Country of ref document: HK |
|
| GR01 | Patent grant | ||
| GR01 | Patent grant |