CN105579828B - Image type cell instrument - Google Patents
Image type cell instrument Download PDFInfo
- Publication number
- CN105579828B CN105579828B CN201480031377.1A CN201480031377A CN105579828B CN 105579828 B CN105579828 B CN 105579828B CN 201480031377 A CN201480031377 A CN 201480031377A CN 105579828 B CN105579828 B CN 105579828B
- Authority
- CN
- China
- Prior art keywords
- light
- sample
- image
- light source
- sample chamber
- Prior art date
- Legal status (The legal status is an assumption and is not a legal conclusion. Google has not performed a legal analysis and makes no representation as to the accuracy of the status listed.)
- Active
Links
- 239000002245 particle Substances 0.000 claims abstract description 141
- 238000001514 detection method Methods 0.000 claims abstract description 97
- 230000003287 optical effect Effects 0.000 claims abstract description 95
- 230000005284 excitation Effects 0.000 claims abstract description 75
- 238000000034 method Methods 0.000 claims abstract description 35
- 239000000523 sample Substances 0.000 claims description 265
- 239000012472 biological sample Substances 0.000 claims description 27
- 238000005286 illumination Methods 0.000 claims description 24
- 238000012545 processing Methods 0.000 claims description 14
- 239000000758 substrate Substances 0.000 claims description 10
- 239000000725 suspension Substances 0.000 claims description 7
- 230000010365 information processing Effects 0.000 claims 1
- 238000004458 analytical method Methods 0.000 abstract description 13
- 238000004163 cytometry Methods 0.000 abstract description 5
- 210000004027 cell Anatomy 0.000 description 34
- 230000000694 effects Effects 0.000 description 18
- 238000011156 evaluation Methods 0.000 description 13
- 238000003384 imaging method Methods 0.000 description 10
- 230000000284 resting effect Effects 0.000 description 10
- 230000008859 change Effects 0.000 description 8
- 239000007788 liquid Substances 0.000 description 8
- 239000011324 bead Substances 0.000 description 6
- 230000008901 benefit Effects 0.000 description 6
- 230000002238 attenuated effect Effects 0.000 description 5
- 230000003993 interaction Effects 0.000 description 5
- 238000001454 recorded image Methods 0.000 description 5
- 238000010521 absorption reaction Methods 0.000 description 4
- 238000002073 fluorescence micrograph Methods 0.000 description 4
- 238000000386 microscopy Methods 0.000 description 4
- 230000002829 reductive effect Effects 0.000 description 4
- 239000007787 solid Substances 0.000 description 4
- 238000003491 array Methods 0.000 description 3
- 238000000799 fluorescence microscopy Methods 0.000 description 3
- 238000005259 measurement Methods 0.000 description 3
- 239000000203 mixture Substances 0.000 description 3
- 230000008569 process Effects 0.000 description 3
- 241000894007 species Species 0.000 description 3
- 239000000126 substance Substances 0.000 description 3
- 230000003321 amplification Effects 0.000 description 2
- 230000000903 blocking effect Effects 0.000 description 2
- 238000006243 chemical reaction Methods 0.000 description 2
- 238000010276 construction Methods 0.000 description 2
- 230000003247 decreasing effect Effects 0.000 description 2
- 230000001419 dependent effect Effects 0.000 description 2
- 238000013461 design Methods 0.000 description 2
- 238000010586 diagram Methods 0.000 description 2
- 239000006185 dispersion Substances 0.000 description 2
- 238000012921 fluorescence analysis Methods 0.000 description 2
- 230000005484 gravity Effects 0.000 description 2
- 239000012535 impurity Substances 0.000 description 2
- 230000000670 limiting effect Effects 0.000 description 2
- 239000000463 material Substances 0.000 description 2
- 230000002503 metabolic effect Effects 0.000 description 2
- 238000003199 nucleic acid amplification method Methods 0.000 description 2
- 238000002135 phase contrast microscopy Methods 0.000 description 2
- 102000004169 proteins and genes Human genes 0.000 description 2
- 108090000623 proteins and genes Proteins 0.000 description 2
- 238000005086 pumping Methods 0.000 description 2
- 238000004062 sedimentation Methods 0.000 description 2
- 230000035945 sensitivity Effects 0.000 description 2
- 230000003068 static effect Effects 0.000 description 2
- 238000012800 visualization Methods 0.000 description 2
- 241000894006 Bacteria Species 0.000 description 1
- 201000008808 Fibrosarcoma Diseases 0.000 description 1
- 241001529936 Murinae Species 0.000 description 1
- 240000004808 Saccharomyces cerevisiae Species 0.000 description 1
- 238000002835 absorbance Methods 0.000 description 1
- 230000009471 action Effects 0.000 description 1
- 230000004913 activation Effects 0.000 description 1
- 230000001464 adherent effect Effects 0.000 description 1
- 230000004075 alteration Effects 0.000 description 1
- 230000006907 apoptotic process Effects 0.000 description 1
- 230000004071 biological effect Effects 0.000 description 1
- 239000012620 biological material Substances 0.000 description 1
- 239000000090 biomarker Substances 0.000 description 1
- 230000022131 cell cycle Effects 0.000 description 1
- 210000000170 cell membrane Anatomy 0.000 description 1
- 239000006285 cell suspension Substances 0.000 description 1
- 238000012512 characterization method Methods 0.000 description 1
- 239000003153 chemical reaction reagent Substances 0.000 description 1
- 210000004978 chinese hamster ovary cell Anatomy 0.000 description 1
- 230000002301 combined effect Effects 0.000 description 1
- 230000002380 cytological effect Effects 0.000 description 1
- 230000005670 electromagnetic radiation Effects 0.000 description 1
- 238000005188 flotation Methods 0.000 description 1
- 239000012530 fluid Substances 0.000 description 1
- 229920001109 fluorescent polymer Polymers 0.000 description 1
- 230000006872 improvement Effects 0.000 description 1
- 230000000977 initiatory effect Effects 0.000 description 1
- 238000003780 insertion Methods 0.000 description 1
- 230000037431 insertion Effects 0.000 description 1
- 230000010354 integration Effects 0.000 description 1
- 230000003834 intracellular effect Effects 0.000 description 1
- 208000032839 leukemia Diseases 0.000 description 1
- 230000031700 light absorption Effects 0.000 description 1
- 210000004962 mammalian cell Anatomy 0.000 description 1
- 230000000873 masking effect Effects 0.000 description 1
- 238000007431 microscopic evaluation Methods 0.000 description 1
- 230000004899 motility Effects 0.000 description 1
- 230000009467 reduction Effects 0.000 description 1
- 238000002310 reflectometry Methods 0.000 description 1
- 238000000926 separation method Methods 0.000 description 1
- 238000001228 spectrum Methods 0.000 description 1
- 230000001629 suppression Effects 0.000 description 1
- 238000013519 translation Methods 0.000 description 1
- 230000035899 viability Effects 0.000 description 1
- XLYOFNOQVPJJNP-UHFFFAOYSA-N water Substances O XLYOFNOQVPJJNP-UHFFFAOYSA-N 0.000 description 1
Images


Classifications
-
- G—PHYSICS
- G01—MEASURING; TESTING
- G01N—INVESTIGATING OR ANALYSING MATERIALS BY DETERMINING THEIR CHEMICAL OR PHYSICAL PROPERTIES
- G01N15/00—Investigating characteristics of particles; Investigating permeability, pore-volume, or surface-area of porous materials
- G01N15/10—Investigating individual particles
- G01N15/14—Electro-optical investigation, e.g. flow cytometers
- G01N15/1434—Electro-optical investigation, e.g. flow cytometers using an analyser being characterised by its optical arrangement
-
- G—PHYSICS
- G01—MEASURING; TESTING
- G01N—INVESTIGATING OR ANALYSING MATERIALS BY DETERMINING THEIR CHEMICAL OR PHYSICAL PROPERTIES
- G01N15/00—Investigating characteristics of particles; Investigating permeability, pore-volume, or surface-area of porous materials
- G01N15/02—Investigating particle size or size distribution
- G01N15/0205—Investigating particle size or size distribution by optical means, e.g. by light scattering, diffraction, holography or imaging
- G01N15/0227—Investigating particle size or size distribution by optical means, e.g. by light scattering, diffraction, holography or imaging using imaging, e.g. a projected image of suspension; using holography
-
- G01N15/1433—
-
- G—PHYSICS
- G01—MEASURING; TESTING
- G01N—INVESTIGATING OR ANALYSING MATERIALS BY DETERMINING THEIR CHEMICAL OR PHYSICAL PROPERTIES
- G01N21/00—Investigating or analysing materials by the use of optical means, i.e. using sub-millimetre waves, infrared, visible or ultraviolet light
- G01N21/62—Systems in which the material investigated is excited whereby it emits light or causes a change in wavelength of the incident light
- G01N21/63—Systems in which the material investigated is excited whereby it emits light or causes a change in wavelength of the incident light optically excited
- G01N21/64—Fluorescence; Phosphorescence
- G01N21/6428—Measuring fluorescence of fluorescent products of reactions or of fluorochrome labelled reactive substances, e.g. measuring quenching effects, using measuring "optrodes"
-
- G—PHYSICS
- G06—COMPUTING; CALCULATING OR COUNTING
- G06T—IMAGE DATA PROCESSING OR GENERATION, IN GENERAL
- G06T7/00—Image analysis
- G06T7/0002—Inspection of images, e.g. flaw detection
- G06T7/0012—Biomedical image inspection
-
- G—PHYSICS
- G06—COMPUTING; CALCULATING OR COUNTING
- G06V—IMAGE OR VIDEO RECOGNITION OR UNDERSTANDING
- G06V20/00—Scenes; Scene-specific elements
- G06V20/60—Type of objects
- G06V20/69—Microscopic objects, e.g. biological cells or cellular parts
-
- G01N15/01—
-
- G—PHYSICS
- G01—MEASURING; TESTING
- G01N—INVESTIGATING OR ANALYSING MATERIALS BY DETERMINING THEIR CHEMICAL OR PHYSICAL PROPERTIES
- G01N15/00—Investigating characteristics of particles; Investigating permeability, pore-volume, or surface-area of porous materials
- G01N15/10—Investigating individual particles
- G01N2015/1006—Investigating individual particles for cytology
-
- G—PHYSICS
- G01—MEASURING; TESTING
- G01N—INVESTIGATING OR ANALYSING MATERIALS BY DETERMINING THEIR CHEMICAL OR PHYSICAL PROPERTIES
- G01N15/00—Investigating characteristics of particles; Investigating permeability, pore-volume, or surface-area of porous materials
- G01N15/10—Investigating individual particles
- G01N15/14—Electro-optical investigation, e.g. flow cytometers
- G01N15/1434—Electro-optical investigation, e.g. flow cytometers using an analyser being characterised by its optical arrangement
- G01N2015/1438—Using two lasers in succession
-
- G—PHYSICS
- G01—MEASURING; TESTING
- G01N—INVESTIGATING OR ANALYSING MATERIALS BY DETERMINING THEIR CHEMICAL OR PHYSICAL PROPERTIES
- G01N15/00—Investigating characteristics of particles; Investigating permeability, pore-volume, or surface-area of porous materials
- G01N15/10—Investigating individual particles
- G01N15/14—Electro-optical investigation, e.g. flow cytometers
- G01N15/1434—Electro-optical investigation, e.g. flow cytometers using an analyser being characterised by its optical arrangement
- G01N2015/144—Imaging characterised by its optical setup
-
- G—PHYSICS
- G01—MEASURING; TESTING
- G01N—INVESTIGATING OR ANALYSING MATERIALS BY DETERMINING THEIR CHEMICAL OR PHYSICAL PROPERTIES
- G01N15/00—Investigating characteristics of particles; Investigating permeability, pore-volume, or surface-area of porous materials
- G01N15/10—Investigating individual particles
- G01N15/14—Electro-optical investigation, e.g. flow cytometers
- G01N2015/1493—Particle size
- G01N2015/1495—Deformation of particles
-
- G—PHYSICS
- G01—MEASURING; TESTING
- G01N—INVESTIGATING OR ANALYSING MATERIALS BY DETERMINING THEIR CHEMICAL OR PHYSICAL PROPERTIES
- G01N2201/00—Features of devices classified in G01N21/00
- G01N2201/06—Illumination; Optics
- G01N2201/061—Sources
- G01N2201/06113—Coherent sources; lasers
- G01N2201/0612—Laser diodes
-
- G—PHYSICS
- G06—COMPUTING; CALCULATING OR COUNTING
- G06T—IMAGE DATA PROCESSING OR GENERATION, IN GENERAL
- G06T2207/00—Indexing scheme for image analysis or image enhancement
- G06T2207/10—Image acquisition modality
- G06T2207/10056—Microscopic image
-
- G—PHYSICS
- G06—COMPUTING; CALCULATING OR COUNTING
- G06T—IMAGE DATA PROCESSING OR GENERATION, IN GENERAL
- G06T2207/00—Indexing scheme for image analysis or image enhancement
- G06T2207/10—Image acquisition modality
- G06T2207/10064—Fluorescence image
-
- G—PHYSICS
- G06—COMPUTING; CALCULATING OR COUNTING
- G06T—IMAGE DATA PROCESSING OR GENERATION, IN GENERAL
- G06T2207/00—Indexing scheme for image analysis or image enhancement
- G06T2207/30—Subject of image; Context of image processing
- G06T2207/30004—Biomedical image processing
- G06T2207/30024—Cell structures in vitro; Tissue sections in vitro
Abstract
The present invention relates to methods and systems for image cytometry analysis, typically at low optical magnification, wherein the analysis is based on the detection of biological particles using one or more sources of UV bright field and optionally excitation light.
Description
Technical Field
The present invention relates to methods and systems for image-based cytological analysis, typically at low optical magnification, wherein the analysis is based on the detection of biological particles.
Background
Microscopes have been used for a long time for the analysis of biological materials. In order to see an object under a microscope, it is necessary that the object exhibits an optical characteristic different from that of the background and the difference is called contrast. Biological particles are usually composed mainly of water contained in cell membranes, which makes them inherently similar to their surroundings. The interior of a cell often differs from the surrounding fluid in certain chemical compositions such as proteins, DNA and RNA, some of which form "structures" whose dimensions may be visualized, for example DNA packed into the nucleus of the cell. Biological particles, such as mammalian cells, yeast and bacteria are relatively small, typically less than about 20 μm in diameter, which can make it difficult to view them under a microscope unless some advanced technique is applied. Such techniques are high magnification, phase contrast and UV microscopy and with the introduction of digital techniques, several image enhancement techniques have been introduced.
High magnification microscopes typically use more than 50 magnifications, which enable the separation of microscopic structures, facilitating the visualization and identification of biological particles. Phase contrast microscopy makes use of small differences in refractive index to produce images with high contrast. UV microscopy exploits the absorption properties of proteins and DNA, which absorb light at about 260 and 280nm, respectively. The absorbance of light is seen as contrast in the microscope. Further, short wavelength light enables smaller structures to be separated than would be possible with longer wavelength light, since the maximum resolution of the microscope is dependent on the wavelength of the light. Such small structures in biological particles are typically internal structures of cells, such as the nucleus.
In assessing biological particles by image cytometry, it is of utmost importance to know the position of the biological particles in the image. This is of course evident when the task of analyzing the biological particles is to calculate (the enumeration) the particles in the sample, as is the case in almost all cases where other properties of the sample and/or the cells are of interest. A necessary condition for identifying any object in an image is to be able to establish a condition that makes the image of the object significantly different from the image of the surrounding background.
Typical microscopy is based on optical properties that do not change the wavelength of light, such as differences in refractive index, reflectivity or attenuation, whereas methods such as fluorescence microscopy are based on shifts in the wavelength of light, typically brought about by quantum mechanical properties of matter.
In a microscope, this difference is commonly referred to as "contrast". There are several methods of generating contrast in microscopes, two basic methods being Dark Field (DF) and Bright Field (BF) microscopes, where the intensity of the "field" signal refers to the intensity of the background, i.e. the region separating the images of any object that may be present. Thus, in DF, the background is dark and the object has a higher intensity, as opposed to BF where the background is luminous and the image of the object represents a reduction in light.
Both DF and BF microscopy methods result in images of rather poor contrast when considering microscopic analysis of biological particles such as biological cells. There are therefore additional techniques widely used for biological particle analysis, as they typically provide greater contrast of images, such as phase contrast and fluorescence microscopy. Both methods have advantages and disadvantages when implemented for identifying biological particles. Phase contrast microscopes require special optical components, whereas fluorescence microscopes are limited by the selectivity defined by the fluorophore system used, which must either be present in the particle or bound to the particle.
Disclosure of Invention
The present invention provides a simple, effective and reliable method of recording images of biological particles with considerable contrast, which makes the method and system according to the present invention particularly suitable for identifying particles in an Image Cytometry.
The invention provides an image type cytometer, comprising:
-a first light source configured to emit light towards the sample area;
-focusing means for forming collimated light and directing the collimated light from the first light source along the optical axis of the cytometer;
-a second light source comprising a first excitation light source for emitting excitation light towards the sample region; and
-image forming means for forming an image of at least a part of the sample area on the array of detection elements, wherein
The sample region is located between the focusing means and the array of detector elements, and wherein
The cytometer can be configured to switch between a bright field mode, a dark field mode, and a fluorescence mode, and/or wherein
The first light source is configured to emit light having a wavelength of less than 400nm, and/or wherein
The excitation light has an angle of incidence with respect to the optical axis to provide a fluorescence mode.
The invention further provides an illumination system for an image cytometer, comprising:
-a first light source configured to emit light;
-focusing means for directing light from the first light source along the optical axis of the image cytometer and into the sample region; and
-a second light source comprising a first excitation light source configured to emit excitation light and into the sample region, wherein
The light from the first light source is configured to emit light having a wavelength of less than 400 nm.
Still further, the present invention provides a method for assessing at least one quantitative parameter and/or one quality parameter of a biological sample, comprising:
-applying a volume of biological sample into a sample chamber having parallel walls defining an exposure area, said walls allowing light from the image cytometer according to claims 1-51 to pass through the walls of the sample chamber,
illuminating the sample chamber with light from the first light source and exposing the light passing through the sample chamber onto the 2-dimensional array of active detection elements, thereby recording an image of spatial light intensity information,
illuminating the sample chamber with excitation light from the second light source and exposing the fluorescence light passing through the sample chamber onto the 2-dimensional array of active detection elements, thereby recording an image of fluorescence spatial light intensity information,
processing the two images in such a way that light intensity information from the individual biological particles is identified as being different from light intensity information from the background,
and correlating the processing result with at least one quantity parameter and/or quality parameter of the biological particles in the biological sample.
Drawings
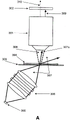
FIG. 1 is a schematic diagram of an embodiment of the image cytometer according to the present invention.
FIG. 2A shows a graph depicting the contrast observed.
FIGS. 2B-G depict bright field images recorded using light of different wavelengths.
Fig. 3 depicts the arrangement of tilted light sources and the effect of masking the light.
FIG. 4 shows a graph plotting the intensity of fluorescent polymer beads.
FIG. 5 depicts the construction of passive light modulation in a bright field image.
Detailed Description
A first effect of the image cytometer according to one embodiment is that the image cytometer can be configured to switch between bright field mode, dark field mode, and fluorescence mode. In a preferred embodiment of the invention, the first light source may provide a bright field light source and a dark field light source, such that only a single light source is required for both bright field mode and dark field mode. Thus, the exchange between the two modes can be obtained by the exchange means without changing the light source or the optical means. Preferably, the first light source is configured to emit light having a wavelength of less than 400 nm. In this regard, the first light source may be considered an Ultraviolet (UV) bright field light source. It has been found that the effect of using a UV bright field light source is that such illumination provides more detail about the particles, and/or higher image contrast, than images recorded with light from a light source emitting light at wavelengths greater than 400 nm.
According to the present invention, the second light source may provide the fluorescent pattern, and the present invention has an effect that the fluorescent pattern may be provided without moving the second light source or a member that may guide the fluorescent light from the second light source. In other words, the fluorescent pattern may be provided quickly, as the fluorescent light source may not move or the components that may guide the fluorescent light source may not move. Preferably, the excitation light has an angle of incidence with respect to the optical axis, the optical axis of the image cytometer being defined by the axis between the sample region and the array of detection elements, thereby providing a fluorescence pattern. It has been found that one effect of such an arrangement is that the intensity of the excitation light exposed at the detection element can be significantly reduced.
Attenuator and modulator
In a preferred embodiment of the invention, the image cytometer further comprises attenuation means, such as optical filters, to attenuate the light intensity of one or more predetermined wavelength bands, preferably wherein the attenuation means is positioned at a predetermined plane along the optical axis. Even further, the image cytometer may further comprise a modulation device, such as a spatial modulation device, preferably wherein the modulation device is positioned at a predetermined plane along the optical axis. In some embodiments of the invention, the attenuating means and/or the modulating means are placed in the light path between the first light source and the sample area. Preferably, the attenuating means and/or modulating means are placed in the optical path between the sample area and the array of detecting elements. More preferably, the modulation means is placed in or close to a focal plane in which collimated light is transmitted through the sample area along the optical axis towards the detection element.
It has been found that placing the modulation means in or near the focal plane of collimated light transmitted through the sample area has many effects. Firstly, the contrast, for example at high spatial frequencies, is improved relative to an arrangement without modulation means at this location. Secondly, the modulation means may produce an extended depth of field since the focal plane of the collimated light may be the aperture stop of the image forming device. Third, the modulation means may allow only light in the sample region refracted or dispersed by the sample particles to reach the detection element and eliminate light directly emitted from the light source. By the arrangement of the modulation means at or near the focal plane at which collimated light is transmitted through the sample region, it is possible to achieve an image cytometer with the flexibility to record high contrast bright or dark field images, or a combination of both, simply by placing or removing an appropriate modulator.
In some embodiments of the invention, two or more attenuating devices and/or modulating devices are installed in the exchanging device, which allows to remove or exchange the attenuating devices and/or modulating devices. The exchange means may for example comprise a rotating unit, such as a filter wheel. The two or more switching means may be such that none, one, two or more of the attenuating and/or modulating means may be positioned along the optical axis at the same time. The effect of having two or more switching means may be that these allow modulating means, attenuating means or a combined effect of both means. Another effect may be that two or more exchange devices may exchange attenuation and/or modulation devices more quickly than a single exchange device having the same number of attenuation and/or modulation devices, e.g. because such exchange devices may be smaller and may rotate faster than a single exchange device.
In some embodiments of the invention, at least one of the modulation devices may be partially opaque or partially transparent. The attenuating and/or modulating means may likewise be partially opaque in some parts and partially transparent in other parts, preferably wherein one or more of said parts are circular. Therefore, at least oneA portion of the modulation means may be partially opaque and another portion of the modulation means may be partially transparent. Preferably, the attenuating means is operable to attenuate the light by a predetermined factor, e.g. less than 10-3E.g. less than 10-4E.g. less than 10-5Or for example less than 10-6。
In a preferred embodiment of the invention, the modulation means comprises an obstruction configured for dark field mode, preferably to substantially attenuate collimated light passing through the sample region. In another preferred embodiment of the invention, the modulation means comprises an aperture configured for bright field mode, preferably substantially attenuating non-collimated light emitted from the sample region. By exchanging obstacles and holes, the possibility of an exchange between bright field mode and dark field mode can be achieved. The exchange between the bright-field mode and the dark-field mode can thus be achieved by a modulation means, preferably by inserting and/or exchanging a modulation means between the sample area and the array of detection elements.
In another preferred embodiment of the invention, the modulation means comprise phase difference microscope modulation means. Thus, the modulation means may constitute phase difference microscope modulation means and the substantial wavelength of the light emitted by the first light source is a narrow band, preferably having a band width of less than 50 nm.
First and second light sources
In an optical setup, it is acceptable that complete collimation is not always obtained, and collimated light from the first light source may deviate from collimated light by an off-angle of less than 10 degrees, more preferably less than 5 degrees.
In an embodiment of the invention, the wavelength from the first light source is between 200nm and 700 nm. Preferably, the wavelength from the first light source may be between 300nm and 395 nm. Even more preferably, the wavelength from the first light source may be between 320nm and 380 nm. Most preferably, the wavelength from the first light source may be between 350nm and 380 nm.
The excitation light from the second light source may have a wavelength substantially different from the wavelength of the light from the first light source. Preferably, the angle of incidence of the excitation light may be between 10 and 80 degrees, preferably between 20 and 60 degrees, and more preferably between 30 and 50 degrees. Alternatively, the incident angle of the excitation light may be 90 degrees. In another alternative embodiment of the invention, the angle of incidence is between 110 and 180 degrees, preferably between 120 and 160 degrees, and more preferably between 130 and 150 degrees.
Focusing device
In a preferred embodiment of the invention the focusing means comprise a lens, and in another equally preferred embodiment of the invention the focusing means comprise a curved mirror.
Additional light source
In some embodiments of the invention, the image cytometer further comprises an additional light source, such as a third or fourth or fifth or sixth light source, preferably the additional light source is an excitation light source. The light source may be a light emitting diode and/or a diode laser and/or a laser, for example a tunable solid state light source and/or a tunable light emitting diode. The tunable solid state light source may be a tunable laser diode.
Optical device and detection element
In a preferred embodiment of the invention, the light source is optically connected to an optical arrangement configured to provide light with a substantially uniform intensity across the sample area and/or across the area imaged by the array of detection elements. The optical device may comprise a microlens array. Alternatively, the optical device may comprise an array of cylindrical microlenses, preferably two arrays of cylindrical microlenses oriented substantially perpendicular to the cylindrical lenses. The array of detection elements may be an array of CCD or CMOS sensor elements.
Exposure method
According to the invention, the light source is configured to emit light for a duration of less than 1 second, preferably less than 0.1 second. Preferably, the light source is configured to emit light for a duration of between 0.0001 and 0.1000 seconds, preferably between 0.0001 and 0.0500 seconds. However, in certain cases, such as when high sensitivity is required in fluorescence imaging, the light source may be configured to emit light for a duration of more than 1 second, such as more than 2 seconds, such as more than 3 seconds, such as more than 4 seconds, such as more than 5 seconds, such as more than 6 seconds, such as more than 7 seconds, such as more than 8 seconds, such as more than 9 seconds, or such as more than 10 seconds.
Shading of light
In one embodiment of the present invention, light from the excitation light source that reaches the inlet of the image forming apparatus can be substantially eliminated by selectively removing light from the light beam of the excitation light. The light may be selectively removed by placing one or more obstacles in the beam of excitation light, preferably wherein the beam of excitation light is substantially collimated in the plane in which the obstacles are placed.
Image forming apparatus with a toner supply device
In a preferred embodiment of the invention, the image forming apparatus is configured to provide a depth of field exceeding 5 μm, for example between 10 μm and 150 μm. In this way, the sample area may be in focus in the depth of field such that it may not be necessary to move the image forming device and/or the array of detection elements in order to obtain a sharp image of the sample in the sample area, for example when particles in the sample are positioned at different depths. However, in some embodiments of the invention, the image forming device and/or the array of detection elements and/or the sample chamber may be configured such that the image forming device and/or the array of detection elements may be moved relative to the sample to be placed in an optimal position. One sample or part of a sample may be, for example, in focus in one configuration, but when changed to another sample or different part of a sample, the other sample or different part of a sample may not be in focus and therefore requires or moves the sample and/or the image forming device and/or the array of detection elements.
In a preferred embodiment of the present invention, the image forming apparatus is configured to transmit light in a wavelength region between 200nm and 1000nm, more preferably in a wavelength region between 350nm and 850 nm.
In several preferred embodiments of the present invention, the image forming device comprises a microscope objective. The image forming device may be configured to provide linear magnification of the sample. Preferably, the linear amplification is less than 20: 1. The linear amplification may also be in the range from 1:20 to 1:1, preferably in the range from 1:1 to 10:1, more preferably in the range from 1:1 to 4: 1.
In several preferred embodiments of the invention, the image cytometer is configured with means to allow two or more image forming devices to be exchanged between recorded images. The purpose of swapping the imaging devices is preferably to change the optical characteristics of the image cytometer, for example to change the linear magnification of the image and/or to change the depth of field of view. Typically, the selection of the imaging device is made based on a priori known characteristics of the sample, but in several preferred embodiments of the invention, the selection of the imaging device is made based on the results of an evaluation of the sample being analyzed.
Sample (I)
The sample area may comprise a sample, such as a biological sample. The sample may be in a sample chamber.
Lighting system
According to the present invention, the illumination system can be used to provide the required light sources for the image cytometer, which are bright field light sources, and fluorescent light sources. In a preferred embodiment of the invention, the focusing means associated with the illumination system is for forming collimated light from the first light source. In addition, the excitation light may have an angle of incidence with respect to the optical axis. The illumination system may additionally have any of the features of the image cytometer as previously described.
Cytometry method
In one aspect of the invention, a method for assessing at least one quantitative parameter and/or at least one quality parameter of a biological sample is provided, comprising
Applying a volume of biological sample to a sample chamber having parallel walls defining an exposure area, the walls allowing light from a first light source to pass through the walls of the sample chamber,
exposing light passing through the sample chamber onto the array of active detection elements, thereby recording an image of spatial light intensity information,
processing the image in a manner such that light intensity information from the individual biological particles is identified as being different from light intensity information from the background,
and correlating the processing result with at least one quantity parameter and/or at least one quality parameter of the biological particles in the liquid sample.
The present invention relates to methods and systems for assessing quantitative and/or qualitative parameters of a biological sample, including optical interactions with the sample. Optical interactions with the sample preferably cause the intensity and/or direction of light to change due to interactions with the biological sample or particles in the biological sample, some preferred interactions being one or more of the following; reflection, refraction, diffraction, interaction, scattering, or absorption.
In a preferred embodiment of the invention, the biological sample to be evaluated is contained in a sample chamber. A preferred characteristic of the sample chamber is to define the boundaries of the sample. Another preferred embodiment of the invention is wherein the wall of the sample chamber is the bottom of an open container. In several embodiments, the boundary of the sample chamber is formed by a transparent wall defining the bottom or top of the sample, while in other equally preferred embodiments, the sample chamber is formed by two transparent walls, with the sample disposed between the walls, defining the thickness of the sample being evaluated.
In a preferred embodiment of the invention, the biological sample being evaluated is a suspension of biological particles. Such a suspension of biological particles may be part of a larger sample size, wherein the purpose of the evaluation may be to determine or predict the characteristics of the larger sample size. In another, equally preferred embodiment, the biological sample is a sample of cells growing and/or growing on a substrate. Alternatively, the sample may be a liquid sample. In some preferred embodiments, the substrate is a suspension, while in other equally preferred embodiments, such a substrate is, or may be, an integral part of the sample chamber. It is generally preferred that the substrate placed in the sample chamber is substantially transparent, and in many preferred embodiments, the transparent substrate sheet is a wall of the sample chamber.
In a preferred embodiment of the invention, the evaluation of the at least one quantitative parameter and/or the at least one quality parameter of the biological sample is an analysis of individual cells. Such individual cells are often isolated, either in suspension or on a substrate, but they may also be in a cell mass, with the cells adhering to each other. In other preferred embodiments of the present invention, the evaluation of the at least one quantitative parameter and/or the at least one quality parameter of the biological sample is the analysis of a large number of cells (bulk of cells), such as tissue samples.
In several most preferred embodiments of the invention, the first light source is a Light Emitting Diode (LED) and/or a diode laser and/or a laser. Several characteristics of LEDs and laser diodes provide substantial advantages in the design and operation of the system according to the invention, such as small physical size and power efficiency. In many preferred embodiments of the invention, the wavelength of the light from the first light source is less than 400 nm. It is often preferred that the wavelength of the light from the first light source is between 200nm and 400nm, for example between 300nm and 395 nm. It has surprisingly been found that the use of short wavelength light provides a substantial improvement in the evaluation of bioparticles according to the invention, and that light of wavelength bands such as 200nm to 250nm, 200nm to 300nm, 250nm to 350nm, and 320nm and 380nm are preferred.
Generally, the biological particles being evaluated are sensitive to light to the extent that the characteristics of the particles can be altered, and a preferred method of reducing the effect of light is to limit the length of time the sample is exposed to light to limit the time that the light source emits light to the sample, preferably wherein the duration of illumination of the light from the light source is less than 1 second, more preferably less than 0.1 second. In other equally preferred embodiments, the illumination period is between 0.0001 and 0.1000 seconds, for example between 0.0001 and 0.0500 seconds. Expressed in energy, preferably at 200nJ/mm during exposure2Or less, e.g. 100nJ/mm2Or less, preferably 50nJ/mm2Or less, e.g. 20nJ/mm2Or less to illuminate the sample.
According to the present invention, a preferred method for the evaluation of biological particles is the recording of images based on spatial light intensity information from a volume of sample, wherein the signal from an individual biological particle attenuates the light intensity signal relative to the light intensity from the background. Attenuation may be brought about by one or more of the following: reflection, refraction, diffraction, interference, absorption, scattering. In these embodiments, the intensity of the light related to the biological particles is lower than the signal from the background, and on this basis the image may be processed in such a way that the signal from the individual cells and the signal from the background, preferably wherein the signal from the particles is substantially smaller than the signal from the background, preferably from the background in close spatial proximity to the particles, are distinguished from each other.
In several preferred embodiments, the attenuation of the light is caused by scattering of the light, which scattering results from, for example, refraction and/or reflection processes of the light. Furthermore, in these and other preferred embodiments, the attenuation is caused by absorption of light caused by the chemical composition of the biological particles being evaluated and/or other chemical compositions intentionally added to the sample. Thus, absorption may be caused by a reagent added to the sample. In an embodiment according to the invention, a light attenuation of 5% to 70% associated with the biological particles is achieved compared to the intensity of the signal from the background. In other equally preferred embodiments, the attenuation of light associated with the biological particle compared to light from the background is between 50% and 90%.
In other equally preferred embodiments of the invention, the signal from the individual biological particle is enhanced, such as: an increase in the observed light intensity signal relative to the light intensity from the background. This can be caused by, for example, scattering, interference, reflection and refraction processes, often in combination with focusing or other changes in the optical signal, the enhancement being a result of spatial redistribution of the light. In these embodiments, the intensity of the light related to the biological particles is higher than the signal from the background, and on this basis the image may be processed in such a way that the signal from the individual cells and the signal from the background, preferably wherein the signal from the particles is substantially higher than the signal from the background, preferably from the background in close spatial proximity to the particles, are distinguished from each other.
In yet other highly preferred embodiments of the present invention, the recorded image of light intensity from the biological particle comprises a signal associated with the biological particle, such image comprising a change in light intensity information, which is a combination of attenuation and enhancement of light intensity relative to light intensity from the background.
A generally preferred method of the present invention is to modulate the light transmitted or scattered through the sample, which generally has the effect of increasing the contrast during recording of light intensity information. Preferably, such modulation corresponds to a spatial difference in light characteristics at a predetermined plane in the optical path from the light source to the array of active detection elements. Such modulation is typically produced by using a modulating means, such as an opaque or substantially opaque, or transparent means, preferably a means where transparency, e.g. attenuation, is a predetermined property. Preferably, such a modulation means is implemented as a combination of opaque means and transparent means, whereby the modulation means is opaque at predetermined positions or areas and transparent at other predetermined positions or areas. In two preferred implementations of the modulation device, the first is an opaque disc with a hole in its center and the second is an opaque disc with a diameter substantially smaller than the diameter of the parallel light beams. When the two brewing devices are used in combination, the diameter of the central hole in the first device is then similar or identical to the size of the disc in the second device. Preferably, the predetermined position of the opaque and/or transparent area corresponds to an image of the light source at the optical surface near the position of the modulation means. Preferably, such modulation means have different effects in light transmitted through the sample, light transmitted through the biological particles. A typical preferred location of the modulation means is close to the focal plane of the parallel light entering the condenser objective of the imaging system.
Typical preferred characteristics of the modulating means are those which alter the light passing through the modulating means; for example: changing phase, changing intensity, such as attenuation, light shielding, such as blocking light. The modulation means preferably comprises one or several of these characteristics.
In a preferred embodiment, the modulation device is positioned along the optical axis at a location between the light source and the sample, while it is also preferred to position the modulation device along the optical axis at a location between the sample and the array of active detection elements. Still a preferred embodiment may comprise the modulation means being on both sides of the sample along the optical axis. In embodiments where the modulation means is included only along the optical axis at a location between the sample and the array of active detection elements, the light from the light source is substantially parallel as it traverses the sample, and it is also preferred that the light intensity of such parallel light is substantially uniform throughout the portion of the sample imaged by the array of active detection elements.
When optical components, such as lenses, are used to focus light from the sample chamber onto the array of active detection elements, the parallel light transmitted through the sample chamber is typically focused on a plane along the optical axis. Under these conditions, it is generally preferred to place the modulation device at, or near, the focal plane. In a preferred embodiment, the light which interacts with the biological particle causing it to be deflected, refracted and/or scattered, for example, enters a condenser objective of the imaging system. It is further generally preferred that the properties of the modulation means, such as the opaque and transparent properties, are arranged to substantially follow the shape of the image of the light source at this focal plane. A frequently preferred characteristic and form of the modulator is the difference in the net effect on the light transmitted through the sample chamber and the light transmitted through the biological sample.
In embodiments comprising modulation means, it is generally preferred to use a light source capable of producing light consisting of light of a predetermined wavelength band, preferably wherein the wavelength band is substantially narrow, for example not more than 50nm, preferably even less than 30nm wide, for example less than 20 nm. Furthermore, it is generally preferred to use light of a predetermined wavelength, preferably wherein the wavelength of the light is predominantly less than 400nm, for example between 250nm and 400nm, more preferably between 300nm and 390 nm.
A preferred embodiment of the invention comprises a modulation device arranged to produce a phase contrast image, but provided that the wavelength of light transmitted through the sample chamber is less than 400 nm.
Several preferred embodiments of the present invention include a modulation device that can be placed in or removed from the optical path, and it is generally preferred to include two or more different modulation devices. Thus, when two or more substantially different modulation means are applied, two or more images of the spatial light intensity may be recorded. In such embodiments, where it is possible to change the light path by including or omitting the modulation means, it is preferred to record two or more images of light intensity information from the light transmitted through the sample chamber. Thus, two or more images of spatial light intensity information recorded by the first light source may be used in the processing of the light intensity information.
In a preferred embodiment, the light from the light source that passes through the wall of the sample chamber has a general orientation that is substantially perpendicular to the surface of the wall. In another preferred embodiment of the invention, the light from the light source is substantially parallel when passing through the sample. In another preferred embodiment of the invention, collimated light that has passed through the sample is focused substantially onto a plane located between the focusing means and the array of detection elements, wherein the modulating means is positioned substantially at the focal plane. Since the light from the light source is preferably directed by using one or more optical components, such as lenses and/or mirrors, this orientation may be considered as the optical axis of the light source and in this context the optical axis of the light source is substantially perpendicular to the surface of the wall portion. Furthermore, in several embodiments, it is generally preferred that the walls of the sample chamber are substantially perpendicular to the viewing direction of the array of active detection elements. Also, since light is usually focused to the active array of detection elements by using optical elements such as lenses and/or mirrors, this corresponds to the optical axis of the array of detection elements being perpendicular to the wall portion. Thus, several preferred embodiments of the invention comprise a light source, a sample chamber and an array of active detection elements, all of which are substantially located on one axis, such that the optical axis of the light source and the array of detection elements are substantially on one axis, which axis passes through the sample chamber such that its walls are substantially perpendicular to the common axis.
Many highly preferred embodiments of the present invention include two or more light sources for sample illumination. The two or more light sources typically differ in characteristics, such as arrangement of optical axes or wavelengths. One preferred embodiment of the invention comprising two or more light sources is where the light from the second light source passes through a wall of the sample chamber, wherein the second light source is arranged such that the main direction of the light enters the wall defining the exposure region of the sample chamber at an angle, preferably an angle between 10 and 80 degrees with respect to the vertical. Such an arrangement provides typical advantages when two or more light sources are mounted in a substantially permanent position, particularly when more than two light sources are mounted. Furthermore, it has been found that such an angular arrangement may reduce the intensity of the background light signal. In addition, several preferred embodiments of the invention comprise three or more, for example four, light sources illuminating and/or passing light through the wall of the sample chamber. Other equally preferred embodiments comprise more than four light sources, for example five light sources. As more and more light sources offer the possibility to perform bio-particle assessment, wherein the processing is based on a plurality of light intensity information, embodiments comprising preferably six, seven, eight or even more than eight, e.g. ten individual light sources are preferred.
Here and elsewhere in this discussion, the term "main direction of light" may be exchanged for the term "optical axis", which is typically formed by arranging a light source, or another active component such as an array of active detection elements, in combination with optical means such as one or more and/or mirrors, regardless of the function of the lens and/or mirror, whether for collimation, focusing or dispersion. The optical axis of such systems typically has an axis of symmetry.
In a preferred embodiment of the invention, the two or more individual light sources emit substantially the same light, e.g. with respect to wavelength, preferably in such a case e.g. that the two or more light sources are operated substantially simultaneously, thereby increasing the total light energy emitted and/or extending the illumination area of the sample chamber and/or ensuring a more uniform light intensity illumination of at least a part of the sample chamber. In these and in other equally preferred embodiments of the invention, the two or more individual light sources emit substantially different light, e.g. for wavelength, preferably in case e.g. such two or more light sources are operated independently, e.g. only one such light source is switched on at a time, or such that only the light of one such light source illuminates the sample chamber at a time. One preferred characteristic of such two or more light sources emitting different light is that at least one of such light sources generates fluorescence, preferably wherein such fluorescence intensity information is used for combination with the attenuated light intensity information for the purpose of assessing at least one quantitative parameter and/or at least one quality parameter in the biological sample.
In several preferred embodiments, all of the light sources are located on the same side of the sample chamber. In such embodiments, it is generally preferred that such light source be located in the sample chamber on the side opposite the array of active detection elements.
It is generally preferred that the two or more light sources are arranged such that the light source generating the fluorescence light is placed at an angle to the wall of the sample chamber, such that the optical axis of the light source is not substantially perpendicular to the wall of the sample chamber. One preferred advantage of such an arrangement is that the ratio of the intensity of the fluorescence emitted from the biological particles compared to the light intensity from the background, commonly referred to as the signal to background ratio (S/B), is increased. Light from the background, which is typically a region outside any biological particle of interest in the image of light intensity information, may originate from a variety of sources and/or phenomena, some of which are directly related to characteristics of the light source, such as the orientation of the light source relative to the optical axis of the array of detection elements. Another equally preferred advantage of arranging the light sources at an angle to the wall of the sample chamber is that a large number of light sources can be positioned in fixed positions relative to the sample chamber, thereby allowing the sample chamber to be illuminated with light from two or more light sources without the use of mechanical means. A preferred advantage of these characteristics is simpler system construction and/or the ability to operate the system faster when the task is to sequentially illuminate the sample in the sample chamber with two or more different wavelengths. Furthermore, it has been found that such an arrangement of excitation light sources reduces internal reflections of light emitted onto the planar surface of the light sources that could otherwise be reflected back into the array of active detection elements.
A preferred embodiment of the invention is the use of a light source for recording light attenuation, e.g. by refraction and/or reflection. It is often preferred that light from such a light source is transmitted through the sample chamber in a substantially collimated manner such that a major portion of the light is parallel or substantially parallel. It has surprisingly been found that such substantially parallel light may enhance the attenuated contrast, i.e. the ratio of the light attenuated by the biological particles to the intensity of the transmitted light of the background area. In these and other preferred embodiments of the invention, a portion of the light transmitted through the sample is not perfectly parallel, but is preferably at an angle of less than 45 ° with respect to parallel, for example less than 30 °, for example 15 °. Even less divergence is generally preferred, e.g. 10 ° or less, e.g. no more than 5 ° of light divergence with respect to the optical axis.
It has been found that in some preferred embodiments, the high contrast recorded under collimated conditions can be substantially maintained, while moderate divergence tends to actively assist in equalizing the intensity of light transmitted through the sample chamber and exposed to the array of active detection elements. Typically many of these embodiments provide that the focal point of the light source, brought about by optical components such as lenses or mirrors, is substantially outside the sample chamber.
In a further, likewise preferred embodiment of the invention, for recording the attenuation of the light, the light from the light source for recording the attenuation of the light, which passes through the sample chamber, is focused substantially on the sample chamber. Preferably wherein a substantial portion of the light transmitted through the sample chamber is registered by the array of active detection elements.
A very preferred feature of the invention is that the light transmitted through and/or to the sample chamber is of substantially uniform intensity throughout the field of view of the array of active detection elements. Preferably, the deviation from uniform illumination, e.g. expressed as the ratio of the variation in intensity to the average intensity, is less than 25%, more preferably less than 10%, even more preferably less than 5%. Such properties generally have the effect of reducing the variation in the optical properties of the sample recorded on the array of active detection elements, which tends to result in a lower variation in the characterization, which is substantially dependent on the intensity of the illumination light. This is for example evident both for light attenuation and fluorescence emission.
The optical means, consisting of a number of lenses arranged in an array, may be arranged to focus a plurality of images of the light emitting elements of the light source substantially to and/or through the sample chamber. Such a microlens array is preferred in several embodiments of the present invention for efficiently illuminating portions of the sample chamber, preferably substantially only the portion from which light is exposed to the active detection element array.
One generally preferred arrangement of microlenses includes a cylindrical microlens array. Such a microlens array is preferably used in conjunction with a second or more cylindrical microlens arrays, which are typically oriented perpendicular to each other. Such an arrangement is included in several preferred embodiments of the present invention, wherein the illumination efficiency is mainly increased by generating a uniform illumination in a part of the sample chamber and/or by transmitting a high fraction (fraction) of the light emitted from the light source to a part of the sample chamber. In several preferred embodiments, the characteristics of such two or more cylindrical microlens arrays are substantially the same, while in other, often preferred embodiments, the characteristics are substantially different in order to produce illumination that is appropriate in shape to the shape of the active detection element array. The characteristics of the microlens that are changed in order to produce such a shape are, for example, the pitch (pitch) and/or the focal length of the lens.
It is generally preferred to include optics to focus the light exposed to an array of detection elements, such as one or more lenses or mirrors, where such optics have the ability to focus the exposed light signal, expressed as the depth of focus in the object plane. In several preferred embodiments of the invention, such focusing means have a depth of focus of more than 5 μm, preferably in the range from 10 μm to 150 μm.
In order to use one optical arrangement for recording both the attenuated transmitted light and the emitted fluorescent light, it is generally preferred that the one or more lenses for focusing the light exposed onto the array of detection elements are substantially transparent to light in the wavelength region between 200nm and 1,000nm, preferably between 300nm and 1,000nm, more preferably between 350nm and 850 nm. Preferably, the one or more lenses used for focusing are corrected for optical aberrations in this range. Preferably, the transparency of the one or more lenses is such that the attenuation of light in this region is less than 3OD, more preferably less than 1 OD.
While the emitted light (e.g., fluorescence) is typically of a relatively weak intensity, the transmitted light (e.g., light used to determine attenuation) often has a relatively large intensity. In many embodiments, it is therefore generally preferred to attenuate the light by using an optical attenuation filter, preferably wherein the light emitted to the sample chamber is attenuated. Preferably, the attenuating filter used has the property of reducing the intensity of transmitted light by more than 1OD, preferably by as much as 3 OD.
The array of active detection elements in embodiments of the present invention is typically a CCD or CMOS sensor.
In several preferred embodiments of the invention, wherein two or more fluorescence intensity images are recorded in addition to the light attenuation images, the fluorescence is filtered using wavelength limiting means, such as filters and/or interference filters, preferably these filters can be exchanged between the recorded images. These filters may be mounted on a moving fixture, for example by linear translation or by rotation.
In a preferred embodiment of the invention, the optical magnification of the light exposed to the array of active detection elements is less than 20:1, defined as the ratio of the projected size of any size object in the sample chamber to the size of the object. Other equally preferred embodiments have an optical magnification between 1:1 and 20:1, preferably between 1:1 and 1: 10. In several embodiments, where a large sample chamber is imaged, it is preferred that the optical magnification is less than 4:1, for example in the range from 1:1 to 4: 1.
While several embodiments of the present invention include devices with fixed optical magnification, several equally preferred embodiments include devices that allow recording of images at two or more optical magnifications, which can be used, for example, to facilitate detection of cells at lower magnifications and subsequent detailed analysis of cells at high magnifications. Some preferred embodiments include means for variable optical magnification (e.g. zooming).
Because the plurality in the preferred embodiment of the present invention comprises exposing a plurality of light intensity images in order to assess a biological property, it is preferred that any movement of the sample or particles in the sample is kept under control, more preferably such movement should be kept to a minimum. Thus, preferably, the volume of liquid sample is left to stand during the exposure, wherein left to stand is defined as that at least a part of the image of the biological particle is no longer moved during one exposure and is thus substantially comprised within the boundaries of the same detection element. Furthermore, when more than one exposure to the array of detection elements is used, in order to generate two or more light intensity information images, it is preferred to maintain a resting condition, wherein resting is defined as that during two exposures at least a part of the image of the biological particle is no longer moving and is thus substantially comprised within the boundaries of the same detection element, preferably such that during more than two exposures (e.g. during three, four, five or even six exposures) is substantially comprised within the boundaries of the same detection element. More preferably, the static condition is maintained during the exposure of all light intensity information images processed for evaluating the characteristics of biological particles.
In a preferred method of the invention, the volume of liquid sample is allowed to stand during exposure, more preferably before, during, after and during exposure. A resting condition is a condition in which there is no movement, but such a condition may be difficult to obtain in a liquid system (e.g. when biological particles are suspended in a liquid), since there may be forces such as gravity, dynamic forces acting such that a part of the sample comprising the particles moves, e.g. by sedimentation or vibration, such forces acting unintentionally on the sample, i.e. without active activation and/or control. It is therefore generally preferred to define a condition that is static in that no intentional forces are applied to the sample, sample chamber or detection device that could cause movement. Another preferred definition is to define resting as at least a portion of the image of the biological particle no longer moving during exposure with the light source and thus being substantially comprised within the boundaries of the same detection element, e.g. during exposure with the first or second light source, the reason for the preferred movement being unintentional.
Another equally preferred definition of resting is a condition in which, during the collection of light intensity information, preferably during two or more exposures, the sample no longer moves relative to the array of active detection elements, such that the image of a biological particle in the sample no longer moves, and thus it is substantially contained within the boundaries of the same detection elements, the reason for the preferred movement being unintentional. Yet another equally preferred definition of resting is that during two or more exposures the sample is no longer moving relative to the array of active detection elements such that the image of the biological particle in the sample is no longer moving and is therefore substantially contained within the boundaries of the same detection elements, the reason for the preferred movement being unintentional.
One generally preferred method of obtaining a resting condition is to allow the sample with suspended biological particles to rest for a sufficient amount of time after moving the sample and/or sample chamber before initiating a measurement so that the biological particles in the suspension settle and/or float to the inner lower and/or upper boundary of the sample chamber, thereby obtaining a resting condition of the biological particles relative to the sample chamber. Preferably, the sedimentation and/or flotation of the biological particles is effected in a relatively short time, such as less than 240 seconds, preferably less than 100 seconds, such as 45 seconds. More preferably, the settling time is greater than 10 seconds, preferably in the range between 10 and 240 seconds, more preferably in the range between 30 and 120 seconds. Resting may be defined as a condition in which the sample does not move relative to the sample chamber. In a preferred embodiment of the invention, resting is defined as standing for a period of time, such as at least 10 seconds, such as at least 9 seconds, such as at least 8 seconds, such as at least 7 seconds, such as at least 6 seconds, such as at least 5 seconds, such as at least 4 seconds, such as at least 3 seconds, such as at least 2 seconds, or such as at least 1 second. Preferably, the period may be before, during and/or after the exposure.
The volume of the sample analyzed usually relates to the statistical quality of the evaluation of the biological particles, since the size of the volume is usually directly linked to the number of individual particles analyzed. For example, when the evaluation of biological particles involves counting of individual particles, the total number of particles counted determines the accuracy of the result. One parameter that affects the volume of the sample being analyzed is the thickness of the sample chamber defined by its walls, and thus several embodiments of the invention are preferred in which the interior of the sample chamber has an average thickness between 20 μm and 1,000 μm. In these and other preferred implementations, the average thickness is between 20 μm and 100 μm. Ideally, the thickness of the sample chamber is uniform, but it has been unexpectedly found that large deviations from uniform thickness do not impair the results of the evaluation, as long as the average thickness of the part of the sample chamber being analyzed is known. Furthermore, in embodiments where the evaluation of the biological particles is performed in a substantially disposable sample chamber, e.g. a sample chamber intended for a primary analysis of a sample, it is preferred that the average thickness of each sample chamber is known or preferably determined by means of the system.
In a preferred embodiment of the invention, the volume of the liquid sample from which the electromagnetic radiation is exposed to the array of detection elements is in the range between 0.01 μ L and 20 μ L, for example between 0.05 μ L and 5 μ L. Since the total volume of the sample being evaluated (which is exposed to the array of detection elements) depends on several factors, including the sample thickness and the area of the sample chamber portions exposed to the array of detection elements, it is possible to combine several features of the present invention in order to determine this volume but many preferred embodiments result in a volume between 0.05 μ L and 1.0 μ L being analyzed in a single exposure. The total volume evaluated may preferably be further increased by exposing additional portions of the sample, either by replacing portions of the sample in the sample chamber with different portions or by moving the sample chamber to expose different portions of the sample chamber to the array of sample chambers. Placing or replacing the sample or a portion of the sample may be accomplished by pumping the sample or portion of the sample into the sample chamber with a pumping means (e.g., a pump, such as a plunger) and/or by means of a force, such as capillary force, and/or such as gravity. After placement or replacement of the sample or part of the sample, the sample or part of the sample is stationary inside the sample chamber, preferably due to the absence of any deliberate action (such as applying a force to the sample or part of the sample), and the sample chamber can be moved around in order to analyze and/or evaluate the sample or part of the sample according to the invention.
One generally preferred embodiment that typically contributes significantly to determining the volume of sample exposed to the array of detection elements is that the viewing area of the optical arrangement that exposes the light intensity information, including embodiments where the viewing area is substantially fixed, or in equally preferred embodiments, the viewing area may be determined based on adjusting the optical components. One preferred method for determining the volume analyzed in a single exposure is to combine information about the thickness of the sample chamber with information about the active viewing area of the exposure system. In an embodiment according to the invention, the thickness of the sample chamber is determined separately for the sample chamber in use. In addition, the sample chamber may be used for a single analysis of a sample, and in many preferred embodiments, the sample chamber may only be used for analysis of a single sample.
The type and characteristics of biological particles are varied, but it is generally preferred in several embodiments of the invention that the size of the particles (one or more parameters to be evaluated) is a size between 0.1 μm and 100 μm. Such particle size is typically the average diameter of the particles, and in several equally preferred embodiments, this average size of the biological particles is between 0.1 μm and 20 μm. In other preferred embodiments of the invention, the size is between 5 μm and 15 μm. In some embodiments of the invention, the size is between 1 μm and 15 μm, such as at least 15 μm, at least 14 μm, at least 13 μm, at least 12 μm, at least 11 μm, at least 10 μm, at least 9 μm, at least 8 μm, at least 7 μm, at least 6 μm, at least 5 μm, at least 4 μm, at least 3 μm, at least 2 μm, or such as at least 1.
Because of the great diversity of biological particles and the nature of such particles, embodiments of the present invention may be used to assess a large number of quantity and/or quality parameters of a biological sample and/or particles of a biological sample. Several such preferred parameters are; the number of biological particles per volume of liquid sample, the diameter, area, circumference, asymmetry, circularity of the biological particles, the degree of adherence and/or clumping of the biological particles, preferably wherein the degree of clumping allows a large determination of the number of individual cells in the cell clump. Other equally preferred parameters are; the type of bioparticles, the metabolic state of the bioparticles, intracellular properties such as the number, size, shape of nuclei.
Another characteristic of the biological particles in the sample is the approximate location of the biological particles in the spatial light intensity image, which is generally preferred when evaluating recordings that include two or more images of spatial light intensity information, one of which represents the attenuation of light. This position of the particle is preferably used to correlate other light intensity information with the particle, such as fluorescence. This is often preferred, for example, when there are a plurality of individual particles, it is contemplated that some particles reflect this other light intensity information, while other particles do not substantially reflect this light intensity information. Such a large absence of light intensity information may make it difficult to determine the presence of such particles based on the information of light intensity alone, since it sometimes does not show information that can be distinguished from the background. In these cases, it is generally preferred that the location of the particle be acquired based on the aerial image intensity of the other images.
A preferred embodiment of the invention comprises a method for the evaluation of biological samples and/or biological particles, wherein an image of spatial light attenuation information is recorded. Many of these embodiments preferably further comprise the step of recording an image of additional spatial light intensity information comprised in the processing of the image information, wherein the additional spatial light intensity information is information about fluorescence. In several embodiments, this additional fluorescence image information is generated by excitation light from a light source that passes through the wall of the sample chamber and is used to generate attenuation image information, wherein an emission filter is employed to generate the fluorescence therefrom. In other equally preferred embodiments, such additional fluorescence information images are generated by excitation light from an additional light source. Since more information is generally recorded by recording more than one or two images of spatial light intensity information, it is generally preferred to include two additional fluorescence information images at the time of processing of the images in addition to the image of attenuation information, and it is generally more preferred to use three, four or five additional fluorescence information images. According to one embodiment of the invention, an image of spatial light intensity information is recorded, wherein the spatial light intensity information is information about fluorescence light caused by excitation light from the second light source passing through the wall of the sample compartment. In other preferred embodiments, the second spatial fluorescence light intensity information is caused by excitation light from a third light source. In a further embodiment of the invention, a third image of third spatial light intensity information is recorded, wherein the third spatial light intensity information is information about fluorescence light caused by excitation light from the second or third light source passing through the wall of the sample chamber, preferably by excitation light from a fourth or subsequent light source. In a third embodiment of the invention, a fourth image of fourth spatial light intensity information is recorded, wherein the fourth spatial light intensity information is information about fluorescence.
In embodiments of the invention where the parameters of the biological sample and/or biological particles comprise a plurality of images contained at the time of processing, it is generally preferred to use two or more light sources to obtain the required image information. The light sources are typically two, three, four or five separate light sources, the number and nature of which reflect characteristics such as wavelength and intensity of light, attenuation and scattering, and in the case of fluorescence background suppression.
In several highly preferred embodiments of such multi-image processing, it is preferred that the spatial information about the position of the biological particle is an integrated feature (integrated feature) of the image processing of the spatial light intensity information.
In embodiments comprising processing multi-image information, the parameters of the biological particle that may be evaluated may preferably be one or more of the following; evaluation of species bioparticles, bioparticle condition, preferably wherein the condition of the bioparticles is a metabolic condition, such as cell cycle, viability, apoptosis, motility. In a preferred embodiment of the invention the position of the biological particle in the first spatial light intensity image is used to determine the presence of light intensity information in a further recorded image of light intensity information related to the biological particle, preferably wherein the further light intensity information is fluorescence. In another preferred embodiment of the invention, the position of the biological particle is determined from information combined in a first and a second image of spatial light intensity information, wherein the images are recorded using illumination from a first light source and applying substantially different modulation means to the images, preferably wherein the images are dark field and bright field images. In a further preferred embodiment of the invention, the position of the biological particle is determined from information combining three or more images of the spatial light intensity information, wherein the images are recorded using illumination from the first light source and applying substantially different modulation means to the images. The determination of the intensity of the second or additional light intensity information associated with the biological particle may be used to assess the condition of the species and/or biological particle. Alternatively, the determination of the second or additional light intensity information associated with the biological particle may also be used for the assessment of the species comprising the biomarker and/or the condition of the biological particle.
The light sources used in many preferred embodiments of the present invention are tunable solid state light sources. The presence of a tunable light source may significantly simplify the design of the system according to the invention and will also allow greater flexibility, for example when a tunable solid-state light source is used for excitation of fluorescence. Preferably, such a tunable solid state light source may be a Light Emitting Diode (LED) or a laser diode.
Example 1
Image type cell instrument
FIG. 1 depicts a possible configuration of a graphic cytometer including several preferred embodiments of the present invention. The diagram summarizes the 4 main component groups, the sample holder (100), the illumination device (110), the imaging device (120) and the detection device (130). Finally, the main optical axis (140) of the image cytometer is depicted, along which most of the optical components are arranged.
The sample holder is movable along the optical axis relative to the imaging device to ensure that the sample is in focus with the imaging device. The sample chamber (101) is placed in the light path on a sample stage (102). The sample chamber is typically attached to the sample stage, but it may be released from the stage so that the sample chamber may be removed from the image cytometer and replaced again by a manual or automated process. The sample stage is movable in two directions perpendicular to the optical axis. This allows to evaluate different parts of the sample inside the sample chamber.
The illumination device may be moved along the optical axis to maintain the desired illumination of the sample chamber. The lighting device typically contains 2 or more light sources (3 shown). The illustration shows a light source (111) located on the optical axis so as to illuminate the sample in a direction towards the detector, which is generally preferred only when the aim is to produce images of passive light attenuation and/or scattering properties, such as bright field or dark field images, for example. Furthermore, the illustration shows two fluorescent light sources (112) illuminating the sample chamber obliquely with respect to the optical axis, which has been found to improve the condition when the signal from the particles is identified as different from the signal from the background. Further illustrated is a light source (112a) emitting a single wavelength, and a light source (112b) emitting two wavelengths by placing two light emitting diodes in one arrangement.
The imaging device comprises a condenser objective (121) arranged such that two or more condenser objectives (121a and 121b) having substantially different characteristics, such as nominal magnification, can be interchanged. The two or more condenser objectives are exchanged either by linear or by circular motion. The light modulation means are preferably two or more and comprise a plurality of optically active components, such as filters, apertures, obstacles or phase difference elements, respectively denoted Yi (122) and Xi (123). The light modulation device may be movable perpendicular to the optical axis such that each optical component may be placed in the beam of light emitted from the condenser objective, the movement being either linear or circumferential. Each light modulation device preferably has a position without optical components, so that no modulation will occur if all light modulation devices are arranged such that this empty position is in the light beam. The imaging device comprises a focusing device (124) which focuses the light from the condenser objective onto the detector.
The detection means may be moved along the optical axis in order to record the light intensity information of the focused image. The information is gathered using an array of active sensing elements (131), i.e. light sensitive cameras.
The operation of the image cytometer and the collection of data is controlled by a computer device (not shown). The computer device is preferably equipped with image processing means that can be used for automatic identification and evaluation of biological particles.
Example 2
Characteristics of low wavelength microscope
The contrast of the brightfield microscope according to the present invention was investigated by measuring a sample of Jurkat cells (human leukemia cell line, subclone A3, ATCC CRL-2570). The measurements were made using four light sources of different wavelengths. The three light sources are monochromatic narrow-band Light Emitting Diodes (LEDs) and the fourth light source is a broad-band white LED. All light sources are in an optical arrangement in which the emitted light is collimated as it passes through the sample.
The output from the narrow band LED is used unmodified, but the output from the white LED is used modified, and modified using a narrow band filter. Broadband light from the white LED represents a typical condition for a visualization microscope. The dominant wavelengths of the narrow band light used in the measurement are listed in the following table 2-1.
TABLE 2-1 light sources List
| Light source | Dominant wavelength |
| LED 365nm | 365nm |
| LED 400nm | 400nm |
| LED 453nm | 453nm |
| White light + filter | 555nm |
| White light + filter | 720nm |
The sample containing Jurkat cells in suspension was loaded into a sample chamber approximately 100 μm thick. The sample cell was placed in an optical system and bright field information was focused onto the active detection element array using 2 x linear magnification. The focus and light intensity of each image were adjusted to produce comparable results.
The information in the image is analyzed by determining the total intensity contrast of individual cells as a measure of the relative attenuation of light as the ratio of the integrated intensity of the cell to the intensity of the background. The results of the contrast determination are shown in the table of fig. 2A, which shows the observed contrast as a function of the wavelength band of the light source. In the graph, the solid line plots the wavelength range from 400nm to 750nm, which represents the total intensity contrast observed when using a broad band of light from a white LED.
Fig. 2B-2G show examples of recorded images. FIG. 2B shows an image recorded using 365nm light, FIG. 2C shows 400nm light, FIG. 2D shows white light, and FIG. 2E shows 710nm light. These images show that the contrast of the images has a profound effect on the image representation of biological particles for accurate identification of the presence and spatial location of cells.
Fig. 2F and 2G show slices of images collected at a higher resolution. Fig. 2F is an image using 365nm light, and fig. 2G is an image using 710nm light. These images show that images obtained with light of wavelengths below 400nm show more detail than images collected using light of long wavelengths, although the images were collected under similar conditions. Images of 365nm light show a considerable amount of information about shape, size and relative position than images of longer wavelengths.
Example 3
Enhancement of signal-to-background ratio
When performing fluorescence analysis of biological samples, it is important to manage the excitation and emission light to obtain proper contrast of the image. There are basically two ways to improve contrast, firstly using excitation filters to reduce light of longer wavelength than that used for fluorescence excitation and secondly using emission filters to reduce light of shorter wavelength than the fluorescence reaching the active detection elements.
In order to perform highly sensitive fluorescence analysis, where an important aspect of signal contrast is, it is necessary to consider various aspects of the optical system that affect the collected intensity information. This includes aspects such as the excitation intensity, autofluorescence and optical filter attenuation of any component of the system. In the task of improving the contrast of the fluorescence spatial intensity information collected from a biological sample, it is important to first optimize the intensity of the fluorescence signal and second minimize the background signal. The intensity of the fluorescence signal is determined mainly by the intensity of the excitation light. The intensity of the background signal depends on several aspects, such as the exposure of the excitation light on the active detection element array and the intensity of the autofluorescence of the optical components.
Ideally, the exposure of the excitation light on the array of active detection elements can be eliminated by using an emission filter with infinite attenuation or blocking. Such ideal filters are difficult to achieve and typically attenuate light to a small fraction of a given wavelength, e.g. 10-6To 10-7(attenuation between six and seven orders of magnitude), it is necessary to consider other aspects affecting the exposure of the excitation light in addition to the high quality filter. The orientation of the excitation light source relative to the field of view of the active detection element array can have a large effect on the exposure of the excitation light on the detection elements, with the overall orientation directly along the axis of the field of view of the detection elements typically resulting in the highest intensity of the exposed excitation light. The general orientation of the excitation light away from the axis of the field of view reduces the intensity of the excitation light exposed at the detection element.
In a preferred embodiment of the invention, the excitation light is directed towards the sample in the sample chamber at an angle to the axis between the sample chamber and the array of active detection elements. Such an embodiment is shown in FIG. 3A, where the overall axis of excitation light is about 40 degrees from the axis between the sample chamber and the array of active detection elements. In fig. 3A, a condenser objective (301) is shown, which collects light from a sample chamber defined by a transparent wall (303) defining the bottom of the sample chamber and another transparent wall (304) defining the top of the sample chamber. The objective lens transmits light from the sample chamber through an emission filter (302) and images it onto an array of active detection elements (not shown).
The excitation light is generated by a light emitting diode (305), and light therefrom is collected by a first lens in an excitation light module (306), which excitation light module (306) is comprised of one or more lenses (two shown) and one or more light modulation elements (two shown) such as an excitation filter and a light dispersing element. Light from the excitation light module is focused to the sample chamber as indicated by the boundary of the beam of excitation light (307). Under the conditions as given in this figure, it is possible that a portion of the excitation light may enter the field of view of the condenser objective, either by scattering (not shown) or by direct illumination (which may occur when a portion of the beam of excitation light enters the opening of the condenser objective (307a) at an angle lower than the acceptance angle). A large portion of this light is removed by the emission filter before reaching the detection element (309), allowing the fluorescence light to reach (310). Although the emission filter has a large attenuation, it is limited to, for example, 10-7Which means that this part of the light, although small, can reach the detection element. Further, the elements of the condenser objective may generate fluorescence (autofluorescence), which will pass through the emission filter and produce a background image on the detection elements.
Fig. 3B gives a view of the light intensity of the portion of the beam corresponding to the excitation light (307a) at the entrance of the condenser objective. By the arrangement of the components of the excitation module it is possible to reduce this light by limiting the aperture of the excitation light module, but this would greatly reduce the total amount of excitation light exposed to the sample chamber, thereby similarly reducing the fluorescence intensity. A preferred embodiment of the invention is shown in fig. 3C, where an obstacle (311) is placed in the excitation light module, thereby altering the beam of excitation light (312), which largely eliminates the light rays that would enter the field of view of the focusing objective.
Fig. 3D shows the intensity distribution spectrum of the modified beam of excitation light, a portion of which is removed by the obstruction. Fig. 3E shows the resulting intensity of light entering the condenser objective, in contrast to fig. 3B, which shows that the spread of light has been largely removed, but further in this embodiment it is important to note that the scaling of the two images is such that fig. 3E is magnified by a factor of approximately x 200, indicating that the intensity of the excitation light has been effectively reduced.
The following table 3-1 shows the effect of the size of the obstacles on the intensity of the excitation illumination and the intensity of the excitation light entering the focusing objective. The table shows the relative amounts of excitation light exposed to the sample chamber and the relative amounts of the beams of excitation light entering the focusing objective. The obstacle is formed by placing a linear screen into a cylindrical beam of light that excites the inside of the light module and the reported value is the insertion of the obstacle relative to the diameter of the beam.
TABLE 3-1 excitation light and light in condenser Objective
| Obstacle | Excitation light | Light in |
| 0% | 100% | 11% |
| 6% | 98% | 8% |
| 13% | 93% | 3% |
| 19% | 85% | 0.8% |
| 22% | 81% | 0.18% |
| 25% | 77% | 0.005% |
Using typical conditions, the effect of the analysis of weakly fluorescent particles (e.g. particles containing relatively few fluorophores) is demonstrated below. In the embodiment of the present invention, it is assumed that a condenser objective lens having a Numerical Aperture (NA) of 0.20 is used. Further, it is assumed that the fluorescence conversion efficiency of the particles is 2 × 10⁻⁶And similarly the fluorescence conversion efficiency of the sample chamber is 2X 10⁻⁷This fluorescence comes from impurities in the transparent wall and/or other materials. The emission filter attenuates a large portion of the excitation light entering the condenser objective, but upon entering the condenser objective, the light may produce significant background fluorescence, caused by the optics and impurities of other materials in the condenser objective, and a large portion of this fluorescence will pass through the emission filter. There is therefore a net light intensity transmitted through the emission filter onto the detection element as a result of the excitation light entering the condenser objective, and it can be assumed that the scatter, exposure and fluorescence light passing through the emission filter amounts to 5x10⁻⁷The net strength of (a).
These conditions describe a system where it is very difficult to assess the fluorescence intensity from biological particles since the total intensity of the background is about 3 times the fluorescence intensity observed from the particles. By inserting an obstacle to the beam of excitation light in the excitation light module, the amount of light entering the condenser objective can be reduced and thus the background signal can be significantly suppressed. In Table 3-1, it has been shown that at the same time the total amount of excitation light entering the sample chamber is also reduced to a much lesser extent. The effect of this is shown in Table 3-2 below, which shows normalized fluorescence and background signals.
TABLE 3-2 normalized fluorescence and background signals
| Obstacle | Fluorescence | Sample background | Light in objective lens | Background | Signal/ |
| 0% | 1.00 | 0.10 | 2.67 | 2.77 | 0.36(1) |
| 6% | 0.98 | 0.10 | 1.98 | 2.08 | 0.47(1.3) |
| 13% | 0.93 | 0.09 | 0.74 | 0.83 | 1.1(3.1) |
| 19% | 0.85 | 0.09 | 0.16 | 0.24 | 3.5(10) |
| 22% | 0.81 | 0.08 | 0.04 | 0.12 | 6.8(19) |
| 25% | 0.77 | 0.08 | 0.00 | 0.08 | 9.6(27) |
Table 3-2 shows that the total background signal decreased significantly faster than the fluorescence intensity, as shown by the signal/background (S/B) values (relative change in fluorescence signal to background signal ratio in parentheses). The results of Table 3-2 show that under these conditions, by placing an obstruction in the beam of excitation light to cover about 25% of the beam diameter, the S/B ratio increased by nearly 30 times. Under these conditions, the intensity of fluorescence decreased only 23%.
Example 4
Detection of particle standards
Calibration beads, which are typically used to calibrate flow cytometer devices, are identified and quantified using a system according to the present invention. The beads were Rainbow Calibration Particles (P/N RCP-30-5A), Spherotech, USA, one set of beads with a diameter of 3 μm, including 8 sets, produced different fluorescence intensities.
The image cytometer of the present invention is configured to be illuminated with a narrow band excitation light at about 475nm and to detect fluorescence emission in a wavelength band of about 536 nm. Light from the sample chamber was collected and focused onto an array of active detection elements using a 4-fold condenser objective lens with NA 0.20. The beads were processed according to the instructions provided by the supplier and placed in a sample chamber approximately 100 μm thick.
A series of images of spatial light intensity information are collected by an array of active detection elements, first an exposure of spatial bright field light intensity information is collected for the purpose of acquiring information relating to the position of the particles, and second an exposure of spatial fluorescence intensity is collected using an integration time of 300 ms. A total of 35 pairs of bright field and fluorescence images were collected from different parts of the sample by moving the sample chamber, resulting in a total of 70 light intensity images.
Each bright field image is used to determine the location of the particle and this information is used to interrogate the fluorescence image at that location, integrating the total intensity of the fluorescence of each particle. A total of 12,750 particles were analyzed and the results are shown in figure 4, which shows a histogram of the observed fluorescence intensity. The figure shows the clear differences of the 8 different intensity sets, consistent with the specifications given by the supplier of the calibration beads. This shows that the sensitivity of the image cytometer according to the present invention is similar to that of today's typical flow cytometers.
Example 5
Bright/dark field configuration
A sample of adherent wei hi-S cells (murine fibrosarcoma cell line) was placed in an image cytometer of the invention schematically depicted in 5A and illuminated with a light source (503) emitting light in a narrow wavelength band of about 365 nm. The light source is located on an optical axis extending from the array of active detection elements (509) to the sample chamber, defined by two transparent walls (502 and 503), and exposes light towards the detection elements.
The exposed light passes through an optical device (507) such that it forms a beam (504) substantially parallel to the optical axis of the condenser objective (501). The properties of the condenser objective used are such that the parallel light emitted from the light source is focused substantially onto a plane (506) located along the optical axis between the objective and the array of active detection elements, such that a major part of this light is directed away by the condenser objective (508), which condenser objective (508) focuses the light onto the detection elements. With this arrangement, a portion of the light emitted from the light and passing through the focusing objective enters the detection element with a uniform background intensity unless the light is deflected by a particle in the sample and then the light from that location of the sample attenuates the light intensity to form a spatially bright field image of the particle.
The light deflected by the particles is influenced by the elements of the particles. The light thus deflected changes direction and is emitted in several directions, the intensity of the light in the different directions being determined by the properties of the particles. Some of the deflected light enters the condenser objective and forms differently directed beams (505) originating from the particles. The deflected light entering the condenser objective forms a substantially parallel light beam when it reaches the condenser objective, which light beam is focused on the condenser element. This deflected light forms an aerial image of the light intensity information mixed with the bright field image of the sample, an example of which is shown in fig. 5D.
Fig. 5B shows an obstruction (510) placed in the focal plane of the substantially parallel light emitted from the light source between the condenser objective and the detection element. Such obstacles are holes formed by holes in the disc, the size of which is such as to allow substantially only light from the light source to reach the detection element, eliminating light scattered by the particles. The resulting image (one example is shown in fig. 5E) is an aerial image of bright field light information with a greatly improved contrast compared to an arrangement without the aperture obstructions discussed above. An additional characteristic of this arrangement is that such a bright field image is significantly less sensitive to the focusing of the condenser objective, thereby favouring an image with a substantially large focal depth, since the focusing of this bright field image depends to a large extent on the degree of collimation of the light passing through the sample chamber and the size of the aperture of the obstacle.
Fig. 5C shows an obstruction (511) placed in the focal plane of the substantially parallel light emitted from the light source between the condenser objective and the detection element. The obstruction is sized and positioned so that it allows substantially only light scattered by the particles to reach the detection element, eliminating light emitted directly from the light source. The resulting image (an example of which is shown in fig. 5F) is an aerial image of dark field light information of the particles in the specimen.
Fig. 5G shows light rays interacting with a spherical object whose properties with respect to refractive index are similar to those of biological particles. It is shown that when collimated light (520) illuminates a particle (521), the light is refracted due to the refractive index difference, the degree of refraction being determined by the optical properties of the particle. The light (522) that bypasses the particles enters the focusing objective (not shown), still collimated. Some of the light is scattered at large angles (523) so that they will illuminate the entrance face of the condenser objective outside the entrance and thus will not reach the array of detection elements (not shown). Other rays are refracted (524) at a small angle so that they will enter the condenser objective and be imaged on the detection elements.
Considering the collimated light rays that bypass the particles, these will form an image on the detection element that has a considerable light intensity outside the image of the particles and no or a small light intensity inside the particles, thus forming a shadow of the particles. Light rays interacting with the particles are refracted to different degrees, some with zero angle refraction because they pass perpendicularly through the particle boundaries, and others with varying dispersion angles. These will form an image of the particle, taking into account the scattered light, which is somewhat similar to the image that would be observed if the particle were illuminated, but with a different dark field focus (525) that does not coincide with the particle position, the focus being determined by the size and optical characteristics of the particle.
Fig. 5H to 5J show images of CHO cell suspensions recorded with different illumination conditions. Fig. 5H is a bright field image of a cell, and fig. 5I is a bright field image in which refracted light has been blocked by placing a hole (refer to fig. 5B) on a focal plane of parallel light and fig. 5J is a dark field image in which collimated light is blocked (refer to fig. 5C), all of which are focused individually. Finally fig. 5K is a fluorescence image showing specifically stained particles. The images used in fig. 5H, 5I and 5J are used in combination to determine the location and contour of individual cells, information for counting the number of cells and estimating the fluorescence intensity of individual cells, which are used to classify cell characteristics.
By such an exchangeable arrangement of the obstacles in the focal plane of the condenser objective, it is possible to realize an image-based cytometry system with the flexibility of recording high-contrast bright or dark fields, or a combination of both, simply by placing or removing appropriate obstacles.
Claims (31)
1. An image cytometer, comprising:
-a first light source (111, 313, 503) configured to emit light towards the sample area;
-optical means (507) for directing light from a first light source (111, 313, 503) along an optical axis of the cytometer (140) and into a sample region;
-a second light source (305, 112a, 112b) comprising a first excitation light source for emitting excitation light (307, 312) towards the sample region; and
-image forming means (121, 124, 501, 508) for forming an image of at least a part of the sample area on the array of detection elements (509), wherein
The sample area is located between the optical device (507) and the array of detection elements (509), characterized in that,
the optical arrangement (507) is for forming collimated light (504, 520) from the first light source (111, 313, 503) such that the collimated light (504, 520) is directed into the sample area, and
the first light source (111, 313, 503) is configured to emit light having a wavelength of less than 400 nm.
2. The image cytometer according to claim 1, wherein the cytometer further comprises an attenuation device to attenuate light intensity in a predetermined wavelength region or regions.
3. The image cytometer according to claim 2, wherein the attenuation device is positioned in a predetermined plane along the optical axis.
4. The image cytometer according to claim 2, wherein the cytometer further comprises a modulation device.
5. The image cytometer according to claim 4, wherein the modulation device is positioned in a predetermined plane along the optical axis.
6. The image cytometer according to claim 4, wherein the attenuation means and/or modulation means are placed in the optical path between the first light source (111, 313, 503) and the sample area.
7. The image cytometer according to claim 4, wherein the attenuation means and/or modulation means are placed in the optical path between the sample area and the array of detection elements (509).
8. The image cytometer according to claim 7, wherein the modulation device is positioned proximate to the focal plane of the collimated light transmitted through the sample region.
9. The image cytometer according to claim 4, wherein two or more attenuation devices and/or modulation devices are mounted in a swapping device that allows to remove the attenuation devices and/or modulation devices or to swap them.
10. The image cytometer according to claim 9, wherein the exchange device comprises a rotation unit.
11. The image cytometer according to claim 9 or 10, wherein the two or more exchange means are such that none, one, two or more of the attenuation and/or modulation means can be positioned along the optical axis at the same time.
12. The image cytometer according to claim 4, wherein at least one modulation device is partially opaque.
13. The image cytometer according to claim 4, wherein the modulation device is partially transparent.
14. The image cytometer according to claim 4, wherein the attenuation means and/or modulation means are partially opaque and partially transparent.
15. The image cytometer according to claim 14, wherein one of the attenuation means and/or modulation means is circular in shape.
16. The image cytometer of claim 4, wherein a portion of at least one modulation device is opaque and another portion of the modulation device is partially transparent.
17. The image cytometer according to claim 4, wherein the cytometer can be configured to switch between a bright field mode and a dark field mode using an obstacle in the modulation means and/or using an aperture in said modulation means, wherein said obstacle is configured for the dark field mode,
wherein the aperture is configured for bright field mode and a fluorescence mode using an attenuation device to attenuate light intensity in a predetermined wavelength region or regions.
18. The image cytometer according to claim 17, wherein the obstruction is configured to attenuate collimated light passing through the sample region (100, 502),
19. the image cytometer according to claim 4, wherein the modulation device comprises a phase contrast microscope modulation device.
20. The image cytometer according to claim 18, wherein the exchange between the bright field mode and the dark field mode is achieved by a modulation means.
21. The image cytometer according to claim 20, wherein the exchange between the bright field mode and the dark field mode is achieved by inserting and/or exchanging a modulation device located between the sample region and the array of detection elements (509).
22. The image cytometer according to claim 1, wherein the sample region comprises a biological sample.
23. The image cytometer according to claim 1, wherein the sample zone comprises a sample in a sample chamber (101).
24. An illumination system (110) for an image cytometer, comprising:
-a first light source (111, 313, 503) configured to emit light;
-optical means (507) for directing light from the first light source (111, 313, 503) along the optical axis of the image cytometer (140) and into the sample region; and
-a second light source (305, 112a, 112b) comprising a first excitation light source configured to emit excitation light (307, 312) into the sample region,
the light from the first light source (111, 313, 503) is configured to emit light having a wavelength of less than 400nm, and wherein the optical arrangement (507) is configured to form collimated light (504, 520) from the first light source (111, 313, 503).
25. The lighting system (110) according to claim 24, further comprising one or more of the features of claims 2-23.
26. A method of assessing at least one quantitative parameter and/or one quality parameter of a biological sample, comprising:
-applying a volume of biological sample into a sample chamber (101) having parallel walls defining an exposure area, said walls allowing light from the image cytometer to pass through the walls of the sample chamber (101),
-illuminating the sample chamber (101) with light from a first light source (111, 313, 503) and exposing the light passing through the sample chamber (101) onto a 2-dimensional array of active detection elements, thereby recording an image of spatial light intensity information,
-illuminating the sample chamber (101) with excitation light from a second light source (305, 112a, 112b) and exposing fluorescence light passing through the sample chamber (101) onto the 2-dimensional array of active detection elements, thereby recording an image of fluorescence spatial light intensity information,
-processing the two images in such a way that light intensity information from the individual biological particles (521) is identified as being different from light intensity information from the background,
and correlating the result of the treatment with at least one quantity parameter and/or quality parameter of the biological particles in the biological sample,
the light illuminating the sample chamber (101) is collimated light (504, 520) and the image cytometer is an image cytometer (140) according to claims 1-23.
27. A method according to claim 26, wherein in the light intensity information processing two or more images of spatial light intensity information recorded with the first light source (111, 313, 503) are used.
28. A method according to claim 26 or 27, wherein the biological sample is a suspension of growing and/or growing cells on a substrate.
29. The method of claim 28, wherein the substrate is a transparent substrate.
30. The method according to claim 29, wherein the substrate is an integrated part of the sample chamber (101).
31. A method according to claim 26, wherein sufficient time is allowed to elapse after the end of the movement of the sample and/or the sample chamber (101) relative to the array of active detection elements until the start of the recording of the light intensity information to allow the suspended particles (521) to settle and/or float to the inner lower and/or upper boundary of the sample chamber (101).
Priority Applications (1)
| Application Number | Priority Date | Filing Date | Title |
|---|---|---|---|
| CN202010059068.2A CN111220529A (en) | 2013-05-28 | 2014-05-28 | Image type cell instrument |
Applications Claiming Priority (3)
| Application Number | Priority Date | Filing Date | Title |
|---|---|---|---|
| DKPA201370291 | 2013-05-28 | ||
| DKPA201370291 | 2013-05-28 | ||
| PCT/DK2014/050151 WO2014191003A1 (en) | 2013-05-28 | 2014-05-28 | Image forming cytometer |
Related Child Applications (1)
| Application Number | Title | Priority Date | Filing Date |
|---|---|---|---|
| CN202010059068.2A Division CN111220529A (en) | 2013-05-28 | 2014-05-28 | Image type cell instrument |
Publications (2)
| Publication Number | Publication Date |
|---|---|
| CN105579828A CN105579828A (en) | 2016-05-11 |
| CN105579828B true CN105579828B (en) | 2020-02-14 |
Family
ID=51022214
Family Applications (2)
| Application Number | Title | Priority Date | Filing Date |
|---|---|---|---|
| CN201480031377.1A Active CN105579828B (en) | 2013-05-28 | 2014-05-28 | Image type cell instrument |
| CN202010059068.2A Pending CN111220529A (en) | 2013-05-28 | 2014-05-28 | Image type cell instrument |
Family Applications After (1)
| Application Number | Title | Priority Date | Filing Date |
|---|---|---|---|
| CN202010059068.2A Pending CN111220529A (en) | 2013-05-28 | 2014-05-28 | Image type cell instrument |
Country Status (9)
| Country | Link |
|---|---|
| US (2) | US10458896B2 (en) |
| EP (2) | EP3004838B1 (en) |
| JP (1) | JP6717741B2 (en) |
| KR (1) | KR102162213B1 (en) |
| CN (2) | CN105579828B (en) |
| AU (1) | AU2014273560B2 (en) |
| CA (1) | CA2913667A1 (en) |
| DK (1) | DK3004838T3 (en) |
| WO (1) | WO2014191003A1 (en) |
Families Citing this family (35)
| Publication number | Priority date | Publication date | Assignee | Title |
|---|---|---|---|---|
| US20170186262A1 (en) * | 2014-02-14 | 2017-06-29 | Rotas Italia SRL | Product authentication method |
| EP4194801A1 (en) | 2015-02-24 | 2023-06-14 | The University of Tokyo | Dynamic high-speed high-sensitivity imaging device and imaging method |
| CN105486667A (en) | 2015-07-01 | 2016-04-13 | 上海睿钰生物科技有限公司 | Integrated fluorescence excitation light source apparatus |
| WO2017036483A1 (en) * | 2015-08-28 | 2017-03-09 | Chemometec A/S | Continuous image cytometer |
| US11098275B2 (en) | 2015-10-28 | 2021-08-24 | The University Of Tokyo | Analysis device |
| WO2017130613A1 (en) * | 2016-01-27 | 2017-08-03 | 株式会社 日立ハイテクノロジーズ | Observation device |
| JP7129909B2 (en) * | 2016-02-18 | 2022-09-02 | オプトフルイディクス インコーポレイテッド | Systems and methods for characterizing particles in fluid samples |
| US11035795B2 (en) | 2016-02-18 | 2021-06-15 | Optofluidics, Inc. | Methods for identification of particles in a fluid sample |
| DE102016211038A1 (en) * | 2016-06-21 | 2017-12-21 | Cytena Gmbh | Apparatus and method for detecting cells or particles in a fluid container |
| CN115931687A (en) * | 2017-03-31 | 2023-04-07 | 生命技术公司 | Apparatus, system and method for imaging flow cytometry |
| CN107389535A (en) * | 2017-07-18 | 2017-11-24 | 深圳小孚医疗科技有限公司 | A kind of means of illumination of micro-imaging illuminator |
| GB201711886D0 (en) | 2017-07-24 | 2017-09-06 | Univ College Cardiff Consultants Ltd | Analysing nano - objects |
| US11561161B2 (en) * | 2017-08-08 | 2023-01-24 | Sony Corporation | Information processing apparatus, information processing method, and program |
| JP6413006B1 (en) * | 2017-11-28 | 2018-10-24 | リオン株式会社 | Particle counter |
| CN112513707B (en) * | 2018-04-17 | 2023-05-26 | 克莫麦特公司 | Depiction of objects |
| LU100777B1 (en) * | 2018-04-23 | 2019-10-23 | Cytena Gmbh | A method of assaying a liquid containing at least one cell and / or at least one particle |
| EP3807005B1 (en) | 2018-06-13 | 2023-10-25 | ThinkCyte K.K. | Methods and systems for cytometry |
| WO2020086583A1 (en) * | 2018-10-22 | 2020-04-30 | Bioelectronica Corporation | Multiplexed assay systems and methods |
| JP2020094925A (en) * | 2018-12-13 | 2020-06-18 | 住友電気工業株式会社 | Method for evaluating quality |
| CN109709025B (en) * | 2019-02-12 | 2021-07-16 | 军事科学院系统工程研究院卫勤保障技术研究所 | Multimode imaging optical system |
| CN110487686B (en) * | 2019-09-03 | 2022-09-02 | 中国工程物理研究院流体物理研究所 | Air aerosol single particle multi-mode spectrum diagnosis device and diagnosis method |
| CN110609026B (en) * | 2019-10-31 | 2020-11-03 | 福州大学 | Laser power feedback control up-conversion fluorescence imaging device and imaging method thereof |
| US11806955B2 (en) | 2020-02-26 | 2023-11-07 | Depuy Ireland Unlimited Company | Method for testing additively manufactured orthopaedic prosthetic components |
| FR3109159B1 (en) * | 2020-04-09 | 2023-06-23 | Interscience | Image processing method applied to colony counters in microbiology |
| KR102286722B1 (en) * | 2020-04-14 | 2021-08-06 | 주식회사 톱텍 | Automated cell Counter and method for counting cell using it |
| CN111598058A (en) * | 2020-06-24 | 2020-08-28 | 无锡市科德科技有限公司 | Bright field and dark field directional reflection light source assembly based on single light source |
| WO2022038614A1 (en) * | 2020-08-20 | 2022-02-24 | Maytronics Ltd. | Multi-region optical filters and systems and methods using same |
| KR102505687B1 (en) * | 2020-11-30 | 2023-03-03 | 디투이모션(주) | Semi-automatic cell counting method using a hemocytometer |
| EP4275087A1 (en) * | 2021-01-06 | 2023-11-15 | Scopgenx Private Limited | A compact portable multimodal microscopy |
| JPWO2023007920A1 (en) * | 2021-07-29 | 2023-02-02 | ||
| CN114088606B (en) * | 2021-10-23 | 2023-05-09 | 广州市艾贝泰生物科技有限公司 | Cell analysis device |
| KR102645654B1 (en) * | 2021-12-22 | 2024-03-13 | (주)얼라인드제네틱스 | A line confocal cell counter for high throughput multispectral detection of cells |
| WO2024085932A1 (en) * | 2022-10-17 | 2024-04-25 | Becton, Dickinson And Company | Methods for classifying particles using images based on filtered layers and machine learning models and systems for same |
| JP7393836B1 (en) | 2023-04-25 | 2023-12-07 | 株式会社写真化学 | Bacterial body observation device |
| CN117348225A (en) * | 2023-12-04 | 2024-01-05 | 成都丹诺迪医疗科技有限公司 | Microscopic device |
Family Cites Families (41)
| Publication number | Priority date | Publication date | Assignee | Title |
|---|---|---|---|---|
| US4786165A (en) | 1986-07-10 | 1988-11-22 | Toa Medical Electronics Co., Ltd. | Flow cytometry and apparatus therefor |
| DE3714830A1 (en) * | 1987-05-05 | 1988-11-17 | Leitz Ernst Gmbh | COMBINED LIGHT-FIELD-DARK-FIELD REFLECTED LIGHTING DEVICE |
| JP3084296B2 (en) | 1991-02-27 | 2000-09-04 | シスメックス株式会社 | Flow image cytometer |
| US6180415B1 (en) * | 1997-02-20 | 2001-01-30 | The Regents Of The University Of California | Plasmon resonant particles, methods and apparatus |
| ATE398185T1 (en) | 1997-05-05 | 2008-07-15 | Chemometec As | METHOD AND SYSTEM FOR DETERMINING SOMA CELLS IN MILK |
| US6731100B1 (en) | 1997-05-05 | 2004-05-04 | Chemometec A/S | Method and a system for determination of somatic cells in milk |
| US6707555B1 (en) | 1998-10-15 | 2004-03-16 | Sysmex Corporation | Optical information measuring apparatus |
| EP1125105A2 (en) | 1998-11-05 | 2001-08-22 | ChemoMetec A/S | A method for the assessment of particles and a system and a device for use in the method |
| DE19923822A1 (en) * | 1999-05-19 | 2000-11-23 | Zeiss Carl Jena Gmbh | Optical scanning configuration for detecting fluorescent light and for suppressing stray light arising from an illuminated test detected through a lens creates a shaded area for stray light in a focal plane. |
| US7738945B2 (en) * | 2002-04-19 | 2010-06-15 | University Of Washington | Method and apparatus for pseudo-projection formation for optical tomography |
| GB0227649D0 (en) | 2002-11-27 | 2003-01-08 | Medical Res Council | Uses of optical projection tomography methods and apparatus |
| DE10239548A1 (en) * | 2002-08-23 | 2004-03-04 | Leica Microsystems Semiconductor Gmbh | Device and method for inspecting an object |
| DE10239955B3 (en) * | 2002-08-26 | 2004-05-13 | Carl Zeiss Smt Ag | Optical microscope with bright and dark field illumination using annular cross-section illumination beam and light stop of variable width |
| CA2524345C (en) * | 2003-04-29 | 2014-04-08 | S3I, Llc | A multi-spectral optical method and system for detecting and classifying biological and non-biological particles |
| DE10361073A1 (en) * | 2003-12-22 | 2005-07-21 | Innovatis Ag | Method and device for taking microscopic images |
| JP4698992B2 (en) * | 2004-09-14 | 2011-06-08 | 浜松ホトニクス株式会社 | Sample measuring apparatus and measuring method |
| US7660045B2 (en) * | 2004-11-24 | 2010-02-09 | Takashi Yoshimine | Object lens and condenser |
| WO2006083969A2 (en) | 2005-02-01 | 2006-08-10 | Amnis Corporation | Blood analysis using a flow imaging cytometer |
| JP2007033381A (en) | 2005-07-29 | 2007-02-08 | Tokyo Seimitsu Co Ltd | Optical inspection apparatus and its lighting method |
| JP2009516181A (en) | 2005-11-16 | 2009-04-16 | シェモメテック・アクティーゼルスカブ | Determination of chemical or physical properties of a sample or sample components |
| JP4723362B2 (en) | 2005-11-29 | 2011-07-13 | 株式会社日立ハイテクノロジーズ | Optical inspection apparatus and method |
| JP5028014B2 (en) * | 2006-02-08 | 2012-09-19 | 株式会社日立ハイテクノロジーズ | Pattern inspection method and apparatus |
| JP2008002932A (en) | 2006-06-22 | 2008-01-10 | Tokyo Seimitsu Co Ltd | Sample imaging apparatus and sample illumination method |
| US7700928B2 (en) * | 2007-01-25 | 2010-04-20 | Etaluma, Inc. | Apparatus and method for interleaving detection of fluorescence and luminescence |
| CN101622522A (en) * | 2007-01-26 | 2010-01-06 | 贝克顿·迪金森公司 | The method, system and the composition that are used for cell count and analysis |
| CN101711341A (en) | 2007-04-18 | 2010-05-19 | 克莫麦特公司 | Interferometer actuator |
| CN101216601B (en) * | 2007-12-29 | 2010-12-15 | 中国科学院西安光学精密机械研究所 | Method and device for accomplishing dark-field photomicrography and fluorescent photomicrography by axicon lens |
| US8143600B2 (en) * | 2008-02-18 | 2012-03-27 | Visiongate, Inc. | 3D imaging of live cells with ultraviolet radiation |
| JP2009237486A (en) * | 2008-03-28 | 2009-10-15 | Kawasaki Heavy Ind Ltd | Zoom phase difference observation apparatus and illuminator for phase difference observation |
| US20100189338A1 (en) | 2008-04-09 | 2010-07-29 | Nexcelom Bioscience | Systems and methods for counting cells and biomolecules |
| JP2010085194A (en) * | 2008-09-30 | 2010-04-15 | Sysmex Corp | Sample analyzer |
| EP2350617B1 (en) | 2008-10-21 | 2018-01-10 | ChemoMetec A/S | Fluorescence imaging apparatus and method |
| DE102009004920B4 (en) * | 2009-01-16 | 2018-10-11 | Schaeffler Technologies AG & Co. KG | Combined radial thrust roller bearing |
| WO2010088585A1 (en) * | 2009-01-30 | 2010-08-05 | Trustees Of Boston University | Chemical/biological sensor employing scattered chromatic components in nano-patterned aperiodic surfaces |
| WO2011045994A1 (en) | 2009-10-14 | 2011-04-21 | シャープ株式会社 | Flexible circuit board connection structure and display device |
| JP5887275B2 (en) * | 2009-12-04 | 2016-03-16 | ライフ テクノロジーズ コーポレーション | Apparatus, system, method and computer readable medium for acoustic flow cytometry |
| EP2348301B1 (en) * | 2010-01-08 | 2013-08-21 | Sysmex Corporation | Sample analyzer |
| WO2011088014A2 (en) * | 2010-01-12 | 2011-07-21 | Nexcelom Bioscience Llc | Systems and methods for counting cells and biomolecules |
| JP5532459B2 (en) * | 2011-01-12 | 2014-06-25 | 株式会社ニコン | Microscope system |
| US8681215B2 (en) * | 2011-04-29 | 2014-03-25 | ProteinSimple | Method and particle analyzer for determining a broad particle size distribution |
| JP6076801B2 (en) * | 2013-03-29 | 2017-02-08 | シスメックス株式会社 | Blood cell analyzer and blood cell analysis method |
-
2014
- 2014-05-28 CN CN201480031377.1A patent/CN105579828B/en active Active
- 2014-05-28 KR KR1020157036826A patent/KR102162213B1/en active IP Right Grant
- 2014-05-28 US US14/893,780 patent/US10458896B2/en active Active
- 2014-05-28 AU AU2014273560A patent/AU2014273560B2/en active Active
- 2014-05-28 EP EP14733071.6A patent/EP3004838B1/en active Active
- 2014-05-28 WO PCT/DK2014/050151 patent/WO2014191003A1/en active Application Filing
- 2014-05-28 JP JP2016515661A patent/JP6717741B2/en active Active
- 2014-05-28 CN CN202010059068.2A patent/CN111220529A/en active Pending
- 2014-05-28 DK DK14733071.6T patent/DK3004838T3/en active
- 2014-05-28 EP EP22158257.0A patent/EP4027132A1/en active Pending
- 2014-05-28 CA CA2913667A patent/CA2913667A1/en active Pending
-
2019
- 2019-07-03 US US16/502,136 patent/US10921234B2/en active Active
Also Published As
| Publication number | Publication date |
|---|---|
| AU2014273560A1 (en) | 2015-12-03 |
| EP3004838B1 (en) | 2022-03-16 |
| US10921234B2 (en) | 2021-02-16 |
| AU2014273560B2 (en) | 2018-07-19 |
| US20190323944A1 (en) | 2019-10-24 |
| US10458896B2 (en) | 2019-10-29 |
| WO2014191003A1 (en) | 2014-12-04 |
| KR102162213B1 (en) | 2020-10-07 |
| US20160103058A1 (en) | 2016-04-14 |
| CN105579828A (en) | 2016-05-11 |
| EP4027132A1 (en) | 2022-07-13 |
| DK3004838T3 (en) | 2022-06-20 |
| JP6717741B2 (en) | 2020-07-08 |
| KR20160047432A (en) | 2016-05-02 |
| CA2913667A1 (en) | 2014-12-04 |
| EP3004838A1 (en) | 2016-04-13 |
| CN111220529A (en) | 2020-06-02 |
| JP2016529876A (en) | 2016-09-29 |
Similar Documents
| Publication | Publication Date | Title |
|---|---|---|
| CN105579828B (en) | Image type cell instrument | |
| US10345303B2 (en) | Image analysis and measurement of biological samples | |
| JP7464685B2 (en) | Apparatus, system and method for imaging flow cytometry - Patents.com | |
| US10690898B2 (en) | Light-field microscope with selective-plane illumination | |
| JP2016529876A5 (en) | ||
| JP2009063375A (en) | Hemanalysis device | |
| EP3532822B1 (en) | Trans-illumination imaging with use of interference fringes to enhance contrast and find focus | |
| EP3227740B1 (en) | Image cytometer | |
| US20200379227A1 (en) | Method For Analyzing Fluorescent Particles in an Immunoassay | |
| US11933707B2 (en) | Depicting of objects | |
| US20220326502A1 (en) | Apparatuses, systems and methods for solid immersion meniscus lenses | |
| KR20180074250A (en) | Apparatus of image detector for detecting particulate in liquid | |
| JP2023510615A (en) | Electro-optical device for flow measurement | |
| JP2009524061A (en) | Method and apparatus for noise reduction in scatter measurements | |
| WO2022049097A1 (en) | Device, method and use for optically determining at least one property of a sample positioned on a sample stage |
Legal Events
| Date | Code | Title | Description |
|---|---|---|---|
| C06 | Publication | ||
| PB01 | Publication | ||
| C10 | Entry into substantive examination | ||
| SE01 | Entry into force of request for substantive examination | ||
| GR01 | Patent grant | ||
| GR01 | Patent grant |