CN105164277B - Method for evaluating immune repertoires - Google Patents
Method for evaluating immune repertoires Download PDFInfo
- Publication number
- CN105164277B CN105164277B CN201480020810.1A CN201480020810A CN105164277B CN 105164277 B CN105164277 B CN 105164277B CN 201480020810 A CN201480020810 A CN 201480020810A CN 105164277 B CN105164277 B CN 105164277B
- Authority
- CN
- China
- Prior art keywords
- sequences
- immune
- disease
- cdr3
- pcr
- Prior art date
- Legal status (The legal status is an assumption and is not a legal conclusion. Google has not performed a legal analysis and makes no representation as to the accuracy of the status listed.)
- Active
Links
Images


Classifications
-
- C—CHEMISTRY; METALLURGY
- C12—BIOCHEMISTRY; BEER; SPIRITS; WINE; VINEGAR; MICROBIOLOGY; ENZYMOLOGY; MUTATION OR GENETIC ENGINEERING
- C12Q—MEASURING OR TESTING PROCESSES INVOLVING ENZYMES, NUCLEIC ACIDS OR MICROORGANISMS; COMPOSITIONS OR TEST PAPERS THEREFOR; PROCESSES OF PREPARING SUCH COMPOSITIONS; CONDITION-RESPONSIVE CONTROL IN MICROBIOLOGICAL OR ENZYMOLOGICAL PROCESSES
- C12Q1/00—Measuring or testing processes involving enzymes, nucleic acids or microorganisms; Compositions therefor; Processes of preparing such compositions
- C12Q1/68—Measuring or testing processes involving enzymes, nucleic acids or microorganisms; Compositions therefor; Processes of preparing such compositions involving nucleic acids
- C12Q1/6876—Nucleic acid products used in the analysis of nucleic acids, e.g. primers or probes
- C12Q1/6883—Nucleic acid products used in the analysis of nucleic acids, e.g. primers or probes for diseases caused by alterations of genetic material
-
- G—PHYSICS
- G16—INFORMATION AND COMMUNICATION TECHNOLOGY [ICT] SPECIALLY ADAPTED FOR SPECIFIC APPLICATION FIELDS
- G16B—BIOINFORMATICS, i.e. INFORMATION AND COMMUNICATION TECHNOLOGY [ICT] SPECIALLY ADAPTED FOR GENETIC OR PROTEIN-RELATED DATA PROCESSING IN COMPUTATIONAL MOLECULAR BIOLOGY
- G16B30/00—ICT specially adapted for sequence analysis involving nucleotides or amino acids
-
- G—PHYSICS
- G16—INFORMATION AND COMMUNICATION TECHNOLOGY [ICT] SPECIALLY ADAPTED FOR SPECIFIC APPLICATION FIELDS
- G16B—BIOINFORMATICS, i.e. INFORMATION AND COMMUNICATION TECHNOLOGY [ICT] SPECIALLY ADAPTED FOR GENETIC OR PROTEIN-RELATED DATA PROCESSING IN COMPUTATIONAL MOLECULAR BIOLOGY
- G16B35/00—ICT specially adapted for in silico combinatorial libraries of nucleic acids, proteins or peptides
-
- G—PHYSICS
- G16—INFORMATION AND COMMUNICATION TECHNOLOGY [ICT] SPECIALLY ADAPTED FOR SPECIFIC APPLICATION FIELDS
- G16B—BIOINFORMATICS, i.e. INFORMATION AND COMMUNICATION TECHNOLOGY [ICT] SPECIALLY ADAPTED FOR GENETIC OR PROTEIN-RELATED DATA PROCESSING IN COMPUTATIONAL MOLECULAR BIOLOGY
- G16B40/00—ICT specially adapted for biostatistics; ICT specially adapted for bioinformatics-related machine learning or data mining, e.g. knowledge discovery or pattern finding
-
- G—PHYSICS
- G16—INFORMATION AND COMMUNICATION TECHNOLOGY [ICT] SPECIALLY ADAPTED FOR SPECIFIC APPLICATION FIELDS
- G16B—BIOINFORMATICS, i.e. INFORMATION AND COMMUNICATION TECHNOLOGY [ICT] SPECIALLY ADAPTED FOR GENETIC OR PROTEIN-RELATED DATA PROCESSING IN COMPUTATIONAL MOLECULAR BIOLOGY
- G16B50/00—ICT programming tools or database systems specially adapted for bioinformatics
- G16B50/30—Data warehousing; Computing architectures
-
- G—PHYSICS
- G16—INFORMATION AND COMMUNICATION TECHNOLOGY [ICT] SPECIALLY ADAPTED FOR SPECIFIC APPLICATION FIELDS
- G16C—COMPUTATIONAL CHEMISTRY; CHEMOINFORMATICS; COMPUTATIONAL MATERIALS SCIENCE
- G16C20/00—Chemoinformatics, i.e. ICT specially adapted for the handling of physicochemical or structural data of chemical particles, elements, compounds or mixtures
- G16C20/60—In silico combinatorial chemistry
-
- C—CHEMISTRY; METALLURGY
- C12—BIOCHEMISTRY; BEER; SPIRITS; WINE; VINEGAR; MICROBIOLOGY; ENZYMOLOGY; MUTATION OR GENETIC ENGINEERING
- C12Q—MEASURING OR TESTING PROCESSES INVOLVING ENZYMES, NUCLEIC ACIDS OR MICROORGANISMS; COMPOSITIONS OR TEST PAPERS THEREFOR; PROCESSES OF PREPARING SUCH COMPOSITIONS; CONDITION-RESPONSIVE CONTROL IN MICROBIOLOGICAL OR ENZYMOLOGICAL PROCESSES
- C12Q1/00—Measuring or testing processes involving enzymes, nucleic acids or microorganisms; Compositions therefor; Processes of preparing such compositions
- C12Q1/68—Measuring or testing processes involving enzymes, nucleic acids or microorganisms; Compositions therefor; Processes of preparing such compositions involving nucleic acids
- C12Q1/6869—Methods for sequencing
-
- G—PHYSICS
- G16—INFORMATION AND COMMUNICATION TECHNOLOGY [ICT] SPECIALLY ADAPTED FOR SPECIFIC APPLICATION FIELDS
- G16B—BIOINFORMATICS, i.e. INFORMATION AND COMMUNICATION TECHNOLOGY [ICT] SPECIALLY ADAPTED FOR GENETIC OR PROTEIN-RELATED DATA PROCESSING IN COMPUTATIONAL MOLECULAR BIOLOGY
- G16B40/00—ICT specially adapted for biostatistics; ICT specially adapted for bioinformatics-related machine learning or data mining, e.g. knowledge discovery or pattern finding
- G16B40/10—Signal processing, e.g. from mass spectrometry [MS] or from PCR
Landscapes
- Life Sciences & Earth Sciences (AREA)
- Health & Medical Sciences (AREA)
- Engineering & Computer Science (AREA)
- Physics & Mathematics (AREA)
- Chemical & Material Sciences (AREA)
- General Health & Medical Sciences (AREA)
- Bioinformatics & Cheminformatics (AREA)
- Theoretical Computer Science (AREA)
- Biophysics (AREA)
- Biotechnology (AREA)
- Medical Informatics (AREA)
- Bioinformatics & Computational Biology (AREA)
- Spectroscopy & Molecular Physics (AREA)
- Evolutionary Biology (AREA)
- Proteomics, Peptides & Aminoacids (AREA)
- Organic Chemistry (AREA)
- Analytical Chemistry (AREA)
- Databases & Information Systems (AREA)
- Bioethics (AREA)
- Wood Science & Technology (AREA)
- Zoology (AREA)
- Genetics & Genomics (AREA)
- Molecular Biology (AREA)
- Biochemistry (AREA)
- Immunology (AREA)
- Microbiology (AREA)
- General Engineering & Computer Science (AREA)
- Pathology (AREA)
- Medicinal Chemistry (AREA)
- Software Systems (AREA)
- Public Health (AREA)
- Computing Systems (AREA)
- Evolutionary Computation (AREA)
- Epidemiology (AREA)
- Data Mining & Analysis (AREA)
- Computer Vision & Pattern Recognition (AREA)
- Artificial Intelligence (AREA)
- Crystallography & Structural Chemistry (AREA)
- Library & Information Science (AREA)
- Measuring Or Testing Involving Enzymes Or Micro-Organisms (AREA)
Abstract
Disclosed herein are methods for amplifying RNA from a population of T cells and a population of B cells and using the amplified RNA products to assess possible correlations between normal or abnormal immune responses and the development of diseases such as autoimmune diseases, cancer, diabetes or heart disease.
Description
Sequence listing
This application contains a sequence listing submitted electronically in ASCII format and incorporated by reference herein in its entirety. The ASCII copy was created at 5 days 2/2014, named 15892-.
Cross Reference to Related Applications
This application is a continuation of and claiming priority of U.S. provisional application No. 61/763,451 entitled "Method for Evaluating an immunological improtoire" filed on 2013, 2, 11, and which is incorporated herein by reference.
Technical Field
The present invention relates to methods of identifying T cell receptor antibodies in a population of cells and methods of using the information to measure the immune status of a patient and predict the probability of which disease the patient is likely to suffer from.
Background
Scientists have known for many years that certain diseases are associated with specific genes or gene mutations. However, genetic causes explain only a subset of the diseases diagnosed in humans. Many diseases appear to be somehow related to the immune system's response to infectious and environmental factors, but it remains established how the immune system plays a role in diseases such as cancer, Alzheimer's disease, costalchondritis, fibromyalgia, lupus and other diseases.
The human genome comprises a total of 567 to 588 IG (immunoglobulin) and TR (T cell receptor) genes (339 to 354 IG and 228 to 234 TR) in a single haploid genome, located in 7 major loci. They contain 405 to 418V genes, 32D genes, 105 to 109J genes and 25 to 29C genes. The number of functional IG genes and TR genes is 321 to 353 per haploid genome. They contain 187 to 216V genes, 28D genes, 86 to 88J genes and 20 to 21C genes (http:// imgt. cines. fr). By rearranging these genes, it is estimated that 2.5X 10 can be generated7A potential antibody or T cell receptor.
To date, a small number of diseases have been associated with the body's response to Common antigens (Prinz, J. et al, Eur. J. Immunol. (1999)29 (10): 3360; "Selection of Conserved TCR VDJ reactivity sequences in viral plasmid DNA in viral plasmid Vulgaris) and/or to specific VDJ Rearrangements (Tamaru, J. et al, Blood (1994)84 (3): 708;" Hodgkin's Disease with B-cell phenyl evolution of DNA A VDJ reactivity and hybridization Mutations in the VH Genes). There is a need for better methods for assessing changes in human immune response cells and correlating those changes to specific diseases.
Disclosure of Invention
The present invention relates to methods for assessing changes in immune response cell populations and correlating those changes to specific diseases. In one aspect of the invention, the method comprises the steps of: (a) isolating a subpopulation of white blood cells from at least one human or animal subject, (b) isolating RNA from the subpopulation of cells, (c) amplifying the RNA in a first amplification reaction using RT-PCR with nested primers to generate amplicons, at least a portion of the nested primers comprising additional nucleotides to incorporate a binding site for a common primer (common primer) into the resulting amplicons, (d) separating the amplicons of the first amplification reaction from one or more unused primers of the first amplification reaction, (e) amplifying the amplicons of the first amplification reaction having at least one binding site for the common primer by adding the common primer in a second amplification reaction, and (f) sequencing the amplicons of the second amplification reaction to identify antibody and/or receptor rearrangements in the subpopulation of the cells. In one embodiment, the subpopulation may include a whole blood population or another mixed population sample.
In one embodiment, the step of isolating the subpopulation of leukocytes can be performed by flow cytometry to isolate naive B cells, mature B cells, memory B cells, naive T cells, mature T cells, and memory T cells. In various embodiments of the methods, the recombination in the cell subpopulation is a rearrangement of B cell immunoglobulin heavy chains (IgH), kappa and/or lambda light chains (IgK, IgL), T cell receptors alpha, beta, gamma, delta. In a further embodiment of the process according to the invention,
in another aspect of the present invention, the method may optionally comprise another step comprising (g): the rearrangements identified for the population of individuals to whom the vaccine has been administered are compared with those identified for individuals to whom the vaccine has not been administered to assess the efficacy of the vaccine in generating an immune response.
The process may optionally further comprise a further step (g): the rearrangements identified for a population of normal individuals are compared to rearrangements identified for a population of individuals who have been diagnosed with a disease to determine whether there is a correlation between a particular rearrangement or set of rearrangements and the disease.
In various aspects, the methods can result in semi-quantitative amplification of a polynucleotide comprising complementarity determining region 3(CDR3) that results from gene rearrangement within a T cell or B cell, and results in the affinity and specificity of antibodies and/or T cell receptors for a particular antigen. Semi-quantitative amplification provides a method to not only detect the presence of specific CDR3 sequences, but also to determine the relative abundance of cells that have generated the necessary recombination events for generating those CDR3 sequences.
Accordingly, one aspect of the invention relates to a method for analyzing semi-quantitative sequence information to provide one or more immune status reports for a human or animal. The method for generating an immune status report comprises the steps of: (a) identifying one or more unique CDR3 sequences that are common between the subject's immune profile and the cumulative immune profile from the disease pool stored in the database, summing the total number of detected sequences in the subject corresponding to those unique CDR3 sequences that are common, and calculating a percentage of the total number of detected sequences in the subject's immune profile that represent those unique CDR3 that are common between the subject's immune profile and the disease pool to produce one or more initial consensus indices; (b) randomly selecting sequences from a public pool stored in a database to form a sub-pool comprising a number of sequences approximately equal to the number of unique CDR3 sequences in a disease pool, identifying one or more unique CDR3 sequences that are common between a subject's immune profile and the sub-pool, summing the total number of detected sequences corresponding to those common CDR3 sequences, and calculating a percentage of the total number of detected sequences in the subject's immune profile that are common between the subject's immune profile and the sub-pool to generate a sample consensus index; (c) repeating step (b) at least 1000 times or more; and (d) evaluating the P-value as a fraction of the number of times the sampled consensus index is greater than or equal to the initial consensus index between the patient's immune profile and the disease pool.
Drawings
The disclosure may be better understood with reference to the following drawings. The elements of the drawings are not necessarily to scale relative to each other, emphasis instead being placed upon clearly illustrating the principles of the present disclosure. Moreover, like reference numerals designate corresponding parts throughout the several views.
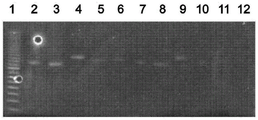
FIGS. 1a and 1b are photographs of a gel illustrating the presence of amplification products obtained by the method of the invention using the primers disclosed herein.
Fig. 2a and 2b are cartoon graphs representing the differences in diversity observed between the immune profiles of individuals with disease and generally healthy individuals, with each filled circle representing a unique CDR3 sequence and the size of the circles representing the number of times a unique CDR3 sequence is found in the immune profile.
FIG. 3 is a diagram illustrating a method for generating a public library.
Fig. 4 is a diagram illustrating a method for generating a disease library.
Fig. 5 illustrates the results obtained by: the patient immune profile is compared to a pool of diseases, the percentage of each unique CDR3 in the patient immune profile that is common between the two is calculated, and those percentages are added to produce a sum or a common index.
Fig. 6 illustrates the results obtained by: the patient immune profile is compared to a subset of the public pool, the percentage of each unique CDR3 that is common between the two is calculated, and those percentages in the patient immune profile are added to produce a sum or a common index.
FIG. 7 is a graph illustrating the method of the present invention, where the area under the curve represents the total of the indices obtained for a subset of the common banks (sub-banks), the P value is estimated, and the vertical line (DL) is1、DL2Etc.) represent a common index for comparing an individual's immune profile to one or more disease pools.
Detailed Description
The present inventors have developed methods for assessing antibody and T cell receptor rearrangements from a large number of cells that can be used to compare rearrangements identified in a population of individuals to determine whether there is a correlation between a particular rearrangement or set of rearrangements and a disease or certain symptoms of a disease. The methods can also be used to establish a history of immune responses in one or more individuals in response to infectious and/or environmental factors, and to assess the efficacy of a vaccine.
The present invention relates to methods for assessing changes in immune response cell populations and correlating those changes to specific diseases. In one aspect of the invention, the method comprises the steps of: (a) isolating a subpopulation of white blood cells from at least one human or animal subject, (b) isolating RNA from the subpopulation of cells, (c) amplifying the RNA in a first amplification reaction using RT-PCR with nested primers to generate amplicons, at least a portion of the nested primers comprising additional nucleotides to incorporate binding sites for a common primer into the resulting amplicons, (d) separating the amplicons of the first amplification reaction from one or more unused primers of the first amplification reaction, (e) amplifying the amplicons of the first amplification reaction having at least one binding site for a common primer by adding a common primer in a second amplification reaction, and (f) sequencing the amplicons of the second amplification reaction to identify antibodies and/or receptors in the subpopulation of cells. In one embodiment, the subpopulation may include a whole blood population or another mixed population of samples.
In one embodiment, a peripheral blood sample is taken from the patient and the step of isolating the subpopulation of leukocytes can be performed by flow cytometry to isolate naive B cells, mature B cells, memory B cells, naive T cells, mature T cells, and memory T cells. In various embodiments of the methods, the recombination in the cell subpopulation is a rearrangement of B cell immunoglobulin heavy chains (IgH), kappa and/or lambda light chains (IgK, IgL), T cell receptors beta, gamma or delta.
In a second aspect of the invention, the method may comprise a further step (g): the rearrangements identified for a population of normal individuals are compared to rearrangements identified for a population of individuals who have been diagnosed with a disease to determine whether there is a correlation between a particular rearrangement or set of rearrangements and the disease.
In another aspect of the present invention, the method may comprise another step comprising (g): the rearrangements identified for the population of individuals to whom the vaccine has been administered are compared with the rearrangements identified for the population of individuals to whom the vaccine has not been administered to assess the efficacy of the vaccine in generating an immune response.
In some embodiments, the step of separating the amplicon of the first amplification reaction from the one or more unused primers of the first amplification reaction may be omitted, and the two amplification reactions may be performed in the same reaction tube.
The present inventors previously developed a PCR method called tem-PCR, which has been described in publication number WO2005/038039, the disclosure of which is incorporated herein by reference in its entirety. More recently, the present inventors have developed a method called arm-PCR, which is described in U.S. provisional patent application No. 61/042,259, the disclosure of which is incorporated herein by reference in its entirety. Also described is a device for detecting a target polynucleotide in a sample, the device comprising: a first amplification chamber for thermocycling to amplify one or more target polynucleotides with nested primers to generate amplicons, at least a portion of the nested primers comprising additional nucleotides to incorporate binding sites for a common primer into the resulting amplicons; means for separating the amplicons of the first amplification reaction from the one or more unused primers of the first amplification reaction; and a second amplification chamber for thermocycling to amplify one or more amplicons generated during the first amplification reaction by adding a common primer in a second amplification reaction, the amplicons of the first amplification reaction having at least one binding site for at least one common primer.
Also described is a PCR chip comprising a first PCR chamber, said chamber being fluidically connected to both a waste reservoir and a second PCR chamber, each additionally comprising at least one electrode comprising means for isolating amplicons generated from the first PCR chamber. The second PCR chamber is fluidically connected to a hybridization and detection chamber comprising microspheres or beads arranged such that the physical location of the beads indicates the presence of a particular target polynucleotide in a sample analyzed with the chip.
the tem-PCR method, particularly the arm-PCR method, provides semi-quantitative amplification of multiple polynucleotides in one reaction. In addition, arm-PCR provides additional sensitivity. Both are capable of amplifying multiple polynucleotides in a single reaction, which is beneficial to the present methods because, for example, a repertoire of multiple T cells and B cells (repotoreires) is so large. The addition of a binding site for a common primer in an amplification reaction, and the subsequent amplification of the target molecule using the common primer, results in a quantitative or semi-quantitative result, which allows the determination of the relative amount of cells comprising multiple rearrangements within a patient's blood sample. Clonal proliferation due to recognition of an antigen results in a larger population of cells recognizing the antigen, and assessment of the cells by their relative numbers provides a means for determining whether antigen exposure affects proliferation of antibody-producing B cells or T cells with a receptor. This helps to assess whether a particular population of cells is likely to be present, for example, more prevalent in individuals who have been diagnosed with a particular disease, and in particular can help to assess whether a vaccine achieves a desired immune response in an individual to whom the vaccine has been administered.
There are several commercially available high throughput sequencing technologies, such as 454 sequencing by Roche Life Sciences. In the 454 sequencing method, the 454A and 454B primers are attached to the PCR product during PCR or after the PCR reaction. When performed in conjunction with tem-PCR or arm-PCR, the 454A and 454B primers may be used as a common primer in the amplification reaction. The PCR product (usually a mixture of different sequences) is diluted to about 200 copies/. mu.l. In an "emulsion PCR" reaction, the diluted PCR product is amplified by primers (454A or 454B) on the surface of the microbeads (semi-solid gel-like environment). Because PCR templates are very dilute, typically only one bead is adjacent to one template and it is confined to a semi-solid environment, amplification only occurs on and around the bead. The beads were then eluted and placed on a plate with specially designed wells. Each well can accommodate only one bead. Reagents were then added to each well for pyrosequencing. The sequencing reaction for each well can be read using a fiber optic detector and the data collected in parallel by a computer. One such high throughput reaction can generate up to 6000 ten thousand reads (6000 ten thousand beads) and each read can generate about 300bp sequences.
One aspect of the invention relates to the development of a "personal immune repertoire" or database of immune profiles, such that each individual can establish a baseline and track the development of immune responses to antigens (known and unknown antigens) over a period of several years. If this information is collected from a large number of individuals, the information can provide an epidemiological database that will yield valuable information, particularly in the context of the development of those diseases such as cancer and heart disease, which are believed to be typically caused by exposure to viruses or other infectious agents or transformed cells, many of which have not been identified. One particularly important use of the methods of the invention relates to the evaluation of children to determine whether an infectious disease, environmental agent or vaccine is likely to be the cause of autism. For example, many have proposed that vaccine administration can trigger the development of autism. However, many people also attribute potential relevance to the use of agents in vaccines such as thimerosal, and studies have demonstrated that thimerosal does not appear to be a causative agent of the disease. The following speculation still exists: development of mixed vaccines is associated with an increase in the number of cases of autism, however, it is extremely difficult to collect data for assessing potential causal relationships of multiple antigens. The methods of the invention simplify the process and can provide critical information to better understand autism and other diseases in which the immune response of different individuals can provide an explanation for the differential development of the disease in some individuals exposed to an agent or group of agents, while other similarly exposed individuals do not develop the disease.
An imbalance in the immune spectrum caused by infection can lead to a number of diseases including cancer, leukemia, neurological diseases (alzheimer's disease, multiple sclerosis, Parkinson's disease, autism, etc.), autoimmune diseases and metabolic diseases. These diseases may be referred to as immune spectrum disorders. There may be two forms of immune spectrum disease. (1) A "loss of function" form, and (2) a "gain of function" form. In the "loss of function" form, a human is susceptible to disease because of his/her limited and/or limited immune spectrum lack of cells that produce the most potent and essential IG and TR. In the "gain of function" form, a human is susceptible to disease because his/her immune spectrum acquires cells that produce IG and TR that should not normally be present. In "loss of function" (LOF) immune spectrum diseases, an individual does not have properly functioning B or T cells to fight the disease. His/her HLA typing determines which cells are eliminated during the early part of the immune cell maturation process, which is usually because they react strongly with his/her own proteins.
One aspect of the invention also provides a method comprising: (a) amplifying and sequencing one or more RNAs from T cells and/or B cells of one or more individuals, (B) inputting the sequences into a database to provide data which may be stored on a computer, server or other electronic storage device, (c) inputting identification information and characteristics of the individual's sequences corresponding to the one or more RNAs as data which may also be stored on a computer, server or other electronic storage device, and (d) evaluating the data of steps (B) and (e) for one or more individuals to determine whether there is a correlation between the sequence of the one or more RNAs and the one or more characteristics of the individual corresponding to the sequence. The identifying information may include, for example, a patient identification number, a code comprising a patient HLA type, a disease code comprising one or more clinical diagnoses that may have been made, a "staging code" comprising a sample date, a cell type code comprising a type of cell subpopulation from which the RNA is amplified and sequenced, and one or more sequence codes comprising sequences identified for the sample.
The described methods include novel primer designs that not only allow amplification of the entire immune repertoire, but also allow amplification to be performed in a highly multiplexed manner and semi-quantitatively. Multiplex amplification requires only a small number of PCR or RT-PCR reactions. For example, all IG can be amplified in one reaction, or the reaction can be divided into two or three reactions for IgH, IgL or IgK. Similarly, T cell receptors (TRs) may be amplified in only one reaction, or may be amplified in several reactions, including TRA, TRB, TRD, and TRG. Semi-quantitative amplification means that all targets in a multiplex reaction will be amplified independently, so that the end-point analysis of the amplified products will reflect the initial internal ratios in the targets.
In various aspects, the methods can result in semi-quantitative amplification of polynucleotides comprising Complementarity Determining Regions (CDRs) caused by gene rearrangement within T cells or B cells, and resulting in the affinity and specificity of antibodies and/or T cell receptors for a particular antigen. Semi-quantitative amplification provides a means to not only detect the presence of specific CDR3 sequences, but also to determine the relative number of cells that have generated the necessary recombination events to generate those CDR3 sequences.
Accordingly, one aspect of the invention relates to a method for analyzing semi-quantitative sequence information to provide one or more immune status reports for a human or animal. The method for generating an immune status report comprises the steps of: (a) identifying one or more unique CDR3 sequences that are common between the subject's immune profile and a library of diseases stored in a database, summing the total number of those CDR3 sequences that are common, and calculating a percentage of the total number of sequences in the subject's immune profile that are common between the subject's immune profile and the library of diseases to produce one or more initial consensus indices; (b) randomly selecting sequences from a common pool stored in a database to form a sub-pool comprising a number of sequences approximately equal to the number of unique sequences in the disease pool, identifying one or more unique CDR3 sequences that are common between the subject's immune profile and the sub-pool, summing the total number of those CDR3 sequences that are common, and calculating a percentage of the total number of sequences in the subject's immune profile that are common between the subject's immune profile and the sub-pool to generate a sample consensus index; (c) repeating step (b) at least 1000 times or more; and (d) evaluating the P-value as a fraction of the number of times the sampled consensus index is greater than or equal to the initial consensus index between the patient's immune profile and the disease pool.
The present inventors have discovered that the immune profile of individuals suffering from certain diseases (e.g., cancer, autoimmune diseases, etc.) may be characterized by a lack of diversity in one or more immune cell populations. Fig. 1 is a cartoon illustrating the differences that can be observed between the unique types and numbers of T cells present in, for example, blood samples of cancer patients (fig. 1a) and healthy patients (fig. 1b), where each circle represents one unique type of T cell, as represented by the recombinant cDNA of the complementarity determining regions of the T cell receptor (e.g., CDR3) amplified and sequenced and the relative number of cells sharing the same CDR3 sequence as determined by PCR amplification and sequencing. As indicated in fig. 1a, there may be fewer unique cells with different specificities, but a greater number of cells with a certain specificity, as represented by the CDR3 sequence. FIG. 1b illustrates the normal spectrum with more different cells, but a smaller number of each cell type sharing the same CDR3 sequence.
The list of each unique CDR3 expressing cell and the number of such cells represented within a blood or tissue sample from a human or animal may constitute the immune profile of the human or animal. Compiling the immune profiles of a group of people (e.g., a group comprising healthy individuals and individuals with a variety of different diseases) together can provide a "public pool" that represents the types of diversity found in the normal population (fig. 2). Similarly, compiling together the immune profiles of a group of individuals who have been clinically diagnosed with a particular disease can provide a "disease pool" of specific CDRs 3, etc., representing a population of proliferating cells that lack diversity (fig. 3). These immune profiles may be stored in a database, for example, available through computer access to the internet, so that the information can be used in the methods of the invention to analyze the immune status of a patient.
An immune profile can be generated for an individual patient that includes a list of unique CDR3 expressing cells ("unique CDR 3", those cells that share a unique CDR3 sequence) and the number of each unique CDR3 present in a blood or tissue sample from the individual. The patient's immune profile is compared to the combined immune profile (disease library, which is stored in a database) of a group of patients who have been diagnosed with a particular disease. This can be done for a range of disease pools and is shown in figure 4.
Public pools can exist in millions of possible combinations, and the immune system of most of those individuals typically exhibits increased diversity relative to the immune system of a group of individuals who have been diagnosed with a particular disease. Thus, the inventors determined that the step of preparing a sublibrary by random sampling/selection from a list of unique CDRs 3 in a common library and their numbers would be advantageous for accurate evaluation and comparison of the methods of the invention. The number of unique CDRs 3 represented by the unique peptide sequences of the CDR3 fragments should be approximately equal to the number of unique CDRs 3 identified in a disease library or an average calculated from more than one disease library. Generating a significant number of sub-pools, for example 1000 or more sub-pools (generated by random sampling from a public pool) increases the presence of multiple unique CDRs 3 and produces results that are statistically significantly effective for identifying and characterizing an individual patient's immune profile as normal ("healthy") or as characterized by the presence of the type and number of cells associated with a particular disease.
In the methods of the invention, a patient provides a clinical sample comprising, for example, blood or tissue, from which the unique CDR3 is semi-quantitatively amplified and sequenced. This provides the identity and relative abundance of each CDR3 for all unique CDRs 3. This information may be entered into a program that obtains a database containing at least one public library and one or more disease libraries. The software for data entry and/or analysis may be obtained via internet access to the database, or may be located on a separate personal computer that utilizes the internet to access the sequence information in the database. Comparisons between the individual immune profile and the plurality of libraries and sub-libraries are obtained and results are generated, as generally illustrated in fig. 4 and 5, if a particular CDR3 sequence is detected, the number of those unique CDR3 sequences that will be detected is counted and it is determined whether the particular unique CDR3 is present in both the individual immune profile and the particular library (i.e., the particular unique CDR3 is "shared" between the individual and the libraries). The percentages representing the number of those CDRs 3 determined to be common are added together to produce a sum that contains the total number of fractions that comprise the CDRs 3 in the individual immune profile that are common between the individual immune profile and the particular repertoire (i.e., a "common index"). From the results obtained for the sub-pools, the P value is calculated as the probability that the random percentage will be greater than or equal to the percentage recorded for the particular disease pool, and a significant result is recorded when the fraction of the number of times the sample consensus index exceeds the initial consensus index for the particular pool is less than, for example, 0.01. If the consensus index represents a relationship between an individual's immune profile and a disease pool, the individual may be informed of the probability that the individual/patient has the disease represented by a particular disease pool. If the P-value calculated for all disease pools is greater than 0.01, then the report for that individual may indicate that the immune profile appears normal and that no disease state has been detected.
Since the sequence data is compiled together and stored in one or more databases of multiple populations of individuals, it may additionally associate certain common indices with a library representing populations with pre-conditioning or predisposition to certain diseases. The immune system is active and reactive, and changes in the immune system reflected in the immune spectrum may provide the first (and sometimes unique) signal that there is a predisposition, a preconditioning or even an established disease. The present inventors have used the method to demonstrate that certain types of cancer, inflammatory bowel disease and certain viral infections can be detected by determining a common index between patients and an established disease repertoire obtained by sequencing CDR3 using the ARM-PCR method to generate a subset of the immune repertoire representing the existing CDR 3.
The results are even more reliable when the filter is applied to the sequence data. For example, the inventors have developed a "SMART" filter for sequence data that helps generate significantly more reliable results. This is further described in the examples.
By way of further explanation, the following examples illustrate the process of the present invention. Blood samples may be taken from children prior to administration of any vaccine, those of each child used to establish a "baseline" against which future samples may be assessed. For each child, future samples can be used to determine whether exposure to factors has propagated a population of cells known to be associated with the disease, and this can be used as a "marker" of the risk of future development of the disease. Individuals so identified can then be more closely monitored so that early detection can be made and any available treatment options can be provided early in the disease process.
By providing another example, blood samples can be taken from children prior to administration of any vaccine, those from each child establishing a "baseline" against which future samples can be evaluated. For each child in the study and for the entire child population, those baselines can be compared to the results of RNA sequencing of T cells and B cells using target-specific primers to amplify antibodies and T cell receptors after administration of the vaccine. The comparison may further involve evaluating data regarding symptoms, diagnosed diseases, and other information relating to the respective antibody and T cell receptor sequences for each individual. Individuals exhibiting symptoms of a particular disease may also share a corresponding antibody or T cell receptor, e.g., or a collection of corresponding antibodies or T cell receptors, if there is a relationship between administration of the vaccine and the occurrence of the disease.
The methods of the invention can be used, inter alia, to identify commonalities between individuals suffering from, for example, autoimmune diseases, and can provide epidemiological data that will better describe the association of infectious and environmental factors with diseases (e.g., heart disease, atherosclerosis, diabetes and cancer), thereby providing "biomarkers" indicative of the presence of or predisposition to develop disease.
The methods may also be used to develop passive immunotherapy. For example, certain antibody-producing B cells and/or T cells proliferate after exposure to an infectious agent. The methods of the invention enable, for example, protective antibodies to be identified, and those antibodies can be used to provide passive immunotherapy in situations where such therapy is required.
The methods of the invention may also provide the ability to achieve targeted removal of cells with undesirable rearrangements, providing a means by which such cellular rearrangements can be identified.
The present inventors have identified and developed target specific primers for use in the methods of the invention. T cell specific primers are shown in table 1 and antibody specific primers are shown in table 2. Another embodiment of the invention is a method comprising: the RNA of the blood sample is amplified using any one or a combination of the primers of table 1 or table 2, more specifically to recognize antibodies, T cell receptors and HLA molecules within the cell population.
The gene encoding the immunoglobulin superfamily molecule can be amplified using Arm-PCR or tem-PCR according to the Amplification method previously described by the present inventors (Han et al, 2006, Simultaneous Amplification and Identification of 25Human Papilomavir Types with Templex technology. J.Clin. Micro.44(11) 4157-4162). In the tem-PCR reaction, gene-specific nested primers were designed to enrich for the target during the initial PCR cycle. Thereafter, all targets were amplified using universal "super" primers. The primer was designated as Fo(Forward outer side), Fi(forward inner side), Ri(reverse inner side), Ro(reverse outer), FS (forward superprimer) and RS (reverse superprimer), where the superprimer is common to each molecule due to the addition of binding sites for those primers at the ends of the target specific primers. Gene-specific primers (F)o、Fi、RiAnd Ro) Used in very low concentrations. Different primers were involved in each of the three main stages of the tem-PCR process. First, in the "enrichment" phase, a low concentration of gene-specific primers is given sufficient time to find the template. For each intended target, four possible products can be generated, depending on which primer is used: fo/Ro、Fi/Ro、Fi/RiAnd Fo/Ri. The enrichment stage is typically performed for 10 cycles. In the second or "tagging" stage, the annealing temperature is raised to 72 ℃ and only the inner primer (F) of 40 nucleotides in length is presentiAnd Ri) Will function. After 10 cycles of this tagging phase, all PCR products were "tagged" with universal superprimer sequences. Then, in a third "amplification" stage, the high concentration of superprimers effectively acts to amplify all targets and label the PCR products with biotin during the process. Specific probes can be covalently linked to Luminex color-coated beads.
In order to amplify genes encoding immunoglobulin superfamily molecules, the inventors designed nested primers based on sequence information in the public domain. To investigate the VDJ rearrangement of B-and T-cells, the inventors designed primers for amplifying the rearranged and expressed RNA. Typically, a pair of nested forward primers is designed from the V gene and a set of reverse nested primers is designed from the J gene or the C gene. The average amplicon size is 250bp to 350 bp. For example, for the IgHV gene there are 123 genes, which can be divided into 7 different families, and the primers of the invention are designed family-specific. However, if the amplified cDNA sequences are sequenced, there is sufficient sequence diversity to allow for further differentiation among genes within the same family. For MHC loci, genomic DNA is intended to be amplified.
Examples
Calculation of common indices
Assuming S is the subject' S Immune Profile (IP) represented as N unique CDR3 sequences CDR31、CDR32、...CDR3nEach CDR3 has its own frequency s1、s2、...sn。
D is a disease repertoire, which is the sum of a number of patient immune profiles with M unique CDRs 3. All patients in the disease pool were diagnosed with the same disease.
P is a public pool, which is the sum of the immune profiles of a large number of controls.
Common indexIs defined as sx、sy、...szWherein CDR3 is shared in the subject's immune profile and repertoirex、CDR3y、...CDR3z. It should be noted that sx、sy、...szIs the frequency of the CDR3 in the subject's immune profile rather than the frequency of the CDR3 in the library.
Assuming that there are always more unique CDRs 3 in the public pool (P) than in the disease pool (D), M unique CDRs 3 in the public pool were randomly selected and used to generate the sub-pool P1, and the consensus index (SI) between the subject and the sub-pool was calculated according to the above formulap1). The sampling procedure is repeated 1000 times or more and 1000 or more SIs are calculatedpx。
In the same manner, the common index SI between the subjects and the disease pool was calculatedd. The P value is defined as all SI (SI)p1、SIp2、...SIpx、SId(Note that SI isdInclusive) of equal to or greater than SId. It should be noted that when sampling the CDR3 in the public pool, there are x chances that the CDR3 present in the x control's immune profile will be sampled.
Amplification of rearrangement sites in T cells or B cells
All oligonucleotides were resuspended using 1 × TE. All oligonucleotides except 454A and 454B were resuspended at a concentration of 100 pmol/. mu.L. 454A and 454B were resuspended at a concentration of 1000 pmol/. mu.L. 454A and 454B are functionally identical to the common primer previously described, and different sequences are used in subsequent high throughput sequencing procedures.
Three different primer mixtures were prepared. Alpha delta primer mixThe mixture included 82 primers (all TRAV-C + TRDV-C), the β γ primer mix included 79 primers (all TRBVC and TRGV-C), and the B cell primer mix included a total of 70 primers. Fo、FiAnd RiThe concentration of the primer was 1 pmol/. mu.L. RoThe concentration of the primer was 5 pmol/. mu.L. 454A and 454B were at a concentration of 30 pmol/. mu.L.
Three different RNA samples were ordered from ALLCELLS (www.allcells.com). All samples were diluted to a final concentration of 4 ng/uL. The ordered samples were:
| cell type: | the source is as follows: |
| ALL-PB-MNC | patients with acute lymphoblastic leukemia |
| NPB-Pan T cell | Normal T cells |
| NPB-B cells | Normal B cells |
RT-PCR was performed using Qiagen one-step RT-PCR kit. Each sample contained the following:
10 μ L Qiagen buffer
2μL DNTP’s
2 μ l enzyme
23.5μL dH2O
10 μ L of appropriate primer mixture
2.5 μ L of appropriate template (10 ng RNA in total)
The samples were run using the following cycling conditions:
30 minutes at 50 DEG C
15 minutes at 95 DEG C
94 ℃ for 30 seconds
15 cycles of
1 minute at 55 DEG C
1 minute at 72 DEG C
94 ℃ for 15 seconds
6 cycles as follows
1 minute and 30 seconds at 70 DEG C
94 ℃ for 15 seconds
30 cycles of
55 ℃ for 15 seconds
72 ℃ for 15 seconds
3 minutes at 72 DEG C
Maintaining at 4 deg.C
The order of the samples placed in the gel shown in FIG. 1a is: (1) molecular gradients (maximum at 500bp, decreasing with an amplitude (step) of 20bp, middle bright band in FIG. 1a at 200 bp); (2) a primer mix of α + δ and 10ng Pan T cell template; (3) β + γ primer mix and 10ng Pan T cell template; (4) b cell primer mix and 10ng B cell template; (5) b cell primer mix and 10ng ALL cell template; (6) a primer mix of α + δ and 10ng ALL cell template; (7) β + γ primer mix and 10ng ALL cell template; 8. alpha + delta primer mix blank; (9) a blank of the beta + gamma primer mixture; (10) b cell primer mix blank; (11) electrophoresis buffer blank. These samples were pre-cast Use on
 SDS 10% gel Electrophoresis was performed with a DNA non-denaturing electrophoresis buffer.
Initial experiments showed that a tail band was generated from the PCR reaction including the template. The trailing band indicates that different sized PCR products were generated, which represent a mixture of different VDJ rearrangements. There was some background amplification from the B cell reaction. Further improvements to the primer mixture are required to clean the reaction.
To determine whether a PCR product actually includes a different VDJ rearrangement, it is necessary to isolate a single clone and sequence it. Instead of using a conventional cloning procedure, the inventors used a different strategy. The PCR products generated from the α δ -mixture and β γ -mixture ( lanes 2 and 3 in FIG. 1a) were diluted 1: 1000, and 2 μ l aliquots were used as PCR templates in the following reactions. Then, instead of using a primer mix targeting the entire repertoire, only one specific PCR product was amplified using a specific pair of Fi and Ri primers (5 pmol each). The following cycling conditions were used to amplify the samples:
5 minutes at 95 DEG C
30 cycles of
94 ℃ for 30 seconds
1 minute at 72 DEG C
3 minutes at 72 DEG C
Maintaining at 4 deg.C
The product was amplified using the Qiagen PCR kit. The Master Mix used for PCR contained the following:
| each reaction | Master Mix×12 | |
| 10 XPCR buffer | 5μL | 60μL |
| dNTP | 1μL | 12μL |
| HotStartTaq Plus | 0.25μL | 3μL |
| H2O | 39.75μL | 477μL |
The gel photograph in FIG. 1b shows the PCR products of the following reactions: (1) a molecular gradient; (2) TRAV1Fi + TRACRi and α δ Pan T PCR products; (3) TRAV2Fi + TRACRi and α δ Pan T PCR products; (4) TRAV3Fi+TRACRiAnd an α δ Pan T PCR product; (5) TRAV4Fi+TRACRiAnd an α δ Pan T PCR product; (6) TRAV5Fi+TRACRiAnd a PCR product with α δ Pan T; (7) TRAV1Fi+TRACRiAnd an α δ Pan T PCR product; (8) TRAV2Fi+TRACRiAnd an α δ Pan T PCR product; (9) TRAV3Fi+TRACRiAnd an α δ Pan T PCR product; (10) TRAV4Fi+TRACRiAnd an α δ Pan T PCR product; (11) TRAV5Fi+TRACRiAnd an α δ Pan T PCR product; (12) PCR blank. As FiThe primers listed are "forward inside" primers and are designated as FoThe primers listed are "forward outer" primers, and RiAnd RoThe "reverse inner" primer and the "reverse outer" primer are indicated, respectively.
As illustrated by fig. 1b, each reaction produced a single PCR product. Different reactions produced bands of different sizes. This PCR cloning approach was successful for two main reasons-1) the PCR template used in this reaction was the diluted PCR product (1: 1000) of the previous reaction that used a primer mix to amplify all possible VDJ rearrangements (e.g., using a primer mix that included a total of 82 primers to amplify the T cell receptor alpha and delta genes), and (2) only one pair of PCR primers targeting a specific V gene was used in each reaction during this "cloning" experiment. Some of these products were gel purified and sequenced. The following is an example sequence obtained from the scheme described above. In each case, a single clone was obtained and the specific T cell receptor V gene matched to the Fi primer was identified.
TRAV1 template + 454A as sequencing primer:
NNNNNNNNNNCNTANTCGGTCTAAGGGTACNGNTACCTCCTTTTGAAGGAGCTCCAGATGAAAGACTCTGCCTCTTACCTCTGTGCTGTGAGAGATANCAACNATCACTTAATCTTGGGCGCTGGGAGCAGACTAATTATAATGCCAGATATCCACAACCCTGACCCTGCCGCGTACCAGCTGAAAGACTATGAACAGGATGGGGAGGCAGNAGNAGNAG(SEQ ID NO.1)
TRAV1 template + 454A as sequencing primer:
NNNNNNNNNNGNANGNNCAGGGTTCTGGATATTTGGTTTNACAATTAGCTTGGTCCCTGCTCCAAAGATTAATTTGTAGTTGCTATCCCTCACAGCACAGAGGTAAGAGGAAGAGTATTTCTTCTGGAGCTCCTTCAACAGGAGGAAACTGTACCCTTTATACCTACTAAGGAATGAAGA(SEQ ID NO.2)
TRAV2 template + 454A as sequencing primer:
NNNNNNNNNNNNTNNCGGTTCTCTTNNTCGCTGCTCATCCTCCAGGTGCGGGAGGCAGATGCTGCTGTTTACTACTGTGCTGTGNANNANGGCANNGACAACAACCTCNTCTTTGGTGGAGGNACCCTACTNNTGGTTATNCCNAATANCCANAACCCTGACCCTGCCGAGNAGCAGCANAAAAACTNNNAGGGGGGTGGAGAAGNANNNNN(SEQ ID NO.3)
TRAV3 template + 454A as sequencing primer:
NNNNNNNNNNNNNNGGNNNGGNAGCTATGGCTTTGAAGCTGAATTTAACAAGAGCCAAACCTCCTTCCACCTGAAGAAACCATCTGCCCTTGTGAGCGACTCCGCTTTGTACTTCTGTGCTGTGAGAGACATCAACGCTGCCGGCAACAACCTAACTTTTGGAGGAAGAACCATGGTGCTAGTTAAACCAAATATCCATAACCCTGACGCTGCCGTGTACCAGCTGAAAGACTCTGAGGGGGCTGGAGAGGNAGGNG(SEQ ID NO.4)
TRAV4 template + 454A as sequencing primer:
NNNNNANNGGNNNNNGTTTATCCCTGCCGACAGAAAGTCCAGCACTCTGAGCCTGCCCCGGGTTTCCCTGAGCGACACTGCTGTGTACTACTGCCTCGTGGGTGACCGGTCTGGAAACAGCGATGAAATTTTCATCTTAGGAAGAAGAACGCTTCTAGTCATCCANCCCAACATCCACAACCCTGCCGCGGAGNAGCACCAGAAAAAAGATGATGAGGGGGANGNAGNAGNANNNN(SEQ ID NO.5)
TRAV5 template + 454A as sequencing primer:
NNNNNNNNNNNNNNNNTCNCTGNTCTATTGAATAAAAAGGATAAACATCTGTCTCTGCGCATTGCAGACACCCAGACTGGGGACTCAGCTATCTACTTCTGTGCAGAGAGCCCCGGTGGCGGCAGCAACTTCTTCTTTGGTGGAGGAGCANTACTACTAGTCGTTCTACATANCCACAACCATGATNCCGCCGAGTACNTGCTGAAAAAATATGATGAGGATGGAGAAGAAGNAGCATNAN(SEQ ID NO.6)
TRBV19Fi template + 454A as sequencing primer:
NNNNNNNNCTGAGGGTANNCGTCTCTCGGGAGAAGAAGGAATCCTTTCCTCTCACTGTGACATCGGCCCAAAAGAACCCGACAGCTTTCTATCTCTGTGCCAGTAGTATGGGGGGGGGGGCCTACAATGAGNACGGCGGCGGGGGAGGGACNNTGCTCGTCGTGGAGGAGGACATGAAGGTCTTGCCCGCNNCNGAGGAAGNTGNANANGAACCATAAAAATGCGCTGGCTGAANNN(SEQ ID NO.7)
TRBV20Fi template + 454A as sequencing primer:
NNNNNNNNNNNGCTCNNNNNNCNCATACGAGCAAGGCGTCGAGAAGGACAAGTTTCTCACAACCATGCAAGCCTGACCTTGTCCACTCTGACAGTGACCAGTGCCCATCCTGAAGACAGCAGCTTCTACATCTGCAGTGCTAGAGGGGGGGGGGGGGACGACTACTACTACTTCGGCGGGGGGGGCATGCTGATCGTGGAGGAGGAGGACATGNAGCTCCTCCCCGCCGCCGAGGTTGTTGTGTNTNNANCATCATACTGNTGGTGGAGNAGNAGNAGCN(SEQ ID NO.8)
TRBV21Fi template + 454A as sequencing primer:
NNNNNNNNNNNNNNNGNNNNNNNNNNNTACTTTCNGAATGAAGAACTTATTCAGAAAGCAGAAATAATCAATGAGCGATTTTTAGCCCAATGCTCCAAAAACTCATCCTGTACCTTGGAGTTCCAGTCCACGGAGTCAGGGGACACAGCACTGTATTTCTGTGCCAGCAGCA(SEQ ID NO.9)
TRBV23Fi template + 454A as sequencing primer:
NNNGNNNNNNNANNGGANANGCACAAGAAGCGATTCTCATCTCAATGCCCCAAGAACGCACCCTGCAGCCTGGCAATCCTGTCCTCAGAACCGGGAGACACGGCACTGTATCTCTGCGCCAGCAGTCAATCGGGGGGGGGGGGGAGGGCCGTCCGCAGCGGGGGGGGGGGGGGCCGGGGGACGGTCCCAAAGAGAAAGAAAACCTGCCCCCCGCGCTCGGGCGGTGTGATTGAGCGAAACAGACAGGAAGGNAAGNAAAAAANNNNANCNNCNCTCNN(SEQ ID NO.10)
TRBV24Fi template + 454A as sequencing primer:
NNNNNNNNGNNANNNTCTGATGGANACAGTGTCTCTCGACAGGCACAGGCTAAATTCTCCCTGTCCCTAGAGTCTGCCATCCCCAACCAGACAGCTCTTTACTTCTGTGCCACCAGTGANGCGGGGGGCGGGGACCACTACTTCGGGGGGGGGAGGCGGACCAGGGTGCTGGTCGACGAGAAAAAGGAGCTCCCCCCCGCCGCCGCTGTGGTTGTTGCTTCATAATAATCAGGNNGGNGAGGNAGNAGNAANN(SEQ ID NO.11)
to investigate the effect of the artifacts on the overall repertoire analysis of the TCR β transcriptome, the inventors performed control experiments using chemically synthesized TCR β CDR3 templates. To this end, the inventors chemically synthesized four unique clones, clone purified each clone, and prepared a different mixture of these four constructs as templates for Amplicon Rescue Multiplex (ARM) -PCR. Two different reaction mixtures were subjected to two independent ARM-PCR reactions and Illimuna was used The pooled PCR products were sequenced from both ends with a length of 100 bp. The inventors first joined together double-ended reads by overlap alignment using a modified Needleman-Wunsch algorithm and then mapped the combined sequences to germline V, D and J reference sequences.
Without clearance, the inventors obtained a total of 5,729,613 sequences from template mixture I that could be mapped to TCR β V, D and J fragments. Surprisingly, the sequence reads purportedly represented a total of 36,439 unique CDR3 variants. Thus, considering that there are only four unique variants of CDR3 in the template mixture, virtually all of the identified variants of CDR3 must be non-authentic. Similar results were obtained for the second template mixture, where a total of 9,131,681 VDJ-mapped sequences were identified, mimicking the presence of 50,354 unique TCR β CDR3 variants. Independent sequencing experiments by the inventors showed that only a few unique CDR3 template variants can generate artificial repertoire diversity far exceeding the true template diversity, and therefore the inventors set out to eliminate these artifacts.
The 3' terminal Illumina sequencing read is generally considered to be of poor quality. In the case of repertoire sequencing, this is annoying because the PCR primers need to be positioned far enough away from the hypervariable V (D) J junction to avoid side effects due to primer-template mismatches. Thus, the CDR3 fragment of interest is typically "shifted" closer to the 3' end of the sequencing read-a region with increased sequencing error rate. Another technical problem of interest is the observation that sequencing errors are background specific and therefore chain specific. Therefore, it is realistic to assume that there is a very small probability that a sequencing error in a forward read coincides with a sequencing error in a corresponding reverse read.
In view of this, the present inventors have devised a solution based on The technology provides a double-ended strategy for double-stranded sequencing of the entire TCR CDR3 segment. In this method, forward and reverse sequencing primers are located at the 3-terminus of the framework region and at the 5' -terminus of the TCR J or C region, respectively. Given the average length of the Illumina sequence reads (currently 100-150bp), this design enabled complete sequencing of both chains that bound the CDR3 segment. In a second step, the forward and reverse reads were then analyzed for sequence mismatches and the newly developed double-ended filtering algorithm was used to eliminate CDR3 sequences that exhibit non-identity of the two chains.
Applying this sequencing error filter to the 5,729,613 CDR3 sequences obtained for template mixture I, the inventors identified a total of 2,751,131 (48%) CDR3 sequences that contained conflicting sequence information on their opposite strands. Discarding these sequences eliminated 35,455 (97.2%) unique artificial CDR3 variants. Consistent with this, the double-ended filter removed 4,308,020 (47%) CDR3 sequences from template mixture II, resulting in the elimination of 49,063 (97.4%) artificial CDR3 variants. A total of 973 and 1271 unique CDR3 variants, respectively, passed the filter. These results indicate that double-ended sequencing and filtering reduced the total number of non-authentic unique CDR3 sequences by almost two orders of magnitude.
Detailed analysis of the frequency distribution of the non-authentic CDR3 variants after sequencing error filters revealed that in both mixtures, about 50% of all artifacts were single copy sequences. About 10% of these artificial CDRs 3 displayed > 100 copy numbers and accounted for > 80% of all artificial CDR3 variants. Given that the variable TCR genes do not undergo somatic hypervariation, the present inventors developed reference algorithms that can identify and remove CDR3 sequence reads that exhibit nucleotide mismatches relative to the mapped germline V, D and J reference sequences, since these reads must be artifacts generated at the PCR amplification or sequencing level.
Applying this filtering algorithm to the "double-ended filtered" sequences of template mixture I removed a total of 29,804 sequences, which correspond to 609 unique CDR3 variants. For template mixture II, 54,516 artificial sequences (831 unique CDR3 variants) were identified. Thus, the use of the reference sequence filter reduced the non-authentic unique CDR3 sequence by 60%. The reference filter was not effective for V-J and D-J junctions because nucleotides randomly added to these regions during somatic recombination could not be mapped. Therefore, the inventors performed PCR filters after computational simulation experiments to better understand four variables: the effect of initial template number, replication efficiency per cycle, number of cycles (n) and DNA polymerase error rate (μ) on the overall endpoint error rate. In contrast, the inventors noted that PCR polymerase error rate had a significant effect on the number of accumulated errors.
In the inventors' control sequencing experiments, PCR amplification was performed in 15 cycles and 45 cycles in the first and second reactions using Taq polymerase. To more realistically simulate the accumulation of errors during the ARM-PCR reaction, the PCR efficiency was set to decrease by 5% per cycle for the first 25 cycles and by 10% per cycle for the remaining cycles. For each new PCR reaction, the PCR efficiency was reset to 1.0. Furthermore, the inventors allow for variation at the second location. The substitution error rate of the published Taq enzyme is expressed as error/bp/cycle, and it is in the range of 0.023X 10⁻⁴To 2.1X 10⁻⁴. In the simulation experiment, the substitution error rate was set to 2.7 × 10⁻⁵And the insertion-loss (indel) error rate is set to 1.0 × 10⁻⁶. Taq polymerase is known to have a higher insertion and deletion (indel) mutation rate in the homopolymeric region of the template. For a homomeric region, indel mutations in any position of this region generate the same pattern. Thus, the indel error rate in a homomeric region is set to n × μ, where n is the length of the homomeric region and μ is 1.0 × 10⁻⁶。
Since the initial template number and PCR efficiency have less impact on the endpoint error rate, it should be safe to apply the same endpoint error rate estimated from the simulation experiment to molecules with different initial numbers and different replication efficiencies in a multiplex PCR reaction. For each category, the cutoff error rate (μ) was empirically set to the error rate at the 9999 th 10000 quantile point. For two similar CDR3 sequences A and B with frequencies NA and NB (NA > NB) that differ in less than three positions, CDR3 sequence B would be excluded if NA μ ≧ NB where μ is the corresponding cut-off error rate. Applying this filtering algorithm to the "reference filtered" sequences of template mixture I removed a total of 22,369 sequences, which correspond to 281 unique CDR3 variants. For template cocktail II, 39,920 artificial sequences (348 unique CDR3 variants) were identified (table 1). Thus, using a PCR amplification error filter can further reduce the non-authentic unique CDR3 sequence by about 80%.
In a compilation of sequences that have passed the above filters, the inventors identified several abundant CDR3 variants that differ from their most similar input template sequence at multiple positions. Since it is extremely rare to have PCR substitutions and/or indel mutations at multiple positions of the CDR3 fragment according to simulation experiments, those CDR3 variants must be caused by artifacts of other origin. Interestingly, the inventors noted that some of these sequences contained fragments with two unique input templates and exhibited clear breakpoints, which identified the sequences as chimeras. Chimeric sequences are PCR artifacts resulting from incomplete primer extension or template switching during PCR and form mosaic-like structures. In view of this unexpected PCR artifact, the inventors developed a computational "mosaic filter". Using this filtering algorithm, the inventors identified a total of 17 and 15 chimeric sequences in template mixtures I and II, respectively. Notably, some of these CDR3 chimeras exhibited sequence copy numbers > 1000, indicating that the inventors' algorithms for filters were able to identify highly abundant chimeric CDR3 sequences.
The application of the filtering algorithm eliminated 99.8% of the non-authentic unique CDR3 sequences generated by high throughput sequencing of only four defined TCR CDR3 templates. Only 62 and 73 artificial CDR3 sequences, respectively, passed through all filters. Of these sequences, the two most abundant CDR3 sequences were identical in the two mixing experiments. They most likely represent chimeric artifacts that escape filtration due to a single nucleotide substitution located at the exact breakpoint. In the remaining error CDRs 3, 85% (n-53) and 75% (n-55) are single reads, respectively. To eliminate this small fraction of artifacts, the inventors propose that high stringency data analysis of the TCR immune repertoire should include another filter (frequency threshold filter) that removes single copy CDR3 reads.
TABLE 1


TABLE 2


Claims (1)
1. Use of primers for amplifying CDR3 sequences in the preparation of a diagnostic agent for performing a method for analyzing semi-quantitative sequence information to provide one or more immune status reports for a human or animal, the method comprising the steps of:
(a) identifying one or more unique CDR3 sequences that are shared between the subject's immune profile and a cumulative immune profile from a pool of diseases stored in a database;
(b) summing the total number of detected sequences for subjects corresponding to those unique CDR3 sequences in common;
(c) calculating a percentage of the total number of detected sequences in the subject's immune profile that represent those unique CDRs 3 that are shared between the subject's immune profile and the disease pool to generate one or more initial consensus indices;
(d) randomly selecting sequences from a public library stored in a database to form a sub-library comprising a number of unique CDR3 sequences approximately equal to the number of unique CDR3 sequences in the disease library;
(e) identifying one or more unique CDR3 sequences that are shared between the subject's immune profile and the sublibrary;
(f) summing the total number of detected sequences corresponding to those CDR3 sequences in common and calculating a percentage of the total number of detected sequences in the subject immune profile that are common between the subject immune profile and the sublibrary to produce a sample consensus index;
(g) repeating steps (d) to (f) at least 1000 times or more;
(h) evaluating a P-value as a fraction of the number of times the sample consensus index is greater than or equal to the initial consensus index between a patient's immune profile and a pool of diseases; and
wherein when the P value is greater than 0.01, it is indicative that the subject's immune profile is normal.
Applications Claiming Priority (3)
| Application Number | Priority Date | Filing Date | Title |
|---|---|---|---|
| US201361763451P | 2013-02-11 | 2013-02-11 | |
| US61/763,451 | 2013-02-11 | ||
| PCT/US2014/015841 WO2014124451A1 (en) | 2013-02-11 | 2014-02-11 | Method for evaluating an immunorepertoire |
Publications (2)
| Publication Number | Publication Date |
|---|---|
| CN105164277A CN105164277A (en) | 2015-12-16 |
| CN105164277B true CN105164277B (en) | 2021-05-28 |
Family
ID=51300201
Family Applications (1)
| Application Number | Title | Priority Date | Filing Date |
|---|---|---|---|
| CN201480020810.1A Active CN105164277B (en) | 2013-02-11 | 2014-02-11 | Method for evaluating immune repertoires |
Country Status (10)
| Country | Link |
|---|---|
| US (1) | US20160034637A1 (en) |
| EP (1) | EP2954070B1 (en) |
| JP (1) | JP6460343B2 (en) |
| KR (1) | KR102228488B1 (en) |
| CN (1) | CN105164277B (en) |
| CA (1) | CA2900776C (en) |
| ES (1) | ES2798119T3 (en) |
| HK (1) | HK1212735A1 (en) |
| PT (1) | PT2954070T (en) |
| WO (1) | WO2014124451A1 (en) |
Families Citing this family (8)
| Publication number | Priority date | Publication date | Assignee | Title |
|---|---|---|---|---|
| WO2016144776A1 (en) * | 2015-03-06 | 2016-09-15 | Cb Biotechnologies, Inc. | Method for measuring a change in an individual's immunorepertoire |
| US20160333409A1 (en) * | 2015-03-09 | 2016-11-17 | Cb Biotechnologies, Inc. | Method for identifying disease-associated cdr3 patterns in an immune repertoire |
| US11047011B2 (en) * | 2015-09-29 | 2021-06-29 | iRepertoire, Inc. | Immunorepertoire normality assessment method and its use |
| WO2017193097A1 (en) | 2016-05-06 | 2017-11-09 | Girihlet Inc. | Methods and compositions for determining specifc tcr and bcr chain pairings |
| CN106283201B (en) * | 2016-09-20 | 2019-08-06 | 中国医学科学院肿瘤医院 | The detection of TCR diversity and library construction based on high-flux sequence |
| US20200199650A1 (en) * | 2017-05-18 | 2020-06-25 | Geneplus-Beijing | Analysis system for peripheral blood-based non-invasive detection of lesion immune repertoire diversity and uses of system |
| EP4212631A1 (en) * | 2017-09-01 | 2023-07-19 | Life Technologies Corporation | Compositions and methods for immune repertoire sequencing |
| US20220148690A1 (en) * | 2019-05-17 | 2022-05-12 | iRepertoire, Inc. | Immunorepertoire wellness assessment systems and methods |
Citations (2)
| Publication number | Priority date | Publication date | Assignee | Title |
|---|---|---|---|---|
| WO2011139371A1 (en) * | 2010-05-06 | 2011-11-10 | Sequenta, Inc. | Monitoring health and disease status using clonotype profiles |
| WO2012097374A1 (en) * | 2011-01-14 | 2012-07-19 | Cb Biotechnologies, Inc. | Immunodiversity assessment method and its use |
Family Cites Families (8)
| Publication number | Priority date | Publication date | Assignee | Title |
|---|---|---|---|---|
| CA2257152C (en) * | 1996-06-03 | 2009-01-27 | Linda M. Pilarski | Methods for detection of rearranged dna |
| AU2009231582B2 (en) * | 2008-04-03 | 2015-02-26 | iRepertoire, Inc. | Amplicon rescue multiplex polymerase chain reaction for amplificaton of multiple targets |
| US9012148B2 (en) * | 2008-04-16 | 2015-04-21 | Jian Han | Method for evaluating and comparing immunorepertoires |
| US8691510B2 (en) * | 2008-11-07 | 2014-04-08 | Sequenta, Inc. | Sequence analysis of complex amplicons |
| EP4335932A2 (en) * | 2008-11-07 | 2024-03-13 | Adaptive Biotechnologies Corporation | Methods of monitoring conditions by sequence analysis |
| US9234240B2 (en) * | 2010-05-07 | 2016-01-12 | The Board Of Trustees Of The Leland Stanford Junior University | Measurement and comparison of immune diversity by high-throughput sequencing |
| JP2014528001A (en) * | 2011-09-28 | 2014-10-23 | シービー バイオテクノロジーズ インコーポレイテッド | Identification of antigen-specific adaptive immune responses using arm PCR and high-throughput sequencing |
| JP6164759B2 (en) * | 2013-11-21 | 2017-07-19 | Repertoire Genesis株式会社 | Analysis system for T cell receptor and B cell receptor repertoire and its use for therapy and diagnosis |
-
2014
- 2014-02-11 US US14/767,178 patent/US20160034637A1/en not_active Abandoned
- 2014-02-11 KR KR1020157023530A patent/KR102228488B1/en active IP Right Grant
- 2014-02-11 PT PT147490957T patent/PT2954070T/en unknown
- 2014-02-11 CA CA2900776A patent/CA2900776C/en active Active
- 2014-02-11 WO PCT/US2014/015841 patent/WO2014124451A1/en active Application Filing
- 2014-02-11 EP EP14749095.7A patent/EP2954070B1/en active Active
- 2014-02-11 ES ES14749095T patent/ES2798119T3/en active Active
- 2014-02-11 JP JP2015557201A patent/JP6460343B2/en active Active
- 2014-02-11 CN CN201480020810.1A patent/CN105164277B/en active Active
-
2016
- 2016-01-18 HK HK16100509.6A patent/HK1212735A1/en unknown
Patent Citations (2)
| Publication number | Priority date | Publication date | Assignee | Title |
|---|---|---|---|---|
| WO2011139371A1 (en) * | 2010-05-06 | 2011-11-10 | Sequenta, Inc. | Monitoring health and disease status using clonotype profiles |
| WO2012097374A1 (en) * | 2011-01-14 | 2012-07-19 | Cb Biotechnologies, Inc. | Immunodiversity assessment method and its use |
Non-Patent Citations (1)
| Title |
|---|
| High Throughput Sequencing Reveals A Complex Pattem Of Dynamic Interrelationships Among Human T Cell Subsets;WANG,C ET AL.;《PNAS》;20100126;第107卷(第4期);1518-1523 * |
Also Published As
| Publication number | Publication date |
|---|---|
| HK1212735A1 (en) | 2016-06-17 |
| US20160034637A1 (en) | 2016-02-04 |
| CA2900776A1 (en) | 2014-08-14 |
| WO2014124451A1 (en) | 2014-08-14 |
| JP6460343B2 (en) | 2019-01-30 |
| CN105164277A (en) | 2015-12-16 |
| EP2954070A1 (en) | 2015-12-16 |
| EP2954070B1 (en) | 2020-04-01 |
| EP2954070A4 (en) | 2016-10-26 |
| JP2016506750A (en) | 2016-03-07 |
| CA2900776C (en) | 2023-08-15 |
| KR102228488B1 (en) | 2021-03-15 |
| ES2798119T3 (en) | 2020-12-09 |
| KR20150141939A (en) | 2015-12-21 |
| PT2954070T (en) | 2020-06-22 |
Similar Documents
| Publication | Publication Date | Title |
|---|---|---|
| CN105164277B (en) | Method for evaluating immune repertoires | |
| AU2009244634B2 (en) | Method for evaluating and comparing immunorepertoires | |
| US10392663B2 (en) | Highly-multiplexed simultaneous detection of nucleic acids encoding paired adaptive immune receptor heterodimers from a large number of samples | |
| EP2663864B1 (en) | Immunodiversity assessment method and its use | |
| US20170335386A1 (en) | Method of measuring adaptive immunity | |
| Sui et al. | Composition and variation analysis of the TCR β-chain CDR3 repertoire in systemic lupus erythematosus using high-throughput sequencing | |
| RU2766004C1 (en) | Method for assessing normal state of immune repertoire and its application | |
| Kirik et al. | Parallel antibody germline gene and haplotype analyses support the validity of immunoglobulin germline gene inference and discovery | |
| US11414700B2 (en) | TCR/BCR profiling using enrichment with pools of capture probes | |
| Simon et al. | Sequencing the peripheral blood B and T cell repertoire–quantifying robustness and limitations | |
| US20180051336A1 (en) | Methods for diagnosing multiple sclerosis using vh4 antibody genes |
Legal Events
| Date | Code | Title | Description |
|---|---|---|---|
| C06 | Publication | ||
| PB01 | Publication | ||
| C10 | Entry into substantive examination | ||
| SE01 | Entry into force of request for substantive examination | ||
| REG | Reference to a national code |
Ref country code: HK Ref legal event code: DE Ref document number: 1212735 Country of ref document: HK |
|
| GR01 | Patent grant | ||
| GR01 | Patent grant |