CN102822834B - Computer-based system for predicting treatment outcome - Google Patents
Computer-based system for predicting treatment outcome Download PDFInfo
- Publication number
- CN102822834B CN102822834B CN201180015982.6A CN201180015982A CN102822834B CN 102822834 B CN102822834 B CN 102822834B CN 201180015982 A CN201180015982 A CN 201180015982A CN 102822834 B CN102822834 B CN 102822834B
- Authority
- CN
- China
- Prior art keywords
- treatment
- population
- function
- model
- individuals
- Prior art date
- Legal status (The legal status is an assumption and is not a legal conclusion. Google has not performed a legal analysis and makes no representation as to the accuracy of the status listed.)
- Active
Links
Images


Classifications
-
- G—PHYSICS
- G16—INFORMATION AND COMMUNICATION TECHNOLOGY [ICT] SPECIALLY ADAPTED FOR SPECIFIC APPLICATION FIELDS
- G16B—BIOINFORMATICS, i.e. INFORMATION AND COMMUNICATION TECHNOLOGY [ICT] SPECIALLY ADAPTED FOR GENETIC OR PROTEIN-RELATED DATA PROCESSING IN COMPUTATIONAL MOLECULAR BIOLOGY
- G16B40/00—ICT specially adapted for biostatistics; ICT specially adapted for bioinformatics-related machine learning or data mining, e.g. knowledge discovery or pattern finding
- G16B40/20—Supervised data analysis
-
- G—PHYSICS
- G16—INFORMATION AND COMMUNICATION TECHNOLOGY [ICT] SPECIALLY ADAPTED FOR SPECIFIC APPLICATION FIELDS
- G16B—BIOINFORMATICS, i.e. INFORMATION AND COMMUNICATION TECHNOLOGY [ICT] SPECIALLY ADAPTED FOR GENETIC OR PROTEIN-RELATED DATA PROCESSING IN COMPUTATIONAL MOLECULAR BIOLOGY
- G16B5/00—ICT specially adapted for modelling or simulations in systems biology, e.g. gene-regulatory networks, protein interaction networks or metabolic networks
- G16B5/20—Probabilistic models
-
- G—PHYSICS
- G16—INFORMATION AND COMMUNICATION TECHNOLOGY [ICT] SPECIALLY ADAPTED FOR SPECIFIC APPLICATION FIELDS
- G16B—BIOINFORMATICS, i.e. INFORMATION AND COMMUNICATION TECHNOLOGY [ICT] SPECIALLY ADAPTED FOR GENETIC OR PROTEIN-RELATED DATA PROCESSING IN COMPUTATIONAL MOLECULAR BIOLOGY
- G16B40/00—ICT specially adapted for biostatistics; ICT specially adapted for bioinformatics-related machine learning or data mining, e.g. knowledge discovery or pattern finding
-
- Y—GENERAL TAGGING OF NEW TECHNOLOGICAL DEVELOPMENTS; GENERAL TAGGING OF CROSS-SECTIONAL TECHNOLOGIES SPANNING OVER SEVERAL SECTIONS OF THE IPC; TECHNICAL SUBJECTS COVERED BY FORMER USPC CROSS-REFERENCE ART COLLECTIONS [XRACs] AND DIGESTS
- Y02—TECHNOLOGIES OR APPLICATIONS FOR MITIGATION OR ADAPTATION AGAINST CLIMATE CHANGE
- Y02A—TECHNOLOGIES FOR ADAPTATION TO CLIMATE CHANGE
- Y02A90/00—Technologies having an indirect contribution to adaptation to climate change
- Y02A90/10—Information and communication technologies [ICT] supporting adaptation to climate change, e.g. for weather forecasting or climate simulation
Landscapes
- Physics & Mathematics (AREA)
- Engineering & Computer Science (AREA)
- Health & Medical Sciences (AREA)
- Life Sciences & Earth Sciences (AREA)
- Bioinformatics & Cheminformatics (AREA)
- Medical Informatics (AREA)
- Theoretical Computer Science (AREA)
- Spectroscopy & Molecular Physics (AREA)
- Bioinformatics & Computational Biology (AREA)
- Biotechnology (AREA)
- Evolutionary Biology (AREA)
- General Health & Medical Sciences (AREA)
- Biophysics (AREA)
- Physiology (AREA)
- Molecular Biology (AREA)
- Data Mining & Analysis (AREA)
- Epidemiology (AREA)
- Bioethics (AREA)
- Computer Vision & Pattern Recognition (AREA)
- Databases & Information Systems (AREA)
- Artificial Intelligence (AREA)
- Evolutionary Computation (AREA)
- Public Health (AREA)
- Software Systems (AREA)
- Probability & Statistics with Applications (AREA)
- Medical Treatment And Welfare Office Work (AREA)
- Investigating Or Analysing Biological Materials (AREA)
- Measuring Or Testing Involving Enzymes Or Micro-Organisms (AREA)
Abstract
The present invention relates to computer systems for conducting drug and biomarker discovery, drug development, and personalized medicine, and more generally managing healthcare, and more particularly to systems and methods for predicting treatment value for treatment of an individual. The treatment is associated with a function that generally describes the benefit of the treatment in the population of individuals as a function of the risk (e.g., occurrence of the medical event) without the treatment in the event of the treatment.
Description
Technical Field
The present invention relates to computer systems for managing healthcare, and more particularly to systems and methods for predicting the therapeutic value of a treatment to a user. The system is particularly suited to assist a user in making decisions based on treatment efficacy. The system may be configured to display personalized treatment information to the patient and/or their physician, or information about the value of existing treatments or hypothetical treatments to, for example, a healthcare payer or drug developer.
Background
As observed in clinical practice, while numerous computer-based systems have been developed for classifying and displaying treatment costs, there have been few attempts to design systems that can predict outcomes.
One example for predicting the therapeutic outcome is the system of Archimedes ltd, e.g. WO2009/158585 (Archimedes ltd). The system uses a complex biological model of the human body including modeling of body organs and body functions. The system then accepts inputs of patient characteristics and their results, maps these to a human biological model and derives a benefit function for each simulated individual. The model allows users to generate and study larger populations of simulated individuals that replicate the population from which input features are derived (e.g., customers of HMOs). However, such systems do not appear to allow for treatment simulation in populations where the drug has not been used in vivo. In addition, the system requires complex biological models whose parameters are difficult to validate, and because each simulated individual is modeled independently, a very large number of mathematical functions are required. Another system reported in US2005/013663 shares common aspects of the approach of the Archimedes system, as it uses each virtual individual represented by a complex biological model and attempts to match the real patient to the closest representation among the virtual individuals. The system is also highly complex and depends on the accuracy of the biological model.
Accordingly, there is a need for improved systems for predicting treatment outcome in new patients or in new populations and for drug candidates prior to in vivo administration.
Disclosure of Invention
The outcome processing system of the invention will typically include a processor that performs the method of predicting the outcome of a treatment, e.g., the system will typically include a set of inputs, a processor in communication with the inputs, and optionally a display, a communication device or data storage device in communication with the processor.
The set of inputs generates a set of data, denoted T, that characterizes the treatment. The treatment may be a hypothetical treatment (e.g., modulation of a biological target, hypothetical chemical structure) or a real treatment. The treatment is associated with a function that describes the benefit of the treatment in the population of individuals, typically in terms of the occurrence of a medical event at the treatment, and the benefit of the treatment is described as a function of the risk (e.g., occurrence of a medical event) without the treatment described above. The treatment is optionally associated with one or more variables (X). The variable (X) is a vector of individual features other than those contained in the risk (Rc) in the absence of treatment, and wherein the variables (X) and (Y) may be environmental, phenotypic or genotypic derived variables(s). The variable (X) can alternatively be referred to as a first variable and the variable (Y) as a second variable.
The processor calculates a therapeutic benefit for the virtual population or patient of interest using a function that describes the therapeutic benefit as a function of risk (Rc) and variable (X) in the absence of the above-described treatment. The processor can calculate any one or more number of benefit indicators from the treatment of a population or individual, which can then be output. Alternatively, the benefits of the treatment may be displayed, stored or communicated in text or graphical form, e.g. to a database or further to a processor.
The optional display generation includes a display of any one or more of a number of benefit indicators, including textual or graphical, obtained from treatment of a population or individual.
By associating each treatment (T) with an equation that describes its benefits in the population and variables that describe inter-patient variability, the set of treatments (T) can be evaluated in a simulated population that differs in number or characteristics (e.g., variables (X) and/or (Y)) from the population from which the function was derived. This approach does not require a separate function to describe each individual's complex biological process as was the case with previous systems, but instead uses a benefit function that can be applied to a given treatment across individuals with different individual-specific characteristics. Thus, a single benefit function can be applied to the overall population, and since a single benefit function can be targeted for each treatment or each therapy modality (e.g., a treatment regimen with defined dose, plan, etc.), the system is simplified and potential sources of error are eliminated.
The invention is useful, for example, to evaluate whether a treatment is appropriate for a population of interest, or how the treatment is compared to another treatment, including but not limited to evaluating whether a treatment is cost effective in a population of interest. The invention is also useful in personalized medicine; the user can enter patient descriptors (variables) and the previously mentioned benefit functions and variables, and can be used to calculate and display to the user the benefits that the patient will receive from treatment. Furthermore, with such functions, optionally variables, candidate treatments (T) can be evaluated in a simulated population, even without clinical validation at all, as long as they provide a benefit function at least as a function of risk and variable (X). The latter is particularly valuable in-silico drug discovery, e.g. for estimating biological targets. The invention is also useful for identifying and/or evaluating biomarkers or biomarker combinations, such as disease biomarkers or biomarkers responsive to therapy prophylaxis (e.g., therapeutic benefit (Rc-Rt) prophylactic biomarkers).
Moreover, the present invention allows for an output for a population or individual that is easy to estimate and show the benefit of a treatment. The output may be output via visual charts (e.g., where benefits are shown to the patient) in a manner that allows the user to easily capture potential methods, or in a quantitative manner (e.g., where treatment comparisons are needed for health economics or drug discovery).
In one embodiment, a computer-implemented method is provided that includes calculating, by an outcome processing system, a therapeutic benefit (Rc-Rt) or a therapeutic outcome rate (Rt) for one or more individuals, wherein the calculating includes calculating a benefit of therapy (T) associated with a function that describes a therapeutic benefit (Rc-Rt) for a population, wherein the therapeutic benefit (Rc-Rt) is described as a function of risk without therapy (Rc), preferably wherein the function is a function that describes the therapeutic benefit (Rc-Rt) as a function of the following variables:
(i) a risk in the absence of treatment (T) depending on the first variable (Y), and
(ii) a second variable (X), wherein said second variable (X) is a vector of individual features other than those included in the risk without treatment (Rc), and a first variable (Y) is a vector of individual features included in the risk without treatment (Rc), and wherein said variables (X) and (Y) may be (several) environmentally, phenotypically or genotypically derived variables;
receiving a patient descriptor describing the one or more individuals, wherein each individual is associated with a risk (Rc) and a second variable (X); and
optionally, a therapeutic benefit (Rc-Rt) indicator or a therapeutic outcome rate for the individual is output.
In one embodiment of any of the methods of the invention, including personalized medicine, biomarker identification or estimation methods, drug discovery, portability, and progress monitoring methods, the method may include calculating a therapeutic benefit for each of a plurality of treatments (T), wherein each of the treatments (T) is associated with a function (e.g., a special function, preferably a single function for each treatment) that describes a therapeutic benefit for a population, wherein the therapeutic benefit is described as a function of risk (Rc) and a second variable (X) in the absence of treatment. When the therapeutic benefit for multiple treatments is calculated, the system can be used to compare treatments (e.g., treatment ranking, identify appropriate treatments), or more generally to output or display multiple treatments (e.g., as treatment options; for comparison). This method of integrating multiple treatments is particularly useful for physicians or those involved in drug discovery, drug development, and health economics.
In one embodiment of the method of the invention, the individual(s) are real human patient(s). In one embodiment of the method of the present invention, the individual(s) is/are simulated individual(s).
In one embodiment of the method of the present invention, the step of receiving a patient descriptor comprises generating a simulated individual or a simulated population of individuals.
In one embodiment of the method of the present invention, the individual(s) comprise a plurality of real human patients. In one embodiment of the method of the present invention, the individual comprises a simulated population of individuals. Optionally, the simulated population of individuals is a virtual reality population. Preferably, the method comprises calculating a therapeutic benefit in each individual of the population. Preferably, the output of the method provides a therapeutic benefit in the population.
In one embodiment of the method of the present invention, the therapeutic benefit is calculated using information or data input by the user, generated by the outcome processing system, or received from a data source. In one embodiment, the data source is a medical record system. In one embodiment, the information includes data on clinical treatment usage. In one embodiment, the information includes an output of a pathophysiological treatment model. Optionally, the method further derives from such information said function describing a therapeutic benefit for the population, said therapeutic benefit being described as a function of risk in the absence of treatment. In one embodiment, the information includes a function describing a therapeutic benefit for the population, the therapeutic benefit being described as a function of risk in the absence of treatment and other patient descriptors.
In one embodiment of the method of the present invention, the method further comprises displaying a function of therapeutic benefit (Rc-Rt) to said individual. In one embodiment, the display interface is in the form of a chart.
In one embodiment of the method of the present invention, the method further comprises evaluating whether the treatment is applicable to the patient. In one embodiment of the method of the invention, the method further comprises estimating the effect of the variable on the therapeutic benefit for said individual, e.g. comparing the effect of the variable on the therapeutic benefit or determining the effect on the therapeutic benefit. Optionally, variables that affect the benefit of the treatment are determined as biomarkers, e.g., treatment (T) response prediction biomarkers. In one embodiment of the method of the invention, the method further comprises assessing whether the treatment is applicable to the population of interest. In one embodiment of the method of the invention, the method further comprises comparing the effect of the variable on the therapeutic benefit of the individual; alternatively, the variable is a detectable biological or cellular component, and wherein the component that determines an effect on a therapeutic benefit is considered a biomarker, e.g., a therapeutic (T) response prediction marker. In an embodiment of the method of the invention, the method further comprises the step of monitoring the development, e.g. of a drug. Such an evaluation or comparison step may be performed by a computer-implemented system or a user.
In one embodiment of the method of the present invention, the individual comprises one or more real patients. In one embodiment of the method of the present invention, the one or more individuals comprise a simulated individual or a simulated population.
In one aspect of any of the embodiments herein, the input data comprises treatment data that has been clinically validated or non-clinically evaluated (e.g., in an in vitro assay, biochemical analysis, in vivo assay in a non-human animal).
The disclosed methods are useful for personalized medicine. In one embodiment of the present invention comprising calculating a therapeutic benefit (Rc-Rt) for a patient by a outcome processing system, wherein the calculating comprises:
calculating the benefit of a plurality of treatments (T) for a patient, each of which is associated with a function describing the therapeutic benefit (Rc-Rt) for the population, wherein the therapeutic benefit (Rc-Rt) is described as a function of the risk without treatment (Rc), preferably in terms of a first variable (Y) and a second variable (X), wherein the function is a function describing the therapeutic benefit (Rc-Rt) described as a function of the risk without treatment (Rc), wherein the second variable (X) is a vector of individual features other than those included in the risk without treatment (Rc), and wherein the variables (X) and (Y) can be environmental, phenotypic or genotypic variables(s);
receiving patient descriptors for the variables (X) and (Y) for a patient; and
outputting a therapeutic benefit (Rc-Rt) indicator for the treatment T to the patient.
In one embodiment, the step of receiving the patient descriptor comprises receiving information input by a user, for example, via an input device or input interface.
Optionally, outputting a therapeutic benefit indicator comprises displaying whether the treatment is appropriate for the patient. Optionally, the output comprises, for example, displaying one of a plurality of treatments, or displaying a plurality of treatments appropriate for the patient, optionally ranked according to their expected benefit to the patient. Optionally, the output may further comprise graphically displaying expected benefits of the treatment for a plurality of individuals and indicating how the benefit for the patient compares with the benefit for the population; alternatively, the chart form is a scatter plot with axis Rt and axis Rc in the chart; alternatively, the chart form is a scatter plot with axis Rc-Rt and axis Rc in the chart.
In one aspect of any embodiment herein, the input data comprises simulated treatment data. In one aspect of any of the embodiments herein, the input data comprises treatment data that has been clinically validated or non-clinically evaluated (e.g., in an in vitro assay, biochemical analysis, in vivo assay in a non-human animal).
In one aspect of any of the embodiments herein, the therapeutic benefit is calculated using information input, generated, or received from clinical therapeutic use and (ii) information obtained from said data describing a function of therapeutic benefit for the population, wherein the therapeutic benefit is described as a function of risk in the absence of treatment T.
In one aspect of any of the embodiments herein, the therapeutic benefit is calculated using information received from the pathophysiological model and the therapy T model, e.g., a formal therapy model. Patient descriptors and/or functions describing therapeutic benefit for a population can be derived from such information, where the therapeutic benefit is described as a function of risk in the absence of treatment T. The therapeutic benefit is calculated using information or data input by the user, generated by the outcome processing system, or received from a data source.
The present invention also discloses specific processes useful in biomarker discovery and estimation, and provides methods comprising:
(a) a computer-implemented method of execution, the method comprising:
calculating a therapeutic benefit (Rc-Rt) for an individual or population by a result processing system, wherein said calculating comprises calculating a therapeutic benefit (T) associated with a function describing a therapeutic benefit (Rc-Rt) for a population as a function of risk (Rc) in the absence of treatment, preferably wherein said function describes a therapeutic benefit (Rc-Rt) as a function of the following variables:
(i) risk without treatment (Rc) depending on the first variable (Y), and
(ii) a second variable (X), wherein said second variable (X) is a vector of individual features other than those included in the risk without treatment (Rc), and a first variable (Y) is a vector of individual features included in the risk without treatment (Rc), and wherein said variables (X) and (Y) may be (several) environmentally, phenotypically or genotypically derived variables;
receiving a patient descriptor describing the one or more individuals, wherein each individual is associated with a risk (Rc) and a second variable (X); and
optionally, outputting a therapeutic benefit (Rc-Rt) indicator for the individual;
(b) estimating the effect of the variable on the therapeutic benefit (Rc-Rt) for the individual or population.
Preferably, a population of different patient descriptors is received or generated, wherein combinations of all patient descriptors and/or their respective values are presented, and the step of estimating the effect of the variables on the therapeutic benefit (Rc-Rt) comprises determining which parameters (e.g., patient descriptors and/or their respective values) are associated with increased therapeutic benefit.
Optionally, a variable affecting therapeutic benefit for the population is determined as a biomarker. In one aspect, the step (b) of estimating variables is performed by a user. In one aspect, (b) is performed by a computer (e.g., an outcome processing system), and the method further comprises outputting one or more identifiers for the biomarkers, and optionally, further outputting a therapeutic benefit (Rc-Rt) indicator associated with such biomarkers.
In one aspect, the step of receiving a descriptor describing one or more individual patients includes receiving at least one of the patient descriptors from a pathophysiological model. Preferably, the patient descriptors received from the pathophysiological model are represented by components or interrelationships between the pathophysiological model components. In one embodiment, one or more patient descriptors for a second variable (X) are received from a pathophysiological model. In one embodiment, one or more, preferably all, patient descriptors for the second variable (X) and risk (Rc) are received from the pathophysiological model.
In one embodiment, the variable affecting the therapeutic benefit is a second variable X, and the biomarker is determined to be a therapeutic (T) response prevention biomarker. In one embodiment, the variable affecting the therapeutic benefit is the second variable Y, and the biomarker is determined to be absent (independent of treatment (T)) from the treatment (T) disease prevention biomarker. For example, a biomarker may be an indication of disease status, progression, severity, and the like.
Optionally, the method comprises performing an in vitro test to estimate biomarkers for a patient, e.g. an actual person. For example, a biomarker may be determined as the presence or level of a particular cellular or biological component (e.g., the presence of a genetic polymorphism or allele), and an in vitro test designed to detect such a component (e.g., in a biological sample of an individual) is performed.
The invention also discloses specific processes useful in biological target discovery and more general drug discovery, such as drug discovery. In one such embodiment, the treatment (T) is a simulated treatment or a developed treatment. In one embodiment, a computer-implemented method is provided comprising:
calculating, by the outcome processing system, a therapeutic benefit (Rc-Rt) for the simulated population, wherein the calculating comprises calculating a therapeutic (T) benefit associated with (i) and (2), wherein (i) a change in the component or pathophysiological model's interrelationship, (2) describes a function of the therapeutic benefit (Rc-Rt) for the population, wherein the therapeutic benefit (Rc-Rt) is described as a function of risk (Rc) without treatment, preferably, dependent on a first variable (Y) and a second variable (X), wherein the Rc function is a function describing the therapeutic benefit (Rc-Rt) and the therapeutic benefit (Rc-Rt) is described as a function of risk (Rc) without treatment, wherein the second variable (X) is a vector of individual features other than those included in the risk (Rc) without treatment, and wherein the variables (X) and (Y) may be environmental, phenotypic or genotypic derived variable(s);
receiving a patient descriptor for a simulated population, wherein each individual in the population is associated with a risk (Rc) and a second variable (X); and
outputting an indicator of therapeutic benefit (Rc-Rt) in the simulated population.
In one embodiment, the step of receiving patient descriptors includes generating simulated individuals or simulated populations. Optionally, the simulated population is a virtual reality population.
In one embodiment, the method further comprises receiving information specifying interrelationships between the components or pathophysiological model components, the changes in the components or component interrelationships being used to define the treatment (T). Information may be received from, for example, a user via an input device.
In one embodiment, a function describing a therapeutic benefit (Rc-Rt) for a population is obtained by (a) and (b), wherein the therapeutic benefit (Rc-Rt) is described as a function of risk without treatment (Rc), wherein (a) runs a pathophysiological model defining a treatment (T) that includes components or changes in interrelationships between pathophysiological model components, wherein the pathophysiological model generates a likelihood of an event of interest; and (b) obtaining the function from the event likelihood of interest.
In one embodiment, the function describing therapeutic benefit (Rc-Rt) for a population is obtained by (a) and (b), wherein therapeutic benefit (Rc-Rt) is described as a function of risk without treatment (Rc), wherein (a) a formal treatment model is run that simulates treatment (T) associated with one or more treatment descriptors, wherein the formal treatment model generates a likelihood of an event of interest; and (b) obtaining the function from the event likelihood of interest.
In one embodiment, further comprising receiving clinical data and using the data to modify the formal treatment model; and optionally, repeating said steps (a) and (b) with the modified formal treatment model.
In any of the embodiments herein, the method may advantageously comprise providing a plurality of treatments (T), wherein each treatment T within said plurality of treatments (T) is associated with a benefit function. Thus, optionally, the method may further comprise (i) inputting, generating or receiving treatment information for each of the plurality of treatments T, and optionally storing the treatment information (e.g., from a clinical trial, from a pathophysiological model), and (ii) obtaining a function from the information describing a therapeutic benefit for the population, wherein the therapeutic benefit is described as a function of risk in the absence of treatment.
In any of the embodiments herein, the therapeutic benefit (Rc-Rt) can be expressed as a therapeutic benefit (Rt), as is the therapeutic benefit (Rt) derived from the treatment outcome rate.
In another embodiment, the invention provides a memory for storing application access data for execution by an outcome processing system, comprising a data structure stored in the memory, the data structure comprising information for use by the application, wherein the data structure is configured to include a plurality of data objects, each data object corresponding to one of a plurality of treatments (T), and wherein each treatment (T) is associated with (e.g., linked to) a function describing a therapeutic benefit for a population, wherein the therapeutic benefit is described as a function of risk without treatment, preferably dependent on a first variable (Y) and a second variable (X), wherein the function is a function describing a therapeutic benefit (Rc-Rt) described as a function of risk without treatment (Rc), wherein the second variable (X) is a vector of individual characteristics other than those included in the risk without treatment (Rc), and the first variable (Y) is a vector of individual characteristics included in the risk without treatment (Rc), and wherein the variables (X) and (Y) may be environmental, phenotypic or genotypic derived variable(s).
In another embodiment, the invention provides a memory for storing application access data for execution by an outcome processing system, comprising a data structure stored in the memory, the data structure including information for use by the application, wherein the data structure is configured to include a plurality of data objects, each data object corresponding to one of a plurality of treatments (T), and wherein each treatment (T) is associated with a therapeutic benefit (Rc-Rt) in a particular population, wherein the therapeutic benefit (Rc-Rt) is calculated using a function describing the therapeutic benefit for the population, the therapeutic benefit being described as a function of risk in the absence of treatment, preferably in dependence on a first variable (Y) and a second variable (X), wherein the function is a function describing the therapeutic benefit (Rc-Rt), the therapeutic benefit (Rc-Rt) is described as a function of risk without treatment (Rc), wherein the second variable (X) is a vector of individual features other than those included in risk without treatment (Rc), and the first variable (Y) is a vector of individual features included in risk without treatment (Rc), and wherein the variables (X) and (Y) may be environment-, phenotype-or genotype-derived variable(s). Optionally, each treatment (T) is further associated with the specific population.
In one embodiment, such a data structure is useful for providing therapy information to a user. In one aspect, the invention provides a computer-implemented method comprising receiving a query (e.g., from a user via an input device or input interface), identifying one or more treatments (T) that satisfy the query, accessing a memory for storing data of the invention, and outputting a benefit (Rc-Rt) indicator for the treatment (T), e.g., for an individual or a population. The query may be any information used by the system of the present invention to identify one or more treatments; the query may include, for example, a selection or specification of one or more treatments (T), a selection and specification combination of a set of treatments (T) according to any desired characteristic (e.g., disease), or a selection or specification of a desired medical outcome.
When providing input data to any embodiment herein or to any single step within any embodiment herein, the step of providing input data may comprise any suitable method, including for example receiving input data, inputting input data using an input device or interface, storing input data, and/or retrieving input data from a memory for storing data. Likewise, the output data may include any suitable method including, for example, storage, communication, display, and the like.
The present invention also provides an apparatus for predicting one or more therapeutic benefits, the apparatus comprising a computer for executing computer instructions, wherein the computer comprises computer instructions for performing any of the methods described herein.
The present invention also provides a computer readable medium storing a computer program for predicting one or more therapeutic benefits, wherein the computer program comprises instructions for performing any of the methods described herein.
Drawings
FIG. 1 is a schematic diagram showing a multifunction system of the present invention.
Fig. 2 is a schematic diagram showing different processes of the present invention that can be performed by a multifunction system.
Fig. 3 is an acute stroke pathophysiological model that outputs the likelihood of an event of interest.
FIG. 4 is an acute stroke pathophysiological model that outputs the likelihood of an event of interest; this model can be incorporated into a more complete model of acute stroke incorporating other processes, such as cell death.
Figure 5 is a pharmacological model in a formal treatment model. The input is a treatment at dose D that provides the body with an amount of CuD at time t. The PK model converts it to blood concentration (c (t)) by several consecutive steps. The blood concentration is then switched during the change of the physiological parameter io (t). If io (t) is supportive of disease treatment efficacy, it is cited as z. This variable affects the disease process represented in the pathophysiological model. Io (t) or similar parameters affected by treatment are inputs to the side effect model. Io (t) is a biomarker of treatment efficacy.
Figure 6 is a stepwise formal treatment model that includes a pharmacologic model output to a pathophysiological model. Based on our understanding of pharmacology and physiology, each step is modeled by one or several equations.
FIG. 7 is a process for conducting a transplantable study or a biomarker evaluation study.
FIG. 8 is a process for conducting a transplantable study or a biomarker evaluation study.
FIG. 8bis is a process for performing portability and/or biomarker studies across multiple populations.
FIG. 9 is a process of evaluating a biological target.
FIG. 10 shows the results of an acute stroke pathophysiological model; the change in the model was the blockage of sodium channels, and the output of the model was the effect on edema over time in minutes (expressed as the rADCw value).
Figure 11 shows the results of a pathophysiological model of acute stroke, in which the course of ischemia is regulated by altering sodium channels (NaP).
Figure 12 shows the sodium channel blocking effect in humans and mice, which provides a possible explanation for drugs that are effective in mice but not in humans.
Fig. 13 illustrates a method of monitoring drug development.
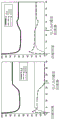
Figure 14 shows the prediction of angina pectoris episodes followed by the use of a formal treatment model to hypothesize the outcome of cardiotonic treatment; the lines show the prediction as a function of dose, while the bands show the results from the clinical trial from which the drug data was obtained.
Fig. 15 is a graphical display illustrating the therapeutic benefit determined by the effect model of the cardiotonic applied to the virtual reality population.
Figures 16, 17 and 18 illustrate a method of predicting a therapeutic benefit for a patient.
FIG. 19 illustrates an exemplary display of the present invention; a scatter plot depicted with axis Rt and axis Rc shows the therapeutic benefit with ivabradine (ivrabadine) where plaque rupture is an event of interest.
Fig. 20 illustrates a hardware embodiment.
Detailed Description
Definition of
"treatment," as used herein, refers to any intervention (e.g., surgery, medication, etc.) that may alter the disease process, whether detectable or undetectable, with the goal of treating, curing, or preventing the disease, by altering the functioning of the living system, including the alleviation or amelioration of one or more symptoms, diminishment of disease extent, stabilization (i.e., not worsening) of the disease state, preventing the spread of the disease, delay or slowing of disease progression, amelioration or palliation of the disease state, and remission (whether local or global).
"transplantable study," as used herein, refers to the transplantable assessment of treatment efficacy and/or tolerance. Portability refers to the operation of: by this procedure, a prediction of treatment efficacy and/or tolerance is inferred from data obtained in a first population(s) or individual(s) different from a second population or individual of interest to the second population or individual.
The term "biological target", as used herein, refers to a biological component, the alteration of which has the potential to alter the function of a biological system of interest. Non-limiting examples of biological targets include molecules such as DNA, RNA, proteins, glycoproteins, lipoproteins, carbohydrates, fatty acids, enzymes; hormones and chemically reactive molecules (e.g., H +, superoxide, ATP, and citric acid); ions; a glycoprotein; macromolecules and molecular complexes; cells and parts of cells, such as subcellular organs (e.g., mitochondria, nuclei, golgi complexes, lysosomes, endoplasmic reticulum, and ribosomes); and combinations of the foregoing.
The term "objective assessment", as used herein, refers to the assessment of the effect on the pathophysiological model output(s) of biological objective changes.
The term "change", as used herein with respect to a pathophysiological model, refers to a modification of a parameter or component in a biological system model designed to represent real-life changes in the environment and/or subject therapy. Exemplary alterations include the presence of existing or hypothetical drugs that modulate (e.g., activate or inhibit) the function of a cell or biological component (e.g., a biological target), as well as treatment sessions, time lapse only (e.g., aging), exposure to environmental toxins, increased exercise, and the like.
As used herein, the term "patient" refers to a real or simulated individual, preferably a human. The term "simulated individuals" refers to representations of real individuals in the systems, codes, devices and methods of the present invention.
As used herein, the term "treatment descriptor" refers to any information useful for describing a treatment parameter. Examples include drug dose, drug administration frequency, prescription of drug, combination therapy dose, drug administration frequency, drug administration duration, metabolite, drug half-life, renal drug metabolism, metabolic pathway or metabolic enzyme, subject dietary habits, subject exercise regimen, any recommended value other than the usage value (e.g., recommended by health administration), and the like. Certain treatment descriptors may also be patient descriptors of their individual-dependent extent, e.g., drug half-life. The therapy descriptor may alternatively be a pure therapy descriptor, such as a medication intake dose.
As used herein, the term "patient descriptor" refers to any information useful for describing a patient's characteristics. Examples include variable(s) (Y) related to the occurrence of the outcome (event) of interest integrated into the risk without treatment (Rc), which are referred to as "risk factors", and variable(s) (X) related to the intensity of benefit not integrated into the Rc. A biomarker is an example of a patient descriptor. The term "cellular component" refers to a biological cell or a portion thereof. Non-limiting examples of cellular components include molecules such as DNA, RNA, proteins, lipoproteins, carbohydrates, fatty acids, enzymes; hormones, chemically reactive molecules (e.g., H +, superoxide, ATP (adenosine triphosphate), and citric acid); ions; a glycoprotein; macromolecules and molecular complexes; cells and parts of cells, such as subcellular organs (e.g., mitochondria, nuclei, Golgi complex, lysosomes, endoplasmic reticulum, and ribosomes); and combinations of the foregoing.
The term "biological component" refers to a portion of a biological system. A biological system may comprise, for example, a single cell, a collection of cells in vivo or a collection of cells in vitro, such as a cell culture, an organ, a tissue, a multicellular organism, e.g., a single human patient, a subset of cells of a multicellular organism, or a population of multicellular organisms, e.g., a group of patients or an overall human population as a whole. The biological system may also include, for example, multiple tissue systems, such as the nervous system, the immune system, or the cardiovascular system. Biological components that are part of a biological system can include, for example, extracellular components, cellular components, intracellular components, or combinations thereof. Examples of biological components include DNA; RNA; proteins, lipoproteins, carbohydrates, fatty acids, enzymes; hormones, small organic molecules, macromolecules and molecular complexes, cells; an organ; tissue; parts of cells, tissues or organs; subcellular organelles such as mitochondria, nuclei, golgi complexes, lysosomes, endoplasmic reticulum, and ribosomes; chemically reactive molecules such as H +; superoxide; ATP; citric acid; a protein albumin; ions, and combinations thereof.
The term "function" with respect to a biological component refers to the interaction of the biological component with one or more additional biological components. According to certain biological mechanisms, each biological component of a biological system may interact with one or more additional biological components of the biological system. The biological mechanisms by which biological components interact with each other may be known or unknown. Biological mechanisms may include, for example, synthesis, regulation, homeostasis, or control networks of biological systems. For example, the interaction of one biological component with another may include, for example, the conversion of one biological component into another (e.g., by synthesis or degradation), the direct physical interaction of the biological components, the indirect interaction of the biological components mediated by an intermediate biological event, or some other mechanism or any integrated network ((genetic network(s), (mRNA network(s), (gene regulatory network (s)), or (protein network (s)). In some cases, the interaction of one biological component with another biological component may include, for example, a regulatory adjustment of the one biological component by the other biological component, such as a productivity, an inhibition or stimulation of a level, or a determination of an activity of the one biological component by the other biological component.
The term "biological process" refers to an interaction or set of interactions between biological components of a biological system. In some cases, a biological process may refer to a collection of biological components extracted from a certain aspect of a biological system and a network of interactions between the biological components. Biological processes may include, for example, biochemical or molecular pathways/pathways and networked biological components ((genetic network(s), (mRNA network(s), (gene regulatory network (s)), and (protein network (s)). Biological processes may also include, for example, pathways that occur within or come into contact with the environment of a cell, organ, tissue, or multicellular organism. Examples of biological processes include biochemical pathways in which molecules are broken down to provide cellular energy, biochemical pathways in which molecules combine to provide cellular structure or energy storage, pathways in which proteins or nucleic acids are synthesized, activated, or disrupted, and biochemical pathways in which protein or nucleic acid precursors are synthesized or disrupted. Biological components of such biochemical pathways include, for example, enzymes, synthetic intermediates, media precursors, and intermediate species.
The term "drug" refers to a compound of any complexity that is capable of affecting a biological state, whether by known or unknown biological mechanisms and whether used therapeutically or not. In some cases, a drug exerts its effect by interacting with a biological component, which may be referred to as the therapeutic target of the drug. Drugs that mimic the function of the therapeutic target may be referred to as "activation drugs" or "agonists", while drugs that inhibit the function of the therapeutic target may be referred to as "inhibitory drugs" or "antagonists". The effect of the drug may be, for example, a drug-mediated change in the rate of metastasis or rate of degradation of one or more species of RNA, a drug-mediated change in the rate or range of graft treatment or post-graft treatment or range of post-graft treatment of one or more polypeptides, a drug-mediated change in the rate or range of degradation of one or more proteins, a drug-mediated inhibition or stimulation of drug-mediated activity or activity of one or more proteins, and the like. Examples of drugs include typical, protein-based, nucleic acid-based, or synthetic chemicals (e.g., small molecules) of interest for research or treatment or prevention; naturally occurring factors, such as endocrine, paracrine, autocrine factors or factors that interact with any type of cellular receptor; intracellular factors such as intracellular signaling pathway elements; factors isolated from other natural sources, such as plant-derived chemicals. Drugs may also include, for example, agents used in gene therapy like DNA and RNA. Furthermore, antibodies, viruses, bacteria, and bioactive agents produced by bacteria and viruses (e.g., toxins, antigenic agents useful as vaccines) can be considered drugs. For certain applications, a drug may include a composition comprising a set of drugs or a composition comprising a set of drugs and a set of excipients. The term "medical product" refers to any system, tool or composition having the ability to act on the body or the like or to affect a biological state like a drug; the pharmaceutical product may act by any activity means, including chemical, biochemical or physical (e.g., X-ray, positron). Medical products, like drugs, are treatments.
The term "biological state" refers to a state associated with a biological system. In some cases, a biological state refers to a state associated with the occurrence of a set of biological processes of a biological system. According to certain biological mechanisms, each biological process of a biological system is capable of interacting with one or more additional biological processes of the biological system. Biological states often also change as biological processes change relative to each other. Biological states generally depend on various biological mechanisms by which biological processes interact with each other. The biological state may include, for example, a state of substance concentration, nutrient or hormone concentration, in cellular tissue, in plasma, interstitial fluid, intracellular fluid or cerebrospinal fluid, such as any biomarker. For example, a biological state associated with edema is associated with water flow into the neuron and/or an apparent diffusion coefficient through water (biomarker rADCw); the biological states associated with hypoglycemia and insufficient blood insulin are characterized by states of hypoglycemia and hypoinsulinemia, respectively. These conditions may be applied experimentally or may be inherently present in a particular biological system. As another example, the biological state of a neuron may include, for example, a state in which the neuron is at rest, a state in which the neuron is initiating a possible action, a state in which the neuron is releasing neurotransmitters, or a combination thereof. As a further example, the biological state of the plasma nutrient set may include a state in which a person is awake from overnight, a state just after a meal, a state between meals. As another example, the biological state of rheumatoid arthritis may include significant cartilage degradation and inflammatory cell proliferation.
Biological states may include "disease states," which refers to abnormal or harmful states associated with a biological system. Disease states are often associated with abnormal or deleterious effects of disease in biological systems. In some cases, a disease state refers to a state associated with the occurrence of a set of biological processes of a biological system, wherein the set of biological processes plays a role in the abnormal or deleterious effects of a disease in the biological system. The disease state can be observed, for example, in a cell, organ, tissue, multicellular organism, or population of multicellular organisms. Examples of disease states include asthma, diabetes, obesity, infectious diseases (e.g., viral, bacterial infections), cancer, stroke, cardiovascular diseases (e.g., arteriosclerosis, coronary artery disease, valvular heart disease, arrhythmia, heart failure, hypertension, orthostatic hypotension, shock, endocarditis, aortic and its branch diseases, peripheral vascular system disorders, and congenital heart diseases), and inflammatory or autoimmune diseases (e.g., rheumatoid arthritis, multiple sclerosis).
The term "biomarker" refers to any detectable characteristic (e.g., physical characteristic) or molecule, other chemical species (e.g., ion), or particle that is an indicator or predictor of a biological state (e.g., disease) or disease susceptibility or has a particular biological state, or that is a therapeutic efficacy or safety indicator or predictor. Exemplary biomarkers include proteins (e.g., antigens or antibodies), carbohydrates, cells, viruses, nucleic acids (e.g., nucleotides present at polymorphic sites), and small organic molecules or more generally any biological or cellular component. The biomarker may be a biomarker complex. Exemplary biomarkers include patient descriptors (e.g., variables X and/or Y) that can be detected or measured, or signals that can be obtained from patient descriptors detected or measured in vivo or in vitro. Exemplary biomarkers can also include any disease parameter that can be measured in vivo or in vitro, or a signal that can be obtained from a disease parameter measured in vivo or in vitro; such biomarkers are often indicative of a disease state or disease progression.
The term "responder" refers to a patient who experiences a therapeutic benefit above a given threshold (including between two thresholds). The threshold may be defined according to any suitable means or criteria.
As used herein, an "effect model" refers to a mathematical function that describes a therapeutic benefit for a population of individuals as a function of risk in the absence of treatment and one or more other characteristics of the individual (e.g., a patient descriptor). The effect model may take the form of a function that describes the therapeutic benefit (Rc-Rt) or the probability of therapeutic outcome (Rt) as a function of (i) the risk without treatment (Rc) dependent on a variable (Y) and (ii) a variable (X), wherein the variable (X) is a vector of individual characteristics other than those contained in the risk without treatment (Rc), and wherein the variables (X) and (Y) may be environmental, phenotypic (phenotypic) or genotypic derived variables.
As used herein, a "formal treatment model" refers to a model that includes a pharmacological model operably linked to a pathophysiological model that integrates an event of interest as an output and optionally a side effect model (e.g., toxicology) that integrates side effects and toxic effects as an output.
As used herein, the term "mechanical model" refers to a computational model, such as a model having a set of differential equations, that describes the characteristics or behavior of a system, such as a biological system. The mechanical model may be a causal model, which typically links two or more causal related variables in a mathematical relationship, wherein the mathematical relationship reflects the underlying mechanism(s), e.g. biological mechanisms, that affect these variables.
As used herein, the term "pathophysiological model" refers to a model that includes one or more processes (e.g., biological processes) to represent healthy homeostasis dynamics and homeostasis changes, e.g., to represent a disease, to represent a biological state, or a disease state.
1.0 overview-Components and Steps
The components and steps of an exemplary system of the present invention are described in this section. As will be illustrated in section 2.0 (functional overview), the systems and methods according to the present invention need not include all of the components and steps described in section 1.0. Depending on the particular application desired, different components may be assembled to produce a system that achieves a particular goal. A different example of such a system uses the subset of components provided in section 2.0.
Fig. 1 provides an overview of systems and methods that can implement all of the processes described herein, including methods for target and/or drug discovery, monitoring progress, transplantable studies, biomarker discovery, and personalized medicine. Components are indicated within the dashed line generally depicting the core multifunction system; the system includes a pathophysiological model (network, block 101), a pharmacological model (PK/PD, block 102), a simulated population of individuals (SPI, block 103), an effects model (EM, block 104), calculations of benefit to the population of individuals (NEc, NEA, NEAt, and BAtp in blocks 105 to 108, respectively). It should be understood that not all components are necessary depending on the process to be performed. Shown outside the core system are optional components: databases (knowledge database (block 109), progress database (block 110), clinical database (block 111), and patient descriptor database (block 112)), descending procedures (goal selection (block 113), ligand selection (block 114)), monitoring progress (block 115), portability studies (block 116), and personalized medicine (block 117)). It should be understood that these optional components may be included within the core system individually or together, but are not required. An overview of the different processes of the present invention is shown in fig. 2.
The method of the present invention minimally includes (a) providing a treatment associated with an effect model, (b) providing an input to an individual or group of individuals, (c) calculating a treatment benefit, and (d) outputting an indicator of the treatment benefit.
In one aspect, the system and method includes:
(a) providing one or more real or simulated treatments (T), wherein each treatment (T) is associated with an effect model function, e.g. by receiving the function and a treatment identifier as input or in a step of deriving the function from input information about the treatment, preferably wherein the function describes a therapeutic benefit (Rc-Rt) or a treatment outcome rate (Rt) as a function of a variable (Y) and a risk without treatment (Rc) of the variable (X), wherein the variable (X) is a vector of individual features other than those included in the risk without treatment (Rc), and wherein the variables (X) and (Y) may be environment-, phenotype-or genotype-derived variable(s);
(b) providing a patient descriptor for one or more individuals (e.g., real patient, simulated population of individuals), wherein each individual is associated with a risk (Rc) and a variable (X);
(c) calculating a therapeutic benefit (as a function of Rc-Rt) for one or more of said treatments (T) of said individual(s); and
(d) an output, preferably showing to the user an indicator of the therapeutic benefit (as a function of Rc-Rt) of the individual(s).
Such a system may be used as a system without additional components, such as described herein for certain personalized medical applications. In a personalized medical application, patient information is received, therapeutic benefits are calculated, and indicators of therapeutic benefits are output. In some transaction marker identification or assessment methods, the effect of patient descriptors on the therapeutic benefit is assessed, where descriptors that affect the therapeutic benefit are identified as biomarkers (e.g., biomarkers of therapeutic efficacy). The systems and methods may include additional components or steps, depending on the use case. When the system is used in target evaluation processes (e.g., in drug screening, biological target evaluation), monitoring progress, transplantable studies, and certain personalized medical applications, the system will include inputs for modeling a population of individuals, each of which is associated with a risk (Rc) and a variable (X).
When the system is used in target evaluation processes, monitoring progress, certain transplantable studies, and certain personalized medical applications, the system will include a pathophysiological model. Moreover, in drug screening applications for targeted evaluation processes, the system will include a formal treatment model in monitoring progress and certain transplantable studies. When the system is used in a method of identifying or evaluating biomarkers, the system will include a pathophysiological model, optionally further including a simulated population of individuals constructed with a distribution of all model parameters or variables.
In one embodiment, in the method and system, an effect model associated with the therapy may be input, generated, or received, and optionally stored (e.g., by accessing a database of therapies associated with the effect model). In another embodiment, the effect model associated with the treatment is derived by a method of the system in steps that include (i) inputting, generating, or receiving, and optionally storing, information for the treatment T, and (ii) deriving the effect model for the treatment from the information.
The various elements of the system and method are described below.
1.1 therapy input and benefit function
Treatment (T) may be any suitable treatment. The treatment may be a real treatment or a simulated treatment. Examples of simulated therapies are one or more biological components (e.g., a change in a biological process, a change in a biological target, such as inhibition or stimulation) or a change in a biological system. True therapy typically includes therapy (e.g., treatment methods, drugs) for which information is available from its clinical and/or non-clinical use.
In the methods and systems of the present invention, each treatment will be associated with a benefit function (the term "benefit function" is also referred to herein as an "effect model"), which describes the therapeutic benefit for a population as a function of risk and patient characteristics (X) in the absence of treatment. The Effects Model (EM) is shown in blocks 104a to 104d of fig. 2. A suitable effect model is a function describing the therapeutic benefit (Rc-Rt) as a function of the risk without treatment (Rc) depending on one or more variables (Y) and a variable (X), wherein variable (X) is a vector of individual features other than those included in the risk without treatment (Rc), and wherein the variables (X) and (Y) may be environment-, phenotype-or genotype-derived variable(s). The input for the treatment into the present methods and systems may include a treatment descriptor including treatment information and/or an effect model for the treatment. It should be understood that an effect model may be acquired/derived by the methods and systems of the present invention based on input information for the treatment. As a result, in addition to the therapy identifier typically included, the input for the therapy may include information about the therapy without an associated effect model (e.g., from a fluent use of the outcome), such that an effect model is subsequently generated by the method or system of the invention and associated with the therapy. Methods for obtaining an effects model from different types of information are further described herein. In another embodiment, the input for treatment may include an effect model previously obtained from treatment information; in this embodiment of the method and system of the present invention, no further effect model for the treatment needs to be obtained.
The information about the treatment may include data and/or a treatment descriptor. For example, information such as data may include any experimental results, such as information from in vitro analysis (e.g., functional analysis, microarray data, etc.) or in vivo analysis, including but not limited to the effect of a treatment on the function of a biological component or cellular component or biological system, its therapeutic target, pharmacological information, etc. The information may also include any information from clinical use, including but not limited to clinical trials or use in clinical practice, for example as is the case for marketed treatments. Thus, in any embodiment, the method may optionally further comprise the step of obtaining experimental results for the treatment and optionally storing said results. This experimental data is then integrated as input to the method and system of the present invention. In many cases, the inclusion of information about treatment can be obtained from scientific publications by using search tools that allow for a large number of scientific journals or Abstracts, such as MedLine (Online medical literature analysis and retrieval System), Chemical Abstracts (Chemical Abstracts), Biosis reviews (biological Abstracts), etc., such as computer searches in Science (Science), Nature (Nature), Proceedings of the national academy of Sciences (Proc. Natl. Acad. Sci. USA), and any search engine that "reads" and analyzes publications to extract data. The information sources also include any public databases, private databases, and proprietary data such as confidential data developed in and limited to a particular laboratory. The information for treatment may alternatively or additionally include an output from a pathophysiological model or a formal treatment model. Thus, in any embodiment, the method may optionally further comprise the step of modeling or modeling the treatment as a pathophysiological model or a formal treatment model (i.e. running the model), and optionally storing the results.
Where information from clinical use, from a pathophysiological model, or a formal treatment model is included, the information typically includes patient descriptors for one or more patients treated with a treatment regimen and results (e.g., medical results, occurrence of events of interest) for the individual(s). In case the information comes from clinical use, the patient is preferably a real patient. In case the information is an output from a pathophysiological model or a formal treatment model, the patient may be simulated, preferably as a disease model.
Simulating a treatment typically includes the available information being treatment from simulation only or from simulation primarily, where the available information is free of data from, for example, experimental or clinical trials. The simulated treatment may be represented as a change in the biological target of interest; the change may indicate a therapeutic goal of the simulated therapy or an indirect effect caused by the simulated therapy. The steps of altering biological targets are discussed under the component "pathophysiological model". The pathophysiological model generates treatment information that can be used to obtain an effect model of the treatment.
The patient descriptor will preferably include: (a) variable(s) (Y) associated with the occurrence of an outcome (event) of interest integrated in the risk without treatment (Rc), referred to as "risk factor", and/or (b) variable(s) (X) associated with the intensity of benefit not integrated in the Rc.
The variable(s) (X) related to the intensity of benefit optionally interact with a treatment descriptor (e.g., body weight, which adjusts the volume of distribution of the drug). Examples of variable(s) (X) associated with intensity of benefit include body mass index (body mass index), enzyme activity, blood pressure, one or a set of genetic alleles, any level of biological component after rest and/or stimulation (e.g., after meals, medication or other adjustments, etc.) or any habit or environmental component. Examples of variable(s) (Y) associated with the occurrence of a result include total blood cholesterol, blood pressure, age, gender, habit or environmental component such as smoking or past smoking, physical exercise, etc.
In one embodiment, the patient descriptor is a biomarker. In such embodiments, the biomarker may be a patient descriptor (e.g., X and/or Y) that can be detected or measured, or a signal obtained from a patient descriptor that can be detected or measured in vivo or in vitro. Such biomarkers may be predictors of the magnitude of benefit given by the treatment when derived from X and Y, or predictors of the disease (e.g., disease state, progression, severity, etc.) when derived from Y alone. In one example, the patient descriptor is a biomarker identified according to the method of section 1.1.1 (identification of new biomarkers for disease).
It should be understood that the methods and systems of the present invention can be used to model any medical product, and more generally any treatment. Examples of agents that can embody therapy include, for example, 5 alpha reductase inhibitors, 5 aminosalicylic acids, 5HT3 receptor antagonists, adamantane antiviral agents, adrenocorticosteroids, adrenocortical hormone inhibitors, adrenergic bronchodilators, hypertensive emergency agents, pulmonary hypertension agents, aldosterone receptor antagonists, alkylating agents, alpha-adrenoceptor antagonists, alpha-glucosidase inhibitors, alternative drugs, anti-amoebics, aminoglycosides, aminopenicillin, aminosalicylates, amylin analogs, analgesic combinations, analgesics, androgens and anabolic steroids, angiotensin converting enzyme inhibitors, angiotensin II inhibitors, anal preparations, anorectic drugs, antacids, anthelmintics, anti-angiogenic ophthalmic agents, monoclonal antibodies, anti-infective drugs, an anti-adrenergic agent, a centrally-acting, an anti-adrenergic agent, a peripherally-acting, an anti-androgen, an anti-angina agent, an anti-arrhythmic agent, an anti-asthmatic combination, an antibiotic/antineoplastic agent, an anti-cholinergic antiemetic agent, an anti-cholinergic anti-Parkinson's disease agent, an anti-cholinergic bronchodilator, an anti-cholinergic chronotropic agent, an anti-cholinergic/anti-spastic agent, an anti-diarrheal agent, an antidote, an antiemetic anti-dazzling agent, an antifungal agent, an anti-gonadotropic agent, an anti-gout agent, an antihistamine, a hypolipidemic agent, an anti-hypertensive agent combination, an anti-hyperuricemia agent, an anti-malarial drug combination, an anti-malarial quinoline, an antimetabolite, an anti-migraine agent, an anti-neoplastic antidote, an anti-neoplastic interferon, an anti-neoplastic monoclonal antibody, an antineoplastic agent, antiplatelet agents, anti-pseudomonas penicillins, anti-psoriasis agents, anti-psychotic agents, antirheumatic agents, preservatives and bactericides, antithyroid agents, antitoxin and antitoxic sera, antitubercular agents, antitubercular combinations, antitussives, antiviral agents, antiviral agent combinations, antiviral interferons, anxiolytic agents, sedatives, and hypnotics, aromatase inhibitors, atypical antipsychotics, azole antifungal agents, bacterial vaccines, barbiturate anticonvulsants, barbituric acid, BCR-ABL tyrosine kinase inhibitors, benzodiazepine anticonvulsants, benzodiazepine agents, beta-adrenoceptor blockers, beta-lactamase inhibitors, bile acid sequestrants, biologicals, bisphosphonates, bone resorption inhibitors, bronchodilator combinations, bronchodilators, calcitonin, calcium channel blockers, carbamate anticonvulsants, carbapenems, carbonic anhydrase inhibitor anticonvulsants, carbonic anhydrase inhibitors, cardiac tonics, cardiac selective beta-blockers, cardiovascular drugs, catecholamines, CD20 monoclonal antibody, CD33 monoclonal antibody, CD52 monoclonal antibody, CTLA4 antibody, central nervous system drugs, antibiotics of the cephalosporin family, cerumen dissolvents, chelating agents, chemokine receptor antagonists, chloride channel activators, cholesterol absorption inhibitors, cholinergic agonists, cholinergic neuromuscular agonists, cholinesterase inhibitors, central nervous stimulants, blood coagulation modifiers, colony stimulating factors, contraceptives, adrenocorticotropic hormones, coumarins and indandiones, COX-2 inhibitors, decongestants, dermatological drugs, diagnostic radiopharmaceuticals, dibenzoazepine anticonvulsants, digestive enzymes, dipeptidyl peptidase 4 inhibitors, diuretics, dopaminergic antiparkinson drugs, drugs for alcohol dependence, echinocandins, epidermal growth factor receptor inhibitors, estrogen receptor antagonists, estrogens, expectorants, factor Xa inhibitors, fatty acid derivative anticonvulsants, cellulose acid derivatives, first generation cephalosporins, fourth generation cephalosporins, functional bowel disorders, gallstone dissolving agents, gamma-aminobutyric acid analogs, gamma-aminobutyric acid reuptake inhibitors, gamma-aminobutyric acid transaminase inhibitors, gastrointestinal agents, general anesthetics, urogenital tract infective agents, GI stimulants, glucocorticoids, blood glucose elevation agents, glycopeptide antibiotics, glycoprotein platelet inhibitors, tigecycline, gonadotropin-releasing hormones, gonadotropin-releasing hormone antagonists, gonadotropins, group I, II, III, IV or V antiarrhythmics, growth hormone receptor blockers, growth hormones, helicobacter pylori eradicators, H2 receptor antagonists, hematopoietic stem cell strippers, heparin antagonists, heparin, HER2 inhibitors, traditional Chinese medicine products, histone deacetylase inhibitors, hormone replacement therapy, hormones, hormonal/antineoplastic agents, hydantoin anticonvulsants, illegal (street) drugs, immunoglobulins, immunological agents, immunosuppressive agents, impotence agents, in vivo diagnostic agents, incretin analogs, inhaled anti-infective agents, inhaled glucocorticoids, positive inotropic agents, insulin-like growth factors, integrin chain transfer inhibitors, interferons, intravenous nutritional products, iodophors, ionophors, iron preparations, ketolide antibacterials, laxatives, leprosy [ bacterin ], leukotriene modulators, lincomycin derivatives, lipoglycopeptides, locally injected anesthetics, loop diuretics, pulmonary surfactants, lymph stains, lysosomal enzymes, macrolide derivatives, macrolides, magnetic resonance imaging contrast media, mast cell stabilizers, medicinal gases, meglitinides, metabolic agents, methylxanthines, mineralocorticoids, minerals and electrolytes, miscellaneous agents, miscellaneous analgesics, miscellaneous antibiotics, miscellaneous anticonvulsants, miscellaneous antidepressants, miscellaneous hypoglycemic agents, miscellaneous antiemetics, miscellaneous antifungal agents, miscellaneous hypolipidemic agents, miscellaneous antimalarial agents, miscellaneous antineoplastics, miscellaneous antiparkinsonian agents, miscellaneous antipsychotic agents, miscellaneous antitubercular agents, miscellaneous antiviral agents, miscellaneous anxiolytic agents, sedatives and hypnotics, miscellaneous biologicals, miscellaneous bone resorption inhibitors, miscellaneous cardiovascular agents, miscellaneous central nervous system agents, miscellaneous blood coagulation regulators, miscellaneous diuretics, other agents of the urogenital system, miscellaneous GI agents, miscellaneous hormones, miscellaneous metabolic agents, miscellaneous ophthalmic agents, miscellaneous ear drops, miscellaneous respiratory agents, miscellaneous sex hormones, miscellaneous external preparations, miscellaneous unclassified agents, miscellaneous vaginal agents, mitotic inhibitors, monoamine oxidase inhibitors, monoclonal antibodies, oral and throat products, mTOR inhibitors, mTOR kinase inhibitors, mucolytic agents, multikinase inhibitors, muscle relaxants, mydriatic agents, narcotic analgesic combinations, narcotic analgesics, nasal anti-infective agents, nasal antihistamines and decongestants, nasal lubricants and irrigants, nasal drops, nasal steroids, natural penicillins, neuraminidase inhibitors, neuromuscular blockers, a new generation of cephalosporins, nicotinic acid derivatives, nitrates, non-nucleoside reverse transcriptase inhibitors, non-cardioselective beta-blockers, non-iodophores, non-ionic iodinated contrast media, non-sulfonylureas, non-steroidal anti-inflammatory agents, norepinephrine reuptake inhibitors, reuptake inhibitors of norepinephrine-dopamine, Nucleoside Reverse Transcriptase Inhibitors (NRTIs), nutraceutical products, ophthalmic anesthetics, ophthalmic anti-infectives, ophthalmic anti-inflammatories, ophthalmic antihistamines and decongestants, ophthalmic diagnostic agents, ophthalmic glaucoma drugs, ophthalmic lubricants and irrigants, ophthalmic formulations, ophthalmic steroids, ophthalmic anti-infective steroids, ophthalmic surgical agents, oral nutritional supplements, otic anesthetics, otic anti-infectives, otic formulations, otic steroids, otic anti-infective steroids, oxazolidinedione anticonvulsants, parathyroid hormone and analogs, penicillinase-resistant penicillins, peripheral opioid receptor antagonists, peripheral vasodilators, peripherally acting antiobesity agents, phenothiazine antiemetics, phenothiazine antipsychotics, phenylpiperazine antidepressants, plasma bulking agents, platelet aggregation inhibitors, platelet stimulants, polyene antibiotics, potassium sparing diuretics, probiotics, progestin receptor modulators, progestins, prolactin inhibitors, prostaglandin D2 receptor antagonists, protease inhibitors, proton pump inhibitors, psoralens, psychotherapeutic agents, psychotherapeutic combinations, purine nucleosides, pyrrolidine anticonvulsants, quinolones, contrast agents, radioactive additives, radioactive agents, radioactive conjugated agents, radioactive agents, RANK ligand inhibitors, recombinant human erythropoietin, renin inhibitors, respiratory drugs, respiratory inhalation products, rifamycin derivatives, salicylates, sclerosing agents, second generation cephalosporins, selective estrogen receptor modulators, selective 5-hydroxytryptamine reuptake inhibitors, serotonin norepinephrine reuptake inhibitors, hydroxytryptamine neurogut modulators, sex hormone combinations, sex hormones, skeletal muscle relaxants, smoking cessation agents, somatostatin and somatostatin analogs, spermicides, statins, sterile irrigation fluids, streptomyces derivation tools, succinimidyl carbonate anticonvulsants, sulfonamides, sulfonylureas, synthetic ovulators, tetracyclics antidepressants, tetracyclines, therapeutic radiopharmaceuticals, thiazide diuretics, thiazolidinediones, dimethylthiophenes, third generation cephalosporins, thrombin inhibitors, thrombolytic agents, thyroid drugs, contraceptives, topical acne agents, topical preparations, topical anesthetics, topical anti-infective drugs, topical antibiotics, topical antifungal drugs, topical antihistamines, topical antipsoriatic drugs, topical antiviral drugs, topical astringents, topical debridement agents, topical depigmenting agents, topical emollients, topical keratolytic agents, topical steroids and anti-infective drugs, toxoids, triazine anticonvulsants, tricyclic antidepressants, trifunctional monoclonal antibodies, Tumor Necrosis Factor (TNF) inhibitors, tyrosine kinase inhibitors, ultrasound contrast media, upper respiratory tract disease combinations, urea anticonvulsants, urinary system anti-infective drugs, urine antispasmodics, urine pH modifiers, contraceptives, vaccines, vaccine combinations, vaginal anti-infective drugs, vaginal preparations, vasodilators, vasopressin receptor antagonists, vasopressors, VEGF/VEGFR inhibitors, viral vaccines, adhesives, vitamin and mineral combinations and vitamins.
1.1.1 identification of novel biomarkers for diseases (X, Y)
In certain embodiments, an optional step of identifying biomarkers for use in the systems and methods further described herein is provided. In other embodiments, the method of identifying a biomarker may be used alone, independent of any of the systems and methods described herein. When obtaining biomarkers from X, Y, the biomarkers can be predictors of disease (e.g., disease state, progression, severity, etc.). While many such biomarkers and their association with disease and thus risk without treatment (Rc) are well known in the art, it is useful to identify new biomarkers that are not yet known to be associated with a disease state of interest.
In one aspect, provided herein are methods of identifying such biomarkers that can subsequently be used as variable X in the methods of the invention. The biomarkers and methods for their identification are therefore particularly suitable for use in the broader methods of the invention using patient descriptors, particularly descriptor X.
The method uses a pathophysiological model as described in section 1.2 in order to assess the correlation between components of the pathophysiological model and the disease state. The pathophysiological model comprises components and/or interrelationships between components, whose components or interrelationships represent patient descriptors (in particular descriptor X, and descriptor Y), and these descriptors are thus candidate biomarkers. The pathophysiological model is run for combinations of different components within the risk factor vector (Y) and other descriptors X or combinations of different values of multiple components within the risk factor vector (Y, X) and other disease-related components X. The pathophysiological model is run to calculate the risk of an event of interest (likelihood of occurrence) for each combination of component values, and a set of output information will be generated from such calculations. The event of interest may be any suitable parameter, such as an indicator of disease status, progression, severity, etc. The results can then be evaluated using statistical methods to identify those biomarkers that are associated with the disease state of interest. In such cases, the biomarker will be a component of the pathophysiological model; preferably, these biomarkers will further correspond to patient descriptors that can be detected or measured in vivo or in vitro.
Accordingly, in one aspect, the present invention provides a method of identifying biomarkers of a disease, the method comprising: (a) running a pathophysiological model comprising one or more components or interrelationships between components of the pathophysiological model, the components or interrelationships representing candidate biomarkers, and wherein the pathophysiological model generates event likelihoods of interest for each candidate biomarker or combination of biomarkers (or values associated with each candidate biomarker); and (b) identifying a biomarker or combination of biomarkers associated with an increased or decreased likelihood of an event of interest. Wherein the relevant biomarker or combination of biomarkers is determined as a biomarker of a disease (e.g., a biomarker, progression, severity of a disease state). Optionally, the method further comprises calculating a therapeutic benefit by the outcome processing system of the invention, wherein the biomarker is contained within a vector of individual features contained in the risk (Rc) without treatment (variable (Y)).
1.1.2 benefit function
Treatment information (e.g., data, treatment descriptors) may be entered along with or without the effect model for a particular treatment. In one embodiment, the input includes an effects model; in such a case, the treatment information may be minimal except for the effect model, e.g., the identifier of the treatment is all that is minimally needed except for the effect model. In another embodiment, treatment information is input and an effect model is obtained by deriving the effect model from the information for each treatment. In the latter embodiment, the information for treatment generally includes clinical data, output from a pathophysiological model or a formal treatment model. The treatment information may be provided by any suitable method, for example, input by an input device or by receiving input from a database. Optionally, the system of the invention comprises a database comprising one or more treatments and information for each treatment, wherein such information comprises an effect model and/or information related to treatment objectives, in vivo tests, in vitro test results or clinical use results. Preferably, the information will include variables (e.g., X, Y); for example, the results of clinical use would include results for a patient being treated with treatment T (e.g., occurrence of an event of interest) and patient descriptors (X) and (Y) describing patient characteristics, where patient descriptors (X) and (Y) are context-, phenotype-, or genotype-derived variables.
The effect model expresses the therapeutic benefit in terms of the occurrence of events of interest. The desired therapeutic effect is typically a reduced risk or a reduction in the occurrence of the opposite or unwanted event(s) of interest (e.g., death and/or morbidity, associated susceptibility or any parameter indicative thereof), such as may be caused by disease. In the case of angina, one may want to reduce the likelihood of chest pain occurring. In this example, an effect model was used, where Rc is the frequency of this clinical event (chest pain) in individuals who did not receive treatment T. During the same time period, in the same but treated subject, the frequency becomes Rt. The relationship between these two frequencies depends on the treatment, disease and therapeutic objectives, i.e. the "events" of interest (usually clinical criteria) selected for efficacy, such as chest pain, sudden death, myocardial infarction in case of cardiovascular and cerebrovascular diseases.
The event of interest can be any desired detectable event, including but not limited to any clinically observable phenomenon or any detectable measure (e.g., biomarker) or underlying biological mechanism that leads to a clinically observable process. The event may be as simple as whether a clinical event (e.g., stroke, death, etc.) occurred, or the occurrence of any quantitative or qualitative threshold (e.g., tumor growth, progression or regression, tumor volume, new tumor formation, biomarker levels or biological component levels, optionally in the organ or in the circulation, rADCw levels, gene expression, hormone levels, quality of life scale scores, etc.).
The form of the relationship between Rt and Rc is represented by the following equation:
Rt=f(Rc,T,x),
where T indicates that it is therapy-dependent and X is a vector of individual features related to Rt in addition to those related to Rc. X may be a phenotype or genotype derived variable. Some may be altered by the environment of the individual. From such a relationship, Rc-Rt = g (Rc, T, X) is derived, and this function gives the absolute benefit, that is, the benefit expected from T for the patient (Rc, X).
The method for deriving a treatment information-based effect model for the treatment T will depend on the information provided for the treatment. In general, the effects model may be derived by applying one or more regression methods to available data, including, but not limited to, generalized linear and non-linear regression, logistic and poisson regression, supervised machine learning algorithms (e.g., neural networks, support vector machines), and other methods (response surface modeling, multivariate adaptive regression splines).
1. Deriving an effects model from clinical data
In one embodiment exemplified by certain implantable research methods or personalized medical methods, the treatment is associated with information generated from the use of clinical treatments. In this embodiment, the therapeutic effect of the treated individual (e.g., in terms of the occurrence of an event of interest) can be compared to the therapeutic effect of an untreated individual; data from clinical trials (e.g., patient descriptors and medical outcomes for each individual) is provided and regression techniques are applied in order to estimate the efficacy model of the treatment, i.e., a function that gives the benefit Rc-Rt = f (Rc, X) for each individual of the population.
2. Deriving an effect model from a pathophysiology model
In one embodiment exemplified by a goal evaluation method, the effect of treatment is modeled by the use of a pathophysiological model. In such cases, the treatment information typically includes information regarding the likelihood of the occurrence of the event of interest. Examples include altering biological targets in pathophysiological models, changes representing treatments that would contribute to such alterations. In this embodiment of the biological target to be evaluated, the effect of an unchanged pathophysiological model representative of a first biological state (e.g. a disease state), e.g. in terms of occurrence of an event of interest, may be compared with a modified pathophysiological model comprising said change, preferably taking into account the variable(s) in each case of a population of real or virtual individuals. Regression techniques can then be applied to the two-dimensional dataset of risk (Rc) and therapeutic benefit (Rt) without treatment in order to estimate the model of the effect of the treatment, i.e. a function giving the benefit Rc-Rt = f (Rc, X) of each individual. In a simplified case, the effect model can be obtained by mathematically solving a set of equations describing the pathophysiological model. The resulting benefits will therefore describe the benefits predicted by altering the biological targets, allowing assessment of physiological effects and therapeutic potential of the biological targets.
3. Deriving an effect model from a formal treatment model
In another embodiment exemplified by a progress monitoring method, the input information for the pharmacological information is available or simulated therapy. In such embodiments, pharmacologic information is input, and the therapy is modeled in a formal therapy model that includes the pharmacologic and pathophysiological models and variable(s). The pathophysiological model outcome without treatment (e.g., in terms of occurrence of an event of interest) may be compared to the pathophysiological model effect modified by treatment; regression techniques can then be applied to the two-dimensional dataset of risk (Rc) and therapeutic benefit (Rt) in the absence of treatment in order to estimate the model of the effect of the treatment, i.e. to give each individual of the population a function of the benefit Rc-Rt = f (Rc, X).
It should be appreciated that alternatively, any step in using a method or system that includes a formal treatment model, the steps of providing clinical data and using the data to modify the formal treatment model may be performed. Such a step would have the effect of confirming and improving the accuracy of the formal treatment model by comparing the results with the benefits from the formal treatment model results obtained from the clinical data. Such steps may include comparing an effectiveness model calculated from the formal treatment model with an effectiveness model derived from clinical data. The comparison takes into account the formula and the variables involved. Any differences can be explored. It is generally assumed that the effect model calculated from the formal treatment model is closer to reality than the effect model calculated from the clinical data. The comparison focuses on variables that are contained in the effect model derived from the clinical data and not in the effect model derived from the formal treatment model, or vice versa. These variables are then included in the latter model and integrated or maintained in the formal treatment model if the accuracy of the individual or population benefit is improved and/or if it has strong biological relevance.
1.2 pathophysiological models
In certain embodiments, pathophysiological models are used in certain methods, e.g., for target assessment, monitoring progress, transplantable studies, and personalized medicine.
Preferably, the pathophysiological model interprets all or a prospective selected portion of the knowledge available on the biological mechanism that causes the disease and incorporates the clinically observable results as an output. The pathophysiological model may be a model that includes a collection of logical forms with or without mathematical, logical, numerical, and/or computerized instruments representing the logical forms used to describe the dynamic behavior of the disease state. The pathophysiological model is preferably a disease model. The process represented in the pathophysiological model may include any clinically observable phenomenon or underlying biological mechanism that causes a clinically observable process, whether or not the biological mechanism itself is readily measurable in a clinical setting. Non-limiting examples of processes include any biological process; binding of the drug to the receptor (including, e.g., binding constant); catalysis of a particular chemical reaction, such as an enzymatic reaction (including, for example, the rate of such a reaction); synthesis or degradation of cellular components such as molecules or molecular complexes (including, for example, the rate of such synthesis or degradation); modification of cellular components, such as phosphorylation or glycosylation of proteins (including, for example, the rate of such phosphorylation or glycosylation); proliferation, activation, motility or migration of cells or death of cells; flow of any molecule (e.g., ions, water, any chemically reactive molecule, proteins, etc.) and the like.
Pathophysiological models typically include mechanical models. The pathophysiological model may alternatively or additionally include an empirical model and/or a phenomenological model. Examples of pathophysiological models include models that describe biological processes and phenomenological models that describe interactions between biological systems without describing underlying biological processes.
It should be understood that the pathophysiological model may, but need not, simulate the whole human or a system comprising multiple organs, but may simulate at least one physiological process, e.g. a step or several steps comprised in a disease process. Depending on the application, the pathophysiological model may, for example, simulate one or more groups of cells, tissues, one or more organs, etc., as long as such simulation allows for prediction of event risk.
The biological processes represented in the pathophysiological model may include, for example, signaling and control channels. Biological components of such channels include, for example, primary or intermediate signaling molecules and proteins that are involved in signaling or control cascades that generally characterize these channels. For signaling channels, binding of a signaling molecule to a receptor can directly affect the number of intermediate signaling molecules, and can indirectly affect the degree of phosphorylation (or other modification) of the channel protein. Binding of signaling molecules can affect the activity of cellular proteins by, for example, affecting the switching habits of the cell. These cellular proteins are often important effectors of cellular events initiated by signals. Control channels, for example, those that control the timing and occurrence of the cell cycle, share certain similarities with signaling channels. Here, multiple cellular events, and often uninterrupted cellular events, are temporally coordinated, often with feedback control, to achieve results such as chromosome bearing detached cell divisions. This temporal coordination is a result of the functioning of control channels, which are often mediated by the interplay of proteins in terms of their degree of modification or activation (e.g., phosphorylation) of each other. Other control channels may include channels that seek to maintain optimal levels of cellular metabolism in the face of a changing environment.
The pathophysiological model may be a mathematical model that represents a set of biological processes of the physiological system using a set of mathematical relationships. For example, the model may represent a first biological process using a first mathematical relationship and a second biological process using a second mathematical relationship. The mathematical relationships typically include one or more variables, behaviors that can be modeled by the model (e.g., time evolution). In particular, the mathematical relationships of the model can define interactions among variables that can represent levels or activities of various biological components of the physiological system, as well as levels or activities represented by assemblies or aggregates of various biological components. The model typically includes a set of parameters that affect the behavior of variables contained in the model. For example, the parameters represent variable initial values, variable half-lives, rate constants, slew rates, and exponents. Due to variability in experimental systems, these variables generally accept ranges of values. The specific values are selected to provide the components and system with behavior that conforms to known constraints. Thus, the behavior of variables in the model changes over time. The computer model includes a set of parameters in a mathematical relationship. In one implementation, the parameters are used to represent intrinsic characteristics (e.g., genetic factors) as well as external characteristics of the biological system (e.g., environmental factors). Mathematical relationships used in the model may include, for example, ordinary differential equations, partial differential equations, stochastic differential equations, differential algebraic equations, differential equations, cellular automata, coupling maps, Boolean network equations, fuzzy logic networks, or combinations thereof.
Running a pathophysiological model will calculate the risk (likelihood of occurrence) of an event of interest and produce a set of output information from such calculations. The pathophysiological model will preferably relate the variables (X) and (Y) describing the model parameters of the patient descriptor and risk, optionally wherein one or more of the variables used in the pathophysiological model are biomarkers, wherein the variables (X) and (Y) are environmental, phenotype or genotype derived variable(s). The output information may then be used to derive an effect model for a given change in the biological target.
In some embodiments of, for example, a biological target evaluation method, the step of selecting a biological target of interest may be performed, as indicated by block 101b of fig. 2 above. This step may include inputting, e.g., receiving, inputting or otherwise specifying, via an input device, one or more changes to the biological network, which are represented as potential treatments T. Thus, the changes to be assessed are specified such that the therapeutic benefit of altering the biological target is then calculated.
A preferred pathophysiological model is based on a diffuse model, as described further below.
1. Constructing a model: diffuse model
In one aspect, a diffuse model is used. The diffuse model is a step prior to creating the computational model, which is, for example, a model having a set of differential equations. Such models have the advantage of being suitable for integrating various levels of interaction, including biological processes at the biological component level and processes at the tissue and/or organ level. By integrating processes at the tissue and organ level, pathophysiological models can be used to predict the risk of clinical events of interest. Thus, the diffuse pathophysiological model may explain the disease process, i.e. it integrates the upper levels, including the physiological levels. Diseases encompass several hierarchically organized levels of complex phenomena, from gene to population. The time scale varies from nanoseconds to decades, with chemical interactions for the former scale and evolution to clinical events for the latter scale. In chronic diseases, such as cancer or arteriosclerosis, the series of events at the molecular, cellular, tissue and target organ level take decades to achieve death or myocardial infarction. In view of the rapidly emerging scientific information, it is therefore envisaged that the model is flexible enough to integrate any new relevant knowledge.
Overall, modeling of disease progresses along three axes: a phenomenon or subsystem axis, a time axis, an integration axis. The first step in constructing a diffuse pathophysiological model is to determine the exact formulation of what to model and how to obtain the target(s), which is required for the selection that occurs later in the construction process for repair. Further steps vary according to each study topic. However, typically building a model will include the major steps shown in Table 1, although these steps need not be performed in the order shown.
Table 1


In general, i) the modeling of a biological process can be segmented, with clearly identified inputs and outputs for each segment or sub-model, and biomarkers that can be used to validate the overall model; ii) each segment can be solved numerically at a level of complexity different from the other levels; iii) any time the modeling process progresses, the submodel can be replaced by a more detailed submodel ("insert" principle).
System pathophysiology all available evidence and data needs to be collected and analyzed before selecting those relevant for the model. Their uncertainty and evidence strength are valued and recorded. Building a model of pathophysiology relies on a "knowledge base" that includes evidence elements that are considered to be both sufficiently rational and important in the model. The types of evidence incorporated into the model can range from in vitro test results in basic biology, including structural biology, to infectious disease, randomized clinical trials, and clinical research and imaging data. Collecting experimental data from scientific literature as well as experimental conditions, cell types and species; next, the data is compared and erroneous data is culled. Due to the multiplicity of experiments and observation settings, the values of a given parameter can vary within a range and be scored by the variability and intensity of the evidence. Data is typically stored in a database that incorporates quantitative, qualitative, and structural information as well as scores describing the strength of their evidence.
2. Dividing the diffusion model into sub-models
A diffuse model is generally a text and/or graph that assembles all the components of the disease and their interactions, albeit sufficiently related to the objectives of the modeling process. This is the basis for the later steps of table 1. The components and their associations are shown in the final mathematical model. The model is represented as text, outlined by a chart and several series of rules. The diffuse model comes in various embedded forms: at the molecular level, at the cellular level, etc.
In the mathematical modeling step, a large amount of different knowledge and data is typically integrated. The solution consists in separating the diffusion models by identifying independent subsystems. These are characterized by their ability to be studied and modeled independently as sub-models, while respecting global system dynamics. For example, in the acute stroke modeling process, cell death alone is described as the entire process. The independence of the subsystems may be described using an exemplary set of rules: i) the underlying biological phenomenon has a recognized specific functional state; ii) signals with good representation (input/output of the subsystem) linked to other subsystems; iii) it contains at least biomarkers that are measurable in vivo or in vitro (for the purpose of confirming the simulation result). For example, cell death may be viewed as a subsystem with relatively simple input/output signals, e.g., calcium ion concentration, energy storage as an input, and energy consumption and ultimately cell death as an output.
3. Chronology and organizational level
The subsystem has two other features of interest: chronological component and organizational level. The molecular level is a lower level and the population level is a higher level. As a key segment of the overall diffusion model, the subsystem can be organized along two dimensions: time axis and tissue axis. Both axes are descriptors of series events, i.e. chronology and causality. As an example, multi-scale mathematical models of growth of cancer cells or vascular events have recently been proposed. Tibba, b. et al, journal "biological theory" (the or Biol.) (2006) 243: 532-541 and Dronne, M.A. et al, Brain Studies (Brain Res) (2007) 1138: 231-42, the disclosure of which is incorporated herein by reference.
Examples of acute stroke are provided herein (see fig. 3 and 4). In this model, cell death, first necrosis due to cellular edema, is the result of abnormal ion exchange due to energy starvation. Subsequently, the cells in the penumbra may die by an intact apoptotic process. However, cell death/apoptosis occurs later and can last for several days. These examples show that subsystems can be connected by causal relationships and have different chronologies. Cellular and tissue mechanical properties are increasingly recognized as regulators of many biological processes ranging from gene transfer to tissue remodeling. Cellular elasticity is a key parameter of mechanical signal transduction, while extracellular matrix stiffness regulates cell adhesion and migration. It is well known that environmental mechanical forces affect many cellular functions, such as cell growth, proliferation, protein synthesis, and gene expression. Thus, mathematical modeling at the tissue level would preferably integrate the interpretation of different subsystems at different tissue levels, such as cell proliferation, gene expression and protein synthesis. In certain embodiments, modeling integrates, for example, cellular proliferation, regulated at the molecular and genetic level, and macroscopic changes in tissue compression and deformation.
4. Parameter estimation
A model is typically a series of equations and/or a series of rules characterized by algebraic or logical functions and parameters. The choice of function depends on the relationship or interaction between the system components or entities. Parameter selection and estimation generally follows any one or a combination of three different approaches: i) parameter values were extracted from the literature, i.e., the experimental data from which they were derived was not accessible; ii) adjusting parameters over a set of experimental data using statistical methods (e.g., maximum likelihood) that allow fitting a model to the data, and/or iii) arranging parameter values to allow the model to satisfy general biochemical, physiological, or physico-chemical rules or desired behaviors.
One can start with a set of experimental parameter values for each parameter in the model and then move to a "reasonable" set. The experimental or observation sets were extracted directly from the literature. It includes values that have been observed in similar experimental settings, as close as possible to the set in which the model is embedded. A parameter may be considered "reasonable" if the model shows a physiologically relevant response to stimulation, a correct resting state, and if the parameter values remain within plausible ranges. Depending on the qualitative dynamics and rest characteristics of the model, these values need not be "true" values, but may be assigned within reasonable ranges. These characteristics are generated from pre-specified rules contained in the diffusion model and extracted from the knowledge base. Thus, the knowledge base contains not only experimental data, but also a qualitative description of global behavior.
The rational set can be evaluated using a probabilistic method or using a deterministic method. The probability statistical method consists of the following contents: a set of parameters is randomly selected and checked whether it results in correct macroscopic behavior, i.e. whether it satisfies a series of rules representing qualitative knowledge. With the deterministic approach, we first create a "distance" that measures the difference between the calculated result and the expected result, and then we try to minimize this distance. With respect to the ion channel model example of fig. 3, the basis of the rules is: i) a stable resting equilibrium potential exists; ii) a short (1 ms) sufficiently strong applied current results in an action potential. These two rules can be converted into mathematical statements and can be easily confirmed by an automated program. If the set of tests satisfies the rule, it is stored. At the end of a run, thousands of parameter sets have been tested, resulting in tens of suitable sets, followed by the addition of more stringent criteria to the rules, such as: i) for a brief external stimulus period, an action potential may be generated; below, there should be no action potential, above, the cell is depolarized; ii) for prolonged external stimuli, producing multiple action potentials or repetitive discharge (sparking) occurrences, these sets can be explored in more detail. Unknown-value parameters are managed in the same way, i.e. their values are such that the model satisfies the rules describing the behaviour of the biological system of interest.
5. Type of model
Various model types may be suitable. The phenomenological model is simplified to an envelope representation of the phenomenological of interest. For example, apoptosis in acute stroke in the model of fig. 3 can be modeled by any mathematical equation that increases to a maximum over time, then the level decreases and eventually falls to baseline after a few days. The main advantage of the phenomenological model is its simplicity. On the other hand, mechanical models aim to incorporate as many system-known details as possible. In embodiments such as those described herein that evaluate biological targets, mechanical models are preferred. The choice between the two alternatives generally depends on: i) a target of a modeling process; ii) availability of information about the system; iii) the selected strategy. The insertion principle makes it possible to use a phenomenological model for the subsystems, while mechanically modeling the other subsystems. If the need for a refinement subsystem is later generated, the phenomenon submodel is replaced by a mechanical submodel with the same terms and outputs.
1.3 formal treatment model
In certain embodiments of the invention, certain methods, such as for goal assessment, monitoring progress, transplantable studies, and personalized medicine, use formal treatment models.
Formal treatment models include pathophysiological models and pharmacological models. The formal treatment model can be constructed by assembling a Pharmacokinetic (PK) model, a Pharmacodynamic (PD) model, and a pathophysiological model. In the monitor progress (block 106c of fig. 2) method, PK and PD associated data provided as input to the formal treatment model may be obtained from experiments with the treatment whose progress is to be monitored (e.g., block 111 of fig. 2).
In a method of assessing the portability of clinical results (block 106d of fig. 2), PK and PD data provided as input to a formal treatment model may be obtained from the scientific or medical literature, for example, as observed from previous studies utilizing treatments and stored in a database (block 111 of fig. 2).
The example pharmacological models shown in blocks 102a and 102b of fig. 2 include stepwise calculations describing the effect of a drug on a pathophysiological system (e.g., a pathophysiological model) and are performed by one or several equations based on general scientific knowledge of pharmacology and physiology. The pharmacologic model may include a first pharmacokinetic submodel that calculates a drug concentration (Ct) in a tissue of interest and a second pharmacodynamic submodel that utilizes the Ct as an input and describes an effect of the drug on one or more components (e.g., biological targets) of the pathophysiological model. Alternatively, the pharmacodynamic model may take into account additional factors that may alter the effect and/or side effects of the drug on the disease mechanism; optionally, the model may take into account one or more biomarkers (IO) indicative of a change in the biological system(s) caused by the drug. The final function(s) describing the effect and/or side effects of a drug on the disease mechanism is called z. Running the formal treatment model will calculate the likelihood of an event of interest and will generate a set of output information from such calculations. This output information may then be used, for example, to derive an effect model for a given change in the biological target.
In the exemplary PK and PD submodels of the formal therapy model shown in fig. 5, drug activity or any kind of therapy in vivo may be divided into four subsystems that may each be modeled separately. The only system entry (input) is the administration of the drug with the amount per dose, timing of administration and cumulative amount. The output is the desired clinical effect and side effect(s). Between each subsystem, one or more markers of drug activity are present in the body, and can be accessed to determine: drug concentration in the relevant fluid (c (t)) and intermediate markers (biomarkers) (io (t) in fig. 5). IO may be derived from biological signals that mediate the effect of a drug on disease mechanisms and/or in side-effect mechanisms. However, in real medical practice, IO is often only relevant to clinical outcome. Nevertheless, in the modeling process of fig. 5, it is assumed that IO describes the effect of a drug on disease mechanisms, that is, it is a signal that mediates the drug activity pattern. In such a case, io (t) is referred to as z, as given below. Each subsystem may be modeled phenomenologically or mechanically. Compartmental modeling is an example of the former for the Pharmacokinetic (PK) subsystem.
Thus, the formal treatment model links the "computer simulated" administration (effect on clinical outcome) of a given dose to an end product, allowing the drug dose, the drug concentration in the biological fluid, mainly blood, and the biomarker(s) of the pharmacological activity and the clinical effect to be integrated and calculated in a single global model following the administration.
Thus, each formal treatment model may be a cascade of sub-models for each step of the treatment process that propagates the potential activity of the drug to intermediate or final (e.g., clinical) detectable effects (fig. 6).The sequence of steps and their contents may follow the Wenget-Pedersen (Vengt-Pedersen) protocol (Veng-Pedersen P and Modi NB (1992) in journal "pharmaceutical sciences" (Pharm Sci); 81: 925-34 literature). In turn, each step may be broken down into sub-steps. Each step i or sub-step ij consisting of an input, an output, a mathematical submodel linking the output to the input, a scale parameter(s) thetai and of XjA single multi-dominant definition of a representation; if a step consists of sub-steps, there will be many X's as sub-steps, which are recorded as X' sijWherein j represents a substep. The output of step i-1 is the input to step i. Thus, in this simplified illustration, the process is linear in the step domain (i.e., between steps), although the process is not linear within steps. Alternatively, a more realistic model may be used that includes a feedback process between two or more consecutive steps, such that the overall process is no longer linear. As an example of how the steps are constructed, the case of drug dispensing (step i-2) is refined. The input from the previous step (absorption) is the amount of drug that reaches the systemic circulation, a. The output is the mean drug concentration in the blood between two doses, Cavg. The corresponding numerical submodel is given by the classical pharmacokinetic equation: where T is the dosage interval and θ 21 and θ 22 are two model parameters, the latter being the maximum gap. The patient variable is X2Age, age. The last step gives a modified value for z.
1.4 simulated Individual groups
In certain embodiments of the invention, such as certain methods for goal assessment, monitoring progress, transplantable studies, and personalized medicine, a simulated population of individuals is used.
The simulated population of individuals shown in blocks 103a to 103d of fig. 2 is a virtual population, such as a group or set of virtual individuals. The simulated population of individuals may or may not represent population characteristics of the real subject population, such as a clinical population of interest. Thus, the simulated population of individuals may be referred to as a virtual reality population, where the population is constructed to represent a real sample of the population of interest. Such a sample may represent, for example, a group of people in a particular region or country, covered by health taxpayers, who are candidates for a particular treatment, who are at a particular age, who have or are predisposed to a particular disease and/or have a specified physiological and/or medical history, etc.
Thus, the virtual reality population will typically have statistical properties or habits (e.g., mean, median, variance, dynamics, etc.) that approximate the statistical properties or habits of the real experimental subject sample population. Each individual in the population is associated with a patient descriptor comprising individual parameter(s) and/or variable(s) (X) and one or more risk factors (Y) that are aggregated into Rc, i.e., the risk of an event or outcome (e.g., the frequency of an adverse health event), where parameter (s)/variable(s) X are vectors of individual characteristics other than those included in Rc, and where X and Y may be environmentally, phenotype, or genotype derived variable(s). Variables may include, for example, age, gender, race, any measurable or detectable variable, biomarker(s), history-related information, symptoms, disease severity, previous or concurrent therapy, and the like. Examples of variables in cardiovascular disease include typical risk factors such as Systolic Blood Pressure (SBP) and Diastolic Blood Pressure (DBP), Total Cholesterol (TC) and high density lipoprotein cholesterol (HDL-C), Diabetes Mellitus (DM), smoking status, weight, height, and values of serum creatinine. Patient descriptors in a virtual population may also come from model variables and parameters, and may only have indirect biological relevance or authenticity. All patient descriptors in the virtual population are potential biomarkers.
Virtual reality populations can be constructed using data from representative observational studies and statistics from demographic information sources using the following general methods for generating the following populations for cardiovascular disease studies. The number of virtual subjects is known from the "institute for statistics and economics" (INSEE) of France, fixed to reproduce the structure of the age and sex of the French subjects between, for example, 35 and 64 years of age. Each subject of the virtual population is represented by variables whose dimensions are individual-related characteristics, such as age, gender, and other typical cardiovascular risk factors: systolic (SBP) and Diastolic (DBP), Total Cholesterol (TC) and high density lipoprotein cholesterol (HDL-C), Diabetes (DM), smoking status, weight, height, and serum creatinine. The inputs for the simulations were data sorted by gender and age, summarized as mean, standard deviation and quantile, and covariance matrix for each category. The data collected correlates with baseline characteristics of individuals not receiving anti-diabetic, cholesterol-lowering, or anti-hypertensive therapy. These features are not independent; for example, it is well known that blood pressure is associated with diabetes and overall cholesterol within the same age group. When necessary, covariates will follow a Multivariate Normal Distribution (MND) after checking the normality of the original variables and applying mathematical operations to convert them to a normal distribution. MND-based algorithms are used to generate SBP, DBP, TC, HDL-C, blood glucose, serum creatinine, weight and height. A uniform distribution is used to assign random ages to each virtual subject in a desired interval.
Further, where variables are not available from observation studies for the population to be represented, such variables may be estimated from scientific data (e.g., publications). For example, in the previous example, left ventricular hypertrophy, which is useful as a cardiovascular risk factor in the risk equation, is defined by a high R-wave on the ECG associated with a repolarization abnormality. Instead of obtaining values from observation studies in the target population (here, the french), information is obtained from the INDANA database. The probability of having ECG-LVH is expressed as a function of SBP, gender and age using logistic regression, and the equations generated therefrom are used to estimate the individual LVH probability in the simulated subjects. Diabetic subjects are those individuals with random blood glucose levels of 1.26g/l or above. Since smoking status does not exhibit significant correlation with other covariates other than age and gender; it was modeled using a binomial distribution where the probability of being a smoker was represented by the prevalence of smoking status in the same class of original subjects. Next, these variables: LVH, diabetes and smoking status were divided into two halves. In order to make the covariate values biologically reasonable, the simulated individuals with covariate extrema that exceed the true distribution limits were excluded.
The simulated population of individuals may also be constructed to include completely or partially spurious individuals. In such a case, the patient descriptors X and Y are defined by model variables and parameters, the distribution and covariances of which are created with all available knowledge on the variability of the model components. In a completely false individual, the virtual individual is characterized or not by variables that have not been or cannot be measured in a real individual. In some spurious individuals, each individual is characterized by a mixture of spurious and measured variables, among which perhaps the distribution of biomarkers is obtained from real individuals. Spurious variables from the set of variables and parameters in the pathophysiological model may also be potential biomarkers.
Once a virtual reality population is constructed, the consistency of the simulated individuals can be tested at the population level. For example, in the foregoing example, the predicted cardiovascular mortality in the virtual reality population was compared to the cardiovascular mortality declared in the legal statistics. The 10-year risk of fatal cardiovascular disease (CVD) was calculated for each mock individual. The 10-year predicted mortality was calculated as the average risk of 100000 people in each age-gender category. The life-sheet method is used to infer the latest achievable mortality from national statistics in order to obtain a 10-year estimate of the French-national mortality.
1.5 patient descriptors of real individuals
In the personalized medical embodiment of the present invention, as represented in block 109 of FIG. 2, patient descriptor(s) of the real individual are entered. The patient descriptor(s) may include any individual parameter and/or variable describing the individual. Individual parameters and/or variables typically include one or more risk factors (Y) and parameters/variables represented by X, where X and Y may be environmental, phenotype, or genotype-derived variable(s). Variables may include, for example, age, gender, race, any measurable or detectable variable (e.g., biomarker (s)), medical history-related information, symptoms, disease severity, previous or concurrent treatments, and the like. Examples of variables in cardiovascular disease include values for typical risk factors such as Systolic Blood Pressure (SBP) and Diastolic Blood Pressure (DBP), Total Cholesterol (TC) and high density lipoprotein cholesterol (HDL-C), Diabetes (DM), smoking status, weight, height, and serum creatinine.
1.6 optional data storage component
The system of the present invention may optionally include any number of data storage components. Although input may be received from a data storage device and/or database external to the system, or in addition to, from any other suitable source, using a communication device, or input on an input device, it should be understood that a data storage device and/or database including input information may also form part of the inventive system. The data store and/or database may include, for example, a knowledge database containing information from scientific experiments or publications, a progress database containing scientific experimental information from drugs (e.g., PK or PD data), a clinical database containing data from clinical use of the treatment, and/or a patient descriptor database containing patient information (e.g., variables (X, Y), any other information). In one embodiment, the system comprises a data storage and/or a database, wherein said database comprises a plurality of treatments (T), wherein each treatment (T) is associated with an effect model.
1.7 calculation of the benefits of treatment
Different methods will be employed to calculate therapeutic benefit using the aforementioned treatment inputs, input and effect models for an individual or population, depending on the use of the invention. Calculating the therapeutic benefit as a function of risk in the absence of treatment and X involves applying an effect model to the individual or a simulated population of individuals. Calculating therapeutic benefit may include, but need not require, accumulating the number of events, depending on the particular application. For example, a therapeutic benefit may be output by indicating the presence or absence of a probability (Rt) of occurrence of an event of interest for an individual or each individual in a population. In another example, for example, when a therapeutic benefit is to be displayed to a user in a personalized medical approach, the display may include a graphical output, such as a graph with Rt on one axis and Rc on another axis. In other embodiments, the number of events avoided by the treatment is accumulated and output as a graph; such a graph is useful for comparison purposes, such as comparing the benefit of changes in different biological targets, comparing the benefit of different treatment regimens of drugs.
1. Calculating BAtp
In the personalized medical embodiment, the method includes the step shown in block 105e of fig. 2 of calculating a treatment expectation benefit (BAtp) for an individual patient by applying an effects model to the input patient information. From the efficacy model, one derives a function Rc-Rt that gives the expected benefit of an individual patient utilizing treatment T, where Rc = f (Y) and Rt = g (Rc, X), Y and X being patient descriptors relating to the course of either or both of the risk of disease-associated events and the intensity of treatment efficacy. Therefore, Rc-Rt = h (Y, X). The effect model function is derived from clinical data (block 110 of fig. 2), or from the application of a formal treatment model of the treatment T to the population from which the patient is extracted or its virtual reality Population (PVR), as shown by the dashed line above block 104d in fig. 2. The values of patient descriptors Y and X are input into the function, which gives barp = Rc-Rt.
2. Calculating NEC
In certain embodiments of the invention, such as certain methods for targeted assessment or monitoring of therapy using an unaltered pathophysiological model, the method may include the step of calculating the number of control events of interest, referred to as the event control number (NEc), observed in a population of simulated individuals to which therapy has not been administered. Block 105a of fig. 2 shows NEc. The step of calculating NEc is used according to the unaltered pathophysiological model. The corresponding number of events is obtained by aggregating the probabilities of event occurrences for the entire virtual population, where the probabilities are calculated by applying a pathophysiological model to each individual of the population.
NEc is calculated by applying a pathophysiological model to each individual of a simulated population of individuals to calculate the individual risk (Rc) of an adverse health event, aggregating all individuals of the population, and optionally extending to the parent population, in order to obtain the number of events resulting from a disease of interest in the population. Confidence intervals for NEc are obtained by sampling another virtual population that is distributed taking into account patient descriptors. Any other method of accounting for model variability and parameter variability may be similarly used to calculate NEc confidence intervals.
3. Calculation of NEA
In certain embodiments of the present invention, such as certain methods for target assessment, the method may include the step of calculating the Number of Events (NEA) avoided due to changes in the biological target(s) or other components of interest in the pathophysiological model. Block 105b of fig. 2 shows NEA.
In fig. 2, NEA is calculated in order to obtain a predicted number of avoidance events given a change in biological target(s), by applying an effect model associated with a change in a target or a combination of targets, which may be derived from a pathophysiological model as described above, to a simulated population of individuals or another simulated population of individuals with an appropriate pattern, aggregating all individuals of the population and optionally extending to the mother population. Thus, this step allows to calculate the number of avoidance events caused by an altered disease process of interest (caused by the alteration of the biological target) in the population. The confidence interval for NEA is obtained by sampling another virtual population that is distributed taking into account the patient descriptors. Any other method of accounting for model variability and parameter variability may be similarly used to calculate NEA confidence intervals.
4. Calculation of NEAt
In certain embodiments of the invention, such as certain methods for monitoring progress or transplantability studies, the method may include the step of calculating the number of avoidance events (NEAt) due to the treatment of interest. Blocks 105c and 105d of fig. 2 illustrate NEAt.
The NEAt is calculated by applying an effect model associated with the treatment (e.g., drug under development) to a simulated population of individuals, aggregating all individuals of the population to obtain the number of avoidance events expected from the treatment. In some embodiments of the methods, e.g., for monitoring progress or portability studies, the effect model is derived from the formal treatment model as described above. In other embodiments, such as where clinical information is available for portability studies of treatments, the efficacy model is derived or updated from clinical data as described above. The therapeutic benefit for the population or individual may then be output in any suitable manner and in any suitable form, including but not limited to output or transfer to a data storage device, processor, or display device, with the therapeutic benefit as a function of risk in the absence of treatment. Confidence intervals for the NEAt are obtained by sampling another virtual population that is distributed taking into account the patient descriptors. Any other method of accounting for model variability and parameter variability may be similarly used to calculate the NEAt confidence interval.
1.8 Process for Using prediction of therapeutic benefit
The therapeutic benefit calculated in the previous section can be used in various optional additional methods, where the therapeutic benefit is a function of risk and variable (X) in the absence of treatment. The therapeutic benefit calculated in the previous section may be output and used by the user in an additional method, for example by delivering the therapeutic benefit to a further system to implement the additional method. In other embodiments, any additional methods may form part of the system and be implemented as further steps of the method of the present invention.
1. Target evaluation method
Block 106a of FIG. 2 illustrates the target evaluation method. The target assessment method may include selecting a biological target or combination of targets (or other components of the pathophysiological model) whose changes result in a benefit, typically with a substantially smaller number of events with changes than without. In one example, a plurality of biological targets are evaluated; in such an embodiment, the benefit is calculated for a plurality of biological targets, and if the benefit resulting from the alteration of one biological target is greater than the benefit resulting from the alteration of another biological target of the plurality of biological targets, then the biological target is selected from the plurality of biological targets.
In one embodiment, the target assessment method may include comparing the number of events for a change in biological target or combination of targets (or other components of the pathophysiological model) to the number of events with known (e.g., marketed) treatments. Optionally, the method further comprises selecting a biological target whose alteration results in a benefit that is greater than a benefit from a known therapy.
In one embodiment, the method may include selecting a biological target or combination of biological targets or other component that maximizes the number of avoidance events or optionally provides additional benefit (additional avoidance events) through known therapeutic or pharmaceutical targets.
The method may further include the step of drug selection, as shown in block 106b of fig. 2. In this step, for example, drugs that directly or indirectly mimic or contribute to changes in biological targets or combinations of targets (or other components of the pathophysiological model) are evaluated. Such drugs may be known in scientific knowledge (e.g., literature), drug discovery or drug design methods performed from experiments or from computers. Alternatively, the drug may be a ligand of the aforementioned biological target(s). This step involves selecting drugs with the potential to alter a biological target or combination of targets. The method may further include inputting pharmacological information for the selected drug into the formal treatment model; optionally, the method further comprises monitoring drug development in the progress monitoring method of the invention.
2. Progress monitoring method
3. Transplantable research method
Block 106d of FIG. 2 represents the portability study methodology and the biomarker assessment methodology. Exploring the portability of clinical trial results for treatment T, such as before marketing or testing treatment T, involves evaluating population descriptors (patient descriptors, e.g., variables Y and X) to determine and/or identify descriptors that can alter the efficacy model and/or avoid the number of events. The estimation will typically also take into account the amount of change in the effects model and/or the number of avoidance events due to a given descriptor or combination of descriptors. The method may also be used to estimate the benefit of treatment T in a population that is characterized or quantified differently than the first population for which the information for treatment T was used as an input.
4. Biomarker assessment method
Block 106d of FIG. 2 also represents a biomarker identification and assessment method. Identifying or evaluating biomarkers for treatment T involves evaluating population descriptors (patient descriptors, e.g., variables Y and X) to determine and/or identify descriptors to determine Rc values or descriptors that can alter an effect model and/or avoid a number of events for treatment T. The estimation will typically also take into account the amount of change in the effects model and/or the number of avoidance events due to a given descriptor or combination of descriptors. Thus, the method may be used to estimate the effect of biomarkers that affect the benefit of treatment T in populations with the same or different characteristics or numbers as the first population, where the information for treatment T is used as input, or to identify biomarkers. The method can also be used to estimate the impact of or identify biomarkers that are predictive of disease (e.g., disease state, disease progression, etc.).
5. Personalized medical treatment method
In one embodiment, the personalized medicine method includes predicting benefits of a plurality of available treatments based on the patient descriptor, variable X and a risk factor, and selecting a treatment appropriate for the patient based on the predicted benefits as a function of cost (e.g., acceptable cost for selection) and similar risk of serious adverse effects. Calculating a benefit by integrating the patient's X value and risk factor value into an effects model; thresholds for relevant benefits may be calculated by limiting overall population costs using an effectiveness model calculated from clinical trial data or generated from a formal treatment model and a realistic virtual population.
In one embodiment, the personalized medical approach comprises predicting benefits from a plurality of available treatments based on patient descriptors, namely variable X and risk factors, and selecting a treatment appropriate for the patient based on the predicted benefits, optionally taking into account the risk of serious adverse effects; benefits are calculated by integrating the patient's X values and risk factor values into the effects model.
2.0 output and display
2.1 example output Path
The therapeutic benefit calculated in the section entitled "calculating benefit of treatment" as a function of risk and variable X in the absence of treatment may be output in any suitable manner and in any suitable form, including but not limited to output to another computer system or to a display device.
The different forms of output and display may correspond to different output requirements. For example, a healthcare payer may need an output that includes the cost of not treating a patient and/or the cost savings of treating a patient. The healthcare payer may need an output comparing the benefits of the different treatments, which shows the threshold S for the patient treated under given constraints, such as the budget per treatment or per disease. A healthcare payer or drug developer may need to include and/or evaluate the output of the therapeutic benefit in the simulated population of interest, or compare the output of the population of interest. A researcher or drug developer who is evaluating biological targets for a drug as a future target may need to include a ranked list of changes or an un-ranked list, as well as an output of NEA for each change or biological target or therapeutic target.
In one example, a list of ranked or non-ranked treatments may be returned with their number of avoidance events for each treatment in a population of individuals, optionally with their confidence intervals. In a second approach, a ranking method may be used. For example, treatments may be ranked according to NEA or cost per avoidance event or size of the target population (i.e., number of individuals above a threshold for a given budget). When applied to a target or drug discovery method, the output may include a ranked list of biological targets according to, for example, the NEA of the biological target.
Recipients of the output, such as physicians, laboratory workers, researchers, drug developers, or healthcare payers, may define the method of ranking/ranking. The recipient then has the opportunity to determine a threshold point on the list that determines which individual in the simulated population of individuals receives or does not receive treatment.
The output may be of any suitable type. Generally, the alphanumeric output allows, for example, providing the user with a number of avoidance events and/or a cost graphic based on the number of avoidance events, or an indication of whether to treat the patient. Table 2 herein shows an example comparing the treatment of hyperlipidemia in a real-world legal population, showing NSE, unit cost, associated risk, risk threshold, etc. for several statin drugs. Thus, the risk threshold S defines the population of the population that has received each treatment.
In one embodiment, the patient descriptor used as input describes each of the plurality of individuals using the age, gender, race, biomarkers, medication, and previous medical history of the individual. For each individual, the method is used to calculate results (e.g., reducing the chance of myocardial infarction), cost differences as a result of treatment, cost of treatment (e.g., medications, tests, and visits), and cost of non-treatment (MIs, stroke, etc.). The ranking may be used to address the individuals who will receive the most improvement in each monetary unit spent. In an embodiment, the treatment will receive the individuals with the most improvement in dollars per cost. Examples of medical interventions are, but not limited to, blood pressure, glycemic control, smoking, weight loss, blood tests, and case management (e.g., for congestive heart failure).
Examples of other approaches include display and/or ranking of treatment descriptors that have an effect on the number of avoidance events, based on variable X, such as a significant biomarker or patient descriptor.
Optionally, simulated individuals corresponding to an average (fictitious) patient are generated by averaging patient descriptors across a virtual reality population or a population of interest in any manner, thereby accounting for patient descriptors associated with benefit size, wherein all individuals of the population receive treatment.
Alternatively, the user may run a patient simulation for a plurality of treatments T and display in graphical form the benefit the patient will receive for each of the plurality of treatments compared to the results that would be received if the patient did not receive any medication treatment (or treatment with a reference treatment). Such a display would illustrate the benefits for each treatment achieved for the patient.
2.2 example of graphical display
In one embodiment, the therapeutic benefit for the population of interest may be presented in a graphical output. The user can run a simulation for treatment T in a simulated population of individuals and display the benefits achieved by the application method for this population. Optionally, one or more individual patients may be presented and identified within the population to account for the benefits received by the patient compared to the population.
In one example, the therapeutic benefit in the population or for individual patients is shown as a scatter plot with axis Rt and axis Rc in the plot, as shown in fig. 19, for therapeutic benefit with ivabradine. The resulting graphical display in this manner is particularly effective because the two axes show the quantitative effect of the treatment. The graphical display is also useful in personalized medicine for physicians and/or patients to indicate where a patient falls within the population, e.g., whether the patient is in a group with higher therapeutic benefit, or whether the patient is below a threshold S.
3.0 functional overview
3.1 portability study 1
The invention can be used to explore the portability of clinical results (e.g., clinical trials, from standard clinical practice) of treatment T to different patient populations, e.g., prior to marketing treatment T to an individual population.
Fig. 7 shows such a method of estimating portability according to the invention. In this embodiment, clinical outcome portability across an individual population is estimated. Generating an effect model describing the therapeutic benefit (Rc-Rt) achieved with the therapy (T), wherein the therapeutic benefit (Rc-Rt) is described as a function of a risk Rc (e.g., a risk of occurrence of a health event) and the variable (X). The therapeutic benefit as a function of risk in the simulated population of individuals of interest is then calculated, yielding a population avoidance event number (NEAt).
The therapeutic benefit in the simulated population may then be output and, for example, displayed. This information can be used to evaluate the contribution of the population descriptors (patient parameters and variables X) to the effectiveness model and/or the number of avoidance events. For example, the user may modify the population descriptor of the simulated population, recalculate the NEAt, and evaluate whether the modification has an effect on the NEAt. In one embodiment, the system may be configured to calculate and/or display the NEAt in a plurality of simulated populations of individuals such that the user may identify or be calculated and displayed by the system the most appropriate simulated population of individuals.
This configuration also has the following advantages: by translating the therapeutic benefit to a population of interest (e.g., a population within a national healthcare system, a population covered by healthcare payers), a user may consider all resources available for group therapy (e.g., financial, quantity of medical products), or more typically all resources for a particular health condition within a population, or all resources for a particular therapy within a particular population. The user may also consider, for example, the risk of serious side effects. By partitioning resources among the population, the user can estimate the threshold at which treatment loses its added benefit. Thus, the user can set a threshold level of benefit (calculated using the individual's parameters and variable X and the risk factor) at which treatment is no longer beneficial, for example, as compared to an alternative without treatment or alternative treatment.
At block 704, clinical results are received from the database of clinical results 703 and stored, and function(s) describing the risk of an outcome of interest (e.g., the frequency of adverse health events) described as a function of individual parameters (X) and variables and a risk factor (Y) are generated for the individuals in the population. The above function is generated by using the clinical results received from 703 and comparing individuals who are or are not under treatment and deriving a function describing the number of occurrences of events as Rc and X. The resulting function evaluates the efficacy model of the possible treatment, i.e. the function that gives the benefit Rc-Rt = f (Rc, X) for each individual of the population.
At block 705, the number of times of avoiding the occurrence of events (NEAt) in the simulated population of block 701 treated with the drug is aggregated by applying the function generated in block 704 to the simulated population of individuals 701 and aggregating the number of events, the function generated in block 704 describing the risk of the outcome of interest when the individual is treated with the drug as a function of the individual parameters (X) and variables and the risk factor (y). The results are expressed as the number of events occurring in the simulated population (NEAt) and calculated using the formula NEAt = ∑ (Rci-Rti).
An indicator that displays the benefit of the medication. Displaying the indicator to the user may include displaying NEAt. An example of the display format is shown in table 2.
In one embodiment, the system may be configured to calculate and/or display the NEAt in multiple simulated populations of individuals, e.g., so that the user may identify or be calculated and displayed by the system the most appropriate simulated population of individuals.
Prediction of the number of occurrences (deaths) in France avoided by statins
A simplified example of a portability study is performed as follows. Efficacy of different statins in preventing death was predicted in a population of simulated individuals using efficacy models derived from clinical data obtained from patients from the united states, asia, the uk and other countries. Few french patients are included. The aim of this study was to better identify the target population treated with statins in france and compare the efficacy of different statins.
A meta/meta analysis of the 91 clinical trials identified in the scientific literature relating to different statins was performed. A model-based function is generated for each statin by regression that describes the benefit of treatment with the drug (Rt) as a function of the risk factor Y that accumulates in the risk Rc (e.g., risk of mortality).
The benefit of treatment with the drug as a function of risk in the simulated population of the individual of interest is then calculated using the effects model. And constructing a simulation group of the individuals by using parameters corresponding to the French population. The french human virtual reality community integrates correlations between known french infectious diseases and variables to provide a realistic representation of the french human community as infectious disease information evolves. The number of avoidance events (NEA) for this population was calculated using the following formula:

where f (rc) is the distribution of risks in the french population (in this example, the simulated population representing it), and s is the threshold above which resources (the health budget for all statins) are sufficient for the individual to be treated.
Based on the cost of each statin, and by applying external constraints, in this case attribution or attribution of financial resources for cardiovascular disease prevention, the efficacy of the different statins may be ranked in order to identify a target group of individuals corresponding to each statin.
The results are shown in table 2 below. The time period considered by the study was one year. The health care budget for statins is billions of euros per year. RR is the relative risk of the effect model summarizing statins, which in this example was found to be a linear multiplicative model. The threshold s is defined by an iterative calculation such that the total treatment cost corresponds to the healthcare budget. The cost per avoidance event (death) is also shown. As a result, the efficacy of statins can be estimated by considering NEA and the cost savings per avoidance event.
Table 2

3.2 assessment of biomarkers l
The present invention may be used to identify and/or assess biomarkers, e.g., biomarkers of disease, e.g., biomarkers indicative of disease state, disease progression, etc., and/or biomarkers of treatment, e.g., biomarkers indicative of the benefit of treatment (T).
In one embodiment, the system and method of evaluating or identifying biomarkers follows the general configuration shown in fig. 7 discussed in the context of the method of estimating portability herein.
Generally, biomarkers are evaluated by estimating the contribution of population descriptors (parameters and variables of the patient) to the efficacy model and/or the number of avoidance events. Variables that modify the efficacy model and/or the number of avoidance events can be designated as biomarkers, such as biomarkers for a disease or biomarkers for therapeutic benefit.
For example, the systems and methods generally include:
(a) providing one or more real or simulated treatments (T), wherein each treatment (T) is associated with an effect model function, for example by receiving the function and a treatment identifier as inputs, or in a step of deriving the function from input information about the treatment, preferably the function describes the therapeutic benefit (Rc-Rt) as a function of the risk without treatment (Rc) that depends on a variable (Y) and a variable (X), wherein the variable (X) is a vector of individual features other than those contained in the risk without treatment (Rc), and wherein the variables (X) and (Y) may be environment, phenotype or genotype derived variable(s);
(b) providing a patient descriptor for one or more individuals (e.g., a simulated population of individuals), wherein each individual is associated with a risk (Rc) and a variable (X); and
(c) calculating a therapeutic benefit (Rc-Rt) for one or more of said therapeutic Ts in said individual.
The system may then output (e.g., display to the user) an indicator of the therapeutic benefit (Rc-Rt) for the individual(s). The user may then estimate the effect of the variable on the therapeutic benefit (Rc-Rt) for one or more individuals. The variable associated with the therapeutic benefit indicator may be designated as a biomarker.
Alternatively, the computer-implemented system may be configured to directly evaluate the biomarkers. In this configuration, the system can estimate the effect of the variables on the therapeutic benefit (Rc-Rt) for one or more individuals and output identifiers corresponding to the one or more variables, optionally along with an indicator of their effect on the therapeutic benefit, or according to any predefined criteria (e.g., minimum effect, effect related to therapeutic benefit threshold). The variable associated with the therapeutic benefit indicator may be designated as a biomarker.
Preferably, estimating the effect of a variable on the therapeutic benefit (Rc-Rt) would include generating a population of individuals with different patient descriptors, wherein the descriptors and/or substantially all combinations of their values are represented, and determining which parameters are associated with increased therapeutic benefit.
In one embodiment, the variable affecting the benefit of the treatment is a second variable, X, and the biomarker is determined to be a biomarker indicative of a response to the treatment (T).
In one embodiment, the variable affecting the therapeutic benefit is the second variable Y, and the biomarkers are determined to be biomarkers indicative of disease without (independent of) treatment (T). For example, a biomarker may indicate disease status, progression, severity, and the like.
Optionally, the method further comprises performing an assay to detect the biomarker in a biological sample from the patient, e.g., an authentic person. Such a detection step may be used to obtain data regarding the values observed for the biomarkers and incorporated into the systems and methods of the present invention as patient descriptors. In another aspect, the detecting step can evaluate a patient receiving treatment (T). For example, a biomarker may be determined as the presence or level of a particular cell or biological component (e.g., the presence of a genetic polymorphism or allele; the level of protein in a tissue), and an in vitro test is performed on a biological sample obtained from an actual patient, which test is designed to detect such a biological component.
As shown in fig. 7, an effect model is generated that describes the therapeutic benefit (Rc-Rt) of treatment (T) as a function of risk Rc (e.g., risk of occurrence of a health event) and variable (X). The therapeutic benefit as a function of risk in a simulated population of the individual of interest is calculated, yielding a number of avoidance events (NEAt) for the population. The therapeutic benefit in the simulated population may then be output and displayed, for example. This information can be used to estimate variables by evaluating the contribution of population descriptors (patient parameters and variable X) to the efficacy model and/or the number of avoidance events. Advantageously, the user can modify the population descriptors of the simulated (or real) population (or select only certain populations or certain members of the population with specific descriptors), recalculate the NEAt, and evaluate whether the modification has an effect on the NEAt. For example, a population descriptor contained in variable X that results in an increase in NEAt for a population may be identified as a biomarker associated with a positive response, where a positive response is a positive response to treatment (T). Those descriptors that are relevant to the impact on NEAt may be designated as biomarkers. When a biomarker is associated with variable Y, the biomarker can be assigned as a biomarker that is predictive of disease (e.g., disease state, progression, severity, etc.). When a biomarker is associated with variable X, the biomarker may be designated as a biomarker that predicts response to treatment (T) (e.g., indicates a disease state after treatment, progression under treatment, severity or improvement of symptoms, or any other disease parameter under treatment, etc.). However, since Rc-Rt and the number of avoidance events NEAt correlate with Rc, the biomarkers from Y can also predict patients that will respond to treatment.
Advantageously, such biomarkers associated with variable X may be designated as biomarkers for patients predicted to be responders to treatment (T). Optionally, the method includes determining or providing a threshold of therapeutic benefit (Rc-Rt) and estimating for the population an effect of the variable on the threshold of therapeutic benefit (Rc-Rt). When a biomarker is associated with variable X, the biomarker is designated as a biomarker that is predictive of response to treatment (T). When a biomarker is associated with variable Y, the biomarker may be designated as a biomarker that is predictive of response to treatment (T) and disease state.
In one embodiment, the system may be configured to calculate and/or display a therapeutic benefit or NEAt in a simulated population of individuals such that a user may identify descriptors that have a significant impact on the therapeutic benefit or be calculated and displayed by the system. In one embodiment, such descriptors (i.e., biomarkers) are associated with an identifier (e.g., the name of a gene or protein, etc.) and the identifier is output, preferably displayed.
At block 704, clinical results are received from the database of clinical results 703 and stored, and function(s) describing the risk of the result of interest (e.g., the frequency of adverse health events) are generated, which describes the risk of the result of interest as a function of individual parameters (X) and variables, and a risk factor (Y). The above function is generated by the following steps: the clinical results received from 703a are utilized and the individuals are compared, with or without treatment, and a function is derived that describes the number of event occurrences as a function of Rc and X. The resulting function estimates the model of the effect of the potential treatment, i.e. a function that gives the benefit Rc-Rt = f (Rc, X) for each individual of the population.
At block 705, the number of occurrences of avoidance events (NEAt) in the simulated population of the block 701 that was treated with the drug is aggregated by applying the function generated in block 704 to the simulated population of individuals 701 and aggregating the number of events, where the function generated in block 704 describes the risk of the outcome of interest when the individual was treated with the drug as a function of the individual parameters (X) and variables and the risk factor (Y). The result is expressed as the number of events occurring in the simulated population (NEAt), calculated using the formula NEAt = =Σ (Rci-Rti).
3.3 use of pathophysiology in transplantability exploration and biomarker assessment
The invention can also be used to explore the portability of clinical outcomes (e.g., clinical trials, from standard clinical practice) of treatment T for different patient populations, e.g., before treatment T is marketed in one individual population (fig. 8) or in several populations (fig. 8 bis). The method can also be used to simulate clinical trials. The method is useful in predicting the benefit of treatment T in a target population, e.g., determining whether the treatment is beneficial as compared to no treatment or alternative treatment, determining whether the treatment is cost-effective, etc. The method can also be used to identify patient variables (descriptors) that can be used as biomarkers, as detailed in section (b).
(a) Test portability and simulation
FIG. 8 illustrates a first method of estimating portability in accordance with the present invention. In this embodiment, which estimates the portability of clinical trial results across an individual population, the trial results and pathophysiological models run during preclinical and clinical progression for a treatment of interest are used as input to a simulation of pharmacology and drug effects on the pathophysiological model in vivo (formal treatment model) to ultimately obtain a function describing the drug effect (e.g., number of event occurrences). It should be understood that in some embodiments, the clinical trial results or the pathophysiological model may be used alone as the sole source of input, or both may be used as input sources. The function describes the benefit of treatment with a drug as a function of the risk Rc (e.g., the risk of a health accident occurring) and the variable (X). Next, the benefit of treatment with the drug as a function of patient descriptors in the virtual population is calculated for the simulated population of the individual of interest, yielding a number of avoidance events (NEAt) for the population. The output from the simulation gives the patient descriptors for treatment and adjustment of NEAt.
Then, therapeutic benefit can be shown. This information can be used to assess the contribution of population descriptors (patient parameters and variables X) to the efficacy model and/or the number of avoidance events. For example, the user may modify the individual descriptors of the simulated population, recalculate the NEAt, and evaluate whether the modification has an effect on the NEAt.
In one embodiment, the system may be configured to calculate and/or display the NEAt in multiple simulated groups of individuals so that the user may identify the most appropriate simulated group of individuals or be calculated and displayed by the system (see FIG. 8 bis).
Inputs from pharmaceutically available evidence are received, stored and provided to the pharmacological model 801, wherein the inputs include drug exposure 802 in animal models and humans, experimental results from, for example, drug candidates, drugs that have been tested in clinical trials, marketed treatments. The inputs typically include information describing the taking of the drug in amounts per dose, timing and cumulative amounts, as well as pharmacokinetic and pharmacodynamic information of the drug observed in clinical use.
The pharmacological model 801 includes a stepwise calculation describing the effect of a drug on a pathophysiological system (e.g., pathophysiological model) as shown in fig. 5. The final function(s) describing the effect of the drug on the disease mechanism and/or side effects is/are called z and is/are input to block 803.
At block 807, the function generated at block 806 describes the risk of an outcome of interest when an individual is treated with a drug as a function of individual parameters (X) and variables and a risk factor (Y) by applying the function generated at block 806 to the simulated population 805 of individuals and aggregating to obtain the number of avoided event occurrences (NEAt) in the simulated population in block 805 for drug treatment. The results are expressed as the number of events occurring in the mock population (NEAt). The NEAt can be calculated using the formula NEAt = ∑ (Rci-Rti). At block 808, an indicator of the benefit of treatment with the drug is output or displayed, e.g., NEAt is displayed.
This information can be used to assess the contribution of population descriptors (patient parameters, including variable X) to the effectiveness model and/or the number of avoidance events. For example, the user may modify the population descriptor of the simulated population, recalculate the NEAt, and evaluate whether the modification has an effect on the NEAt. Thus, patient descriptors that contribute to NEAt can be identified as biomarkers, the measurements of which can aid in selecting a target population.
(b) Biomarkers
FIG. 8 may also provide a general process for identifying and evaluating biomarkers. As in part (a), the test results and pathophysiological models run during preclinical and clinical progression for a treatment of interest are used as input for the simulation of pharmacology and the effect of the drug on the pathophysiological model in vivo (formal treatment model) to finally obtain a function describing the effect of the drug. The function describes the therapeutic benefit of using a drug as a function of the risk Rc (e.g., the risk of developing a healthy disease) and the variable (X). The pathophysiological model comprises components and/or interrelationships between components, which components or interrelationships represent patient descriptors (in particular descriptors for variables X and Y), which are thus candidate biomarkers. Since the pathophysiological model provides such descriptors, a simulated population of individuals is generated from the pathophysiological model. Individuals in the population have different patient descriptors, and all combinations of descriptors (e.g., different values for a particular descriptor) are substantially represented. Next, the benefit of treatment with the drug as a function of patient descriptors in the virtual population is calculated for the simulated population of individuals of interest, yielding a therapeutic benefit for each individual and/or a number of avoidance events (NEAt) for the population. The system or user may then identify that the parameter is associated with increased therapeutic benefit for the individual or population (including sub-population).
The method may be implemented as shown in blocks 801 through 804, as described in section (a). At block 805, a simulated population of individuals is provided or generated from the pathophysiological model. The pathophysiological model (block 803) is applied to a simulated population of individuals, where the parameters of the pathophysiological model are assigned to the variables X and Y. Individuals in the population have different patient descriptors, and all combinations of base descriptors (e.g., particular descriptors have different values) are represented. Block 806 is performed as in part (a).
At block 807, a value Rc provides a result for each individual in the simulated population of blocks 805 that is obtained by applying the function generated in block 806 to the simulated population of individuals 805, wherein the function generated in block 806 describes the risk of the result of interest when the individual is treated with the drug as a function of the individual parameters (X) and variables and the risk factor (Y). Patient descriptors that affect Rc can be ranked and identified as biomarkers. Then, the process is carried out. Biomarkers can be used in any method in which biomarkers are useful for research, medical product discovery, and development, e.g., measurement of biomarkers can aid in selection of target populations, or more generally, in predicting medical care.
3.4 target evaluation method
FIG. 9 illustrates a method of evaluating a biological target according to the present invention. The method is also suitable for virtual drug screening where each change in the target or any combination of targets is considered a drug, and for each drug the model can optionally further incorporate PK and PD parameters and the model. In this embodiment, the invention uses the input of a pathophysiological model. Drug screening methods involve the implementation of two major simulations. In a first step, a pathophysiological model provides information about the risk of Rc (e.g., the risk of occurrence of a health event) and the variables (Y) that regulate Rc in a simulated biological system (e.g., simulated individuals, tissues, etc.), and then, the number of events (e.g., the number of occurrences of a health event) in a simulated population of individuals is determined. In a second step, the pathophysiological model provides therapeutic benefit as a function of risk and variable (X) when the phenomenological components of the biological target (e.g., biological component) or disease model are modulated in the simulated biological system. The benefit as risk and variable (X) in the virtual population is then calculated for changes in biological targets, yielding a population for the number of events. The calculation of the benefit of changing a biological target may be repeated for any number of biological targets in the pathophysiological model. When adjusting a biological target, the benefit may be expressed, for example, as the number of health events avoided, such that the targets may be compared against their capabilities to reduce the number of events, thereby identifying the target with the greatest potential medical benefit.
At block 901, input is provided from a pathophysiological model, in this example a simulated biological system, which itself has been received or generated using experimental results, for example, from scientific publications stored in a database (block 902). The simulated biological system is associated with a patient descriptor (Y), a risk factor describing the risk of an outcome of interest (e.g., the frequency of adverse health events), and possibly some or all of the descriptors (X).
In a first step, the pathophysiological model is used to establish a base risk in the simulated population in the absence of changes in biological targets in the pathophysiological network to be assessed. Thus, the pathophysiological model is typically configured to provide input for settings representative of the real population to be treated. For example, the input may represent an individual who has not undergone any treatment. In another embodiment, the input may represent an individual who is undergoing standard therapy to which a hypothetical therapy that adjusts the biological target to be evaluated is added.
At block 903, input is provided from the analog group of individuals. The input provides a simulated population of individuals, wherein each individual in the population is associated with an individual parameter (X) and risk factor(s) Y.
At block 904, the number of occurrences of the health outcome of interest (e.g., the frequency of adverse health events) is then calculated for the simulated population of individuals in block 903. The number of occurrences will represent the control value that will be used for comparison with the number of occurrences under the hypothetical treatment. The calculation of the number of occurrences comprises inputting individual parameters (X) and variables and a risk factor (Y) for the population, applying a function describing the risk of the outcome of interest provided by the pathophysiological model, and calculating the total number of occurrences, called the number of events. The number of events, referred to as the event control number (NEc), may be expressed using the formula: NEc =Σ Rci calculation.
Optionally, NEc may be compared to data generated in real individuals in order to assess the accuracy of the calculations. The assessment is typically in a confirmed population of individuals for which the individual parameters (X) and variables and the risk factor (Y) are known. Whether by selecting data from a validation population that matches the simulation population, or by generating a simulation population that is similar to the validation population, the validation population and the simulation population will typically be as close in character as possible. Optionally, a step of adjusting the parameters or the pathophysiological model structure is carried out such that the accuracy of the model in the predicted health occurrence is improved.
The assessment of the benefit from altering one or more biological targets is initiated by simulating the alteration of one or more targets in the pathophysiological model. At block 905, input representing one or more changes to the biological network, represented as potential treatments T, is provided by the pathophysiological model. There may be as many treatments T as there are target changes or combinations of target changes.
The pathophysiological model may provide input for all or a subset of the biological targets represented in the pathophysiological model, so that the benefit of changes to all targets is accounted for, or so that the user subsequently selects the target to be evaluated. Alternatively, the user may provide input at this stage via the input device, selection of one or more targets in the pathophysiological model to be evaluated.
For each target, the pathophysiological model provides information that can be used to calculate the benefit as a function of risk and variables (X) in the population as the target changes. In general, for each change in the target, the pathophysiological model is associated with individual parameters (X) and variables and a risk factor (Y) describing the risk of the outcome of interest (e.g., the frequency of adverse health events).
At block 906, input is provided from the analog population of individuals. The input includes a simulated population of individuals, wherein each individual in the population is associated with an individual parameter (X) and a risk factor Rc.
At block 907, the benefit of altering each target is calculated for the individual simulation population using the effects model. In this step, the benefit of changing targets is described as a function of the risk factor (Y) and the vector of individual features (X) other than those included in Rc, the function associated with each target being used to calculate, for each target, the number of occurrences of the outcome of interest (e.g., the frequency of adverse health events) in the individual simulation population of block 906. Individual parameters (X) and variables for the simulated population and risk factors (Y) are input into the functions provided for each objective. The output is the risk of event associated with changing each target. The total number of occurrences, referred to as the number of events, is calculated using the formula new target =Σrtarget.
The number of occurrences of health events associated with a change in a target or combination of targets is estimated and compared to the number of occurrences when the target is unchanged (referred to herein as NEc), thereby providing information as to whether the target has a value that regulates the progress of its therapy. This assessment is typically performed by making calculations that provide a target assessment, or by outputting or displaying benefits (NEA) in the simulated population to the user. The function is an effect model associated with a change in the target.
At any appropriate stage, the benefit as a function of risk and variable (X) may be output. Such output may include outputting (e.g., outputting and displaying on a display device) the number of occurrences of the health event when the goal changes, such that the user may evaluate the goal based on the number of occurrences of the health event. In one example, output NEtarget; in one example, output NEAtarget and NEC; in one example, a changed number of avoidance events (NEA) for the biological target is output. According to the formula nettarget = ∑ (Rc-Rtarget), NEA provides the number of avoidance events when the target is changed compared to NEc (block 908 of fig. 9).
When assessing the impact of a target that is likely to be a therapeutic target for improvement of adverse health events in a disease, a change in the target associated with a lower number of occurrences of health events than NEc would indicate that the change in the target is beneficial for health and that the target has a value that is a target for therapeutic intervention. In one embodiment, the number of avoidance events (NEA) may be displayed for the target.
Alternatively, the targets may be selected or ranked based on one or more criteria, such as the number of occurrences of health events avoided when changing the targets. In one example, the method may further include calculating, displaying, and/or selecting a goal and/or combination of goals that maximizes the number of avoidance events.
Alternatively, the benefit of changing the target may be compared to the benefit of existing treatments that adjust the same or different targets. In one example, NEAtarget is compared to the known number of events avoided by marketed therapies. The number of events that are known and/or have been avoided by marketed treatment can be obtained as described herein by generating an effect model, e.g., based on clinical data, and applying the effect model to a simulated population of individuals and calculating the number of avoidance events.
Targeted assessment in stroke
A simplified example of a target evaluation study was conducted as follows. Later, over 300 drugs that were active in animal models of acute cerebrovascular disease onset were found to lack activity or even have side effects or toxic effects in human clinical trials. The model is used to evaluate different biological targets in order to predict whether their modulation is beneficial for reducing the risk of stroke, as well as to compare expected effects in rodents and humans.
The general scientific knowledge is used to construct a pathophysiological model of the major early pathophysiological mechanisms of acute cerebrovascular attack, which integrates phenomenological and mechanical models as well as phenomenological models. This model is a two-scale model and relies on a set of ordinary differential equations. We created two versions of this model (for human and rodent brains) that differ in white matter and glial cell ratio. The inputs to the pathophysiological model include distinguishing blood flow (degree of ischemia) and brain features between mice and humans. The outputs of this model are the apparent diffusion coefficient of water (rADCw), the death rate, the penumbra or viable cells (nerve cells or stellate cells), and the ionic concentration of ATP. The model was constructed using physical laws such as conservation of energy, current, and extensive review of scientific literature on the mechanisms and consequences of cerebral ischemia. The basic approach is to generate sub-models and variable levels of integration depending on the sub-models, with the level of integration determined by recent targets and thus changing during the process.
Stroke is a dynamic process in which pathophysiology occurs in overlapping stages over time, each stage having its own time scale ranging from microseconds to weeks. At time 0, an interruption of blood flow occurs, cutting off the oxygen supply and nutrients to the brain cells, and defining the onset of ischemia. An overall stroke model is constructed to take into account the major mechanisms in stroke. The results obtained below relate to the period of acute stroke (first 3-6 hours). During this time, the ion phenomenon dominates, and the cells necessarily die due to edema caused by the stopping or slowing of ion exchange (after which water flows into the cells). The entire model is shown in fig. 3. Integrated into this model is a sub-model of the ion phenomenon, which is shown in fig. 4. These early processes determine a good portion of the anatomical damage observed in human brain images, as well as acute and subacute mortality rates. The common pathway leading to cell death and tissue damage is edema, which can be detected by the biomarker rADCw or the apparent diffusion coefficient of water, which can be observed by MRI. Thus, the ionomeric model includes various ion channels, and describes ion exchange in cells, with edema given as output, expressed by rADCw.
An exemplary mathematical formula for calculating an ion model is as follows.
The variation in ion population in a compartment (e.g., cell(s) or subcellular structure (s)) is equal to the total ion flux across the membrane of that compartment plus the ion diffusion between compartment elements:

(Ns,i: the number of ions s in compartment i; n isi: the number of cells in each subunit; j. the design is a squares,i,kFlux of ions s through the membrane of compartment i αs,i: diffusion coefficient of ions in compartment i between subcells; cs,i: ion concentration in compartment i)
The diffusion was calculated using the laplace equation:


(si: the surface of the compartment i film; i iss,i,k: current of ions s passing through the membrane of cell i; a conveying device k having a surface unit; z is a radical ofs: the valency of the ion s; f: faraday constant)
The change in the amount of ions in the extracellular space is obtained by summing the ion flux across neurons and glial membranes. This equation is derived from the law of conservation of species for each ion species.

Delayed rectified potassium channel (KDR):
IKDR=10-3gKDR.m2.h.(Vm-EK) And and
and wherein
 And
And
high conductance voltage and calcium dependent potassium channels (BK):
IBK=10-3gBK.m.(Vm-EK) And persistent sodium channel (NaP):
INaP=10-3gNaP.m.(Vm-ENa)


wherein Wherein
 And
And and
and wherein
 And
And delayed access to the current potassium ion channel (Kir):


the input to the submodel of figure 4 is ATP and five currents are simulated, representing the functioning of the ion channel, pump or potassium exchanger. The output allows one of various variables of the model to be observed at a time. One or more biological targets (i.e., ion channels, pumps, or potassium exchangers) can be altered by decreasing their activity.
FIG. 11 shows an example of sodium channel (NaP) being blocked in the model; the figure shows the effect on edema over time in minutes (expressed as rADCw values, typically biomarkers of brain cell death due to edema). It can be seen that blocking the sodium channels has only a modest effect on edema and thus on cell death. Figure 12 shows the effect of sodium channel blockage in humans and rodents, providing a possible explanation for drugs that are effective in rodents and not in humans; the figure shows three areas consisting of healthy cells (solid line), penumbra (dashed line) and invaded or dead (dotted line) for a period of 40 minutes after the use of the NaP blocking agent in rodents (left panel) and humans (right panel), respectively. Rodent and human brains differ in various characteristics including the ratio of astrocytes and white matter; in rodents, penumbra coverage is about 95% but only 20% in humans.
This sub-model may further be integrated into a broader pathophysiological model including a complementarity model (fig. 3) and cell death or other outcomes, or may be used alone when edema is used as the event of interest. The model is run with different parameters of the variables (e.g. here blood flow (degree of ischemia) and brain features that distinguish rats and humans) and changes in one or more ion channels, e.g. to blunt the channel, to select events of interest, and then an effect model function is generated from these data in order to predict the occurrence of events of interest (e.g. edema, cell death). Generating individual simulation populations with different parameters for variable blood flow and brain features, i.e., generating populations comprising both humans and mice, and determining NEc by running the models on the individual simulation populations and aggregating occurrences of events of interest (e.g., meeting the rADCw threshold or infarct area or volume threshold, or certain infarct areas, or clinical events such as death or residual disorders). Indicating that mice were used for comparative purposes only. Next, the benefit of altering each ion channel target or combination thereof is calculated for the individual's simulated population using the effects model, and the sum of the occurrences of events of interest is neacalculated (nea). Comparing NEc and NEA for each change in ion channel (i.e., calculating NEA); if NEA is significantly below NEc and thus traverses individuals with characteristics of the human brain, it is predicted that drugs that block one or more ion channels may be of benefit in human therapy.
3.5 monitoring progress
Monitoring progress may include any process of receiving pharmacological information for a treatment of interest (e.g., a drug) and the user's desire to predict the benefit of such treatment.
Fig. 13 illustrates a first method of monitoring drug development according to the present invention. In this embodiment, the present invention uses input from pathophysiological models and input from drug development, e.g., experimental results from drug candidates, drugs that have been tested in clinical trials, treatments that are put on the market (i.e., formal treatment models that are updated with all available data on the treatment). The method comprises in a first step performing a simulation of the in vivo pharmacology of the drug and the effect of the drug on a pathophysiological model in order to finally obtain a function describing the effect (e.g. the number of occurrences) of the drug. The simulation results in a function that describes the benefit of treatment with the drug (Rc-Rt), which is described as a function of the risk Rc (e.g., the risk of the occurrence of a health event) and the variable (X). The benefit of treatment with the drug as a function of risk (e.g., variable Y) and variable X in the virtual population is then calculated, yielding a number of events for that population. This number of events can be compared to the number of events observed in a mock population not treated with the drug (NEc), and the number of events avoided with drug treatment (NEAt) calculated. The benefit of modulating the biological target may be displayed in any suitable manner, such as displaying the NEAt in alphanumeric or graphical form. The user may also obtain additional information to design the experiment; thus, the method may comprise the step of identifying or ranking variables (X) and (Y) that cause uncertainty or variability in NEA.
A graphical or graphical display juxtaposing the uncertainty range of all parameters in the formal treatment model and the corresponding range of uncertainty of the NEAt given by the simulation allows identification of a parameter or set of parameters that contributes to the highest proportion of uncertainty in the NEAt prediction. The other display shows the prior distribution of the formal treatment model parameters and the corresponding prior distribution of NEEt, rather than just the range. These previous distributions are actually later distributions that follow experiments performed at the end of previous steps of drug development. In the current step, off-the-shelf experiments can be designed to optimize uncertainty reduction in the NEAt prediction.
Inputs are provided to the pharmacological model (block 1301) from the development of the drug (block 1302), e.g., experimental results from drug candidates, drugs that have been tested in clinical trials, treatments that are put on the market. The inputs typically include therapy descriptors such as amount per dose, timing of administration, and cumulative total amount. Optionally, any available pharmacological or pharmacokinetic information may be additionally entered.
The pharmacology model (1301) includes stepwise calculations describing the effect/impact of a drug on a pathophysiological system (e.g., pathophysiological model), as shown in fig. 5. The final function(s) describing the effect of the drug on disease mechanisms and/or side effects is called z and is input into a block of pathophysiological models (1303) which themselves have been received or utilized, e.g. experimental results (1304) from scientific publications stored in databases are generated. Inputs from the pharmacologic model are processed in the pathophysiological model to produce a signal that outputs a probability of an event occurring (e.g., whether an event occurred) as a function of the parameter (X) and the risk factor (Y).
At block 1305, input is provided from an analog group of individuals. The input comprises a simulated population of individuals, wherein each individual in the population is associated with an individual parameter (X) and risk factor(s) (Y). The parameter (X) and risk factor(s) are obtained from the pathophysiological model (1303) or can be specified by the user from known information. At block 1306, an effect model is generated from the output of the model of block 1303.
At block 1307, the output of the pathophysiological model of block 1303 may be used to calculate the underlying risk in the simulated population in the absence of drug, expressed as the number of event occurrences (NEc) in the simulated population. As a result, the pathophysiological model is typically configured to provide input for settings representing the real population to be treated. For example, the input may represent an individual who has not undergone any treatment. In another embodiment, the input may represent an individual who is undergoing standard therapy, which may be added with therapy T.
At block 1308, the function generated at block 1306 is used to calculate Rt for each individual of the simulated population, and the aggregate Rt, expressed as the number of event occurrences (NEt) in the simulated population. The function(s) from block 1306 describe the risk of an outcome of interest (e.g., the frequency of adverse health events) as a function of individual parameters (X) and variables and a risk factor (Y) applied to the input from the individual's simulation population 1305 by applying an effect model function with the function(s) from block 1306 to aggregate the number of event occurrences, or by comparing (NEAt) and (NEc) to calculate the number of events avoided with therapy NEAt.
At block 1309, an indicator of the benefit of the medication is displayed. Displaying the indicator to the user may include displaying the NEAt on a display device.
The user may then use the displayed information, for example to gather information by conducting experiments, or to plan experiments that can be used to reduce uncertainty about the number of events occurring under medication.
Prediction of angina pectoris drug efficacy
Method of producing a composite material
A simplified example of a study to monitor progress is carried out as follows. The efficacy of a hypothetical cardiotonic that reduces heart rate in preventing angina attacks was predicted in a simulated population of individuals using a pathophysiological model of angina. Angina pectoris is a chest pain caused by myocardial ischemia, usually caused by a blockage or spasm of the coronary arteries. The purpose of this example is to help drug developers choose between once or twice daily doses of a drug, predict the dose-effect relationship of the drug in this pathology, and provide a model of the effect of the drug as a function of the risk of onset of angina pectoris.
The PK-PD model incorporates a phenomenological model of angina to provide as an output parameter the onset of angina at time t over a 24 hour period. Briefly, a PK-PD model of a drug is constructed using the general scientific and medical knowledge of the model drug, e.g., scientific publications, including its biological targets, here potassium channels. The PK and PD models were calibrated using data from human clinical data for model drugs with two compartments and compartment effects for the parent drug and its major metabolites. In each case of pharmacokinetic equilibrium, the input is one or several drug doses. The output parameter of the PK-PD model was chosen as the heart rate (RR interval) due to the effect of the drug on bradycardia. The heart rate is then used as an input parameter to the phenomenological model.
The phenomenological model is based on a diffuse model, modeled with a series of functional equations starting from a published model of cardiac hemodynamics known as the kappa and Peer models shown in Table 3 below. The coronary artery reserve (CR) at each time t was calculated and compared to the angina gene threshold for each case. The output is the occurrence of angina attacks at time t during 24 hours.
Table 3


Information about 1706 subjects for whom continuous heart rate measurements (RR intervals) and arterial pressure measurements were available on a regular day for 24 hours were used to construct a simulated population of individuals. Therefore, the heart rate varies according to the circadian rhythm and physical activity, etc. Real subjects were transformed into mock individuals by associating a vector comprising new variables representing pharmacokinetic, pharmacodynamic and pathophysiological characteristics with each individual. For example, the variables include two distribution volumes, coronary stenosis degree (d) and Angiogenetic Threshold (AT). The values obtained from the reconstituted distribution of data from the scientific literature were randomly assigned to 1706 simulated individuals.
The effect model of the drug is generated by integrating a pathophysiological model of angina pectoris attacks and a formal treatment model of a pharmacological model of a model drug. The formal treatment model is applied to each individual of the simulated population. Next, a regression technique was applied to clinical trial data obtained by simulating hundreds of clinical trials for each of the studied doses, and an effect model was calculated. For each trial, one group of patients was treated with one dose of the drug and the other group was treated with placebo. The population from which the simulated patients were randomly extracted was based on data from real subjects.
Although one may change the degree of compliance as any patient descriptor, the degree of compliance is assumed to be maximum. The results output from the simulated clinical trials were stored and analyzed using standard statistical methods.
Results
Dose-effect relationship on the number of angina attacks within 24 hours. The results are shown in fig. 14. According to two protocols (one or two administrations per day), when clinical trials with different doses of a drug are simulated in a simulated population of individuals, a Dose Effect Relationship (DER) is predicted, as shown by the lines (including confidence intervals) while the results from the published phase II clinical trials from which clinical data for the hypothetical drug was obtained are shown by the bars.
The computer simulates the effect model of the three doses tested. The results displayed are shown in fig. 15. Each dose produced an effect model with mean values representing the trial (ordered) obtained for a 24 hour period with at least one angina subject frequency bin. As mentioned above, the confidence interval depends on the number of simulations. The three doses tested had different efficacy models. The results indicate that the benefits for angina-prone individuals achieved the greatest benefit (group of patients with 60% chance of having an episode in the 24 hour period), followed by a reduction until severe patients did not exist.
3.6 personalized medicine 1
The invention can also be used for personalized medicine. The present invention provides methods for predicting and/or outputting whether a treatment is beneficial to a patient. The display generated by the effects model function, which shows the benefit of the treatment in the population of individuals (e.g., provided by the function Rc-Rt = f (Rc, X)), is preferably displayed in a graphical format, and it indicates where the patient is within the population based on the factors Rc and X. Such a display is in a format that can advantageously convey to a user, such as a healthcare provider or payer or patient, information of the magnitude of benefit that the patient wishes to experience from the treatment.
Figure 16 illustrates a method of predicting a patient's therapeutic benefit.
At block 1601, a clinical outcome of a treatment of interest is received and stored in a database of clinical outcomes (1602), and a function describing a risk of the outcome of interest (e.g., frequency of adverse health events) for a treated individual or an untreated individual is generated from the clinical outcome, wherein the risk of the outcome of interest is described as a function of an individual parameter (X) and a risk factor (Y). This function estimates the model of the effect of the treatment and can be expressed as a function that gives each individual a benefit Rc-Rt = f (Rc, X).
At block 1603, patient information 1604 is received and stored, for example, from a patient database or from an input device. The patient information will include patient descriptors for individual parameters (X) and variables of the patient and the risk factor (Y). Wherein X and Y are biomarkers that predict treatment efficacy.
An indicator of the patient's therapeutic benefit is then output, preferably displayed on a display device, so that the user can visualize whether or to what extent the patient receives a benefit from the treatment. In one example, the display includes a graphical display that displays the benefits along with other information that helps the user make a decision. The patient may be located and identified as a point in the treated population of individuals.
In one embodiment, the procedure is performed for a plurality of treatments. The method may further comprise selecting and/or displaying for the patient the treatment with the highest predicted benefit, or ranking the treatments or displaying a ranking of treatments based on the predicted benefit of the patient.
Predictive benefits may also integrate cost and similar risk of serious adverse effects; benefits are calculated by integrating the patient's X values and risk factor values into the effects model. A patient with a predicted benefit above a threshold (or between two thresholds) may be said to be a responder to treatment.
3.7 personalized medicine 2
In another personalized medical configuration, the present invention provides the user with the ability to predict and/or display the benefits of treatment for a patient, preferably a real individual, wherein the treatment is transposed to a virtual reality group of interest, for example, to the group to which the patient belongs and where the benefits of the patient of interest are calculated and indicators of such benefits are displayed. The patient's therapeutic benefit is calculated by integrating the patient's X value and risk factor value into the effects model. Alternatively, thresholds for relevant benefits may be calculated by constraining the total population cost and determining the individual with the greatest difference between treatment cost and treatment benefit, where treatment benefit is calculated and substituted into a simulated population of individuals using an effect model based on clinical trial data. Optionally, the method includes the step of determining and/or displaying whether the patient is above or below a threshold, or the step of determining the amount of predicted benefit for or comparing with the predicted benefit for the other members of the population from which the patient was extracted.
This configuration has the advantage of allowing prediction of benefit for a patient in situations where available clinical outcomes are generated for treatment in a population different from the patient's cohort, e.g., patients from different regions or countries having different ethnic origins or otherwise different inheritance, or fewer in number, such that information for certain Rc values, risk factors, and/or X is not available.
This configuration also has the advantage of displacing therapeutic benefits to a population of interest (e.g., a population within a national healthcare system, a population covered by healthcare payers), which a user may consider for a population therapy (e.g., financial), or more generally a particular health condition within a population, or the total resources available for a particular therapy within a particular population. For example, the user may also consider the risk of serious side effects. By differentiating resources among the population, the user can estimate the threshold at which treatment loses its progressive benefit. Thus, the user may set a benefit level threshold (calculated using individual parameters and variables X and risk factors) at which treatment is no longer beneficial, for example, as compared to no treatment or alternative treatment. The personalized medical configuration allows for entry of patient of interest information and calculation of a benefit for the patient of interest; if the benefit is above the threshold, the patient is indicated as being eligible for the particular treatment.
This display interface, generated by an effect model function showing the therapeutic benefit of an individual population, is optionally displayed in a graphical format and indicates the population of lying patients based on factors Rc and X. Such a display interface is a format that can be used to advantageously convey to a user, such as a healthcare provider or payer or patient, information that the patient wishes to benefit from the magnitude of the therapeutic experience. Other display interfaces are provided regarding patients who are not in the population of individuals.
Figure 17 illustrates a method of predicting a therapeutic benefit for a patient. Block 1701 represents the step of providing or generating a simulated population of individuals. The simulated population of individuals is used in conjunction with the function generated in block 1703; it should be appreciated that block 1701 may be placed behind block 1703. Each individual in the population is associated with an individual parameter (X) and risk factor(s) Rc. The parameter (X) and risk factor(s) Rc for the population may be received and obtained from any suitable source, such as from known information about the population of interest 1702, which may be stored in a database or received from an external source or input using an input device. Among X and Y are biomarkers that predict the efficacy of treatment. External constraints, such as the total number of available resources in a health plan assigned to a disease, allow calculation of benefit thresholds for individuals of a population of interest.
At block 1703, clinical results of a treatment of interest are received and stored in a database of clinical results 1704, and an efficacy model is generated from the clinical results describing a risk of the result of interest (e.g., frequency of adverse health events) in the treated individual, wherein the risk of the result of interest is described as a function of the individual parameter (X) and the risk. This function estimates the therapeutic effect model and can be expressed as a function that gives the benefit Rc-Rt = f (Rc, X) for each individual.
At block 1705, a patient descriptor including individual parameters (X) and/or variables and a risk factor (Y) is received, and at block 1706, a therapy expectation benefit (BATp) of the patient is calculated by applying the function generated at block 1702 to the individual parameters (X) and variables and the risk factor (Y) of the patient, and then a therapy benefit indicator may be output or displayed.
The patient's therapeutic benefit indicator is then output, preferably, for example, on a display device, so that the user can assess whether and/or to what extent the patient has achieved a therapeutic benefit. In one example, the display interface includes a graphical display (such as, for example, a scatter plot including Rc and Rt) and points at which the patient is located and identified as being within the treated population of individuals. The threshold and benefit size and Rc may be displayed for the individual.
In one embodiment, the procedure is performed for a plurality of treatments. At block 1707, the therapeutic benefit calculated at block 1706 may be used for personalized medicine. The method may further comprise selecting and/or displaying the highest predicted therapeutic benefit for the patient, or ranking and/or displaying ranked treatments based on the patient's predicted benefit.
In one embodiment, if the patient is expected to benefit from the treatment, personalized medicine includes selecting an appropriate treatment for the patient, e.g., above a benefit threshold, or selecting the best predicted benefit among the plurality of treatments for which benefits are calculated in block 1706. Further, among factors such as a combination of treatment cost and risk of serious adverse effect, a selection may be made based on a threshold generated by combining treatment cost and risk of serious adverse effect. Patients with predicted benefit above the threshold may be said to be responders to the treatment.
3.8 personalized medicine 3
In another personalized medical configuration, the present invention provides a user with a method of predicting and/or displaying a therapeutic benefit for a patient for whom therapeutic clinical outcomes and pharmacologic information are available.
In this embodiment, the method comprises performing an in vivo pharmacologic treatment effect simulation on the pathophysiological model, i.e. in the formal treatment model, to finally obtain a function (e.g. number of occurrences) describing the modified treatment effect. The Formal Treatment Model (FTM) results in a point estimation, i.e. a predicted benefit, of the effect model for this patient. Alternatively, the efficacy model may be updated with clinical trial data of the treatment. Running the FTM results in a function that describes the therapeutic benefit (Rc-Rt) as a function of the risk Rc (e.g., the risk of occurrence of a health event), the variable (X), and the therapy descriptor. In a second step, a clinical outcome of the reference treatment is received and a function describing the effect of the reference treatment at the endpoint is generated. A therapy function is applied to the simulated population of individuals to determine benefit as a function of risk Rc, variable X, and a therapy descriptor. Patient information is then received and integrated into the pathophysiological model, and patient benefit and optionally benefit indicators are determined for each treatment.
Figure 18 illustrates a method of predicting a therapeutic benefit for a patient.
Pharmacological models (1801) are provided with input from treatment progress (1802), e.g., experimental results from drug candidates, drugs that have been tested in clinical trials, treatments that are put on the market. The inputs typically include medication administration information describing the amount, timing of administration, and cumulative amounts per dose. Alternatively, any available pharmacological or pharmacokinetic information may be additionally entered.
The pharmacological model (1801) includes a step-wise calculation describing the effect of a drug on a pathophysiological system as shown in fig. 5. The final function(s) describing the effect of the drug on the disease mechanism and/or side effects is/are called z and is/are input into block (1803), and the pathophysiological model itself has been received or generated using scientific knowledge, for example from scientific publications stored in a database. Inputs from the pharmacologic model are processed in the pathophysiological model and output the likelihood/likelihood of whether an event occurred as a function of the parameters (X) and/or variables and the risk factor (Y).
Block (1805) represents the step of providing or generating a simulated population of individuals. The simulated population of individuals may be used in conjunction with the function generated in block (1806); thus, it should be appreciated that block 1805 is placed behind or in front of block 1806. Each individual in the population is associated with an individual parameter (X) and risk factor(s) Rc. The parameter (X) and risk factor(s) Rc may be specified in any manner so as to represent the population in which treatment is to be assessed. Typically, the individual parameters (X) and risk factor(s) Rc are obtained from data available from scientific knowledge (1804) about the characteristics of the population of interest (e.g., from the scientific and medical literature, as provided by databases, experiments, etc.). In X and Y are biomarkers predictive of treatment efficacy.
At block 1806, clinical results are received, e.g., from a clinical results database (1807), and a function describing the outcome risk of interest for the individuals in the population is generated, which describes the outcome risk of interest as a function of individual parameters (X) and variables, and a risk factor (Y). By comparing the pathophysiological model effects and the formal treatment model effects (i.e. with treatment) 1801 and 1803, an effect model is generated from which is derived, giving a benefit Rc-Rt = f (Rc, X) for each individual. Alternatively, this function may be changed if other clinical applications of the effect model and treatment derived from clinical trials deem necessary. In that case, the final function adjusted according to the empirical effect model is used to predict patient benefit.
At block 1809, patient information including individual parameters (X) and/or variables and risk factors (Y) is received (1808). The expected benefit of treatment (BATp) for the patient is calculated by applying the function generated by block 1806 to the patient's individual parameters (X) and variables and the risk factor (Y). A therapeutic benefit indicator may then be output or displayed. The interval between treatment descriptors, e.g. dose, ingestion may be varied in order to find a set of treatment descriptors that maximizes benefit and minimizes risk of adverse effects.
The patient therapeutic benefit indicator is then output, preferably, for example, on a display device, so that the user can assume whether and/or to what extent the patient receives a therapeutic benefit. In one example, the display interface includes a graphical display showing the BAtp, and points where the patient is located and identified among a population of treated individuals for various treatments and treatment descriptors. The treatment may be a combination of various medical treatments.
At block 810, the therapeutic benefit calculated at block 1809 may be used in personalized medicine. In one embodiment, if the patient is predicted to benefit from the treatment, personalized medicine includes selecting an appropriate treatment for the patient, e.g., above a benefit threshold, or among a plurality of treatments for which benefits are calculated at block 1809, with the best predicted benefit. Further, in, for example, combining factors such as treatment cost and severe adverse effect, the selection may be made based on a threshold generated by combining treatment cost and risk of severe adverse effect. A patient with a predicted benefit above a threshold (or between two thresholds) may be said to be a responder to the treatment.
4.0 implementation mechanisms-hardware overview
Aspects of the invention may be described in the general context of computer-executable instructions, such as program modules, being executed by a computer. Generally, program modules include routine tests, programs, objects, components, data structures, etc. that perform tasks or implement particular abstract data types. Such program modules may be implemented with hardware components, software components, or a combination thereof. Moreover, those skilled in the art will appreciate that the invention may be practiced with various computer system configurations, including multiprocessor systems, microprocessor-based or programmable consumer electronics, minicomputers, mainframe computers, and the like. The present invention may be used with any number of computer systems and computer networks, including but not limited to smart phones or other handheld devices.
Specific hardware devices, programming languages, components, procedures, protocols, and numerous specific details including operating environments and the like are set forth in order to provide a thorough understanding of the present invention. In other instances, structures, devices, and processes are shown in block diagram form, rather than in detail, in order to avoid obscuring the present invention. It will be understood by those of ordinary skill in the art that the present invention may be practiced without these specific details. Computer systems, servers, workstations, and other machines may be connected from one to another across a communication medium including, for example, a network or networks.
It will be appreciated by those skilled in the art that embodiments of the invention may be embodied as, among other things: a method, system, or computer program product. Accordingly, embodiments may take the form of a hardware embodiment, a software embodiment, or a combination of software and hardware embodiments. In an embodiment, the invention takes the form of a computer program product including computer-useable instructions embodied on one or more computer-readable media. The methods, data structures, interfaces, and other aspects of the invention described above may be embodied in such computer program products.
Computer-readable media includes both volatile and nonvolatile media, removable and non-removable media, and tangible media readable by a database, a switch, and various other network devices. By way of example, and not limitation, computer readable media may comprise media implemented in any method or technology for storing information. Examples of stored information include computer-useable instructions, data structures, program modules, and other data representations. Examples of media include, but are not limited to, information delivery media, RAM, ROM, EEPROM, flash memory or other memory technology, CD-ROM, Digital Versatile Disks (DVD), holographic media or other optical disk storage, magnetic cassettes, magnetic tape, magnetic disk storage, and other magnetic storage devices. These techniques may immediately store the numerical control temporarily or permanently. In an embodiment, a non-transitory medium is used.
The invention may be practiced in distributed computing environments where tasks are performed by remote processing devices that are linked through a communications network or other communications medium. In a distributed computing environment, program modules may be located in both local and remote memory storage devices. Depending on the source of the input, the computer uses the instructions to form an interface that allows the computer to react. The instructions cooperate with other code segments to initiate various tasks in reaction to receiving data in cooperation with receiving a data source.
The present invention may be practiced in a network environment, such as a communications network. Such networks can be widely used to connect various types of network elements, such as routers, servers, gateways, and so forth. Further, the present invention may be practiced in multi-network environments with various connected public and/or private networks.
Communication between network elements may be wireless or wired (wired). Those skilled in the art will appreciate that the communication network may take several different forms and may employ different communication protocols.
Embodiments of the subject invention may be embodied in an outcome processing system. The components of the result processing system may be located on a single computer or distributed network as is known in the art. For example, in a system that employs a pathophysiological model or a formal therapy model, such models may be configured as separate, associated subsystems or models, e.g., capable of stand-alone operation and/or may be disposed on a computer other than a computer that calculates a therapeutic benefit. Similarly, the generation of individual simulation clusters may be configured as separate, associated subsystems. In an embodiment, the components of the result processing system are distributed on a computer readable medium.
In embodiments, a user may access the results processing system via a client device. In embodiments, certain functions or result processing systems may be stored on and/or executed on such devices. Such means may take any of a variety of forms. By way of example, the client device may be a desktop or laptop computer, a Personal Digital Assistant (PDA), an MP3 player, a communication device such as a telephone, pager, email reader, or a text messaging device, or any combination of these or other devices.
In an embodiment, the client device may be connected to the results processing system via a network. As described above, the client device may communicate with the network using various access technologies, wireless and wire. Furthermore, the client device may include one or more later input and output interfaces that support user access to the processing system. Such user interfaces may further include various input and output devices to facilitate the logging in of user information or the presentation of user information. Such input and output devices may include, but are not limited to, a mouse, a touch pad, a touch screen or other pointing device, a keyboard, a camera, a monitor, a microphone, a printer, a scanner, among other devices in such devices.
For example, in a system adapted for personalized medical methods, the client device may include an input interface that allows a user to input a patient descriptor. The central processor may receive such descriptors and calculate a therapeutic benefit for the patient. Optionally, the client device may further comprise an output interface (e.g. a display) allowing the user to receive the therapeutic benefit and optionally, envision calculating the therapeutic benefit by the outcome processing system.
In a system suitable for the portability study approach, the client device may include an input interface that allows a user to input patient descriptors for a population of individuals, to select a population of individuals of interest to specify a disease, to specify a treatment or type of treatment, and/or to input any additional restrictions or other characteristics (e.g., financial resources assigned to the treatment). The central processor may receive such input and generate output back to the user, e.g., back to the client device. The central processor may, for example, access a memory storing data to return therapeutic benefits for a population of individuals or to calculate therapeutic benefits for a population of individuals. Optionally, the client device may further include a display that allows the user to receive input information and optionally, to visualize a therapeutic benefit and/or a treatment in response to the input information (e.g., to select a treatment for a disease, a benefit for a population of individuals, etc.).
In a system adapted for a target evaluation method, a client device may comprise an input interface specifying interrelationships between one or more components or pathophysiological model components, allowing a user to input information. The change in the components or interrelationships defines a treatment (T). The central processor may receive such input and generate output that is returned to the user, e.g., to the client device. The central processor may calculate a treatment (T) benefit for a simulated population of individuals. Optionally, the client device may further comprise allowing the user to receive a therapy (T) benefit and optionally, to envision a therapy (T) benefit, to envision a therapy that provides a meaningful benefit, or to rank a plurality of therapies (T).
In a system adapted to monitor a progression method, a client device may include an input interface that allows a user to input therapy descriptors and/or therapy (T) usage data (e.g., clinical, experimental). The central processor may receive such input and generate output that is returned to the user, e.g., to the client device. The central processor may calculate a treatment (T) benefit for a simulated population of individuals. Optionally, the client device may further comprise an output device (e.g. a display) allowing the user to receive the therapy (T) benefit and optionally to envisage the therapy (T) benefit.
FIG. 20 illustrates a block diagram of a single computer system 2000 in which embodiments of the present invention may be practiced in a simple configuration. Computer system 2000 includes a bus 2002 or other communication mechanism for communicating information, and a processor 2004 coupled with bus 2002 for processing information. Computer system 2000 also includes a main memory 2006, such as a Random Access Memory (RAM) or other storage device, coupled to bus 2002 for storing information and instructions to be executed by processor 2004. Main memory 2006 also may be used for storing temporary variables or other intermediate information during execution of instructions by processor 2004. Computer system 2000 further includes a Read Only Memory (ROM) 2008 or other static storage device coupled to bus 2002 for storing static information and instructions for processor 2004. A storage device 2010, such as a magnetic disk or optical disk, is provided for storing information and instructions and is coupled to bus 2002.
The invention is related to the use of computer system 2000 for implementing the techniques described herein. According to an embodiment of the invention, those techniques are performed by a computer system 2000 that is responsive to a processor 2004, wherein the processor 2004 executes one or more instructions of one or more programs contained in a main memory 2006. Such instructions may be read into main memory 2006 from another machine-readable medium, such as storage device 2010. Execution of the program instructions contained in main memory 2006 causes processor 2004 to perform the process steps described herein. In alternative embodiments, hard-wired circuitry may be used in place of or in combination with software instructions to implement the invention. Thus, embodiments of the invention are not limited to any specific combination of hardware circuitry and software.
In an embodiment implemented using computer system 2000, various computer readable media, such as an optical or magnetic disk, for example, storage device 2010 or dynamic memory, for example, primary processor 2006, are involved in providing instructions to processor 2004. Transmission media includes coaxial cables, copper wire and fiber optics, including the wires that comprise bus 2002. Transmission media can also take the form of acoustic or light waves, such as those generated during radio-wave and infrared data communications. All such media must be tangible to enable the instructions carried by the media to be detected by a physical mechanism that reads the instructions to a machine.
Various forms of computer readable media may be involved in carrying one or more instructions of one or more programs to processor 2004 for execution. For example, the instructions may initially be carried on a magnetic disk of a remote computer. The remote computer can load the instructions into its dynamic memory and send the instructions over a telephone line using a modem. A modem local to the computer system can receive the data on the telephone line and use an infra-red transmitter to convert the data to an infra-red signal. An infra-red detector can receive the data carried in the infra-red signal and appropriate circuitry can place the data on bus 2002. The bus 2002 carries the data to the main memory 2006 from which the processor 2004 retrieves and executes the instructions. Alternatively, the instructions received by main memory 2006 may be stored on storage device 2010 either before or after execution by processor 2004.
Optionally, computer system 2000 also includes a communication interface 2015 coupled to bus 2002. Communication interface 2015 provides a two-way data communication coupling to a network link 2020, where the network link 2020 connects to a local network 2022. For example, communication interface 2015 can be an Integrated Services Digital Network (ISDN) card or a modem to provide a data communication connection to a corresponding telephone line type. As another example, communication interface 2015 can be a Local Area Network (LAN) card to provide a data communication connection to a compatible LAN. But may also be implemented as a wireless link. In any such implementation, communication interface 2015 sends and receives electrical, electromagnetic or optical signals that carry digital data streams representing various information types. Network link 2020 typically provides data communication through one or more networks or other data devices. For example, network link 2020 may provide a connection through local network 2022 to a host computer 2024 or to data equipment operated by an Internet Service Provider (ISP) 2026. The ISP2026 in turn provides data communication services through the world's packet data communication networks, now commonly referred to as the "internet" 2028. Local network 2022 and internet 2028 both use electrical, electromagnetic or optical signals that carry digital data streams. The signals through the various networks and the signals on network link 2020, and the signals conveying the digital data to and from computer system 2000 through communication interface 2015 are exemplary forms of carrier waves transporting the digital data. Computer system 2000 can send messages and receive data, including program code, through the network(s), network link 2020 and communication interface 2015. In the internet example, a server 530 might transmit a requested code for an application program through internet 2028, ISP2026, local network 2022 and communication interface 2015. The received code may be received by processor 2004, executed by it, and/or stored in storage device 2010, or other non-volatile storage for later execution. In this manner, computer system 2000 may obtain application code in the form of a carrier wave.
All publications and patent applications cited in this specification are herein incorporated by reference as if each individual publication or patent application were specifically and individually indicated to be incorporated by reference.
While the foregoing invention has been described in some detail by way of illustration and example for purposes of clarity of understanding, it will be readily apparent to those of ordinary skill in the art in light of the teachings of this invention that certain changes and modifications may be made thereto without departing from the spirit or scope of the appended claims.
Claims (22)
1. An apparatus for computer simulated drug discovery, the apparatus comprising:
means for obtaining a function describing a therapeutic benefit for a population Rt as a function of risk without treatment Rc, wherein the means for obtaining a function comprises means for running a pathophysiological model comprising changes in components or interrelationships between components of the pathophysiological model, the pathophysiological model defining a treatment T corresponding to an existing or hypothetical drug that modulates a biological target, wherein the pathophysiological model generates a likelihood of an event of interest; and means for deriving the function from the likelihood of the event of interest;
means for receiving a patient descriptor for a population of simulated individuals, wherein each simulated individual in the population is associated with a risk Rc and a second variable X;
a result processing system for calculating a therapeutic benefit Rt for the simulated population of individuals, wherein the calculating comprises calculating a benefit of therapy T associated with (i) and (ii), wherein (i) is a change in a component or interrelationship between components of a pathophysiological model, and (ii) is a function that describes the therapeutic benefit Rt for the population as a function of risk Rc in the absence of therapy, wherein the function is a function that describes the therapeutic benefit Rt as a function of: a risk without treatment Rc that is dependent on a first variable Y, and a second variable X, wherein the second variable X is a vector of individual features other than those contained in the risk without treatment Rc, and the variables X and Y can be several environmental, phenotypic or genotypic derived variables; and
means for outputting a number of avoidance events in the simulated population of individuals for treatment.
2. The apparatus of claim 1, wherein the means for receiving a patient descriptor comprises means for generating a simulated individual or a simulated population of individuals.
3. The apparatus of claim 2, wherein the simulated population of individuals is a virtual reality population.
4. The apparatus of any of the above claims, wherein the means for outputting the number of avoidance events in the simulated population of individuals for a therapy further comprises means for ranking the number of avoidance events in the simulated population of individuals for a therapy in a plurality of therapies.
5. The apparatus of any one of claims 1, 2 or 3, further comprising means for identifying a biological target, the alteration of which provides a therapeutic benefit in the simulated population of individuals.
6. The apparatus of any one of claims 1, 2 or 3, further comprising means for assessing the effect of variables on the therapeutic benefit of the number of individuals.
7. The device of claim 6, wherein the variable is a detectable biological or cellular constituent, and wherein a constituent determined to have an effect on a therapeutic benefit of the number of simulated individuals is identified as a biomarker.
8. The apparatus of any one of claims 1, 2 or 3, further comprising means for assessing whether the treatment is appropriate for the population of interest.
9. The apparatus of any one of claims 1, 2 or 3, further comprising means for assessing therapeutic benefit in a population of interest.
10. The apparatus of any one of claims 1, 2 or 3, further comprising means for displaying an indicator of a therapeutic benefit Rt for the number of individuals.
11. A computer-implemented method for drug discovery, comprising:
obtaining a function describing a therapeutic benefit for a population Rt as a function of risk without treatment Rc, wherein the obtaining comprises running a pathophysiological model comprising changes in components or interrelationships between components of the pathophysiological model defining a treatment T corresponding to an existing or hypothetical drug modulating a biological target, wherein the pathophysiological model generates a likelihood of an event of interest; and deriving the function from the likelihood of the event of interest;
receiving a patient descriptor for a population of simulated individuals, wherein each simulated individual in the population is associated with a risk Rc and a second variable X;
calculating, by a result processing system, a therapeutic benefit Rt for the simulated population of individuals, wherein the calculating comprises: calculating the benefit of said treatment T in association with (i) and (ii), wherein (i) is a change in the components of the pathophysiological model or the interrelationship between the components, and (ii) is a function that describes the therapeutic benefit Rt for a population as a function of the risk without treatment Rc, wherein said function is a function that describes the therapeutic benefit Rt as a function of the risk without treatment Rc that depends on a first variable Y and a second variable X, wherein said second variable X is a vector of individual features other than those contained in the risk without treatment Rc, and said variables X and Y can be several environmentally, phenotypically or genotypically derived variables; and
outputting a number of avoidance events in the simulated population of individuals for treatment.
12. The method of claim 11, wherein the receiving a patient descriptor comprises generating a simulated individual or a simulated population of individuals.
13. The method of claim 11 or 12, wherein the simulated population of individuals is a virtual reality population.
14. The method of claim 11 or 12, wherein the outputting the number of avoidance events in the simulated population of individuals for a treatment further comprises ranking the number of avoidance events in the simulated population of individuals for a treatment in a plurality of treatments.
15. The method of claim 11 or 12, further comprising identifying a biological target, changes in the biological target providing therapeutic benefit in a simulated population of individuals.
16. The method of claim 11 or 12, further comprising assessing the effect of a variable on the therapeutic benefit of the number of individuals.
17. The method of claim 16, wherein the variable is a detectable biological or cellular constituent, and wherein a constituent determined to have an effect on a therapeutic benefit of the number of individuals is identified as a biomarker.
18. The method of claim 11 or 12, further comprising assessing whether treatment is appropriate for a population of interest.
19. The method of claim 11 or 12, further comprising assessing therapeutic benefit in a population of interest.
20. The method of claim 11 or 12, further comprising displaying an indicator of a therapeutic benefit Rt for the number of individuals.
21. An apparatus for assessing a biomarker, the apparatus comprising:
means for obtaining a function describing a therapeutic benefit for a population Rt as a function of risk without treatment Rc, wherein the means for obtaining a function comprises means for running a pathophysiological model comprising changes in components or interrelationships between components of the pathophysiological model, the pathophysiological model defining a treatment T, wherein the pathophysiological model generates a likelihood of an event of interest; and means for deriving the function from the likelihood of the event of interest;
means for receiving a patient descriptor for a population of simulated individuals, wherein each simulated individual in the population is associated with a risk Rc and a second variable X;
a result processing system for calculating a therapeutic benefit Rc-Rt for a simulated individual or population of individuals, wherein said calculating comprises calculating a benefit of said therapy T associated with a function describing a therapeutic benefit Rc-Rt for the population as a function of risk Rc in the absence of therapy, wherein said function is a function describing said therapeutic benefit Rc-Rt as a function of:
risk of Rc without treatment dependent on a first variable Y, and
a second variable X, wherein said second variable X is a vector of individual characteristics other than those contained in the risk Rc in the absence of treatment, and said first variable Y is a vector of individual characteristics contained in the risk Rc in the absence of treatment, and said variables X and Y may be several environmental, phenotypic or genotypic derived variables; and
means for outputting a number of avoidance events in the simulated population of individuals for treatment; and
means for assessing the effect of the variable on the therapeutic benefit Rc-Rt for the one or more simulated individuals.
22. A method of assessing a biomarker, the method comprising:
obtaining a function describing a therapeutic benefit for a population Rt as a function of risk without treatment Rc, wherein the obtaining a function comprises running a pathophysiological model comprising changes in components or interrelationships between components of the pathophysiological model, the pathophysiological model defining a treatment T, wherein the pathophysiological model generates a likelihood of an event of interest; and deriving the function from the likelihood of the event of interest;
receiving a patient descriptor for a population of simulated individuals, wherein each simulated individual in the population is associated with a risk Rc and a second variable X;
calculating, by a result processing system, a therapeutic benefit Rc-Rt for a simulated individual or population of individuals, wherein said calculating comprises calculating a benefit of said therapy T associated with a function describing a therapeutic benefit Rc-Rt for the population as a function of risk Rc in the absence of therapy, wherein said function is a function describing said therapeutic benefit Rc-Rt as a function of:
risk of Rc without treatment dependent on a first variable Y, and
a second variable X, wherein said second variable X is a vector of individual characteristics other than those contained in the risk Rc in the absence of treatment, and said first variable Y is a vector of individual characteristics contained in the risk Rc in the absence of treatment, and said variables X and Y may be several environmental, phenotypic or genotypic derived variables; and
outputting a number of avoidance events in the simulated population of individuals for treatment; and
evaluating the effect of the variable on the therapeutic benefit Rc-Rt for the one or more simulated individuals.
Applications Claiming Priority (3)
| Application Number | Priority Date | Filing Date | Title |
|---|---|---|---|
| US32155510P | 2010-04-07 | 2010-04-07 | |
| US61/321,555 | 2010-04-07 | ||
| PCT/EP2011/001759 WO2011124385A1 (en) | 2010-04-07 | 2011-04-05 | Computer based system for predicting treatment outcomes |
Publications (2)
| Publication Number | Publication Date |
|---|---|
| CN102822834A CN102822834A (en) | 2012-12-12 |
| CN102822834B true CN102822834B (en) | 2020-09-25 |
Family
ID=44477613
Family Applications (1)
| Application Number | Title | Priority Date | Filing Date |
|---|---|---|---|
| CN201180015982.6A Active CN102822834B (en) | 2010-04-07 | 2011-04-05 | Computer-based system for predicting treatment outcome |
Country Status (8)
| Country | Link |
|---|---|
| US (2) | US20130041683A1 (en) |
| EP (1) | EP2556460A1 (en) |
| JP (1) | JP5970449B2 (en) |
| CN (1) | CN102822834B (en) |
| AU (1) | AU2011238099A1 (en) |
| CA (1) | CA2832355A1 (en) |
| RU (1) | RU2601197C2 (en) |
| WO (1) | WO2011124385A1 (en) |
Families Citing this family (58)
| Publication number | Priority date | Publication date | Assignee | Title |
|---|---|---|---|---|
| US8635183B1 (en) * | 2010-04-19 | 2014-01-21 | Bridgehealth Medical, Inc. | Method and apparatus to computer-process data to produce, store, and disseminate output related to medical or health information |
| WO2011124385A1 (en) * | 2010-04-07 | 2011-10-13 | Novadiscovery | Computer based system for predicting treatment outcomes |
| US20200027181A1 (en) * | 2010-09-29 | 2020-01-23 | Dacadoo Ag | Automated health data acquisition, processing and communication system and method |
| US20130014061A1 (en) * | 2011-07-06 | 2013-01-10 | Lockheed Martin Corporation | Method and apparatus for time-based opportunity and risk management |
| US8992228B2 (en) * | 2012-06-19 | 2015-03-31 | MediResource Inc. | Automated system for delivery of targeted content based on behavior change models |
| EP2864914B1 (en) * | 2012-06-21 | 2020-07-08 | Battelle Memorial Institute | Clinical predictive analytics system |
| US11694797B2 (en) | 2012-10-30 | 2023-07-04 | Neil S. Davey | Virtual healthcare communication platform |
| WO2014113714A1 (en) * | 2013-01-17 | 2014-07-24 | The Regents Of The University Of California | Rapid identification of optimized combinations of input parameters for a complex system |
| EP2951741A2 (en) * | 2013-02-03 | 2015-12-09 | Genelex Corporation | Systems and methods for quantification and presentation of medical risk arising from unknown factors |
| BR122022005675B1 (en) * | 2013-02-06 | 2023-05-02 | Geissler Companies, Llc | METHODS FOR DETERMINING THE EFFECTIVENESS OF A DRUG |
| US9864837B2 (en) * | 2013-02-28 | 2018-01-09 | Accenture Global Services Limited | Clinical quality analytics system with recursive, time sensitive event-based protocol matching |
| WO2014145705A2 (en) | 2013-03-15 | 2014-09-18 | Battelle Memorial Institute | Progression analytics system |
| US10853451B2 (en) * | 2013-06-06 | 2020-12-01 | Timeless Veterinary Systems International Limited | Drug formulary application |
| US9530095B2 (en) | 2013-06-26 | 2016-12-27 | International Business Machines Corporation | Method and system for exploring the associations between drug side-effects and therapeutic indications |
| EP3129507A4 (en) * | 2014-04-10 | 2017-12-06 | Yissum Research Development Company of the Hebrew University of Jerusalem Ltd. | Methods and kits for determining a personalized treatment regimen for a subject suffering from a pathologic disorder |
| JP6324828B2 (en) * | 2014-07-07 | 2018-05-16 | 株式会社日立製作所 | Medicinal effect analysis system and medicinal effect analysis method |
| US9349178B1 (en) | 2014-11-24 | 2016-05-24 | Siemens Aktiengesellschaft | Synthetic data-driven hemodynamic determination in medical imaging |
| EP3051449A1 (en) * | 2015-01-29 | 2016-08-03 | Bayer Technology Services GmbH | Computer-implemented method for creating a fermentation model |
| WO2016168474A1 (en) * | 2015-04-17 | 2016-10-20 | Heartflow, Inc. | Systems and methods for assessment of tissue function based on vascular disease |
| RU2599350C1 (en) * | 2015-06-04 | 2016-10-10 | Федеральное государственное бюджетное научное учреждение "Научно-исследовательский институт фармакологии и регенеративной медицины имени Е.Д. Гольдберга" | Method for prediction of individual clinical effectiveness of statins (versions) |
| US20170024539A1 (en) * | 2015-07-23 | 2017-01-26 | PrioBio, LLC | Enhancing blood cell estimation |
| US10825557B2 (en) * | 2015-09-04 | 2020-11-03 | Canon Medical Systems Corporation | Medical information processing apparatus |
| US11216478B2 (en) | 2015-10-16 | 2022-01-04 | o9 Solutions, Inc. | Plan model searching |
| US9906551B2 (en) * | 2016-02-09 | 2018-02-27 | International Business Machines Corporation | Forecasting and classifying cyber-attacks using crossover neural embeddings |
| US11039986B2 (en) * | 2016-02-25 | 2021-06-22 | Samsung Electronics Co., Ltd. | Chronotherapeutic dosing of medication and medication regimen adherence |
| EP3223180A1 (en) | 2016-03-24 | 2017-09-27 | Fujitsu Limited | A system and a method for assessing patient risk using open data and clinician input |
| EP3223178A1 (en) | 2016-03-24 | 2017-09-27 | Fujitsu Limited | A system and a method for assessing patient treatment risk using open data and clinician input |
| KR102286728B1 (en) | 2016-05-18 | 2021-08-06 | 마크 노알 | Methods and systems for predicting successful treatment and outcome of bodily tissue disorders based on the energetic activity of the tissue |
| JP6068715B1 (en) * | 2016-07-06 | 2017-01-25 | 原 正彦 | Intervention effect estimation system, intervention effect estimation method, and program used for intervention effect estimation system |
| RU2675067C1 (en) * | 2017-09-18 | 2018-12-14 | федеральное государственное бюджетное учреждение "Национальный медицинский исследовательский центр имени В.А. Алмазова" Министерства здравоохранения Российской Федерации | Method for predicting resumption of coronary heart disease clinical picture by means of neural networks in patients after endovascular intervention |
| EP3480823A1 (en) * | 2017-11-02 | 2019-05-08 | Koninklijke Philips N.V. | Clinical decision support |
| US11132621B2 (en) | 2017-11-15 | 2021-09-28 | International Business Machines Corporation | Correction of reaction rules databases by active learning |
| JP7308865B2 (en) * | 2018-05-03 | 2023-07-14 | エフ・ホフマン-ラ・ロシュ・アクチェンゲゼルシャフト | Visualization of biomedical predictions |
| AU2019277199B2 (en) * | 2018-05-31 | 2024-04-04 | Lynne Bilston | Systems, devices and methods for the treatment of oral and pharyngeal disorders |
| US11177028B2 (en) | 2018-12-06 | 2021-11-16 | International Business Machines Corporation | Extraction, representation, and cognitive interpretation of medically relevant evidence |
| US11605469B2 (en) * | 2018-12-13 | 2023-03-14 | International Business Machines Corporation | Cognitive analysis of data using granular review of documents |
| EP3673955A1 (en) * | 2018-12-24 | 2020-07-01 | Koninklijke Philips N.V. | Automated detection of lung conditions for monitoring thoracic patients undergoing external beam radiation therapy |
| US10515715B1 (en) | 2019-06-25 | 2019-12-24 | Colgate-Palmolive Company | Systems and methods for evaluating compositions |
| RU2736391C1 (en) * | 2019-10-11 | 2020-11-16 | Федеральное государственное бюджетное научное учреждение "Научно-исследовательский институт фармакологии имени В.В. Закусова" | Method for predicting therapeutic efficacy of aphobazolum anxiolytic in patients with anxiety disorders |
| CN111166289B (en) * | 2020-01-04 | 2023-02-24 | 山东大学齐鲁医院(青岛) | Remote endocrine disorder detection equipment |
| RU2754884C2 (en) * | 2020-02-03 | 2021-09-08 | Атлас Биомед Груп Лимитед | Determination of phenotype based on incomplete genetic data |
| US11328796B1 (en) | 2020-02-25 | 2022-05-10 | Vignet Incorporated | Techniques for selecting cohorts for decentralized clinical trials for pharmaceutical research |
| CN111403040A (en) * | 2020-06-04 | 2020-07-10 | 成都泰盟软件有限公司 | Treatment simulation system based on virtual standard patient |
| US11854670B2 (en) * | 2020-08-18 | 2023-12-26 | International Business Machines Corporation | Running multiple experiments simultaneously on an array of chemical reactors |
| US11798652B2 (en) * | 2020-08-24 | 2023-10-24 | Kpn Innovations, Llc. | Method of and system for identifying and ameliorating body degradations |
| US20230343467A1 (en) * | 2020-09-07 | 2023-10-26 | Theraindx Lifesciences Pvt Ltd | Systems and methods for identification of cell lines, biomarkers, and patients for drug response prediction |
| CN112652368A (en) * | 2020-12-31 | 2021-04-13 | 中山大学肿瘤防治中心(中山大学附属肿瘤医院、中山大学肿瘤研究所) | Data analysis method and device |
| CN112509669A (en) * | 2021-02-01 | 2021-03-16 | 肾泰网健康科技(南京)有限公司 | AI technology-based renal disease hemodialysis scheme customization method and system |
| US11361846B1 (en) | 2021-02-03 | 2022-06-14 | Vignet Incorporated | Systems and methods for customizing monitoring programs involving remote devices |
| US11296971B1 (en) | 2021-02-03 | 2022-04-05 | Vignet Incorporated | Managing and adapting monitoring programs |
| US11316941B1 (en) | 2021-02-03 | 2022-04-26 | Vignet Incorporated | Remotely managing and adapting monitoring programs using machine learning predictions |
| US11196656B1 (en) | 2021-02-03 | 2021-12-07 | Vignet Incorporated | Improving diversity in cohorts for health research |
| US11521714B1 (en) | 2021-02-03 | 2022-12-06 | Vignet Incorporated | Increasing diversity of participants in health research using adaptive methods |
| US11789837B1 (en) | 2021-02-03 | 2023-10-17 | Vignet Incorporated | Adaptive data collection in clinical trials to increase the likelihood of on-time completion of a trial |
| WO2023230712A1 (en) * | 2022-06-02 | 2023-12-07 | Vana Health Inc. | System, method and apparatus for assessing efficacy of nutraceutical polyphenols utilizing ai |
| CN115359921B (en) * | 2022-10-20 | 2023-06-27 | 中融云尚科技有限公司 | Medical information storage sharing system based on data analysis |
| CN117238522A (en) * | 2023-11-08 | 2023-12-15 | 查理高特(青岛)健康科技有限公司 | Febuxostat curative effect prediction system, febuxostat curative effect prediction equipment and febuxostat curative effect prediction medium |
| CN117558460B (en) * | 2024-01-11 | 2024-04-05 | 卓世未来(天津)科技有限公司 | Chronic disease management method and system based on small sample learning and large language model |
Citations (1)
| Publication number | Priority date | Publication date | Assignee | Title |
|---|---|---|---|---|
| WO2009076551A2 (en) * | 2007-12-12 | 2009-06-18 | The Regents Of The University Of California | Systems and methods for predicting response of biological samples |
Family Cites Families (21)
| Publication number | Priority date | Publication date | Assignee | Title |
|---|---|---|---|---|
| US6983227B1 (en) * | 1995-01-17 | 2006-01-03 | Intertech Ventures, Ltd. | Virtual models of complex systems |
| US5860917A (en) * | 1997-01-15 | 1999-01-19 | Chiron Corporation | Method and apparatus for predicting therapeutic outcomes |
| US6315720B1 (en) * | 2000-10-23 | 2001-11-13 | Celgene Corporation | Methods for delivering a drug to a patient while avoiding the occurrence of an adverse side effect known or suspected of being caused by the drug |
| JP4284050B2 (en) * | 2002-09-27 | 2009-06-24 | 株式会社東芝 | Program, database, system and method for predicting effectiveness of treatment |
| US20060188878A1 (en) * | 2002-10-15 | 2006-08-24 | Dressman Marlene M | Methods to predict ederma as a side effect of drug treatment |
| US20040115647A1 (en) * | 2002-12-12 | 2004-06-17 | Paterson Thomas S. | Apparatus and method for identifying biomarkers using a computer model |
| EP1685512A2 (en) | 2003-10-07 | 2006-08-02 | Entelos, Inc. | Simulating patient-specific outcomes |
| US20060073496A1 (en) * | 2004-07-20 | 2006-04-06 | O'toole Margot | Methods of identifying patients at risk of developing encephalitis following immunotherapy for Alzheimer's disease |
| NL1027047C2 (en) * | 2004-09-15 | 2006-03-16 | Roderik Adriaan Kraaijenhagen | Computer device for establishing a diagnosis. |
| US20100204920A1 (en) * | 2005-04-25 | 2010-08-12 | Caduceus Information Systems Inc. | System for development of individualised treatment regimens |
| RU2322675C1 (en) * | 2006-11-08 | 2008-04-20 | Андрей Александрович Темнов | Method for predicting organism resistance to stress action |
| US20080140371A1 (en) * | 2006-11-15 | 2008-06-12 | General Electric Company | System and method for treating a patient |
| WO2009079446A1 (en) * | 2007-12-14 | 2009-06-25 | Centocor, Inc. | Method and system for distributing information between patients, health care providers, caregivers, and payors |
| US20090164190A1 (en) * | 2007-12-19 | 2009-06-25 | Abbott Diabetes Care, Inc. | Physiological condition simulation device and method |
| US20090307179A1 (en) * | 2008-03-19 | 2009-12-10 | Brandon Colby | Genetic analysis |
| WO2009132239A2 (en) * | 2008-04-24 | 2009-10-29 | Trustees Of Boston University | A network biology approach for identifying targets for combination therapies |
| US8224665B2 (en) * | 2008-06-26 | 2012-07-17 | Archimedes, Inc. | Estimating healthcare outcomes for individuals |
| US20110178819A1 (en) * | 2008-10-06 | 2011-07-21 | Merck Sharp & Dohme Corp. | Devices and methods for determining a patient's propensity to adhere to a medication prescription |
| US8694300B2 (en) * | 2008-10-31 | 2014-04-08 | Archimedes, Inc. | Individualized ranking of risk of health outcomes |
| US20110105852A1 (en) * | 2009-11-03 | 2011-05-05 | Macdonald Morris | Using data imputation to determine and rank of risks of health outcomes |
| WO2011124385A1 (en) * | 2010-04-07 | 2011-10-13 | Novadiscovery | Computer based system for predicting treatment outcomes |
-
2011
- 2011-04-05 WO PCT/EP2011/001759 patent/WO2011124385A1/en active Application Filing
- 2011-04-05 EP EP11713708A patent/EP2556460A1/en not_active Ceased
- 2011-04-05 AU AU2011238099A patent/AU2011238099A1/en not_active Abandoned
- 2011-04-05 CA CA2832355A patent/CA2832355A1/en not_active Abandoned
- 2011-04-05 CN CN201180015982.6A patent/CN102822834B/en active Active
- 2011-04-05 JP JP2013503039A patent/JP5970449B2/en active Active
- 2011-04-05 RU RU2012133279/08A patent/RU2601197C2/en active
- 2011-04-05 US US13/636,737 patent/US20130041683A1/en not_active Abandoned
-
2017
- 2017-05-17 US US15/597,661 patent/US20180039726A1/en not_active Abandoned
Patent Citations (1)
| Publication number | Priority date | Publication date | Assignee | Title |
|---|---|---|---|---|
| WO2009076551A2 (en) * | 2007-12-12 | 2009-06-18 | The Regents Of The University Of California | Systems and methods for predicting response of biological samples |
Non-Patent Citations (2)
| Title |
|---|
| "Modelling methodology in physiopathology";Jean-Pierre Boissel et al;《Progress in Biophysics and Molecular Biology》;20080531;第97卷(第1期);1-12 * |
| "New insights on the relation between untreated and treated outcomes for a given therapy effect model is not necessarily linear";Jean-Pierre Boissel et al;《Journal of Clinical Epidemiology》;20080331;第61卷(第3期);第301页第2栏,第303页第1栏第4段,第303页第1栏第5-8段,第303页第2栏第1-3段,第304页第1栏第3段,第306页第2栏第1段,图1-4 * |
Also Published As
| Publication number | Publication date |
|---|---|
| JP5970449B2 (en) | 2016-08-17 |
| US20130041683A1 (en) | 2013-02-14 |
| CN102822834A (en) | 2012-12-12 |
| RU2601197C2 (en) | 2016-10-27 |
| JP2013524355A (en) | 2013-06-17 |
| CA2832355A1 (en) | 2012-10-13 |
| AU2011238099A1 (en) | 2012-11-29 |
| RU2012133279A (en) | 2014-05-20 |
| US20180039726A1 (en) | 2018-02-08 |
| EP2556460A1 (en) | 2013-02-13 |
| WO2011124385A1 (en) | 2011-10-13 |
Similar Documents
| Publication | Publication Date | Title |
|---|---|---|
| CN102822834B (en) | Computer-based system for predicting treatment outcome | |
| Yang et al. | Risk prediction of diabetes: big data mining with fusion of multifarious physical examination indicators | |
| US11734593B2 (en) | Bayesian causal relationship network models for healthcare diagnosis and treatment based on patient data | |
| Staszak et al. | Machine learning in drug design: Use of artificial intelligence to explore the chemical structure–biological activity relationship | |
| JP6127160B2 (en) | Personalized healthcare system and method | |
| Yang et al. | DeepIDC: a prediction framework of injectable drug combination based on heterogeneous information and deep learning | |
| AU2004280966A1 (en) | Simulating patient-specific outcomes | |
| EP2223248A1 (en) | Simulating patient-specific outcomes | |
| US10262112B2 (en) | Prescription decision support system and method using comprehensive multiplex drug monitoring | |
| AU2020239014A1 (en) | Systems and methods for drug-agnostic patient-specific dosing regimens | |
| El Naqa et al. | Translation of AI into oncology clinical practice | |
| WO2009148803A2 (en) | Methods and systems for integrated health systems | |
| Li et al. | Dgcl: Distance-wise and graph contrastive learning for medication recommendation | |
| Liu et al. | DIGNiFI: Discovering causative genes for orphan diseases using protein-protein interaction networks | |
| Gancheva | A big data management approach for computer aided breast cancer diagnostic system supporting precision medicine | |
| Chang et al. | An investigation of the COVID-19 impact on liver cancer using exploratory and predictive analytics | |
| Aziz et al. | Patient-physician relationship and the role of clinical decision support systems | |
| Lodhi et al. | Impact Artificial Intelligence in the Pharmaceutical Industry on Working Culture: A Review | |
| Das et al. | Advances in Predicting Drug Functions: A Decade-Long Survey in Drug Discovery Research | |
| Doga et al. | Towards quantum computing for clinical trial design and optimization: A perspective on new opportunities and challenges | |
| Zhu et al. | PPM10 Correlation and hiearchical clustering order analysis of top 25 co-occurring genomic alterations in non-small cell lung cancer | |
| Shahsavari et al. | Integration of Federated Learning and Blockchain in Healthcare: A Tutorial | |
| Kumari et al. | RETRACTED CHAPTER: Computational and Informatics Methodologies in Drug Discovery, with Focus on Natural Products | |
| Polychronidou et al. | Biomedical Applications of Precision Medicine in Neurodegenerative Diseases | |
| Bairagee et al. | Artificial Intelligence in Boosting the Development of Drug |
Legal Events
| Date | Code | Title | Description |
|---|---|---|---|
| C06 | Publication | ||
| PB01 | Publication | ||
| C10 | Entry into substantive examination | ||
| SE01 | Entry into force of request for substantive examination | ||
| GR01 | Patent grant | ||
| GR01 | Patent grant |