Attorney Docket No.047162-7482WO1(02447) TITLE PARP PET Imaging Agents and Methods of Using the Same CROSS-REFERENCE TO RELATED APPLICATION This application claims priority to U.S. Provisional Patent Application No. 63/599,366 entitled “PARP PET IMAGING AGENTS AND METHODS USING SAME,” filed November 15, 2023, the disclosure of which is incorporated herein by reference in its entirety. STATEMENT REGARDING FEDERALLY SPONSORED RESEARCH This invention was made with government support under CA249569 awarded by National Institutes of Health. The government has certain rights in the invention. BACKGROUND Tumor cells can survive chemotherapies and/or radiation therapies through DNA repairment mediated by poly(ADP-ribose) polymerase (PARP). Consequently, PARP inhibitors alone or in combination with chemotherapy or radiation therapy have led to substantial gains in the overall survival of cancer patients through inhibition of PARP- catalyzed DNA repair. With multiple ongoing clinical trials using PARP inhibitors to treat glioma, the quantification of baseline PARP expression through PARP Positron Emission Tomography (PET) imaging is expected to provide valuable prognosis information and facilitate the clinical trials involving PARP inhibitors. However, the current PARP imaging agents lack sufficient brain penetration, making the reliable PARP quantification in the brain challenging. The present disclosure solves this unmet need. BRIEF SUMMARY OF THE INVENTION In various aspects, a compound of Formula (I), or a salt, solvate, tautomer, or stereoisomer thereof is provided:

1 53376748.1
Attorney Docket No.047162-7482WO1(02447) In certain embodiments, in the compound of Formula (I): R
1 is H or C1-C6 alkyl comprising at least one
11C; R
2 is H or
18F; R
3 is
11C or
12C; wherein the compound comprises at least one of
11C and
18F. In various aspects, a compound of Formula (II), or a salt, solvate, tautomer, or stereoisomer thereof is provided:
In certain embodiments, in the compound of Formula (II): R
1 is H or C1-C6 alkyl comprising at least one
11C; R
2 is
18F or
19F; and R
3 is
11C or
12C; wherein the compound comprises at least one of
11C and
18F. Compounds of Formula (I) and Formula (II) are useful as PET imaging agents. These compounds are especially, but not exclusively, suited for imaging gliomas owing to the advantageous blood-brain barrier (BBB) permeability of the compounds of Formula (I) and Formula (II). BRIEF DESCRIPTION OF THE FIGURES The drawings illustrate generally, by way of example, but not by way of limitation, various embodiments of the present application. Fig.1A shows PARP PET tracers derived from the PARP1/2 inhibitors olaparib and rucaparib. Fig.1B shows a radiochemical synthesis of [
11C]PyBic, according to various embodiments. Figs.2A-2F show [
11C]PyBic PET imaging in RG2 glioblastoma-bearing rats and quantitative data analysis results. Representative horizontal summed PET standard uptake value (SUV) images from 30–60 min p.i. and the corresponding contrast-enhanced MR (CEMR) images for baseline (Fig.2A) and blocking scans (Fig.2B), with hand-drawn regions of interest (ROIs) for tumor and contralateral nontumor regions. (Figs.2C-2D) SUV time-activity curves (TACs) of the RG2 tumor and selected brain subregions, including the 2 53376748.1
Attorney Docket No.047162-7482WO1(02447) contralateral nontumor cortex (nontumor), neocortex, thalamus, hippocampus, brain stem, and cerebellum, under baseline (Fig.2C, n = 5) and blocking (Fig.2D, n = 4) conditions. (Fig.2E) The regional distribution volume ratios (DVRs) of [
11C]PyBic in selected brain subregions and tumors, calculated using the simplified reference tissue method 2 (SRTM2) with the contralateral nontumor region as the pseudo reference region. The DVRs of the tumor (p = 0.0087), cerebellum (p = 0.0003), and neocortex (p = 0.0179) showed statistically significant differences between baseline and blocking scans. (Fig.2F) Radiometabolite analysis of [
11C]PyBic in rat plasma and brain homogenate at 60 min p.i. Figs.3A-3D show aspects of the pharmacokinetics of compounds of Formula (I) and Formula (II). (Fig.3A) Biodistribution analysis of baseline and blocking (veliparib, 5 mg/kg) at 60 min p.i. of [
11C]PyBic, expressed as %ID/g (n = 4 for baseline; n = 3 for blocking), with tumor and spleen showing statistically significant differences at baseline and blocking studies. (Fig.3B) The ratio of tracer uptake in tumor to different tissues and blood, showing that the tumor-to-contralateral cortex (tumor/cortex) ratios at baseline study and blocking study are most significantly different (p = 0.017), supporting the use of contralateral nontumor region as the reference region in the SRTM2 analysis. (Fig.3C) Linear correlational analysis of the difference between the tissue-to-blood ratios at baseline and blocking studies and baseline tissue-to-blood ratios. Dots on the graph represent the mean values of each analyzed brain region or tissue, i.e., the olfactory bulb, cerebellum, tumor, contralateral nontumor cortex (nontumor), and spleen. (Fig.3D) Linear correlational analysis of the results of baseline SRTM2 DVR and biodistribution data on tracer uptake in the cerebellum, nontumor, tumor, and brain stem, normalized by nontumor tracer uptake. Dots on the graph represent each individual tissue of cerebellum, tumor, contralateral nontumor cortex (nontumor), and brain stem from three different rats. For the statistical analysis using a t test, p < 0.05 was considered significantly different. Figs.4A-4F show immunohistochemical (IHC) staining and western blotting of PARP1 and correlation analysis with biodistribution and PET results. (Fig.4A) Representative IHC staining of PARP1 in RG2 tumor-bearing rats. (Fig.4B) PARP1 IHC in tumor tissue and adjacent normal tissue. (Figs.4C-4D) Representative western blotting of PARP1 in selected brain subregions, including the cortex, olfactory bulb, brain stem, cerebellum, hippocampus, and tumor, using a capillary electrophoresis WES system (ProteinSimple). (Fig.4C) Histogram graph of PARP1 expression. The116 kD band was detected by the PARP1-specific antibody. (Fig.4D) Classic western blotting image of PARP1 and expression quantification. N = 3–4, multiple t test, p < 0.05 is considered significantly 3 53376748.1
Attorney Docket No.047162-7482WO1(02447) different. (Fig.4E) Correlation of baseline biodistribution and WES on the olfactory bulb, stem, cerebellum, hippocampus, and tumor. (Fig.4F) Correlation of baseline PET DVR and PARP1 WES in the tumor, cerebellum, cortex, brain stem, and hippocampus. For graphs in Figs.4E-4F, dots on the graph represent the group mean, with n = 3–5 per group. Figs.5A-5E show [
11C]PyBic PET imaging and metabolism study in Monkey 1. (Fig. 5A) MRI of monkey brain (left column) and summed SUV PET images of [
11C]PyBic from early (2
nd and 3
rd columns, 10–20 min) and late (4
th and 5
th columns, 60–90 min) scan windows. The brain regional SUVs ranged from 0.5 to 1.5, with cerebellum being the highest, followed by occipital cortex, frontal cortex and globus pallidus showing the lowest tracer uptake. (Figs.5B-5c) Representative time active curves (TACs) of different brain regions at baseline scan (Fig.5B) and blocking scan (Fig.5C). (Fig.5D) Radio-HPLC chromatograms of plasma samples taken at different time points and the blood standard. (Fig. 5E) Metabolism-corrected arterial blood input functions of a baseline scan (in maroon) and a blocking scan (in blue) in the same monkey. Figs.6A-6B show in vivo target occupancy assays shown by Lassen plots of VT ▸ derived from 1 tissue compartment (1TC) modeling in two different monkeys. (Fig.6A) Lassen plot of V
T (baseline) vs the difference in V
T (baseline) and V
T (blocking) with veliparib as a blocking drug in Monkey 1. (Fig.6B) Lassen plot of V
T (baseline) vs the difference in VT (baseline) and VT (blocking) with veliparib as a blocking drug in Monkey 2. (Fig.6C) Lassen plot of VT (baseline) vs the difference in VT (baseline) and VT (blocking) with BGB290 as a blocking drug in Monkey 2. The x-intercept is the estimated non- displaceable volume distribution (VND), and the slope is the target occupancy. Fig.7A shows the synthesis of precursor and standard compounds 4 and 5. (i) CDI, 2- Me-Imidazole, NMP, 90 ºC, 12 h; (ii) NaOAc, AcOH, reflux; (iii) HCl (conc.), i-PrOH, 80 ºC, 12 h; (iv) MeI, DMF, K2CO3, 100 ºC, 12h. Fig.7B shows a representative SemiPrep-HPLC chromatogram. Column: Phenomenex Luna C-18 HPLC column (10 µm, 10 mm x 250 mm). Mobile phase: 20% acetonitrile/80% NH
4HCO
3 (20 mM, pH = 8.9). Flow rate: 5 mL/min. Fig.7C shows the HPLC trace of the co-injection of [
11C]PyBic and its standard compound 5. Fig.8A shows the synthesis of [
3H]PyBic. Fig.8B shows the results of a [
3H]PyBic saturation binding assay using rat hippocampus. Fig.9 shows the linear correlation of 0-90 min DVR and 0-60 min DVR from SRTM2 4 53376748.1
Attorney Docket No.047162-7482WO1(02447) kinetic modeling analyses. For 0-90 min, n=4, and for 0-60 min, n=5. Fig.10A shows 60 min SUV time activity curves of baseline and blocking scans on selected brain subregions, including cerebellum, hippocampus, neocortex, thalamus, tumor and contralateral non-tumor tissue (baseline, n = 5; blocking, n=4). Fig.10B is a graph of the area under curve (AUC, 0-60 min) in the different regions of brain compared to tumor in the baseline scans (n = 5, multiple t test). Figs.11A-11B show that the P-gp inhibitor verapamil did not affect [
11C]PyBic uptake in healthy rat brain. P-gp inhibitor verapamil (1 mg/kg) was injected via i.v.10 min before radiotracer administration. Fig.11A is without verapamil and Fig.11B is with verapamil. Fig.12 shows the biodistribution analysis of baseline and blocking (veliparib, 5 mg/kg) at 60 min p.i. of [
11C]PyBic, expressed as SUV (n = 4 for baseline; n = 3 for blocking), with tumor and spleen showing statistically significant differences at baseline and blocking studies. Or the statistical analysis using multiple t test, p < 0.05 is considered significantly different. Figs.13A-13C shows the results of capillary electrophoresis WES of PARP1 in tumor and normal and adjacent tissues. Fig.13A is a histogram graph of five pairs of normal and tumor tissues. Fig.13B is a classical view of western blotting on the same five pairs of tumor and normal tissues. Fig.13C is a quantification of PARP1 WEST, t test, p < 0.05 is considered significantly different, n = 5. Figs.14A-14D shows arterial input function studies shown by SUV time activity curves in the same monkey (monkey 2). Fig.14A is a test or retest study. Fig.14B is baseline vs. blocking with veliparib. Fig.14C is baseline vs. blocking with BGB290. Fig.14D is baseline vs. P-gp with tariquidar (1 mg/kg, i.v.). Fig.15 shows VT comparison among 1TCM and MA1 method in the same monkey. Figs.16A and 16B show a comparison of uptake of [
11C]PyBic (Fig.16A) vs. [
18F]PARPi (Fig.16B) in a BT142 bearing brain glioma mouse model. Fig.17A shows a representative horizontal summed PET SUV images for 10-20 min and 30–60 min p.i. baseline scans with [
11C](R)-FPyBic. Fig.17B shows a representative horizontal summed PET SUV images for 10-20 min and 30–60 min p.i. blocking scans with [
11C](R)-FPyBic using veliparib 2.5 mg/kg for blocking. Fig.17C shows representative time active curves (TACs) of different brain regions at baseline scan for the scan in Fig.17a. 5 53376748.1
Attorney Docket No.047162-7482WO1(02447) Fig.17D shows representative time active curves (TACs) of different brain regions at blocking scan for the scan in Fig.17b. Fig.17E shows radio-HPLC chromatograms of plasma samples taken at different time points and the blood standard for [
11C](R)-FPyBic. Fig.18A shows a representative horizontal summed PET SUV images for 10-20 min and 30–60 min p.i. baseline scans with [
18F](R)-FVeliparib. Fig.18B shows representative ex vivo rat brain AR imaging. Fig.18C shows representative time active curves (TACs) of different brain regions at baseline scan for [
18F](R)-FVeliparib. Fig.18D shows radio-HPLC chromatograms of plasma samples taken at different time points and the blood standard for [
11C](R)-FPyBic in rat. Fig.18E shows radio-HPLC chromatograms of plasma samples taken at different time points and the blood standard for [
18F](R)-FVeliparib. DETAILED DESCRIPTION The present disclosure provides in one aspect veliparib-derived PARP PET imaging agents (such as but not limited to [
11C]PyBic) that can freely pass the blood-brain barrier and demonstrate imaging characteristics in models of gliomas and healthy primates. The in vitro autoradiography study using the tritiated PyBic demonstrated the feasibility of quantifying PARP in human brain using [
11C]PyBic. Based on this lead PET tracer, one can develop and translate an
18F-labeled brain penetrant PARP imaging probe to first-in-human study in healthy volunteers and glioma patients. The following disclosure provides many different embodiments, or examples, for implementing different features of the provided subject matter. Specific examples of components and arrangements are described below to simplify the present disclosure. These are, of course, merely examples and are not intended to be limiting. For example, the formation of a first feature over or on a second feature in the description that follows may include embodiments in which the first and second features are formed in direct contact, and may also include embodiments in which additional features may be formed between the first and second features, such that the first and second features may not be in direct contact. In addition, the present disclosure may repeat reference numerals and/or letters in the various examples. This repetition is for the purpose of simplicity and clarity and does not in itself dictate a relationship between the various embodiments and/or configurations discussed. 6 53376748.1
Attorney Docket No.047162-7482WO1(02447) Definitions As used herein, each of the following terms has the meaning associated with it in this section. Unless defined otherwise, all technical and scientific terms used herein generally have the same meaning as commonly understood by one of ordinary skill in the art to which this disclosure belongs. Generally, the nomenclature used herein and the laboratory procedures in animal pharmacology, pharmaceutical science, peptide chemistry, and organic chemistry are those well-known and commonly employed in the art. It should be understood that the order of steps or order for performing certain actions is immaterial, so long as the present teachings remain operable. Any use of section headings is intended to aid reading of the document and is not to be interpreted as limiting; information that is relevant to a section heading may occur within or outside of that particular section. All publications, patents, and patent documents referred to in this document are incorporated by reference herein in their entirety, as though individually incorporated by reference. In the application, where an element or component is said to be included in and/or selected from a list of recited elements or components, it should be understood that the element or component can be any one of the recited elements or components and can be selected from a group consisting of two or more of the recited elements or components. In the methods described herein, the acts can be carried out in any order, except when a temporal or operational sequence is explicitly recited. Furthermore, specified acts can be carried out concurrently unless explicit claim language recites that they be carried out separately. For example, a claimed act of doing X and a claimed act of doing Y can be conducted simultaneously within a single operation, and the resulting process will fall within the literal scope of the claimed process. In this document, the terms “a,” “an,” or “the” are used to include one or more than one unless the context clearly dictates otherwise. The term “or” is used to refer to a nonexclusive “or” unless otherwise indicated. The statement “at least one of A and B” or “at least one of A or B” has the same meaning as “A, B, or A and B.” “About” as used herein when referring to a measurable value such as an amount, a temporal duration, and the like, is meant to encompass variations of ±20% or ±10%, in certain embodiments ±5%, in certain embodiments ±1%, in certain embodiments ±0.1% from the specified value, as such variations are appropriate to perform the disclosed methods. The term “alkyl” as used herein refers to straight chain and branched alkyl groups and cycloalkyl groups having from 1 to 40 carbon atoms, 1 to about 20 carbon atoms, 1 to 12 carbons or, in some embodiments, from 1 to 8 carbon atoms. Examples of straight chain alkyl 7 53376748.1
Attorney Docket No.047162-7482WO1(02447) groups include those with from 1 to 8 carbon atoms such as methyl, ethyl, n-propyl, n-butyl, n-pentyl, n-hexyl, n-heptyl, and n-octyl groups. Examples of branched alkyl groups include, but are not limited to, isopropyl, iso-butyl, sec-butyl, t-butyl, neopentyl, isopentyl, and 2,2- dimethylpropyl groups. As used herein, the term “alkyl” encompasses n-alkyl, isoalkyl, and anteisoalkyl groups as well as other branched chain forms of alkyl. Representative substituted alkyl groups can be substituted one or more times with any of the groups listed herein, for example, amino, hydroxy, cyano, carboxy, nitro, thio, alkoxy, and halogen groups. The term “solvent” as used herein refers to a liquid that can dissolve a solid, liquid, or gas. Non-limiting examples of solvents are silicones, organic compounds, water, alcohols, ionic liquids, and supercritical fluids. The term “independently selected from” as used herein refers to referenced groups being the same, different, or a mixture thereof, unless the context clearly indicates otherwise. Thus, under this definition, the phrase “X
1, X
2, and X
3 are independently selected from noble gases” would include the scenario where, for example, X
1, X
2, and X
3 are all the same, where X
1, X
2, and X
3 are all different, where X
1 and X
2 are the same but X
3 is different, and other analogous permutations. The term “room temperature” as used herein refers to a temperature of about 15 °C to 28 °C. The term “standard temperature and pressure” as used herein refers to 20 °C and 101 kPa. A “disease” is a state of health of an animal wherein the animal cannot maintain homeostasis, and wherein if the disease is not ameliorated then the animal’s health continues to deteriorate. A “disorder” in an animal is a state of health in which the animal is able to maintain homeostasis, but in which the animal’s state of health is less favorable than it would be in the absence of the disorder. Left untreated, a disorder does not necessarily cause a further decrease in the animal’s state of health. A disease or disorder is “alleviated” if the severity of a symptom of the disease or disorder, the frequency with which such a symptom is experienced by a patient, or both, is reduced. In one aspect, the terms “co-administered” and “co-administration” as relating to a subject refer to administering to the subject a compound and/or composition of the disclosure along with a compound and/or composition that may also treat or prevent a disease or disorder contemplated herein. In certain embodiments, the co-administered compounds 8 53376748.1
Attorney Docket No.047162-7482WO1(02447) and/or compositions are administered separately, or in any kind of combination as part of a single therapeutic approach. The co-administered compound and/or composition may be formulated in any kind of combinations as mixtures of solids and liquids under a variety of solid, gel, and liquid formulations, and as a solution. As used herein, the term “pharmaceutical composition” or “composition” refers to a mixture of at least one compound useful within the disclosure with a pharmaceutically acceptable carrier. The pharmaceutical composition facilitates administration of the compound to a patient. Multiple techniques of administering a compound exist in the art including, but not limited to, subcutaneous, intravenous, oral, aerosol, inhalational, rectal, vaginal, transdermal, intranasal, buccal, sublingual, parenteral, intrathecal, intragastrical, ophthalmic, pulmonary, and topical administration. As used herein, the term “pharmaceutically acceptable” refers to a material, such as a carrier or diluent, which does not abrogate the biological activity or properties of the compound, and is relatively non-toxic, i.e., the material may be administered to an individual without causing undesirable biological effects or interacting in a deleterious manner with any of the components of the composition in which it is contained. As used herein, the term “pharmaceutically acceptable carrier” means a pharmaceutically acceptable material, composition or carrier, such as a liquid or solid filler, stabilizer, dispersing agent, suspending agent, diluent, excipient, thickening agent, solvent or encapsulating material, involved in carrying or transporting a compound useful within the disclosure within or to the patient such that it may perform its intended function. Each carrier must be “acceptable” in the sense of being compatible with the other ingredients of the formulation, including the compound useful within the disclosure, and not injurious to the patient. Some examples of materials that may serve as pharmaceutically acceptable carriers include: sugars, such as lactose, glucose and sucrose; starches, such as corn starch and potato starch; cellulose, and its derivatives. As used herein, “pharmaceutically acceptable carrier” also includes any and all coatings, antibacterial and antifungal agents, and absorption delaying agents, and the like that are compatible with the activity of the compound useful within the disclosure, and are physiologically acceptable to the patient. The “pharmaceutically acceptable carrier” may further include a pharmaceutically acceptable salt of the compound useful within the disclosure. Other additional ingredients that may be included in the pharmaceutical compositions used in the practice of the disclosure are known in the art and described, for example in Remington’s Pharmaceutical Sciences (Genaro, Ed., Mack Publishing Co., 1985, Easton, PA), which is incorporated herein by reference. 9 53376748.1
Attorney Docket No.047162-7482WO1(02447) As used herein, the language “pharmaceutically acceptable salt” refers to a salt of the administered compound prepared from pharmaceutically acceptable non-toxic acids and bases, including inorganic acids, inorganic bases, organic acids, inorganic bases, solvates, hydrates, and clathrates thereof. Suitable pharmaceutically acceptable acid addition salts may be prepared from an inorganic acid or from an organic acid. Examples of inorganic acids include hydrochloric, hydrobromic, hydriodic, nitric, carbonic, sulfuric (including sulfate and hydrogen sulfate), and phosphoric acids (including hydrogen phosphate and dihydrogen phosphate). Appropriate organic acids may be selected from aliphatic, cycloaliphatic, aromatic, araliphatic, heterocyclic, carboxylic and sulfonic classes of organic acids, examples of which include formic, acetic, propionic, succinic, glycolic, gluconic, lactic, malic, tartaric, citric, ascorbic, glucuronic, maleic, malonic, saccharin, fumaric, pyruvic, aspartic, glutamic, benzoic, anthranilic, 4-hydroxybenzoic, phenylacetic, mandelic, embonic (pamoic), methanesulfonic, ethanesulfonic, benzenesulfonic, pantothenic, trifluoromethanesulfonic, 2- hydroxyethanesulfonic, p-toluenesulfonic, sulfanilic, cyclohexylaminosulfonic, stearic, alginic, β-hydroxybutyric, salicylic, galactaric and galacturonic acid. Suitable pharmaceutically acceptable base addition salts of compounds described herein include, for example, ammonium salts, metallic salts including alkali metal, alkaline earth metal and transition metal salts such as, for example, calcium, magnesium, potassium, sodium and zinc salts. Pharmaceutically acceptable base addition salts also include organic salts made from basic amines such as, for example, N,N’-dibenzylethylene-diamine, chloroprocaine, choline, diethanolamine, ethylenediamine, meglumine (N-methylglucamine) and procaine. All of these salts may be prepared from the corresponding compound by reacting, for example, the appropriate acid or base with the compound. As used herein, a “pharmaceutically effective amount,” “therapeutically effective amount,” or “effective amount” of a compound is that amount of compound that is sufficient to provide a beneficial effect to the subject to which the compound is administered. As used herein, the term “prevent” or “prevention” means no disorder or disease development if none had occurred, or no further disorder or disease development if there had already been development of the disorder or disease. Also considered is the ability of one to prevent some or all of the symptoms associated with the disorder or disease. As used herein, the terms “subject” and “individual” and “patient” can be used interchangeably and may refer to a human or non-human mammal or a bird. Non-human mammals include, for example, livestock and pets, such as ovine, bovine, porcine, canine, 10 53376748.1
Attorney Docket No.047162-7482WO1(02447) feline and murine mammals. In certain embodiments, the subject is human. As used herein, the term “treatment” or “treating” is defined as the application or administration of a therapeutic agent, i.e., a compound useful within the disclosure (alone or in combination with another pharmaceutical agent), to a patient, or application or administration of a therapeutic agent to an isolated tissue or cell line from a patient (e.g., for diagnosis or ex vivo applications), who has a disease or disorder and/or a symptom of a disease or disorder, with the purpose to cure, heal, alleviate, relieve, alter, remedy, ameliorate, improve or affect the disease or disorder and/or the symptoms of the disease or disorder. Such treatments may be specifically tailored or modified, based on knowledge obtained from the field of pharmacogenomics. Compounds of Formula (I) and Formula (II) Compounds of Formula (I) or Formula (II) or otherwise described herein can be prepared by the general schemes described herein, using the synthetic method known by those skilled in the art. The following examples illustrate non-limiting embodiments of the compound(s) described herein and their preparation. The enzyme poly(ADP-ribose) polymerase-1 (PARP1) is one of 17 members in the PARP family and is involved in the base excision repair (BER) pathway that regulates DNA single-strand break (SSB) repair. PARP1 is the most abundant PARP member and accounts for 90% of the NAD + used by the PARP family to catalyze poly(ADPribosylation) on proteins and oligonucleotides. DNA damage activates PARP1 towards addition with ADP- ribose, forming a polymeric, energy rich scaffold of poly(ADPribose) (PAR), which is an essential energy source in DNA SSB and BER. The process of DNA repair can be interrupted by PARP inhibition, which leads to the accumulation of DNA SSBs and results in synthetic lethality in cancer cells with BRCA1/2 mutations. Thus, PARP inhibitors (PARPis) are actively pursued as treatments for a variety of cancers, including ovarian, breast and brain tumors. To date, the FDA has approved four PARPis for the treatment of ovarian cancer and breast cancer, i.e., olaparib (AZD2281), niraparib, rucaparib and talazoparib. Malignant gliomas are highly aggressive tumors with poor prognosis, among which glioblastoma (GBM) is the most aggressive. Even with the intensive regimen of surgical removal followed by radio/chemotherapy, the 5-year survival rate is only 5% for GBM patients. The rapid infiltration of tumor cells into surrounding tissues limits the complete surgical excision of GBM tumors. The complex neurovascular physiology of the blood–brain barrier (BBB) and blood-tumor barrier (BTB) limits the penetration and distribution of some therapeutic drugs. 11 53376748.1
Attorney Docket No.047162-7482WO1(02447) The nature of tumor heterogeneity that contributes to the development of resistance to therapies and the active efflux of small molecule drugs are among the major challenges in finding a cure for malignant gliomas. PARP1 is overexpressed in GBM, and its levels positively correlated with tumor grades in gliomas, such as proneural and classical GBM subtypes. PET imaging allows for noninvasive whole-body quantification of protein expression and has been used to delineate tumors, provide functional information, predict patient response to a targeted therapy, assess therapeutic effects, and provide a global and dynamic picture of the disease biomarkers in primary tumors and metastatic sites. Great efforts have been devoted to developing PARP PET imaging probes using the potent PARPis olaparib and rucaparib and, more recently, talazoparib as the lead compounds, culminating in the translation of [
18F]FTT and [
18F]PARPi into human studies (Fig.1a). However, veliparib has been essentially overlooked as a leading compound for PARP PET tracer development, despite its more desirable characteristics for brain PET imaging, i.e., high brain exposure, fast brain kinetics and less P- glycoprotein (P-gp) efflux from the brain. As a therapeutic drug, veliparib has been investigated extensively to treat non-small cell lung cancer, BRCA-mutated advanced breast cancer and ovarian cancer. In fact, some of the current PARP PET tracers have been investigated as PET imaging agents in gliomas but suffer from limited brain penetration and liability to efflux by transporter proteins. Using veliparib as the lead, computational analysis was performed and an N-
11C-methylated veliparib derivative, (R)-2-(2-methyl-1-(methyl-
11C)pyrrolidin-2-yl)1H-benzo[d]imidazole-4-carboxamide ([
11C]PyBic) was identified and synthesized, based on its predicted desirable physicochemical properties as a brain penetrant PET tracer, and evaluated its potential to image and quantify PARP in GBM and healthy brains. Specifically, the in vivo specific binding signals of [
11C]PyBic were tested in a rodent GBM model through baseline and blocking studies. Ex vivo metabolite analysis showed no substantive radiometabolites in healthy rat brains. PET imaging results were corroborated by ex vivo biodistribution of [
11C]PyBic, western blotting and immunohistochemical staining of PARP1 in selected brain regions and the implanted tumors. Furthermore, the BBB penetration of [
11C]PyBic was confirmed using quantitative nonhuman primate (NHP) brain PET imaging. Blocking studies with the structurally analogous veliparib and the structurally distinctive PARPi BGB-290 (Pamiparib) confirmed PARP-specific tracer uptake in NHP brains. 12 53376748.1
Attorney Docket No.047162-7482WO1(02447)
BGB-290 (Pamiparib) In various embodiments, a compound of Formula (I), or a salt, solvate, tautomer, or stereoisomer thereof is provided:
In certain embodiments, in the compound of Formula (I): R
1 is H or C1-C6 alkyl containing at least one
11C atom; R
2 is H or
18F; R
3 is
11C or
12C; wherein the compound contains at least one of a
11C atom and a
18F atom. In various embodiments, the C
1-C
6 alkyl in the compound of Formula (I) is optionally substituted by at least one F or
18F atom. When R
1 is larger than methyl, such as ethyl, propyl, butyl, pentyl, hexyl, or branched isomers thereof, the
11C atom can replace any
12C atom in the alkyl group at any location, and all such permutations of replacing a single
12C atom by a
11C atom are herein contemplated. In various embodiments, R
1 is C1-C6 alkyl containing at least one
11C atom. In various embodiments, R
1 is C2-C6 alkyl containing at least two
11C atoms, or more. In various embodiments, R
1 is
11CH
3. In various embodiments, R
2 is
18F. In various embodiments, the compound of Formula (I) is selected from the group consisting of:
In various embodiments, the compound of Formula (I) is selected from the group 13 53376748.1
Attorney Docket No.047162-7482WO1(02447) consisting of:
In various embodiments, a compound of Formula (II), or a salt, solvate, tautomer, or stereoisomer thereof is provided:
In certain embodiments, in the compound of Formula (II): R
1 is H or C
1-C
6 alkyl containing at least one
11C atom; R
2 is
18F or
19F; and R
3 is
11C or
12C; wherein the compound contains at least one of a
11C atom and a
18F atom. In various embodiments, the C
1-C
6 alkyl in the compound of Formula (II) is optionally substituted by at least one F or
18F atom. In the compound of Formula (II), when R
1 is larger than methyl, such as ethyl, propyl, butyl, pentyl, hexyl, or branched isomers thereof, the
11C atom can replace any
12C atom in 14 53376748.1
Attorney Docket No.047162-7482WO1(02447) the alkyl group at any location, and all such permutations of replacing a single
12C atom by a
11C atom are herein contemplated. In various embodiments, R
1 is C
1-C
6 alkyl containing at least one
11C atom. In various embodiments, R
1 is C2-C6 alkyl containing at least two
11C atoms, or more. In various embodiments, R
1 is
11CH3. In various embodiments, R
2 is
18F. In various embodiments, the compound of Formula (II) is selected from the group consisting of: ,
Compounds of Formula (II) can be synthesized by alkylation (alkylative cyclization) of the amide NH
2 and imidazole nitrogen in the compound of Formula (I) forming a ring, according to methods known in the art. In various embodiments, the compound of Formula (II) is 15 53376748.1
Attorney Docket No.047162-7482WO1(02447)

The compounds described herein can possess one or more stereocenters, and each stereocenter can exist independently in either the (R) or (S) configuration. In certain embodiments, compounds described herein are present in optically active or racemic forms. It is to be understood that the compounds described herein encompass racemic, optically-active, regioisomeric and stereoisomeric forms, or combinations thereof that possess the therapeutically useful properties described herein. Preparation of optically active forms is achieved in any suitable manner, including by way of non-limiting example, by resolution of the racemic form with recrystallization techniques, synthesis from optically-active starting materials, chiral synthesis, or chromatographic separation using a chiral stationary phase. In certain embodiments, a mixture of one or more isomer is utilized as the therapeutic compound described herein. In other embodiments, compounds described herein contain one or more chiral centers. These compounds are prepared by any means, including stereoselective synthesis, enantioselective synthesis and/or separation of a mixture of enantiomers and/ or diastereomers. Resolution of compounds and isomers thereof is achieved by any means including, by way of non-limiting example, chemical processes, enzymatic processes, fractional crystallization, distillation, and chromatography. The methods and formulations described herein include the use of N-oxides (if appropriate), crystalline forms (also known as polymorphs), solvates, amorphous phases, and/or pharmaceutically acceptable salts of compounds having the structure of any compound(s) described herein, as well as metabolites and active metabolites of these compounds having the same type of activity. Solvates include water, ether (e.g., tetrahydrofuran, methyl tert-butyl ether) or alcohol (e.g., ethanol) solvates, acetates and the like. In certain embodiments, the compounds described herein exist in solvated forms with pharmaceutically acceptable solvents such as water, and ethanol. In other embodiments, the compounds described herein exist in unsolvated form. In certain embodiments, the compound(s) described herein can exist as tautomers. All tautomers are included within the scope of the compounds presented herein. In certain embodiments, compounds described herein are prepared as prodrugs. A 16 53376748.1
Attorney Docket No.047162-7482WO1(02447) “prodrug” refers to an agent that is converted into the parent drug in vivo. In certain embodiments, upon in vivo administration, a prodrug is chemically converted to the biologically, pharmaceutically or therapeutically active form of the compound. In other embodiments, a prodrug is enzymatically metabolized by one or more steps or processes to the biologically, pharmaceutically or therapeutically active form of the compound. In certain embodiments, sites on, for example, the aromatic ring portion of compound(s) described herein are susceptible to various metabolic reactions. Incorporation of appropriate substituents on the aromatic ring structures may reduce, minimize or eliminate this metabolic pathway. In certain embodiments, the appropriate substituent to decrease or eliminate the susceptibility of the aromatic ring to metabolic reactions is, by way of example only, a deuterium, a halogen, or an alkyl group. Compounds described herein also include isotopically-labeled compounds wherein one or more atoms is replaced by an atom having the same atomic number, but an atomic mass or mass number different from the atomic mass or mass number usually found in nature. Examples of isotopes suitable for inclusion in the compounds described herein include and are not limited to
2H,
3H,
11C,
13C,
14C,
36Cl,
18F,
123I,
125I,
13N,
15N,
15O,
17O,
18O,
32P, and
35S. In certain embodiments, isotopically-labeled compounds are useful in drug and/or substrate tissue distribution studies. In other embodiments, substitution with heavier isotopes such as deuterium affords greater metabolic stability (for example, increased in vivo half-life or reduced dosage requirements). In yet other embodiments, substitution with positron emitting isotopes, such as
11C,
18F,
15O and
13N, is useful in Positron Emission Topography (PET) studies for examining substrate receptor occupancy. Isotopically-labeled compounds are prepared by any suitable method or by processes using an appropriate isotopically-labeled reagent in place of the non-labeled reagent otherwise employed. In certain embodiments, the compounds described herein are labeled by other means, including, but not limited to, the use of chromophores or fluorescent moieties, bioluminescent labels, or chemiluminescent labels. The compounds described herein, and other related compounds having different substituents are synthesized using techniques and materials described herein and as described, for example, in Fieser & Fieser’s Reagents for Organic Synthesis, Volumes 1-17 (John Wiley and Sons, 1991); Rodd’s Chemistry of Carbon Compounds, Volumes 1-5 and Supplementals (Elsevier Science Publishers, 1989); Organic Reactions, Volumes 1-40 (John Wiley and Sons, 1991), Larock’s Comprehensive Organic Transformations (VCH Publishers Inc., 1989), March, Advanced Organic Chemistry 4
th Ed., (Wiley 1992); Carey & Sundberg, 17 53376748.1
Attorney Docket No.047162-7482WO1(02447) Advanced Organic Chemistry 4th Ed., Vols. A and B (Plenum 2000,2001), and Green & Wuts, Protective Groups in Organic Synthesis 3rd Ed., (Wiley 1999) (all of which are incorporated by reference for such disclosure). General methods for the preparation of compound as described herein are modified by the use of appropriate reagents and conditions, for the introduction of the various moieties found in the formula as provided herein. Compounds described herein are synthesized using any suitable procedures starting from compounds that are available from commercial sources, or are prepared using procedures described herein. In certain embodiments, reactive functional groups, such as hydroxyl, amino, imino, thio or carboxy groups, are protected in order to avoid their unwanted participation in reactions. Protecting groups are used to block some or all of the reactive moieties and prevent such groups from participating in chemical reactions until the protective group is removed. In other embodiments, each protective group is removable by a different means. Protective groups that are cleaved under totally disparate reaction conditions fulfill the requirement of differential removal. In certain embodiments, protective groups are removed by acid, base, reducing conditions (such as, for example, hydrogenolysis), and/or oxidative conditions. Groups such as trityl, dimethoxytrityl, acetal and t-butyldimethylsilyl are acid labile and are used to protect carboxy and hydroxy reactive moieties in the presence of amino groups protected with Cbz groups, which are removable by hydrogenolysis, and Fmoc groups, which are base labile. Carboxylic acid and hydroxy reactive moieties are blocked with base labile groups such as, but not limited to, methyl, ethyl, and acetyl, in the presence of amines that are blocked with acid labile groups, such as t-butyl carbamate, or with carbamates that are both acid and base stable but hydrolytically removable. In certain embodiments, carboxylic acid and hydroxy reactive moieties are blocked with hydrolytically removable protective groups such as the benzyl group, while amine groups capable of hydrogen bonding with acids are blocked with base labile groups such as Fmoc. Carboxylic acid reactive moieties are protected by conversion to simple ester compounds as exemplified herein, which include conversion to alkyl esters, or are blocked with oxidatively-removable protective groups such as 2,4-dimethoxybenzyl, while co- existing amino groups are blocked with fluoride labile silyl carbamates. Allyl blocking groups are useful in the presence of acidand baseprotecting groups since the former are stable and are subsequently removed by metal or pi-acid catalysts. For example, an allyl-blocked carboxylic acid is deprotected with a palladium-catalyzed reaction 18 53376748.1
Attorney Docket No.047162-7482WO1(02447) in the presence of acid labile t-butyl carbamate or base-labile acetate amine protecting groups. Yet another form of protecting group is a resin to which a compound or intermediate is attached. As long as the residue is attached to the resin, that functional group is blocked and does not react. Once released from the resin, the functional group is available to react. Typically blocking/protecting groups may be selected from:

. Other protecting groups, plus a detailed description of techniques applicable to the creation of protecting groups and their removal are described in Greene & Wuts, Protective Groups in Organic Synthesis, 3rd Ed., John Wiley & Sons, New York, NY, 1999, and Kocienski, Protective Groups, Thieme Verlag, New York, NY, 1994, which are incorporated herein by reference for such disclosure. PET Imaging Methods In various embodiments, a method of imaging poly(ADP-ribose) polymerase-1 (PARP1) in a subject is provided. The method includes: administering the compound of Formula (I) or Formula (II) to the subject, and imaging the compound in the subject. In various embodiments, the compound of Formula (I) or Formula (II) is administered in an amount sufficient to clinically diagnose a disease or disorder of the brain. In various embodiments, the disease or disorder of the brain is cancer. In various embodiments, the cancer in the brain expresses PARP1. In various embodiments, the imaging is or includes positron emission tomography (PET). In various embodiments, the PARP1 is imaged in the brain of the subject. In various embodiments, subject suffers from glioma. In various embodiments, the glioma can be, for example, ependymoma, anaplastic astrocytoma, 19 53376748.1
Attorney Docket No.047162-7482WO1(02447) glioblastoma, astrocytoma, brainstem glioma, diffuse midline glioma, oligodendroglioma, ganglioglioma, circumscribed astrocytic glioma, low-grade glioma, angiocentric glioma, oligoastrocytoma, pleomorphic xanthoastrocytoma, subependymal giant cell astrocytoma, dysembryoplastic neuroepithelial tumor, and the like. In various embodiments, the subject suffers from Alzheimer’s disease (AD), Parkinson’s disease (PD), and/or any other central nervous system (CNS) disease or neurological disease or disorder. In various embodiments, the method can be used to quantify the amount of PARP1 in the subject, for example, the brain of the subject or in other portions of the CNS where crossing the BBB (blood-brain barrier) is necessary and/or desirable for diagnostic purposes. In various embodiments, imaging is used or can be used to identify whether the subject will benefit from administration of a PARP1 inhibitor to treat, ameliorate, and/or prevent a disease or disorder. In various embodiments, the disease or disorder is cancer. In various embodiments, the disease or disorder is a central nervous system (CNS) disease or a neurological disease. In various embodiments, the cancer is glioma. In various embodiments, the glioma is a glioblastoma. In various embodiments, the CNS disease is Alzheimer’s disease (AD) or Parkinson’s disease (PD). The compounds of Formula (I) and Formula (II) described herein are useful in a variety of in vivo imaging applications (e.g., for tissue or whole body imaging). In certain embodiments, the compounds of Formula (I) and Formula (II) can be used to image tumors. For example, the compound(s) of Formula (I) and/or Formula (II) is/are administered to a subject in an amount sufficient to uptake the compound(s) of Formula (I) and/or Formula (II) into the tissue of interest, for example the brain. The subject is then imaged using an imaging system such as PET for an amount of time appropriate for the compound(s) of Formula (I) and/or Formula (II). The compound(s) of Formula (I) and/or Formula (II) -bound to cells or tissues expressing PARP1 are then detected by the imaging system. PET imaging with compound(s) of Formula (I) and/or Formula (II) can be used to qualitatively or quantitatively detect PARP1 protein. The compound(s) of Formula (I) and/or Formula (II) can be used as a biomarker, and the presence or absence of a positive signal (i.e., presence of PARP1) in a subject may be indicative that the subject would be responsive to a given therapy, e.g., a cancer therapy, or that the subject is responding or not to a therapy. In certain embodiments, the progression or regression of disease (e.g. tumor) can be imaged as a function of time or treatment. For instance, the size of the tumor can be 20 53376748.1
Attorney Docket No.047162-7482WO1(02447) monitored in a subject undergoing cancer therapy (e.g., chemotherapy, radiotherapy) and the extent of regression of the tumor can be monitored in real-time based on detection of the compound(s) of Formula (I) and/or Formula (II). The distribution of target molecule within one or more tumors or healthy cells may also be visualized, and monitored prior and/or during a treatment and/or a disease. In certain embodiments, the subject receiving the compound(s) of Formula (I) and/or Formula (II), is a mammal, for example, a human, dog, cat, ape, monkey, rat, or mouse. In certain embodiments, the compound(s) of Formula (I) and/or Formula (II) described herein are useful for PET imaging of brain, lungs, heart, kidneys, liver, and skin, and other organs, or tumors associated with these organs which express PARP1. In certain embodiments, the compound(s) of Formula (I) and/or Formula (II) provide a contrast of at least 25, 30, 35, 40, 45, 50, 75, 80, 85, 90, 95% or more. In certain embodiments, an image using compound(s) of Formula (I) and/or Formula (II) described herein, is obtained by administering the compounds to a subject and imaging in vivo the distribution of the compound(s) of Formula (I) and/or Formula (II) by positron emission tomography. Non-limiting Example of a PET Procedure The following illustrative non-limiting procedure may be utilized when performing PET imaging studies on patients in the clinic. A skilled artisan can modify the procedure described herein as necessary to provide clinically useful readouts. A venous catheter, e.g., a 20 G two-inch venous catheter, is inserted into the contralateral ulnar vein for radiotracer administration. Administration of the PET tracer is often timed to coincide with time of maximum (T max) or minimum (T min) of the imaging agent or precursor concentration in the blood, in this case compound(s) of Formula (I) and/or Formula (II). The patient is positioned in the PET camera and a tracer dose of the PET tracer of the compound(s) of Formula (I) and/or Formula (II) is administered via i.v. catheter. A subject may, prior to administration of the PET tracer, drink a liter of water to promote the renal clearance of unbound tracer from the circulation in order to enhance signal to background ratio and/or empty his bladder. Either arterial or venous blood samples may be taken at 15 appropriate time intervals throughout the PET scan in order to, e.g., analyze and quantitate the fraction of unmetabolized PET tracer in plasma. Images may be acquired for up to 120 min. Within ten minutes of the injection of radiotracer and at the end of the imaging session, 1 mL blood samples may be obtained, e.g., for determining the plasma concentration of any 21 53376748.1
Attorney Docket No.047162-7482WO1(02447) labeled or unlabeled imaging agent or precursor or metabolite. Two types of PET procedures may be used. One type involves obtaining single time point estimates of tracer uptake or static imaging that provides a spatial map of regional tracer concentration. With static imaging, only an average value is measured (e.g. Standardized Uptake Value, SUV). The second type is referred to as dynamic tracer imaging, which can provide considerably more information about in vivo biology by delineating both the temporal and spatial pattern of tracer uptake. See, e.g., Muzi et al. Magn Reson Imaging. 201230(9): 1203-1215. Imaging agents, such as compound(s) of Formula (I) and/or Formula (II), may be used in either static tracer imaging or dynamic tracer imaging. For quantification of tracer uptake, the clinician may visually identify tumor lesions on a PET or CT scan and determine a region-of-interest (ROI) around these lesions. Imaging agent-uptake in these ROI’s may be corrected for body weight and injected dose and quantified as standardized uptake value (SUVmax and SUVmean). Tomographic images are obtained through image reconstruction. For determining the distribution of radiotracer, ROIs may be drawn on the reconstructed image including, but not limited to, the brain, lungs, liver, heart, kidney, skin, or other organs and tissue (e.g., cancer tissue in any of the preceding list of organs). Radiotracer uptakes over time in these regions are used to generate time activity curves (TAC) obtained in the absence of any intervention or in the presence of the unlabeled targeting molecule at the various dosing paradigms examined. Data may be expressed as radioactivity per unit time per unit volume (μci/cc/mCi injected dose). PET may be accompanied by a low-dose or diagnostic CT-scan for anatomic reference purposes. By using compounds of Formula (I) and/or Formula (II), PET scanning can be used to assess whole body distribution, pharmacokinetics (PK) and pharmacodynamics (PD) and to relate findings to treatment effects. In one embodiment, a method comprises (a) administering to a subject a compound of Formula (I) or Formula (II), at a dose of about 3-14 mCi (100-518 MBq); and (b) conducting a PET scan of the subject about 1-120 minutes (such as 30-120, 30-60 or 60-120 minutes) after step (a). The PET scan may be a static PET scan or a dynamic PET scan. If the PET scan is a static PET scan, the PET scan may occur 30-120, 30-60 or 60-120 minutes after administration of the imaging agent, and if the PET scan is a dynamic PET scan, it may occur 1-120, 30-120, 30-60 or 60-120 minutes after administration of the compound of Formula (I) or Formula (II), such as 1-, 35-, 70-, or 105-minutes post injection. A dynamic PET scan may take a total duration of 30 to 120 minutes, such as 30 to 60 minutes, e.g., 30 minutes or 60 22 53376748.1
Attorney Docket No.047162-7482WO1(02447) minutes, with variable frame lengths. The scan may be a whole-body scan or a partial body scan, e.g., a scan of a single tumor. For example, a dynamic PET scan may be a scan of a single tumor and a static PET scan may be a whole-body scan. In certain embodiments, the dose administered is about 200-225 MBq (i.e., ±10%) or about 6 mCi (i.e., ±10%). In certain embodiments, a subject is a subject with cancer, and the method comprises (a) administering to the subject a compound of Formula (I) or Formula (II), at a dose of about 3-10 mCi (100-333 MBq); and (b) conducting a PET scan of the subject about 1-120 minutes (such as 30-120, 30-60 or 60-120 minutes) after step (a), wherein steps (a) and (b) are conducted prior to the initiation of a cancer treatment. In certain embodiments, a subject is a subject with cancer, and the method comprises (a) administering to the subject a compound of Formula (I) or Formula (II), at a dose of about 3-10 mCi (100-333 MBq); and (b) conducting a PET scan of the subject about 1-120 minutes (such as 30-120, 30-60 or 60-120 minutes) after step (a), wherein steps (a) and (b) are conducted at at least 2 time points, e.g., one of which is prior to the initiation of a cancer treatment, and one of which is during the cancer treatment, or wherein both time points are during the cancer treatment. The two time points may be separated by, e.g., a time of 1-10 weeks, such as 2-8 weeks, such as 5-7 weeks, such as 6 weeks. In certain embodiments, steps (a) and (b) are conducted at at least 3, 4, 5 or more time points, wherein the successive time points are separated by, e.g., a time of 1-10 weeks, such as 2-8 weeks, such as 5-7 weeks, such as 6 weeks. Methods in which more than one iteration of steps (a) and (b) are used may comprise comparing a PET scan conducted at a first time point with a PET scan conducted at a second time point, and/or later time point. Such comparison may inform on a patient’s evolution of the disease, a patient’s response to a treatment, a patient’s potential adverse reaction or other. Administration/Dosage/Formulations The regimen of administration may affect what constitutes an effective amount. The therapeutic formulations contemplated within the disclosure may be administered to the subject either prior to or after the onset of a disease and/or disorder contemplated herein. Further, several divided dosages, as well as staggered dosages may be administered daily or sequentially, or the dose may be continuously infused, or may be a bolus injection. Further, the dosages of the therapeutic formulations contemplated within the disclosure may be proportionally increased or decreased as indicated by the exigencies of the therapeutic or prophylactic situation. Administration of the compositions contemplated within the disclosure to a patient, 23 53376748.1
Attorney Docket No.047162-7482WO1(02447) preferably a mammal, more preferably a human, may be carried out using known procedures, at dosages and for periods of time effective to image a tissue and/or treat a disease and/or disorder contemplated herein in the patient. An effective amount of the therapeutic compound necessary to achieve a therapeutic effect may vary according to factors such as the state of the disease or disorder in the patient; the age, sex, and weight of the patient; and the ability of the therapeutic compound contemplated within the disclosure to image a tissue and/or treat a disease and/or disorder contemplated herein in the patient. Dosage regimens may be adjusted to provide the optimum therapeutic response. For example, several divided doses may be administered daily or the dose may be proportionally reduced as indicated by the exigencies of the therapeutic situation. A non-limiting example of an effective dose range for a therapeutic compound contemplated within the disclosure is from about 0.001 and 5,000 mg/kg of body weight/per day. One of ordinary skill in the art would be able to study the relevant factors and make the determination regarding the effective amount of the therapeutic compound without undue experimentation. Actual dosage levels of the active ingredients in the pharmaceutical compositions contemplated within the disclosure may be varied so as to obtain an amount of the active ingredient that is effective to achieve the desired therapeutic response for a particular patient, composition, and mode of administration, without being toxic to the patient. In particular, the selected dosage level depends upon a variety of factors including the activity of the particular compound employed, the time of administration, the rate of excretion of the compound, the duration of the imaging, treatment, other drugs, compounds or materials used in combination with the compound, the age, sex, weight, condition, general health and prior medical history of the patient being imaged, treated, and like factors well, known in the medical arts. A medical doctor, e.g., physician or veterinarian, having ordinary skill in the art may readily determine and prescribe the effective amount of the pharmaceutical composition required. For example, the physician or veterinarian could start doses of the compounds contemplated within the disclosure employed in the pharmaceutical composition at levels lower than that required in order to achieve the desired therapeutic effect and gradually increase the dosage until the desired effect is achieved. In particular embodiments, it is especially advantageous to formulate the compound in dosage unit form for ease of administration and uniformity of dosage. Dosage unit form as used herein refers to physically discrete units suited as unitary dosages for the patients to be imaged and/or treated; each unit containing a predetermined quantity of therapeutic 24 53376748.1
Attorney Docket No.047162-7482WO1(02447) compound calculated to produce the desired therapeutic effect in association with the required pharmaceutical vehicle. The dosage unit forms contemplated within the disclosure are dictated by and directly dependent on (a) the unique characteristics of the therapeutic compound and the particular therapeutic effect to be achieved, and (b) the limitations inherent in the art of compounding/formulating such a therapeutic compound for the imaging of a tissue and/or treatment of a disease and/or disorder contemplated herein. In certain embodiments, the compounds of the disclosure are formulated as a composition with one or more pharmaceutically acceptable excipients or carriers. In certain embodiments, the pharmaceutical compositions of the disclosure comprise a therapeutically effective amount of a compound of the disclosure and a pharmaceutically acceptable carrier. The carrier may be a solvent or dispersion medium containing, for example, water, ethanol, polyol (for example, glycerol, propylene glycol, and liquid polyethylene glycol, and the like), suitable mixtures thereof, and vegetable oils. The proper fluidity may be maintained, for example, by the use of a coating such as lecithin, by the maintenance of the required particle size in the case of dispersion and by the use of surfactants. Prevention of the action of microorganisms may be achieved by various antibacterial and antifungal agents, for example, parabens, chlorobutanol, phenol, ascorbic acid, thimerosal, and the like. In many cases, it is preferable to include isotonic agents, for example, sugars, sodium chloride, or polyalcohols such as mannitol and sorbitol, in the composition. Prolonged absorption of the injectable compositions may be brought about by including in the composition an agent which delays absorption, for example, aluminum monostearate or gelatin. In certain embodiments, the compositions of the disclosure are administered to the patient in dosages that range from one to five times per day or more. In another embodiment, the compositions of the disclosure are administered to the patient in range of dosages that include, but are not limited to, once every day, every two, days, every three days to once a week, and once every two weeks. It is readily apparent to one skilled in the art that the frequency of administration of the various combination compositions of the disclosure varies from individual to individual depending on many factors including, but not limited to, age, tissue to be imaged, disease or disorder to be treated, gender, overall health, and other factors. Thus, the disclosure should not be construed to be limited to any particular dosage regime and the precise dosage and composition to be administered to any patient is determined by the attending physical taking all other factors about the patient into account. In various embodiments, sterile injectable solutions can be prepared by incorporating the compound of Formula (I) or Formula (II) in the required amount in an appropriate solvent 25 53376748.1
Attorney Docket No.047162-7482WO1(02447) with one or a combination of ingredients enumerated above, as required, followed by sterilization microfiltration. Generally, dispersions are prepared by incorporating the active compound into a sterile vehicle that contains a basic dispersion medium and the required other ingredients from those enumerated above. In the case of sterile powders for the preparation of sterile injectable solutions, the preferred methods of preparation are vacuum drying and freeze-drying (lyophilization) that yield a powder of the active ingredient plus any additional desired ingredient from a previously sterile-filtered solution thereof. Compounds of the disclosure for administration may be in the range of from about 1 μg to about 10,000 mg, about 20 μg to about 9,500 mg, about 40 μg to about 9,000 mg, about 75 μg to about 8,500 mg, about 150 μg to about 7,500 mg, about 200 μg to about 7,000 mg, about 3050 μg to about 6,000 mg, about 500 μg to about 5,000 mg, about 750 μg to about 4,000 mg, about 1 mg to about 3,000 mg, about 10 mg to about 2,500 mg, about 20 mg to about 2,000 mg, about 25 mg to about 1,500 mg, about 30 mg to about 1,000 mg, about 40 mg to about 900 mg, about 50 mg to about 800 mg, about 60 mg to about 750 mg, about 70 mg to about 600 mg, about 80 mg to about 500 mg, and any and all whole or partial increments therebetween. In some embodiments, the dose of a compound of the disclosure is from about 1 mg and about 2,500 mg. In some embodiments, a dose of a compound of the disclosure used in compositions described herein is less than about 10,000 mg, or less than about 8,000 mg, or less than about 6,000 mg, or less than about 5,000 mg, or less than about 3,000 mg, or less than about 2,000 mg, or less than about 1,000 mg, or less than about 500 mg, or less than about 200 mg, or less than about 50 mg. Similarly, in some embodiments, a dose of a second compound as described herein is less than about 1,000 mg, or less than about 800 mg, or less than about 600 mg, or less than about 500 mg, or less than about 400 mg, or less than about 300 mg, or less than about 200 mg, or less than about 100 mg, or less than about 50 mg, or less than about 40 mg, or less than about 30 mg, or less than about 25 mg, or less than about 20 mg, or less than about 15 mg, or less than about 10 mg, or less than about 5 mg, or less than about 2 mg, or less than about 1 mg, or less than about 0.5 mg, and any and all whole or partial increments thereof. The amount of the compound of Formula (I) or Formula (II) which can be combined with a carrier material to produce a single dosage form will vary depending upon the subject being treated, and the particular mode of administration. The amount of compound of Formula (I) or Formula (II) which can be combined with a carrier material to produce a single dosage form will generally be that amount of the composition which produces a 26 53376748.1
Attorney Docket No.047162-7482WO1(02447) detectable effect. Generally, out of one hundred percent, this amount will range from about 0.01 percent to about ninety-nine percent of active ingredient, preferably from about 0.1 percent to about 70 percent, most preferably from about 1 percent to about 30 percent of active ingredient in combination with a pharmaceutically acceptable carrier. Typically, for imaging purposes it is desirable to provide the recipient with a dosage of the compound(s) of Formula (I) or Formula (II) that is in the range of from about 1 mg to 500 mg as a single intravenous infusion, although a lower or higher dosage also may be administered as circumstances dictate. Typically, it is desirable to provide the recipient with a dosage that is in the range of from about 0.1 mg to 10 mg of compound(s) of Formula (I) or Formula (II) per square meter of body surface area for the typical adult, although a lower or higher dosage also may be administered as circumstances dictate. Examples of dosages of compound(s) of Formula (I) or Formula (II) that may be administered to a human subject for imaging purposes are about 0.1 to 500 mg, 0.1 to 200 mg, about 0.1 to 70 mg, about 0.1 to 20 mg, and about 0.1 to 10 mg, although higher or lower doses may be used. Examples of dosages of compound(s) of Formula (I) or Formula (II) that can be administered to a human subject for imaging purposes are 10 μg to 1000 μg, 100 μg to 1000 μg, 100 μg to 500 μg, 200 μg to 500 μg, and 300 μg to 400 μg, although higher or lower doses may be used. For example, compound(s) of Formula (I) or Formula (II) can be administered in an amount, e.g., as a bolus injection, to a human ranging from 10 μg to 1000 μg, 100 μg to 1000 μg, 100 μg to 500 μg, 200 μg to 500 μg, and 300 μg to 400 μg. In certain embodiments, administration occurs in an amount of compound(s) of Formula (I) or Formula (II), of between 0.005 μg/kg of body weight to 50 μg/kg of body weight per day, e.g., between 0.02 μg/kg of body weight to 10 μg/kg, e.g., per day, between 0.1 μg/kg of body weight to 10 μg/kg of body weight, e.g., per day, between 1 μg/kg of body weight to 10 μg/kg of body weight, e.g., per day, between 2 μg/kg of body weight to 6 μg/kg of body weight, e.g., per day or between 4 μg/kg of body weight to 5 μg/kg of body weight, e.g., per day. In certain embodiments, the compound(s) of Formula (I) or Formula (II) is administered to a human subject in an amount between 0.1 μg/kg of body weight to 10 μg/kg of body weight, e.g., per day, between 1 μg/kg of body weight to 10 μg/kg of body weight, e.g., per day, between 2 μg/kg of body weight to 6 μg/kg of body weight, e.g., per day or between 4 μg/kg of body weight to 5 μg/kg of body weight, e.g., per day. In certain embodiments, the present disclosure is directed to a packaged pharmaceutical composition comprising a container holding a therapeutically effective amount of a compound of the disclosure, alone or in combination with a second 27 53376748.1
Attorney Docket No.047162-7482WO1(02447) pharmaceutical agent; and instructions for using the compound to treat, prevent, or reduce one or more symptoms of the disease/disorder herein in a patient. Formulations may be employed in admixtures with conventional excipients, i.e., pharmaceutically acceptable organic or inorganic carrier substances suitable for intracranially, oral, parenteral, nasal, intravenous, subcutaneous, enteral, or any other suitable mode of administration, known to the art. The pharmaceutical preparations may be sterilized and if desired mixed with auxiliary agents, e.g., lubricants, preservatives, stabilizers, wetting agents, emulsifiers, salts for influencing osmotic pressure buffers, coloring, flavoring and/or aromatic substances and the like. They may also be combined where desired with other active agents, e.g., other analgesic agents. Routes of administration of any of the compositions of the disclosure include oral, nasal, rectal, intravaginal, parenteral, buccal, sublingual or topical. The compounds for use in the disclosure may be formulated for administration by any suitable route, such as for oral or parenteral, for example, transdermal, transmucosal (e.g., sublingual, lingual, (trans)buccal, (trans)urethral, vaginal (e.g., transand perivaginally), (intra)nasal and (trans)rectal), intravesical, intrapulmonary, intraduodenal, intragastrical, intrathecal, subcutaneous, intramuscular, intradermal, intra-arterial, intravenous, intrabronchial, inhalation, and topical administration. Suitable compositions and dosage forms include, for example, tablets, capsules, caplets, pills, gel caps, troches, dispersions, suspensions, solutions, syrups, granules, beads, transdermal patches, gels, powders, pellets, magmas, lozenges, creams, pastes, plasters, lotions, discs, suppositories, liquid sprays for nasal or oral administration, dry powder or aerosolized formulations for inhalation, compositions and formulations for intravesical administration and the like. It should be understood that the formulations and compositions that would be useful in the present disclosure are not limited to the particular formulations and compositions that are described herein. Oral Administration For oral application, particularly suitable are tablets, dragees, liquids, drops, suppositories, or capsules, caplets and gelcaps. The compositions intended for oral use may be prepared according to any method known in the art and such compositions may contain one or more agents selected from the group consisting of inert, non-toxic pharmaceutically excipients that are suitable for the manufacture of tablets. Such excipients include, for example an inert diluent such as lactose; granulating and disintegrating agents such as cornstarch; binding agents such as starch; and lubricating agents such as magnesium stearate. 28 53376748.1
Attorney Docket No.047162-7482WO1(02447) The tablets may be uncoated or they may be coated by known techniques for elegance or to delay the release of the active ingredients. Formulations for oral use may also be presented as hard gelatin capsules wherein the active ingredient is mixed with an inert diluent. For oral administration, the compounds of the disclosure may be in the form of tablets or capsules prepared by conventional means with pharmaceutically acceptable excipients such as binding agents (e.g., polyvinylpyrrolidone, hydroxypropylcellulose or hydroxypropylmethylcellulose); fillers (e.g., cornstarch, lactose, microcrystalline cellulose or calcium phosphate); lubricants (e.g., magnesium stearate, talc, or silica); disintegrates (e.g., sodium starch glycollate); or wetting agents (e.g., sodium lauryl sulphate). If desired, the tablets may be coated using suitable methods and coating materials such as OPADRY™ film coating systems available from Colorcon, West Point, Pa. (e.g., OPADRY™ OY Type, OYC Type, Organic Enteric OY-P Type, Aqueous Enteric OY-A Type, OY-PM Type and OPADRY™ White, 32K18400). Liquid preparation for oral administration may be in the form of solutions, syrups or suspensions. The liquid preparations may be prepared by conventional means with pharmaceutically acceptable additives such as suspending agents (e.g., sorbitol syrup, methyl cellulose or hydrogenated edible fats); emulsifying agent (e.g., lecithin or acacia); non-aqueous vehicles (e.g., almond oil, oily esters or ethyl alcohol); and preservatives (e.g., methyl or propyl p-hydroxy benzoates or sorbic acid). The present disclosure also includes a multi-layer tablet comprising a layer providing for the delayed release of one or more compounds of the disclosure, and a further layer providing for the immediate release of another medication. Using a wax/pH-sensitive polymer mix, a gastric insoluble composition may be obtained in which the active ingredient is entrapped, ensuring its delayed release. Parenteral Administration For parenteral administration, the compounds of the disclosure may be formulated for injection or infusion, for example, intravenous, intramuscular or subcutaneous injection or infusion, or for administration in a bolus dose and/or continuous infusion. Suspensions, solutions or emulsions in an oily or aqueous vehicle, optionally containing other formulatory agents such as suspending, stabilizing and/or dispersing agents may be used. In various embodiments, the compound(s) of Formula (I) and/or Formula (II) are administered intravenously, e.g., as a bolus injection. Additional Administration Forms Additional dosage forms of this disclosure include dosage forms as described in U.S. Patents Nos.6,340,475; 6,488,962; 6,451,808; 5,972,389; 5,582,837; and 5,007,790. 29 53376748.1
Attorney Docket No.047162-7482WO1(02447) Additional dosage forms of this disclosure also include dosage forms as described in U.S. Patent Applications Nos.20030147952; 20030104062; 20030104053; 20030044466; 20030039688; and 20020051820. Additional dosage forms of this disclosure also include dosage forms as described in PCT Applications Nos. WO 03/35041; WO 03/35040; WO 03/35029; WO 03/35177; WO 03/35039; WO 02/96404; WO 02/32416; WO 01/97783; WO 01/56544; WO 01/32217; WO 98/55107; WO 98/11879; WO 97/47285; WO 93/18755; and WO 90/11757. Controlled Release Formulations and Drug Delivery Systems In certain embodiments, the formulations of the present disclosure may be, but are not limited to, short-term, rapid-offset, as well as controlled, for example, sustained release, delayed release and pulsatile release formulations. The term sustained release is used in its conventional sense to refer to a drug formulation that provides for gradual release of a drug over an extended period of time, and that may, although not necessarily, result in substantially constant blood levels of a drug over an extended time period. The period of time may be as long as a month or more and should be a release which is longer that the same amount of agent administered in bolus form. For sustained release, the compounds may be formulated with a suitable polymer or hydrophobic material which provides sustained release properties to the compounds. As such, the compounds for use the method of the disclosure may be administered in the form of microparticles, for example, by injection or in the form of wafers or discs by implantation. In certain embodiments of the disclosure, the compounds of the disclosure are administered to a patient, alone or in combination with another pharmaceutical agent, using a sustained release formulation. The term delayed release is used herein in its conventional sense to refer to a drug formulation that provides for an initial release of the drug after some delay following drug administration and that mat, although not necessarily, includes a delay of from about 10 minutes up to about 12 hours. The term pulsatile release is used herein in its conventional sense to refer to a drug formulation that provides release of the drug in such a way as to produce pulsed plasma profiles of the drug after drug administration. The term immediate release is used in its conventional sense to refer to a drug formulation that provides for release of the drug immediately after drug administration. As used herein, short-term refers to any period of time up to and including about 8 hours, about 7 hours, about 6 hours, about 5 hours, about 4 hours, about 3 hours, about 2 30 53376748.1
Attorney Docket No.047162-7482WO1(02447) hours, about 1 hour, about 40 minutes, about 20 minutes, or about 10 minutes and any or all whole or partial increments thereof after drug administration after drug administration. As used herein, rapid-offset refers to any period of time up to and including about 8 hours, about 7 hours, about 6 hours, about 5 hours, about 4 hours, about 3 hours, about 2 hours, about 1 hour, about 40 minutes, about 20 minutes, or about 10 minutes, and any and all whole or partial increments thereof after drug administration. Dosing The therapeutically effective amount or dose of a compound of the present disclosure depends on the age, sex and weight of the patient, the current medical condition of the patient and the progression of disease/disorder in the patient being treated. The skilled artisan is able to determine appropriate dosages depending on these and other factors. A suitable dose of a compound of the present disclosure may be in the range of from about 0.01 mg to about 5,000 mg per day, such as from about 0.1 mg to about 1,000 mg, for example, from about 1 mg to about 500 mg, such as about 5 mg to about 250 mg per day. The dose may be administered in a single dosage or in multiple dosages, for example from 1 to 4 or more times per day. When multiple dosages are used, the amount of each dosage may be the same or different. For example, a dose of 1 mg per day may be administered as two 0.5 mg doses, with about a 12-hour interval between doses. It is understood that the amount of compound dosed per day may be administered, in non-limiting examples, every day, every other day, every 2 days, every 3 days, every 4 days, or every 5 days. For example, with every other day administration, a 5 mg per day dose may be initiated on Monday with a first subsequent 5 mg per day dose administered on Wednesday, a second subsequent 5 mg per day dose administered on Friday, and so on. In the case wherein the patient’s status does improve, upon the doctor’s discretion the administration of the modulator of the disclosure is optionally given continuously; alternatively, the dose of drug being administered is temporarily reduced or temporarily suspended for a certain length of time (i.e., a “drug holiday”). The length of the drug holiday optionally varies between 2 days and 1 year, including by way of example only, 2 days, 3 days, 4 days, 5 days, 6 days, 7 days, 10 days, 12 days, 15 days, 20 days, 28 days, 35 days, 50 days, 70 days, 100 days, 120 days, 150 days, 180 days, 200 days, 250 days, 280 days, 300 days, 320 days, 350 days, or 365 days. The dose reduction during a drug holiday includes from 10%-100%, including, by way of example only, 10%, 15%, 20%, 25%, 30%, 35%, 40%, 45%, 50%, 55%, 60%, 65%, 70%, 75%, 80%, 85%, 90%, 95%, or 100%. 31 53376748.1
Attorney Docket No.047162-7482WO1(02447) Once improvement of the patient’s conditions has occurred, a maintenance dose is administered if necessary. Subsequently, the dosage or the frequency of administration, or both, is reduced, as a function of the patient’s condition, to a level at which the improved disease is retained. In certain embodiments, patients require intermittent imaging and/or treatment on a long-term basis upon any recurrence of symptoms and/or infection. The compounds for use in the method of the disclosure may be formulated in unit dosage form. The term “unit dosage form” refers to physically discrete units suitable as unitary dosage for patients undergoing imaging and/or treatment, with each unit containing a predetermined quantity of active material calculated to produce the desired imaging and/or therapeutic effect, optionally in association with a suitable pharmaceutical carrier. The unit dosage form may be for a single daily dose or one of multiple daily doses (e.g., about 1 to 4 or more times per day). When multiple daily doses are used, the unit dosage form may be the same or different for each dose. Toxicity and therapeutic efficacy of such therapeutic regimens are optionally determined in cell cultures or experimental animals, including, but not limited to, the determination of the LD
50 (the dose lethal to 50% of the population) and the ED
50 (the dose therapeutically effective in 50% of the population). The dose ratio between the toxic and therapeutic effects is the therapeutic index, which is expressed as the ratio between LD50 and ED
50. Capsid assembly modulators exhibiting high therapeutic indices are preferred. The data obtained from cell culture assays and animal studies are optionally used in formulating a range of dosage for use in human. The dosage of such capsid assembly modulators lies preferably within a range of circulating concentrations that include the ED
50 with minimal toxicity. The dosage optionally varies within this range depending upon the dosage form employed and the route of administration utilized. Those skilled in the art recognizes, or is able to ascertain using no more than routine experimentation, numerous equivalents to the specific procedures, embodiments, claims, and examples described herein. Such equivalents were considered to be within the scope of this disclosure and covered by the claims appended hereto. For example, it should be understood, that modifications in assay and/or reaction conditions, with art-recognized alternatives and using no more than routine experimentation, are within the scope of the present application. It is to be understood that wherever values and ranges are provided herein, all values and ranges encompassed by these values and ranges, are meant to be encompassed within the scope of the present disclosure. Moreover, all values that fall within these ranges, as well as the upper or lower limits of a range of values, are also contemplated by the present 32 53376748.1
Attorney Docket No.047162-7482WO1(02447) application. Examples The present specification further describes in detail by reference to the following experimental examples. These examples are provided for purposes of illustration only, and are not intended to be limiting unless so specified. Thus, the present specification should in no way be construed as being limited to the following examples, but rather, should be construed to encompass any and all variations which become evident as a result of the teaching provided herein. Materials and Methods Chemicals All reagents and solvents were purchased from commercial sources (Sigma-Aldrich, VWR, and Fisher Scientific) and used without further purification. The tritium-labeled PyBic, [
3H]PyBic, was purchased from Novandi Cehmistry AB (Sweden) as an ethanol solution (37 MBq/mL) with a chemical and radiochemical purity of 99% and a molar activity of 3.0 TBq/mmol (NC064-04–1).
1H NMR spectra were recorded on an Agilent 400 or 600 MHz spectrometer with tetramethylsilane as an internal standard. All chemical shifts (δ) were reported in parts per million (ppm) downfield relative to the chemical shift of tetramethylsilane. Signals were quoted as s (singlet), d (doublet), dt (double triplets), t (triplet), q (quartet), or m (multiplet). High-resolution mass spectra (HRMS) were obtained and recorded on a Thermo Scientific LTQ Orbitrap XL Elite system. The P-gp efflux assay was performed by Eurofins (MO, U.S. using a Caco-2 cell monolayer at pH 7.4. Computational study Docking calculations were performed using the PARP1 co-crystallized structure of olaparib with PDB code 5DS3. The protein binding site was prepared using the protein preparation wizard (Schrodinger, New York) in Maestro. For better accuracy, water and heteroatoms > 5 Å from the active site region were removed. The ligands were listed with tautomers and stereoisomers for the study; furthermore, geometry-optimized ligands were prepared using LigPrep wizard (Schrodinger, New York). For the docking calculations, standard-precision (SP, Schrodinger, New York) was specified for preliminary calculations, and the extra-precision (XP, Schrodinger, New York) mode was specified for the final calculations. The results were obtained from the top 70 poses obtained from Glide. 33 53376748.1
Attorney Docket No.047162-7482WO1(02447) Furthermore, the blood brain barrier relevant parameters, such as MDCK permeability, PSA, and logS, were also calculated based on the QikProp predictions (Schrodinger, New York). Synthesis of Precursor and Standard In various embodiments, compounds of Formula (I) can be synthesized according to Scheme 1.

Scheme 1 Synthesis of PyBic standard:
To a solution of (R)-Veliparib (50 mg, 0.204 mmol) in MeOH (1 mL) was added CH2O aqueous solution (37%, 70 mg, 0.818 mmol, 70 uL) and Et3N (41 mg, 0.408 mmol, 56 umL). The mixture was stirred at rt for 2 h. Then NaBH3CN solid (64 mg, 1.018 mmol) was slowly added at 0 oC, the mixture was allowed to warm up to room temperature and stirred for 4 h. The mixture was filtered through Celite®, the filtrate was concentrated under reduced pressure, and purified by flash chromatography (CH2Cl2: MeOH = 1:20 to 1:10) to afford Pybic standard as a white solid (26 mg, 10.102 mmol, 50%). The obtained date was matched 34 53376748.1
Attorney Docket No.047162-7482WO1(02447) with reference reported.

BH3·Me2S (8.61 mL, 1.0 M in THF, 8.61 mmol) was added dropwise over 1 h to a stirred solution of (S)-1-(tert-butoxycarbonyl)-2-methylpyrrolidine-2-carboxylic acid (1.79 g, 7.83 mmol) in THF (46 mL). The reaction mixture was then heated at a gentle reflux for 1 h, cooled to RT and concentrated in vacuo to yield the title compound 2 as a colourless oil (1.70 g). Rf =0.4, (Hexane/ethyl acetate, 2:1). The intermediate was used for next step without further purification. To a stirred solution of compound 2 (1.60 g, 7.45 mmol) in dichloromethane (88 mL) at 0 °C was added Dess–Martin periodinane (4.86 g, 11.5 mmol). The mixture was allowed to warm to RT, stirred for 6 h then diluted with ether (100 mL). The mixture was poured onto NaOH solution (1.3 M aq., 200 mL) and stirred for 15 min. The layers were separated and the organic layer was washed successively with NaOH solution (1.3 M aq., 60 mL) and brine (60 mL), then dried (MgSO4) and evaporated in vacuo to yield aldehyde as a yellow oil (1.55 g, 97%) that was used without further purification. Rf =0.5, (Hexane/ethyl acetate, 2:1);
1HNMR (400 MHz, CDCl3) (2:1 rotameric mixture) major rotamer: 1.37 (3 H, s), 1.40 (9 H, s), 1.58–1.71 (1 H, m), 1.87–2.02 (3 H, m), 3.41–3.67 (2 H, m), 9.32 (1 H, s); minor rotamer: 1.41 (3 H, s), 1.44 (9 H, s), 1.58–1.71 (1 H, m), 1.87–2.02 (3 H, m), 3.41–3.67 (2 H, m), 9.40 (1 H, s);
13CNMR (100 MHz, CDCl3) major rotamer: 18.7, 22.7, 28.2, 35.4, 47.4, 68.2, 80.8, 153.2, 199.6; minor rotamer: 17.9, 23.6, 28.4, 34.4, 47.4, 68.4, 80.1, 154.0, 200.2.
35 53376748.1
Attorney Docket No.047162-7482WO1(02447) To a stirred solution of 3 (1.00 g, 4.69 mmol) and Na2SO3 (2.44 g, 23.45 mmol) in MeOH (30 mL) at was added 4 (0.71 g, 4.69 mmol). The mixture was refluxed for 6 h. The mixture was quenched with H
2O (100 mL) and stirred for 15 min. The aqueous layer was extracted with ethyl acetate (50 mL) and the combined organic layers were washed with brine (60 mL), then dried (MgSO4) and evaporated in vacuo. Purification by flash column chromatography (Hexane/ethyl acetate, 5:1 to 1:1) gave the product as a yellow solid (1.45 g, 4.22 mmol, 90%). Rf =0.6, (Hexane/ethyl acetate, 1:1);
1H-NMR (400 MHz, MeOH- d4) 7.90 (dd, J = 8.0, 1.0 Hz, 1H), 7.63 (d, J = 8 Hz, 1H), 7.32 - 7.27 (m, 1H), 3.81 – 3.74 (m, 1H), 3.65−3.59 (m, 1H), 2.33 – 2.16 (m, 2H), 2.08 – 1.96 (m, 2H), 1.89 (s, 3H), 1.41 (s, 3H), 1.00 (s, 6H);
13C-NMR (100 MHz, MeOH-d4) 169.0, 160.6, 154.1, 141.0, 134.8, 122.4, 121.6, 120.9, 114.7, 79.1, 42.5, 27.3, 26.7, 22.5, 22.0.
To a stirred solution of 5 (1.00 g, 2.90 mmol) in CH2Cl2 (10 mL) at was added HCl (4M in dioxane, 11.6 mmol). The mixture was refluxed for 6 h. After filtration, solid precipitation (S)-Veliparib is obtained as a white solid (0.86 g, 2.72 mmol, 94%). Rf =0.6, (Hexane/ethyl acetate, 1:1);
1H NMR (400 MHz, DMSO-d6) δ 10.66 (d, J = 8.0 Hz, 1H), 9.59 (s, 1H), 8.95 (s, 1H), 7.87 (d, J = 7.5 Hz, 1H), 7.74 (d, J = 8.0 Hz, 1H), 7.36 (t, J = 7.8 Hz, 1H), 3.43 (d, J = 7.1 Hz, 2H), 2.56 (ddd, J = 13.1, 8.0, 5.1 Hz, 1H), 2.24 (dt, J = 13.2, 7.9 Hz, 1H), 2.11 (qd, J = 7.6, 2.5 Hz, 1H), 1.89 (s, 3H), 1.87 – 1.76 (m, 1H).
13C NMR (100 MHz, DMSO-d6) δ 166.0, 154.4, 138.4, 136.1, 123.1, 122.7, 122.3, 116.7, 65.1, 44.2, 37.0, 23.3, 22.4.
To a solution of (S)-Veliparib (64 mg, 0.20 mmol) in MeOH (1 mL) was added freshly CH
2O aqueous solution (37%, 70 mg, 0.82 mmol, 70 umL) and Et
3N (41 mg, 0.41 mmol, 56 umL). The mixture was stirred at rt for 2 h. Then NaBH3CN solid (64 mg, 1.02 mmol) was slowly added at 0
oC, the mixture was allowed to warm up to room temperature and stirred for 4 h. The mixture was filtered through Celite®, the filtrate was concentrated under reduced pressure, and purified by flash chromatography (CH
2Cl
2: MeOH = 1:20 to 1:10) to afford (S)-Me-Veliparib as a white solid (26 mg, 0.102 mmol, 50%).
1H NMR (400 36 53376748.1
Attorney Docket No.047162-7482WO1(02447) MHz, D2O) δ 7.69 (d, J = 8.1 Hz, 1H), 7.33 (t, J = 7.9 Hz, 1H), 7.72 (d, J = 7.5 Hz, 1H), 3.49- 3.61 (m, 1H), 3.79-3.99 (m, 1H), 2.25-2.43 (m, 2H), 2.49-2.56 (m, 1H), 2.61-2.68 (m, 1H), 2.88 (s, 3H), 1.94 (s, 3H).
13C NMR (100 MHz, D
2O) δ 169.30, 151.17, 137.51, 134.60, 123.68, 123.48, 119.78, 117.23, 69.10, 54.17, 37.08, 35.20, 20.28, 17.74. tert-Butyl (R)-2-(4-carbamoyl-1H-benzo[d]imidazol-2-yl)-2-methylpyrrolidine-1- carboxylate (3)

To a mixture of 2-methylimidazole (1 mmol, 1 equiv) and CDI (1.05 mmol, 1.05 equiv) was added a solution of (R)-1-(tert-butoxycarbonyl)-2-methylpyrrolidine-2carboxylic acid (1 mmol, 1 equiv) in NMP (1.5 mL). Consumption of the carboxylic acid derivative was monitored using TLC over 2 h.3-carbamoylbenzene-1,2-diaminium chloride (1 mmol, 1.0 equiv) was then added to the reaction mixture. The resultant solution was stirred at 90 °C for 12 h. Further, anhydrous sodium acetate (2.2 mmol, 2.2 equiv) and glacial acetic acid (2.2 mmol, 2.2 equiv) were added to the reaction mixture. The mixture was refluxed for 8 hr. The mixture was cooled to room temperature, poured into brine, and extracted with ethyl acetate (3 x 20 mL). The combined organic extracts were concentrated to a residue and purified by flash chromatography to obtain 3 (185 mg, 54% yield) as a colorless solid.
1H-NMR (400 MHz, MeOH-d4) 7.90 (dd, J = 8.0, 1.0 Hz, 1H), 7.63 (d, J = 8 Hz, 1H), 7.327.27 (m, 1H), 3.81 – 3.74 (m, 1H), 3.65−3.59 (m, 1H), 2.33 – 2.16 (m, 2H), 2.08 – 1.96 (m, 2H), 1.89 (s, 3H), 1.41 (s, 3H), 1.00 (s, 6H);
13C-NMR (100 MHz, MeOH-d4) 169.0, 160.6, 154.1, 141.0, 134.8, 122.4, 121.6, 120.9, 114.7, 79.1, 42.5, 27.3, 26.7, 22.5, 22.0. (R)-2-(2-methylpyrrolidin-2-yl)-1H-benzo[d]imidazole-4-carboxamide (4)

Compound 3 (172 mg, 0.5 mmol, 1 equiv) was added to isopropyl alcohol (3 mL). The mixture was stirred while heating at 65 °C until the compound was dissolved. To this solution was added concentrated hydrochloric acid (200 µL, 0.25 mmol, 5 equiv). The 37 53376748.1
Attorney Docket No.047162-7482WO1(02447) temperature was raised to 80 °C and maintained for 4 h. The mixture was then allowed to cool to room temperature. The precipitate formed was isolated, washed with i-PrOH (2 mL) and further dried in a vacuum oven at 50 °C to obtain 4 (70 mg, 40% yield) as a yellow solid. 1H NMR (400 MHz, DMSO-d6) δ 10.66 (d, J = 8.0 Hz, 1H), 9.59 (s, 1H), 8.95 (s, 1H), 7.87 (d, J = 7.5 Hz, 1H), 7.74 (d, J = 8.0 Hz, 1H), 7.36 (t, J = 7.8 Hz, 1H), 3.43 (d, J = 7.1 Hz, 2H), 2.56 (ddd, J = 13.1, 8.0, 5.1 Hz, 1H), 2.24 (dt, J = 13.2, 7.9 Hz, 1H), 2.11 (qd, J = 7.6, 2.5 Hz, 1H), 1.89 (s, 3H), 1.87 – 1.76 (m, 1H).
13C NMR (100 MHz, DMSO-d6) δ 166.0, 154.4, 138.4, 136.1, 123.1, 122.7, 122.3, 116.7, 65.1, 44.2, 37.0, 23.3, 22.4. (R)-2-(1,2-dimethylpyrrolidin-2-yl)-1H-benzo[d]imidazole-4-carboxamide (5)
Method 1: To 50 mL flask was added K2CO3 (2.5 equiv) and MeI (1.1 equiv) were added to a solution containing 4 (30 mg) and DMF (1 mL). The reaction mixture was heated at 100 °C for 12 h. After completion of the reaction, the mixture was then allowed to cool to room temperature, poured into water (10 mL) and extracted with ethyl acetate (3 x 5 mL). The combined organic portions containing 5 were concentrated to a residue. The residue was further purified using silica gel column chromatography to afford 5 (11 mg, 56% yield) as a colorless solid. 1H-NMR (400 MHz, MeOHd4) 7.87 (d, J = 8.0 Hz, 1H), 7.67 (d, J = 8 Hz, 1H), 7.28 (t, d = 8.0 Hz, 1H), 3.09 − 3.03 (m, 1H), 2.87 – 2.82 (m, 1H), 2.39−2.32 (m, 1H), 2.24 (s, 3H), 2.07 – 1.93 (m, 3H), 1.58 (s, 3H);
13C-NMR (100 MHz, MeOH-d4) δ 170.6, 161.2, 123.7, 122.9, 121.9, 121.8, 117.5, 117.3, 64.56, 54.8, 41.5, 35.7, 22.8, 18.8.. HRMS (ESI) m/z calculated for C
14H
19N
4O [M+H]: 259.1559. Found: 259.1537. Method 2: To a solution of Veliparib (20 mg, 0.071 mmol) in MeOH (3 mL) was added freshly CH2O aqueous solution (37%, 0.28 mmol) and Et3N (28 mg, 0.28 mmol). The mixture was stirred at rt for 3h. Then NaCNBH
3 solid (22 mg, 0.35 mmol) was slowly added at 0 °C, the mixture was allowed to warm up to room temperature and stirred for 2 h. The mixture was filtered through Celite®, the filtrate was concentrated under reduced pressure, and purified by flash chromatography (CH2Cl2: MeOH = 1:20 to 1:10) to afford Me- Veliparib as a white solid (14 mg, 0.055 mmol, 77%). The obtained date was matched with reference reported. 38 53376748.1
Attorney Docket No.047162-7482WO1(02447) 1H-NMR (400 MHz, MeOHd4) 7.87 (d, J = 8.0 Hz, 1H), 7.67 (d, J = 8 Hz, 1H), 7.28 (t, d = 8.0 Hz, 1H), 3.09 − 3.03 (m, 1H), 2.87 – 2.82 (m, 1H), 2.39−2.32 (m, 1H), 2.24 (s, 3H), 2.07 – 1.93 (m, 3H), 1.58 (s, 3H);
13C-NMR (100 MHz, MeOH-d4) δ 170.6, 161.2, 123.7, 122.9, 121.9, 121.8, 117.5, 117.3, 64.56, 54.8, 41.5, 35.7, 22.8, 18.8.. HRMS (ESI) m/z calculated for C14H19N4O [M+H]: 259.1559. Found: 259.1537. Synthesis of the major metabolite (6)
To a solution of 5 (70 mg, 0.27 mmol) in CH3CN (3 mL) was added tetrapropylammonium perruthenate solid (9 mg, 0.027 mmol) and NaIO
4 aqueous solution (144 mg, 0.675 mmol, 1.0 mL) at 0 °C. The mixture was stirred at 0 °C for 3h. Then the reaction was quenched with Na2SO3 aqueous solution. The mixture was filtered through Celite®, washed with MeOH (5 mL) for 3 times, the filtrate was concentrated under reduced pressure, and purified by flash chromatography (CH
2Cl
2: MeOH = 1:20 to 1:10) to afford amide 6 as a white solid (6 mg, 0.024 mmol, 9%). 1H NMR (400 MHz, MeOH-d4) δ 7.96 (d, J = 7.6 Hz, 1H), 7.70 (d, J = 8.0 Hz, 1H), 7.36 (t, J = 7.9 Hz, 1H), 2.77 (s, 3H), 2.58 (q, J = 9.2 Hz, 2H), 2.45 (td, J = 11.1, 8.9, 5.1 Hz, 1H), 2.28 (dt, J = 13.2, 8.4 Hz, 1H), 1.88 (s, 3H).
13C NMR (100 MHz, MeOH-d4) δ 176.2, 168.6, 157.0, 140.8, 135.2, 123.0, 122.3, 121.5, 115.3, 63.32, 33.3, 29.0, 25.0, 21.7. HRMS (ESI) m/z calculated for C
14H
19N
4O [M+H]: 273.1346. Found: 273.1342.
BH3·Me2S (8.61 mL, 1.0 M in THF, 8.61 mmol) was added dropwise over 1 h to a stirred solution of (R)-1-(tert-butoxycarbonyl)-2-methylpyrrolidine-2-carboxylic acid (1.79 g, 7.83 mmol) in THF (46 mL). The reaction mixture was then heated at a gentle reflux for 1 h, cooled to RT and concentrated in vacuo to yield the title compound 2 as a colourless oil (1.70 g). R
f =0.4, (Hexane/ethyl acetate, 2:1). The intermediate was used for next step without further purification. To a stirred solution of compound 2 (1.60 g, 7.45 mmol) in dichloromethane (88 mL) at 0 °C was added Dess–Martin periodinane (4.86 g, 11.5 mmol). The mixture was allowed to 39 53376748.1
Attorney Docket No.047162-7482WO1(02447) warm to RT, stirred for 6 h then diluted with ether (100 mL). The mixture was poured onto NaOH solution (1.3 M aq., 200 mL) and stirred for 15 min. The layers were separated and the organic layer was washed successively with NaOH solution (1.3 M aq., 60 mL) and brine (60 mL), then dried (MgSO4) and evaporated in vacuo to yield aldehyde as a yellow oil (1.55 g, 97%) that was used without further purification. Rf =0.5, (Hexane/ethyl acetate, 2:1);
1HNMR (400 MHz, CDCl3) (2:1 rotameric mixture) major rotamer: 1.37 (3 H, s), 1.40 (9 H, s), 1.58–1.71 (1 H, m), 1.87–2.02 (3 H, m), 3.41–3.67 (2 H, m), 9.32 (1 H, s); minor rotamer: 1.41 (3 H, s), 1.44 (9 H, s), 1.58–1.71 (1 H, m), 1.87–2.02 (3 H, m), 3.41–3.67 (2 H, m), 9.40 (1 H, s);
13CNMR (100 MHz, CDCl
3) major rotamer: 18.7, 22.7, 28.2, 35.4, 47.4, 68.2, 80.8, 153.2, 199.6; minor rotamer: 17.9, 23.6, 28.4, 34.4, 47.4, 68.4, 80.1, 154.0, 200.2.
The known key intermediates were synthesized according to the reported methods.
Synthesis of compounds of Formula (II): 40 53376748.1
Attorney Docket No.047162-7482WO1(02447)
The key intermediates were synthesized according to the reported methods.
1H NMR (400 MHz, Acetone-d6) δ 7.77 (t, J = 5.6 Hz, 1H), 7.23 (ddd, J = 19.9, 7.8, 1.2 Hz, 2H), 6.67 (t, J = 7.8 Hz, 1H), 3.11 – 2.93 (m, 2H), 3.00 – 2.68 (m, 5H), 2.01 (q, J = 8.6 Hz, 1H), 2.02 – 1.81 (m, 1H), 1.80 – 1.51 (m, 1H), 1.46 (s, 3H), 1.44 – 1.35 (m, 1H), 1.35 – 1.18 (m, 3H), 0.83 (s, 3H).
13C NMR (101 MHz, acetone) δ 167.11, 142.05, 133.32, 125.40, 122.66, 120.81, 117.39, 64.26, 52.19, 40.64, 37.65, 34.33, 21.54, 16.37.
1H NMR (400 MHz, Chloroform-d) δ 8.08 (d, J = 7.6 Hz, 1H), 7.92 (d, J = 7.8 Hz, 1H), 7.48 (d, J = 6.1 Hz, 1H), 7.32 (td, J = 7.8, 1.7 Hz, 1H), 4.45 (t, J = 9.5 Hz, 0.5H), 4.31 (t, J = 9.6 Hz, 1H), 4.18 (d, J = 9.7 Hz, 0.5 H), 3.66 (q, J = 5.0, 3.8 Hz, 2H), 3.46 (d, J = 1.7 Hz, 1H), 3.40 (dt, J = 8.6, 4.3 Hz, 1H), 2.85 – 2.66 (m, 1H), 2.60 (d, J = 7.9 Hz, 1H), 2.57 – 2.28 (m, 1H), 2.26 (d, J = 9.7 Hz, 1H), 2.27 – 1.71 (m, 3H), 1.58 (s, 3H).
13C NMR (101 MHz, Chloroform-d) δ 169.23, 142.13, 133.60, 126.79, 123.80, 121.65, 116.52, 82.48, 80.79, 65.25, 50.72, 49.58, 49.49, 49.30, 41.73, 41.69, 37.89, 21.86, 17.11. 41 53376748.1
Attorney Docket No.047162-7482WO1(02447)
1H NMR (400 MHz, Methanol-d4) δ 7.70 (dt, J = 10.5, 2.2 Hz, 1H), 7.55 (dt, J = 8.6, 2.2 Hz, 1H), 3.74 (s, 2H), 3.29 – 3.23 (m, 2H), 3.13 (s, 1H), 2.62 (s, 1H), 2.17 (t, J = 10.0 Hz, 1H), 2.14 – 2.03 (m, 1H), 2.02 – 1.92 (m, 2H), 1.90 (d, J = 1.8 Hz, 1H), 1.71 (s, 3H).
13C NMR (101 MHz, cd3od) δ 167.56, 159.77, 158.45, 157.41, 142.58, 142.46, 130.07, 117.65, 117.56, 113.39, 113.11, 108.98, 108.73, 64.04, 49.52, 45.17, 40.53, 37.02, 24.49, 24.32.
1H NMR (400 MHz, Chloroform-d) δ 7.82 (dd, J = 10.4, 2.5 Hz, 1H), 7.60 (dd, J = 8.5, 2.6 Hz, 1H), 3.75 – 3.54 (m, 2H), 3.16 (td, J = 8.5, 7.8, 2.6 Hz, 1H), 3.02 (s, 1H), 2.93 (s, 1H), 2.73 – 2.62 (m, 1H), 2.33 – 2.21 (m, 1H), 2.14 (s, 3H), 2.08 (s, 1H), 2.05 – 1.95 (m, 3H), 1.75 (s, 1H), 1.54 (s, 3H).
13C NMR (101 MHz, cdcl3) δ 168.15, 159.80, 157.44, 143.49, 143.37, 130.40, 114.16, 113.89, 110.25, 110.01, 65.03, 52.62, 41.94, 38.60, 38.19, 35.34, 34.80, 22.13, 21.72, 16.37.
1H NMR (400 MHz, DMSO-d6) δ 10.53 – 10.39 (m, 1H), 9.66 (s, 1H), 8.62 (t, J = 5.6 Hz, 1H), 8.05 (d, J = 1.9 Hz, 1H), 7.93 (d, J = 1.8 Hz, 1H), 3.61 (d, J = 4.9 Hz, 2H), 3.33 (d, J = 6.7 Hz, 2H), 2.51 – 2.34 (m, 4H), 2.12 (dt, J = 14.1, 7.1 Hz, 1H), 1.90 (d, J = 10.5 Hz, 1H), 1.75 (s, 3H).
13C NMR (101 MHz, dmso) δ 165.67, 155.24, 143.21, 132.68, 128.75, 125.34, 119.98, 114.54, 66.77, 65.49, 49.88, 43.82, 35.53, 23.13, 22.93.
1H NMR (400 MHz, Chloroform-d) δ 8.15 (s, 1H), 8.05 (s, 1H), 7.84 (s, 1H), 4.54 – 3.41 (m, 6H), 2.10 (m, 4H), 1.92 (s, 3H), 1.00 (s, 9H), 0.31 (s, 9H).
13C NMR (101 MHz, cdcl3) δ 169.87, 153.38, 141.39, 134.37, 133.35, 132.95, 132.81, 131.79, 131.38, 115.50, 80.14, 62.52, 49.09, 47.00, 41.38, 40.07, 29.66, 28.31, 27.98, 25.00, 22.24, -9.26. 42 53376748.1
Attorney Docket No.047162-7482WO1(02447) Radiochemistry Solid-phase extraction (SPE) Sep-Pak cartridges were purchased from Waters Associates (Milford, MA, USA). The HPLC system used for purification of crude product included a Shimadzu LC-20A pump, a Knauer K200 UV detector, and a Bioscan γ-flow detector, with a Luna C18(2) semipreparative column. The HPLC system used for quality control tests was composed of a Shimadzu LC-20A pump, a Shimadzu SPD-M20A PDA or SPD-20A UV detector, and a Bioscan γ-flow detector, with a Gemini NX column eluting with a mobile phase of 20% CH
3CN and 80% 0.1% triethyl amine (TEA) buffer solution (pH 11.75) at a flow rate of 2 mL/min. [
11C]CO
2 was produced through the
14N(p,α)
11C nuclear reaction by bombardment of a high-pressure target containing a mixture of nitrogen and oxygen (0.5%–1%) with a 16.8-MeV proton beam that was produced by the PET Trace cyclotron (GE Healthcare) cyclotron. [
11C]MeI was synthesized by the gas-phase method from [
11C]CO2 using the FXMeI module (GE Healthcare) by initially converting [
11C]CO2 to [
11C]-methane, followed by the reaction of [
11C]-methane with iodine at 720 °C to produce [
11C]MeI. Experimental procedure for the radiochemical synthesis of [
11C]PyBic After trapping [
11C]MeI into a reaction vial containing K
2CO
3 (2.5 equiv.) and precursor 4 (1.5 mg) in DMF (0.3 mL), the reaction mixture was heated at 100 °C for 10 min. Subsequently, the mixture was quenched with 1.5 mL of 20 mM NH4HCO3 buffer (pH = 8.8) and MeCN in an 80:20 (v/v) ratio as the HPLC eluent. The mixture was eluted with the HPLC mobile phase at a flow rate of 5 mL/ min. The product portion was collected using a semi-PrepHPLC setup using a Phenomenex Luna C-18 HPLC column (10 μm, 10 mm × 250 mm) with a retention time of approximately 20 min. The product, which was collected into 50 mL of water, was then trapped on a C18 light SepPak cartridge (Waters). The cartridge was washed with 10 mL of water. The cartridge was eluted with 1 mL of ethanol and 3 mL of saline, and the radioactive material was finally collected in a dose vial pre-charged with 7 ml of saline and 8.4% USP sodium bicarbonate solution. Alternative Experimental procedure for the radiochemical synthesis of [11C]- PyBic, [11C]-PyBic-s, [11C]-F-PyBic. 43 53376748.1
Attorney Docket No.047162-7482WO1(02447)

Sep-Pak cartridges for solid-phase extraction (SPE) were obtained from Waters Associates (Milford, MA, USA). The purification of the crude product was performed using an HPLC system comprising a Shimadzu LC-20A pump, a Knauer K200 UV detector, and a Bioscan γ-flow detector. For analytic HPLC, a different HPLC system was utilized, consisting of a Shimadzu LC-20A pump, a Shimadzu SPD-M20A PDA or SPD-20A UV detector, and a Bioscan γ-flow detector. The production of [
11C]CO
2 involved the
14N(p,α)
11C nuclear reaction, achieved by directing a 16.8-MeV proton beam from the PET Trace cyclotron (GE Healthcare) at a high- pressure target containing a nitrogen and oxygen mixture (0.5%–1%). Subsequently, [
11C]MeI was synthesized using the gas-phase method through the FXMeI module (GE Healthcare). This process began with the conversion of [
11C]CO
2 to [
11C]-methane, which was then reacted with iodine at 720 °C to yield [
11C]MeI. After trapping [
11C]MeI into a reaction vial containing Cs2CO3 (2.5 equiv.) and PyBic or PyBic-s precursor(1.5 mg) in DMF (0.3 mL), the reaction mixture was heated at 100 °C for 10 min. Subsequently, the mixture was quenched with 1.5 mL of 20 mM NH3(HCO3) buffer (pH = 8.8, with sodium ascorbate 300 mg/L) and MeCN in 80:20 (v/v) ratio as HPLC eluent. The mixture was eluted with the HPLC mobile phase, at a flow rate of 5 mL/min. The product portion was collected using a semiPrep-HPLC. The product which was collected into a 50 mL of water was then trapped on a C18 light SepPak cartridge (Waters). The cartridge was washed with 10 mL of water. The cartridge was eluted with 1 mL of ethanol and 3 mL of saline and the radioactive material was finally collected in a dose vial pre-charged with 7 ml of saline and 8.4 % USP sodium bicarbonate solution. Radiosynthesis of [
18F]-F-Veliparib
The QMA cartridge
18F Separation Cartridge 45 mg PS-HCO3- was purchased from 44 53376748.1
Attorney Docket No.047162-7482WO1(02447) Synthra GmbH (Art. No.00260110; preconditioned 5 ml EtOH, 5 ml aq. potassium triflate 90 mg/ml, 5 ml water, and 5 ml air). The used PTFE syringe filter was purchased from VWR (Art. No.514-0071; pore size 0.45 µm, 25 mm ø, preconditioned: 10 ml EtOH, 10 ml water, and 10 ml air) and the used RP cartridge was purchased from waters (Sep-Pak C18 classic cartridge, 360 mg sorbent, 55-105 µm, Art. No. WAT051910, preconditioned: 10 ml EtOH, 10 ml water, 10 ml air; Sep-Pak C18 plus light cartridge, 130 mg sorbent, 55-105 µm, Art. No. WAT023501, preconditioned: 10 ml EtOH, 10 ml water, 10 ml air). Semi-preparative HPLC was conducted using a Shimadzu LC-20A pump with a Knauer K200 UV detector and a Bioscan γ-flow detector on a Phenomenex Luna 10 µm C18(2) 100 Å column (250 × 10 mm, Phenomenex Ltd., Germany). Analytical HPLC separations employed a Shimadzu LC- 20AT pump, DGU-20A5R degasser, CBM-20A communication bus module, SPD-20A UV/Vis detector, and a Bioscan γ-flow radioactivity monitor. Data analysis was carried out using Shimadzu Client/Server software (v7.4SP4, Shimadzu Scientific Instruments, Inc.). The cyclotron produced aqueous [
18F]fluoride solution in H2
18O was transferred to a V-vial in a lead-shielded hot cell, where the [
18F]fluoride anion was trapped on an anionic exchange resin cartridge (Chromafix-PS-HCO3) pre-activated by elution sequentially with EtOH (5 mL), an aqueous solution of potassium triflate (KOTf, 90 mg/mL, 5 mL), and deionized (DI) water (5 mL). The potassium [
18F]fluoride was then eluted off the cartridge into a 2-mL V-vial with the mixture of aqueous solution of KOTf (10 mg/mL, 0.45 mL) and MeCN (0.5 mL). The eluent was azeotropically dried at 110 °C, with two portions of anhydrous MeCN (1.0 mL × 2) added during the process. A solution of the Tin precursor (5.0 mg) in anhydrous 1,3-Dimethyl-2-imidazolidinone (DMI, 0.4 mL) was then added to the reaction vial, followed by the solution of pyridine (1 M in DMI, 0.1 mL) and copper(II) triflate (0.2 M in DMI, 67 µL). The reaction mixture was then heated at 180 °C for 30 min, then HCl (6 M, 0.2 mL) were added. The reaction mixture was heated at 100 °C for another 10 min, then NaOH-EDTA solution was added (5M, 0.2 mL). The reaction mixture was diluted with the HPLC mobile phase (1.0 mL) and purified by HPLC (column: Phenomenex Gemini C18, 10 µm, 10 × 250 mm; mobile phase: 20% MeCN and 80% 0.1% Et
3N; flow rate: 5 mL/min). The eluent was monitored by a UV detector (at 254 nm) and a radioactivity detector. The fraction containing [
18F]-F-Veliparib was collected, diluted with DI water (50 mL), and passed through a C18 SepPak, which was then washed with 0.001 N HCl (10 mL) and dried with 10 cc air. The product was eluted off with EtOH (1 mL), diluted with USP grade saline (3 mL), passed through a sterile membrane filter (0.22 µm), and collected in a sterile vial pre-charged with 7 45 53376748.1
Attorney Docket No.047162-7482WO1(02447) mL of USP saline and 20 µL of 8.4% NaHCO3 to afford a formulated solution ready for administration. Analytic HPLC conditions (column: Phenomenex Gemini, 5 µm, 4.6 × 250 mm; mobile phase: 20% MeCN and 80% 0.1% Et
3N, flow rate: 5 mL/min, retention time = 7.63 min) were used in the quality control step. Experimental procedure for the radiochemical synthesis of [
11C]-PARP8.
Sep-Pak cartridges for solid-phase extraction (SPE) were obtained from Waters Associates (Milford, MA, USA). The purification of the crude product was performed using an HPLC system comprising a Shimadzu LC-20A pump, a Knauer K200 UV detector, and a Bioscan γ-flow detector. For analytic HPLC, a different HPLC system was utilized, consisting of a Shimadzu LC-20A pump, a Shimadzu SPD-M20A PDA or SPD-20A UV detector, and a Bioscan γ-flow detector. The production of [
11C]CO2 involved the
14N(p,α)
11C nuclear reaction, achieved by directing a 16.8-MeV proton beam from the PET Trace cyclotron (GE Healthcare) at a high- pressure target containing a nitrogen and oxygen mixture (0.5%–1%). Subsequently, [
11C]MeI was synthesized using the gas-phase method through the FXMeI module (GE Healthcare). This process began with the conversion of [
11C]CO
2 to [
11C]-methane, which was then reacted with iodine at 720 °C to yield [
11C]MeI. After trapping [
11C]MeI into a reaction vial containing Cs2CO3 (2.5 equiv.) and PyBic or PyBic-s precursor(1.5 mg) in DMF (0.3 mL), the reaction mixture was heated at 100 °C for 10 min. Subsequently, the mixture was quenched with 1.5 mL of 20 mM NH
4CO
3 buffer (pH = 8.8, with sodium ascorbate 300 mg/L) and MeCN in 80:20 (v/v) ratio as HPLC eluent. The mixture was eluted with the HPLC mobile phase, at a flow rate of 5 mL/min. The product portion was collected using a semiPrep-HPLC. The product which was collected into a 50 mL of water was then trapped on a C18 light SepPak cartridge (Waters). The cartridge was washed with 10 mL of water. The cartridge was eluted with 1 mL of ethanol and 3 mL of saline and the radioactive material was finally collected in a dose vial pre-charged with 7 ml of saline and 8.4 % USP sodium bicarbonate solution. Measurement of lipophilicity (log D7.4) 46 53376748.1
Attorney Docket No.047162-7482WO1(02447) The lipophilicity was determined by the modified method from previously published procedures. Log D7.4 was measured and calculated as the ratio of decay-corrected radioactivity concentrations in 1-octanol and phosphate-buffered saline (PBS, pH = 7.4, Dulbecco). Six consecutive equilibrations of [
11C]PyBic in 1-octanol and phosphatebuffered saline (PBS, pH = 7.4, Dulbecco) were performed until a constant value of log D7.4 was obtained. Saturation binding assay using [
3H]PyBic in rat hippocampus and NHP brain tissue The saturation binding assay was performed at Gifford Bioscience (UK). The hippocampus was dissected from the rat brain. The cerebellum, brain stem, frontal cortex, hippocampus, and occipital cortex were dissected from the monkey brain. The dissected brain tissues were homogenized in ice-cold buffer (50 mM Tris; 5 mM MgCl2; 5 mM EDTA; protease inhibitor cocktail). After a low-speed spin (100 × g) to remove tissue pieces, the supernatant was transferred to a fresh tube and centrifuged at 17,000 × g for 10 min at 4 °C to pellet the membranes. The pellet was resuspended in fresh buffer and centrifuged a second time. The pellet from the second spin was resuspended in buffer (50 mM Tris, 5 mM MgCl
2, 0.1 mM EDTA) containing 10% sucrose as a cryoprotectant, divided into aliquots, frozen, and stored at -80 °C. A sample of the washed membrane preparation was analyzed for protein content using the Pierce® BCA assay. Radioligand binding assays were carried out in 96- well plates in a final volume of 250 µL per well. Then, 150 µL membrane, 50 µL cold compound in buffer (or buffer alone) and 50 µL radioligand in buffer were added to each well. The plate was incubated at 30 °C for 90 min with gentle agitation. The incubation was stopped by vacuum filtration onto presoaked (incubation buffer) GF/C filters using a 96-well FilterMate™ harvester, followed by five washes with ice-cold wash buffer. Filters were then dried under a warm air stream and sealed in polyethylene, a scintillation cocktail was added, and the radioactivity was counted in a Wallac® TriLux 1450 MicroBeta counter. For each concentration of drug, nonspecific binding was subtracted from total binding to give specific binding. Data were fitted using the nonlinear curve fitting routines in Prism® (GraphPad Software Inc.) to determine K
d. and B
max. Animal model The syngeneic orthotopic RG2 tumor model was established following published protocols using male F344 rats (200–220 g, 10–12 weeks old) purchased from Charles River Laboratory. In short, RG2 cells (ATCC, Manassas, VA) were grown under standard cell 47 53376748.1
Attorney Docket No.047162-7482WO1(02447) culture conditions in T-75 flasks. Cells (~ 10,000) were suspended in sterile phosphate- buffered saline and injected into the striatum in the right hemisphere of Fischer 344 rats using a Hamilton syringe and a stereotactic device (David Kopf Instruments, Tujunga, CA). RG2 tumor growth was monitored by contrast-enhanced MR (CEMR) imaging at 14–18 days post implantation of tumor cells. The tumor volumes are from 5.8 mm
3 to 12.3 mm
3 for the 14-day post implantation cohort, from 28.9 mm
3 to 180.6 mm
3 for the 18-day post implantation cohort. Multiple cohorts of in vivo, in vitro and ex vivo studies were performed using the same (when available) or different animals. MR imaging RG2-bearing rats were scanned on an 11.7 T Magnex magnet (Magnex Scientific Ltd.) interfaced to a Bruker Avance III HD spectrometer running on ParaVision 6 (Bruker Instruments). Rats were anesthetized with isoflurane using a 70/30% N
2O/ O
2 mixture as the carrier gas delivered via a nose cone. Animals were positioned prone in a heated holder to maintain body temperature at 37 °C. Before positioning in the scanner, animals were injected subcutaneously with a bolus of 200 µL T1 contrast agent gadopentetate dimeglumine (Magnevist®, Bayer). For MRI acquisition, a 20 mm 1H surface coil was used, positioned directly above the animal’s head. After scout images were acquired to confirm positioning, T1-weighted MR images were acquired using a multi-slice spin-echo pulse sequence with a repetition time of 1000 ms, echo time of 6.4 ms, isotropic resolution of 250 µm and 4 averages. After automatic contrast adjustment of the MR images, tumor segmentation was performed using an intensity threshold and manual segmentation tools to outline the contrast- enhancing region in each slice of the MR image stack, and the segmentation results were exported. PET imaging experiments in glioblastoma rats and healthy rats First, four RG2-bearing rats underwent a 0–90 min scan (baseline, n = 2; blocking, n = 2). Then, 5 other RG2-bearing rats underwent a 0–60 min scan (baseline, n = 3; blocking, n = 2) on FOCUS-220 scanners (Siemens Medical Solutions, Knoxville, TN, USA). [
11C]PyBic (23 ± 6 MBq, 400 μL) was injected intravenously in the tail vein for both baseline and blocking scans. For blocking studies, the blocking agent veliparib (ABT-888, 5 mg/kg) was administered IV 10 min prior to the radiotracer injection. The blocking dose was prepared by dissolving 5 mg of veliparib in a solution of 1 mL of EtOH and saline in a 1:9 ratio. After the emission scan, a 9-min transmission scan was obtained for attenuation correction. 48 53376748.1
Attorney Docket No.047162-7482WO1(02447) Images were reconstructed with the 3D ordered subset expectation maximization method (OSEM3D; 2 iterations, 16 subsets) with a maximum a posteriori algorithm (MAP; 25 iterations) with corrections for decay, attenuation, scatter, normalization, and randoms. The 60- and 90-min dynamic scans were reconstructed to 20 and 26 frames, respectively: 6 × 30 s, 1 × 45 s, 2 × 60 s, 1 × 90 s, 1 × 120 s, 1 × 210 s, and 10 × 300 s for 60-min scans or 15 × 300 s for 90-min scans. An averaged PET image from 0 to 60 min for each measurement (mean of all frames) was co-registered to the T2 weighted image in the Waxholm Space rat brain atlas with 6- degree-of-freedom linear registration using an in-house manual registration tool. ROIs were extracted from the atlas, and regional time-activity curves (TACs) were obtained by applying template ROIs to the PET images. Analysis included the following ROIs: cerebellum, hippocampus, neocortex, thalamus, stratum, and brain stem (BS). Tumor and contralateral nontumor ROIs were manually drawn on the individual 0–60/90 min summed PET images by referring to each individual contrast-enhanced MRI. For P-gp inhibitor studies, PET scans were performed with (n = 1) or without (n = 2) the pre-injected P-gp inhibitor verapamil (1 mg/kg, i.v., 10 min before radiotracer injection) using [
11C]PyBic in healthy rats. Quantitative analysis for rodent PET IDL programs developed in house in Yale University PET Center was used for rodent and following monkey PET imaging analysis. The simplified reference tissue model 2 (SRTM2) was used to estimate the distribution volume ratio (DVR) using the contralateral as a reference region. The first 60 min dynamic scan data were used in the kinetic modeling analysis, generating similar DVR to using the 90 min dynamic scan data (Fig.9). PET imaging in rhesus monkeys Two rhesus monkeys (Macaca mulatta) were used in the study. For Monkey 1, a 120- min long dynamic PET scan (one baseline and one blocking scan with veliparib) was carried out. For Monkey 2, a total of 2 baseline scans (test, retest), 2 blocking scans with veliparib (2.5 mg/ kg) and BGB290 (0.5 mg/kg), and one P-gp inhibitor tariquidar (1.4 mg/kg) were carried out on a FOCUS220 scanner. PET imaging reconstruction was performed using similar procedures as described previously. To define the regions of interest (ROIs), MR images were acquired using a Siemens 3 T Trio scanner and co-registered to an inhouse-generated monkey brain atlas and 49 53376748.1
Attorney Docket No.047162-7482WO1(02447) the PET images. The PET emission data were reconstructed using a Fourier re-binning and filtered back projection algorithm with a Shepp-Logan filter. SUV TACs were generated for the brain stem, cerebellum, frontal cortex, occipital cortex and globus pallidus. Ex vivo biodistribution experiments Seven RG2-bearing rats were used in the ex vivo biodistribution analysis. Briefly, [
11C]PyBic (15.8 ± 5.0 MBq) were injected as a bolus in the presence (blocking, n = 3) or absence of veliparib (baseline, n = 4, 5 mg/kg, i.v.). Animals were euthanized at 60 min post injection of the radiotracer. Blood and preselected organs, such as the olfactory, cerebellum, brain stem, tumor, muscle, spleen, kidney, liver, lung, and hippocampus, were collected, weighed, and counted in an automatic Wizard γ counter (PerkinElmer). Radioactivity concentrations were normalized against weight, decay-corrected, and expressed as percentage of injected dose per gram tissue (%ID/g) or SUV. Western blotting Western blotting was performed on normal brain and tumor tissues from RG2 rats that were lysed in protein lysis buffer (1% SDS, 10% glycerol, in 25 mM Tris–HCl, pH 6.8) supplemented with proteinase inhibitors (cOmplete™, Cat# 11,836,170,001, Sigma) and phosphatase inhibitors (PhosSTOP™, Cat # 4,906,845,001, Sigma). Three micrograms of protein were separated using WES capillary electrophoresis (ProteinSimple) and incubated with rabbit polyclonal anti-PARP1 antibody (Proteintech, Cat# 13,371–1-AP) in antibody dilution buffer provided with the WES machine. Compass software provided by ProteinSimple was used to analyze the western blot results. The absolute chemiluminescent signal values of the area under the specific peak curve generated by Compass were used to quantify the protein expression level. Immunohistochemistry Sagittal-cut rat brains with RG2 tumors were paraffin-embedded and cut into 10- micron sections and deparaffinized and rehydrated for immunohistochemistry staining of PARP1 using the abovementioned antibody. Slides were blocked with 2% normal goat serum for 1 h, incubated with anti-PARP1 antibody (1:200) overnight at 4 °C, and incubated with biotin-conjugated secondary antibody for 1 h, followed by streptavidin–horseradish peroxidase and substrate application according to the manufacturer’s instructions (Vector Labs). Vectashield with DAPI was used for nuclear counterstaining, and sections were 50 53376748.1
Attorney Docket No.047162-7482WO1(02447) scanned using Aperio AT2 at 20 × with a minimum of 5 focus points verified prior to automated scanning in Yale Pathology Tissue Services. Images were obtained using Aperio ImageScope (v12.4.3.5008). Metabolite analysis Two different metabolite studies, first with tumor-bearing rats and later with a nonhuman primate, were performed. The activity of the blood sample was measured. The plasma fraction was collected by centrifugation of the blood. For rats, the plasma was mixed with a urea solution and further diluted with a 0.2 mL (80:20) mixture of ammonium formate aqueous solution (0.1 M) and MeCN and run under the same solution as the mobile phase at 1 mL/min in a Gemini HPLC column (NX, 5μm). For NHP plasma metabolite analysis, the NHP plasma was diluted with an HPLC mobile phase comprising an 85:15 ratio of ammonium formate aqueous solution (0.1 M) and MeCN and run in a Gemini NX column at a 1.2 mL/min flow rate. Kinetic modeling Volume of distribution (V
T, mL·cm
−3) values were derived through 1-tissue (1 T) compartment, 2TCM, and MA1 kinetic modeling as described before. Non-displaceable binding potential (BP
ND) values were calculated from V
T values based on the formula BP
ND = (V
T − V
ND)/V
ND. Target occupancy and V
ND were calculated using the Lassen plot. Statistical analysis Unpaired and two-sided Student t tests were performed using GraphPad Prism. All data are presented as the mean ± SD unless described otherwise. In vivo and in vitro experiments were repeated at least 2 times/experiment with the “n” number detailed in the corresponding figure legends. Statistical significance was defined as P < 0.05. Results Computational studies Computational studies were performed to analyze the physicochemical properties of PyBic in comparison with veliparib. From the docking study, it was determined that the secondary interactions of PyBic with PARP1 were consistent with those of veliparib. Then, the physicochemical and pharmacological parameters were calculated, i.e., LogP, MDCK permeability, PSA, LogS, and XP scores, to predict the brain permeability and binding 51 53376748.1
Attorney Docket No.047162-7482WO1(02447) affinity of PyBic (Table 1). The calculated XP score (-7.866) was slightly higher than that of veliparib (-7.976), which was consistent with their reported IC50 values (6 nM and 5.2 nM for PyBic and veliparib, respectively. With the extra methyl group, PyBic was predicted to possess higher lipophilicity (LogP), lower polar surface area (PSA), and improved membrane permeability (MDCK permeability) than veliparib. Furthermore, a hydrogen bond donor was removed by N-methylating pyrrolidine, presumably reducing its liability to P-gp efflux. The changes in physicochemical properties suggested improved BBB penetration for PyBic over veliparib. Therefore, radiolabeling was pursued and in vitro and in vivo evaluations of PyBic as the lead brain-penetrant PARP PET tracer. Chemistry and radiochemistry It was reasoned that [
11C]PyBic can be obtained via a chemoselective N-methylation reaction using [
11C]MeI and veliparib as the labeling precursor. Veliparib (4) and the PyBic standard (5) were synthesized following the reported procedure with slight modifications (Fig.7a). The reference standard (5) was synthesized from precursor 4 using either methyl iodide (MeI) under basic conditions in 56% yield or paraformaldehyde in 77% yield. [
11C]PyBic was synthesized in 43 ± 10% decay-corrected radiochemical yields after formulation (962 to 1554 MBq, n = 8, Supplementary Table 1, Fig.7b). The identity of the purified radiotracer was inferred from the coelution of the radiotracer with PyBic standard compound 5 on radio-HPLC (Fig.7c). Formulated [
11C] PyBic was obtained with greater than 97% radiochemical purity (RCP) and a molar activity of 148 ± 85 MBq/nmol (n = 6). The whole production process, starting from the trapping of [
11C]MeI, including the synthesis, purification and formulation, lasted approximately 60 min. LogD measurement The LogD7.4 of [
11C]PyBic was determined to be 1.76 ± 0.05 (n = 5), which is higher than the calculated LogP value (1.18) but still within the optimal range for BBB penetration. [
11C]PyBic PET imaging in RG2‑bearing rat brains To explore the feasibility of using [
11C]PyBic in rat brain PET imaging, tritium- labeled PyBic, [
3H] PyBic (Fig.8A) was obtained for saturation binding assays using rat hippocampal homogenates. The K
D and B
max values in the rat hippocampus were 0.46 nM and 50 fmol/mg (protein), respectively. Assuming the protein content of rat brain tissue is 9.1% and the brain tissue density is 1 g/mL, the calculated Bmax was 4.6 nM and the Bmax to KD 52 53376748.1
Attorney Docket No.047162-7482WO1(02447) ratio was 10, suggesting the feasibility of imaging PARP1 in the rat brain using [
11C]PyBic (Fig.8B). To evaluate [
11C]PyBic in RG2 tumor-bearing rats (n = 16), imaged 12 RG2 tumor- bearing rats were imaged for tumor assessment using contrast-enhanced MR (CEMR). The RG2 tumor size ranged from 6.5 to 180.6 mm
3 at 14–18 days post-implantation of tumor cells, and the average size was 54.6 ± 56.0 mm
3 (mean ± SD). After confirming tumor formation in the rat brains, [
11C]PyBic PET imaging in 9 rats was carried out for either a 0– 90 min or a 0–60 min scan. The administered dose of [
11C]PyBic was equivalent to 0.4 ± 0.12 μg/kg of cold mass of PyBic. In baseline scans (n = 5), the standardized uptake value (SUV) images summed from 30 to 60 min post-injection (p.i.) showed high contrast between the tumor region and the contralateral nontumor brain region, as outlined in Fig.2A, which was markedly higher than that in the blocking scans (n = 4), in which veliparib (5 mg/kg, i.v.) was administered before tracer injections (Fig.2B). The tumor uptake plateaued within 30 min p.i., with a baseline tumor SUV of 1.0 ± 0.22 (mean ± SD) averaged from 30 to 60 min p.i. The contralateral nontumor brain region showed much lower tracer uptake, with an average SUV of 0.39 ± 0.04 (mean ± SD, Fig. 2C). All the selected normal brain regions showed significantly lower tracer uptake than the tumors (p < 0.05, Fig.2C). With the preinjected PARP1/2 inhibitor veliparib (5 mg/kg, i.v.), the tumor SUV exceeded 1 within 10 min p.i. and then decreased to 0.39 ± 0.10 (mean ± SD) after 40 min p.i. (Fig.2D). Veliparib provided 61% blockade of tracer binding based on the SUV (30–60 min) data (p = 0.0003, t test, Figs.2C-2D). Injection of the P-gp inhibitor verapamil (n = 1) did not change the brain SUVs compared to baseline injections in healthy rats (n = 2) (Figs.10A-10B), indicating that [
11C]PyBic is unlikely a substrate of P-gp. This is consistent with the in vitro Caco-2 cell monolayer permeability test results, which showed an efflux ratio of 0.52 for PyBic. Table 1: Binding affinity and physicochemical properties of PyBic and veliparib. IC
50 LogP MDCK PSA LogS XP PyBic 6 nM 1.18 91.6 77.3 -2.21 - 7.866 Veliparib PARP1: 5.2 nM 0.58 60.57 86.7 -1.693 - PARP2: 2.9 nM 7.976 Optimal range < 10 nM 1—3 25—500 < 90 -6.05—0.5 [
11C]PyBic PET quantitative analysis in RG2 rats 53 53376748.1
Attorney Docket No.047162-7482WO1(02447) For the quantitative PET analysis, the regional distribution volume ratio (DVR) was calculated using the simplified reference tissue method 2 (SRTM2) with the contralateral nontumor region of interest (ROI) defined as shown in Fig.2A/B as the reference region. The contralateral nontumor ROI was chosen as the reference region because it was the brain region with the lowest tracer uptake and was the least influenced by preinjected veliparib as the blocking drug (Figs.10A-10B). Using the pilot 90-min scan data (n = 4), a strong linear correlation was observed between DVR (0–60 min) and DVR (0–90 min). Thus, DVR derived using 0–60 min data is sufficient for [
11C]PyBic quantitative analyses, and DVRs from 0–60 min scan (n = 9) were used in the following analysis. In the baseline scans, the highest tracer uptake was in the tumor (DVR: 3.33 ± 0.40, n = 5). The average tumor DVR was decreased by 51% in blocking scans (1.62 ± 0.16, n = 4, p = 0.049, Fig.2E). There were smaller but statistically significant 28% and 30% differences in DVR between baseline and blocking scans in neocortex and cerebellum, respectively, strongly suggesting that there is PARP-specific uptake in these brain regions. Note that partial volume effects contribute to inter-regional variation in uptake due to differential spill-in from other brain regions and from the extra-cranial tissue. Further confirmation from ex vivo and in vitro AR study is needed to confirm this in vivo imaging finding. Considering the compromised BBB at the tumor site, these data are insufficient to prove the brain penetration of [
11C]PyBic, as [
11C]PyBic and veliparib might be able to diffuse into healthy brain regions through the leaky BBB around the RG2 tumor. The DVRs of the other brain regions did not show significant differences between baseline and blocking scans, indicating similar PARP1 expression levels in these brain regions and the contralateral cortex. [
11C]PyBic metabolism study in rats The radiometabolites were examined in rat plasma and brain (n = 4) at 60 min p.i. of [
11C]PyBic. The parent fraction of [
11C]PyBic at 60 min p.i. was 31% and 90% in the plasma and brain, respectively. Two major radiometabolite peaks with HPLC retention times of approximately 3.5 min and 6.5 min were detected, while the retention time of the parent tracer was approximately 5 min (Fig.2F). Ex vivo biodistribution study To validate the PET imaging results and determine the extent of nonspecific binding, biodistribution studies of [
11C]PyBic in RG2 rats were performed at 60 min p.i. with (blocking, n = 3) or without preinjected veliparib (baseline, n = 4). A complete PARP1/2 54 53376748.1
Attorney Docket No.047162-7482WO1(02447) blockade at the i.v. dose of 5 mg/kg was expected, as the estimated Cmax, plasma (1.64 µM) is 328-fold of the IC50 of veliparib and the estimated Cmax, brain (0.42 µM) is 84-fold of the IC
50 of veliparib. The biodistribution data showed that [
11C]PyBic had the highest uptake in the tumor (0.85 ± 0.3%ID/g, n = 4) and spleen (2.85 ± 0.3%ID/g, n = 4). The uptake of [
11C]PyBic was reduced by 75% (n = 4, p = 0.021) and 74% (n = 4, p = 0.0004) in the tumor and spleen, respectively, by veliparib pre-administration (Fig.3A). The mean tumor uptake as represented by SUV (1.97 ± 0.68, n = 4) derived from the biodistribution data was nearly twice the mean tumor PET SUV (Fig.12). The difference between PET and biodistribution data is likely due to partial volume effects associated with small animal PET imaging. Interestingly, the tissue-to-plasma ratios for [
11C] PyBic at 60 min p.i. under the blocking condition are comparable to those of [
3H]veliparib under similar blocking conditions (veliparib, 5 mg/kg, i.v.) for the spleen, kidney, liver, and lung, indicating similar levels of nonspecific binding for these two tracers in these selected tissues. However, [
11C]PyBic exhibits a lower nonspecific signal in muscle and relatively higher nonspecific signals in the brain than [
3H] veliparib (Table 3). The mean tissue-to-plasma ratios for [
11C]PyBic in selected rat tissues were as follows: brain (0.9), kidney (5.3), liver (4.7), lungs (2.4), spleen (4.0), muscle (2.2) at 60 min p.i. under blocking conditions with preinjected veliparib (5 mg/kg, i.v.). Using data from the biodistribution study, the tracer uptake in tumors normalized by different brain regions, muscle, and blood were compared and found that tumor-to-blood ratios showed the greatest difference between baseline and blocking groups (8.39 ± 2.10, n = 4; 1.05 ± 0.29, n = 3, for baseline and blocking groups, respectively, p = 0.032, Fig.3B), indicating ubiquitous baseline PARP expression in rodent brain and muscle. Compared with using other brain regions as the reference region, the tumor-to-contralateral cortex (tumor/cortex) ratios of the baseline and blocking groups had the greatest statistical significance (6.2 ± 2.1; 1.5 ± 0.6, for baseline and blocking studies, respectively, p = 0.017, Fig.3B), supporting the use of the contralateral nontumor cortex region as the reference region in the PET data analysis. The difference in tissue-to-blood ratios between baseline and blocking studies against the tissue-to-blood ratios at baseline for the spleen, tumor, olfactory bulb, cerebellum, and neocortex, was plotted which showed excellent linearity and fit (Y = 0.89 * X—0.51, R
2 = 0.9996, Fig.3C), indicating high PARP-specific tracer uptake in these tissues. The baseline PET DVR values of the tumor, contralateral nontumor cortex, hippocampus, brain stem and cerebellum correlated well with the biodistribution data (Y = 2.547*X-1.911, R
2 = 0.9, Fig.3D), which supported the use of SRTM2 for the quantitative 55 53376748.1
Attorney Docket No.047162-7482WO1(02447) analysis of PET imaging data in RG2 rats. PET DVR values were lower than the biodistribution data, indicating underestimation of the ratios in the PET results, likely due to partial volume effects in the tumor. Table 2: Volume of distribution (VT) values (mL/cm
3) of [
11C] primates of PyBic in two non- human primates (NHPs) under baseline conditions or with preinjected Veliparib, BGB290, or tariquidar. Brain region Baseline Blocking Baseline Blocking P-gp inhibition V
eliparib Test Retest Veliparib BGB290 Tariquidar brainstem 11.0 2.1 8.4 9.1 1.6 1.5 8.0 caudate 10.8 2.4 14.7 9.4 2.2 2.4 8.4 cerebellum 17.6 2.3 14.9 14.0 2.0 1.8 12.4 cingulate 11.9 2.6 14.6 14.0 2.9 3.2 12.4
frontal cortex 12.9 2.4 19.7 18.2 2.8 3.0 14.6 insula 12.3 2.6 11.2 12.7 2.4 2.9 10.9 occipital cortex 15.5 2.2 16.3 15.8 2.0 2.2 13.5 pons 11.6 2.2 8.0 9.9 1.6 1.6 8.9 putamen 13.8 2.5 9.5 11.9 2.1 2.4 10.4 temporal cortex 12.9 2.3 14.7 13.8 2.3 2.6 12.0
thalamus 11.2 2.4 6.9 7.7 1.8 2.2 7.8 Table 3. Comparison of tissue-to-blood ratios of [
11C]PyBic and [
3H]Veliparib treated rats at 60 min p.i. PARP1 expression correlates with in vivo [
11C]PyBic uptake Immunohistochemical (IHC) staining of PARP1 in RG2-bearing rat brains indicated that PARP1 expression in tumor tissues was noticeably higher than that in normal brain tissue (Fig.4A). The expression of PARP1 was heterogeneous across the tumor tissues, with the tumor border exhibiting the highest PARP1 expression (Fig.4B). Using capillary 56 53376748.1
Attorney Docket No.047162-7482WO1(02447) electrophoresis western blotting (WES), the expression of PARP1 in the cortex, olfactory bulb, brain stem, cerebellum, hippocampus, and tumor was compared. Consistent with the in vivo PET imaging, ex vivo biodistribution, and in vitro IHC results, tumor tissues expressed significantly higher levels of PARP1 compared to the cortex (p = 0.0036), brain stem (p = 0.0041), and hippocampus (p = 0.0013) (Figs.4C-4D, Figs.13a-13c), with the lowest levels found in the brain stem and hippocampus. Linear correlational analyses between WES, biodistribution and PET imaging was carried out and a positive linear correlation between WES and biodistribution data (Y = 406,275*X + 118,898, R
2 = 0.88, Fig.4e) was found, as well as between WES and PET data (Y = 143,581*X—13,574, R
2 = 0.84, Fig.4F). In vivo NHP PET imaging study with [
11C]PyBic To facilitate clinical translation and confirm the brain penetration of [
11C]PyBic in larger animals with intact BBB, PET imaging studies were performed in healthy NHPs, with the collection of arterial blood for metabolism analysis and generation of arterial input function (AIF). [
11C]PyBic (194 MBq, mean, n = 2) was injected into one healthy rhesus monkey (Monkey 1) with or without veliparib (2.5 mg/ kg, i.v. and scanned for 2 h. A second monkey (Monkey 2) was injected with [
11C]PyBic (256 MBq ± 83 MBq, n = 5) and scanned twice under baseline conditions for a test–retest comparison, once with preinjected veliparib (2.5 mg/kg, i.v.), once with preinjected BGB290 (PARPi, 0.5 mg/kg, i.v.), and once with the infusion of the P-gp inhibitor tariquidar (1 mg/kg, i.v. over 30 min) to study the effect of P-gp inhibition on the brain uptake of [
11C] PyBic. Summed baseline SUV images from the early time (10–20 min p.i.) and late time windows (60–90 min p.i.) showed fast tracer entrance into the brain and sustained retention in all brain regions (Fig.5A), consistent with the ubiquitous expression pattern of PARP1 in the monkey brain. The test and retest studies in the same animal showed nearly perfect overlap of the AIF (Fig.14A). In the blocking scan, the early SUV (10–20 min) was higher than the baseline SUV, which was due to the increased tracer plasma concentration caused by the blockade of peripheral PARP1/2 binding by veliparib (Fig.14B). Similarly, BGB290, a structurally different PARP1/2 inhibitor, also increased plasma and brain SUVs in the earlier period compared to baseline (Fig.14C). Injection of the P-gp inhibitor tariquidar did not change the AIF compared to the baseline study (Fig.14D). The late-time SUV (60–90 min) images of the blocking scans showed consistently low and nearly homogeneous tracer distribution in all brain regions, indicating effective blockade by veliparib and BGB290 at the injected doses. From the baseline time-activity curves (TACs), the cerebellum had the highest 57 53376748.1
Attorney Docket No.047162-7482WO1(02447) uptake, followed by the occipital cortex, frontal cortex and globus pallidus, showing the lowest tracer uptake, while in the blocking scans, the tracer washed out of the brain quickly, with reduced contrast among brain regions at later imaging windows due to the effective blockade of PARP binding sites in all brain regions (Figs.5B-5C). [
11C]PyBic metabolism study in NHP Similar to the rat metabolism study, the same two major radiometabolite peaks from the radio-HPLC chromatograms were observed, indicating cross-species conservation in the metabolism profiles of [
11C]PyBic. The metabolism rate of this tracer was moderate in NHPs, with plasma parent fractions of 73% and 52% at 15 min and 90 min p.i., respectively (Fig. 5D). The radiometabolites were not expected to be brain penetrant, at least not to an extent enough to interfere with the quantification of PARP1 in the brain, based on the rat brain homogenate radio-HPLC data (Fig.2F). Brain PET kinetic modeling in NHPs To estimate the regional distribution volume (V
T) and the ratio of tracer concentration in the brain to that in plasma at equilibrium, the use of the 1-tissue compartment model (1TCM), 2-tissue compartment model (2TCM) and the multilinear analysis (MA1) method were compared. Both the 1TCM and MA1 methods produced good fits with the TACs, with 1TCM producing more reliable brain regional V
T values, which are consistent with the MA1 VT values (Fig.15), while the 2TCM produced VT with large standard errors in several brain regions. V
T from 1TCM was used in the following analysis. Based on the Lassen plot analysis, both the structurally analogous veliparib and the structurally dissimilar PARPi BGB290 blocked more than 90% of the binding of [
11C]PyBic in the monkey brains (Fig.6), indicating the high in vivo binding specificity of [
11C]PyBic. The mean non-displaceable volume of distribution (V
ND) of [
11C]PyBic was 1.81 mL/cm
3. The V
T values from 1TCM in the monkey baseline scan ranged from 7.3 mL/cm
3 for the amygdala to 15.5 mL/cm
3 for the occipital cortex (Table 2), while the VT values for the monkey blocking scan ranged from 2.1 mL/cm
3 to 2.7 mL/cm
3. Both K
1 and V
T calculated using 1 T models were similar between the test and retest baseline as well as with the P-gp inhibition scan using tariquidar as the P- gp inhibitor. Using the average V
ND from three blocking scans, the non-displaceable binding potential (BP
ND) for the brain regions of the two monkeys was obtained. The brainstem was found to have the lowest BPND, while the frontal cortex and occipital cortex had relatively 58 53376748.1
Attorney Docket No.047162-7482WO1(02447) higher BPND. Selected Discussion PET imaging results showed higher tracer uptake in the orthotopic RG2 glioblastoma relative to the rest of the rat brain. The quantification of PARP1 using molecular biological methods and biodistribution analysis confirmed the PET imaging results. The uptake of [
11C] PyBic is significantly reduced by the PARP1/2 inhibitor veliparib in both PET imaging and biodistribution analysis, indicating the in vivo binding specificity of the radiotracer. The high brain-to-plasma ratio in healthy NHPs demonstrated the high brain permeability and specific binding of [
11C]PyBic in NHPs, supporting its use as a brain PARP PET imaging probe. Several PARPi-derived PET radiotracers have been developed for PARP imaging. PET tracer [
11C]PJ34 was intended for imaging PARP in a streptozotocin-induced type I diabetes-related necrosis model, where a higher uptake of [
11C]PJ34 in both the pancreas and liver was observed. Two
18F-labeled analogs of 59laparib, [
18F] FBO and [
18F]PARP-Fl, have been used to image rodent models of ovarian cancer, pancreatic cancer, and glioma. PET studies on the rucaparib/AG14699-derivative [
18F] FluorThanatrace ([
18F]FTT) demonstrated high tracer uptake in a xenograft model of human breast cancer. The first clinical PARP PET imaging study using [
18F]FTT in ovarian cancer patients (NCT02469129) indicated a positive correlation between tumor SUVs and PARP1 expression levels. In addition, a study using [
18F]FTT showed the highest tracer uptake in the spleen, pancreas, and liver in healthy human volunteers and the tumor regions of pancreatic ductal adenocarcinoma, biphenotypic hepatocellular carcinoma and cholangiocarcinoma among the 8 different malignant tumors examined. Recently, the drug engagement of different PARPis in small-cell lung cancer patient-derived xenografts (PDX) was explored using [
18F]PARPi and the fluorescent probe PARPi-FL, which have important implications in PARPi drug development, treatment planning and monitoring in the clinic. [
18F]PARPi has been evaluated in GBM patients recently, but its brain imaging characteristics have not yet been studied in healthy animals or humans. A PET imaging probe ([
18F] SuPAR), a radiofluorinated NAD + analog that can be recognized by PARP and incorporated into the long-branched PAR for measuring PARP activity, was reported. With [
18F]SuPAR, it was possible to map the dose- and time- dependent activation of PARP following radio/chemotherapy in breast and cervical cancer xenograft models. Preliminary biodistribution studies of [
18F]talazoparib in the murine PC-3 tumor model showed that [
18F]talazoparib had a good level of tumor uptake that persisted for over 8 h. 59 53376748.1
Attorney Docket No.047162-7482WO1(02447) Both olaparib and rucaparib have relatively high PARP trapping capability, which makes them good candidates as cancer therapeutics. However, neither of them nor their analogs have been shown to achieve desirable brain penetration as PET imaging agents due to their liability to active drug efflux. Compared to olaparib and rucaparib, veliparib (ABT-888) has a relatively lower PARP trapping capability and is reported to be a weak P-gp substrate, which makes it appealing as a lead compound for developing brain PET imaging agents with fast and reversible brain kinetics. Encouraged by the in silico prediction results, an N- methylated derivative of veliparib, PyBic, was synthesized on the premise that the removal of the N–H hydrogen-bond donor would further decrease its susceptibility to active efflux at the BBB and that the slightly increased hydrophobicity would improve its cell membrane permeability and BBB penetration. The imaging characteristics of [
11C]PyBic were tested in a syngeneic rat model of glioblastoma. PARP1 is constitutively expressed in most tissue types, and it has been found to be upregulated in many different malignant cells, including brain tumors. To test the in vivo binding specificity of this tracer and explore its brain penetration at the same time, the syngeneic RG2 rat model was chosen, where RG2 glioblastoma cells were orthotopically injected into the right striatum of Fischer 344 (F344) rats, as the chemotherapeutic refractory RG2 rat brain tumor model has been used in the evaluation of PARPi’s therapeutic effects. Due to the difficulties in obtaining arterial blood for arterial input function generation in rats, the simplified reference tissue method 2 (SRTM2) was used for quantitative imaging analysis. Except for tumors, all brain regions showed similarly low tracer uptake, reflecting a relatively low level of PARP1 expression in normal rat brain tissue. There was no significant difference in the contralateral nontumor cortex SUV between baseline and blocking scans, while in both the cerebellum and neocortex, the blocking effect was more prominent. The contralateral nontumoral cortex was chosen as the reference region to estimate the regional DVR. In addition to RG2 tumors, only the cerebellum and neocortex showed significant blocking effects based on the DVR results (Fig.2e, p = 0.0003, 0.0179, for cerebellum and neocortex, respectively). Importantly, the biodistribution results correlated well with the PET DVR, corroborating the SRTM2 analysis results. The western blotting and immunohistochemical staining results indicate that PARP1 expression at the tumor site is higher than that in normal brain tissue, which is consistent with the biodistribution and PET imaging results. The tissue-to-blood ratios were calculated using the biodistribution data at 60 min p.i. and plotted the difference in the baseline and blocking tissue-to-blood activity ratios against 60 53376748.1
Attorney Docket No.047162-7482WO1(02447) the baseline tissue-to-blood ratios to estimate the PARP occupancy by the pre-administered veliparib. A nearly perfect linear correlation with an R square of 0.9996 and a slope of 0.89 was obtained, indicating that approximately 89% PAPR is occupied by the pre-administered veliparib at 5 mg/kg (Fig.3c). This finding indicates highly PARPspecific uptake of [
11C]PyBic in RG2 tumors, rat brains and spleens. The gadolinium contrast-enhanced MR (CEMR) imaging indicated that the BBB surrounding the RG2 tumors was compromised (Figs.2A-2F). Thus, the PARP-specific uptake of [
11C]PyBic in the RG2 rat brains does not exclude the possibility that the tracer is entering the brain through the damaged BBB and/or the BTB around the tumors. Caution should be taken when interpretating the kinetics modeling results. To confirm and quantify the extent of brain penetration of [
11C]PyBic, two healthy NHPs were imaged after intravenous bolus injections of [
11C]PyBic. A quick uptake of [
11C]PyBic was observed in the NHP brain, plateauing within 30 min p.i., with baseline SUVs ranging from 0.66 (in the globus pallidus) to 0.97 (in the cerebellum) (Figs.5A-5B). Furthermore, blocking scans were performed with preinjected veliparib or BGB290, both of which decreased tracer uptake to nonspecific levels in the whole brain, indicating that [
11C]PyBic uptake in monkey brains is indeed PARP-specific. It was noticed that the brain kinetics of [
11C] PyBic is slower in NHP than in rats. Yet, the NHP brain TACs fit well with 1TC model, suggesting reversible in vivo binding of [
11C]PyBic in the NHP brain. The faster clearance in the rodent brain is most likely due to faster plasma clearance, as suggested by the lower parent fraction data in the rodent. This is a common difference between rodent and NHP data, i.e., that metabolism is faster in the rodent, so plasma clearance and brain clearance is more pronounced. Arterial blood samples were collected and analyzed the metabolism profiles of [
11C]PyBic in rats and NHPs and found two major metabolite peaks of [
11C]PyBic in both species (Figs.2F, 5D). Based on the metabolism profile of veliparib, it was hypothesized that the oxidization product (compound 6) of methylpyrrolidine is the major radiometabolite. Based on the effective blocking by veliparib in the rodent and NHP PET imaging and the fact that a minimum amount of radiometabolites were detected in the rat brain homogenates (Fig. 2F), the radiometabolites are not expected to interfere with the interpretation of the brain PET imaging results. Compared to other PARP1/2 inhibitors, such as olaparib, talazoparib, and rucaparib, veliparib has a lower PARP trapping capability, implicating a faster K
off rate than other PARP1/2 inhibitors, a desirable feature for quantitative brain PET imaging. Although [
18F]PARPi has been used in GBM patients to delineate tumors, a highly brain-penetrant PET 61 53376748.1
Attorney Docket No.047162-7482WO1(02447) tracer such as [
11C]PyBic is desirable for reliable PARP quantification and is potentially applicable in lower grade gliomas and brain metastases with intact or heterogeneous BBB integrity. Because the other PARP PET tracers under development suffer from being P-gp substrates, the effect of P-gp inhibition on the brain uptake and kinetics of [
11C] PyBic in rats and NHPs was examined. The veliparib can block the brain uptake of PyBic effectively at the doses of 5 mg/kg in rats and 2.5 mg/kg in monkeys, because sufficient amount of veliparib can reach its target in the brain, even though it is a weak substrate of p-gp. This is consistent with previous results using veliparib at 3.1 mg/kg/d to 25 mg/kg/d, which increased the efficacy of temozolomide in rat glioma model. The efflux ratio of veliparib in MDR1-MDCK cells was 1.8, indicating veliparib as a weak P-gp substrate. The efflux ratio of PyBic was measured to be 0.52, indicating PyBic is not a P-gp substrate. Generally, compounds with efflux ratio greater than 2 are considered to be positive P-gp substrates. The preliminary PET imaging experiment using the P-gp inhibitor verapamil (1 mg/kg, i.v., 10 min before radiotracer injection) did not show obviously altered [
11C]PyBic uptake in healthy rat brains (Figs.11A-11B), indicating that [
11C]PyBic is unlikely a P-gp substrate. Consistently, the preliminary P-gp inhibition study in NHP showed no influence of the P-gp inhibitor tariquidar on the VT and K1 of [
11C]PyBic in NHP brain. Enumerated Embodiments The following exemplary embodiments are provided, the numbering of which is not to be construed as designating levels of importance: Embodiment 1: A compound of Formula (I), or a salt, solvate, tautomer, or stereoisomer thereof: wherein: R
1 is H or C
1-C
6 alkyl comprising at least one
11C; R
2 is H
wherein the compound comprises at least one of
11C and
18F. Embodiment 2: The compound of Embodiment 1, wherein R
1 is C
1-C
6 alkyl comprising at least one
11C. Embodiment 3: The compound of any one of Embodiments 1-2, wherein R
1 is
11CH3. Embodiment 4: The compound of any one of Embodiments 1-3, wherein R
2 is
18F. 62 53376748.1
Attorney Docket No.047162-7482WO1(02447) Embodiment 5: The compound of any one of Embodiments 1-4, which is selected from the group consisting of:
Embodiment 6: The compound of any one of Embodiments 1-5, which is selected from the group consisting of:
Embodiment 7: A compound of Formula (II), or a salt, solvate, tautomer, or stereoisomer thereof:
least one
11C; R
2 is
18F or
19F; and R
3 is
11C or
12C; wherein the compound comprises at least one of
11C and
18F. Embodiment 8: The compound of Embodiment 7, wherein R
1 is C1-C6 alkyl comprising at least one
11C. 63 53376748.1
Attorney Docket No.047162-7482WO1(02447) Embodiment 9: The compound of any one of Embodiments 7-8, wherein R
1 is
11CH3. Embodiment 10: The compound of any one of Embodiments 7-9, wherein R
2 is
18F. Embodiment 11: The compound of any one of Embodiments 7-10, which is selected from the group consisting of: ,

Embodiment 12: A method of imaging poly(ADP-ribose) polymerase-1 (PARP1) in a subject, the method comprising: administering the compound of claim 1 or claim 7 to the subject, and imaging the compound in the subject. Embodiment 13: The method of Embodiment 12, wherein the imaging comprises positron emission tomography (PET). Embodiment 14: The method of any one of Embodiments 12-13, wherein the PARP1 is imaged in the brain of the subject. Embodiment 15: The method of any one of Embodiments 12-14, wherein the subject suffers from glioma, optionally wherein the glioma is glioblastoma. Embodiment 16: The method of any one of Embodiments 12-14, wherein the subject suffers from Alzheimer’s disease (AD), Parkinson’s disease (PD), and/or any other central 64 53376748.1
Attorney Docket No.047162-7482WO1(02447) nervous system (CNS) disease. Embodiment 17: The method of any one of Embodiments 12-16, wherein the imaging is used to quantitate PARP1 in the subject. Embodiment 18: The method of any one of Embodiments 12-17, wherein the imaging is used to identify whether the subject will benefit from administration of a PARP1 inhibitor to treat, ameliorate, and/or prevent a disease or disorder. Embodiment 19: The method of Embodiment 18, wherein the disease or disorder is cancer or a central nervous system (CNS) disease. Embodiment 20: The method of Embodiment 19, wherein the cancer is glioma. Embodiment 21: The method of Embodiment 20, wherein the glioma is selected from the group consisting of ependymoma, anaplastic astrocytoma, glioblastoma, astrocytoma, brainstem glioma, diffuse midline glioma, oligodendroglioma, ganglioglioma, circumscribed astrocytic glioma, low-grade glioma, angiocentric glioma, oligoastrocytoma, pleomorphic xanthoastrocytoma, subependymal giant cell astrocytoma, and dysembryoplastic neuroepithelial tumor. Embodiment 22: The method of any one of Embodiments 20-21, wherein the glioma is glioblastoma. Embodiment 23: The method of Embodiment 19, wherein the CNS disease is Alzheimer’s disease (AD) or Parkinson’s disease (PD). Embodiment 24: The method of any one of Embodiments 12-23, wherein the compound is administered in an amount sufficient to clinically diagnose a disease or disorder of the brain. The foregoing outlines features of several embodiments so that those skilled in the art may better understand the aspects of the present disclosure. Those skilled in the art should appreciate that they may readily use the present disclosure as a basis for designing or modifying other processes and structures for carrying out the same purposes and/or achieving the same advantages of the embodiments introduced herein. Those skilled in the art should also realize that such equivalent constructions do not depart from the spirit and scope of the present disclosure, and that they may make various changes, substitutions, and alterations herein without departing from the spirit and scope of the present disclosure. 65 53376748.1
 In certain embodiments, in the compound of Formula (II): R1 is H or C1-C6 alkyl comprising at least one 11C; R2 is 18F or 19F; and R3 is 11C or 12C; wherein the compound comprises at least one of 11C and 18F. Compounds of Formula (I) and Formula (II) are useful as PET imaging agents. These compounds are especially, but not exclusively, suited for imaging gliomas owing to the advantageous blood-brain barrier (BBB) permeability of the compounds of Formula (I) and Formula (II). BRIEF DESCRIPTION OF THE FIGURES The drawings illustrate generally, by way of example, but not by way of limitation, various embodiments of the present application. Fig.1A shows PARP PET tracers derived from the PARP1/2 inhibitors olaparib and rucaparib. Fig.1B shows a radiochemical synthesis of [11C]PyBic, according to various embodiments. Figs.2A-2F show [11C]PyBic PET imaging in RG2 glioblastoma-bearing rats and quantitative data analysis results. Representative horizontal summed PET standard uptake value (SUV) images from 30–60 min p.i. and the corresponding contrast-enhanced MR (CEMR) images for baseline (Fig.2A) and blocking scans (Fig.2B), with hand-drawn regions of interest (ROIs) for tumor and contralateral nontumor regions. (Figs.2C-2D) SUV time-activity curves (TACs) of the RG2 tumor and selected brain subregions, including the 2 53376748.1
Attorney Docket No.047162-7482WO1(02447) contralateral nontumor cortex (nontumor), neocortex, thalamus, hippocampus, brain stem, and cerebellum, under baseline (Fig.2C, n = 5) and blocking (Fig.2D, n = 4) conditions. (Fig.2E) The regional distribution volume ratios (DVRs) of [11C]PyBic in selected brain subregions and tumors, calculated using the simplified reference tissue method 2 (SRTM2) with the contralateral nontumor region as the pseudo reference region. The DVRs of the tumor (p = 0.0087), cerebellum (p = 0.0003), and neocortex (p = 0.0179) showed statistically significant differences between baseline and blocking scans. (Fig.2F) Radiometabolite analysis of [11C]PyBic in rat plasma and brain homogenate at 60 min p.i. Figs.3A-3D show aspects of the pharmacokinetics of compounds of Formula (I) and Formula (II). (Fig.3A) Biodistribution analysis of baseline and blocking (veliparib, 5 mg/kg) at 60 min p.i. of [11C]PyBic, expressed as %ID/g (n = 4 for baseline; n = 3 for blocking), with tumor and spleen showing statistically significant differences at baseline and blocking studies. (Fig.3B) The ratio of tracer uptake in tumor to different tissues and blood, showing that the tumor-to-contralateral cortex (tumor/cortex) ratios at baseline study and blocking study are most significantly different (p = 0.017), supporting the use of contralateral nontumor region as the reference region in the SRTM2 analysis. (Fig.3C) Linear correlational analysis of the difference between the tissue-to-blood ratios at baseline and blocking studies and baseline tissue-to-blood ratios. Dots on the graph represent the mean values of each analyzed brain region or tissue, i.e., the olfactory bulb, cerebellum, tumor, contralateral nontumor cortex (nontumor), and spleen. (Fig.3D) Linear correlational analysis of the results of baseline SRTM2 DVR and biodistribution data on tracer uptake in the cerebellum, nontumor, tumor, and brain stem, normalized by nontumor tracer uptake. Dots on the graph represent each individual tissue of cerebellum, tumor, contralateral nontumor cortex (nontumor), and brain stem from three different rats. For the statistical analysis using a t test, p < 0.05 was considered significantly different. Figs.4A-4F show immunohistochemical (IHC) staining and western blotting of PARP1 and correlation analysis with biodistribution and PET results. (Fig.4A) Representative IHC staining of PARP1 in RG2 tumor-bearing rats. (Fig.4B) PARP1 IHC in tumor tissue and adjacent normal tissue. (Figs.4C-4D) Representative western blotting of PARP1 in selected brain subregions, including the cortex, olfactory bulb, brain stem, cerebellum, hippocampus, and tumor, using a capillary electrophoresis WES system (ProteinSimple). (Fig.4C) Histogram graph of PARP1 expression. The116 kD band was detected by the PARP1-specific antibody. (Fig.4D) Classic western blotting image of PARP1 and expression quantification. N = 3–4, multiple t test, p < 0.05 is considered significantly 3 53376748.1
Attorney Docket No.047162-7482WO1(02447) different. (Fig.4E) Correlation of baseline biodistribution and WES on the olfactory bulb, stem, cerebellum, hippocampus, and tumor. (Fig.4F) Correlation of baseline PET DVR and PARP1 WES in the tumor, cerebellum, cortex, brain stem, and hippocampus. For graphs in Figs.4E-4F, dots on the graph represent the group mean, with n = 3–5 per group. Figs.5A-5E show [11C]PyBic PET imaging and metabolism study in Monkey 1. (Fig. 5A) MRI of monkey brain (left column) and summed SUV PET images of [11C]PyBic from early (2nd and 3rd columns, 10–20 min) and late (4th and 5th columns, 60–90 min) scan windows. The brain regional SUVs ranged from 0.5 to 1.5, with cerebellum being the highest, followed by occipital cortex, frontal cortex and globus pallidus showing the lowest tracer uptake. (Figs.5B-5c) Representative time active curves (TACs) of different brain regions at baseline scan (Fig.5B) and blocking scan (Fig.5C). (Fig.5D) Radio-HPLC chromatograms of plasma samples taken at different time points and the blood standard. (Fig. 5E) Metabolism-corrected arterial blood input functions of a baseline scan (in maroon) and a blocking scan (in blue) in the same monkey. Figs.6A-6B show in vivo target occupancy assays shown by Lassen plots of VT ▸ derived from 1 tissue compartment (1TC) modeling in two different monkeys. (Fig.6A) Lassen plot of VT (baseline) vs the difference in VT (baseline) and VT (blocking) with veliparib as a blocking drug in Monkey 1. (Fig.6B) Lassen plot of VT (baseline) vs the difference in VT (baseline) and VT (blocking) with veliparib as a blocking drug in Monkey 2. (Fig.6C) Lassen plot of VT (baseline) vs the difference in VT (baseline) and VT (blocking) with BGB290 as a blocking drug in Monkey 2. The x-intercept is the estimated non- displaceable volume distribution (VND), and the slope is the target occupancy. Fig.7A shows the synthesis of precursor and standard compounds 4 and 5. (i) CDI, 2- Me-Imidazole, NMP, 90 ºC, 12 h; (ii) NaOAc, AcOH, reflux; (iii) HCl (conc.), i-PrOH, 80 ºC, 12 h; (iv) MeI, DMF, K2CO3, 100 ºC, 12h. Fig.7B shows a representative SemiPrep-HPLC chromatogram. Column: Phenomenex Luna C-18 HPLC column (10 µm, 10 mm x 250 mm). Mobile phase: 20% acetonitrile/80% NH4HCO3 (20 mM, pH = 8.9). Flow rate: 5 mL/min. Fig.7C shows the HPLC trace of the co-injection of [11C]PyBic and its standard compound 5. Fig.8A shows the synthesis of [3H]PyBic. Fig.8B shows the results of a [3H]PyBic saturation binding assay using rat hippocampus. Fig.9 shows the linear correlation of 0-90 min DVR and 0-60 min DVR from SRTM2 4 53376748.1
Attorney Docket No.047162-7482WO1(02447) kinetic modeling analyses. For 0-90 min, n=4, and for 0-60 min, n=5. Fig.10A shows 60 min SUV time activity curves of baseline and blocking scans on selected brain subregions, including cerebellum, hippocampus, neocortex, thalamus, tumor and contralateral non-tumor tissue (baseline, n = 5; blocking, n=4). Fig.10B is a graph of the area under curve (AUC, 0-60 min) in the different regions of brain compared to tumor in the baseline scans (n = 5, multiple t test). Figs.11A-11B show that the P-gp inhibitor verapamil did not affect [11C]PyBic uptake in healthy rat brain. P-gp inhibitor verapamil (1 mg/kg) was injected via i.v.10 min before radiotracer administration. Fig.11A is without verapamil and Fig.11B is with verapamil. Fig.12 shows the biodistribution analysis of baseline and blocking (veliparib, 5 mg/kg) at 60 min p.i. of [11C]PyBic, expressed as SUV (n = 4 for baseline; n = 3 for blocking), with tumor and spleen showing statistically significant differences at baseline and blocking studies. Or the statistical analysis using multiple t test, p < 0.05 is considered significantly different. Figs.13A-13C shows the results of capillary electrophoresis WES of PARP1 in tumor and normal and adjacent tissues. Fig.13A is a histogram graph of five pairs of normal and tumor tissues. Fig.13B is a classical view of western blotting on the same five pairs of tumor and normal tissues. Fig.13C is a quantification of PARP1 WEST, t test, p < 0.05 is considered significantly different, n = 5. Figs.14A-14D shows arterial input function studies shown by SUV time activity curves in the same monkey (monkey 2). Fig.14A is a test or retest study. Fig.14B is baseline vs. blocking with veliparib. Fig.14C is baseline vs. blocking with BGB290. Fig.14D is baseline vs. P-gp with tariquidar (1 mg/kg, i.v.). Fig.15 shows VT comparison among 1TCM and MA1 method in the same monkey. Figs.16A and 16B show a comparison of uptake of [11C]PyBic (Fig.16A) vs. [18F]PARPi (Fig.16B) in a BT142 bearing brain glioma mouse model. Fig.17A shows a representative horizontal summed PET SUV images for 10-20 min and 30–60 min p.i. baseline scans with [11C](R)-FPyBic. Fig.17B shows a representative horizontal summed PET SUV images for 10-20 min and 30–60 min p.i. blocking scans with [11C](R)-FPyBic using veliparib 2.5 mg/kg for blocking. Fig.17C shows representative time active curves (TACs) of different brain regions at baseline scan for the scan in Fig.17a. 5 53376748.1
Attorney Docket No.047162-7482WO1(02447) Fig.17D shows representative time active curves (TACs) of different brain regions at blocking scan for the scan in Fig.17b. Fig.17E shows radio-HPLC chromatograms of plasma samples taken at different time points and the blood standard for [11C](R)-FPyBic. Fig.18A shows a representative horizontal summed PET SUV images for 10-20 min and 30–60 min p.i. baseline scans with [18F](R)-FVeliparib. Fig.18B shows representative ex vivo rat brain AR imaging. Fig.18C shows representative time active curves (TACs) of different brain regions at baseline scan for [18F](R)-FVeliparib. Fig.18D shows radio-HPLC chromatograms of plasma samples taken at different time points and the blood standard for [11C](R)-FPyBic in rat. Fig.18E shows radio-HPLC chromatograms of plasma samples taken at different time points and the blood standard for [18F](R)-FVeliparib. DETAILED DESCRIPTION The present disclosure provides in one aspect veliparib-derived PARP PET imaging agents (such as but not limited to [11C]PyBic) that can freely pass the blood-brain barrier and demonstrate imaging characteristics in models of gliomas and healthy primates. The in vitro autoradiography study using the tritiated PyBic demonstrated the feasibility of quantifying PARP in human brain using [11C]PyBic. Based on this lead PET tracer, one can develop and translate an 18F-labeled brain penetrant PARP imaging probe to first-in-human study in healthy volunteers and glioma patients. The following disclosure provides many different embodiments, or examples, for implementing different features of the provided subject matter. Specific examples of components and arrangements are described below to simplify the present disclosure. These are, of course, merely examples and are not intended to be limiting. For example, the formation of a first feature over or on a second feature in the description that follows may include embodiments in which the first and second features are formed in direct contact, and may also include embodiments in which additional features may be formed between the first and second features, such that the first and second features may not be in direct contact. In addition, the present disclosure may repeat reference numerals and/or letters in the various examples. This repetition is for the purpose of simplicity and clarity and does not in itself dictate a relationship between the various embodiments and/or configurations discussed. 6 53376748.1
Attorney Docket No.047162-7482WO1(02447) Definitions As used herein, each of the following terms has the meaning associated with it in this section. Unless defined otherwise, all technical and scientific terms used herein generally have the same meaning as commonly understood by one of ordinary skill in the art to which this disclosure belongs. Generally, the nomenclature used herein and the laboratory procedures in animal pharmacology, pharmaceutical science, peptide chemistry, and organic chemistry are those well-known and commonly employed in the art. It should be understood that the order of steps or order for performing certain actions is immaterial, so long as the present teachings remain operable. Any use of section headings is intended to aid reading of the document and is not to be interpreted as limiting; information that is relevant to a section heading may occur within or outside of that particular section. All publications, patents, and patent documents referred to in this document are incorporated by reference herein in their entirety, as though individually incorporated by reference. In the application, where an element or component is said to be included in and/or selected from a list of recited elements or components, it should be understood that the element or component can be any one of the recited elements or components and can be selected from a group consisting of two or more of the recited elements or components. In the methods described herein, the acts can be carried out in any order, except when a temporal or operational sequence is explicitly recited. Furthermore, specified acts can be carried out concurrently unless explicit claim language recites that they be carried out separately. For example, a claimed act of doing X and a claimed act of doing Y can be conducted simultaneously within a single operation, and the resulting process will fall within the literal scope of the claimed process. In this document, the terms “a,” “an,” or “the” are used to include one or more than one unless the context clearly dictates otherwise. The term “or” is used to refer to a nonexclusive “or” unless otherwise indicated. The statement “at least one of A and B” or “at least one of A or B” has the same meaning as “A, B, or A and B.” “About” as used herein when referring to a measurable value such as an amount, a temporal duration, and the like, is meant to encompass variations of ±20% or ±10%, in certain embodiments ±5%, in certain embodiments ±1%, in certain embodiments ±0.1% from the specified value, as such variations are appropriate to perform the disclosed methods. The term “alkyl” as used herein refers to straight chain and branched alkyl groups and cycloalkyl groups having from 1 to 40 carbon atoms, 1 to about 20 carbon atoms, 1 to 12 carbons or, in some embodiments, from 1 to 8 carbon atoms. Examples of straight chain alkyl 7 53376748.1
Attorney Docket No.047162-7482WO1(02447) groups include those with from 1 to 8 carbon atoms such as methyl, ethyl, n-propyl, n-butyl, n-pentyl, n-hexyl, n-heptyl, and n-octyl groups. Examples of branched alkyl groups include, but are not limited to, isopropyl, iso-butyl, sec-butyl, t-butyl, neopentyl, isopentyl, and 2,2- dimethylpropyl groups. As used herein, the term “alkyl” encompasses n-alkyl, isoalkyl, and anteisoalkyl groups as well as other branched chain forms of alkyl. Representative substituted alkyl groups can be substituted one or more times with any of the groups listed herein, for example, amino, hydroxy, cyano, carboxy, nitro, thio, alkoxy, and halogen groups. The term “solvent” as used herein refers to a liquid that can dissolve a solid, liquid, or gas. Non-limiting examples of solvents are silicones, organic compounds, water, alcohols, ionic liquids, and supercritical fluids. The term “independently selected from” as used herein refers to referenced groups being the same, different, or a mixture thereof, unless the context clearly indicates otherwise. Thus, under this definition, the phrase “X1, X2, and X3 are independently selected from noble gases” would include the scenario where, for example, X1, X2, and X3 are all the same, where X1, X2, and X3 are all different, where X1 and X2 are the same but X3 is different, and other analogous permutations. The term “room temperature” as used herein refers to a temperature of about 15 °C to 28 °C. The term “standard temperature and pressure” as used herein refers to 20 °C and 101 kPa. A “disease” is a state of health of an animal wherein the animal cannot maintain homeostasis, and wherein if the disease is not ameliorated then the animal’s health continues to deteriorate. A “disorder” in an animal is a state of health in which the animal is able to maintain homeostasis, but in which the animal’s state of health is less favorable than it would be in the absence of the disorder. Left untreated, a disorder does not necessarily cause a further decrease in the animal’s state of health. A disease or disorder is “alleviated” if the severity of a symptom of the disease or disorder, the frequency with which such a symptom is experienced by a patient, or both, is reduced. In one aspect, the terms “co-administered” and “co-administration” as relating to a subject refer to administering to the subject a compound and/or composition of the disclosure along with a compound and/or composition that may also treat or prevent a disease or disorder contemplated herein. In certain embodiments, the co-administered compounds 8 53376748.1
Attorney Docket No.047162-7482WO1(02447) and/or compositions are administered separately, or in any kind of combination as part of a single therapeutic approach. The co-administered compound and/or composition may be formulated in any kind of combinations as mixtures of solids and liquids under a variety of solid, gel, and liquid formulations, and as a solution. As used herein, the term “pharmaceutical composition” or “composition” refers to a mixture of at least one compound useful within the disclosure with a pharmaceutically acceptable carrier. The pharmaceutical composition facilitates administration of the compound to a patient. Multiple techniques of administering a compound exist in the art including, but not limited to, subcutaneous, intravenous, oral, aerosol, inhalational, rectal, vaginal, transdermal, intranasal, buccal, sublingual, parenteral, intrathecal, intragastrical, ophthalmic, pulmonary, and topical administration. As used herein, the term “pharmaceutically acceptable” refers to a material, such as a carrier or diluent, which does not abrogate the biological activity or properties of the compound, and is relatively non-toxic, i.e., the material may be administered to an individual without causing undesirable biological effects or interacting in a deleterious manner with any of the components of the composition in which it is contained. As used herein, the term “pharmaceutically acceptable carrier” means a pharmaceutically acceptable material, composition or carrier, such as a liquid or solid filler, stabilizer, dispersing agent, suspending agent, diluent, excipient, thickening agent, solvent or encapsulating material, involved in carrying or transporting a compound useful within the disclosure within or to the patient such that it may perform its intended function. Each carrier must be “acceptable” in the sense of being compatible with the other ingredients of the formulation, including the compound useful within the disclosure, and not injurious to the patient. Some examples of materials that may serve as pharmaceutically acceptable carriers include: sugars, such as lactose, glucose and sucrose; starches, such as corn starch and potato starch; cellulose, and its derivatives. As used herein, “pharmaceutically acceptable carrier” also includes any and all coatings, antibacterial and antifungal agents, and absorption delaying agents, and the like that are compatible with the activity of the compound useful within the disclosure, and are physiologically acceptable to the patient. The “pharmaceutically acceptable carrier” may further include a pharmaceutically acceptable salt of the compound useful within the disclosure. Other additional ingredients that may be included in the pharmaceutical compositions used in the practice of the disclosure are known in the art and described, for example in Remington’s Pharmaceutical Sciences (Genaro, Ed., Mack Publishing Co., 1985, Easton, PA), which is incorporated herein by reference. 9 53376748.1
Attorney Docket No.047162-7482WO1(02447) As used herein, the language “pharmaceutically acceptable salt” refers to a salt of the administered compound prepared from pharmaceutically acceptable non-toxic acids and bases, including inorganic acids, inorganic bases, organic acids, inorganic bases, solvates, hydrates, and clathrates thereof. Suitable pharmaceutically acceptable acid addition salts may be prepared from an inorganic acid or from an organic acid. Examples of inorganic acids include hydrochloric, hydrobromic, hydriodic, nitric, carbonic, sulfuric (including sulfate and hydrogen sulfate), and phosphoric acids (including hydrogen phosphate and dihydrogen phosphate). Appropriate organic acids may be selected from aliphatic, cycloaliphatic, aromatic, araliphatic, heterocyclic, carboxylic and sulfonic classes of organic acids, examples of which include formic, acetic, propionic, succinic, glycolic, gluconic, lactic, malic, tartaric, citric, ascorbic, glucuronic, maleic, malonic, saccharin, fumaric, pyruvic, aspartic, glutamic, benzoic, anthranilic, 4-hydroxybenzoic, phenylacetic, mandelic, embonic (pamoic), methanesulfonic, ethanesulfonic, benzenesulfonic, pantothenic, trifluoromethanesulfonic, 2- hydroxyethanesulfonic, p-toluenesulfonic, sulfanilic, cyclohexylaminosulfonic, stearic, alginic, β-hydroxybutyric, salicylic, galactaric and galacturonic acid. Suitable pharmaceutically acceptable base addition salts of compounds described herein include, for example, ammonium salts, metallic salts including alkali metal, alkaline earth metal and transition metal salts such as, for example, calcium, magnesium, potassium, sodium and zinc salts. Pharmaceutically acceptable base addition salts also include organic salts made from basic amines such as, for example, N,N’-dibenzylethylene-diamine, chloroprocaine, choline, diethanolamine, ethylenediamine, meglumine (N-methylglucamine) and procaine. All of these salts may be prepared from the corresponding compound by reacting, for example, the appropriate acid or base with the compound. As used herein, a “pharmaceutically effective amount,” “therapeutically effective amount,” or “effective amount” of a compound is that amount of compound that is sufficient to provide a beneficial effect to the subject to which the compound is administered. As used herein, the term “prevent” or “prevention” means no disorder or disease development if none had occurred, or no further disorder or disease development if there had already been development of the disorder or disease. Also considered is the ability of one to prevent some or all of the symptoms associated with the disorder or disease. As used herein, the terms “subject” and “individual” and “patient” can be used interchangeably and may refer to a human or non-human mammal or a bird. Non-human mammals include, for example, livestock and pets, such as ovine, bovine, porcine, canine, 10 53376748.1
Attorney Docket No.047162-7482WO1(02447) feline and murine mammals. In certain embodiments, the subject is human. As used herein, the term “treatment” or “treating” is defined as the application or administration of a therapeutic agent, i.e., a compound useful within the disclosure (alone or in combination with another pharmaceutical agent), to a patient, or application or administration of a therapeutic agent to an isolated tissue or cell line from a patient (e.g., for diagnosis or ex vivo applications), who has a disease or disorder and/or a symptom of a disease or disorder, with the purpose to cure, heal, alleviate, relieve, alter, remedy, ameliorate, improve or affect the disease or disorder and/or the symptoms of the disease or disorder. Such treatments may be specifically tailored or modified, based on knowledge obtained from the field of pharmacogenomics. Compounds of Formula (I) and Formula (II) Compounds of Formula (I) or Formula (II) or otherwise described herein can be prepared by the general schemes described herein, using the synthetic method known by those skilled in the art. The following examples illustrate non-limiting embodiments of the compound(s) described herein and their preparation. The enzyme poly(ADP-ribose) polymerase-1 (PARP1) is one of 17 members in the PARP family and is involved in the base excision repair (BER) pathway that regulates DNA single-strand break (SSB) repair. PARP1 is the most abundant PARP member and accounts for 90% of the NAD + used by the PARP family to catalyze poly(ADPribosylation) on proteins and oligonucleotides. DNA damage activates PARP1 towards addition with ADP- ribose, forming a polymeric, energy rich scaffold of poly(ADPribose) (PAR), which is an essential energy source in DNA SSB and BER. The process of DNA repair can be interrupted by PARP inhibition, which leads to the accumulation of DNA SSBs and results in synthetic lethality in cancer cells with BRCA1/2 mutations. Thus, PARP inhibitors (PARPis) are actively pursued as treatments for a variety of cancers, including ovarian, breast and brain tumors. To date, the FDA has approved four PARPis for the treatment of ovarian cancer and breast cancer, i.e., olaparib (AZD2281), niraparib, rucaparib and talazoparib. Malignant gliomas are highly aggressive tumors with poor prognosis, among which glioblastoma (GBM) is the most aggressive. Even with the intensive regimen of surgical removal followed by radio/chemotherapy, the 5-year survival rate is only 5% for GBM patients. The rapid infiltration of tumor cells into surrounding tissues limits the complete surgical excision of GBM tumors. The complex neurovascular physiology of the blood–brain barrier (BBB) and blood-tumor barrier (BTB) limits the penetration and distribution of some therapeutic drugs. 11 53376748.1
Attorney Docket No.047162-7482WO1(02447) The nature of tumor heterogeneity that contributes to the development of resistance to therapies and the active efflux of small molecule drugs are among the major challenges in finding a cure for malignant gliomas. PARP1 is overexpressed in GBM, and its levels positively correlated with tumor grades in gliomas, such as proneural and classical GBM subtypes. PET imaging allows for noninvasive whole-body quantification of protein expression and has been used to delineate tumors, provide functional information, predict patient response to a targeted therapy, assess therapeutic effects, and provide a global and dynamic picture of the disease biomarkers in primary tumors and metastatic sites. Great efforts have been devoted to developing PARP PET imaging probes using the potent PARPis olaparib and rucaparib and, more recently, talazoparib as the lead compounds, culminating in the translation of [18F]FTT and [18F]PARPi into human studies (Fig.1a). However, veliparib has been essentially overlooked as a leading compound for PARP PET tracer development, despite its more desirable characteristics for brain PET imaging, i.e., high brain exposure, fast brain kinetics and less P- glycoprotein (P-gp) efflux from the brain. As a therapeutic drug, veliparib has been investigated extensively to treat non-small cell lung cancer, BRCA-mutated advanced breast cancer and ovarian cancer. In fact, some of the current PARP PET tracers have been investigated as PET imaging agents in gliomas but suffer from limited brain penetration and liability to efflux by transporter proteins. Using veliparib as the lead, computational analysis was performed and an N-11C-methylated veliparib derivative, (R)-2-(2-methyl-1-(methyl- 11C)pyrrolidin-2-yl)1H-benzo[d]imidazole-4-carboxamide ([11C]PyBic) was identified and synthesized, based on its predicted desirable physicochemical properties as a brain penetrant PET tracer, and evaluated its potential to image and quantify PARP in GBM and healthy brains. Specifically, the in vivo specific binding signals of [11C]PyBic were tested in a rodent GBM model through baseline and blocking studies. Ex vivo metabolite analysis showed no substantive radiometabolites in healthy rat brains. PET imaging results were corroborated by ex vivo biodistribution of [11C]PyBic, western blotting and immunohistochemical staining of PARP1 in selected brain regions and the implanted tumors. Furthermore, the BBB penetration of [11C]PyBic was confirmed using quantitative nonhuman primate (NHP) brain PET imaging. Blocking studies with the structurally analogous veliparib and the structurally distinctive PARPi BGB-290 (Pamiparib) confirmed PARP-specific tracer uptake in NHP brains. 12 53376748.1
Attorney Docket No.047162-7482WO1(02447)
In certain embodiments, in the compound of Formula (II): R1 is H or C1-C6 alkyl comprising at least one 11C; R2 is 18F or 19F; and R3 is 11C or 12C; wherein the compound comprises at least one of 11C and 18F. Compounds of Formula (I) and Formula (II) are useful as PET imaging agents. These compounds are especially, but not exclusively, suited for imaging gliomas owing to the advantageous blood-brain barrier (BBB) permeability of the compounds of Formula (I) and Formula (II). BRIEF DESCRIPTION OF THE FIGURES The drawings illustrate generally, by way of example, but not by way of limitation, various embodiments of the present application. Fig.1A shows PARP PET tracers derived from the PARP1/2 inhibitors olaparib and rucaparib. Fig.1B shows a radiochemical synthesis of [11C]PyBic, according to various embodiments. Figs.2A-2F show [11C]PyBic PET imaging in RG2 glioblastoma-bearing rats and quantitative data analysis results. Representative horizontal summed PET standard uptake value (SUV) images from 30–60 min p.i. and the corresponding contrast-enhanced MR (CEMR) images for baseline (Fig.2A) and blocking scans (Fig.2B), with hand-drawn regions of interest (ROIs) for tumor and contralateral nontumor regions. (Figs.2C-2D) SUV time-activity curves (TACs) of the RG2 tumor and selected brain subregions, including the 2 53376748.1
Attorney Docket No.047162-7482WO1(02447) contralateral nontumor cortex (nontumor), neocortex, thalamus, hippocampus, brain stem, and cerebellum, under baseline (Fig.2C, n = 5) and blocking (Fig.2D, n = 4) conditions. (Fig.2E) The regional distribution volume ratios (DVRs) of [11C]PyBic in selected brain subregions and tumors, calculated using the simplified reference tissue method 2 (SRTM2) with the contralateral nontumor region as the pseudo reference region. The DVRs of the tumor (p = 0.0087), cerebellum (p = 0.0003), and neocortex (p = 0.0179) showed statistically significant differences between baseline and blocking scans. (Fig.2F) Radiometabolite analysis of [11C]PyBic in rat plasma and brain homogenate at 60 min p.i. Figs.3A-3D show aspects of the pharmacokinetics of compounds of Formula (I) and Formula (II). (Fig.3A) Biodistribution analysis of baseline and blocking (veliparib, 5 mg/kg) at 60 min p.i. of [11C]PyBic, expressed as %ID/g (n = 4 for baseline; n = 3 for blocking), with tumor and spleen showing statistically significant differences at baseline and blocking studies. (Fig.3B) The ratio of tracer uptake in tumor to different tissues and blood, showing that the tumor-to-contralateral cortex (tumor/cortex) ratios at baseline study and blocking study are most significantly different (p = 0.017), supporting the use of contralateral nontumor region as the reference region in the SRTM2 analysis. (Fig.3C) Linear correlational analysis of the difference between the tissue-to-blood ratios at baseline and blocking studies and baseline tissue-to-blood ratios. Dots on the graph represent the mean values of each analyzed brain region or tissue, i.e., the olfactory bulb, cerebellum, tumor, contralateral nontumor cortex (nontumor), and spleen. (Fig.3D) Linear correlational analysis of the results of baseline SRTM2 DVR and biodistribution data on tracer uptake in the cerebellum, nontumor, tumor, and brain stem, normalized by nontumor tracer uptake. Dots on the graph represent each individual tissue of cerebellum, tumor, contralateral nontumor cortex (nontumor), and brain stem from three different rats. For the statistical analysis using a t test, p < 0.05 was considered significantly different. Figs.4A-4F show immunohistochemical (IHC) staining and western blotting of PARP1 and correlation analysis with biodistribution and PET results. (Fig.4A) Representative IHC staining of PARP1 in RG2 tumor-bearing rats. (Fig.4B) PARP1 IHC in tumor tissue and adjacent normal tissue. (Figs.4C-4D) Representative western blotting of PARP1 in selected brain subregions, including the cortex, olfactory bulb, brain stem, cerebellum, hippocampus, and tumor, using a capillary electrophoresis WES system (ProteinSimple). (Fig.4C) Histogram graph of PARP1 expression. The116 kD band was detected by the PARP1-specific antibody. (Fig.4D) Classic western blotting image of PARP1 and expression quantification. N = 3–4, multiple t test, p < 0.05 is considered significantly 3 53376748.1
Attorney Docket No.047162-7482WO1(02447) different. (Fig.4E) Correlation of baseline biodistribution and WES on the olfactory bulb, stem, cerebellum, hippocampus, and tumor. (Fig.4F) Correlation of baseline PET DVR and PARP1 WES in the tumor, cerebellum, cortex, brain stem, and hippocampus. For graphs in Figs.4E-4F, dots on the graph represent the group mean, with n = 3–5 per group. Figs.5A-5E show [11C]PyBic PET imaging and metabolism study in Monkey 1. (Fig. 5A) MRI of monkey brain (left column) and summed SUV PET images of [11C]PyBic from early (2nd and 3rd columns, 10–20 min) and late (4th and 5th columns, 60–90 min) scan windows. The brain regional SUVs ranged from 0.5 to 1.5, with cerebellum being the highest, followed by occipital cortex, frontal cortex and globus pallidus showing the lowest tracer uptake. (Figs.5B-5c) Representative time active curves (TACs) of different brain regions at baseline scan (Fig.5B) and blocking scan (Fig.5C). (Fig.5D) Radio-HPLC chromatograms of plasma samples taken at different time points and the blood standard. (Fig. 5E) Metabolism-corrected arterial blood input functions of a baseline scan (in maroon) and a blocking scan (in blue) in the same monkey. Figs.6A-6B show in vivo target occupancy assays shown by Lassen plots of VT ▸ derived from 1 tissue compartment (1TC) modeling in two different monkeys. (Fig.6A) Lassen plot of VT (baseline) vs the difference in VT (baseline) and VT (blocking) with veliparib as a blocking drug in Monkey 1. (Fig.6B) Lassen plot of VT (baseline) vs the difference in VT (baseline) and VT (blocking) with veliparib as a blocking drug in Monkey 2. (Fig.6C) Lassen plot of VT (baseline) vs the difference in VT (baseline) and VT (blocking) with BGB290 as a blocking drug in Monkey 2. The x-intercept is the estimated non- displaceable volume distribution (VND), and the slope is the target occupancy. Fig.7A shows the synthesis of precursor and standard compounds 4 and 5. (i) CDI, 2- Me-Imidazole, NMP, 90 ºC, 12 h; (ii) NaOAc, AcOH, reflux; (iii) HCl (conc.), i-PrOH, 80 ºC, 12 h; (iv) MeI, DMF, K2CO3, 100 ºC, 12h. Fig.7B shows a representative SemiPrep-HPLC chromatogram. Column: Phenomenex Luna C-18 HPLC column (10 µm, 10 mm x 250 mm). Mobile phase: 20% acetonitrile/80% NH4HCO3 (20 mM, pH = 8.9). Flow rate: 5 mL/min. Fig.7C shows the HPLC trace of the co-injection of [11C]PyBic and its standard compound 5. Fig.8A shows the synthesis of [3H]PyBic. Fig.8B shows the results of a [3H]PyBic saturation binding assay using rat hippocampus. Fig.9 shows the linear correlation of 0-90 min DVR and 0-60 min DVR from SRTM2 4 53376748.1
Attorney Docket No.047162-7482WO1(02447) kinetic modeling analyses. For 0-90 min, n=4, and for 0-60 min, n=5. Fig.10A shows 60 min SUV time activity curves of baseline and blocking scans on selected brain subregions, including cerebellum, hippocampus, neocortex, thalamus, tumor and contralateral non-tumor tissue (baseline, n = 5; blocking, n=4). Fig.10B is a graph of the area under curve (AUC, 0-60 min) in the different regions of brain compared to tumor in the baseline scans (n = 5, multiple t test). Figs.11A-11B show that the P-gp inhibitor verapamil did not affect [11C]PyBic uptake in healthy rat brain. P-gp inhibitor verapamil (1 mg/kg) was injected via i.v.10 min before radiotracer administration. Fig.11A is without verapamil and Fig.11B is with verapamil. Fig.12 shows the biodistribution analysis of baseline and blocking (veliparib, 5 mg/kg) at 60 min p.i. of [11C]PyBic, expressed as SUV (n = 4 for baseline; n = 3 for blocking), with tumor and spleen showing statistically significant differences at baseline and blocking studies. Or the statistical analysis using multiple t test, p < 0.05 is considered significantly different. Figs.13A-13C shows the results of capillary electrophoresis WES of PARP1 in tumor and normal and adjacent tissues. Fig.13A is a histogram graph of five pairs of normal and tumor tissues. Fig.13B is a classical view of western blotting on the same five pairs of tumor and normal tissues. Fig.13C is a quantification of PARP1 WEST, t test, p < 0.05 is considered significantly different, n = 5. Figs.14A-14D shows arterial input function studies shown by SUV time activity curves in the same monkey (monkey 2). Fig.14A is a test or retest study. Fig.14B is baseline vs. blocking with veliparib. Fig.14C is baseline vs. blocking with BGB290. Fig.14D is baseline vs. P-gp with tariquidar (1 mg/kg, i.v.). Fig.15 shows VT comparison among 1TCM and MA1 method in the same monkey. Figs.16A and 16B show a comparison of uptake of [11C]PyBic (Fig.16A) vs. [18F]PARPi (Fig.16B) in a BT142 bearing brain glioma mouse model. Fig.17A shows a representative horizontal summed PET SUV images for 10-20 min and 30–60 min p.i. baseline scans with [11C](R)-FPyBic. Fig.17B shows a representative horizontal summed PET SUV images for 10-20 min and 30–60 min p.i. blocking scans with [11C](R)-FPyBic using veliparib 2.5 mg/kg for blocking. Fig.17C shows representative time active curves (TACs) of different brain regions at baseline scan for the scan in Fig.17a. 5 53376748.1
Attorney Docket No.047162-7482WO1(02447) Fig.17D shows representative time active curves (TACs) of different brain regions at blocking scan for the scan in Fig.17b. Fig.17E shows radio-HPLC chromatograms of plasma samples taken at different time points and the blood standard for [11C](R)-FPyBic. Fig.18A shows a representative horizontal summed PET SUV images for 10-20 min and 30–60 min p.i. baseline scans with [18F](R)-FVeliparib. Fig.18B shows representative ex vivo rat brain AR imaging. Fig.18C shows representative time active curves (TACs) of different brain regions at baseline scan for [18F](R)-FVeliparib. Fig.18D shows radio-HPLC chromatograms of plasma samples taken at different time points and the blood standard for [11C](R)-FPyBic in rat. Fig.18E shows radio-HPLC chromatograms of plasma samples taken at different time points and the blood standard for [18F](R)-FVeliparib. DETAILED DESCRIPTION The present disclosure provides in one aspect veliparib-derived PARP PET imaging agents (such as but not limited to [11C]PyBic) that can freely pass the blood-brain barrier and demonstrate imaging characteristics in models of gliomas and healthy primates. The in vitro autoradiography study using the tritiated PyBic demonstrated the feasibility of quantifying PARP in human brain using [11C]PyBic. Based on this lead PET tracer, one can develop and translate an 18F-labeled brain penetrant PARP imaging probe to first-in-human study in healthy volunteers and glioma patients. The following disclosure provides many different embodiments, or examples, for implementing different features of the provided subject matter. Specific examples of components and arrangements are described below to simplify the present disclosure. These are, of course, merely examples and are not intended to be limiting. For example, the formation of a first feature over or on a second feature in the description that follows may include embodiments in which the first and second features are formed in direct contact, and may also include embodiments in which additional features may be formed between the first and second features, such that the first and second features may not be in direct contact. In addition, the present disclosure may repeat reference numerals and/or letters in the various examples. This repetition is for the purpose of simplicity and clarity and does not in itself dictate a relationship between the various embodiments and/or configurations discussed. 6 53376748.1
Attorney Docket No.047162-7482WO1(02447) Definitions As used herein, each of the following terms has the meaning associated with it in this section. Unless defined otherwise, all technical and scientific terms used herein generally have the same meaning as commonly understood by one of ordinary skill in the art to which this disclosure belongs. Generally, the nomenclature used herein and the laboratory procedures in animal pharmacology, pharmaceutical science, peptide chemistry, and organic chemistry are those well-known and commonly employed in the art. It should be understood that the order of steps or order for performing certain actions is immaterial, so long as the present teachings remain operable. Any use of section headings is intended to aid reading of the document and is not to be interpreted as limiting; information that is relevant to a section heading may occur within or outside of that particular section. All publications, patents, and patent documents referred to in this document are incorporated by reference herein in their entirety, as though individually incorporated by reference. In the application, where an element or component is said to be included in and/or selected from a list of recited elements or components, it should be understood that the element or component can be any one of the recited elements or components and can be selected from a group consisting of two or more of the recited elements or components. In the methods described herein, the acts can be carried out in any order, except when a temporal or operational sequence is explicitly recited. Furthermore, specified acts can be carried out concurrently unless explicit claim language recites that they be carried out separately. For example, a claimed act of doing X and a claimed act of doing Y can be conducted simultaneously within a single operation, and the resulting process will fall within the literal scope of the claimed process. In this document, the terms “a,” “an,” or “the” are used to include one or more than one unless the context clearly dictates otherwise. The term “or” is used to refer to a nonexclusive “or” unless otherwise indicated. The statement “at least one of A and B” or “at least one of A or B” has the same meaning as “A, B, or A and B.” “About” as used herein when referring to a measurable value such as an amount, a temporal duration, and the like, is meant to encompass variations of ±20% or ±10%, in certain embodiments ±5%, in certain embodiments ±1%, in certain embodiments ±0.1% from the specified value, as such variations are appropriate to perform the disclosed methods. The term “alkyl” as used herein refers to straight chain and branched alkyl groups and cycloalkyl groups having from 1 to 40 carbon atoms, 1 to about 20 carbon atoms, 1 to 12 carbons or, in some embodiments, from 1 to 8 carbon atoms. Examples of straight chain alkyl 7 53376748.1
Attorney Docket No.047162-7482WO1(02447) groups include those with from 1 to 8 carbon atoms such as methyl, ethyl, n-propyl, n-butyl, n-pentyl, n-hexyl, n-heptyl, and n-octyl groups. Examples of branched alkyl groups include, but are not limited to, isopropyl, iso-butyl, sec-butyl, t-butyl, neopentyl, isopentyl, and 2,2- dimethylpropyl groups. As used herein, the term “alkyl” encompasses n-alkyl, isoalkyl, and anteisoalkyl groups as well as other branched chain forms of alkyl. Representative substituted alkyl groups can be substituted one or more times with any of the groups listed herein, for example, amino, hydroxy, cyano, carboxy, nitro, thio, alkoxy, and halogen groups. The term “solvent” as used herein refers to a liquid that can dissolve a solid, liquid, or gas. Non-limiting examples of solvents are silicones, organic compounds, water, alcohols, ionic liquids, and supercritical fluids. The term “independently selected from” as used herein refers to referenced groups being the same, different, or a mixture thereof, unless the context clearly indicates otherwise. Thus, under this definition, the phrase “X1, X2, and X3 are independently selected from noble gases” would include the scenario where, for example, X1, X2, and X3 are all the same, where X1, X2, and X3 are all different, where X1 and X2 are the same but X3 is different, and other analogous permutations. The term “room temperature” as used herein refers to a temperature of about 15 °C to 28 °C. The term “standard temperature and pressure” as used herein refers to 20 °C and 101 kPa. A “disease” is a state of health of an animal wherein the animal cannot maintain homeostasis, and wherein if the disease is not ameliorated then the animal’s health continues to deteriorate. A “disorder” in an animal is a state of health in which the animal is able to maintain homeostasis, but in which the animal’s state of health is less favorable than it would be in the absence of the disorder. Left untreated, a disorder does not necessarily cause a further decrease in the animal’s state of health. A disease or disorder is “alleviated” if the severity of a symptom of the disease or disorder, the frequency with which such a symptom is experienced by a patient, or both, is reduced. In one aspect, the terms “co-administered” and “co-administration” as relating to a subject refer to administering to the subject a compound and/or composition of the disclosure along with a compound and/or composition that may also treat or prevent a disease or disorder contemplated herein. In certain embodiments, the co-administered compounds 8 53376748.1
Attorney Docket No.047162-7482WO1(02447) and/or compositions are administered separately, or in any kind of combination as part of a single therapeutic approach. The co-administered compound and/or composition may be formulated in any kind of combinations as mixtures of solids and liquids under a variety of solid, gel, and liquid formulations, and as a solution. As used herein, the term “pharmaceutical composition” or “composition” refers to a mixture of at least one compound useful within the disclosure with a pharmaceutically acceptable carrier. The pharmaceutical composition facilitates administration of the compound to a patient. Multiple techniques of administering a compound exist in the art including, but not limited to, subcutaneous, intravenous, oral, aerosol, inhalational, rectal, vaginal, transdermal, intranasal, buccal, sublingual, parenteral, intrathecal, intragastrical, ophthalmic, pulmonary, and topical administration. As used herein, the term “pharmaceutically acceptable” refers to a material, such as a carrier or diluent, which does not abrogate the biological activity or properties of the compound, and is relatively non-toxic, i.e., the material may be administered to an individual without causing undesirable biological effects or interacting in a deleterious manner with any of the components of the composition in which it is contained. As used herein, the term “pharmaceutically acceptable carrier” means a pharmaceutically acceptable material, composition or carrier, such as a liquid or solid filler, stabilizer, dispersing agent, suspending agent, diluent, excipient, thickening agent, solvent or encapsulating material, involved in carrying or transporting a compound useful within the disclosure within or to the patient such that it may perform its intended function. Each carrier must be “acceptable” in the sense of being compatible with the other ingredients of the formulation, including the compound useful within the disclosure, and not injurious to the patient. Some examples of materials that may serve as pharmaceutically acceptable carriers include: sugars, such as lactose, glucose and sucrose; starches, such as corn starch and potato starch; cellulose, and its derivatives. As used herein, “pharmaceutically acceptable carrier” also includes any and all coatings, antibacterial and antifungal agents, and absorption delaying agents, and the like that are compatible with the activity of the compound useful within the disclosure, and are physiologically acceptable to the patient. The “pharmaceutically acceptable carrier” may further include a pharmaceutically acceptable salt of the compound useful within the disclosure. Other additional ingredients that may be included in the pharmaceutical compositions used in the practice of the disclosure are known in the art and described, for example in Remington’s Pharmaceutical Sciences (Genaro, Ed., Mack Publishing Co., 1985, Easton, PA), which is incorporated herein by reference. 9 53376748.1
Attorney Docket No.047162-7482WO1(02447) As used herein, the language “pharmaceutically acceptable salt” refers to a salt of the administered compound prepared from pharmaceutically acceptable non-toxic acids and bases, including inorganic acids, inorganic bases, organic acids, inorganic bases, solvates, hydrates, and clathrates thereof. Suitable pharmaceutically acceptable acid addition salts may be prepared from an inorganic acid or from an organic acid. Examples of inorganic acids include hydrochloric, hydrobromic, hydriodic, nitric, carbonic, sulfuric (including sulfate and hydrogen sulfate), and phosphoric acids (including hydrogen phosphate and dihydrogen phosphate). Appropriate organic acids may be selected from aliphatic, cycloaliphatic, aromatic, araliphatic, heterocyclic, carboxylic and sulfonic classes of organic acids, examples of which include formic, acetic, propionic, succinic, glycolic, gluconic, lactic, malic, tartaric, citric, ascorbic, glucuronic, maleic, malonic, saccharin, fumaric, pyruvic, aspartic, glutamic, benzoic, anthranilic, 4-hydroxybenzoic, phenylacetic, mandelic, embonic (pamoic), methanesulfonic, ethanesulfonic, benzenesulfonic, pantothenic, trifluoromethanesulfonic, 2- hydroxyethanesulfonic, p-toluenesulfonic, sulfanilic, cyclohexylaminosulfonic, stearic, alginic, β-hydroxybutyric, salicylic, galactaric and galacturonic acid. Suitable pharmaceutically acceptable base addition salts of compounds described herein include, for example, ammonium salts, metallic salts including alkali metal, alkaline earth metal and transition metal salts such as, for example, calcium, magnesium, potassium, sodium and zinc salts. Pharmaceutically acceptable base addition salts also include organic salts made from basic amines such as, for example, N,N’-dibenzylethylene-diamine, chloroprocaine, choline, diethanolamine, ethylenediamine, meglumine (N-methylglucamine) and procaine. All of these salts may be prepared from the corresponding compound by reacting, for example, the appropriate acid or base with the compound. As used herein, a “pharmaceutically effective amount,” “therapeutically effective amount,” or “effective amount” of a compound is that amount of compound that is sufficient to provide a beneficial effect to the subject to which the compound is administered. As used herein, the term “prevent” or “prevention” means no disorder or disease development if none had occurred, or no further disorder or disease development if there had already been development of the disorder or disease. Also considered is the ability of one to prevent some or all of the symptoms associated with the disorder or disease. As used herein, the terms “subject” and “individual” and “patient” can be used interchangeably and may refer to a human or non-human mammal or a bird. Non-human mammals include, for example, livestock and pets, such as ovine, bovine, porcine, canine, 10 53376748.1
Attorney Docket No.047162-7482WO1(02447) feline and murine mammals. In certain embodiments, the subject is human. As used herein, the term “treatment” or “treating” is defined as the application or administration of a therapeutic agent, i.e., a compound useful within the disclosure (alone or in combination with another pharmaceutical agent), to a patient, or application or administration of a therapeutic agent to an isolated tissue or cell line from a patient (e.g., for diagnosis or ex vivo applications), who has a disease or disorder and/or a symptom of a disease or disorder, with the purpose to cure, heal, alleviate, relieve, alter, remedy, ameliorate, improve or affect the disease or disorder and/or the symptoms of the disease or disorder. Such treatments may be specifically tailored or modified, based on knowledge obtained from the field of pharmacogenomics. Compounds of Formula (I) and Formula (II) Compounds of Formula (I) or Formula (II) or otherwise described herein can be prepared by the general schemes described herein, using the synthetic method known by those skilled in the art. The following examples illustrate non-limiting embodiments of the compound(s) described herein and their preparation. The enzyme poly(ADP-ribose) polymerase-1 (PARP1) is one of 17 members in the PARP family and is involved in the base excision repair (BER) pathway that regulates DNA single-strand break (SSB) repair. PARP1 is the most abundant PARP member and accounts for 90% of the NAD + used by the PARP family to catalyze poly(ADPribosylation) on proteins and oligonucleotides. DNA damage activates PARP1 towards addition with ADP- ribose, forming a polymeric, energy rich scaffold of poly(ADPribose) (PAR), which is an essential energy source in DNA SSB and BER. The process of DNA repair can be interrupted by PARP inhibition, which leads to the accumulation of DNA SSBs and results in synthetic lethality in cancer cells with BRCA1/2 mutations. Thus, PARP inhibitors (PARPis) are actively pursued as treatments for a variety of cancers, including ovarian, breast and brain tumors. To date, the FDA has approved four PARPis for the treatment of ovarian cancer and breast cancer, i.e., olaparib (AZD2281), niraparib, rucaparib and talazoparib. Malignant gliomas are highly aggressive tumors with poor prognosis, among which glioblastoma (GBM) is the most aggressive. Even with the intensive regimen of surgical removal followed by radio/chemotherapy, the 5-year survival rate is only 5% for GBM patients. The rapid infiltration of tumor cells into surrounding tissues limits the complete surgical excision of GBM tumors. The complex neurovascular physiology of the blood–brain barrier (BBB) and blood-tumor barrier (BTB) limits the penetration and distribution of some therapeutic drugs. 11 53376748.1
Attorney Docket No.047162-7482WO1(02447) The nature of tumor heterogeneity that contributes to the development of resistance to therapies and the active efflux of small molecule drugs are among the major challenges in finding a cure for malignant gliomas. PARP1 is overexpressed in GBM, and its levels positively correlated with tumor grades in gliomas, such as proneural and classical GBM subtypes. PET imaging allows for noninvasive whole-body quantification of protein expression and has been used to delineate tumors, provide functional information, predict patient response to a targeted therapy, assess therapeutic effects, and provide a global and dynamic picture of the disease biomarkers in primary tumors and metastatic sites. Great efforts have been devoted to developing PARP PET imaging probes using the potent PARPis olaparib and rucaparib and, more recently, talazoparib as the lead compounds, culminating in the translation of [18F]FTT and [18F]PARPi into human studies (Fig.1a). However, veliparib has been essentially overlooked as a leading compound for PARP PET tracer development, despite its more desirable characteristics for brain PET imaging, i.e., high brain exposure, fast brain kinetics and less P- glycoprotein (P-gp) efflux from the brain. As a therapeutic drug, veliparib has been investigated extensively to treat non-small cell lung cancer, BRCA-mutated advanced breast cancer and ovarian cancer. In fact, some of the current PARP PET tracers have been investigated as PET imaging agents in gliomas but suffer from limited brain penetration and liability to efflux by transporter proteins. Using veliparib as the lead, computational analysis was performed and an N-11C-methylated veliparib derivative, (R)-2-(2-methyl-1-(methyl- 11C)pyrrolidin-2-yl)1H-benzo[d]imidazole-4-carboxamide ([11C]PyBic) was identified and synthesized, based on its predicted desirable physicochemical properties as a brain penetrant PET tracer, and evaluated its potential to image and quantify PARP in GBM and healthy brains. Specifically, the in vivo specific binding signals of [11C]PyBic were tested in a rodent GBM model through baseline and blocking studies. Ex vivo metabolite analysis showed no substantive radiometabolites in healthy rat brains. PET imaging results were corroborated by ex vivo biodistribution of [11C]PyBic, western blotting and immunohistochemical staining of PARP1 in selected brain regions and the implanted tumors. Furthermore, the BBB penetration of [11C]PyBic was confirmed using quantitative nonhuman primate (NHP) brain PET imaging. Blocking studies with the structurally analogous veliparib and the structurally distinctive PARPi BGB-290 (Pamiparib) confirmed PARP-specific tracer uptake in NHP brains. 12 53376748.1
Attorney Docket No.047162-7482WO1(02447)
 BGB-290 (Pamiparib) In various embodiments, a compound of Formula (I), or a salt, solvate, tautomer, or stereoisomer thereof is provided:
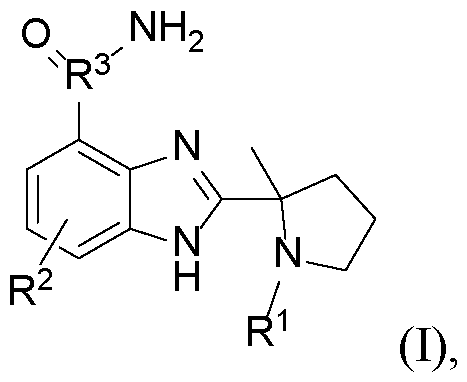 In certain embodiments, in the compound of Formula (I): R1 is H or C1-C6 alkyl containing at least one 11C atom; R2 is H or 18F; R3 is 11C or 12C; wherein the compound contains at least one of a 11C atom and a 18F atom. In various embodiments, the C1-C6 alkyl in the compound of Formula (I) is optionally substituted by at least one F or 18F atom. When R1 is larger than methyl, such as ethyl, propyl, butyl, pentyl, hexyl, or branched isomers thereof, the 11C atom can replace any 12C atom in the alkyl group at any location, and all such permutations of replacing a single 12C atom by a 11C atom are herein contemplated. In various embodiments, R1 is C1-C6 alkyl containing at least one 11C atom. In various embodiments, R1 is C2-C6 alkyl containing at least two 11C atoms, or more. In various embodiments, R1 is 11CH3. In various embodiments, R2 is 18F. In various embodiments, the compound of Formula (I) is selected from the group consisting of:
 In various embodiments, the compound of Formula (I) is selected from the group 13 53376748.1
Attorney Docket No.047162-7482WO1(02447) consisting of:
In various embodiments, the compound of Formula (I) is selected from the group 13 53376748.1
Attorney Docket No.047162-7482WO1(02447) consisting of:
 In various embodiments, a compound of Formula (II), or a salt, solvate, tautomer, or stereoisomer thereof is provided:
 In certain embodiments, in the compound of Formula (II): R1 is H or C1-C6 alkyl containing at least one 11C atom; R2 is 18F or 19F; and R3 is 11C or 12C; wherein the compound contains at least one of a 11C atom and a 18F atom. In various embodiments, the C1-C6 alkyl in the compound of Formula (II) is optionally substituted by at least one F or 18F atom. In the compound of Formula (II), when R1 is larger than methyl, such as ethyl, propyl, butyl, pentyl, hexyl, or branched isomers thereof, the 11C atom can replace any 12C atom in 14 53376748.1
Attorney Docket No.047162-7482WO1(02447) the alkyl group at any location, and all such permutations of replacing a single 12C atom by a 11C atom are herein contemplated. In various embodiments, R1 is C1-C6 alkyl containing at least one 11C atom. In various embodiments, R1 is C2-C6 alkyl containing at least two 11C atoms, or more. In various embodiments, R1 is 11CH3. In various embodiments, R2 is 18F. In various embodiments, the compound of Formula (II) is selected from the group consisting of: ,
In certain embodiments, in the compound of Formula (II): R1 is H or C1-C6 alkyl containing at least one 11C atom; R2 is 18F or 19F; and R3 is 11C or 12C; wherein the compound contains at least one of a 11C atom and a 18F atom. In various embodiments, the C1-C6 alkyl in the compound of Formula (II) is optionally substituted by at least one F or 18F atom. In the compound of Formula (II), when R1 is larger than methyl, such as ethyl, propyl, butyl, pentyl, hexyl, or branched isomers thereof, the 11C atom can replace any 12C atom in 14 53376748.1
Attorney Docket No.047162-7482WO1(02447) the alkyl group at any location, and all such permutations of replacing a single 12C atom by a 11C atom are herein contemplated. In various embodiments, R1 is C1-C6 alkyl containing at least one 11C atom. In various embodiments, R1 is C2-C6 alkyl containing at least two 11C atoms, or more. In various embodiments, R1 is 11CH3. In various embodiments, R2 is 18F. In various embodiments, the compound of Formula (II) is selected from the group consisting of: ,
 Compounds of Formula (II) can be synthesized by alkylation (alkylative cyclization) of the amide NH2 and imidazole nitrogen in the compound of Formula (I) forming a ring, according to methods known in the art. In various embodiments, the compound of Formula (II) is 15 53376748.1
Attorney Docket No.047162-7482WO1(02447)
Compounds of Formula (II) can be synthesized by alkylation (alkylative cyclization) of the amide NH2 and imidazole nitrogen in the compound of Formula (I) forming a ring, according to methods known in the art. In various embodiments, the compound of Formula (II) is 15 53376748.1
Attorney Docket No.047162-7482WO1(02447)
 To a solution of (R)-Veliparib (50 mg, 0.204 mmol) in MeOH (1 mL) was added CH2O aqueous solution (37%, 70 mg, 0.818 mmol, 70 uL) and Et3N (41 mg, 0.408 mmol, 56 umL). The mixture was stirred at rt for 2 h. Then NaBH3CN solid (64 mg, 1.018 mmol) was slowly added at 0 oC, the mixture was allowed to warm up to room temperature and stirred for 4 h. The mixture was filtered through Celite®, the filtrate was concentrated under reduced pressure, and purified by flash chromatography (CH2Cl2: MeOH = 1:20 to 1:10) to afford Pybic standard as a white solid (26 mg, 10.102 mmol, 50%). The obtained date was matched 34 53376748.1
Attorney Docket No.047162-7482WO1(02447) with reference reported.
To a solution of (R)-Veliparib (50 mg, 0.204 mmol) in MeOH (1 mL) was added CH2O aqueous solution (37%, 70 mg, 0.818 mmol, 70 uL) and Et3N (41 mg, 0.408 mmol, 56 umL). The mixture was stirred at rt for 2 h. Then NaBH3CN solid (64 mg, 1.018 mmol) was slowly added at 0 oC, the mixture was allowed to warm up to room temperature and stirred for 4 h. The mixture was filtered through Celite®, the filtrate was concentrated under reduced pressure, and purified by flash chromatography (CH2Cl2: MeOH = 1:20 to 1:10) to afford Pybic standard as a white solid (26 mg, 10.102 mmol, 50%). The obtained date was matched 34 53376748.1
Attorney Docket No.047162-7482WO1(02447) with reference reported.
 35 53376748.1
Attorney Docket No.047162-7482WO1(02447) To a stirred solution of 3 (1.00 g, 4.69 mmol) and Na2SO3 (2.44 g, 23.45 mmol) in MeOH (30 mL) at was added 4 (0.71 g, 4.69 mmol). The mixture was refluxed for 6 h. The mixture was quenched with H2O (100 mL) and stirred for 15 min. The aqueous layer was extracted with ethyl acetate (50 mL) and the combined organic layers were washed with brine (60 mL), then dried (MgSO4) and evaporated in vacuo. Purification by flash column chromatography (Hexane/ethyl acetate, 5:1 to 1:1) gave the product as a yellow solid (1.45 g, 4.22 mmol, 90%). Rf =0.6, (Hexane/ethyl acetate, 1:1); 1H-NMR (400 MHz, MeOH- d4) 7.90 (dd, J = 8.0, 1.0 Hz, 1H), 7.63 (d, J = 8 Hz, 1H), 7.32 - 7.27 (m, 1H), 3.81 – 3.74 (m, 1H), 3.65−3.59 (m, 1H), 2.33 – 2.16 (m, 2H), 2.08 – 1.96 (m, 2H), 1.89 (s, 3H), 1.41 (s, 3H), 1.00 (s, 6H); 13C-NMR (100 MHz, MeOH-d4) 169.0, 160.6, 154.1, 141.0, 134.8, 122.4, 121.6, 120.9, 114.7, 79.1, 42.5, 27.3, 26.7, 22.5, 22.0.
35 53376748.1
Attorney Docket No.047162-7482WO1(02447) To a stirred solution of 3 (1.00 g, 4.69 mmol) and Na2SO3 (2.44 g, 23.45 mmol) in MeOH (30 mL) at was added 4 (0.71 g, 4.69 mmol). The mixture was refluxed for 6 h. The mixture was quenched with H2O (100 mL) and stirred for 15 min. The aqueous layer was extracted with ethyl acetate (50 mL) and the combined organic layers were washed with brine (60 mL), then dried (MgSO4) and evaporated in vacuo. Purification by flash column chromatography (Hexane/ethyl acetate, 5:1 to 1:1) gave the product as a yellow solid (1.45 g, 4.22 mmol, 90%). Rf =0.6, (Hexane/ethyl acetate, 1:1); 1H-NMR (400 MHz, MeOH- d4) 7.90 (dd, J = 8.0, 1.0 Hz, 1H), 7.63 (d, J = 8 Hz, 1H), 7.32 - 7.27 (m, 1H), 3.81 – 3.74 (m, 1H), 3.65−3.59 (m, 1H), 2.33 – 2.16 (m, 2H), 2.08 – 1.96 (m, 2H), 1.89 (s, 3H), 1.41 (s, 3H), 1.00 (s, 6H); 13C-NMR (100 MHz, MeOH-d4) 169.0, 160.6, 154.1, 141.0, 134.8, 122.4, 121.6, 120.9, 114.7, 79.1, 42.5, 27.3, 26.7, 22.5, 22.0.
 To a stirred solution of 5 (1.00 g, 2.90 mmol) in CH2Cl2 (10 mL) at was added HCl (4M in dioxane, 11.6 mmol). The mixture was refluxed for 6 h. After filtration, solid precipitation (S)-Veliparib is obtained as a white solid (0.86 g, 2.72 mmol, 94%). Rf =0.6, (Hexane/ethyl acetate, 1:1); 1H NMR (400 MHz, DMSO-d6) δ 10.66 (d, J = 8.0 Hz, 1H), 9.59 (s, 1H), 8.95 (s, 1H), 7.87 (d, J = 7.5 Hz, 1H), 7.74 (d, J = 8.0 Hz, 1H), 7.36 (t, J = 7.8 Hz, 1H), 3.43 (d, J = 7.1 Hz, 2H), 2.56 (ddd, J = 13.1, 8.0, 5.1 Hz, 1H), 2.24 (dt, J = 13.2, 7.9 Hz, 1H), 2.11 (qd, J = 7.6, 2.5 Hz, 1H), 1.89 (s, 3H), 1.87 – 1.76 (m, 1H).13C NMR (100 MHz, DMSO-d6) δ 166.0, 154.4, 138.4, 136.1, 123.1, 122.7, 122.3, 116.7, 65.1, 44.2, 37.0, 23.3, 22.4.
 To a solution of (S)-Veliparib (64 mg, 0.20 mmol) in MeOH (1 mL) was added freshly CH2O aqueous solution (37%, 70 mg, 0.82 mmol, 70 umL) and Et3N (41 mg, 0.41 mmol, 56 umL). The mixture was stirred at rt for 2 h. Then NaBH3CN solid (64 mg, 1.02 mmol) was slowly added at 0 oC, the mixture was allowed to warm up to room temperature and stirred for 4 h. The mixture was filtered through Celite®, the filtrate was concentrated under reduced pressure, and purified by flash chromatography (CH2Cl2: MeOH = 1:20 to 1:10) to afford (S)-Me-Veliparib as a white solid (26 mg, 0.102 mmol, 50%).1H NMR (400 36 53376748.1
Attorney Docket No.047162-7482WO1(02447) MHz, D2O) δ 7.69 (d, J = 8.1 Hz, 1H), 7.33 (t, J = 7.9 Hz, 1H), 7.72 (d, J = 7.5 Hz, 1H), 3.49- 3.61 (m, 1H), 3.79-3.99 (m, 1H), 2.25-2.43 (m, 2H), 2.49-2.56 (m, 1H), 2.61-2.68 (m, 1H), 2.88 (s, 3H), 1.94 (s, 3H).13C NMR (100 MHz, D2O) δ 169.30, 151.17, 137.51, 134.60, 123.68, 123.48, 119.78, 117.23, 69.10, 54.17, 37.08, 35.20, 20.28, 17.74. tert-Butyl (R)-2-(4-carbamoyl-1H-benzo[d]imidazol-2-yl)-2-methylpyrrolidine-1- carboxylate (3)
To a solution of (S)-Veliparib (64 mg, 0.20 mmol) in MeOH (1 mL) was added freshly CH2O aqueous solution (37%, 70 mg, 0.82 mmol, 70 umL) and Et3N (41 mg, 0.41 mmol, 56 umL). The mixture was stirred at rt for 2 h. Then NaBH3CN solid (64 mg, 1.02 mmol) was slowly added at 0 oC, the mixture was allowed to warm up to room temperature and stirred for 4 h. The mixture was filtered through Celite®, the filtrate was concentrated under reduced pressure, and purified by flash chromatography (CH2Cl2: MeOH = 1:20 to 1:10) to afford (S)-Me-Veliparib as a white solid (26 mg, 0.102 mmol, 50%).1H NMR (400 36 53376748.1
Attorney Docket No.047162-7482WO1(02447) MHz, D2O) δ 7.69 (d, J = 8.1 Hz, 1H), 7.33 (t, J = 7.9 Hz, 1H), 7.72 (d, J = 7.5 Hz, 1H), 3.49- 3.61 (m, 1H), 3.79-3.99 (m, 1H), 2.25-2.43 (m, 2H), 2.49-2.56 (m, 1H), 2.61-2.68 (m, 1H), 2.88 (s, 3H), 1.94 (s, 3H).13C NMR (100 MHz, D2O) δ 169.30, 151.17, 137.51, 134.60, 123.68, 123.48, 119.78, 117.23, 69.10, 54.17, 37.08, 35.20, 20.28, 17.74. tert-Butyl (R)-2-(4-carbamoyl-1H-benzo[d]imidazol-2-yl)-2-methylpyrrolidine-1- carboxylate (3)
 Method 1: To 50 mL flask was added K2CO3 (2.5 equiv) and MeI (1.1 equiv) were added to a solution containing 4 (30 mg) and DMF (1 mL). The reaction mixture was heated at 100 °C for 12 h. After completion of the reaction, the mixture was then allowed to cool to room temperature, poured into water (10 mL) and extracted with ethyl acetate (3 x 5 mL). The combined organic portions containing 5 were concentrated to a residue. The residue was further purified using silica gel column chromatography to afford 5 (11 mg, 56% yield) as a colorless solid. 1H-NMR (400 MHz, MeOHd4) 7.87 (d, J = 8.0 Hz, 1H), 7.67 (d, J = 8 Hz, 1H), 7.28 (t, d = 8.0 Hz, 1H), 3.09 − 3.03 (m, 1H), 2.87 – 2.82 (m, 1H), 2.39−2.32 (m, 1H), 2.24 (s, 3H), 2.07 – 1.93 (m, 3H), 1.58 (s, 3H); 13C-NMR (100 MHz, MeOH-d4) δ 170.6, 161.2, 123.7, 122.9, 121.9, 121.8, 117.5, 117.3, 64.56, 54.8, 41.5, 35.7, 22.8, 18.8.. HRMS (ESI) m/z calculated for C14H19N4O [M+H]: 259.1559. Found: 259.1537. Method 2: To a solution of Veliparib (20 mg, 0.071 mmol) in MeOH (3 mL) was added freshly CH2O aqueous solution (37%, 0.28 mmol) and Et3N (28 mg, 0.28 mmol). The mixture was stirred at rt for 3h. Then NaCNBH3 solid (22 mg, 0.35 mmol) was slowly added at 0 °C, the mixture was allowed to warm up to room temperature and stirred for 2 h. The mixture was filtered through Celite®, the filtrate was concentrated under reduced pressure, and purified by flash chromatography (CH2Cl2: MeOH = 1:20 to 1:10) to afford Me- Veliparib as a white solid (14 mg, 0.055 mmol, 77%). The obtained date was matched with reference reported. 38 53376748.1
Attorney Docket No.047162-7482WO1(02447) 1H-NMR (400 MHz, MeOHd4) 7.87 (d, J = 8.0 Hz, 1H), 7.67 (d, J = 8 Hz, 1H), 7.28 (t, d = 8.0 Hz, 1H), 3.09 − 3.03 (m, 1H), 2.87 – 2.82 (m, 1H), 2.39−2.32 (m, 1H), 2.24 (s, 3H), 2.07 – 1.93 (m, 3H), 1.58 (s, 3H); 13C-NMR (100 MHz, MeOH-d4) δ 170.6, 161.2, 123.7, 122.9, 121.9, 121.8, 117.5, 117.3, 64.56, 54.8, 41.5, 35.7, 22.8, 18.8.. HRMS (ESI) m/z calculated for C14H19N4O [M+H]: 259.1559. Found: 259.1537. Synthesis of the major metabolite (6)
Method 1: To 50 mL flask was added K2CO3 (2.5 equiv) and MeI (1.1 equiv) were added to a solution containing 4 (30 mg) and DMF (1 mL). The reaction mixture was heated at 100 °C for 12 h. After completion of the reaction, the mixture was then allowed to cool to room temperature, poured into water (10 mL) and extracted with ethyl acetate (3 x 5 mL). The combined organic portions containing 5 were concentrated to a residue. The residue was further purified using silica gel column chromatography to afford 5 (11 mg, 56% yield) as a colorless solid. 1H-NMR (400 MHz, MeOHd4) 7.87 (d, J = 8.0 Hz, 1H), 7.67 (d, J = 8 Hz, 1H), 7.28 (t, d = 8.0 Hz, 1H), 3.09 − 3.03 (m, 1H), 2.87 – 2.82 (m, 1H), 2.39−2.32 (m, 1H), 2.24 (s, 3H), 2.07 – 1.93 (m, 3H), 1.58 (s, 3H); 13C-NMR (100 MHz, MeOH-d4) δ 170.6, 161.2, 123.7, 122.9, 121.9, 121.8, 117.5, 117.3, 64.56, 54.8, 41.5, 35.7, 22.8, 18.8.. HRMS (ESI) m/z calculated for C14H19N4O [M+H]: 259.1559. Found: 259.1537. Method 2: To a solution of Veliparib (20 mg, 0.071 mmol) in MeOH (3 mL) was added freshly CH2O aqueous solution (37%, 0.28 mmol) and Et3N (28 mg, 0.28 mmol). The mixture was stirred at rt for 3h. Then NaCNBH3 solid (22 mg, 0.35 mmol) was slowly added at 0 °C, the mixture was allowed to warm up to room temperature and stirred for 2 h. The mixture was filtered through Celite®, the filtrate was concentrated under reduced pressure, and purified by flash chromatography (CH2Cl2: MeOH = 1:20 to 1:10) to afford Me- Veliparib as a white solid (14 mg, 0.055 mmol, 77%). The obtained date was matched with reference reported. 38 53376748.1
Attorney Docket No.047162-7482WO1(02447) 1H-NMR (400 MHz, MeOHd4) 7.87 (d, J = 8.0 Hz, 1H), 7.67 (d, J = 8 Hz, 1H), 7.28 (t, d = 8.0 Hz, 1H), 3.09 − 3.03 (m, 1H), 2.87 – 2.82 (m, 1H), 2.39−2.32 (m, 1H), 2.24 (s, 3H), 2.07 – 1.93 (m, 3H), 1.58 (s, 3H); 13C-NMR (100 MHz, MeOH-d4) δ 170.6, 161.2, 123.7, 122.9, 121.9, 121.8, 117.5, 117.3, 64.56, 54.8, 41.5, 35.7, 22.8, 18.8.. HRMS (ESI) m/z calculated for C14H19N4O [M+H]: 259.1559. Found: 259.1537. Synthesis of the major metabolite (6)
 To a solution of 5 (70 mg, 0.27 mmol) in CH3CN (3 mL) was added tetrapropylammonium perruthenate solid (9 mg, 0.027 mmol) and NaIO4 aqueous solution (144 mg, 0.675 mmol, 1.0 mL) at 0 °C. The mixture was stirred at 0 °C for 3h. Then the reaction was quenched with Na2SO3 aqueous solution. The mixture was filtered through Celite®, washed with MeOH (5 mL) for 3 times, the filtrate was concentrated under reduced pressure, and purified by flash chromatography (CH2Cl2: MeOH = 1:20 to 1:10) to afford amide 6 as a white solid (6 mg, 0.024 mmol, 9%). 1H NMR (400 MHz, MeOH-d4) δ 7.96 (d, J = 7.6 Hz, 1H), 7.70 (d, J = 8.0 Hz, 1H), 7.36 (t, J = 7.9 Hz, 1H), 2.77 (s, 3H), 2.58 (q, J = 9.2 Hz, 2H), 2.45 (td, J = 11.1, 8.9, 5.1 Hz, 1H), 2.28 (dt, J = 13.2, 8.4 Hz, 1H), 1.88 (s, 3H).13C NMR (100 MHz, MeOH-d4) δ 176.2, 168.6, 157.0, 140.8, 135.2, 123.0, 122.3, 121.5, 115.3, 63.32, 33.3, 29.0, 25.0, 21.7. HRMS (ESI) m/z calculated for C14H19N4O [M+H]: 273.1346. Found: 273.1342.
 BH3·Me2S (8.61 mL, 1.0 M in THF, 8.61 mmol) was added dropwise over 1 h to a stirred solution of (R)-1-(tert-butoxycarbonyl)-2-methylpyrrolidine-2-carboxylic acid (1.79 g, 7.83 mmol) in THF (46 mL). The reaction mixture was then heated at a gentle reflux for 1 h, cooled to RT and concentrated in vacuo to yield the title compound 2 as a colourless oil (1.70 g). Rf =0.4, (Hexane/ethyl acetate, 2:1). The intermediate was used for next step without further purification. To a stirred solution of compound 2 (1.60 g, 7.45 mmol) in dichloromethane (88 mL) at 0 °C was added Dess–Martin periodinane (4.86 g, 11.5 mmol). The mixture was allowed to 39 53376748.1
Attorney Docket No.047162-7482WO1(02447) warm to RT, stirred for 6 h then diluted with ether (100 mL). The mixture was poured onto NaOH solution (1.3 M aq., 200 mL) and stirred for 15 min. The layers were separated and the organic layer was washed successively with NaOH solution (1.3 M aq., 60 mL) and brine (60 mL), then dried (MgSO4) and evaporated in vacuo to yield aldehyde as a yellow oil (1.55 g, 97%) that was used without further purification. Rf =0.5, (Hexane/ethyl acetate, 2:1); 1HNMR (400 MHz, CDCl3) (2:1 rotameric mixture) major rotamer: 1.37 (3 H, s), 1.40 (9 H, s), 1.58–1.71 (1 H, m), 1.87–2.02 (3 H, m), 3.41–3.67 (2 H, m), 9.32 (1 H, s); minor rotamer: 1.41 (3 H, s), 1.44 (9 H, s), 1.58–1.71 (1 H, m), 1.87–2.02 (3 H, m), 3.41–3.67 (2 H, m), 9.40 (1 H, s); 13CNMR (100 MHz, CDCl3) major rotamer: 18.7, 22.7, 28.2, 35.4, 47.4, 68.2, 80.8, 153.2, 199.6; minor rotamer: 17.9, 23.6, 28.4, 34.4, 47.4, 68.4, 80.1, 154.0, 200.2.
BH3·Me2S (8.61 mL, 1.0 M in THF, 8.61 mmol) was added dropwise over 1 h to a stirred solution of (R)-1-(tert-butoxycarbonyl)-2-methylpyrrolidine-2-carboxylic acid (1.79 g, 7.83 mmol) in THF (46 mL). The reaction mixture was then heated at a gentle reflux for 1 h, cooled to RT and concentrated in vacuo to yield the title compound 2 as a colourless oil (1.70 g). Rf =0.4, (Hexane/ethyl acetate, 2:1). The intermediate was used for next step without further purification. To a stirred solution of compound 2 (1.60 g, 7.45 mmol) in dichloromethane (88 mL) at 0 °C was added Dess–Martin periodinane (4.86 g, 11.5 mmol). The mixture was allowed to 39 53376748.1
Attorney Docket No.047162-7482WO1(02447) warm to RT, stirred for 6 h then diluted with ether (100 mL). The mixture was poured onto NaOH solution (1.3 M aq., 200 mL) and stirred for 15 min. The layers were separated and the organic layer was washed successively with NaOH solution (1.3 M aq., 60 mL) and brine (60 mL), then dried (MgSO4) and evaporated in vacuo to yield aldehyde as a yellow oil (1.55 g, 97%) that was used without further purification. Rf =0.5, (Hexane/ethyl acetate, 2:1); 1HNMR (400 MHz, CDCl3) (2:1 rotameric mixture) major rotamer: 1.37 (3 H, s), 1.40 (9 H, s), 1.58–1.71 (1 H, m), 1.87–2.02 (3 H, m), 3.41–3.67 (2 H, m), 9.32 (1 H, s); minor rotamer: 1.41 (3 H, s), 1.44 (9 H, s), 1.58–1.71 (1 H, m), 1.87–2.02 (3 H, m), 3.41–3.67 (2 H, m), 9.40 (1 H, s); 13CNMR (100 MHz, CDCl3) major rotamer: 18.7, 22.7, 28.2, 35.4, 47.4, 68.2, 80.8, 153.2, 199.6; minor rotamer: 17.9, 23.6, 28.4, 34.4, 47.4, 68.4, 80.1, 154.0, 200.2.
 The known key intermediates were synthesized according to the reported methods.
 Synthesis of compounds of Formula (II): 40 53376748.1
Attorney Docket No.047162-7482WO1(02447)
Synthesis of compounds of Formula (II): 40 53376748.1
Attorney Docket No.047162-7482WO1(02447)
 The key intermediates were synthesized according to the reported methods.
 1H NMR (400 MHz, Acetone-d6) δ 7.77 (t, J = 5.6 Hz, 1H), 7.23 (ddd, J = 19.9, 7.8, 1.2 Hz, 2H), 6.67 (t, J = 7.8 Hz, 1H), 3.11 – 2.93 (m, 2H), 3.00 – 2.68 (m, 5H), 2.01 (q, J = 8.6 Hz, 1H), 2.02 – 1.81 (m, 1H), 1.80 – 1.51 (m, 1H), 1.46 (s, 3H), 1.44 – 1.35 (m, 1H), 1.35 – 1.18 (m, 3H), 0.83 (s, 3H). 13C NMR (101 MHz, acetone) δ 167.11, 142.05, 133.32, 125.40, 122.66, 120.81, 117.39, 64.26, 52.19, 40.64, 37.65, 34.33, 21.54, 16.37.
 1H NMR (400 MHz, Chloroform-d) δ 8.08 (d, J = 7.6 Hz, 1H), 7.92 (d, J = 7.8 Hz, 1H), 7.48 (d, J = 6.1 Hz, 1H), 7.32 (td, J = 7.8, 1.7 Hz, 1H), 4.45 (t, J = 9.5 Hz, 0.5H), 4.31 (t, J = 9.6 Hz, 1H), 4.18 (d, J = 9.7 Hz, 0.5 H), 3.66 (q, J = 5.0, 3.8 Hz, 2H), 3.46 (d, J = 1.7 Hz, 1H), 3.40 (dt, J = 8.6, 4.3 Hz, 1H), 2.85 – 2.66 (m, 1H), 2.60 (d, J = 7.9 Hz, 1H), 2.57 – 2.28 (m, 1H), 2.26 (d, J = 9.7 Hz, 1H), 2.27 – 1.71 (m, 3H), 1.58 (s, 3H). 13C NMR (101 MHz, Chloroform-d) δ 169.23, 142.13, 133.60, 126.79, 123.80, 121.65, 116.52, 82.48, 80.79, 65.25, 50.72, 49.58, 49.49, 49.30, 41.73, 41.69, 37.89, 21.86, 17.11. 41 53376748.1
Attorney Docket No.047162-7482WO1(02447)
1H NMR (400 MHz, Chloroform-d) δ 8.08 (d, J = 7.6 Hz, 1H), 7.92 (d, J = 7.8 Hz, 1H), 7.48 (d, J = 6.1 Hz, 1H), 7.32 (td, J = 7.8, 1.7 Hz, 1H), 4.45 (t, J = 9.5 Hz, 0.5H), 4.31 (t, J = 9.6 Hz, 1H), 4.18 (d, J = 9.7 Hz, 0.5 H), 3.66 (q, J = 5.0, 3.8 Hz, 2H), 3.46 (d, J = 1.7 Hz, 1H), 3.40 (dt, J = 8.6, 4.3 Hz, 1H), 2.85 – 2.66 (m, 1H), 2.60 (d, J = 7.9 Hz, 1H), 2.57 – 2.28 (m, 1H), 2.26 (d, J = 9.7 Hz, 1H), 2.27 – 1.71 (m, 3H), 1.58 (s, 3H). 13C NMR (101 MHz, Chloroform-d) δ 169.23, 142.13, 133.60, 126.79, 123.80, 121.65, 116.52, 82.48, 80.79, 65.25, 50.72, 49.58, 49.49, 49.30, 41.73, 41.69, 37.89, 21.86, 17.11. 41 53376748.1
Attorney Docket No.047162-7482WO1(02447)
 1H NMR (400 MHz, Methanol-d4) δ 7.70 (dt, J = 10.5, 2.2 Hz, 1H), 7.55 (dt, J = 8.6, 2.2 Hz, 1H), 3.74 (s, 2H), 3.29 – 3.23 (m, 2H), 3.13 (s, 1H), 2.62 (s, 1H), 2.17 (t, J = 10.0 Hz, 1H), 2.14 – 2.03 (m, 1H), 2.02 – 1.92 (m, 2H), 1.90 (d, J = 1.8 Hz, 1H), 1.71 (s, 3H). 13C NMR (101 MHz, cd3od) δ 167.56, 159.77, 158.45, 157.41, 142.58, 142.46, 130.07, 117.65, 117.56, 113.39, 113.11, 108.98, 108.73, 64.04, 49.52, 45.17, 40.53, 37.02, 24.49, 24.32.
 1H NMR (400 MHz, Chloroform-d) δ 7.82 (dd, J = 10.4, 2.5 Hz, 1H), 7.60 (dd, J = 8.5, 2.6 Hz, 1H), 3.75 – 3.54 (m, 2H), 3.16 (td, J = 8.5, 7.8, 2.6 Hz, 1H), 3.02 (s, 1H), 2.93 (s, 1H), 2.73 – 2.62 (m, 1H), 2.33 – 2.21 (m, 1H), 2.14 (s, 3H), 2.08 (s, 1H), 2.05 – 1.95 (m, 3H), 1.75 (s, 1H), 1.54 (s, 3H). 13C NMR (101 MHz, cdcl3) δ 168.15, 159.80, 157.44, 143.49, 143.37, 130.40, 114.16, 113.89, 110.25, 110.01, 65.03, 52.62, 41.94, 38.60, 38.19, 35.34, 34.80, 22.13, 21.72, 16.37.
 1H NMR (400 MHz, DMSO-d6) δ 10.53 – 10.39 (m, 1H), 9.66 (s, 1H), 8.62 (t, J = 5.6 Hz, 1H), 8.05 (d, J = 1.9 Hz, 1H), 7.93 (d, J = 1.8 Hz, 1H), 3.61 (d, J = 4.9 Hz, 2H), 3.33 (d, J = 6.7 Hz, 2H), 2.51 – 2.34 (m, 4H), 2.12 (dt, J = 14.1, 7.1 Hz, 1H), 1.90 (d, J = 10.5 Hz, 1H), 1.75 (s, 3H). 13C NMR (101 MHz, dmso) δ 165.67, 155.24, 143.21, 132.68, 128.75, 125.34, 119.98, 114.54, 66.77, 65.49, 49.88, 43.82, 35.53, 23.13, 22.93.
 1H NMR (400 MHz, Chloroform-d) δ 8.15 (s, 1H), 8.05 (s, 1H), 7.84 (s, 1H), 4.54 – 3.41 (m, 6H), 2.10 (m, 4H), 1.92 (s, 3H), 1.00 (s, 9H), 0.31 (s, 9H). 13C NMR (101 MHz, cdcl3) δ 169.87, 153.38, 141.39, 134.37, 133.35, 132.95, 132.81, 131.79, 131.38, 115.50, 80.14, 62.52, 49.09, 47.00, 41.38, 40.07, 29.66, 28.31, 27.98, 25.00, 22.24, -9.26. 42 53376748.1
Attorney Docket No.047162-7482WO1(02447) Radiochemistry Solid-phase extraction (SPE) Sep-Pak cartridges were purchased from Waters Associates (Milford, MA, USA). The HPLC system used for purification of crude product included a Shimadzu LC-20A pump, a Knauer K200 UV detector, and a Bioscan γ-flow detector, with a Luna C18(2) semipreparative column. The HPLC system used for quality control tests was composed of a Shimadzu LC-20A pump, a Shimadzu SPD-M20A PDA or SPD-20A UV detector, and a Bioscan γ-flow detector, with a Gemini NX column eluting with a mobile phase of 20% CH3CN and 80% 0.1% triethyl amine (TEA) buffer solution (pH 11.75) at a flow rate of 2 mL/min. [11C]CO2 was produced through the 14N(p,α)11C nuclear reaction by bombardment of a high-pressure target containing a mixture of nitrogen and oxygen (0.5%–1%) with a 16.8-MeV proton beam that was produced by the PET Trace cyclotron (GE Healthcare) cyclotron. [11C]MeI was synthesized by the gas-phase method from [11C]CO2 using the FXMeI module (GE Healthcare) by initially converting [11C]CO2 to [11C]-methane, followed by the reaction of [11C]-methane with iodine at 720 °C to produce [11C]MeI. Experimental procedure for the radiochemical synthesis of [11C]PyBic After trapping [11C]MeI into a reaction vial containing K2CO3 (2.5 equiv.) and precursor 4 (1.5 mg) in DMF (0.3 mL), the reaction mixture was heated at 100 °C for 10 min. Subsequently, the mixture was quenched with 1.5 mL of 20 mM NH4HCO3 buffer (pH = 8.8) and MeCN in an 80:20 (v/v) ratio as the HPLC eluent. The mixture was eluted with the HPLC mobile phase at a flow rate of 5 mL/ min. The product portion was collected using a semi-PrepHPLC setup using a Phenomenex Luna C-18 HPLC column (10 μm, 10 mm × 250 mm) with a retention time of approximately 20 min. The product, which was collected into 50 mL of water, was then trapped on a C18 light SepPak cartridge (Waters). The cartridge was washed with 10 mL of water. The cartridge was eluted with 1 mL of ethanol and 3 mL of saline, and the radioactive material was finally collected in a dose vial pre-charged with 7 ml of saline and 8.4% USP sodium bicarbonate solution. Alternative Experimental procedure for the radiochemical synthesis of [11C]- PyBic, [11C]-PyBic-s, [11C]-F-PyBic. 43 53376748.1
Attorney Docket No.047162-7482WO1(02447)
1H NMR (400 MHz, Chloroform-d) δ 8.15 (s, 1H), 8.05 (s, 1H), 7.84 (s, 1H), 4.54 – 3.41 (m, 6H), 2.10 (m, 4H), 1.92 (s, 3H), 1.00 (s, 9H), 0.31 (s, 9H). 13C NMR (101 MHz, cdcl3) δ 169.87, 153.38, 141.39, 134.37, 133.35, 132.95, 132.81, 131.79, 131.38, 115.50, 80.14, 62.52, 49.09, 47.00, 41.38, 40.07, 29.66, 28.31, 27.98, 25.00, 22.24, -9.26. 42 53376748.1
Attorney Docket No.047162-7482WO1(02447) Radiochemistry Solid-phase extraction (SPE) Sep-Pak cartridges were purchased from Waters Associates (Milford, MA, USA). The HPLC system used for purification of crude product included a Shimadzu LC-20A pump, a Knauer K200 UV detector, and a Bioscan γ-flow detector, with a Luna C18(2) semipreparative column. The HPLC system used for quality control tests was composed of a Shimadzu LC-20A pump, a Shimadzu SPD-M20A PDA or SPD-20A UV detector, and a Bioscan γ-flow detector, with a Gemini NX column eluting with a mobile phase of 20% CH3CN and 80% 0.1% triethyl amine (TEA) buffer solution (pH 11.75) at a flow rate of 2 mL/min. [11C]CO2 was produced through the 14N(p,α)11C nuclear reaction by bombardment of a high-pressure target containing a mixture of nitrogen and oxygen (0.5%–1%) with a 16.8-MeV proton beam that was produced by the PET Trace cyclotron (GE Healthcare) cyclotron. [11C]MeI was synthesized by the gas-phase method from [11C]CO2 using the FXMeI module (GE Healthcare) by initially converting [11C]CO2 to [11C]-methane, followed by the reaction of [11C]-methane with iodine at 720 °C to produce [11C]MeI. Experimental procedure for the radiochemical synthesis of [11C]PyBic After trapping [11C]MeI into a reaction vial containing K2CO3 (2.5 equiv.) and precursor 4 (1.5 mg) in DMF (0.3 mL), the reaction mixture was heated at 100 °C for 10 min. Subsequently, the mixture was quenched with 1.5 mL of 20 mM NH4HCO3 buffer (pH = 8.8) and MeCN in an 80:20 (v/v) ratio as the HPLC eluent. The mixture was eluted with the HPLC mobile phase at a flow rate of 5 mL/ min. The product portion was collected using a semi-PrepHPLC setup using a Phenomenex Luna C-18 HPLC column (10 μm, 10 mm × 250 mm) with a retention time of approximately 20 min. The product, which was collected into 50 mL of water, was then trapped on a C18 light SepPak cartridge (Waters). The cartridge was washed with 10 mL of water. The cartridge was eluted with 1 mL of ethanol and 3 mL of saline, and the radioactive material was finally collected in a dose vial pre-charged with 7 ml of saline and 8.4% USP sodium bicarbonate solution. Alternative Experimental procedure for the radiochemical synthesis of [11C]- PyBic, [11C]-PyBic-s, [11C]-F-PyBic. 43 53376748.1
Attorney Docket No.047162-7482WO1(02447)
 The QMA cartridge 18F Separation Cartridge 45 mg PS-HCO3- was purchased from 44 53376748.1
Attorney Docket No.047162-7482WO1(02447) Synthra GmbH (Art. No.00260110; preconditioned 5 ml EtOH, 5 ml aq. potassium triflate 90 mg/ml, 5 ml water, and 5 ml air). The used PTFE syringe filter was purchased from VWR (Art. No.514-0071; pore size 0.45 µm, 25 mm ø, preconditioned: 10 ml EtOH, 10 ml water, and 10 ml air) and the used RP cartridge was purchased from waters (Sep-Pak C18 classic cartridge, 360 mg sorbent, 55-105 µm, Art. No. WAT051910, preconditioned: 10 ml EtOH, 10 ml water, 10 ml air; Sep-Pak C18 plus light cartridge, 130 mg sorbent, 55-105 µm, Art. No. WAT023501, preconditioned: 10 ml EtOH, 10 ml water, 10 ml air). Semi-preparative HPLC was conducted using a Shimadzu LC-20A pump with a Knauer K200 UV detector and a Bioscan γ-flow detector on a Phenomenex Luna 10 µm C18(2) 100 Å column (250 × 10 mm, Phenomenex Ltd., Germany). Analytical HPLC separations employed a Shimadzu LC- 20AT pump, DGU-20A5R degasser, CBM-20A communication bus module, SPD-20A UV/Vis detector, and a Bioscan γ-flow radioactivity monitor. Data analysis was carried out using Shimadzu Client/Server software (v7.4SP4, Shimadzu Scientific Instruments, Inc.). The cyclotron produced aqueous [18F]fluoride solution in H218O was transferred to a V-vial in a lead-shielded hot cell, where the [18F]fluoride anion was trapped on an anionic exchange resin cartridge (Chromafix-PS-HCO3) pre-activated by elution sequentially with EtOH (5 mL), an aqueous solution of potassium triflate (KOTf, 90 mg/mL, 5 mL), and deionized (DI) water (5 mL). The potassium [18F]fluoride was then eluted off the cartridge into a 2-mL V-vial with the mixture of aqueous solution of KOTf (10 mg/mL, 0.45 mL) and MeCN (0.5 mL). The eluent was azeotropically dried at 110 °C, with two portions of anhydrous MeCN (1.0 mL × 2) added during the process. A solution of the Tin precursor (5.0 mg) in anhydrous 1,3-Dimethyl-2-imidazolidinone (DMI, 0.4 mL) was then added to the reaction vial, followed by the solution of pyridine (1 M in DMI, 0.1 mL) and copper(II) triflate (0.2 M in DMI, 67 µL). The reaction mixture was then heated at 180 °C for 30 min, then HCl (6 M, 0.2 mL) were added. The reaction mixture was heated at 100 °C for another 10 min, then NaOH-EDTA solution was added (5M, 0.2 mL). The reaction mixture was diluted with the HPLC mobile phase (1.0 mL) and purified by HPLC (column: Phenomenex Gemini C18, 10 µm, 10 × 250 mm; mobile phase: 20% MeCN and 80% 0.1% Et3N; flow rate: 5 mL/min). The eluent was monitored by a UV detector (at 254 nm) and a radioactivity detector. The fraction containing [18F]-F-Veliparib was collected, diluted with DI water (50 mL), and passed through a C18 SepPak, which was then washed with 0.001 N HCl (10 mL) and dried with 10 cc air. The product was eluted off with EtOH (1 mL), diluted with USP grade saline (3 mL), passed through a sterile membrane filter (0.22 µm), and collected in a sterile vial pre-charged with 7 45 53376748.1
Attorney Docket No.047162-7482WO1(02447) mL of USP saline and 20 µL of 8.4% NaHCO3 to afford a formulated solution ready for administration. Analytic HPLC conditions (column: Phenomenex Gemini, 5 µm, 4.6 × 250 mm; mobile phase: 20% MeCN and 80% 0.1% Et3N, flow rate: 5 mL/min, retention time = 7.63 min) were used in the quality control step. Experimental procedure for the radiochemical synthesis of [11C]-PARP8.
The QMA cartridge 18F Separation Cartridge 45 mg PS-HCO3- was purchased from 44 53376748.1
Attorney Docket No.047162-7482WO1(02447) Synthra GmbH (Art. No.00260110; preconditioned 5 ml EtOH, 5 ml aq. potassium triflate 90 mg/ml, 5 ml water, and 5 ml air). The used PTFE syringe filter was purchased from VWR (Art. No.514-0071; pore size 0.45 µm, 25 mm ø, preconditioned: 10 ml EtOH, 10 ml water, and 10 ml air) and the used RP cartridge was purchased from waters (Sep-Pak C18 classic cartridge, 360 mg sorbent, 55-105 µm, Art. No. WAT051910, preconditioned: 10 ml EtOH, 10 ml water, 10 ml air; Sep-Pak C18 plus light cartridge, 130 mg sorbent, 55-105 µm, Art. No. WAT023501, preconditioned: 10 ml EtOH, 10 ml water, 10 ml air). Semi-preparative HPLC was conducted using a Shimadzu LC-20A pump with a Knauer K200 UV detector and a Bioscan γ-flow detector on a Phenomenex Luna 10 µm C18(2) 100 Å column (250 × 10 mm, Phenomenex Ltd., Germany). Analytical HPLC separations employed a Shimadzu LC- 20AT pump, DGU-20A5R degasser, CBM-20A communication bus module, SPD-20A UV/Vis detector, and a Bioscan γ-flow radioactivity monitor. Data analysis was carried out using Shimadzu Client/Server software (v7.4SP4, Shimadzu Scientific Instruments, Inc.). The cyclotron produced aqueous [18F]fluoride solution in H218O was transferred to a V-vial in a lead-shielded hot cell, where the [18F]fluoride anion was trapped on an anionic exchange resin cartridge (Chromafix-PS-HCO3) pre-activated by elution sequentially with EtOH (5 mL), an aqueous solution of potassium triflate (KOTf, 90 mg/mL, 5 mL), and deionized (DI) water (5 mL). The potassium [18F]fluoride was then eluted off the cartridge into a 2-mL V-vial with the mixture of aqueous solution of KOTf (10 mg/mL, 0.45 mL) and MeCN (0.5 mL). The eluent was azeotropically dried at 110 °C, with two portions of anhydrous MeCN (1.0 mL × 2) added during the process. A solution of the Tin precursor (5.0 mg) in anhydrous 1,3-Dimethyl-2-imidazolidinone (DMI, 0.4 mL) was then added to the reaction vial, followed by the solution of pyridine (1 M in DMI, 0.1 mL) and copper(II) triflate (0.2 M in DMI, 67 µL). The reaction mixture was then heated at 180 °C for 30 min, then HCl (6 M, 0.2 mL) were added. The reaction mixture was heated at 100 °C for another 10 min, then NaOH-EDTA solution was added (5M, 0.2 mL). The reaction mixture was diluted with the HPLC mobile phase (1.0 mL) and purified by HPLC (column: Phenomenex Gemini C18, 10 µm, 10 × 250 mm; mobile phase: 20% MeCN and 80% 0.1% Et3N; flow rate: 5 mL/min). The eluent was monitored by a UV detector (at 254 nm) and a radioactivity detector. The fraction containing [18F]-F-Veliparib was collected, diluted with DI water (50 mL), and passed through a C18 SepPak, which was then washed with 0.001 N HCl (10 mL) and dried with 10 cc air. The product was eluted off with EtOH (1 mL), diluted with USP grade saline (3 mL), passed through a sterile membrane filter (0.22 µm), and collected in a sterile vial pre-charged with 7 45 53376748.1
Attorney Docket No.047162-7482WO1(02447) mL of USP saline and 20 µL of 8.4% NaHCO3 to afford a formulated solution ready for administration. Analytic HPLC conditions (column: Phenomenex Gemini, 5 µm, 4.6 × 250 mm; mobile phase: 20% MeCN and 80% 0.1% Et3N, flow rate: 5 mL/min, retention time = 7.63 min) were used in the quality control step. Experimental procedure for the radiochemical synthesis of [11C]-PARP8.
 Sep-Pak cartridges for solid-phase extraction (SPE) were obtained from Waters Associates (Milford, MA, USA). The purification of the crude product was performed using an HPLC system comprising a Shimadzu LC-20A pump, a Knauer K200 UV detector, and a Bioscan γ-flow detector. For analytic HPLC, a different HPLC system was utilized, consisting of a Shimadzu LC-20A pump, a Shimadzu SPD-M20A PDA or SPD-20A UV detector, and a Bioscan γ-flow detector. The production of [11C]CO2 involved the 14N(p,α)11C nuclear reaction, achieved by directing a 16.8-MeV proton beam from the PET Trace cyclotron (GE Healthcare) at a high- pressure target containing a nitrogen and oxygen mixture (0.5%–1%). Subsequently, [11C]MeI was synthesized using the gas-phase method through the FXMeI module (GE Healthcare). This process began with the conversion of [11C]CO2 to [11C]-methane, which was then reacted with iodine at 720 °C to yield [11C]MeI. After trapping [11C]MeI into a reaction vial containing Cs2CO3 (2.5 equiv.) and PyBic or PyBic-s precursor(1.5 mg) in DMF (0.3 mL), the reaction mixture was heated at 100 °C for 10 min. Subsequently, the mixture was quenched with 1.5 mL of 20 mM NH4CO3 buffer (pH = 8.8, with sodium ascorbate 300 mg/L) and MeCN in 80:20 (v/v) ratio as HPLC eluent. The mixture was eluted with the HPLC mobile phase, at a flow rate of 5 mL/min. The product portion was collected using a semiPrep-HPLC. The product which was collected into a 50 mL of water was then trapped on a C18 light SepPak cartridge (Waters). The cartridge was washed with 10 mL of water. The cartridge was eluted with 1 mL of ethanol and 3 mL of saline and the radioactive material was finally collected in a dose vial pre-charged with 7 ml of saline and 8.4 % USP sodium bicarbonate solution. Measurement of lipophilicity (log D7.4) 46 53376748.1
Attorney Docket No.047162-7482WO1(02447) The lipophilicity was determined by the modified method from previously published procedures. Log D7.4 was measured and calculated as the ratio of decay-corrected radioactivity concentrations in 1-octanol and phosphate-buffered saline (PBS, pH = 7.4, Dulbecco). Six consecutive equilibrations of [11C]PyBic in 1-octanol and phosphatebuffered saline (PBS, pH = 7.4, Dulbecco) were performed until a constant value of log D7.4 was obtained. Saturation binding assay using [3H]PyBic in rat hippocampus and NHP brain tissue The saturation binding assay was performed at Gifford Bioscience (UK). The hippocampus was dissected from the rat brain. The cerebellum, brain stem, frontal cortex, hippocampus, and occipital cortex were dissected from the monkey brain. The dissected brain tissues were homogenized in ice-cold buffer (50 mM Tris; 5 mM MgCl2; 5 mM EDTA; protease inhibitor cocktail). After a low-speed spin (100 × g) to remove tissue pieces, the supernatant was transferred to a fresh tube and centrifuged at 17,000 × g for 10 min at 4 °C to pellet the membranes. The pellet was resuspended in fresh buffer and centrifuged a second time. The pellet from the second spin was resuspended in buffer (50 mM Tris, 5 mM MgCl2, 0.1 mM EDTA) containing 10% sucrose as a cryoprotectant, divided into aliquots, frozen, and stored at -80 °C. A sample of the washed membrane preparation was analyzed for protein content using the Pierce® BCA assay. Radioligand binding assays were carried out in 96- well plates in a final volume of 250 µL per well. Then, 150 µL membrane, 50 µL cold compound in buffer (or buffer alone) and 50 µL radioligand in buffer were added to each well. The plate was incubated at 30 °C for 90 min with gentle agitation. The incubation was stopped by vacuum filtration onto presoaked (incubation buffer) GF/C filters using a 96-well FilterMate™ harvester, followed by five washes with ice-cold wash buffer. Filters were then dried under a warm air stream and sealed in polyethylene, a scintillation cocktail was added, and the radioactivity was counted in a Wallac® TriLux 1450 MicroBeta counter. For each concentration of drug, nonspecific binding was subtracted from total binding to give specific binding. Data were fitted using the nonlinear curve fitting routines in Prism® (GraphPad Software Inc.) to determine Kd. and Bmax. Animal model The syngeneic orthotopic RG2 tumor model was established following published protocols using male F344 rats (200–220 g, 10–12 weeks old) purchased from Charles River Laboratory. In short, RG2 cells (ATCC, Manassas, VA) were grown under standard cell 47 53376748.1
Attorney Docket No.047162-7482WO1(02447) culture conditions in T-75 flasks. Cells (~ 10,000) were suspended in sterile phosphate- buffered saline and injected into the striatum in the right hemisphere of Fischer 344 rats using a Hamilton syringe and a stereotactic device (David Kopf Instruments, Tujunga, CA). RG2 tumor growth was monitored by contrast-enhanced MR (CEMR) imaging at 14–18 days post implantation of tumor cells. The tumor volumes are from 5.8 mm3 to 12.3 mm3 for the 14-day post implantation cohort, from 28.9 mm3 to 180.6 mm3 for the 18-day post implantation cohort. Multiple cohorts of in vivo, in vitro and ex vivo studies were performed using the same (when available) or different animals. MR imaging RG2-bearing rats were scanned on an 11.7 T Magnex magnet (Magnex Scientific Ltd.) interfaced to a Bruker Avance III HD spectrometer running on ParaVision 6 (Bruker Instruments). Rats were anesthetized with isoflurane using a 70/30% N2O/ O2 mixture as the carrier gas delivered via a nose cone. Animals were positioned prone in a heated holder to maintain body temperature at 37 °C. Before positioning in the scanner, animals were injected subcutaneously with a bolus of 200 µL T1 contrast agent gadopentetate dimeglumine (Magnevist®, Bayer). For MRI acquisition, a 20 mm 1H surface coil was used, positioned directly above the animal’s head. After scout images were acquired to confirm positioning, T1-weighted MR images were acquired using a multi-slice spin-echo pulse sequence with a repetition time of 1000 ms, echo time of 6.4 ms, isotropic resolution of 250 µm and 4 averages. After automatic contrast adjustment of the MR images, tumor segmentation was performed using an intensity threshold and manual segmentation tools to outline the contrast- enhancing region in each slice of the MR image stack, and the segmentation results were exported. PET imaging experiments in glioblastoma rats and healthy rats First, four RG2-bearing rats underwent a 0–90 min scan (baseline, n = 2; blocking, n = 2). Then, 5 other RG2-bearing rats underwent a 0–60 min scan (baseline, n = 3; blocking, n = 2) on FOCUS-220 scanners (Siemens Medical Solutions, Knoxville, TN, USA). [11C]PyBic (23 ± 6 MBq, 400 μL) was injected intravenously in the tail vein for both baseline and blocking scans. For blocking studies, the blocking agent veliparib (ABT-888, 5 mg/kg) was administered IV 10 min prior to the radiotracer injection. The blocking dose was prepared by dissolving 5 mg of veliparib in a solution of 1 mL of EtOH and saline in a 1:9 ratio. After the emission scan, a 9-min transmission scan was obtained for attenuation correction. 48 53376748.1
Attorney Docket No.047162-7482WO1(02447) Images were reconstructed with the 3D ordered subset expectation maximization method (OSEM3D; 2 iterations, 16 subsets) with a maximum a posteriori algorithm (MAP; 25 iterations) with corrections for decay, attenuation, scatter, normalization, and randoms. The 60- and 90-min dynamic scans were reconstructed to 20 and 26 frames, respectively: 6 × 30 s, 1 × 45 s, 2 × 60 s, 1 × 90 s, 1 × 120 s, 1 × 210 s, and 10 × 300 s for 60-min scans or 15 × 300 s for 90-min scans. An averaged PET image from 0 to 60 min for each measurement (mean of all frames) was co-registered to the T2 weighted image in the Waxholm Space rat brain atlas with 6- degree-of-freedom linear registration using an in-house manual registration tool. ROIs were extracted from the atlas, and regional time-activity curves (TACs) were obtained by applying template ROIs to the PET images. Analysis included the following ROIs: cerebellum, hippocampus, neocortex, thalamus, stratum, and brain stem (BS). Tumor and contralateral nontumor ROIs were manually drawn on the individual 0–60/90 min summed PET images by referring to each individual contrast-enhanced MRI. For P-gp inhibitor studies, PET scans were performed with (n = 1) or without (n = 2) the pre-injected P-gp inhibitor verapamil (1 mg/kg, i.v., 10 min before radiotracer injection) using [11C]PyBic in healthy rats. Quantitative analysis for rodent PET IDL programs developed in house in Yale University PET Center was used for rodent and following monkey PET imaging analysis. The simplified reference tissue model 2 (SRTM2) was used to estimate the distribution volume ratio (DVR) using the contralateral as a reference region. The first 60 min dynamic scan data were used in the kinetic modeling analysis, generating similar DVR to using the 90 min dynamic scan data (Fig.9). PET imaging in rhesus monkeys Two rhesus monkeys (Macaca mulatta) were used in the study. For Monkey 1, a 120- min long dynamic PET scan (one baseline and one blocking scan with veliparib) was carried out. For Monkey 2, a total of 2 baseline scans (test, retest), 2 blocking scans with veliparib (2.5 mg/ kg) and BGB290 (0.5 mg/kg), and one P-gp inhibitor tariquidar (1.4 mg/kg) were carried out on a FOCUS220 scanner. PET imaging reconstruction was performed using similar procedures as described previously. To define the regions of interest (ROIs), MR images were acquired using a Siemens 3 T Trio scanner and co-registered to an inhouse-generated monkey brain atlas and 49 53376748.1
Attorney Docket No.047162-7482WO1(02447) the PET images. The PET emission data were reconstructed using a Fourier re-binning and filtered back projection algorithm with a Shepp-Logan filter. SUV TACs were generated for the brain stem, cerebellum, frontal cortex, occipital cortex and globus pallidus. Ex vivo biodistribution experiments Seven RG2-bearing rats were used in the ex vivo biodistribution analysis. Briefly, [11C]PyBic (15.8 ± 5.0 MBq) were injected as a bolus in the presence (blocking, n = 3) or absence of veliparib (baseline, n = 4, 5 mg/kg, i.v.). Animals were euthanized at 60 min post injection of the radiotracer. Blood and preselected organs, such as the olfactory, cerebellum, brain stem, tumor, muscle, spleen, kidney, liver, lung, and hippocampus, were collected, weighed, and counted in an automatic Wizard γ counter (PerkinElmer). Radioactivity concentrations were normalized against weight, decay-corrected, and expressed as percentage of injected dose per gram tissue (%ID/g) or SUV. Western blotting Western blotting was performed on normal brain and tumor tissues from RG2 rats that were lysed in protein lysis buffer (1% SDS, 10% glycerol, in 25 mM Tris–HCl, pH 6.8) supplemented with proteinase inhibitors (cOmplete™, Cat# 11,836,170,001, Sigma) and phosphatase inhibitors (PhosSTOP™, Cat # 4,906,845,001, Sigma). Three micrograms of protein were separated using WES capillary electrophoresis (ProteinSimple) and incubated with rabbit polyclonal anti-PARP1 antibody (Proteintech, Cat# 13,371–1-AP) in antibody dilution buffer provided with the WES machine. Compass software provided by ProteinSimple was used to analyze the western blot results. The absolute chemiluminescent signal values of the area under the specific peak curve generated by Compass were used to quantify the protein expression level. Immunohistochemistry Sagittal-cut rat brains with RG2 tumors were paraffin-embedded and cut into 10- micron sections and deparaffinized and rehydrated for immunohistochemistry staining of PARP1 using the abovementioned antibody. Slides were blocked with 2% normal goat serum for 1 h, incubated with anti-PARP1 antibody (1:200) overnight at 4 °C, and incubated with biotin-conjugated secondary antibody for 1 h, followed by streptavidin–horseradish peroxidase and substrate application according to the manufacturer’s instructions (Vector Labs). Vectashield with DAPI was used for nuclear counterstaining, and sections were 50 53376748.1
Attorney Docket No.047162-7482WO1(02447) scanned using Aperio AT2 at 20 × with a minimum of 5 focus points verified prior to automated scanning in Yale Pathology Tissue Services. Images were obtained using Aperio ImageScope (v12.4.3.5008). Metabolite analysis Two different metabolite studies, first with tumor-bearing rats and later with a nonhuman primate, were performed. The activity of the blood sample was measured. The plasma fraction was collected by centrifugation of the blood. For rats, the plasma was mixed with a urea solution and further diluted with a 0.2 mL (80:20) mixture of ammonium formate aqueous solution (0.1 M) and MeCN and run under the same solution as the mobile phase at 1 mL/min in a Gemini HPLC column (NX, 5μm). For NHP plasma metabolite analysis, the NHP plasma was diluted with an HPLC mobile phase comprising an 85:15 ratio of ammonium formate aqueous solution (0.1 M) and MeCN and run in a Gemini NX column at a 1.2 mL/min flow rate. Kinetic modeling Volume of distribution (VT, mL·cm−3) values were derived through 1-tissue (1 T) compartment, 2TCM, and MA1 kinetic modeling as described before. Non-displaceable binding potential (BPND) values were calculated from VT values based on the formula BPND = (VT − VND)/VND. Target occupancy and VND were calculated using the Lassen plot. Statistical analysis Unpaired and two-sided Student t tests were performed using GraphPad Prism. All data are presented as the mean ± SD unless described otherwise. In vivo and in vitro experiments were repeated at least 2 times/experiment with the “n” number detailed in the corresponding figure legends. Statistical significance was defined as P < 0.05. Results Computational studies Computational studies were performed to analyze the physicochemical properties of PyBic in comparison with veliparib. From the docking study, it was determined that the secondary interactions of PyBic with PARP1 were consistent with those of veliparib. Then, the physicochemical and pharmacological parameters were calculated, i.e., LogP, MDCK permeability, PSA, LogS, and XP scores, to predict the brain permeability and binding 51 53376748.1
Attorney Docket No.047162-7482WO1(02447) affinity of PyBic (Table 1). The calculated XP score (-7.866) was slightly higher than that of veliparib (-7.976), which was consistent with their reported IC50 values (6 nM and 5.2 nM for PyBic and veliparib, respectively. With the extra methyl group, PyBic was predicted to possess higher lipophilicity (LogP), lower polar surface area (PSA), and improved membrane permeability (MDCK permeability) than veliparib. Furthermore, a hydrogen bond donor was removed by N-methylating pyrrolidine, presumably reducing its liability to P-gp efflux. The changes in physicochemical properties suggested improved BBB penetration for PyBic over veliparib. Therefore, radiolabeling was pursued and in vitro and in vivo evaluations of PyBic as the lead brain-penetrant PARP PET tracer. Chemistry and radiochemistry It was reasoned that [11C]PyBic can be obtained via a chemoselective N-methylation reaction using [11C]MeI and veliparib as the labeling precursor. Veliparib (4) and the PyBic standard (5) were synthesized following the reported procedure with slight modifications (Fig.7a). The reference standard (5) was synthesized from precursor 4 using either methyl iodide (MeI) under basic conditions in 56% yield or paraformaldehyde in 77% yield. [11C]PyBic was synthesized in 43 ± 10% decay-corrected radiochemical yields after formulation (962 to 1554 MBq, n = 8, Supplementary Table 1, Fig.7b). The identity of the purified radiotracer was inferred from the coelution of the radiotracer with PyBic standard compound 5 on radio-HPLC (Fig.7c). Formulated [11C] PyBic was obtained with greater than 97% radiochemical purity (RCP) and a molar activity of 148 ± 85 MBq/nmol (n = 6). The whole production process, starting from the trapping of [11C]MeI, including the synthesis, purification and formulation, lasted approximately 60 min. LogD measurement The LogD7.4 of [11C]PyBic was determined to be 1.76 ± 0.05 (n = 5), which is higher than the calculated LogP value (1.18) but still within the optimal range for BBB penetration. [11C]PyBic PET imaging in RG2‑bearing rat brains To explore the feasibility of using [11C]PyBic in rat brain PET imaging, tritium- labeled PyBic, [3H] PyBic (Fig.8A) was obtained for saturation binding assays using rat hippocampal homogenates. The KD and Bmax values in the rat hippocampus were 0.46 nM and 50 fmol/mg (protein), respectively. Assuming the protein content of rat brain tissue is 9.1% and the brain tissue density is 1 g/mL, the calculated Bmax was 4.6 nM and the Bmax to KD 52 53376748.1
Attorney Docket No.047162-7482WO1(02447) ratio was 10, suggesting the feasibility of imaging PARP1 in the rat brain using [11C]PyBic (Fig.8B). To evaluate [11C]PyBic in RG2 tumor-bearing rats (n = 16), imaged 12 RG2 tumor- bearing rats were imaged for tumor assessment using contrast-enhanced MR (CEMR). The RG2 tumor size ranged from 6.5 to 180.6 mm3 at 14–18 days post-implantation of tumor cells, and the average size was 54.6 ± 56.0 mm3 (mean ± SD). After confirming tumor formation in the rat brains, [11C]PyBic PET imaging in 9 rats was carried out for either a 0– 90 min or a 0–60 min scan. The administered dose of [11C]PyBic was equivalent to 0.4 ± 0.12 μg/kg of cold mass of PyBic. In baseline scans (n = 5), the standardized uptake value (SUV) images summed from 30 to 60 min post-injection (p.i.) showed high contrast between the tumor region and the contralateral nontumor brain region, as outlined in Fig.2A, which was markedly higher than that in the blocking scans (n = 4), in which veliparib (5 mg/kg, i.v.) was administered before tracer injections (Fig.2B). The tumor uptake plateaued within 30 min p.i., with a baseline tumor SUV of 1.0 ± 0.22 (mean ± SD) averaged from 30 to 60 min p.i. The contralateral nontumor brain region showed much lower tracer uptake, with an average SUV of 0.39 ± 0.04 (mean ± SD, Fig. 2C). All the selected normal brain regions showed significantly lower tracer uptake than the tumors (p < 0.05, Fig.2C). With the preinjected PARP1/2 inhibitor veliparib (5 mg/kg, i.v.), the tumor SUV exceeded 1 within 10 min p.i. and then decreased to 0.39 ± 0.10 (mean ± SD) after 40 min p.i. (Fig.2D). Veliparib provided 61% blockade of tracer binding based on the SUV (30–60 min) data (p = 0.0003, t test, Figs.2C-2D). Injection of the P-gp inhibitor verapamil (n = 1) did not change the brain SUVs compared to baseline injections in healthy rats (n = 2) (Figs.10A-10B), indicating that [11C]PyBic is unlikely a substrate of P-gp. This is consistent with the in vitro Caco-2 cell monolayer permeability test results, which showed an efflux ratio of 0.52 for PyBic. Table 1: Binding affinity and physicochemical properties of PyBic and veliparib. IC50 LogP MDCK PSA LogS XP PyBic 6 nM 1.18 91.6 77.3 -2.21 - 7.866 Veliparib PARP1: 5.2 nM 0.58 60.57 86.7 -1.693 - PARP2: 2.9 nM 7.976 Optimal range < 10 nM 1—3 25—500 < 90 -6.05—0.5 [11C]PyBic PET quantitative analysis in RG2 rats 53 53376748.1
Attorney Docket No.047162-7482WO1(02447) For the quantitative PET analysis, the regional distribution volume ratio (DVR) was calculated using the simplified reference tissue method 2 (SRTM2) with the contralateral nontumor region of interest (ROI) defined as shown in Fig.2A/B as the reference region. The contralateral nontumor ROI was chosen as the reference region because it was the brain region with the lowest tracer uptake and was the least influenced by preinjected veliparib as the blocking drug (Figs.10A-10B). Using the pilot 90-min scan data (n = 4), a strong linear correlation was observed between DVR (0–60 min) and DVR (0–90 min). Thus, DVR derived using 0–60 min data is sufficient for [11C]PyBic quantitative analyses, and DVRs from 0–60 min scan (n = 9) were used in the following analysis. In the baseline scans, the highest tracer uptake was in the tumor (DVR: 3.33 ± 0.40, n = 5). The average tumor DVR was decreased by 51% in blocking scans (1.62 ± 0.16, n = 4, p = 0.049, Fig.2E). There were smaller but statistically significant 28% and 30% differences in DVR between baseline and blocking scans in neocortex and cerebellum, respectively, strongly suggesting that there is PARP-specific uptake in these brain regions. Note that partial volume effects contribute to inter-regional variation in uptake due to differential spill-in from other brain regions and from the extra-cranial tissue. Further confirmation from ex vivo and in vitro AR study is needed to confirm this in vivo imaging finding. Considering the compromised BBB at the tumor site, these data are insufficient to prove the brain penetration of [11C]PyBic, as [11C]PyBic and veliparib might be able to diffuse into healthy brain regions through the leaky BBB around the RG2 tumor. The DVRs of the other brain regions did not show significant differences between baseline and blocking scans, indicating similar PARP1 expression levels in these brain regions and the contralateral cortex. [11C]PyBic metabolism study in rats The radiometabolites were examined in rat plasma and brain (n = 4) at 60 min p.i. of [11C]PyBic. The parent fraction of [11C]PyBic at 60 min p.i. was 31% and 90% in the plasma and brain, respectively. Two major radiometabolite peaks with HPLC retention times of approximately 3.5 min and 6.5 min were detected, while the retention time of the parent tracer was approximately 5 min (Fig.2F). Ex vivo biodistribution study To validate the PET imaging results and determine the extent of nonspecific binding, biodistribution studies of [11C]PyBic in RG2 rats were performed at 60 min p.i. with (blocking, n = 3) or without preinjected veliparib (baseline, n = 4). A complete PARP1/2 54 53376748.1
Attorney Docket No.047162-7482WO1(02447) blockade at the i.v. dose of 5 mg/kg was expected, as the estimated Cmax, plasma (1.64 µM) is 328-fold of the IC50 of veliparib and the estimated Cmax, brain (0.42 µM) is 84-fold of the IC50 of veliparib. The biodistribution data showed that [11C]PyBic had the highest uptake in the tumor (0.85 ± 0.3%ID/g, n = 4) and spleen (2.85 ± 0.3%ID/g, n = 4). The uptake of [11C]PyBic was reduced by 75% (n = 4, p = 0.021) and 74% (n = 4, p = 0.0004) in the tumor and spleen, respectively, by veliparib pre-administration (Fig.3A). The mean tumor uptake as represented by SUV (1.97 ± 0.68, n = 4) derived from the biodistribution data was nearly twice the mean tumor PET SUV (Fig.12). The difference between PET and biodistribution data is likely due to partial volume effects associated with small animal PET imaging. Interestingly, the tissue-to-plasma ratios for [11C] PyBic at 60 min p.i. under the blocking condition are comparable to those of [3H]veliparib under similar blocking conditions (veliparib, 5 mg/kg, i.v.) for the spleen, kidney, liver, and lung, indicating similar levels of nonspecific binding for these two tracers in these selected tissues. However, [11C]PyBic exhibits a lower nonspecific signal in muscle and relatively higher nonspecific signals in the brain than [3H] veliparib (Table 3). The mean tissue-to-plasma ratios for [11C]PyBic in selected rat tissues were as follows: brain (0.9), kidney (5.3), liver (4.7), lungs (2.4), spleen (4.0), muscle (2.2) at 60 min p.i. under blocking conditions with preinjected veliparib (5 mg/kg, i.v.). Using data from the biodistribution study, the tracer uptake in tumors normalized by different brain regions, muscle, and blood were compared and found that tumor-to-blood ratios showed the greatest difference between baseline and blocking groups (8.39 ± 2.10, n = 4; 1.05 ± 0.29, n = 3, for baseline and blocking groups, respectively, p = 0.032, Fig.3B), indicating ubiquitous baseline PARP expression in rodent brain and muscle. Compared with using other brain regions as the reference region, the tumor-to-contralateral cortex (tumor/cortex) ratios of the baseline and blocking groups had the greatest statistical significance (6.2 ± 2.1; 1.5 ± 0.6, for baseline and blocking studies, respectively, p = 0.017, Fig.3B), supporting the use of the contralateral nontumor cortex region as the reference region in the PET data analysis. The difference in tissue-to-blood ratios between baseline and blocking studies against the tissue-to-blood ratios at baseline for the spleen, tumor, olfactory bulb, cerebellum, and neocortex, was plotted which showed excellent linearity and fit (Y = 0.89 * X—0.51, R2 = 0.9996, Fig.3C), indicating high PARP-specific tracer uptake in these tissues. The baseline PET DVR values of the tumor, contralateral nontumor cortex, hippocampus, brain stem and cerebellum correlated well with the biodistribution data (Y = 2.547*X-1.911, R2 = 0.9, Fig.3D), which supported the use of SRTM2 for the quantitative 55 53376748.1
Attorney Docket No.047162-7482WO1(02447) analysis of PET imaging data in RG2 rats. PET DVR values were lower than the biodistribution data, indicating underestimation of the ratios in the PET results, likely due to partial volume effects in the tumor. Table 2: Volume of distribution (VT) values (mL/cm3) of [11C] primates of PyBic in two non- human primates (NHPs) under baseline conditions or with preinjected Veliparib, BGB290, or tariquidar. Brain region Baseline Blocking Baseline Blocking P-gp inhibition Veliparib Test Retest Veliparib BGB290 Tariquidar brainstem 11.0 2.1 8.4 9.1 1.6 1.5 8.0 caudate 10.8 2.4 14.7 9.4 2.2 2.4 8.4 cerebellum 17.6 2.3 14.9 14.0 2.0 1.8 12.4 cingulate 11.9 2.6 14.6 14.0 2.9 3.2 12.4 frontal cortex 12.9 2.4 19.7 18.2 2.8 3.0 14.6 insula 12.3 2.6 11.2 12.7 2.4 2.9 10.9 occipital cortex 15.5 2.2 16.3 15.8 2.0 2.2 13.5 pons 11.6 2.2 8.0 9.9 1.6 1.6 8.9 putamen 13.8 2.5 9.5 11.9 2.1 2.4 10.4 temporal cortex 12.9 2.3 14.7 13.8 2.3 2.6 12.0 thalamus 11.2 2.4 6.9 7.7 1.8 2.2 7.8 Table 3. Comparison of tissue-to-blood ratios of [11C]PyBic and [3H]Veliparib treated rats at 60 min p.i. PARP1 expression correlates with in vivo [11C]PyBic uptake Immunohistochemical (IHC) staining of PARP1 in RG2-bearing rat brains indicated that PARP1 expression in tumor tissues was noticeably higher than that in normal brain tissue (Fig.4A). The expression of PARP1 was heterogeneous across the tumor tissues, with the tumor border exhibiting the highest PARP1 expression (Fig.4B). Using capillary 56 53376748.1
Attorney Docket No.047162-7482WO1(02447) electrophoresis western blotting (WES), the expression of PARP1 in the cortex, olfactory bulb, brain stem, cerebellum, hippocampus, and tumor was compared. Consistent with the in vivo PET imaging, ex vivo biodistribution, and in vitro IHC results, tumor tissues expressed significantly higher levels of PARP1 compared to the cortex (p = 0.0036), brain stem (p = 0.0041), and hippocampus (p = 0.0013) (Figs.4C-4D, Figs.13a-13c), with the lowest levels found in the brain stem and hippocampus. Linear correlational analyses between WES, biodistribution and PET imaging was carried out and a positive linear correlation between WES and biodistribution data (Y = 406,275*X + 118,898, R2 = 0.88, Fig.4e) was found, as well as between WES and PET data (Y = 143,581*X—13,574, R2 = 0.84, Fig.4F). In vivo NHP PET imaging study with [11C]PyBic To facilitate clinical translation and confirm the brain penetration of [11C]PyBic in larger animals with intact BBB, PET imaging studies were performed in healthy NHPs, with the collection of arterial blood for metabolism analysis and generation of arterial input function (AIF). [11C]PyBic (194 MBq, mean, n = 2) was injected into one healthy rhesus monkey (Monkey 1) with or without veliparib (2.5 mg/ kg, i.v. and scanned for 2 h. A second monkey (Monkey 2) was injected with [11C]PyBic (256 MBq ± 83 MBq, n = 5) and scanned twice under baseline conditions for a test–retest comparison, once with preinjected veliparib (2.5 mg/kg, i.v.), once with preinjected BGB290 (PARPi, 0.5 mg/kg, i.v.), and once with the infusion of the P-gp inhibitor tariquidar (1 mg/kg, i.v. over 30 min) to study the effect of P-gp inhibition on the brain uptake of [11C] PyBic. Summed baseline SUV images from the early time (10–20 min p.i.) and late time windows (60–90 min p.i.) showed fast tracer entrance into the brain and sustained retention in all brain regions (Fig.5A), consistent with the ubiquitous expression pattern of PARP1 in the monkey brain. The test and retest studies in the same animal showed nearly perfect overlap of the AIF (Fig.14A). In the blocking scan, the early SUV (10–20 min) was higher than the baseline SUV, which was due to the increased tracer plasma concentration caused by the blockade of peripheral PARP1/2 binding by veliparib (Fig.14B). Similarly, BGB290, a structurally different PARP1/2 inhibitor, also increased plasma and brain SUVs in the earlier period compared to baseline (Fig.14C). Injection of the P-gp inhibitor tariquidar did not change the AIF compared to the baseline study (Fig.14D). The late-time SUV (60–90 min) images of the blocking scans showed consistently low and nearly homogeneous tracer distribution in all brain regions, indicating effective blockade by veliparib and BGB290 at the injected doses. From the baseline time-activity curves (TACs), the cerebellum had the highest 57 53376748.1
Attorney Docket No.047162-7482WO1(02447) uptake, followed by the occipital cortex, frontal cortex and globus pallidus, showing the lowest tracer uptake, while in the blocking scans, the tracer washed out of the brain quickly, with reduced contrast among brain regions at later imaging windows due to the effective blockade of PARP binding sites in all brain regions (Figs.5B-5C). [11C]PyBic metabolism study in NHP Similar to the rat metabolism study, the same two major radiometabolite peaks from the radio-HPLC chromatograms were observed, indicating cross-species conservation in the metabolism profiles of [11C]PyBic. The metabolism rate of this tracer was moderate in NHPs, with plasma parent fractions of 73% and 52% at 15 min and 90 min p.i., respectively (Fig. 5D). The radiometabolites were not expected to be brain penetrant, at least not to an extent enough to interfere with the quantification of PARP1 in the brain, based on the rat brain homogenate radio-HPLC data (Fig.2F). Brain PET kinetic modeling in NHPs To estimate the regional distribution volume (VT) and the ratio of tracer concentration in the brain to that in plasma at equilibrium, the use of the 1-tissue compartment model (1TCM), 2-tissue compartment model (2TCM) and the multilinear analysis (MA1) method were compared. Both the 1TCM and MA1 methods produced good fits with the TACs, with 1TCM producing more reliable brain regional VT values, which are consistent with the MA1 VT values (Fig.15), while the 2TCM produced VT with large standard errors in several brain regions. VT from 1TCM was used in the following analysis. Based on the Lassen plot analysis, both the structurally analogous veliparib and the structurally dissimilar PARPi BGB290 blocked more than 90% of the binding of [11C]PyBic in the monkey brains (Fig.6), indicating the high in vivo binding specificity of [11C]PyBic. The mean non-displaceable volume of distribution (VND) of [11C]PyBic was 1.81 mL/cm3. The VT values from 1TCM in the monkey baseline scan ranged from 7.3 mL/cm3 for the amygdala to 15.5 mL/cm3 for the occipital cortex (Table 2), while the VT values for the monkey blocking scan ranged from 2.1 mL/cm3 to 2.7 mL/cm3. Both K1 and VT calculated using 1 T models were similar between the test and retest baseline as well as with the P-gp inhibition scan using tariquidar as the P- gp inhibitor. Using the average VND from three blocking scans, the non-displaceable binding potential (BPND) for the brain regions of the two monkeys was obtained. The brainstem was found to have the lowest BPND, while the frontal cortex and occipital cortex had relatively 58 53376748.1
Attorney Docket No.047162-7482WO1(02447) higher BPND. Selected Discussion PET imaging results showed higher tracer uptake in the orthotopic RG2 glioblastoma relative to the rest of the rat brain. The quantification of PARP1 using molecular biological methods and biodistribution analysis confirmed the PET imaging results. The uptake of [11C] PyBic is significantly reduced by the PARP1/2 inhibitor veliparib in both PET imaging and biodistribution analysis, indicating the in vivo binding specificity of the radiotracer. The high brain-to-plasma ratio in healthy NHPs demonstrated the high brain permeability and specific binding of [11C]PyBic in NHPs, supporting its use as a brain PARP PET imaging probe. Several PARPi-derived PET radiotracers have been developed for PARP imaging. PET tracer [11C]PJ34 was intended for imaging PARP in a streptozotocin-induced type I diabetes-related necrosis model, where a higher uptake of [11C]PJ34 in both the pancreas and liver was observed. Two 18F-labeled analogs of 59laparib, [18F] FBO and [18F]PARP-Fl, have been used to image rodent models of ovarian cancer, pancreatic cancer, and glioma. PET studies on the rucaparib/AG14699-derivative [18F] FluorThanatrace ([18F]FTT) demonstrated high tracer uptake in a xenograft model of human breast cancer. The first clinical PARP PET imaging study using [18F]FTT in ovarian cancer patients (NCT02469129) indicated a positive correlation between tumor SUVs and PARP1 expression levels. In addition, a study using [18F]FTT showed the highest tracer uptake in the spleen, pancreas, and liver in healthy human volunteers and the tumor regions of pancreatic ductal adenocarcinoma, biphenotypic hepatocellular carcinoma and cholangiocarcinoma among the 8 different malignant tumors examined. Recently, the drug engagement of different PARPis in small-cell lung cancer patient-derived xenografts (PDX) was explored using [18F]PARPi and the fluorescent probe PARPi-FL, which have important implications in PARPi drug development, treatment planning and monitoring in the clinic. [18F]PARPi has been evaluated in GBM patients recently, but its brain imaging characteristics have not yet been studied in healthy animals or humans. A PET imaging probe ([18F] SuPAR), a radiofluorinated NAD + analog that can be recognized by PARP and incorporated into the long-branched PAR for measuring PARP activity, was reported. With [18F]SuPAR, it was possible to map the dose- and time- dependent activation of PARP following radio/chemotherapy in breast and cervical cancer xenograft models. Preliminary biodistribution studies of [18F]talazoparib in the murine PC-3 tumor model showed that [18F]talazoparib had a good level of tumor uptake that persisted for over 8 h. 59 53376748.1
Attorney Docket No.047162-7482WO1(02447) Both olaparib and rucaparib have relatively high PARP trapping capability, which makes them good candidates as cancer therapeutics. However, neither of them nor their analogs have been shown to achieve desirable brain penetration as PET imaging agents due to their liability to active drug efflux. Compared to olaparib and rucaparib, veliparib (ABT-888) has a relatively lower PARP trapping capability and is reported to be a weak P-gp substrate, which makes it appealing as a lead compound for developing brain PET imaging agents with fast and reversible brain kinetics. Encouraged by the in silico prediction results, an N- methylated derivative of veliparib, PyBic, was synthesized on the premise that the removal of the N–H hydrogen-bond donor would further decrease its susceptibility to active efflux at the BBB and that the slightly increased hydrophobicity would improve its cell membrane permeability and BBB penetration. The imaging characteristics of [11C]PyBic were tested in a syngeneic rat model of glioblastoma. PARP1 is constitutively expressed in most tissue types, and it has been found to be upregulated in many different malignant cells, including brain tumors. To test the in vivo binding specificity of this tracer and explore its brain penetration at the same time, the syngeneic RG2 rat model was chosen, where RG2 glioblastoma cells were orthotopically injected into the right striatum of Fischer 344 (F344) rats, as the chemotherapeutic refractory RG2 rat brain tumor model has been used in the evaluation of PARPi’s therapeutic effects. Due to the difficulties in obtaining arterial blood for arterial input function generation in rats, the simplified reference tissue method 2 (SRTM2) was used for quantitative imaging analysis. Except for tumors, all brain regions showed similarly low tracer uptake, reflecting a relatively low level of PARP1 expression in normal rat brain tissue. There was no significant difference in the contralateral nontumor cortex SUV between baseline and blocking scans, while in both the cerebellum and neocortex, the blocking effect was more prominent. The contralateral nontumoral cortex was chosen as the reference region to estimate the regional DVR. In addition to RG2 tumors, only the cerebellum and neocortex showed significant blocking effects based on the DVR results (Fig.2e, p = 0.0003, 0.0179, for cerebellum and neocortex, respectively). Importantly, the biodistribution results correlated well with the PET DVR, corroborating the SRTM2 analysis results. The western blotting and immunohistochemical staining results indicate that PARP1 expression at the tumor site is higher than that in normal brain tissue, which is consistent with the biodistribution and PET imaging results. The tissue-to-blood ratios were calculated using the biodistribution data at 60 min p.i. and plotted the difference in the baseline and blocking tissue-to-blood activity ratios against 60 53376748.1
Attorney Docket No.047162-7482WO1(02447) the baseline tissue-to-blood ratios to estimate the PARP occupancy by the pre-administered veliparib. A nearly perfect linear correlation with an R square of 0.9996 and a slope of 0.89 was obtained, indicating that approximately 89% PAPR is occupied by the pre-administered veliparib at 5 mg/kg (Fig.3c). This finding indicates highly PARPspecific uptake of [11C]PyBic in RG2 tumors, rat brains and spleens. The gadolinium contrast-enhanced MR (CEMR) imaging indicated that the BBB surrounding the RG2 tumors was compromised (Figs.2A-2F). Thus, the PARP-specific uptake of [11C]PyBic in the RG2 rat brains does not exclude the possibility that the tracer is entering the brain through the damaged BBB and/or the BTB around the tumors. Caution should be taken when interpretating the kinetics modeling results. To confirm and quantify the extent of brain penetration of [11C]PyBic, two healthy NHPs were imaged after intravenous bolus injections of [11C]PyBic. A quick uptake of [11C]PyBic was observed in the NHP brain, plateauing within 30 min p.i., with baseline SUVs ranging from 0.66 (in the globus pallidus) to 0.97 (in the cerebellum) (Figs.5A-5B). Furthermore, blocking scans were performed with preinjected veliparib or BGB290, both of which decreased tracer uptake to nonspecific levels in the whole brain, indicating that [11C]PyBic uptake in monkey brains is indeed PARP-specific. It was noticed that the brain kinetics of [11C] PyBic is slower in NHP than in rats. Yet, the NHP brain TACs fit well with 1TC model, suggesting reversible in vivo binding of [11C]PyBic in the NHP brain. The faster clearance in the rodent brain is most likely due to faster plasma clearance, as suggested by the lower parent fraction data in the rodent. This is a common difference between rodent and NHP data, i.e., that metabolism is faster in the rodent, so plasma clearance and brain clearance is more pronounced. Arterial blood samples were collected and analyzed the metabolism profiles of [11C]PyBic in rats and NHPs and found two major metabolite peaks of [11C]PyBic in both species (Figs.2F, 5D). Based on the metabolism profile of veliparib, it was hypothesized that the oxidization product (compound 6) of methylpyrrolidine is the major radiometabolite. Based on the effective blocking by veliparib in the rodent and NHP PET imaging and the fact that a minimum amount of radiometabolites were detected in the rat brain homogenates (Fig. 2F), the radiometabolites are not expected to interfere with the interpretation of the brain PET imaging results. Compared to other PARP1/2 inhibitors, such as olaparib, talazoparib, and rucaparib, veliparib has a lower PARP trapping capability, implicating a faster Koff rate than other PARP1/2 inhibitors, a desirable feature for quantitative brain PET imaging. Although [18F]PARPi has been used in GBM patients to delineate tumors, a highly brain-penetrant PET 61 53376748.1
Attorney Docket No.047162-7482WO1(02447) tracer such as [11C]PyBic is desirable for reliable PARP quantification and is potentially applicable in lower grade gliomas and brain metastases with intact or heterogeneous BBB integrity. Because the other PARP PET tracers under development suffer from being P-gp substrates, the effect of P-gp inhibition on the brain uptake and kinetics of [11C] PyBic in rats and NHPs was examined. The veliparib can block the brain uptake of PyBic effectively at the doses of 5 mg/kg in rats and 2.5 mg/kg in monkeys, because sufficient amount of veliparib can reach its target in the brain, even though it is a weak substrate of p-gp. This is consistent with previous results using veliparib at 3.1 mg/kg/d to 25 mg/kg/d, which increased the efficacy of temozolomide in rat glioma model. The efflux ratio of veliparib in MDR1-MDCK cells was 1.8, indicating veliparib as a weak P-gp substrate. The efflux ratio of PyBic was measured to be 0.52, indicating PyBic is not a P-gp substrate. Generally, compounds with efflux ratio greater than 2 are considered to be positive P-gp substrates. The preliminary PET imaging experiment using the P-gp inhibitor verapamil (1 mg/kg, i.v., 10 min before radiotracer injection) did not show obviously altered [11C]PyBic uptake in healthy rat brains (Figs.11A-11B), indicating that [11C]PyBic is unlikely a P-gp substrate. Consistently, the preliminary P-gp inhibition study in NHP showed no influence of the P-gp inhibitor tariquidar on the VT and K1 of [11C]PyBic in NHP brain. Enumerated Embodiments The following exemplary embodiments are provided, the numbering of which is not to be construed as designating levels of importance: Embodiment 1: A compound of Formula (I), or a salt, solvate, tautomer, or stereoisomer thereof: wherein: R1 is H or C1-C6 alkyl comprising at least one 11C; R2 is H
Sep-Pak cartridges for solid-phase extraction (SPE) were obtained from Waters Associates (Milford, MA, USA). The purification of the crude product was performed using an HPLC system comprising a Shimadzu LC-20A pump, a Knauer K200 UV detector, and a Bioscan γ-flow detector. For analytic HPLC, a different HPLC system was utilized, consisting of a Shimadzu LC-20A pump, a Shimadzu SPD-M20A PDA or SPD-20A UV detector, and a Bioscan γ-flow detector. The production of [11C]CO2 involved the 14N(p,α)11C nuclear reaction, achieved by directing a 16.8-MeV proton beam from the PET Trace cyclotron (GE Healthcare) at a high- pressure target containing a nitrogen and oxygen mixture (0.5%–1%). Subsequently, [11C]MeI was synthesized using the gas-phase method through the FXMeI module (GE Healthcare). This process began with the conversion of [11C]CO2 to [11C]-methane, which was then reacted with iodine at 720 °C to yield [11C]MeI. After trapping [11C]MeI into a reaction vial containing Cs2CO3 (2.5 equiv.) and PyBic or PyBic-s precursor(1.5 mg) in DMF (0.3 mL), the reaction mixture was heated at 100 °C for 10 min. Subsequently, the mixture was quenched with 1.5 mL of 20 mM NH4CO3 buffer (pH = 8.8, with sodium ascorbate 300 mg/L) and MeCN in 80:20 (v/v) ratio as HPLC eluent. The mixture was eluted with the HPLC mobile phase, at a flow rate of 5 mL/min. The product portion was collected using a semiPrep-HPLC. The product which was collected into a 50 mL of water was then trapped on a C18 light SepPak cartridge (Waters). The cartridge was washed with 10 mL of water. The cartridge was eluted with 1 mL of ethanol and 3 mL of saline and the radioactive material was finally collected in a dose vial pre-charged with 7 ml of saline and 8.4 % USP sodium bicarbonate solution. Measurement of lipophilicity (log D7.4) 46 53376748.1
Attorney Docket No.047162-7482WO1(02447) The lipophilicity was determined by the modified method from previously published procedures. Log D7.4 was measured and calculated as the ratio of decay-corrected radioactivity concentrations in 1-octanol and phosphate-buffered saline (PBS, pH = 7.4, Dulbecco). Six consecutive equilibrations of [11C]PyBic in 1-octanol and phosphatebuffered saline (PBS, pH = 7.4, Dulbecco) were performed until a constant value of log D7.4 was obtained. Saturation binding assay using [3H]PyBic in rat hippocampus and NHP brain tissue The saturation binding assay was performed at Gifford Bioscience (UK). The hippocampus was dissected from the rat brain. The cerebellum, brain stem, frontal cortex, hippocampus, and occipital cortex were dissected from the monkey brain. The dissected brain tissues were homogenized in ice-cold buffer (50 mM Tris; 5 mM MgCl2; 5 mM EDTA; protease inhibitor cocktail). After a low-speed spin (100 × g) to remove tissue pieces, the supernatant was transferred to a fresh tube and centrifuged at 17,000 × g for 10 min at 4 °C to pellet the membranes. The pellet was resuspended in fresh buffer and centrifuged a second time. The pellet from the second spin was resuspended in buffer (50 mM Tris, 5 mM MgCl2, 0.1 mM EDTA) containing 10% sucrose as a cryoprotectant, divided into aliquots, frozen, and stored at -80 °C. A sample of the washed membrane preparation was analyzed for protein content using the Pierce® BCA assay. Radioligand binding assays were carried out in 96- well plates in a final volume of 250 µL per well. Then, 150 µL membrane, 50 µL cold compound in buffer (or buffer alone) and 50 µL radioligand in buffer were added to each well. The plate was incubated at 30 °C for 90 min with gentle agitation. The incubation was stopped by vacuum filtration onto presoaked (incubation buffer) GF/C filters using a 96-well FilterMate™ harvester, followed by five washes with ice-cold wash buffer. Filters were then dried under a warm air stream and sealed in polyethylene, a scintillation cocktail was added, and the radioactivity was counted in a Wallac® TriLux 1450 MicroBeta counter. For each concentration of drug, nonspecific binding was subtracted from total binding to give specific binding. Data were fitted using the nonlinear curve fitting routines in Prism® (GraphPad Software Inc.) to determine Kd. and Bmax. Animal model The syngeneic orthotopic RG2 tumor model was established following published protocols using male F344 rats (200–220 g, 10–12 weeks old) purchased from Charles River Laboratory. In short, RG2 cells (ATCC, Manassas, VA) were grown under standard cell 47 53376748.1
Attorney Docket No.047162-7482WO1(02447) culture conditions in T-75 flasks. Cells (~ 10,000) were suspended in sterile phosphate- buffered saline and injected into the striatum in the right hemisphere of Fischer 344 rats using a Hamilton syringe and a stereotactic device (David Kopf Instruments, Tujunga, CA). RG2 tumor growth was monitored by contrast-enhanced MR (CEMR) imaging at 14–18 days post implantation of tumor cells. The tumor volumes are from 5.8 mm3 to 12.3 mm3 for the 14-day post implantation cohort, from 28.9 mm3 to 180.6 mm3 for the 18-day post implantation cohort. Multiple cohorts of in vivo, in vitro and ex vivo studies were performed using the same (when available) or different animals. MR imaging RG2-bearing rats were scanned on an 11.7 T Magnex magnet (Magnex Scientific Ltd.) interfaced to a Bruker Avance III HD spectrometer running on ParaVision 6 (Bruker Instruments). Rats were anesthetized with isoflurane using a 70/30% N2O/ O2 mixture as the carrier gas delivered via a nose cone. Animals were positioned prone in a heated holder to maintain body temperature at 37 °C. Before positioning in the scanner, animals were injected subcutaneously with a bolus of 200 µL T1 contrast agent gadopentetate dimeglumine (Magnevist®, Bayer). For MRI acquisition, a 20 mm 1H surface coil was used, positioned directly above the animal’s head. After scout images were acquired to confirm positioning, T1-weighted MR images were acquired using a multi-slice spin-echo pulse sequence with a repetition time of 1000 ms, echo time of 6.4 ms, isotropic resolution of 250 µm and 4 averages. After automatic contrast adjustment of the MR images, tumor segmentation was performed using an intensity threshold and manual segmentation tools to outline the contrast- enhancing region in each slice of the MR image stack, and the segmentation results were exported. PET imaging experiments in glioblastoma rats and healthy rats First, four RG2-bearing rats underwent a 0–90 min scan (baseline, n = 2; blocking, n = 2). Then, 5 other RG2-bearing rats underwent a 0–60 min scan (baseline, n = 3; blocking, n = 2) on FOCUS-220 scanners (Siemens Medical Solutions, Knoxville, TN, USA). [11C]PyBic (23 ± 6 MBq, 400 μL) was injected intravenously in the tail vein for both baseline and blocking scans. For blocking studies, the blocking agent veliparib (ABT-888, 5 mg/kg) was administered IV 10 min prior to the radiotracer injection. The blocking dose was prepared by dissolving 5 mg of veliparib in a solution of 1 mL of EtOH and saline in a 1:9 ratio. After the emission scan, a 9-min transmission scan was obtained for attenuation correction. 48 53376748.1
Attorney Docket No.047162-7482WO1(02447) Images were reconstructed with the 3D ordered subset expectation maximization method (OSEM3D; 2 iterations, 16 subsets) with a maximum a posteriori algorithm (MAP; 25 iterations) with corrections for decay, attenuation, scatter, normalization, and randoms. The 60- and 90-min dynamic scans were reconstructed to 20 and 26 frames, respectively: 6 × 30 s, 1 × 45 s, 2 × 60 s, 1 × 90 s, 1 × 120 s, 1 × 210 s, and 10 × 300 s for 60-min scans or 15 × 300 s for 90-min scans. An averaged PET image from 0 to 60 min for each measurement (mean of all frames) was co-registered to the T2 weighted image in the Waxholm Space rat brain atlas with 6- degree-of-freedom linear registration using an in-house manual registration tool. ROIs were extracted from the atlas, and regional time-activity curves (TACs) were obtained by applying template ROIs to the PET images. Analysis included the following ROIs: cerebellum, hippocampus, neocortex, thalamus, stratum, and brain stem (BS). Tumor and contralateral nontumor ROIs were manually drawn on the individual 0–60/90 min summed PET images by referring to each individual contrast-enhanced MRI. For P-gp inhibitor studies, PET scans were performed with (n = 1) or without (n = 2) the pre-injected P-gp inhibitor verapamil (1 mg/kg, i.v., 10 min before radiotracer injection) using [11C]PyBic in healthy rats. Quantitative analysis for rodent PET IDL programs developed in house in Yale University PET Center was used for rodent and following monkey PET imaging analysis. The simplified reference tissue model 2 (SRTM2) was used to estimate the distribution volume ratio (DVR) using the contralateral as a reference region. The first 60 min dynamic scan data were used in the kinetic modeling analysis, generating similar DVR to using the 90 min dynamic scan data (Fig.9). PET imaging in rhesus monkeys Two rhesus monkeys (Macaca mulatta) were used in the study. For Monkey 1, a 120- min long dynamic PET scan (one baseline and one blocking scan with veliparib) was carried out. For Monkey 2, a total of 2 baseline scans (test, retest), 2 blocking scans with veliparib (2.5 mg/ kg) and BGB290 (0.5 mg/kg), and one P-gp inhibitor tariquidar (1.4 mg/kg) were carried out on a FOCUS220 scanner. PET imaging reconstruction was performed using similar procedures as described previously. To define the regions of interest (ROIs), MR images were acquired using a Siemens 3 T Trio scanner and co-registered to an inhouse-generated monkey brain atlas and 49 53376748.1
Attorney Docket No.047162-7482WO1(02447) the PET images. The PET emission data were reconstructed using a Fourier re-binning and filtered back projection algorithm with a Shepp-Logan filter. SUV TACs were generated for the brain stem, cerebellum, frontal cortex, occipital cortex and globus pallidus. Ex vivo biodistribution experiments Seven RG2-bearing rats were used in the ex vivo biodistribution analysis. Briefly, [11C]PyBic (15.8 ± 5.0 MBq) were injected as a bolus in the presence (blocking, n = 3) or absence of veliparib (baseline, n = 4, 5 mg/kg, i.v.). Animals were euthanized at 60 min post injection of the radiotracer. Blood and preselected organs, such as the olfactory, cerebellum, brain stem, tumor, muscle, spleen, kidney, liver, lung, and hippocampus, were collected, weighed, and counted in an automatic Wizard γ counter (PerkinElmer). Radioactivity concentrations were normalized against weight, decay-corrected, and expressed as percentage of injected dose per gram tissue (%ID/g) or SUV. Western blotting Western blotting was performed on normal brain and tumor tissues from RG2 rats that were lysed in protein lysis buffer (1% SDS, 10% glycerol, in 25 mM Tris–HCl, pH 6.8) supplemented with proteinase inhibitors (cOmplete™, Cat# 11,836,170,001, Sigma) and phosphatase inhibitors (PhosSTOP™, Cat # 4,906,845,001, Sigma). Three micrograms of protein were separated using WES capillary electrophoresis (ProteinSimple) and incubated with rabbit polyclonal anti-PARP1 antibody (Proteintech, Cat# 13,371–1-AP) in antibody dilution buffer provided with the WES machine. Compass software provided by ProteinSimple was used to analyze the western blot results. The absolute chemiluminescent signal values of the area under the specific peak curve generated by Compass were used to quantify the protein expression level. Immunohistochemistry Sagittal-cut rat brains with RG2 tumors were paraffin-embedded and cut into 10- micron sections and deparaffinized and rehydrated for immunohistochemistry staining of PARP1 using the abovementioned antibody. Slides were blocked with 2% normal goat serum for 1 h, incubated with anti-PARP1 antibody (1:200) overnight at 4 °C, and incubated with biotin-conjugated secondary antibody for 1 h, followed by streptavidin–horseradish peroxidase and substrate application according to the manufacturer’s instructions (Vector Labs). Vectashield with DAPI was used for nuclear counterstaining, and sections were 50 53376748.1
Attorney Docket No.047162-7482WO1(02447) scanned using Aperio AT2 at 20 × with a minimum of 5 focus points verified prior to automated scanning in Yale Pathology Tissue Services. Images were obtained using Aperio ImageScope (v12.4.3.5008). Metabolite analysis Two different metabolite studies, first with tumor-bearing rats and later with a nonhuman primate, were performed. The activity of the blood sample was measured. The plasma fraction was collected by centrifugation of the blood. For rats, the plasma was mixed with a urea solution and further diluted with a 0.2 mL (80:20) mixture of ammonium formate aqueous solution (0.1 M) and MeCN and run under the same solution as the mobile phase at 1 mL/min in a Gemini HPLC column (NX, 5μm). For NHP plasma metabolite analysis, the NHP plasma was diluted with an HPLC mobile phase comprising an 85:15 ratio of ammonium formate aqueous solution (0.1 M) and MeCN and run in a Gemini NX column at a 1.2 mL/min flow rate. Kinetic modeling Volume of distribution (VT, mL·cm−3) values were derived through 1-tissue (1 T) compartment, 2TCM, and MA1 kinetic modeling as described before. Non-displaceable binding potential (BPND) values were calculated from VT values based on the formula BPND = (VT − VND)/VND. Target occupancy and VND were calculated using the Lassen plot. Statistical analysis Unpaired and two-sided Student t tests were performed using GraphPad Prism. All data are presented as the mean ± SD unless described otherwise. In vivo and in vitro experiments were repeated at least 2 times/experiment with the “n” number detailed in the corresponding figure legends. Statistical significance was defined as P < 0.05. Results Computational studies Computational studies were performed to analyze the physicochemical properties of PyBic in comparison with veliparib. From the docking study, it was determined that the secondary interactions of PyBic with PARP1 were consistent with those of veliparib. Then, the physicochemical and pharmacological parameters were calculated, i.e., LogP, MDCK permeability, PSA, LogS, and XP scores, to predict the brain permeability and binding 51 53376748.1
Attorney Docket No.047162-7482WO1(02447) affinity of PyBic (Table 1). The calculated XP score (-7.866) was slightly higher than that of veliparib (-7.976), which was consistent with their reported IC50 values (6 nM and 5.2 nM for PyBic and veliparib, respectively. With the extra methyl group, PyBic was predicted to possess higher lipophilicity (LogP), lower polar surface area (PSA), and improved membrane permeability (MDCK permeability) than veliparib. Furthermore, a hydrogen bond donor was removed by N-methylating pyrrolidine, presumably reducing its liability to P-gp efflux. The changes in physicochemical properties suggested improved BBB penetration for PyBic over veliparib. Therefore, radiolabeling was pursued and in vitro and in vivo evaluations of PyBic as the lead brain-penetrant PARP PET tracer. Chemistry and radiochemistry It was reasoned that [11C]PyBic can be obtained via a chemoselective N-methylation reaction using [11C]MeI and veliparib as the labeling precursor. Veliparib (4) and the PyBic standard (5) were synthesized following the reported procedure with slight modifications (Fig.7a). The reference standard (5) was synthesized from precursor 4 using either methyl iodide (MeI) under basic conditions in 56% yield or paraformaldehyde in 77% yield. [11C]PyBic was synthesized in 43 ± 10% decay-corrected radiochemical yields after formulation (962 to 1554 MBq, n = 8, Supplementary Table 1, Fig.7b). The identity of the purified radiotracer was inferred from the coelution of the radiotracer with PyBic standard compound 5 on radio-HPLC (Fig.7c). Formulated [11C] PyBic was obtained with greater than 97% radiochemical purity (RCP) and a molar activity of 148 ± 85 MBq/nmol (n = 6). The whole production process, starting from the trapping of [11C]MeI, including the synthesis, purification and formulation, lasted approximately 60 min. LogD measurement The LogD7.4 of [11C]PyBic was determined to be 1.76 ± 0.05 (n = 5), which is higher than the calculated LogP value (1.18) but still within the optimal range for BBB penetration. [11C]PyBic PET imaging in RG2‑bearing rat brains To explore the feasibility of using [11C]PyBic in rat brain PET imaging, tritium- labeled PyBic, [3H] PyBic (Fig.8A) was obtained for saturation binding assays using rat hippocampal homogenates. The KD and Bmax values in the rat hippocampus were 0.46 nM and 50 fmol/mg (protein), respectively. Assuming the protein content of rat brain tissue is 9.1% and the brain tissue density is 1 g/mL, the calculated Bmax was 4.6 nM and the Bmax to KD 52 53376748.1
Attorney Docket No.047162-7482WO1(02447) ratio was 10, suggesting the feasibility of imaging PARP1 in the rat brain using [11C]PyBic (Fig.8B). To evaluate [11C]PyBic in RG2 tumor-bearing rats (n = 16), imaged 12 RG2 tumor- bearing rats were imaged for tumor assessment using contrast-enhanced MR (CEMR). The RG2 tumor size ranged from 6.5 to 180.6 mm3 at 14–18 days post-implantation of tumor cells, and the average size was 54.6 ± 56.0 mm3 (mean ± SD). After confirming tumor formation in the rat brains, [11C]PyBic PET imaging in 9 rats was carried out for either a 0– 90 min or a 0–60 min scan. The administered dose of [11C]PyBic was equivalent to 0.4 ± 0.12 μg/kg of cold mass of PyBic. In baseline scans (n = 5), the standardized uptake value (SUV) images summed from 30 to 60 min post-injection (p.i.) showed high contrast between the tumor region and the contralateral nontumor brain region, as outlined in Fig.2A, which was markedly higher than that in the blocking scans (n = 4), in which veliparib (5 mg/kg, i.v.) was administered before tracer injections (Fig.2B). The tumor uptake plateaued within 30 min p.i., with a baseline tumor SUV of 1.0 ± 0.22 (mean ± SD) averaged from 30 to 60 min p.i. The contralateral nontumor brain region showed much lower tracer uptake, with an average SUV of 0.39 ± 0.04 (mean ± SD, Fig. 2C). All the selected normal brain regions showed significantly lower tracer uptake than the tumors (p < 0.05, Fig.2C). With the preinjected PARP1/2 inhibitor veliparib (5 mg/kg, i.v.), the tumor SUV exceeded 1 within 10 min p.i. and then decreased to 0.39 ± 0.10 (mean ± SD) after 40 min p.i. (Fig.2D). Veliparib provided 61% blockade of tracer binding based on the SUV (30–60 min) data (p = 0.0003, t test, Figs.2C-2D). Injection of the P-gp inhibitor verapamil (n = 1) did not change the brain SUVs compared to baseline injections in healthy rats (n = 2) (Figs.10A-10B), indicating that [11C]PyBic is unlikely a substrate of P-gp. This is consistent with the in vitro Caco-2 cell monolayer permeability test results, which showed an efflux ratio of 0.52 for PyBic. Table 1: Binding affinity and physicochemical properties of PyBic and veliparib. IC50 LogP MDCK PSA LogS XP PyBic 6 nM 1.18 91.6 77.3 -2.21 - 7.866 Veliparib PARP1: 5.2 nM 0.58 60.57 86.7 -1.693 - PARP2: 2.9 nM 7.976 Optimal range < 10 nM 1—3 25—500 < 90 -6.05—0.5 [11C]PyBic PET quantitative analysis in RG2 rats 53 53376748.1
Attorney Docket No.047162-7482WO1(02447) For the quantitative PET analysis, the regional distribution volume ratio (DVR) was calculated using the simplified reference tissue method 2 (SRTM2) with the contralateral nontumor region of interest (ROI) defined as shown in Fig.2A/B as the reference region. The contralateral nontumor ROI was chosen as the reference region because it was the brain region with the lowest tracer uptake and was the least influenced by preinjected veliparib as the blocking drug (Figs.10A-10B). Using the pilot 90-min scan data (n = 4), a strong linear correlation was observed between DVR (0–60 min) and DVR (0–90 min). Thus, DVR derived using 0–60 min data is sufficient for [11C]PyBic quantitative analyses, and DVRs from 0–60 min scan (n = 9) were used in the following analysis. In the baseline scans, the highest tracer uptake was in the tumor (DVR: 3.33 ± 0.40, n = 5). The average tumor DVR was decreased by 51% in blocking scans (1.62 ± 0.16, n = 4, p = 0.049, Fig.2E). There were smaller but statistically significant 28% and 30% differences in DVR between baseline and blocking scans in neocortex and cerebellum, respectively, strongly suggesting that there is PARP-specific uptake in these brain regions. Note that partial volume effects contribute to inter-regional variation in uptake due to differential spill-in from other brain regions and from the extra-cranial tissue. Further confirmation from ex vivo and in vitro AR study is needed to confirm this in vivo imaging finding. Considering the compromised BBB at the tumor site, these data are insufficient to prove the brain penetration of [11C]PyBic, as [11C]PyBic and veliparib might be able to diffuse into healthy brain regions through the leaky BBB around the RG2 tumor. The DVRs of the other brain regions did not show significant differences between baseline and blocking scans, indicating similar PARP1 expression levels in these brain regions and the contralateral cortex. [11C]PyBic metabolism study in rats The radiometabolites were examined in rat plasma and brain (n = 4) at 60 min p.i. of [11C]PyBic. The parent fraction of [11C]PyBic at 60 min p.i. was 31% and 90% in the plasma and brain, respectively. Two major radiometabolite peaks with HPLC retention times of approximately 3.5 min and 6.5 min were detected, while the retention time of the parent tracer was approximately 5 min (Fig.2F). Ex vivo biodistribution study To validate the PET imaging results and determine the extent of nonspecific binding, biodistribution studies of [11C]PyBic in RG2 rats were performed at 60 min p.i. with (blocking, n = 3) or without preinjected veliparib (baseline, n = 4). A complete PARP1/2 54 53376748.1
Attorney Docket No.047162-7482WO1(02447) blockade at the i.v. dose of 5 mg/kg was expected, as the estimated Cmax, plasma (1.64 µM) is 328-fold of the IC50 of veliparib and the estimated Cmax, brain (0.42 µM) is 84-fold of the IC50 of veliparib. The biodistribution data showed that [11C]PyBic had the highest uptake in the tumor (0.85 ± 0.3%ID/g, n = 4) and spleen (2.85 ± 0.3%ID/g, n = 4). The uptake of [11C]PyBic was reduced by 75% (n = 4, p = 0.021) and 74% (n = 4, p = 0.0004) in the tumor and spleen, respectively, by veliparib pre-administration (Fig.3A). The mean tumor uptake as represented by SUV (1.97 ± 0.68, n = 4) derived from the biodistribution data was nearly twice the mean tumor PET SUV (Fig.12). The difference between PET and biodistribution data is likely due to partial volume effects associated with small animal PET imaging. Interestingly, the tissue-to-plasma ratios for [11C] PyBic at 60 min p.i. under the blocking condition are comparable to those of [3H]veliparib under similar blocking conditions (veliparib, 5 mg/kg, i.v.) for the spleen, kidney, liver, and lung, indicating similar levels of nonspecific binding for these two tracers in these selected tissues. However, [11C]PyBic exhibits a lower nonspecific signal in muscle and relatively higher nonspecific signals in the brain than [3H] veliparib (Table 3). The mean tissue-to-plasma ratios for [11C]PyBic in selected rat tissues were as follows: brain (0.9), kidney (5.3), liver (4.7), lungs (2.4), spleen (4.0), muscle (2.2) at 60 min p.i. under blocking conditions with preinjected veliparib (5 mg/kg, i.v.). Using data from the biodistribution study, the tracer uptake in tumors normalized by different brain regions, muscle, and blood were compared and found that tumor-to-blood ratios showed the greatest difference between baseline and blocking groups (8.39 ± 2.10, n = 4; 1.05 ± 0.29, n = 3, for baseline and blocking groups, respectively, p = 0.032, Fig.3B), indicating ubiquitous baseline PARP expression in rodent brain and muscle. Compared with using other brain regions as the reference region, the tumor-to-contralateral cortex (tumor/cortex) ratios of the baseline and blocking groups had the greatest statistical significance (6.2 ± 2.1; 1.5 ± 0.6, for baseline and blocking studies, respectively, p = 0.017, Fig.3B), supporting the use of the contralateral nontumor cortex region as the reference region in the PET data analysis. The difference in tissue-to-blood ratios between baseline and blocking studies against the tissue-to-blood ratios at baseline for the spleen, tumor, olfactory bulb, cerebellum, and neocortex, was plotted which showed excellent linearity and fit (Y = 0.89 * X—0.51, R2 = 0.9996, Fig.3C), indicating high PARP-specific tracer uptake in these tissues. The baseline PET DVR values of the tumor, contralateral nontumor cortex, hippocampus, brain stem and cerebellum correlated well with the biodistribution data (Y = 2.547*X-1.911, R2 = 0.9, Fig.3D), which supported the use of SRTM2 for the quantitative 55 53376748.1
Attorney Docket No.047162-7482WO1(02447) analysis of PET imaging data in RG2 rats. PET DVR values were lower than the biodistribution data, indicating underestimation of the ratios in the PET results, likely due to partial volume effects in the tumor. Table 2: Volume of distribution (VT) values (mL/cm3) of [11C] primates of PyBic in two non- human primates (NHPs) under baseline conditions or with preinjected Veliparib, BGB290, or tariquidar. Brain region Baseline Blocking Baseline Blocking P-gp inhibition Veliparib Test Retest Veliparib BGB290 Tariquidar brainstem 11.0 2.1 8.4 9.1 1.6 1.5 8.0 caudate 10.8 2.4 14.7 9.4 2.2 2.4 8.4 cerebellum 17.6 2.3 14.9 14.0 2.0 1.8 12.4 cingulate 11.9 2.6 14.6 14.0 2.9 3.2 12.4 frontal cortex 12.9 2.4 19.7 18.2 2.8 3.0 14.6 insula 12.3 2.6 11.2 12.7 2.4 2.9 10.9 occipital cortex 15.5 2.2 16.3 15.8 2.0 2.2 13.5 pons 11.6 2.2 8.0 9.9 1.6 1.6 8.9 putamen 13.8 2.5 9.5 11.9 2.1 2.4 10.4 temporal cortex 12.9 2.3 14.7 13.8 2.3 2.6 12.0 thalamus 11.2 2.4 6.9 7.7 1.8 2.2 7.8 Table 3. Comparison of tissue-to-blood ratios of [11C]PyBic and [3H]Veliparib treated rats at 60 min p.i. PARP1 expression correlates with in vivo [11C]PyBic uptake Immunohistochemical (IHC) staining of PARP1 in RG2-bearing rat brains indicated that PARP1 expression in tumor tissues was noticeably higher than that in normal brain tissue (Fig.4A). The expression of PARP1 was heterogeneous across the tumor tissues, with the tumor border exhibiting the highest PARP1 expression (Fig.4B). Using capillary 56 53376748.1
Attorney Docket No.047162-7482WO1(02447) electrophoresis western blotting (WES), the expression of PARP1 in the cortex, olfactory bulb, brain stem, cerebellum, hippocampus, and tumor was compared. Consistent with the in vivo PET imaging, ex vivo biodistribution, and in vitro IHC results, tumor tissues expressed significantly higher levels of PARP1 compared to the cortex (p = 0.0036), brain stem (p = 0.0041), and hippocampus (p = 0.0013) (Figs.4C-4D, Figs.13a-13c), with the lowest levels found in the brain stem and hippocampus. Linear correlational analyses between WES, biodistribution and PET imaging was carried out and a positive linear correlation between WES and biodistribution data (Y = 406,275*X + 118,898, R2 = 0.88, Fig.4e) was found, as well as between WES and PET data (Y = 143,581*X—13,574, R2 = 0.84, Fig.4F). In vivo NHP PET imaging study with [11C]PyBic To facilitate clinical translation and confirm the brain penetration of [11C]PyBic in larger animals with intact BBB, PET imaging studies were performed in healthy NHPs, with the collection of arterial blood for metabolism analysis and generation of arterial input function (AIF). [11C]PyBic (194 MBq, mean, n = 2) was injected into one healthy rhesus monkey (Monkey 1) with or without veliparib (2.5 mg/ kg, i.v. and scanned for 2 h. A second monkey (Monkey 2) was injected with [11C]PyBic (256 MBq ± 83 MBq, n = 5) and scanned twice under baseline conditions for a test–retest comparison, once with preinjected veliparib (2.5 mg/kg, i.v.), once with preinjected BGB290 (PARPi, 0.5 mg/kg, i.v.), and once with the infusion of the P-gp inhibitor tariquidar (1 mg/kg, i.v. over 30 min) to study the effect of P-gp inhibition on the brain uptake of [11C] PyBic. Summed baseline SUV images from the early time (10–20 min p.i.) and late time windows (60–90 min p.i.) showed fast tracer entrance into the brain and sustained retention in all brain regions (Fig.5A), consistent with the ubiquitous expression pattern of PARP1 in the monkey brain. The test and retest studies in the same animal showed nearly perfect overlap of the AIF (Fig.14A). In the blocking scan, the early SUV (10–20 min) was higher than the baseline SUV, which was due to the increased tracer plasma concentration caused by the blockade of peripheral PARP1/2 binding by veliparib (Fig.14B). Similarly, BGB290, a structurally different PARP1/2 inhibitor, also increased plasma and brain SUVs in the earlier period compared to baseline (Fig.14C). Injection of the P-gp inhibitor tariquidar did not change the AIF compared to the baseline study (Fig.14D). The late-time SUV (60–90 min) images of the blocking scans showed consistently low and nearly homogeneous tracer distribution in all brain regions, indicating effective blockade by veliparib and BGB290 at the injected doses. From the baseline time-activity curves (TACs), the cerebellum had the highest 57 53376748.1
Attorney Docket No.047162-7482WO1(02447) uptake, followed by the occipital cortex, frontal cortex and globus pallidus, showing the lowest tracer uptake, while in the blocking scans, the tracer washed out of the brain quickly, with reduced contrast among brain regions at later imaging windows due to the effective blockade of PARP binding sites in all brain regions (Figs.5B-5C). [11C]PyBic metabolism study in NHP Similar to the rat metabolism study, the same two major radiometabolite peaks from the radio-HPLC chromatograms were observed, indicating cross-species conservation in the metabolism profiles of [11C]PyBic. The metabolism rate of this tracer was moderate in NHPs, with plasma parent fractions of 73% and 52% at 15 min and 90 min p.i., respectively (Fig. 5D). The radiometabolites were not expected to be brain penetrant, at least not to an extent enough to interfere with the quantification of PARP1 in the brain, based on the rat brain homogenate radio-HPLC data (Fig.2F). Brain PET kinetic modeling in NHPs To estimate the regional distribution volume (VT) and the ratio of tracer concentration in the brain to that in plasma at equilibrium, the use of the 1-tissue compartment model (1TCM), 2-tissue compartment model (2TCM) and the multilinear analysis (MA1) method were compared. Both the 1TCM and MA1 methods produced good fits with the TACs, with 1TCM producing more reliable brain regional VT values, which are consistent with the MA1 VT values (Fig.15), while the 2TCM produced VT with large standard errors in several brain regions. VT from 1TCM was used in the following analysis. Based on the Lassen plot analysis, both the structurally analogous veliparib and the structurally dissimilar PARPi BGB290 blocked more than 90% of the binding of [11C]PyBic in the monkey brains (Fig.6), indicating the high in vivo binding specificity of [11C]PyBic. The mean non-displaceable volume of distribution (VND) of [11C]PyBic was 1.81 mL/cm3. The VT values from 1TCM in the monkey baseline scan ranged from 7.3 mL/cm3 for the amygdala to 15.5 mL/cm3 for the occipital cortex (Table 2), while the VT values for the monkey blocking scan ranged from 2.1 mL/cm3 to 2.7 mL/cm3. Both K1 and VT calculated using 1 T models were similar between the test and retest baseline as well as with the P-gp inhibition scan using tariquidar as the P- gp inhibitor. Using the average VND from three blocking scans, the non-displaceable binding potential (BPND) for the brain regions of the two monkeys was obtained. The brainstem was found to have the lowest BPND, while the frontal cortex and occipital cortex had relatively 58 53376748.1
Attorney Docket No.047162-7482WO1(02447) higher BPND. Selected Discussion PET imaging results showed higher tracer uptake in the orthotopic RG2 glioblastoma relative to the rest of the rat brain. The quantification of PARP1 using molecular biological methods and biodistribution analysis confirmed the PET imaging results. The uptake of [11C] PyBic is significantly reduced by the PARP1/2 inhibitor veliparib in both PET imaging and biodistribution analysis, indicating the in vivo binding specificity of the radiotracer. The high brain-to-plasma ratio in healthy NHPs demonstrated the high brain permeability and specific binding of [11C]PyBic in NHPs, supporting its use as a brain PARP PET imaging probe. Several PARPi-derived PET radiotracers have been developed for PARP imaging. PET tracer [11C]PJ34 was intended for imaging PARP in a streptozotocin-induced type I diabetes-related necrosis model, where a higher uptake of [11C]PJ34 in both the pancreas and liver was observed. Two 18F-labeled analogs of 59laparib, [18F] FBO and [18F]PARP-Fl, have been used to image rodent models of ovarian cancer, pancreatic cancer, and glioma. PET studies on the rucaparib/AG14699-derivative [18F] FluorThanatrace ([18F]FTT) demonstrated high tracer uptake in a xenograft model of human breast cancer. The first clinical PARP PET imaging study using [18F]FTT in ovarian cancer patients (NCT02469129) indicated a positive correlation between tumor SUVs and PARP1 expression levels. In addition, a study using [18F]FTT showed the highest tracer uptake in the spleen, pancreas, and liver in healthy human volunteers and the tumor regions of pancreatic ductal adenocarcinoma, biphenotypic hepatocellular carcinoma and cholangiocarcinoma among the 8 different malignant tumors examined. Recently, the drug engagement of different PARPis in small-cell lung cancer patient-derived xenografts (PDX) was explored using [18F]PARPi and the fluorescent probe PARPi-FL, which have important implications in PARPi drug development, treatment planning and monitoring in the clinic. [18F]PARPi has been evaluated in GBM patients recently, but its brain imaging characteristics have not yet been studied in healthy animals or humans. A PET imaging probe ([18F] SuPAR), a radiofluorinated NAD + analog that can be recognized by PARP and incorporated into the long-branched PAR for measuring PARP activity, was reported. With [18F]SuPAR, it was possible to map the dose- and time- dependent activation of PARP following radio/chemotherapy in breast and cervical cancer xenograft models. Preliminary biodistribution studies of [18F]talazoparib in the murine PC-3 tumor model showed that [18F]talazoparib had a good level of tumor uptake that persisted for over 8 h. 59 53376748.1
Attorney Docket No.047162-7482WO1(02447) Both olaparib and rucaparib have relatively high PARP trapping capability, which makes them good candidates as cancer therapeutics. However, neither of them nor their analogs have been shown to achieve desirable brain penetration as PET imaging agents due to their liability to active drug efflux. Compared to olaparib and rucaparib, veliparib (ABT-888) has a relatively lower PARP trapping capability and is reported to be a weak P-gp substrate, which makes it appealing as a lead compound for developing brain PET imaging agents with fast and reversible brain kinetics. Encouraged by the in silico prediction results, an N- methylated derivative of veliparib, PyBic, was synthesized on the premise that the removal of the N–H hydrogen-bond donor would further decrease its susceptibility to active efflux at the BBB and that the slightly increased hydrophobicity would improve its cell membrane permeability and BBB penetration. The imaging characteristics of [11C]PyBic were tested in a syngeneic rat model of glioblastoma. PARP1 is constitutively expressed in most tissue types, and it has been found to be upregulated in many different malignant cells, including brain tumors. To test the in vivo binding specificity of this tracer and explore its brain penetration at the same time, the syngeneic RG2 rat model was chosen, where RG2 glioblastoma cells were orthotopically injected into the right striatum of Fischer 344 (F344) rats, as the chemotherapeutic refractory RG2 rat brain tumor model has been used in the evaluation of PARPi’s therapeutic effects. Due to the difficulties in obtaining arterial blood for arterial input function generation in rats, the simplified reference tissue method 2 (SRTM2) was used for quantitative imaging analysis. Except for tumors, all brain regions showed similarly low tracer uptake, reflecting a relatively low level of PARP1 expression in normal rat brain tissue. There was no significant difference in the contralateral nontumor cortex SUV between baseline and blocking scans, while in both the cerebellum and neocortex, the blocking effect was more prominent. The contralateral nontumoral cortex was chosen as the reference region to estimate the regional DVR. In addition to RG2 tumors, only the cerebellum and neocortex showed significant blocking effects based on the DVR results (Fig.2e, p = 0.0003, 0.0179, for cerebellum and neocortex, respectively). Importantly, the biodistribution results correlated well with the PET DVR, corroborating the SRTM2 analysis results. The western blotting and immunohistochemical staining results indicate that PARP1 expression at the tumor site is higher than that in normal brain tissue, which is consistent with the biodistribution and PET imaging results. The tissue-to-blood ratios were calculated using the biodistribution data at 60 min p.i. and plotted the difference in the baseline and blocking tissue-to-blood activity ratios against 60 53376748.1
Attorney Docket No.047162-7482WO1(02447) the baseline tissue-to-blood ratios to estimate the PARP occupancy by the pre-administered veliparib. A nearly perfect linear correlation with an R square of 0.9996 and a slope of 0.89 was obtained, indicating that approximately 89% PAPR is occupied by the pre-administered veliparib at 5 mg/kg (Fig.3c). This finding indicates highly PARPspecific uptake of [11C]PyBic in RG2 tumors, rat brains and spleens. The gadolinium contrast-enhanced MR (CEMR) imaging indicated that the BBB surrounding the RG2 tumors was compromised (Figs.2A-2F). Thus, the PARP-specific uptake of [11C]PyBic in the RG2 rat brains does not exclude the possibility that the tracer is entering the brain through the damaged BBB and/or the BTB around the tumors. Caution should be taken when interpretating the kinetics modeling results. To confirm and quantify the extent of brain penetration of [11C]PyBic, two healthy NHPs were imaged after intravenous bolus injections of [11C]PyBic. A quick uptake of [11C]PyBic was observed in the NHP brain, plateauing within 30 min p.i., with baseline SUVs ranging from 0.66 (in the globus pallidus) to 0.97 (in the cerebellum) (Figs.5A-5B). Furthermore, blocking scans were performed with preinjected veliparib or BGB290, both of which decreased tracer uptake to nonspecific levels in the whole brain, indicating that [11C]PyBic uptake in monkey brains is indeed PARP-specific. It was noticed that the brain kinetics of [11C] PyBic is slower in NHP than in rats. Yet, the NHP brain TACs fit well with 1TC model, suggesting reversible in vivo binding of [11C]PyBic in the NHP brain. The faster clearance in the rodent brain is most likely due to faster plasma clearance, as suggested by the lower parent fraction data in the rodent. This is a common difference between rodent and NHP data, i.e., that metabolism is faster in the rodent, so plasma clearance and brain clearance is more pronounced. Arterial blood samples were collected and analyzed the metabolism profiles of [11C]PyBic in rats and NHPs and found two major metabolite peaks of [11C]PyBic in both species (Figs.2F, 5D). Based on the metabolism profile of veliparib, it was hypothesized that the oxidization product (compound 6) of methylpyrrolidine is the major radiometabolite. Based on the effective blocking by veliparib in the rodent and NHP PET imaging and the fact that a minimum amount of radiometabolites were detected in the rat brain homogenates (Fig. 2F), the radiometabolites are not expected to interfere with the interpretation of the brain PET imaging results. Compared to other PARP1/2 inhibitors, such as olaparib, talazoparib, and rucaparib, veliparib has a lower PARP trapping capability, implicating a faster Koff rate than other PARP1/2 inhibitors, a desirable feature for quantitative brain PET imaging. Although [18F]PARPi has been used in GBM patients to delineate tumors, a highly brain-penetrant PET 61 53376748.1
Attorney Docket No.047162-7482WO1(02447) tracer such as [11C]PyBic is desirable for reliable PARP quantification and is potentially applicable in lower grade gliomas and brain metastases with intact or heterogeneous BBB integrity. Because the other PARP PET tracers under development suffer from being P-gp substrates, the effect of P-gp inhibition on the brain uptake and kinetics of [11C] PyBic in rats and NHPs was examined. The veliparib can block the brain uptake of PyBic effectively at the doses of 5 mg/kg in rats and 2.5 mg/kg in monkeys, because sufficient amount of veliparib can reach its target in the brain, even though it is a weak substrate of p-gp. This is consistent with previous results using veliparib at 3.1 mg/kg/d to 25 mg/kg/d, which increased the efficacy of temozolomide in rat glioma model. The efflux ratio of veliparib in MDR1-MDCK cells was 1.8, indicating veliparib as a weak P-gp substrate. The efflux ratio of PyBic was measured to be 0.52, indicating PyBic is not a P-gp substrate. Generally, compounds with efflux ratio greater than 2 are considered to be positive P-gp substrates. The preliminary PET imaging experiment using the P-gp inhibitor verapamil (1 mg/kg, i.v., 10 min before radiotracer injection) did not show obviously altered [11C]PyBic uptake in healthy rat brains (Figs.11A-11B), indicating that [11C]PyBic is unlikely a P-gp substrate. Consistently, the preliminary P-gp inhibition study in NHP showed no influence of the P-gp inhibitor tariquidar on the VT and K1 of [11C]PyBic in NHP brain. Enumerated Embodiments The following exemplary embodiments are provided, the numbering of which is not to be construed as designating levels of importance: Embodiment 1: A compound of Formula (I), or a salt, solvate, tautomer, or stereoisomer thereof: wherein: R1 is H or C1-C6 alkyl comprising at least one 11C; R2 is H
 wherein the compound comprises at least one of 11C and 18F. Embodiment 2: The compound of Embodiment 1, wherein R1 is C1-C6 alkyl comprising at least one 11C. Embodiment 3: The compound of any one of Embodiments 1-2, wherein R1 is 11CH3. Embodiment 4: The compound of any one of Embodiments 1-3, wherein R2 is 18F. 62 53376748.1
Attorney Docket No.047162-7482WO1(02447) Embodiment 5: The compound of any one of Embodiments 1-4, which is selected from the group consisting of:
wherein the compound comprises at least one of 11C and 18F. Embodiment 2: The compound of Embodiment 1, wherein R1 is C1-C6 alkyl comprising at least one 11C. Embodiment 3: The compound of any one of Embodiments 1-2, wherein R1 is 11CH3. Embodiment 4: The compound of any one of Embodiments 1-3, wherein R2 is 18F. 62 53376748.1
Attorney Docket No.047162-7482WO1(02447) Embodiment 5: The compound of any one of Embodiments 1-4, which is selected from the group consisting of:
 Embodiment 6: The compound of any one of Embodiments 1-5, which is selected from the group consisting of:
 Embodiment 7: A compound of Formula (II), or a salt, solvate, tautomer, or stereoisomer thereof:
 least one 11C; R2 is 18F or 19F; and R3 is 11C or 12C; wherein the compound comprises at least one of 11C and 18F. Embodiment 8: The compound of Embodiment 7, wherein R1 is C1-C6 alkyl comprising at least one 11C. 63 53376748.1
Attorney Docket No.047162-7482WO1(02447) Embodiment 9: The compound of any one of Embodiments 7-8, wherein R1 is 11CH3. Embodiment 10: The compound of any one of Embodiments 7-9, wherein R2 is 18F. Embodiment 11: The compound of any one of Embodiments 7-10, which is selected from the group consisting of: ,
least one 11C; R2 is 18F or 19F; and R3 is 11C or 12C; wherein the compound comprises at least one of 11C and 18F. Embodiment 8: The compound of Embodiment 7, wherein R1 is C1-C6 alkyl comprising at least one 11C. 63 53376748.1
Attorney Docket No.047162-7482WO1(02447) Embodiment 9: The compound of any one of Embodiments 7-8, wherein R1 is 11CH3. Embodiment 10: The compound of any one of Embodiments 7-9, wherein R2 is 18F. Embodiment 11: The compound of any one of Embodiments 7-10, which is selected from the group consisting of: ,
 wherein: R1 is H or C1-C6 alkyl comprising at least one 11C; R2 is H or 18F; R3 is 11C or 12C; wherein the compound comprises at least one of 11C and 18F. 2. The compound of claim 1, wherein R1 is C1-C6 alkyl comprising at least one 11C. 3. The compound of claim 1, wherein R1 is 11CH3. 4. The compound of claim 1, wherein R2 is 18F. 5. The compound of claim 1, which is selected from the group consisting of:
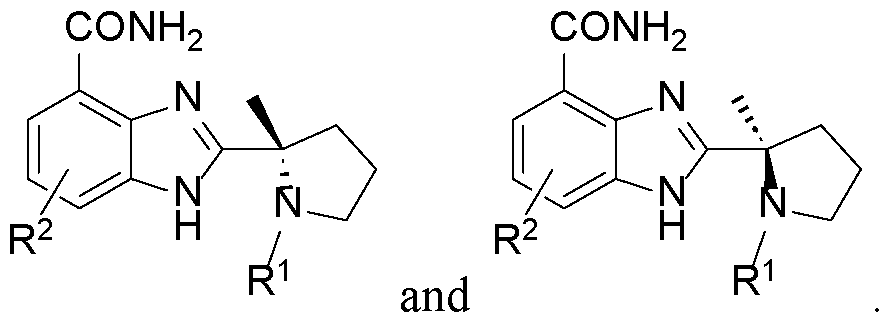 6. The compound of claim 1, which is selected from the group consisting of:
 66 53376748.1
Attorney Docket No.047162-7482WO1(02447)
66 53376748.1
Attorney Docket No.047162-7482WO1(02447)
 7. A compound of Formula (II), or a salt, solvate, tautomer, or stereoisomer thereof:
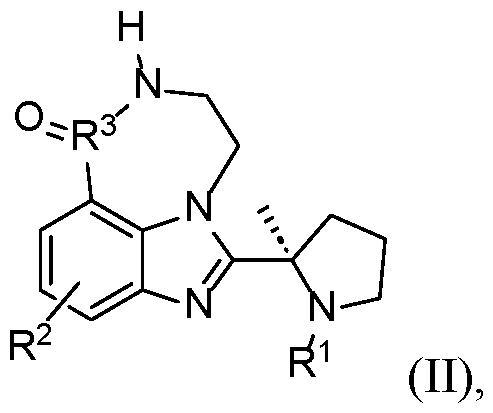 wherein R1 is H or C1-C6 alkyl comprising at least one 11C; R2 is 18F or 19F; and R3 is 11C or 12C; wherein the compound comprises at least one of 11C and 18F. 8. The compound of claim 7, wherein R1 is C1-C6 alkyl comprising at least one 11C. 9. The compound of claim 7, wherein R1 is 11CH3. 10. The compound of claim 7, wherein R2 is 18F. 11. The compound of claim 7, which is selected from the group consisting of: 67 53376748.1
Attorney Docket No.047162-7482WO1(02447)
wherein R1 is H or C1-C6 alkyl comprising at least one 11C; R2 is 18F or 19F; and R3 is 11C or 12C; wherein the compound comprises at least one of 11C and 18F. 8. The compound of claim 7, wherein R1 is C1-C6 alkyl comprising at least one 11C. 9. The compound of claim 7, wherein R1 is 11CH3. 10. The compound of claim 7, wherein R2 is 18F. 11. The compound of claim 7, which is selected from the group consisting of: 67 53376748.1
Attorney Docket No.047162-7482WO1(02447)
 12. A method of imaging poly(ADP-ribose) polymerase-1 (PARP1) in a subject, the method comprising: administering the compound of claim 1 or claim 7 to the subject, and imaging the compound in the subject. 13. The method of claim 12, wherein the imaging comprises positron emission tomography (PET). 14. The method of claim 12, wherein the PARP1 is imaged in the brain of the subject. 15. The method of claim 12, wherein the subject suffers from glioma, optionally wherein the glioma is glioblastoma. 16. The method of claim 12, wherein the subject suffers from Alzheimer’s disease (AD), 68 53376748.1
Attorney Docket No.047162-7482WO1(02447) Parkinson’s disease (PD), and/or any other central nervous system (CNS) disease. 17. The method of claim 12, wherein the imaging is used to quantitate PARP1 in the subject. 18. The method of claim 12, wherein the imaging is used to identify whether the subject will benefit from administration of a PARP1 inhibitor to treat, ameliorate, and/or prevent a disease or disorder. 19. The method of claim 18, wherein the disease or disorder is cancer or a central nervous system (CNS) disease. 20. The method of claim 19, wherein the cancer is glioma. 21. The method of claim 20, wherein the glioma is selected from the group consisting of ependymoma, anaplastic astrocytoma, glioblastoma, astrocytoma, brainstem glioma, diffuse midline glioma, oligodendroglioma, ganglioglioma, circumscribed astrocytic glioma, low-grade glioma, angiocentric glioma, oligoastrocytoma, pleomorphic xanthoastrocytoma, subependymal giant cell astrocytoma, and dysembryoplastic neuroepithelial tumor. 22. The method of claim 20, wherein the glioma is glioblastoma. 23. The method of claim 19, wherein the CNS disease is Alzheimer’s disease (AD) or Parkinson’s disease (PD). 24. The method of claim 12, wherein the compound is administered in an amount sufficient to clinically diagnose a disease or disorder of the brain. 69 53376748.1
12. A method of imaging poly(ADP-ribose) polymerase-1 (PARP1) in a subject, the method comprising: administering the compound of claim 1 or claim 7 to the subject, and imaging the compound in the subject. 13. The method of claim 12, wherein the imaging comprises positron emission tomography (PET). 14. The method of claim 12, wherein the PARP1 is imaged in the brain of the subject. 15. The method of claim 12, wherein the subject suffers from glioma, optionally wherein the glioma is glioblastoma. 16. The method of claim 12, wherein the subject suffers from Alzheimer’s disease (AD), 68 53376748.1
Attorney Docket No.047162-7482WO1(02447) Parkinson’s disease (PD), and/or any other central nervous system (CNS) disease. 17. The method of claim 12, wherein the imaging is used to quantitate PARP1 in the subject. 18. The method of claim 12, wherein the imaging is used to identify whether the subject will benefit from administration of a PARP1 inhibitor to treat, ameliorate, and/or prevent a disease or disorder. 19. The method of claim 18, wherein the disease or disorder is cancer or a central nervous system (CNS) disease. 20. The method of claim 19, wherein the cancer is glioma. 21. The method of claim 20, wherein the glioma is selected from the group consisting of ependymoma, anaplastic astrocytoma, glioblastoma, astrocytoma, brainstem glioma, diffuse midline glioma, oligodendroglioma, ganglioglioma, circumscribed astrocytic glioma, low-grade glioma, angiocentric glioma, oligoastrocytoma, pleomorphic xanthoastrocytoma, subependymal giant cell astrocytoma, and dysembryoplastic neuroepithelial tumor. 22. The method of claim 20, wherein the glioma is glioblastoma. 23. The method of claim 19, wherein the CNS disease is Alzheimer’s disease (AD) or Parkinson’s disease (PD). 24. The method of claim 12, wherein the compound is administered in an amount sufficient to clinically diagnose a disease or disorder of the brain. 69 53376748.1