Docket No.103361-544WO1 THE ROLE OF MIR-15A IN DIAGNOSING AND TREATING PANCREATIC DUCTAL ADENOCARCINOMA (PDAC) CROSS REFERENCE TO RELATED APPLICATIONS This application claims priority to, and the benefit of, U.S. Provisional Patent Application No.63/599,708, filed November 16, 2023, which is incorporated by reference herein in its entirety. STATEMENT REGARDING FEDERALLY SPONSORED RESEARCH This invention was made with government support under grant no. R35 CA197706 awarded by the National Institutes of Health. The government has certain rights in the invention. REFERENCE TO SEQUENCE LISTING The sequence listing submitted on November 15, 2024, as an .XML file entitled “103361- 544WO1_ST26.xml” created on October 23, 2024, and having a file size of 17,357 bytes is hereby incorporated by reference pursuant to 37 C.F.R. § 1.52(e)(5). FIELD The present disclosure relates to methods and compositions for diagnosing and treating pancreatic ductal adenocarcinoma (PDAC). BACKGROUND Pancreatic ductal adenocarcinoma (PDAC) accounts for the majority of pancreatic malignancies and is expected to become the second-leading cause of cancer-related mortality in the next few years. Indeed, PDAC shows a marked resistance to current therapies, and, to date, the 5-year survival rate does not exceed 10% of cases. Compared to other solid neoplasms, PDAC stands out by the abnormal prominence of its desmoplastic reaction, that frequently represents the major component of the tumor bulk. The dense extracellular matrix compresses blood vessels and limits oxygen and nutrients in the tumor microenvironment. To thrive and progress in nutrient restriction, PDAC cells are challenged to rapidly adopt different strategies, resulting in a plastic rewiring of transcriptomic, metabolic and signaling pathways. The study of PDAC adaptive mechanisms allows for the identification of critical vulnerabilities and, as a result, novel therapeutic approaches.
Docket No.103361-544WO1 MicroRNAs represent a class of small non-coding RNAs that, by negatively regulating gene expression at the post-transcriptional level, mediate several biological functions, including the adaptive responses to hypoxia and metabolic stress in cancer and, particularly, in PDAC. Importantly, dysregulation of miR-15a, extensively documented in PDAC, promotes cell cycle progression, cell viability and epithelial-mesenchymal transition. However, the possible role of miR-15a in the stress response of PDAC to nutrient restriction is still unexplored. What is needed in the art are methods and compositions which treat PDAC by targeting the mechanism by which miR-15a regulates Fra-2 and IGFR1. SUMMARY The present invention provides methods and compositions for diagnosing and treating pancreatic ductal adenocarcinoma (PDAC). The invention also provides kits and high-throughput screening assays for doing the same. In one aspect, disclosed herein is a method of treating pancreatic ductal adenocarcinoma (PDAC) in a subject in need thereof, comprising measuring level of expression of miR-15a in a subject compared to a control; placing the subject on a calorie-deficit diet, when a decrease in miR-15a is detected in the subject; and administering to the subject an IGF1R inhibitor, Fra-2 inhibitor or a combination thereof, thereby treating PDAC in the subject. In some embodiments, the control comprises a standardized level of miR-15a from subjects without PDAC. In some embodiments, the control comprises a sample from the subject at an earlier time period. In some embodiments, the calorie-deficit diet is a hypoproteic diet. In some embodiments, the hypoproteic diet comprises 0.8 grams of protein or less per kilogram body weight of the subject. In some embodiments, the hypoproteic diet comprises 0.65 grams of protein or less per kilogram body weight of the subject. In some embodiments, the hypoproteic diet comprises 0.4 grams of protein or less per kilogram body weight of the subject. In some embodiments, the IGF1R inhibitor comprises Ceritinib, Linsitinib, Picropodophyllin, BMS-754807, GSK1838705A, Chimaphilin, BMS-536924, AZD-3463, NVP- AEW541, Ceritinib dihydrochloride, GSK1904529A, NVP-TAE 226, NVP-ADW742, PQ401, XL228, AG1024, Ganitumab, NBI-31772, Mesylate, or Chromeceptin. In some embodiments, the Fra-2 inhibitor comprises T-5224. In some embodiments, the method of treating PDAC further comprising administering miR-15a to the subject, wherein the miR-15a is in a nanoparticle formulation. In some
Docket No.103361-544WO1 embodiments, the method comprising administering to the subject an additional form of cancer therapy. In some embodiments, the additional form of cancer therapy comprises chemotherapy. In one aspect, disclosed herein is a method of treating pancreatic ductal adenocarcinoma (PDAC) in a subject in need thereof, comprising measuring level of expression of miR-15a in a subject compared to a control and administering miR-15a to the subject, when a decrease in miR- 15a is detected in the subject, wherein the miR-15a is in a nanoparticle formulation, thereby treating PDAC in the subject. In some embodiments, the control comprises a standardized level of miR-15a from subjects without PDAC. In some embodiments, the control comprises a sample from the subject at an earlier time period. In some embodiments, the method further comprising placing the subject on a calorie- deficit diet, when a decrease in miR-15a is detected in the subject, as in any of the preceding aspects. In some embodiments, the calorie-deficit diet is a hypoproteic diet. In some embodiments, the hypoproteic diet comprises 0.8 grams of protein or less per kilogram body weight of the subject. In some embodiments, the hypoproteic diet comprises 0.65 grams of protein or less per kilogram body weight of the subject. In some embodiments, the hypoproteic diet comprises 0.4 grams of protein or less per kilogram body weight of the subject. In some embodiments, the method further comprising administering to the subject an IGF1R inhibitor, Fra-2 inhibitor or a combination thereof, thereby treating PDAC in the subject, as in any of the preceding aspects. In some embodiments, the IGF1R inhibitor comprises Ceritinib, Linsitinib, Picropodophyllin, BMS-754807, GSK1838705A, Chimaphilin, BMS-536924, AZD- 3463, NVP-AEW541, Ceritinib dihydrochloride, GSK1904529A, NVP-TAE 226, NVP- ADW742, PQ401, XL228, AG1024, Ganitumab, NBI-31772, Mesylate, or Chromeceptin. In some embodiments, the Fra-2 inhibitor comprises T-5224. In some embodiments, the method comprises administering to the subject an additional form of cancer therapy. In some embodiments, the additional form of cancer therapy comprises chemotherapy. In one aspect, disclosed herein is a method of determining treatment protocol for a subject with pancreatic ductal adenocarcinoma (PDAC), comprising, measuring level of expression of miR-15a in the subject compared to a control, determining that the subject has a low level of miR- 15a compared to a control and determining a treatment protocol comprising a calorie-deficit diet and/or scalable therapeutics.
Docket No.103361-544WO1 In some embodiments, the control comprises a standardized level of miR-15a from subjects without PDAC. In some embodiments, the control comprises a sample from the subject at an earlier time period. In some embodiments, the calorie-deficit diet is a hypoproteic diet. In some embodiments, the hypoproteic diet comprises 0.8 grams of protein or less per kilogram body weight of the subject. In some embodiments, the hypoproteic diet comprises 0.65 grams of protein or less per kilogram body weight of the subject. In some embodiments, the hypoproteic diet comprises 0.4 grams of protein or less per kilogram body weight of the subject. In some embodiments, the scalable therapeutics comprise an IGF1R inhibitor, a Fra-2 inhibitor, or a combination thereof. In some embodiments, the IGF1R inhibitor comprises Ceritinib, Linsitinib, Picropodophyllin, BMS-754807, GSK1838705A, Chimaphilin, BMS- 536924, AZD-3463, NVP-AEW541, Ceritinib dihydrochloride, GSK1904529A, NVP-TAE 226, NVP-ADW742, PQ401, XL228, AG1024, Ganitumab, NBI-31772, Mesylate, or Chromeceptin. In some embodiments, the Fra-2 inhibitor comprises T-5224. In some embodiments, the method comprises administering to the subject an additional form of cancer therapy. In some embodiments, the additional form of cancer therapy comprises chemotherapy. In one aspect, disclosed herein is a kit for diagnosing pancreatic ductal adenocarcinoma (PDAC), comprising means for measuring level of miR-15a expression in at least one sample obtained from a subject. In some embodiments, the at least one sample comprises a blood sample, a tissue biopsy or a combination thereof. In some embodiments, the kit comprises a sample collection device, nucleic acid extraction reagents, one or more control sample(s), a nucleic acid detection probe, DNA polymerase, a thermocycler, or a combination thereof. In some embodiments, the nucleic acid detection probe is a pair of forward and reverse primers. In some embodiments, the kit further comprising a sample resuspension medium, a lysis buffer, a wash buffer, a phenol, and chloroform for extraction of nucleic acids. In some embodiments, the level of miR-15a expression is measured by identifying a nucleic acid in the at least one sample. In some embodiments, the nucleic acid is DNA and/or RNA obtained from the at least one sample. In some embodiments, the level of miR-15a expression is identified and quantified by quantitative polymerase chain reaction (qPCR). In some embodiments, the kit further comprising comparing the level of miR-15a expression to a control with a threshold value, database value, normalized value, relative value, validated value, or a combination thereof. In some embodiments, a decrease in the level of miR-15a expression compared to one or more control sample(s) indicates PDAC. In some embodiments, an increase
Docket No.103361-544WO1 in the level of miR-15a expression compared to one or more control sample(s) indicates a lack of PDAC. In some embodiments, the one or more control sample(s) comprises a standardized level of miR-15a from subjects without PDAC. In some embodiments, the one or more control sample(s) comprises a sample from the subject at an earlier time period. Also, disclosed herein is a method of determining if a test agent is a modulator of miR-15a in a pancreatic ductal adenocarcinoma (PDAC) cell, in an in vitro assay, comprising, contacting a PDAC cell with one or more test agent(s), and measuring level of miR-15a expression in the PDAC cell compared to an untreated control or to miR-15a expression in the cell prior to contact with the one or more test agent(s), wherein a change in miR-15a expression indicates that the test agent is a modulator thereof. In some embodiments, an increase in the level of miR-15a expression compared to the untreated control indicates that the one or more agent(s) is an miR-15a inducer. In some embodiments, a decrease in the level of miR-15a expression compared to the untreated control indicates that the one or more agent(s) is an miR-15a inhibitor. In some embodiments, the one or more agent(s) is a drug, a small molecule, or a chemical compound. In some embodiments, the in vitro assay is high-throughput. Further disclosed herein, is a method of determining if a test agent is a modulator of miR- 15a in an in vivo model of pancreatic ductal adenocarcinoma (PDAC), comprising administering the one or more test agent(s) to the in vivo model of PDAC; and measuring level of miR-15a expression in the in vivo model of PDAC compared to an untreated control or to miR-15a expression in the in vivo model of PDAC prior to administering the one or more test agent(s), wherein a change in miR-15a expression indicates that the test agent is a modulator thereof. In some embodiments, an increase in the level of miR-15a expression compared to the untreated control indicates that the one or more agent(s) is an miR-15a inducer. In some embodiments, a decrease in the level of miR-15a expression compared to the untreated control indicates that the one or more agent(s) is an miR-15a inhibitor. In some embodiments, the one or more agent(s) is a drug, a small molecule, or a chemical compound. In some embodiments, the in vitro assay is high-throughput. BRIEF DESCRIPTION OF FIGURES The accompanying figures, which are incorporated in and constitute a part of this specification, illustrate several aspects described below. FIGS.1A-D show the working model for miR-15a/Fra-2 modulation of IGF1R signaling and sensitivity to IGF1R-inhibitor in PDAC cells exposed to different conditions of nutrient
Docket No.103361-544WO1 availability. Figure 1A shows the high levels of miR-15a inhibit IGF1R expression via Fra-2 targeting, impinging on PDAC growth during nutrient restriction. Figure 1B shows that miR-15a downmodulated PDAC, nutrient restriction triggers expression and transcriptional activity of Fra- 2 that, in turn, leads to PDAC growth by upregulating IGF1R. Figure 1C shows that the presence of nutrient availability, Fra-2 does not activate IGF1R transcription and administration of IGF1R- inhibitor results ineffective. Figure 1D shows that Fra-2 induces IGF1R overexpression in response to nutrient restriction, sensitizing PDAC cells to IGF1R inhibition. FIGS. 2A-2G show that the IGF1 signaling pathway is activated in response to nutrient deprivation and potentially regulated by miR-15a and Fra-2 in PDAC. Figure 2A shows a Venn diagram showing the number of molecular pathways enriched in nutrient deprived PDAC cells and potentially upregulated by miR-15a downregulation and Fra-2 expression in PDAC patients from the TCGA dataset (n=176). For nutrient deprivation, data were obtained by performing ingenuity pathway analysis (IPA®) on the overexpressed genes in AsPC-1 and MIA PaCa-2 cell lines, cultured in nutrient deprivation (0% FBS) for 72 hours. For miR-15a and Fra-2, data were obtained by performing IPA analyses on the genes significantly correlated with Fra-2 expression and the putative target genes inversely correlated with miR-15a levels in PDAC patients from the TCGA dataset. Histograms showing the significance of the five commonly activated pathways, as obtained by the Venn diagram. Dotted lines indicate the established threshold of 1.5 of -log10(p- value). Figures 2B and 2C show the scatter plots representing the correlation of IGF1R expression with levels of miR-15a (Figure 2B) and Fra-2 (Figure 2C) in PDAC samples from the TCGA dataset. The number of analyzed samples (n), the Spearman correlation value (r), and its significance (p-value) are reported in the graphs. Figures 2D and 2E show box plots showing the expression of Fra-2 (Figure 2D) and IGF1R (Figure 2E) in an independent cohort of 38 PDAC samples stratified according to miR-15a levels. miR-15a expression was assessed by qRT-PCR, Fra-2 and IGF1R were evaluated by immunohistochemistry and data represent the percentage of positive cells in each tumor. Unpaired t-test was used for statistical analyses and asterisks indicate significant differences. **p < 0.01; ***p < 0.001. Figure 2F shows the histograms showing miR- 15a expression in patients from the lower quartile and from the upper quartile. Figure 2G shows the representative images of immunohistochemical staining of IGF1R and Fra-2 in PDAC samples stratified according to miR-15a levels, as shown in Figure 2F. FIGS.3A-3H show that the Fra-2 directly regulates IGF1R expression in PDAC response to nutrient deprivation. Figure 3A shows the western blot analysis of the indicated proteins in AsPC-1 cells, cultured in normal serum (10% FBS, Ns) or in nutrient deprivation (0% FBS, N- dep) and collected at the indicated timepoints (hours, h). Vinculin was used as loading control.
Docket No.103361-544WO1 Figure 3B shows the graphs report the normalized expression of Fra-2 (left) and IGF1R (right), evaluated by qRT-PCR analysis in AsPC-1 parental cells cultured as described in Figure 3A. Figure 3C shows the western blot analysis of the indicated proteins in MIA PaCa-2 cells, cultured in normal serum (10% FBS, Ns) or in nutrient deprivation (0% FBS, N-dep) and collected at the indicated timepoints (hours, h). Vinculin was used as loading control. Figure 3D shows the graphs report the normalized expression of Fra-2 (left) and IGF1R (right), evaluated by qRT-PCR analysis in MIA PaCa-2 parental cells cultured as described in Figure 3C. Figure 3E shows on the left, a schematic representation of Fra-2-binding sequence on IGF1R promoter. On the right, chromatin immunoprecipitation (ChIP) analysis of Fra-2 bound to the IGF1R promoter in AsPC- 1 and MIA PaCa-2 cells cultured in normal serum (Ns) or in nutrient deprivation (N-dep) for 72 hours (h). Figure 3F shows the qRT-PCR analysis of miR-15a normalized expression in control, miR-15a overexpressing and Fra-2 silenced (sh-Fra-2) AsPC-1 cells, as used in the experiment described in Figure 3G. Data represent the mean (±SD) of three independent experiments. Figure 3G shows the expression of the indicated proteins and phospho-proteins in cell lysates of control, miR-15a overexpressing and Fra-2 silenced AsPC1 cells, cultured in normal serum (Ns), nutrient deprivation (N-dep) and released with IGF1 (80 ng/ml) for 1 hour (IGF1 release), as indicated. Vinculin was used as loading control. Figure 3H shows the working model for miR-15a modulation of mTOR activity via Fra-2/IGF1R in nutrient deprived PDAC cells. Nutrient deprivation-induced cell stress triggers Fra-2 transcriptional activity that, in turn, increases IGF1R expression and eventually restores the phosphorylation of mTOR pathway members. This mechanism is counteracted by miR-15a targeting of IGF1R via Fra-2. Dashed lines indicate the novel interaction between miR-15a/Fra-2 and IGF1R, whereas solid lines represent the well- established effects of nutrient deprivation and IGF1R activity on mTOR pathway. In Figures 3B, 3D, and 3E, data represent the mean (±SD) of three independent experiments performed in triplicate. Unpaired t-test was used for statistical analyses and asterisks indicate significant differences compared to the Ns condition. ***p < 0.001; ****p < 0.0001. FIGS. 4A-4F show that miR-15a impairs PDAC cell growth during nutrient restriction, via Fra-2 targeting and IGF1R signaling downmodulation. Figure 4A shows a graph reporting the growth rate of control, miR-15a overexpressing and Fra-2 silenced AsPC-1 cells cultured in normal serum (10% FBS) over a period of 72 hours. Figure 4B shows a graph reporting the growth rate of control, miR-15a and miR-15a+IGF1R overexpressing AsPC-1 cells, cultured in nutrient restriction (2.5% FBS) over a period of 72 hours. Figure 4C shows a graph reporting the growth rate of control, Fra-2 silenced and Fra-2 silenced+IGF1R overexpressing AsPC-1 cells, cultured in nutrient restriction (2.5% FBS) over a period of 72 hours. In Figure 4A-4C, the data are folded
Docket No.103361-544WO1 on the 0 hours timepoint and represent the mean (±SD) of three independent experiments performed in triplicate. Two-way ANOVA was used to verify the statistical significance and asterisks indicate significant differences compared to controls. *p<0.05; ***p < 0.001. Figure 4D shows western blot analysis evaluating p27 and Cyclin A protein levels in AsPC-1 cells transfected as indicated and cultured in normal serum (10% FBS, Ns) and nutrient restriction (2.5% FBS, N- res). Figure 4E shows the representative images (left) and graph (right) of colony formation assay of control, miR-15a, miR15a+IGF1R overexpressing, Fra-2 silenced, and Fra-2 silenced+IGF1R overexpressing AsPC-1 cells, cultured in normal serum (10% FBS, Ns) and in nutrient restriction (2.5% FBS, N-res). Data represent the percentage of colonies in N-res folded on the colonies number counted in Ns condition. Data collect the mean (±SD) of three independent experiments performed in duplicate. Figure 4F shows the representative images (top) and graphs (bottom) of soft agar assay of the indicated cells, as described in Figure 4E, cultured in normal serum (10% FBS, Ns) and in nutrient restriction (2.5% FBS, N-res). Bottom graphs report the measured areas, and each dot represents a different colony as evaluated in three independent experiments. In Figure 4E and 4F, unpaired t-test was used for statistical analyses and asterisks indicate significant differences compared to controls. **p<0.01; ***p < 0.001; ****p < 0.0001. FIGS. 5A-5I show that in vivo, protein-restricted diet induces Fra-2 and IGF1R overexpression and IGF1 signaling activation in Mir15a
KO PDAC. Figure 5A shows a schematic representation of the experimental workflow used for the generation and study of an inducible transgenic mouse model of PDAC. The crossbreeding of the Kras
LSL-G12D, Ptf1a
Cre-ERTM, Pten
flox (named KPP) inducible PDAC model with the Mir15a
KO mouse resulted in the KPP/Mir15a
KO mouse (named GL). At 6-8 weeks of age, KPP and GL mice were induced by three intraperitoneal injections of Tamoxifen (9 mg/40 gr mouse weight), and at the third injection mice were randomly distributed in two different cohorts, fed with control (3.8 Kcal/g, 20% of proteins, C-diet) or isocaloric, low protein diet (3.8 Kcal/g, 5% of proteins, LP-diet). After 60 days, mice were sacrificed and pancreata were collected and analyzed. Figure 5B shows a heat map of deregulated genes in PDAC from KPP and GL mice after 60 days from tumor induction and C-diet feeding (n=5 mice each group). Figure 5C shows a Venn diagram showing the number of dysregulated genes in PDAC from KPP and GL mice fed with LP-diet versus C-diet (n=5 mice each group). Numbers represent upregulated genes in response to LP-diet; numbers represent downregulated genes in response to LP-diet compared to C-diet. Figure 5D shows histograms showing molecular networks significantly modulated in GL-PDAC fed with LP-diet compared to C-diet. Data were obtained by performing IPA® analyses on the genes specifically altered in GL-PDAC only (n=815 upregulated and n=741 downregulated), obtained from the comparison in Figure 5C. Bars
Docket No.103361-544WO1 represent a profile of negatively and positively enriched pathways, respectively, based on the z- score. Bars represent a neutral profile of enriched pathway, in which the z-score was undetermined. Figures 5E-5G show graphs reporting the normalized expression of Fra-2 (Figure 5E), Igf1r (Figure 5F) and Irs2 (Figure 5G), evaluated by qRT-PCR analysis in PDAC from KPP and GL mice fed with C- and LP-diet, as indicated. Each dot represents a different tumor and unpaired t-test was used to assess the statistical significance. *p<0.05; **p<0.01. Figure 5H shows western blot analysis of the indicated proteins in PDAC from KPP and GL mice fed with C- and LP-diet, as indicated. Vinculin was used as loading control. Figure 5I shows histological evaluation of KPP- and GL-PDAC fed with C- and LP-diet. On the left, representative images of H&E and CK19 stained sections from PDAC tumors (20x, magnification); on the right, graph represents the percentage of phenotypic components of pancreatic tissues: normal epithelium (non-neoplasti), Pancreatic intraepithelial neoplasia and acinar-to-ductal metaplasia (PanIN/ADM), well-differentiated PDAC (Well), poorly differentiated PDAC (Poorly), or necrosis (grey). (n= 10 KPP C-diet; 9 KPP LP-diet; 10 GL C-diet; 10 GL LP-diet). FIGS. 6A-6E show that miR-15a modulates autophagic flux via Fra-2 and IGF1R targeting in nutrient deprived PDAC cells. Figure 6A shows the transmission electron microscopy (TEM) ultrastructure analyses of control, miR-15a overexpressing and Fra-2 silenced AsPC-1, cultured in normal serum (10% FBS), nutrient deprivation (0% FBS) and released with IGF1 (80 ng/ml) for 2 hours. Arrowheads indicate autophagic vacuoles and insets show an enlargement to highlight the ultrastructure of autophagic vacuoles. Indicated intracellular organelles are mitochondria (m) and autophagic vacuoles (AV). Figure 6B shows a graph reporting the number of autophagic vacuoles per cell, as assessed by TEM. Each dot represents a different evaluated cell and unpaired t-test was used to verify the statistical significance. **p<0.01. Figure 6C shows confocal microscopy analyses of control, miR-15a overexpressing and Fra-2 silenced AsPC-1 cells transfected with ptfLC3 construct. Cells were cultured in normal serum, nutrient deprivation and released or not with IGF1 (80 ng/ml, 2 hours) or Bafilomycin A1 (0.2 μM for 1 hour), as indicated. On the left, is a graph reporting the percentage of LC3 puncta counted per cell (number of cells/experimental condition = 7-12). Unpaired t-test was used to verify the statistical significance. ****p < 0.0001. On the right, typical confocal images of the described experiment. Figure 6D shows western blot analysis evaluating the expression of the indicated autophagy markers in control, miR-15a overexpressing and Fra-2 silenced AsPC-1 cells, cultured in normal serum (10% FBS, Ns), in nutrient deprivation (0% FBS, N-dep), and released with IGF1 (80 ng/ml, 2 hours) or Bafilomycin A1 (0.2 μM for 1 hour), as indicated. Vinculin was used as loading
Docket No.103361-544WO1 control. Figure 6E shows a graph reporting the normalized LC3B I/II ratio in cell lysates, as evaluated in Figure 6D. FIGS.7A-7F show that Fra-2 dictates sensitivity to IGF1R inhibition in nutrient deprived PDAC. Figure 7A shows a graph reporting the normalized expression of Fra-2, evaluated by qRT- PCR analysis in tumors explanted from untreated mice cohort (vehicle) as summarized in Figure 17A. Nude mice were injected in the flank with either wild-type or Fra-2
KO AsPC-1 cells. Once tumor onset was established, mice were randomly subdivided in two different cohorts, fed with control diet (C-diet) or isocaloric, low protein diet (LP-diet) and treated daily with vehicle. Each dot represents a different tumor and unpaired t-test was used to assess the statistical significance. *p<0.05. Figure 7B shows the western blot analysis evaluating the expression of the indicated proteins in tumors explanted from the untreated (vehicle) cohort of mice described in a. Vinculin was used as loading control. Figure 7C shows the graph reporting the growth rate of tumors (n = 4 tumor/group) from the cohort of mice treated with Linsitinib. Nude mice were injected in the flank with either wild-type or Fra-2
KO AsPC-1 cells. Once tumor onset was established, mice were randomly subdivided in two different cohorts, fed with control diet (C-diet) or isocaloric, low protein diet (LP-diet) and treated daily with Linsitinib for 3 weeks. Arrow indicates the starting point of Linsitinib administration. Data are represented as the mean (±SD) of 4 tumor/group folded on their respective volume at the onset and two-way ANOVA was used to verify the statistical significance. *p<0.05; ***p < 0.001. Figure 7D shows typical images of Ki-67 expression evaluated by immunohistochemistry (IHC) in tumors explanted from mice treated with Linsitinib as described in c (20x, magnification). Figure 7E shows a graph reporting the percentage of Ki67- positive cells in tumors represented in Figure 7D. Data are expressed as mean (±SD) of Ki-67 percentage counted in five randomly selected fields per tumor. Each dot represents a different tumor. Unpaired t-test was used to verify the statistical significance. **p<0.01. Figure 7F shows western blot analysis evaluating the expression of the indicated proteins in tumors explanted from the cohort of mice treated with Linsitinib as described in Figure 7C. GAPDH was used as loading control. FIGS. 8A-8H show the IGF1 signaling pathway is activated in response to nutrient deprivation and potentially regulated by miR-15a and Fra-2 in PDAC. Figures 8A and 8B show a Kaplan-Meier curve evaluating the overall survival of PDAC patients from the TCGA dataset (n=176), clustered according to miR-15a (low n=107; high n=69) (Figure 8A) and Fra-2 (low n=37; high n=132) (Figure 8B) expression. Statistical significance, hazard ratio (HR) and confidence interval (95% CI) were calculated with log-rank (Mantel-Cox) test and reported in the graph. Figure 8C shows a scatter plot showing the anti-correlation between Fra-2 and miR-15a in
Docket No.103361-544WO1 PDAC patients from the TCGA dataset. The number of analyzed samples (n), the Spearman correlation value (r), and its significance (p-value) are reported in the graph. Figure 8D shows a schematic representation of miR-15a binding site on FOSL2, encoding Fra-2, 3’UTR and its deletion. Figure 8E shows a histogram representing the normalized luciferase activity of psiCHECK2 vector with Fra-2 wild-type 3’UTR insert and with Fra-2 mutated 3’UTR, containing a deletion of the miR-15a target site. Luciferase activity was measured after 24h post-transfection in HEK293 cells. Data represent the mean (±SD) from three independent experiments performed in triplicate and statistical significance was evaluated by unpaired t-test.

Figures 8F and 8G show a histogram reporting the normalized expression of miR-15a (Figure 8F) and Fra-2 (Figure 8G), evaluated by qRT-PCR analysis in control and miR-15a overexpressing MIA PaCa-2 cells. In Figure 8G, unpaired t-test was used for statistical analyses and asterisks indicate significant differences compared to controls. **p<0.01. Figure 8H shows western blot analysis evaluating Fra-2 protein levels in control and miR-15a overexpressing MIA PaCa-2 cells. Vinculin was used as loading control. FIGS.9A-9D show that Fra-2 expression correlates with IGF1R levels and poor prognosis in an independent cohort of PDAC. Figure 9A shows a scatter plot showing the correlation between Fra-2 and IGF1R expression, evaluated by immunohistochemistry (IHC) in an independent cohort of PDAC patients (n=38). Data are expressed as the percentage of positive cells in the tumor samples and Spearman correlation test was used for statistical analysis. Figures 9B-9D show a Kaplan Meier curve evaluating the overall survival of PDAC patients from an independent cohort (n=37), stratified according to miR-15a (low n=12; high n=25) (Figure 9B), Fra-2 (low n=21; high n=16) (Figure 9C) and IGF1R (low n=19; high n=18) (Figure 9D) expression. Statistical significance, hazard ratio (HR) and confidence interval (95% CI) were calculated with log-rank (Mantel-Cox) test and reported in the graph. FIGS.10A-10L show that Fra-2 transcriptional activity is triggered by nutrient deprivation and leads to IGF1R overexpression. Figure 10A shows western blot analysis evaluating the expression of Fra-2 and IGF1R proteins in a panel of PDAC cell lines. Actin was used as loading control. Figure 10B shows a graph reporting the normalized expression of miR-15a evaluated by qRT-PCR analysis in the indicated PDAC parental cells. Data represent the mean (±SD) of two independent experiments. Figure 10C shows copy-number variation (CNV) analysis of MIR15A gene in DNA from normal cells and PDAC cell lines. Telomerase reverse transcriptase (TERT) control was used as normalizer. Data represent the mean (±SD) of two independent experiments. Figure 10D-10F show a graph reporting the normalized expression of miR-15a evaluated by qRT- PCR in AsPC-1 (Figure 10D), MIA PaCa-2 (Figure 10E) and Panc 2.3 (Figure 10F) parental
Docket No.103361-544WO1 cells, cultured in normal serum (10% FBS, Ns) and nutrient deprivation (0% FBS, N-dep) for the indicated timepoints (hours, h). Figure 10G shows western blot analysis of the indicated proteins in Panc 2.3 parental cells, cultured in normal serum (10% FBS, Ns) and nutrient deprivation (0% FBS, N-dep) and collected at the indicated timepoints (hours, h). Vinculin was used as loading control. Figure 10H shows graphs reporting the normalized expression of Fra-2 (left) and IGF1R (right), evaluated by qRT-PCR analysis in Panc 2.3 parental cells cultured as described in Figure 10D. Figure 10I shows western blot analysis of the indicated proteins in AsPC-1 and MIA PaCa- 2 parental cells cultured in Ns and N-dep for 72 hours, and treated or not with Cycloheximide (CHX) for 48 hours. Vinculin was used as loading control. Figure 10J-10L show graphs reporting the normalized expression of IRS2 by qRT-PCR analysis in AspPC-1 (Figure 10J), MIA PaCa-2 (Figure 10K) and Panc 2.3 (Figure 10L) parental cells grown as reported for the indicated timepoints. In Figures 10D, 10E, 10F, 10H, 10J, 10K, and 10L show data representing the mean (±SD) of three independent experiments. Unpaired t-test was used for statistical analyses and asterisks indicate significant differences compared to the Ns condition. *p < 0.05, **p < 0.01, ***p < 0.001, ****p < 0.0001. FIGS. 11A-11G show that Fra-2 transcriptional activity is triggered by nutrient deprivation and leads to IGF1R overexpression. Figure 11A shows western blot analyses of Fra- 2 and IGF1R in AsPC-1 parental cells, stimulated with EGF (10 ng/ml), IGF1 (80 ng/ml), Insulin (25 nM) and Glucose (30 mM) and collected at the indicated timepoints (h, hours). Vinculin was used as loading control. Figure 11B and 11C show a graph reporting the normalized expression of Fra-2 (Figure 11B) and IGF1R (Figure 11C), evaluated by qRT-PCR analysis in AsPC-1 parental cells stimulated and collected at different timepoints, as indicated in Figure 11D. Western blot analyses of Fra-2 and IGF1R in MIA PaCa-2 parental cells, stimulated with EGF (10 ng/ml), IGF1 (80 ng/ml), Insulin (25 nM) and Glucose (30 mM) and collected at the indicated timepoints (h, hours). Vinculin was used as loading control. Figures 11E and 11F show graphs reporting the normalized expression of Fra-2 (Figure 11E) and IGF1R (Figure 11F), evaluated by qRT-PCR analysis in MIA PaCa-2 parental cells stimulated and collected at different timepoints, as indicated. In Figures 11B, 11C, 11E, and 11F show that the data represent the mean (±SD) of three independent experiments. Unpaired t-test was used for statistical analyses and asterisks indicate significant differences compared to the 0 timepoint condition. *p<0.05; **p<0.01; ***p<0.001; ****p < 0.0001. Figure 11G shows on the left, schematic representation of Fra-2 binding sequence on IRS2 promoter. On the right, the graph reports the chromatin immunoprecipitation (ChIP) analysis of Fra-2 bound to the IRS2 promoter in AsPC-1 and MIA PaCa-2 cells cultured in normal serum (10% FBS, Ns) or in nutrient deprivation (0% FBS, N-dep) for 72 hours (h). Data
Docket No.103361-544WO1 represent the mean (±SD) of three independent experiments. Unpaired t-test was used for statistical analyses and asterisks indicate significant differences compared to the Ns condition. **p < 0.01. FIGS.12A-12D show that Fra-2 directly regulates IGF1 signaling pathway expression in PDAC response to nutrient deprivation. Figure 12A and 12B show histograms reporting the normalized luciferase activity of IGF1R (Figure 12A) and IRS2 (Figure 12B) promoters, containing or not (deleted, del) the Fra-2 binding sequence, in AsPC-1 cells cultured in normal serum (10% FBS, Ns) and in nutrient deprivation (0% FBS, N-dep). Unpaired t-test was used for statistical analyses and asterisks indicate significant differences compared to the Ns condition. **** p-value <0.0001. Figure 12C shows histograms reporting the normalized expression of the indicated proteins and phosphoproteins in cell lysates of control, miR-15a overexpressing and Fra- 2 silenced AsPC1 cells, cultured in normal serum (Ns), nutrient deprivation (N-dep) and released with IGF1 (80 ng/ml) for 1 hour (IGF1 release), as indicated in Figure 3G. Figure 12D shows a graph reporting the normalized expression of IGF1R, evaluated by qRT-PCR analysis in AsPC-1 cells transfected as indicated and used in the experiments reported in Figure 4A-4F. FIGS.13A-13I show that in vivo, protein restriction upregulates IGF1 signaling pathway in Mir15a
KO PDAC. Figure 13A shows western blot analyses of Fra-2 in AsPC-1 and MIA PaCa- 2 cells grown in normal serum (10% FBS, Ns) and in nutrient deprivation (0% FBS, N-dep) alone or supplemented with glucose (30 mM) or amino acids (1X Non-Essential Amino Acids Solution and L-glutamine 2 mM), as indicated. Figure 13B show graphs that represent the body weight in grams of KPP and GL mice at the time of tumor induction (on the left, starting point) and at the endpoint (on the right) in the indicated diet cohorts. Figure 13C shows a graph reporting the normalized expression of Krt19 in normal pancreata from KPP and GL mice and in KPP- and GL- PDAC from mice fed with C- and LP-diet. Figure 13D and 13E show graphs reporting the normalized expression of miR15a (Figure 13D) and MapK8 (Figure 13E) by qRT-PCR in KPP- and GL-PDAC from mice fed with C- and LP-diet. Figure 13F shows graphs reporting the normalized expression of the indicated proteins and phosphoproteins in PDAC lysates collected from KPP and GL mice fed with the indicated diets, as evaluated in Figure 5H. Figures 13G and 13H show charts that represent the percentage of well- and poorly differentiated PDAC components (% PDAC, Figure 13G) and only poorly differentiated PDAC (Figure 13H) evaluated by histology analysis of KPP- and GL-PDAC fed with C- and LP-diet, as indicated in Figure 5I. Figure 13I shows a chart that represents the number of local infiltrated organs evaluated on histological sections of KPP- and GL-PDAC from mice fed with C- and LP-diet, as indicated.
Docket No.103361-544WO1 In Figure 13B-13I, each dot represents a different mouse or tumor, and unpaired t-test was used to verify the statistical significance. *p<0.05; **p<0.01; ***p<0.001 and ****p<0.0001. FIGS.14A-14C show that in vivo, protein restriction did not alter IGF1 bioavailability in the tumor microenvironment. Figure 14A shows a graph reproducing the concentration (ng/mL) of circulating free-IGF1 in the plasma of KPP- and GL-mice fed with C- and LP-diet, after 4 hours of fasting, as obtained by ELISA assay. Each dot represents a different mouse and unpaired t-test was used to verify the statistical significance. *p<0.05; **p<0.01. Figure 14B shows a graph representing the normalized expression of Igf1 by qRT-PCR in KPP- and GL-PDAC collected from mice fed with C- and LP-diet. Each dot represents a different tumor. Figure 14C shows western blot analysis of IGF1 in KPP- and GL-PDAC collected from mice fed with C- and LP- diet. Vinculin was used as loading control. FIGS.15A-15D show the miR-15a/Fra-2 regulate autophagic flux via IGF1R in nutrient deprived PDAC cells. Figure 15A shows histograms reporting the fluorescence intensity of autophagosomes in control, miR-15a overexpressing and Fra-2 silenced AsPC-1 cells, cultured in nutrient deprivation (0% FBS, N-dep), and released with IGF1 (80 ng/ml, 2 hours) or Bafilomycin A1 (0.2 μM for 1 hour), as indicated. Data represent the mean (±SD) of three independent experiments performed in esaplicate and are folded over the N-dep condition. Unpaired t-test was used to verify the statistical significance. **p-value<0.01. Figure 15B shows histograms representing the normalized expression of the indicated proteins and phosphoproteins in cell lysates of control, miR-15a overexpressing and Fra-2 silenced AsPC-1 cells, cultured in normal serum (10% FBS, Ns), in nutrient deprivation (0% FBS, N-dep), and released with IGF1 (80 ng/ml, 2 hours) or Bafilomycin A1 (0.2 μM for 1 hour), as reported in Figure 6D. Figures 15C and 15D show western blot analyses of the indicated autophagy markers in control and miR- 15a+IGF1R-overexpressing (Figure 15C) and Fra-2-silenced+IGF1R-overexpressing (Figure 15D) AsPC-1 cells, cultured in normal serum (10% FBS, Ns) or in nutrient deprivation (0% FBS, N-dep) and released with IGF1 (80 ng/ml, 2 hours) or Bafilomycin A1 (Baf A1, 0.2 μM for 1 hour), as indicated. Vinculin was used as loading control. FIGS. 16A-16C show that in vitro, nutrient deprivation increases sensitivity to IGF1R- inhibition in PDAC cells via Fra-2. Figure 16A shows a dose-response curve of wild-type and Fra-2
KO AsPC-1 cells, cultured in normal serum (10% FBS) and treated for 72 h with increasing doses of Linsitinib, as depicted in the experimental timeline shown below the graph. Figure 16B shows a dose-response curve of wild-type and Fra-2
KO AsPC-1 cells, overexpressing or not IGF1R, cultured in nutrient deprivation (0% FBS) and then treated for 48 hours with increasing doses of Linsitinib, as depicted in the experimental timeline shown below the graph. In Figures
Docket No.103361-544WO1 16A and 16B, cell viability was measured by MTS assay and data show the percentage of viable treated cells folded on the untreated condition in three independent experiments. Unpaired t-test was used for statistical analysis and asterisks indicate significant differences respect to the Fra- 2
KO condition. *p < 0.05; **p < 0.01; ***p < 0.001. Figure 16C shows western blot analysis evaluating the expression of Fra-2 and IGF1R in the indicated cells cultured in normal serum (10% FBS, Ns) and nutrient deprivation (0% FBS, N-dep) for 72 hours as used in Figure 16A and 16B. FIGS.17A-17E show that in vivo, Fra-2 regulates IGF1R overexpression and autophagic flux in response to protein restriction. Figure 17A shows a schematic representation of the experimental workflow used for the evaluation of the tumor growth and the response to the IGF1R- inhibitor Linsitinib in mice xenografted with PDAC cells. Nude mice were injected in the flank with either wild-type or Fra-2
KO AsPC-1 cells. Once tumor onset was established, mice were randomly subdivided in two different cohorts, fed with control diet (C-diet) or isocaloric, low protein diet (LP-diet) and treated daily with vehicle or Linsitinib for 3 weeks. Created with BioRender. Figure 17B shows a graph reporting the tumor growth rate of wild-type and Fra-2
KO PDAC tumors in the untreated (vehicle) cohort of mice fed with C-diet and LP-diet as described in a. Arrow indicates the starting point of vehicle administration. Data represent the mean (±SD) of 4-5 tumors/group folded on their respective volume at the onset and two-way ANOVA was used to verify the statistical significance. *p<0.05. Figures 17C and 17D show the graphs report the normalized expression of IGF1R (Figure 17C) and miR-15a (Figure 17D), evaluated by qRT- PCR analysis in tumors explanted from untreated mice cohort (vehicle), as described in Figure 17A. Each dot represents a different tumor and unpaired t-test was used to assess the statistical significance. **p<0.01. Figure 17E shows western blot analysis evaluating the expression of the indicated proteins in tumors explanted from the cohort of mice treated with vehicle as described in Figure 7A. Vinculin was used as loading control. FIGS.18A-18C show that in vivo, low protein diet triggers IGF1R overexpression via Fra- 2 and increases sensitivity to IGF1R-inhibitor in PDAC. Figure 18A shows graphs reporting the normalized expression of the indicated proteins and phosphoproteins in tumor lysates collected from untreated mice fed with the indicated diets, as evaluated in Figures 7B and 17E. Figure 18B shows western blot analysis evaluating the expression of the indicated proteins in tumors explanted from mice treated with Linsitinib and fed with the indicated diets, as described in Figure 17A. Figure 18C shows graphs reporting the normalized expression of cleaved PARP
D214 (top) and Fra-2 (bottom) in tumor lysates collected from mice treated with Linsitinib and fed with the indicated diets, as evaluated in Figure 7F. In Figures 18A and 18C, each dot represents a different
Docket No.103361-544WO1 tumor lysate, and unpaired t-test was used to verify the statistical significance. *p<0.05; **p<0.01; ***p<0.001. DETAILED DESCRIPTION The following description of the disclosure is provided as an enabling teaching of the disclosure in its best, currently known embodiment(s). To this end, those skilled in the relevant art will recognize and appreciate that many changes can be made to the various embodiments of the invention described herein, while still obtaining the beneficial results of the present disclosure. It will also be apparent that some of the desired benefits of the present disclosure can be obtained by selecting some of the features of the present disclosure without utilizing other features. Accordingly, those who work in the art will recognize that many modifications and adaptations to the present disclosure are possible and can even be desirable in certain circumstances and are a part of the present disclosure. Thus, the following description is provided as illustrative of the principles of the present disclosure and not in limitation thereof. Reference will now be made in detail to the embodiments of the invention, examples of which are illustrated in the drawings and the examples. This invention may, however, be embodied in many different forms and should not be construed as limited to the embodiments set forth herein. Terminology Unless defined otherwise, all technical and scientific terms used herein have the same meaning as commonly understood to one of ordinary skill in the art to which this disclosure belongs. The term “comprising” and variations thereof as used herein is used synonymously with the term “including” and variations thereof and are open, non-limiting terms. Although the terms “comprising” and “including” have been used herein to describe various embodiments, the terms “consisting essentially of” and “consisting of” can be used in place of “comprising” and “including” to provide for more specific embodiments and are also disclosed. As used in this disclosure and in the appended claims, the singular forms “a”, “an”, “the”, include plural referents unless the context clearly dictates otherwise. The following definitions are provided for the full understanding of terms used in this specification. As used in the specification and the appended claims, the singular forms “a,” “an” and “the” include plural referents unless the context clearly dictates otherwise. Thus, for example, reference to “a pharmaceutical carrier” includes mixtures of two or more such carriers, and the like.
Docket No.103361-544WO1 The terms "about" and "approximately" are defined as being “close to” as understood by one of ordinary skill in the art. In one non-limiting embodiment the terms are defined to be within 10%. In another non-limiting embodiment, the terms are defined to be within 5%. In still another non-limiting embodiment, the terms are defined to be within 1%. As used herein, the terms "may," "optionally," and "may optionally" are used interchangeably and are meant to include cases in which the condition occurs as well as cases in which the condition does not occur. Thus, for example, the statement that a formulation "may include an excipient" is meant to include cases in which the formulation includes an excipient as well as cases in which the formulation does not include an excipient. “Composition” refers to any agent that has a beneficial biological effect. Beneficial biological effects include both therapeutic effects, e.g., treatment of a disorder or other undesirable physiological condition, and prophylactic effects, e.g., prevention of a disorder or other undesirable physiological condition. The terms also encompass pharmaceutically acceptable, pharmacologically active derivatives of beneficial agents specifically mentioned herein, including, but not limited to, a vector, polynucleotide, cells, salts, esters, amides, proagents, active metabolites, isomers, fragments, analogs, and the like. When the term “composition” is used, then, or when a particular composition is specifically identified, it is to be understood that the term includes the composition per se as well as pharmaceutically acceptable, pharmacologically active vector, polynucleotide, salts, esters, amides, proagents, conjugates, active metabolites, isomers, fragments, analogs, etc. The term “comprising”, and variations thereof as used herein is used synonymously with the term “including” and variations thereof and are open, non-limiting terms. Although the terms “comprising” and “including” have been used herein to describe various embodiments, the terms “consisting essentially of” and “consisting of” can be used in place of “comprising” and “including” to provide for more specific embodiments and are also disclosed. As used herein the abbreviation “PDAC” refers to pancreatic ductal adenocarcinoma. An "increase" can refer to any change that results in a greater amount of a symptom, disease, composition, condition, or activity. An increase can be any individual, median, or average increase in a condition, symptom, activity, composition in a statistically significant amount. Thus, the increase can be a 1, 2, 3, 4, 5, 6, 7, 8, 9, 10, 15, 20, 25, 30, 35, 40, 45, 50, 55, 60, 65, 70, 75, 80, 85, 90, 95, or 100% increase so long as the increase is statistically significant. A "decrease" can refer to any change that results in a smaller amount of a symptom, disease, composition, condition, or activity. A substance is also understood to decrease the genetic output of a gene when the genetic output of the gene product with the substance is less relative to
Docket No.103361-544WO1 the output of the gene product without the substance. Also, for example, a decrease can be a change in the symptoms of a disorder such that the symptoms are less than previously observed. A decrease can be any individual, median, or average decrease in a condition, symptom, activity, composition in a statistically significant amount. Thus, the decrease can be a 1, 2, 3, 4, 5, 6, 7, 8, 9, 10, 15, 20, 25, 30, 35, 40, 45, 50, 55, 60, 65, 70, 75, 80, 85, 90, 95, or 100% decrease so long as the decrease is statistically significant. As used herein the terms “inhibiting” and “blocking” are used interchangeably, as are the terms “inhibit” or “block” and the terms “inhibitor” or “blocker.” The terms “inhibit” and “block” refer to any detectable and statistically significant decrease in a given biological activity. By “reduce” or other forms of the word, such as “reducing” or “reduction,” is meant lowering of an event or characteristic (e.g., tumor growth). It is understood that this is typically in relation to some standard or expected value, in other words it is relative, but that it is not always necessary for the standard or relative value to be referred to. For example, “reduces tumor growth” means reducing the rate of growth of a tumor relative to a standard or a control. By “prevent” or other forms of the word, such as “preventing” or “prevention,” is meant to stop a particular event or characteristic, to stabilize or delay the development or progression of a particular event or characteristic, or to minimize the chances that a particular event or characteristic will occur. Prevent does not require comparison to a control as it is typically more absolute than, for example, reduce. As used herein, something could be reduced but not prevented, but something that is reduced could also be prevented. Likewise, something could be prevented but not reduced, but something that is prevented could also be reduced. It is understood that where reduce or prevent are used, unless specifically indicated otherwise, the use of the other word is also expressly disclosed. The term “subject” refers to any individual who is the target of administration or treatment. The subject can be a vertebrate, for example, a mammal. In one aspect, the subject can be human, non-human primate, bovine, equine, porcine, canine, or feline. The subject can also be a guinea pig, rat, hamster, rabbit, mouse, or mole. Thus, the subject can be a human or veterinary patient. The term “patient” refers to a subject under the treatment of a clinician, e.g., physician. The term “therapeutically effective” refers to the amount of the composition used is of sufficient quantity to ameliorate one or more causes or symptoms of a disease or disorder. Such amelioration only requires a reduction or alteration, not necessarily elimination. The term “treatment” refers to the medical management of a patient with the intent to cure, ameliorate, stabilize, or prevent a disease, pathological condition, or disorder. This term includes active treatment, that is, treatment directed specifically toward the improvement of a disease,
Docket No.103361-544WO1 pathological condition, or disorder, and also includes causal treatment, that is, treatment directed toward removal of the cause of the associated disease, pathological condition, or disorder. In addition, this term includes palliative treatment, that is, treatment designed for the relief of symptoms rather than the curing of the disease, pathological condition, or disorder; preventative treatment, that is, treatment directed to minimizing or partially or completely inhibiting the development of the associated disease, pathological condition, or disorder; and supportive treatment, that is, treatment employed to supplement another specific therapy directed toward the improvement of the associated disease, pathological condition, or disorder. "Comprising" is intended to mean that the compositions, methods, etc. include the recited elements, but do not exclude others. "Consisting essentially of'' when used to define compositions and methods, shall mean including the recited elements, but excluding other elements of any essential significance to the combination. Thus, a composition consisting essentially of the elements as defined herein would not exclude trace contaminants from the isolation and purification method and pharmaceutically acceptable carriers, such as phosphate buffered saline, preservatives, and the like. "Consisting of'' shall mean excluding more than trace elements of other ingredients and substantial method steps for administering the compositions provided and/or claimed in this disclosure. Embodiments defined by each of these transition terms are within the scope of this disclosure. A “control” is an alternative subject or sample used in an experiment for comparison purposes. A control can be "positive" or "negative." As used herein, “enhance”, “enhanced”, “enhancement”, “enhancing”, and any grammatical variations thereof as used herein, refers to an act of intensifying, increasing, or further improving the quality, value, or extent of a biological function, composition, compound, cell, or tissue. As used herein, the term "polymerase chain reaction" ("PCR") refers to a method for increasing the concentration of a segment of a target sequence in a mixture of genomic DNA without cloning or purification. This process for amplifying the target sequence typically consists of introducing a large excess of two oligonucleotide primers to the DNA mixture containing the desired target sequence, followed by a precise sequence of thermal cycling in the presence of a DNA polymerase. The two primers are complementary to their respective strands of the double stranded target sequence. To effect amplification, the mixture is denatured and the primers then annealed to their complementary sequences within the target molecule. Following annealing, the primers are extended with a polymerase so as to form a new pair of complementary strands. The steps of denaturation,
Docket No.103361-544WO1 primer annealing, and polymerase extension can be repeated many times to obtain a high concentration of an amplified segment of the desired target sequence. Unless otherwise noted, PCR, as used herein, also includes variants of PCR such as allele-specific PCR, asymmetric PCR, hot-start PCR, ligation-mediated PCR, multi- plex-PCR, reverse transcription PCR, or any of the other PCR variants known to those skilled in the art. “Expression” as used herein refers to the process by which information from a gene is used in the synthesis of a functional gene product that enables it to produce a peptide/protein end product, and ultimately affect a phenotype, as the final effect. As used herein, the term “lysis” refers to the process of breaking down the membrane of a cell, often by viral, enzymatic, or osmotic mechanisms that compromise cellular integrity. As used herein, the term “buffer” refers to a solution consisting of a mixture of acid and its conjugate base, or vice versa. The solution is used as a means of keeping the pH at a nearly constant range to be used in a wide variety of chemical and biological applications. As used herein, the term “polymerase” refers to an enzyme that synthesizes long chains of polymers or nucleic acids. DNA polymerase and RNA polymerase are used to assemble DNA and RNA molecules, respectively, by copying a DNA template strand using base-pairing interactions. The term “administer,” “administering”, or derivatives thereof refer to delivering a composition, substance, inhibitor, or medication to a subject or object by one or more the following routes: oral, topical, intravenous, subcutaneous, transcutaneous, transdermal, intramuscular, intra-joint, parenteral, intra-arteriole, intradermal, intraventricular, intracranial, intraperitoneal, intralesional, intranasal, rectal, vaginal, by inhalation or via an implanted reservoir. The term “parenteral” includes subcutaneous, intravenous, intramuscular, intra- articular, intra-synovial, intrasternal, intrathecal, intrahepatic, intralesional, and intracranial injections or infusion techniques. The term “detect” or “detecting” refers to an output signal released for the purpose of sensing of physical phenomenon. An event or change in environment is sensed and signal output released in the form of light. Nanoparticles, as described herein, can be synthesized or assembled via any suitable process. Preferably, the nanoparticles are assembled in a single step to minimize process variation. A single step process can include nanoprecipitation and self-assembly. The nanoparticles can be synthesized or assembled by dissolving or suspending the sunitinib in an organic solvent, preferably a solvent that is miscible in an aqueous solvent used for precipitation. In certain examples, acetonitrile is used as the organic solvent, but any suitable solvent can be used.
Docket No.103361-544WO1 Hydrophilic components are dissolved in a suitable aqueous solvent, such as water, 4 wt.% ethanol, or the like. The organic phase solution can be added drop wise to the aqueous phase solution to nanoprecipitate the sunitinib and allow self-assembly of the nanoparticle in the aqueous solvent. The terms “anticancer” and “anticarcinogen” refers to a substance, composition, or formula that counteracts the effects or inhibits the development of a cancerous cells and tissues. The terms "cell," "cell line" and "cell culture" include progeny. It is also understood that all progenies may not be precisely identical in DNA content, due to deliberate or inadvertent mutations. Variant progeny that have the same function or biological property, as screened for in the originally transformed cell, are included. The "host cells" used in the present invention generally are prokaryotic or eukaryotic hosts. The term “kit” describes a wide variety of bags, containers, carrying cases, and other portable enclosures which may be used to carry and store solid substances, liquid substances, and other accessories. Such kits and their contents along with any applicable procedures may be used in accordance with the teachings of the present disclosure. The term “screening” refers to a method especially used in drug discovery in which data processing/control software, liquid handling devices, and sensitive detectors can allow for quick conductions of chemical, genetic, or pharmacological tests. This process allows one to quickly recognize active compounds, antibodies, or genes that modulate a particular biomolecular pathway. The results of these processes provide starting points for drug design. The term “aspirate” refers to the act in many biological practices to remove any liquid or fluid-like substances from a sample, including cells, tissue, body cavity, cyst, or tumor. A “receptor is a cellular protein whose activation causes a cell to modify its present functions or actions. As used herein, “diagnose”, “diagnosed”, “diagnosing”, and any grammatical variations thereof as used herein, refers to the act of process of identifying the nature of an illness, disease, disorder, or condition in a subject by examination or monitoring of symptoms. The term “miRNA” generally refers to a single-stranded molecule, but in specific embodiments, molecules will also encompass a region or an additional strand that is partially (between 10 and 50% complementary across length of strand), substantially (greater than 50% but less than 100% complementary across length of strand) or fully complementary to another region of the same single-stranded molecule or to another nucleic acid. Thus, nucleic acids may encompass a molecule that comprises one or more complementary or self-complementary strand(s) or “complement(s)” of a particular sequence comprising a molecule. For example,
Docket No.103361-544WO1 precursor miRNA may have a self-complementary region, which is up to 100% complementary. miRNA probes or nucleic acids can include, can be, or can be at least 60, 65, 70, 75, 80, 85, 90, 95, 96, 97, 98, 99 or 100% complementary to their target. Methods of treating pancreatic ductal adenocarcinoma (PDAC) Disclosed herein are methods and compositions for diagnosing and treating pancreatic ductal adenocarcinoma (PDAC). The invention also provides kits and high-throughput screening assays for doing the same. As described in the Example section, insulin-like growth factor-1 (IGF-1) signaling was enhanced in nutrient-deprived PDAC cells, and Fra-2 Fos-related antigen-2 (Fra-2) and insulin- like growth factor-1 receptor (IGF1R) were overexpressed in PDAC patients in whom the onco- suppressormiR-15a was downmodulated. The IGF-1 signaling pathway is a complex network that regulates many cellular processes, including cell proliferation, growth, survival, metabolism, differentiation, apoptosis, and migration. Mechanistically, miR-15a represses IGF1R expression via Fra-2 targeting. In the miR-15a-downmodulated context, IGF1R hyperactivates mTOR, modulates autophagy and sustains PDAC growth in nutrient deprivation. A genetic mouse model (miR-15a knock-out PDAC model), showed Fra-2 and IGF1R upregulation and mTOR activation upon diet restriction. Consistently, nutrient restriction sensitizes PDAC to IGF1R-inhibition in a Fra-2-dependent manner. Overall, these results point to a crucial role of Fra-2 in the response to nutrient restriction typical of pancreatic cancer and support IGF1R as a vulnerable target in miR- 15a-downmodulated PDAC. Accordingly, disclosed herein is a method of treating PDAC in a subject in need thereof by measuring the level of expression of miR-15a in a subject, comparing this level to a control, placing the subject on a calorie-deficit diet when a decrease in miR-15a is detected in the subject; and administering to the subject an IGF1R inhibitor, Fra-2 inhibitor, or a combination thereof, thereby treating PDAC in the subject. In some embodiments, the control comprises a standardized level of miR-15a from subjects without PDAC. In some embodiments, the control comprises a sample from the subject at an earlier time period. By an earlier time period is meant that the level of miR-15a is determined in the subject before treatment and diet restrictions are implemented. If the subject has a low level of miR-15a compared to a control or standard, the subject can be determined to be a good candidate for a combined diet/therapy strategy. This standard can be established by one of skill in the art by determining cutoff, or threshold, levels which are considered in a “normal” range for a subject. Levels determined at earlier timepoints for the same patient can also be used as the
Docket No.103361-544WO1 standard. For example, the level of miR-15a can be less than 5%, 10%, 15%, 20%, 25%, 30%, 35%, 40%, 45%, 50%, 55%, 60%, 65%, 70%, 75%, 80%, 85%, 90%, 95%, or 100% compared to the control. As further disclosed herein, the subject can be sensitized to IGFR1 or Fra-2 treatment by providing a nutrient-deprived environment. This can be, for example, a calorie-deficit diet. A calorie-deficit diet is one wherein a subject does not consume as many calories as the subject needs to maintain their body weight. In some embodiments, the calorie-deficit diet is a hypoproteic diet. The hypoproteic diet can be one where protein is limited. The amount of protein can be limited to 0.8 grams of protein or less per kilogram body weight of the subject, 0.65 grams of protein or less per kilogram body weight of the subject, or 0.4 grams of protein or less per kilogram body weight of the subject. It can also be any amount in-between or below these levels. The hypoproteic diet can be done by the subject limiting the amount of protein consumed. It can also be carried out by administering to the subject a composition which reduces or eliminates the uptake of protein or the amount of available protein in one’s diet. This can also be accomplished by surgical intervention, which reduces the total amount of food consumed or digested. It can also be accomplished by the use of a monitor, such as an implant, or by taking regular blood samples and monitoring certain metrics. When diet is used to accomplish calorie restriction, the subject can be given a monitor to track calorie consumption and progress. This can be an application, for example, in which the subject can input food consumed. Intermittent fasting can also be used. In some embodiments, the diet is followed by the subject, every day, every 2 days, every 3 days, every 4 days, every 5 days, every 6 days, every 7 days, or more. For 1, 2, 3, 4, weeks, or more. In some embodiments, the diet is followed by the subject for 1, 2, 3, 4, 5, 6, 7, 8, 9, 10, 11, 12 months, or more. In some embodiments, the diet is followed by the subject for 1, 2, 3, 4, 5 years or more. In addition, the subject can be administered an IGF1R inhibitor, Fra-2 inhibitor or a combination thereof, the subject can also be given other forms of treatment, such as chemotherapy. Types of IGF1R inhibitors include, but are not limited to, Ceritinib, Linsitinib, Picropodophyllin, BMS-754807, GSK1838705A, Chimaphilin, BMS-536924, AZD-3463, NVP-AEW541, Ceritinib dihydrochloride, GSK1904529A, NVP-TAE 226, NVP-ADW742, PQ401, XL228, AG1024, Ganitumab, NBI-31772, Mesylate, or Chromeceptin. Further, an example of a Fra-2 inhibitor comprises T-5224. Exemplary chemotherapeutic agents include, but are not limited to, anti- estrogens (e.g. tamoxifen, raloxifene, and megestrol), LHRH agonists (e.g. goscrclin and leuprolide), anti-androgens (e.g. flutamide and bicalutamide), photodynamic therapies (e.g. vertoporfin (BPD-MA), phthalocyanine, photosensitizer Pc4, and demethoxy-hypocrellin A
Docket No.103361-544WO1 (2BA-2-DMHA)), nitrogen mustards (e.g. cyclophosphamide, ifosfamide, trofosfamide, chlorambucil, estramustine, and melphalan), nitrosoureas (e.g. carmustine (BCNU) and lomustine (CCNU)), alkylsulphonates (e.g. busulfan and treosulfan), triazenes (e.g. dacarbazine, temozolomide), platinum containing compounds (e.g. cisplatin, carboplatin, oxaliplatin), vinca alkaloids (e.g. vincristine, vinblastine, vindesine, and vinorelbine), taxoids (e.g. paclitaxel or a paclitaxel equivalent such as nanoparticle albumin-bound paclitaxel (ABRAXANE), docosahexaenoic acid bound-paclitaxel (DHA-paclitaxel, Taxoprexin), polyglutamate bound- paclitaxel (PG-paclitaxel, paclitaxel poliglumex, CT-2103, XYOTAX), the tumor-activated prodrug (TAP) ANG1005 (Angiopep-2 bound to three molecules of paclitaxel), paclitaxel-EC-1 (paclitaxel bound to the erbB2-recognizing peptide EC-1), and glucose-conjugated paclitaxel, e.g., 2′-paclitaxel methyl 2-glucopyranosyl succinate; docetaxel, taxol), epipodophyllins (e.g. etoposide, etoposide phosphate, teniposide, topotecan, 9-aminocamptothecin, camptoirinotecan, irinotecan, crisnatol, mytomycin C), anti-metabolites, DHFR inhibitors (e.g. methotrexate, dichloromethotrexate, trimetrexate, edatrexate), IMP dehydrogenase inhibitors (e.g. mycophenolic acid, tiazofurin, ribavirin, and EICAR), ribonucleotide reductase inhibitors (e.g. hydroxyurea and deferoxamine), uracil analogs (e.g. 5-fluorouracil (5-FU), floxuridine, doxifluridine, ratitrexed, tegafur-uracil, capecitabine), cytosine analogs (e.g. cytarabine (ara C), cytosine arabinoside, and fludarabine), purine analogs (e.g. mercaptopurine and Thioguanine), Vitamin D3 analogs (e.g. EB 1089, CB 1093, and KH 1060), isoprenylation inhibitors (e.g. lovastatin), dopaminergic neurotoxins (e.g. 1-methyl-4-phenylpyridinium ion), cell cycle inhibitors (e.g. staurosporine), actinomycin (e.g. actinomycin D, dactinomycin), bleomycin (e.g. bleomycin A2, bleomycin B2, peplomycin), anthracycline (e.g. daunorubicin, doxorubicin, pegylated liposomal doxorubicin, idarubicin, epirubicin, pirarubicin, zorubicin, mitoxantrone), MDR inhibitors (e.g. verapamil), Ca
2+ ATPase inhibitors (e.g. thapsigargin), imatinib, thalidomide, lenalidomide, tyrosine kinase inhibitors (e.g., axitinib (AG013736), bosutinib (SKI- 606), cediranib (RECENTIN™, AZD2171), dasatinib (SPRYCEL®, BMS-354825), erlotinib (TARCEVA®), gefitinib (IRESSA®), imatinib (Gleevec®, CGP57148B, STI-571), lapatinib (TYKERB®, TYVERB®), lestaurtinib (CEP-701), neratinib (HKI-272), nilotinib (TASIGNA®), semaxanib (semaxinib, SU5416), sunitinib (SUTENT®, SU11248), toceranib (PALLADIA®), vandetanib (ZACTIMA®, ZD6474), vatalanib (PTK787, PTK/ZK), trastuzumab (HERCEPTIN®), bevacizumab (AVASTIN®), rituximab (RITUXAN®), cetuximab (ERBITUX®), panitumumab (VECTIBIX®), ranibizumab (Lucentis®), nilotinib (TASIGNA®), sorafenib (NEXAVAR®), everolimus (AFINITOR®), alemtuzumab (CAMPATH®), gemtuzumab ozogamicin (MYLOTARG®), temsirolimus (TORISEL®), ENMD-2076, PCI-
Docket No.103361-544WO1 32765, AC220, dovitinib lactate (TKI258, CHIR-258), BIBW 2992 (TOVOK™), SGX523, PF- 04217903, PF-02341066, PF-299804, BMS-777607, ABT-869, MP470, BIBF 1120 (VARGATEF®), AP24534, JNJ-26483327, MGCD265, DCC-2036, BMS-690154, CEP-11981, tivozanib (AV-951), OSI-930, MM-121, XL-184, XL-647, and/or XL228), proteasome inhibitors (e.g., bortezomib (VELCADE)), mTOR inhibitors (e.g., rapamycin, temsirolimus (CCI-779), everolimus (RAD-001), ridaforolimus, AP23573 (Ariad), AZD8055 (AstraZeneca), BEZ235 (Novartis), BGT226 (Norvartis), XL765 (Sanofi Aventis), PF-4691502 (Pfizer), GDC0980 (Genetech), SF1126 (Semafoe) and OSI-027 (OSI)), oblimersen, gemcitabine, caminomycin, leucovorin, pemetrexed, cyclophosphamide, dacarbazine, procarbizine, prednisolone, dexamethasone, campathecin, plicamycin, asparaginase, aminopterin, methopterin, porfiromycin, melphalan, leurosidine, leurosine, chlorambucil, trabectedin, procarbazine, discodermolide, caminomycin, aminopterin, and hexamethyl melamine. In some embodiments, the IGF1R inhibitor, Fra-2 inhibitor, anti-cancer therapy or a combination thereof is administered 1, 2, 3, 4, 5, 6, 7, 8, 9, 10, 11, 12, 13, 14, 15, 16, 17, 18, 19, 20, 21, 22, 23, 24, 25, 26, 27, 28, 29, 30, 31, 32, 33, 34, 35, 36, 37, 38, 39, 40, 41, 42, 43, 44, 45, 46, 47, 48, 49, 50, 51, 52, 53, 54, 55, 56, 57, 58, 59, 60, 61, 62, 63, 64, 65, 66, 67, 68, 69, 70, 71, 72, 73, 74, 75, 76, 77, 78, 79, 80, 81, 82, 83, 84, 85, 86, 87, 88, 89, 90, 91, 92, 93, 94, 95, 96, 97, 98, 99, 100, or more times. In some embodiments, the IGF1R inhibitor, Fra-2 inhibitor, anti-cancer therapy or a combination thereof is administered daily. In some embodiments, the IGF1R inhibitor, Fra-2 inhibitor, anti-cancer therapy or a combination thereof is administered every day, every 2 days, every 3 days, every 4 days, every 5 days, every 6 days, every 7 days, or more. In some embodiments, the IGF1R inhibitor, Fra-2 inhibitor, anti-cancer therapy or a combination thereof is administered every week, every 2 weeks, every 3 weeks, every 4 weeks, or more. In some embodiments, the IGF1R inhibitor, Fra-2 inhibitor, anti-cancer therapy or a combination thereof is administered every month, every 2 months, every 3 months, every 4 months, every 5 months, every 6 months, every 7 months, every 8 months, every 9 months, every 10 months, every 11 months, every 12 months, or more. In some embodiments, the IGF1R inhibitor, Fra-2 inhibitor, anti-cancer therapy or a combination thereof is administered every year, every 2 years, every 3 years, every 4 years, every 5 years, or more. In one aspect, disclosed herein is a method of treating pancreatic ductal adenocarcinoma (PDAC) in a subject in need thereof, comprising measuring level of expression of miR-15a in a subject compared to a control and administering miR-15a to the subject, when a decrease in miR- 15a is detected in the subject, wherein the miR-15a is in a nanoparticle formulation, thereby treating PDAC in the subject.
Docket No.103361-544WO1 The miR-15a can be given in any number of formats, including, but not limited to, a nanoparticle formulation. The miR-15a can be artificial (not naturally occurring, or derived from naturally occurring miR-15a sequence but engineered so that it is not identical to that which is naturally occurring). In addition to the miR-15a, the subject can be given other compositions for treating PDAC or relieving the symptoms thereof. Methods of determining treatment protocol for PDAC In one aspect, disclosed herein is a method of determining treatment protocol for a subject with PDAC, comprising, measuring level of expression of miR-15a in the subject compared to a control, determining that the subject has a low level of miR-15a compared to a control and determining a treatment protocol comprising a calorie-deficit diet and/or scalable therapeutics. For example, the level of miR-15a can be reduced by 5%, 10%, 15%, 20%, 25%, 30%, 35%, 40%, 45%, 50%, 55%, 60%, 65%, 70%, 75%, 80%, 85%, 90%, 95%, or 100% compared to the control. This can be used to determine the prognosis of the subject, for example, and treating the subject accordingly. The treatment protocol can comprise any number of therapeutic interventions known to those of skill in the art for treating or alleviating the symptoms of PDAC. It can also include dietary guidelines or pharmaceuticals which alter uptake of certain nutrients or macrobiotics. As in any of the preceding aspects, in some embodiments, the control comprises a standardized level of miR-15a from subjects without PDAC. In some embodiments, the control comprises a sample from the subject at an earlier time period. In some embodiments, the calorie- deficit diet is a hypoproteic diet. In some embodiments, the scalable therapeutics comprise an IGF1R inhibitor, a Fra-2 inhibitor, or a combination thereof. In some embodiments, the method comprising administering to the subject an additional form of cancer therapy. In some embodiments, the additional form of cancer therapy comprises chemotherapy. The level of expression of miR-15a can be used to provide cutoff levels. These cutoff levels can be indicative of disease severity or progression, which can then inform treatment protocol. For example, if the relative expression level of miR-15a falls within 3.5 and 7.5 range, this can indicate that the subject has advanced PDAC, and can be treated more aggressively. If the subject has an miR-15a relative expression level which falls within 1.5 and 3.5 range, the subject may receive less aggressive treatments. If the subject has a range within 0 and 1.5, the subject may be referred for monitoring of disease progression, and not be treated at the time. Other factors can also be used to calculate a risk score, such as age, weight, family history, lifestyle choices (smoking, alcohol consumption), etc. One of skill in the art can decide what these risk scores should encompass and what their ranges should be.
Docket No.103361-544WO1 Kits for diagnosing PDAC In one aspect, disclosed herein is a kit for diagnosing pancreatic ductal adenocarcinoma (PDAC), comprising a means for measuring level of miR-15a expression in at least one sample obtained from a subject. In some embodiments, the at least one sample comprises a blood sample, a tissue biopsy or a combination thereof, wherein the tissue biopsy can include pancreatic tissue or pancreatic aspirate. In some embodiments, the kit comprises a sample collection device, nucleic acid extraction reagents, one or more control sample(s), a nucleic acid detection probe, DNA polymerase, a thermocycler, or a combination thereof. In some embodiments, the sample collection device can include but is not limited to a scalpel, biopsy punch, a needle and syringe, and/or a sample container, such as a sterile tube. In some embodiments, the nucleic acid extraction reagents include a sample resuspension medium, a lysis buffer, a wash buffer, a phenol, and chloroform for extraction of nucleic acids. In some embodiments, the one or more control sample(s) comprises a standardized level of miR-15a from subjects without PDAC. In some embodiments, the control comprises a sample from the subject at an earlier time period. By an earlier time period is meant that the level of miR-15a is determined in the subject before treatment and diet restrictions are implemented. In some embodiments, the nucleic acid detection probe is a pair of forward and reverse primers. The kit further comprising a thermocycler and/or a DNA polymerase to perform a polymerase chain reaction to determine the miR-15a levels in the sample obtained. In some embodiments, the level of miR-15a expression is measured by identifying a nucleic acid in the at least one sample. In some embodiments, the nucleic acid is DNA and/or RNA obtained from the at least one sample. In some embodiments, the level of miR-15a expression is identified and quantified by quantitative polymerase chain reaction (qPCR). In some embodiments, the kit further comprising comparing the level of miR-15a expression to a control with a threshold value, database value, normalized value, relative value, validated value, or a combination thereof. In some embodiments, an increase in the level of miR-15a expression compared to one or more control sample(s) indicates a lack of PDAC. In some embodiments, a decrease in the level of miR-15a expression compared to one or more control sample(s) indicates PDAC. If the subject has a low level of miR-15a compared to a control or standard, the subject can be determined to be a good candidate for a combined diet/therapy strategy. This standard can be established by one of skill in the art by determining cutoff, or threshold, levels which are considered in a “normal” range for a subject. Levels determined at earlier timepoints for the same patient can also be used as the standard. For example, the level of miR-15a can be decreased by
Docket No.103361-544WO1 5%, 10%, 15%, 20%, 25%, 30%, 35%, 40%, 45%, 50%, 55%, 60%, 65%, 70%, 75%, 80%, 85%, 90%, 95%, or 100% compared to the control. Methods of detecting modulators of miR-15a Also, disclosed herein is a method of determining if a test agent is a modulator of miR-15a in a pancreatic ductal adenocarcinoma (PDAC) cell, in an in vitro assay, comprising, contacting a PDAC cell with one or more test agent(s), and measuring level of miR-15a expression in the PDAC cell compared to an untreated control or to miR-15a expression in the cell prior to contact with the one or more test agent(s), wherein a change in miR-15a expression indicates that the test agent is a modulator thereof. Some exemplary PDAC cell lines include UN-KC-6141, UN-KPC-960, UN-KPC-961, PK-45P, PK-59, T3M-4, PANC-1, KP4, and MIA PaCa-2. In some embodiments, the one or more agent(s) is a drug, a small molecule, or a chemical compound. In some embodiments, the in vitro assay is high-throughput. In some embodiments, an increase in the level of miR-15a expression compared to the untreated control or to miR-15a expression in the cell prior to contact with the one or more test agent(s) indicates that the one or more agent(s) is an miR-15a inducer. For example, the level of miR-15a can be increased by 5%, 10%, 15%, 20%, 25%, 30%, 35%, 40%, 45%, 50%, 55%, 60%, 65%, 70%, 75%, 80%, 85%, 90%, 95%, or 100% compared to the untreated control or to miR-15a expression in the cell prior to contact with the one or more test agent(s). In some embodiments, a decrease in the level of miR- 15a expression compared to the untreated control or to miR-15a expression in the cell prior to contact with the one or more test agent(s) indicates that the one or more agent(s) is an miR-15a inhibitor. For example, the level of miR-15a can be decreased by 5%, 10%, 15%, 20%, 25%, 30%, 35%, 40%, 45%, 50%, 55%, 60%, 65%, 70%, 75%, 80%, 85%, 90%, 95%, or 100% compared to the untreated control or to miR-15a expression in the cell prior to contact with the one or more test agent(s). Further disclosed herein, is a method of determining if a test agent is a modulator of miR- 15a in an in vivo model of pancreatic ductal adenocarcinoma (PDAC), comprising administering the one or more test agent(s) to the in vivo model of PDAC; and measuring level of miR-15a expression in pancreatic tissue obtained from the in vivo model of PDAC compared to an untreated control or to miR-15a expression in the in vivo model of PDAC prior to administering the one or more test agent(s), wherein a change in miR-15a expression indicates that the test agent is a modulator thereof.
Docket No.103361-544WO1 A number of embodiments of the disclosure have been described. Nevertheless, it will be understood that various modifications may be made without departing from the spirit and scope of the invention. Accordingly, other embodiments are within the scope of the following claims. By way of non-limiting illustration, examples of certain embodiments of the present disclosure are given below. EXAMPLES The following examples are set forth below to illustrate the compositions, devices, methods, and results according to the disclosed subject matter. These examples are not intended to be inclusive of all aspects of the subject matter disclosed herein, but rather to illustrate representative methods and results. These examples are not intended to exclude equivalents and variations of the present invention which are apparent to one skilled in the art. EXAMPLE 1: NUTRIENT RESTRICTION-ACTIVATED FRA-2 PROMOTES TUMOR PROGRESSION VIA IGF1R IN MIR-15A DOWNMODULATED PANCREATIC DUCTAL ADENOCARCINOMA Among the putative targets of miR-15a, Fos-related antigen-2 (hereafter, Fra-2) was identified as a promising player in the adaptive mechanism of PDAC to nutrient deprivation. Indeed, Fra-2 is a member of the Activator Protein-1 (AP-1) transcription factor family, that acts as an immediate early gene, rapidly activated as a result of a wide range of stimuli, including different kinds of cellular stress. For instance, exposure to ultraviolet irradiation and oxidative stress induce the AP-1 activation in fibroblasts that, in turn, prevents cell death. In both physiological and neoplastic models, Fra-2 activity has been involved in the regulation of autophagic flux, hypoxia, and in response to oxidative stress and DNA damage. In PDAC, Fra-2 overexpression is commonly observed and the Fra-2 consensus sequence represents one of the most accessible transcription factor binding motif in transformed pancreatic cells compared to the normal epithelium. In vitro, Fra-2 expression is strongly triggered by serum deprivation in PDAC cells. Collectively, this converging evidence supports a critical role of Fra- 2 in PDAC and in the stress response to nutrient shortage. Herein, the identification of miR-15a and its target Fra-2 I reported as main regulators of the IGF1 signaling pathway and the mechanism is described whereby they orchestrate the cell- stress adaptation to nutrient restriction in PDAC.
Docket No.103361-544WO1 RESULTS IGF1 signaling pathway is activated in response to nutrient deprivation in PDAC, via miR- 15a/Fra-2 axis To investigate the possible role of the onco-suppressor miR-15a in the PDAC adaptation to nutrient shortage, Fra-2 was selected as a promising miR-15a target. Belonging to AP-1 family, Fra-2 is a transcription factor acting as an immediate early gene in the cellular stress response to serum deprivation and its consensus sequence is one of the most accessible motifs in the chromatin of PDAC. To assess the relevance of this miR-15a/Fra-2 axis, the expression of miR-15a and Fra- 2 was explored in PDAC patients from the TCGA consortium. As already reported, low levels of miR-15a correlated with poor prognosis in PDAC patients (Figure 7A). In the same cohort, a shorter overall survival in PDAC patients with high expression of Fra-2 (Figure 7B) and a significant anti-correlation between miR-15a and Fra-2 levels was observed (Figure 7C). These findings show a functional role of miR-15a in the regulation of Fra-2 expression in PDAC. To validate that miR-15a was able to directly target Fra-2, the 3′UTR of Fra-2 containing the miR- 15a seed sequence was cloned into a luciferase (Luc) vector and observed that Luc activity was significantly decreased by miR-15a expression and rescued by miR-15a-binding site deletion (Figures 7D and 7E). Consistently, the ectopic overexpression of miR-15a significantly decreased Fra-2 levels in MIA PaCa-2 PDAC cells (Figure 7F-7H). Next, the molecular networks enriched by Fra-2 activity were explored in PDAC with low expression of miR-15a. A pathway enrichment analysis (via IPA software) was performed on the genes targeted by and inversely correlated with miR-15a expression in the PDAC cohort, obtaining 35 pathways possibly repressed by miR-15a (-log10(p-value) > 1.5) (Table 1). Similarly, by performing an IPA analysis of genes significantly correlated with Fra-2 levels, 317 molecular pathways were obtained that were activated by Fra-2 (-log10(p-value) > 1.5) (Table 1). To refine the research and identify molecular mediators of PDAC response to nutrient restriction, an in vitro experiment was set up and compared the transcriptomic landscape of AsPC-1 and MIA PaCa-2 PDAC cell lines, cultured either in presence (10% FBS, Normal serum, Ns) or in absence (0% FBS, nutrient deprivation, N-dep) of serum for 72 hours. Filtering the microarray data of gene expression (p-value < 0.01 and Fold-Change > 2.0) (Table 2) and performing an IPA analysis, 126 pathways were significantly enriched by N-dep in both PDAC cell lines (-log10(p-value) > 1.5) (Table 1). Finally, the in silico and in vitro data were intersected and 5 common pathways, significantly enriched by nutrient restriction, were identified and observed to be activated by Fra- 2 and repressed by miR-15a (Figure 1A).
Docket No.103361-544WO1 The insulin-like growth factor-1 (IGF1) signaling pathway was the chosen focus, given its relevant role in the response to cell stress and metabolic challenges and the established regulation of the IGF1 receptor (IGF1R) by the miR-15 family. Accordingly, querying the TCGA-PDAC dataset, miR-15a was confirmed to be inversely correlated with IGF1R levels (Figure 1B), whereas Fra-2 and IGF1R expression showed a strong positive correlation (Figure 1C). Overall, these results showed that the IGF1 signaling pathway is enriched due to nutrient restriction and that both Fra-2 and IGF1R are highly expressed in miR-15a downmodulated PDAC. miR-15a inversely correlates with its targets Fra-2 and IGF1R in human PDAC To validate these findings, the expression of genes of interest were assessed in an independent cohort of 38 PDAC patients (Tables 3 and 4). In this setting, tumors with low levels of miR-15a by qRT-PCR were characterized by high positivity of Fra-2 (Figure 1D) and IGF1R (Figure 1E), as assessed by immunohistochemistry. Accordingly, miR-15a stratified IGF1R and Fra-2 expression in PDAC: in fact, tumors from the miR-15a lower quartile (in black, Figure 1F) showed diffuse and intense positivity to both IGF1R and Fra-2 (Figure 1G), whereas tumors from the miR-15a upper quartile (Figure 1F) showed little/no expression of both Fra-2 and IGF1R (Figure 1G). In all PDAC samples, the percentage of Fra-2 positive cells was strongly associated with the co-expression of IGF1R (Figure 8A). As robustly assessed in the TCGA dataset, the independent cohort showed downmodulation of miR-15a (p-value 0.08, Figure 8B) and overexpression of Fra-2 (p-value 0.043, Figure 8C) and IGF1R (p-value 0.021, Figure 8D) correlated with shorter overall survival of PDAC patients. Fra-2 directly regulates IGF1R expression in PDAC response to nutrient deprivation Our findings showed that IGF1R modulation could be mediated by Fra-2 and miR-15a, functionally contributing to PDAC response in nutrient deprivation. To explore this, the expression of the genes of interest in a panel of PDAC cell lines was first evaluated (Figures 9A and 9B). In this setting, Fra-2 expression correlated with IGF1R levels (Figure 9A). Consistently with the knowledge that miR-15a is downmodulated in PDAC (Figure 9B), 3 out of 4 PDAC cell lines harbored a copy number alteration of MIR15A gene (Figure 9C). Then, PDAC cells were cultured in presence (10% FBS, Ns) or in absence of serum for 72 hours (0% FBS, N-dep) and assessed the expression of miR-15a, Fra-2 and IGF1R. Testing AsPC- 1, MIA PaCa-2 and Panc 2.3 PDAC cell lines, we observed that miR-15a levels remained
Docket No.103361-544WO1 substantially stable (Figure 9D and 9E), whereas Fra-2 and IGF1R expression significantly increased under N-dep in a time-dependent manner. Likely, Fra-2 and IGF1R upregulation were due to changes in the transcription rate since mRNA levels significantly increased under N-dep and the translational block with cycloheximide efficiently impaired protein accumulation in western blot analyses (Figures 2A-2D and 9G-9I). Similarly, Insulin Receptor Substrate 2 (IRS2), a direct interactor of IGF1R and member of the IGF1 signaling network, was also overexpressed in N-dep PDAC cell lines (Figures 9J-9L). By contrast, exposure to N-dep decreased the levels of activating phosphorylation of mTOR and its downstream effectors (p70S6K and S6) (Figure 2A, 2C, and 9G), representing critical drivers of cell proliferation and metabolic homeostasis, usually activated by IGF1R and inhibited by ATP reduction and amino acids unavailability. Aside from stress mediators, serum components and growth factors can drive AP-1 activation. Fra-2 and IGF1R expression was evaluated in PDAC cell lines upon different stimuli. However, the genes of interest did not display a univocal trend in AsPC-1 and MIA PaCa-2 cells (Figure 10). For instance, EGF, IGF1, insulin and glucose administration slightly increased Fra-2 and IGF1R in AsPC-1 (Figure 10A-10C), but not in MIA PaCa-2 cell line (Figures 10D-10F). This observation further corroborated the specific association between the expression of Fra-2 and activation of the IGF1R signaling pathway in the context of nutrient shortage. To assess whether the IGF1R and IRS2 upregulation directly depended on Fra-2 transcriptional activity, the upstream regions of IGF1R and IRS2 start codons were scanned, identifying an AP-1 binding motif (Figure 2E and 10G). Thus, performing chromatin immunoprecipitation assay (ChIP) (Figure 2E and 10G) and luciferase assay (Figures 11A and 11B), Fra-2 directly bound and activated IGF1R and IRS2 promoters and, importantly, Fra-2 activity was significantly increased by N-dep. Next, to test whether miR-15a could counteract IGF1R expression and activation in N- deprived PDAC cells, the levels of IGF1R were tested in miR-15a overexpressing and Fra-2 silenced cells (Figure 2F and 2G). Under basal conditions (Ns), AsPC-1 cells showed low levels of Fra-2 and neither miR-15a overexpression nor Fra-2 silencing affected IGF1R expression compared to the control (Figure 2G). However, when cells were cultured in N-dep, a significant overexpression of both Fra-2 and IGF1R was observed in control, but not in miR-15a overexpressing and Fra-2 silenced, cells (Figure 2G and 11C), confirming the inhibitory role of miR-15a on IGF1R expression, via Fra-2 targeting. To explore the significance of IGF1R overexpression in PDAC response to nutrient shortage, N-dep AsPC-1 cells were stimulated with IGF1 and the downstream activation of the IGF1R signaling was assessed. In control cells, IGF-1 stimulation induced an increase of IGF1R phosphorylation (p-IGF1R
T1161/1165/1166) that, in turn, restored levels of p-mTOR
S2448, p-
Docket No.103361-544WO1 p70S6K
T421/S424 and p-S6
S235/236 (Figures 2G and 11C). By contrast, miR-15a overexpressing and Fra-2-silenced AsPC-1 cells (Figures 2G and 11C) did not overexpress IGF1R in N-dep and, consequently, IGF1 administration did not increase the phosphorylated form of mTOR and its downstream interactors. Overall, the collected evidence supported that IGF1R overexpression relies on Fra-2 transcriptional activity and sustains mTOR pathway activation in nutrient deprived PDAC cells. This mechanism is counteracted by miR-15a via Fra-2 targeting (Figure 2H). miR-15a impairs PDAC cell growth during nutrient restriction, via Fra-2 targeting and IGF1R signaling downmodulation It is extensively reported in the literature that IGF1R and mTOR signaling play a critical function in cancer, promoting progression, growth and anoikis of neoplastic cells. Due to this, it was contemplated that IGF1R overexpression induced by Fra-2 could drive the progression of PDAC cells grown in nutrient shortage. To explore this possibility, the growing capability of control, miR-15a overexpressing and Fra-2 silenced AsPC-1 cells, cultured in normal serum (10% FBS, Ns) or under nutrient restricted conditions (2.5% FBS, N-res) for comparison. In Ns, miR- 15a overexpression reduced cell proliferation compared to control, whereas Fra-2 silencing resulted ineffective (Figure 3A). This observation was in line with the established knowledge that miR-15a inhibited several mediators of cell growth in PDAC and showed that Fra-2 targeting did not contribute to proliferation arrest, in the presence of nutrients. Conversely, when AsPC-1 cells were challenged with N-res, both miR-15a overexpression and Fra-2 silencing impaired cell proliferation compared to controls (Figures 3B and 3C). In this setting, the ectopic expression of IGF1R (Figure 11D) partially and fully rescued the proliferation rate of miR-15a overexpressing and Fra-2 silenced cells, respectively (Figures 3B and 3C). Accordingly, N-res cultured miR-15a overexpressing and Fra-2 silenced cells showed higher expression of the cell cycle inhibitor p27
kip1 and lower levels of Cyclin A compared to control cells, both rescued by concomitant ectopic expression of IGF1R (Figure 3D). Comparable results were observed when miR-15a overexpressing and Fra-2 silenced cells were evaluated in the ability to form colonies in N-res compared to controls in both anchorage- dependent (Figure 3E) and -independent (Figure 3F) assay. These phenotypes were all rescued by re-introducing IGF1R (Figure 11D), confirming that, in a nutrient restricted context, miR-15a overexpression impairs cell growth by targeting IGF1R via Fra-2 (Figure 3E and 3F).
Docket No.103361-544WO1 In vivo, protein-restricted diet induces Fra-2 and IGF1R overexpression and IGF1 signaling activation in Mir15a
KO PDAC To thrive and progress in a highly hypoxic and nutrient deprived microenvironment, PDAC cells can use amino acids to synthetize glutamine, thus reducing glucose dependency and fueling the cell metabolism. Consistently, amino-acids addition strongly reduced Fra-2 overexpression in N-dep cultured AsPC-1 and MIA PaCa-2 cells, while glucose did not exert this effect (Figure 12A). To validate these results in vivo, a reduced dietary protein intake was established in mice and the condition was evaluated to elicit a miR15a/Fra-2 dependent IGF1R signaling activation in PDAC, as observed in vitro. The Kras
LSL-G12D, Ptf1a
Cre-ERTM, Pten
flox (hereafter named KPP) inducible PDAC mouse model was crossbred with the Mir15a
KO mouse, obtaining the KPP/Mir15a
KO mice (hereafter named GL) (Figure 4A). Once tumors were induced by tamoxifen, KPP and GL mice were randomly distributed in two different cohorts, fed either with control diet (20% of proteins, C-diet), or with isocaloric, low protein diet (5% of proteins, LP-diet) (Figure 4A). Since KPP mice develop an aggressive disease with an average survival of 80 days from the induction, mice were sacrificed and PDAC analyzed after 60 days. LP-diet induced a remarkable wasting compared to C-diet, in both genotypes (Figure 12B). At the time of necroscopy, the tumor marker Krt19 was used to verify comparable levels of tumor burden among the collected pancreatic samples (Figure 12C). Analysis of the PDAC transcriptional landscape (n = 5 mice/group) showed significant differences in gene expression between KPP and GL in the C-diet group (Figure 4B and Table 5) (p-value < 0.05 and |Fold- Change| > 1.5). Interestingly, neither Fra-2 nor Igf1r were present among the dysregulated genes in GL- compared to KPP-PDAC in C-diet, suggesting that, in absence of stress stimuli, Fra-2 was inactive and did not induce Igf1r transcription regardless Mir15a status. Then, the impact of LP- diet on PDAC transcriptional profiles was analyzed. Intriguingly, GL-PDAC (n = 1637 genes) showed a higher number of dysregulated genes in response to LP-diet compared to KPP-PDAC (n = 509) (Figure 4C), whereas miR-15a was stably expressed in KPP-PDAC regardless of diet (Figure 12D). To investigate the specific contribution of Mir15a
KO in the PDAC response to LP- diet, the IPA analysis was performed on those genes specifically altered in GL-PDAC only (815 upregulated and 741 downregulated genes). LP-diet induced a profile of pathway enrichment highly consistent with findings in PDAC cells cultured in N-dep (e.g., IGF1 signaling, Ferroptosis signaling and EMT) (compare Figure 1A with Figure 4D), supporting that LP-diet may represent a valid approach to translate in vivo the phenotypes elicited in vitro by nutrient deprivation and
Docket No.103361-544WO1 confirming that loss of miR15a promoted an adaptive mechanism in PDAC, relying on growth factor signaling and metabolic switch (Figure 4D). In line with previous findings, GL-PDAC significantly overexpressed Fra-2 (Figure 4E) and, with regards to the IGF1 signaling pathway, Igf1r (Figure 4F), Irs2 (Figure 4G) and Mapk8 (Figure 12E) in response to LP-diet. By western blot analysis, IGF1R overexpression was confirmed in response to LP-diet and, although mTOR is generally inhibited by amino acid scarcity, high levels of phosphorylation of mTOR (S2448) and its downstream effectors ULK1 (S757), S6 (S235/236) and 4E-BP1 (T37/46) were also found, more prominently in GL-PDAC than in KPP-PDAC (Figure 4H and Figure 12F). Aiming to assess the impact of protein restriction on tumor progression, the morphology of pancreas was explored among the different cohorts of mice. KPP-PDAC histology showed that a large component of normal epithelium (CK19-) and pancreatic intraepithelial neoplasia (PanIN) (CK19+) was still present (≈40% of pancreatic tissue) (Figure 4I), whereas well-differentiated was more represented than poorly differentiated PDAC (CK19+) (≈40% and ≈13%, respectively). Notably, pancreatic phenotype was not affected by diet (Figures 12G and 12H). On the other side, GL-PDAC analysis displayed an increased transformation of pancreatic tissue with a minimal residual component of normal tissue and PanIN (≈14%), already in C-diet context (Figure 4I and Figure 12G). LP-diet promoted even further the tumor aggressiveness of this Mir15a
KO background, showing an increased neoplastic transformation and a higher percentage of poorly differentiated PDAC (Figures 4I, 12G, and 12H). Consistent with the proliferative phenotypes observed in vitro (Figure 3), LP-diet significantly inhibited the local aggressiveness of KPP-PDAC but not of GL-PDAC (Figure 12I). Overall, data collected in vivo demonstrated that Mir15a
KO favors tumor progression in nutrient restriction, pointing to a critical role of IGF1 signaling in the adaptive mechanisms of PDAC. In line with the current literature, LP-diet effectively reduced levels of circulating free IGF1 in both KPP and GL mice (Figure 13A). However, when PDAC were analyzed, no significant difference was found in IGF1 levels both at mRNA and protein levels (Figures 13B and13C). Collectively, these results showed that, at least in the tumor microenvironment, IGF1 bioavailability was not compromised by protein restricted diet and could still activate IGF1R overexpressing Mir15a
KO PDAC.
Docket No.103361-544WO1 miR-15a modulates autophagic flux via Fra-2 and IGF1R targeting in nutrient deprived PDAC cells In response to nutrient deprivation, Fra-2 and IGF1R were overexpressed in miR-15a downmodulated PDAC, eventually activating mTOR and its downstream effectors. Consequently, it was explored whether this axis could impact on the autophagy, a stress response mechanism frequently altered in PDAC and negatively regulated by mTOR phosphorylation of ULK1 on serine residue 757. Intriguingly, LP-diet induced a strong increase of phosphorylated ULK1
S757 and decrease of p62 levels in GL-PDAC but not in KPP-PDAC (Figures 4H and 12F), showing an impairment of the autophagic flux. To measure relevance at the morphological level, transmission electron microscopy (TEM) was used, and the intracellular vesicle compartment of the cell was observed under different nutrient contexts. When cultured under N-dep condition, control, miR-15a overexpressing and Fra-2 silenced cells presented an increasing number of vesicles with an ultrastructure compatible with autophagic vacuoles compared to their counterparts grown in Ns (Figure 5A and 5V). IGF1 administration significantly reduced autophagosomes in control, but not in miR-15a overexpressing and Fra-2 silenced AsPC-1 cells (Figure 5A, 5B, and 14A). An increase in autophagosomes may reflect either an active biosynthesis or an accumulation due to an autophagy inhibition. To elucidate these possibilities, the autophagic flux in our model was explored, using the inhibitor Bafilomycin A1. To this aim, a fluorescence assay was exploited using an LC3 construct tagged to mRFP-GFP tandem fluorescent proteins (ptfLC3), allowing the monitoring of phagosomes maturation: in an acidic environment, EGFP protein is quenched, whereas mRFP remains stable, allowing to distinguish if autophagic vesicles are or are not fused with lysosomes. Nutrient deprivation greatly decreased the number of autophagosomes fused with lysosomes, in all cell types, as expected. IGF1 release failed in increasing the percentage of LC3 puncta in miR-15a overexpressing and Fra-2 silenced cells compared to the controls (Figure 5C). Conversely, Bafilomycin A1 treatment restored the number of puncta (Figure 5C), showing that autophagic flux was intact in all conditions. Western blot analyses showed that IGF1 release increased p62 levels, the inhibitory phosphorylation of ULK
S757 and attenuated the conversion of LC3B-I to the autophagosome-associated LC3B-II form in N-dep cultured control cells but not in miR-15a overexpressing and Fra-2 silenced cells (Figure 5D, 5E, and 14B). By contrast, the re- introduction of IGF1R in miR-15a overexpressing and Fra-2 silenced cells rescued levels of phospho-ULK
S757 and LC3B-I when IGF1 was added (Figures 14C and 14D).
Docket No.103361-544WO1 Collectively, these experiments indicated that IGF1R upregulation contributes to the autophagy modulation in response to N-dep, and miR-15a impairs this mechanism via Fra-2 targeting. Fra-2 dictates sensitivity to IGF1R inhibition in nutrient deprived PDAC Next, it was explored whether the pharmacological inhibition of IGF1R could represent a valuable strategy to counteract PDAC progression. To exclude any effect caused by miR-15a targeting of unrelated genes, a more controlled model of CRISPR-Cas9 Fra-2 knockout (Fra-2
KO) AsPC-1 cells was generated, and their response to the small-molecule Linsitinib, a selective IGF1R inhibitor, was tested. In dose-response curves performed in presence of serum (Ns), wild-type and Fra-2
KO AsPC-1 cells displayed the same sensitivity to Linsitinib (Figure 15A). On the contrary, when cells were challenged with N-dep and then treated, only wild-type cells overexpressed IGF1R, becoming more sensitive to Linsitinib compared to Fra-2
KO cells (Figures 15B and 15C). Then, IGF1R re-expression in Fra-2
KO cells restored Linsitinib sensitivity (Figures 15B and 15C). These results demonstrated that, at least in vitro, N-dep induces a status more prone to IGF1R inhibition in Fra-2 proficient PDAC. To translate these observations in vivo, a xenograft mouse model of PDAC was exploited by injecting wild-type and Fra-2
KO AsPC-1 cells into the flank of nude mice (Figure 16A). Once tumors became palpable, we divided them in two groups fed with C-diet and LP-diet; then, after 3 days, mice were treated with Linsitinib (50 mg/kg, daily) or untreated for 3 weeks. At the endpoint, mice were sacrificed, and tumors were collected for further analyses. In the untreated mice, LP-diet reduced the tumor growth compared to the C-diet. However, this impairment was more evident in Fra-2
KO than in wild-type tumors (Figure 16B). Moreover, LP-diet induced the overexpression of both Fra-2 and IGF1R (Figure 6A and 16C) in wild-type but not in Fra-2
KO tumors, whereas miR-15a levels remained stable in both genotypes (Figure 16D). Western blot analyses showed that LP-diet significantly increased phosphorylation of mTOR, 4E-BP1, ULK1 and LC3B-I/II ratio in wild-type but not in Fra-2
KO tumors, suggesting a strong activation of the mTOR pathway and a modulation of the autophagic flux (Figures 6B, 16E, and 17A). When Linsitinib-treated tumors were analyzed, wild-type and Fra-2
KO tumors displayed a similar response to the inhibitor in mice fed with C-diet, consistent with their IGF1R expression levels (Figures 6C and 17B). On the contrary, LP-diet was found to significantly increase the drug sensitivity of wild-type compared to Fra-2
KO tumors (Figure 6C). Moreover, combination of LP-
Docket No.103361-544WO1 diet and Linsitinib administration significantly reduced cell proliferation of wild-type tumors (Figures 6D and 6E) and induced cleavage of PARP, resulting in or due to an increased apoptotic activity (Figures 6F and 17C). Overall, the in vivo results confirmed that Fra-2 controls IGF1R expression in response to nutrient deprivation in PDAC. Importantly, this mechanism could be effectively counteracted by administration of IGF1R-inhibitors. DISCUSSION The ability to thrive and progress in unfavorable conditions represent remarkable features of PDAC. Many observations in literature have reported that miR-15a is frequently dysregulated in PDAC, leading to uncontrolled cell growth, apoptosis inhibition and drug resistance. However, its role in PDAC adaptation to nutrient shortage is still largely unexplored. To fill this gap, the present disclosure investigates the miR-15a regulation of Fra-2, a transcription factor critically activated by stress stimuli and whose consensus sequence is one of the most accessible motif in the chromatin of PDAC compared to normal epithelium. The IGF1 signaling was found to be enriched in nutrient deprived PDAC cells (Figure 1A), whereas miR-15a expression inversely correlated with Fra-2 and IGF1R levels in PDAC patients (Figure 1B, 1D-1G, and 7C). In this context, miR-15a downmodulation unleashed Fra-2 expression and transcriptional activity, eventually leading to IGF1R upregulation. It is interesting to note that the in silico analyses in nutrient deprived cells showed an enrichment in other pathways possibly controlled by miR-15a and Fra-2 in PDAC (Figure 1A). In particular, ferroptosis signaling, a form of cell death resulting from elevated oxidative stress and finely tuned by PDAC cells, was also enriched in the genetic mouse model of Mir15a
KO PDAC under diet restriction (Figures 4C and 4D), further supporting the fact that miR15a loss shapes the adaptive phenotype of PDAC by acting at different levels. Focusing on the IGF1 signaling, Fra-2 transcriptional activity also involved IRS2, a direct IGF1R interactor (Figures 9J-L, 10G, and 11B). Due to this involvement, protein-restricted diet significantly increased Irs2 expression in Mir15a
KO murine tumors (Figure 4G). Collectively, these results support a complex portrait in which Fra-2 orchestrates the stress response in miR- 15a downmodulated PDAC, by regulating different key pathways and several effectors. To explore the findings in vivo, a genetic model of PDAC was exploited using Mir15a
KO mice, which develop a spontaneous but indolent form of lymphocytic malignancy only in the elderly (approximately 1.5 years of age). To circumvent this limit and avoid any phenotypic overlap, Mir15a
KO mice were crossbred with KPP mice, that generate rapidly growing, aggressive
Docket No.103361-544WO1 PDAC, with an average survival of 80 days. At this young age, Mir15a
KO mice do not show any lymphocytic lineage alteration. In response to nutrient shortage, IGF1R overexpression activated the mTOR pathway, attenuating the autophagic flux (Figures 2G, 5D,14C, and14D). This finding is largely supported by literature since, in in vitro models, miR-15a expression promotes autophagy by targeting Rictor, a component of the mTOR complex, whereas AP-1 family members inhibit autophagy of starved cells and IGF1R activity strongly correlates with reduced autophagy in breast cancer patients. On the other hand, the fact that PDAC cells reduced the autophagic flux when exposed to nutrient shortage may appear controversial, considering that autophagy represents an alternative source of nutrients for starved PDAC cells, fueling tumor growth. However, it is established that autophagy could also play an onco-suppressive role in PDAC, since autophagy restriction accelerates the early stages of transformation and tumor progression. Intriguingly, in the genetic mouse model, protein-restricted diet impaired the neoplastic transformation of pancreatic epithelium in Mir15a
WT but not in Mir15a
KO pancreata (Figures 4I, 12G, and 12H), in which Igf1r was overexpressed and the pro-autophagic ULK1 protein inhibited (Figures 4F and 4H). Moreover, it is reported that intensely activated autophagy could promote cell death in PDAC; thus, IGF1R overexpression in nutrient deprivation could also exert a protective function in neoplastic cells, preventing an excess of autophagy. Despite that combination of IGF1R inhibitor and chemotherapy has substantially failed as first line treatment in PDAC patients with metastatic disease, recent evidence indicates that IGF1R inhibition leads to autophagy dependence, increasing the sensitivity to autophagy inhibitors in preclinical model of PDAC. In fact, it is known that IGF1R contributes to the insurgence of resistance to multiple drugs in cancer . Here, IGF1R overexpression also represents a distinctive trait of the stress-tolerant phenotype mediated by Fra-2 in miR-15a downmodulated PDAC. This mechanism could also be elicited in vivo, since diet restriction significantly induced IGF1 signaling activation, only in Fra- 2 proficient tumors (Figures 6B and 16C). Thus, diet restriction as a valid method to sensitize PDAC to the administration of IGF1R inhibitors (Figure 6G), paving the way to assess whether this regimen would be tolerated in patients and whether miR-15a downmodulation could be used as a prognostic biomarker to identify tumors more prone to this therapeutic approach.
Docket No.103361-544WO1 MATERIALS AND METHODS Patient samples and study approval Specimens from 38 primary PDAC (Tables 3 and 4) were collected from patients who underwent surgery without receiving neoadjuvant therapy at Hepato-pancreato-biliary Surgery and Liver Transplantation Unit, University of Modena and Reggio Emilia, Modena, Italy. The study was approved by the Ethical Committee “Comitato Etico dell’Area Vasta Emilia Nord” of the University of Modena and Reggio Emilia, Italy (Prot. AOU #0019500/21), and by the Internal Review Board of The Ohio State University, USA (IRB #2018C0131). The experiments conformed to the principles set out in the WMA Declaration of Helsinki and the Department of Health and Human Services Belmont Report. Animal study approval All animal experiments were performed in compliance with institutional guidelines and approved by the Institutional Animal Care and Use Committee (IACUC) and the University Laboratory Animal Research at The Ohio State University. Cell biology experiments Cell culture, transfection and reagents Pancreatic cancer cell lines AsPC-1 (CRL-1682), MIA PaCa-2 (CRL-1420), Panc 2.3 (Panc 02.03 CRL-2553), PSN-1 (CRL-3211), and kidney embryonic cells HEK293 (293 [HEK- 293] CRL-1573) were purchased from the American Type Culture Collection (ATCC) and cultured in RPMI1640 or DMEM (only for MIA PaCa-2 cell line) medium (Sigma, USA) supplemented with 10% fetal bovine serum (FBS, Sigma, USA) and 1% Streptomycin/ampicillin solution (Sigma, USA). For transient transfection, FOSL2 siRNA (Product no. EHU072911), and control siRNA (scramble oligonucleotides; Product no. SIC001) were purchased from Sigma-Aldrich, USA (Mission esiRNA). Pre-miR-15a precursor (Assay ID PM10235), pre-miR Precursor Negative Control #2 (Cat# AM17111), were obtained from ThermoFisher Scientific, USA. IGF1R_pLX307 was a gift from William Hahn and Sefi Rosenbluh (plasmid # 98344, Addgene). ptfLC3 was a gift from Tamotsu Yoshimori (plasmid # 21074, Addgene). Lipofectamine 2000 (ThermoFisher Scientific, USA) transfection system was used following the manufacturer’s instructions for miR- 15a and IGF1R overexpression, ptfLC3 transfection and Fra-2 silencing in AsPC-1 cell line. Generation of stable Fra-2
KO clones To generate Fra-2 KO clones, CRISPR/Cas-9 technology was used. Stable AsPC-1 Fra- 2
KO pool was obtained by transduction with lentiviral particles (LV01 U6-gRNA:ef1a-puro-2A- Cas9-2A-tGFP, by Sigma-Aldrich).
Docket No.103361-544WO1 Dual-Luciferase reporter assay The predicted miR-15a-binding site of FOSL2/Fra-23’UTR were amplified by PCR using specific primers. PCR products were digested with XhoI and NotI (New England Biolabs, USA) and cloned downstream of Renilla luciferase gene of psiCHECK2 vector (Promega, USA). The mutant of FOSL2/Fra-2 3’UTR were generated using QuikChange II XL Site-Directed Mutagenesis Kit (Agilent, USA), according to the manufacturer’s protocol. HEK293 cells were co-transfected with 1 mg of psiCHECK2 constructs and 100 nM of pre-miR-15a precursor (Assay ID PM10235, ThermoFisher Scientific, USA) in 12-well plate using Lipofectamine 2000 (ThermoFisher Scientific, USA) according to manufacturer’s recommendations. After 24hr, Dual- Luciferase Assay (Promega, USA) was performed to measure the reporter activity. Primers are listed in Table 6. MTS cell proliferation, colony, soft agar assay, autophagy assay and dose-response curves In vitro experiments were performed essentially according to Rampioni et al. (Rampioni Vinciguerra, G. L. et al. Role of the miR-301a/Fra-2/GLIPR1 axis in lung cancer cisplatin resistance. Sig Transduct Target Ther 8, 1–4 (2023)) and Citron et al. (Citron, F. et al. miR-9 modulates and predicts the response to radiotherapy and EGFR inhibition in HNSCC. EMBO Mol Med 13, e12872 (2021)). Transmission electron microscopy and confocal microscopy For transmission electron microscopy (TEM) analysis, control, miR-15a overexpressing and Fra-2 silenced AsPC-1 cells were seeded in Lab-Tek
TM chamber slide system (Cat. #177429, ThermoFisher Scientific, USA) (150000 cells/well). The day after, medium was replaced, and cells were cultured in Normal serum (10% FBS) or in Nutrient deprivation (0% FBS). After 72 hours, cells in nutrient deprivation were released or not with IGF1 (80 ng/ml, 2 hours). Then, samples were immediately fixed with 2.5% glutaraldehyde in 0.1 M phosphate buffer for 30 minutes at room temperature. Samples were postfixed with 1% osmium tetroxide and then en bloc stained with 1% aqueous uranyl acetate, dehydrated in a graded series of ethanol, and embedded in Eponate 12 epoxy resin (Ted Pella Inc., CA). Ultrathin sections were cut with a Leica EM UC6 ultramicrotome (Leica microsystems Inc., USA). Images were acquired with an FEI Technai G2 Spirit BioTwin transmission electron microscope (Thermo Fisher Scientific, USA) operating at 80kV, and a Macrofire digital camera (Optronics, Inc., USA) and AMT image capture software (Advanced Microscopy Techniques, USA). At least 5 cells per condition were evaluated. For confocal microscopy, control, miR-15a overexpressing and Fra-2 silenced AsPC-1 cells were transfected with ptfLC3 construct and plated on coverslips, cultured in Normal serum (10% FBS) or in nutrient deprivation (0%FBS). After 72 hours, nutrient deprived cells were
Docket No.103361-544WO1 released or not with IGF1 (80 ng/ml, 2 hours) or Bafilomycin A1 (0.2 μM, 1 hour) and then immediately fixed in PBS 4% PFA for 10’. ptfLC3 expression was analyzed using Olympus FV1000 filter Confocal System microscope.7-12 cells per condition were evaluated. Molecular biology experiments Western blot analysis Protein lysates and Western blot were performed essentially according to Rampioni et al. (Rampioni Vinciguerra, G. L. et al. Role of the miR-301a/Fra-2/GLIPR1 axis in lung cancer cisplatin resistance. Sig Transduct Target Ther 8, 1–4 (2023)). Chromatin immunoprecipitation assay Chromatin preparation, immunoprecipitation and analyses were performed essentially according to Segatto et al. Segatto, I. et al. Loss of CDKN1B induces an age-related clonal hematopoietic disorder via Notch2 activity dysregulation. Cancer Communications. RNA isolation and quantitative Real-time PCR Total RNA was isolated, retro-transcribed and analyzed essentially according to Rampioni et al. (Rampioni Vinciguerra, G. L. et al. Role of the miR-301a/Fra-2/GLIPR1 axis in lung cancer cisplatin resistance. Sig Transduct Target Ther 8, 1–4 (2023)). Copy number variation Genomic DNA was isolated from PDAC cell lines using DNeasy Blood & Tissue Kit (Cat. #69504, Qiagen, USA) according to manufacturer’s recommendations. Copy number variation assay was performed on 10 ng of genomic DNA. Quantitative real-time polymerase chain reaction (PCR) TaqMan Copy Number Assay was performed using FAM-dye-labeled custom probe targeting miR-15a (Applied Biosystems, USA). TaqMan CNV reactions were performed in triplicate using as reference VIC-dye labeled TERT assay. In vivo experiments (GL generation and nude mice) KPP mice (Kras
LSL-G12D, Ptf1a
Cre-ERTM, Pten
flox) were purchased from The Jackson Laboratory, USA. GL model was generated crossbreeding KPP and Mir15a
KO mice. To evaluate the tumor growth and onset of PDAC cells, primary tumors were established by subcutaneous injection of 1.5 × 10
6 wild-type (17 mice) and Fra-2
KO (16 mice) AsPC-1 cells into the flanks of female athymic nude mice (The Jackson Laboratory, USA). Histological analysis and immunohistochemistry At the endpoint, mouse xenograft samples and abdominal organs from inducible PDAC mouse models were fixed in neutral buffered formalin 10% for 72 hours and processed for standard paraffin embedding. Histological sections (5 μm thick) were made from the paraffin blocks, deparaffinated with xylene, and stained with hematoxylin and eosin (H&E), according to standard
Docket No.103361-544WO1 procedures. Routine deparaffinization of PDAC human tissues and murine samples mounted on positive charge slides was carried out according to standard procedures, followed by rehydration through serial ethanol treatments. Slides were immersed in citrate buffer [0.01 M sodium citrate (pH 6.0)] and heated in a microwave oven at 600 W (three times for 5 min each) to enhance antigen retrieval. Endogenous peroxidase was blocked with 0.3% hydrogen peroxide in methanol for 30 min. Sections were immunostained with Fra-2 (Cat. #19967, Cell Signaling Technology, USA), IGF1R (Cat. #3027, Cell Signaling Technology, USA), Ki67 (Cat. #NBP2-54791, Novus Bio, USA) and CK-19 (Cat. #ab52625, Abcam, USA) antibodies according to manufacturer’s protocol and standardized procedures. Images were collected with Olympus microscope BX41. The histological evaluation of Fra-2 and IGF1R in PDAC human samples and Ki-67 expression in xenograft samples were assessed as the percentage of moderately/highly positive neoplastic cells counted in 5 random fields. Percentage of pancreatic phenotypes in KPP/GL mice was assessed substantially as described
46. All histological and immunohistochemical analyses were performed by two pathologists independently and a consensus was reached in the doubtful cases. Affymetrix microarray AsPC-1 cell lines were cultured in normal serum or in nutrient deprivation for 72 hours, RNA was collected and isolated with TRIzol
TM and RNA clean-up and concentration kit (Cat. #23600, Norgen Biotek Corp, Canada). Pancreatic cancer tissues were collected from GL and KPP mice fed with control or low protein diet and immediately homogenized with grinders in TRIzol
TM Reagent (Cat. #15596026, Invitrogen, USA). RNA was collected and isolated with TRIzol
TM and RNA clean-up and concentration kit (Cat. #23600, Norgen Biotek Corp, Canada). Total RNA was treated with RNase-free DNase I Kit (Cat. #25710, Norgen Biotek Corp, Canada), in order to avoid DNA contamination. Human transcriptome analysis was conducted on AsPC-1 samples obtained from three different transfection experiments and was performed with Clariom™ S Assay, Human (ThermoFisher Scientific, USA). Mouse transcriptome was carried out on five pancreatic cancer tissues from each mouse cohort and was performed with Clariom™ S Assay, Mouse (ThermoFisher Scientific, USA). Bioinformatics analyses Bioinformatics, survival and statistical analyses were performed essentially according to Rampioni et al. (Rampioni Vinciguerra, G. L. et al. Role of the miR-301a/Fra-2/GLIPR1 axis in lung cancer cisplatin resistance. Sig Transduct Target Ther 8, 1–4 (2023)).
Docket No.103361-544WO1 Reagents Bafilomycin A1 (Cat. #54645) was purchased from Cell Signaling Technology, USA. Linsitinib (OSI-906, Cat. #HY-10191) was obtained from MedChemExpress, USA. Puromycin (Cat. #A1113803), MEM Non-Essential Amino Acids Solution (100x) (Cat. #11140076), MEM Amino Acids Solution (Cat. #11130051) and Glucose Solution (Cat. #A2494001) were obtained from Gibco (ThermoFisher Scientific, USA). Recombinant human IGF1 protein (Cat. #RP00996), Recombinant human EGF protein (Cat. #RP01030) were purchased from ABclonal, USA. Insulin solution from bovine pancreas (Cat. #I0516) was purchased from Sigma-Aldrich, USA. Cycloheximide (Cat. #01810) was purchased from Sigma Aldrich, USA. Generation of stable Fra-2
KO clones To generate Fra-2 KO clones, CRISPR/Cas-9 technology was used. Stable AsPC-1 Fra- 2
KO pool was obtained by transduction with lentiviral particles (LV01 U6-gRNA:ef1a-puro-2A- Cas9-2A-tGFP, by Sigma-Aldrich). The gRNA to target FOSL2 was designed by Sigma-Aldrich AAGACCATTGGCACCACCG. Clones were selected after 72 hours from transduction in complete medium supplemented with 1μg/ml of puromycin. To obtain Fra-2
KO AsPC-1 clones, single-cell was seeded into 96-well plates. To obtain genomic DNA, cell pellets were resuspended in lysis solution (100 mM Tris-HCl [pH 8.0], 200 mM NaCl, 5 mM EDTA, 1% SDS, and 0.6 mg/ml proteinase K), and incubated at 55°C overnight. After ethanol and sodium acetate precipitation, DNA pellets were washed in 70% ethanol and resuspended in water. The DNA solution was incubated at 60 °C for 15 min and at least 1 hour at room temperature before proceeding. Genomic PCR was performed using Advantage 2 Polymerase Mix (Cat. #639202, Takara Bio USA Inc.,USA ) according to the manufacturer’s instruction, using 50ng of purified DNA. Sanger sequencing was performed on selected clones (primers are listed in Table 6) and data were analyzed with Synthego ICE software. The clones resulted KO were next confirmed by western blot analysis of Fra-2 expression. Cycloheximide assay, MTS cell proliferation, colony, soft agar assay, autophagy assay and dose-response curves Cycloheximide (CHX) assay was performed in AsPC-1 and MIA PaCa-2 cells cultured in nutrient deprivation (N-dep) for 72 hours. After 24 hours, 50 μg/ml of CHX were added to the medium. To evaluate the proliferation rate, AsPC-1 and stably overexpressing IGF1R AsPC-1 cells were transfected with control, miR-15a or sh-Fra-2 and, after 5 hours, were counted and seeded into 96-well plates (1000 cells/well) and maintained in normal serum (10% FBS, Ns) or in nutrient restriction (2.5% FBS, N-res) for 72 hours. Cell growth was monitored at the indicated timepoints
Docket No.103361-544WO1 using RealTime-Glo
TM MT Cell Viability assay (Cat. #G9713, Promega, USA). Colony formation assay was performed in AsPC-1 and stably overexpressing IGF1R AsPC-1 cells transfected with control, miR-15a or sh-Fra-2. Cells were counted and seeded into 6-well plates (1000 cells/well) and maintained in normal serum (10% FBS, Ns) or in nutrient restriction (2.5% FBS, N-res) for 9-12 days. Colonies were then fixed, stained with crystal violet solution (0.5 mg/ml in 20% methanol) and counted manually. To evaluate the anchorage-independent cell growth, AsPC-1 and stably overexpressing IGF1R AsPC-1 cells were transfected with control, miR-15a overexpressing or Fra-2 silenced and, after 5 hours, were counted (1000 cells) and resuspended in 2 ml top agar medium (RPMI, 0.4% low melting agarose, SIGMA) in normal serum (10% FBS, Ns) or in nutrient restriction (2.5% FBS, N-res) and quickly overlaid on a previously gelified bottom agar medium (RPMI + 10% FBS, 0.8% low melting agarose, SIGMA). This assay was performed in six-well tissue culture plates, in triplicate. After two weeks, the volume/number of colonies were counted in 5 randomly chosen fields (4x, magnification) using ImageJ software. Autophagosome assay was performed in control, miR-15a or Fra-2 silenced AsPC-1 cells, seeded into 96 well/plate (4000 cells/well) and cultured in N-dep (0% FBS). After 72 hours, cells were released or not with IGF1 (80 ng/ml, 2 hours) or Bafilomycin A1 (0.2 μM, 1 hour). Measurement of autophagosome fluorescence was performed using the Autophagy Assay kit (Cat. #MAK138, Sigma-Aldrich, USA), following the instructions provided by the manufacturer. To evaluate the sensitivity to Linsitinib (OSI-906, Cat. #HY-10191, MedChemExpress, USA), AsPC-1 parental cells, Fra-2
KO transfected or not with IGF1R were and seeded into 96- well culture plate and then were cultured in normal serum (Ns) (2500 cells/well) or in nutrient restriction (N-res) (4000 cells/well) for 72hr as indicated. Cell viability was assayed using CellTiter 96® AQueous One Solution Cell Proliferation Assay kit (Promega, USA). Molecular biology experiments Western blot analysis Pancreatic cancer cell lines were lysed in NP-40 cell lysis buffer (Cat. #J60766-AP, ThermoFisher Scientific, USA) supplemented with Protease Inhibitor Cocktail Set III, EDTA- Free – Calbiochem (Cat. #539134, Millipore, USA). PDAC murine samples were homogenized with grinders, on ice. Protein concentration was determined by Protein Assay Dye Reagent Concentrate (Cat. #5000006, Bio-Rad, USA), following the manufacturer’s instructions. Protein lysates were separated in 4-20% Criterion
TM TGX Stain-Free
TM Protein Gel (Cat. #5678094 and #5678095, Bio-Rad, USA) and transferred onto a nitrocellulose membrane (Hybond C, Amersham, UK). Membranes were incubated at 4°C overnight with the indicated primary antibodies: anti-β-Actin (Cat. #A228, Sigma-Aldrich, USA), anti-p-AKT (S473) (Cat. #9271, Cell
Docket No.103361-544WO1 Signaling Technology, USA), anti-Cyclin A (Cat. #sc-271682, Santa Cruz Biotechnology, USA), anti-Fra-2 human (Cat. #19967, Cell Signaling Technology, USA), anti-Fra-2 mouse (Cat. #HPA004817, Sigma-Aldrich, USA), anti-GAPDH (Cat. #GTX100118, Genetex, USA), anti- IGF1 (Cat. #73034, Cell Signaling Technology, USA), anti-IGF1R (Cat. #9750, Cell Signaling Technology, USA), anti-p-IGF1R (T1161/1165/1166) (Cat. #ABE332, Millipore Sigma, USA), anti-LC3A/B (Cat. #12741, Cell Signaling Technology, USA), anti-mTOR (Cat. #2983, Cell Signaling Technology, USA), anti-p-mTOR (S2448) (Cat. #2971, Cell Signaling Technology, USA), anti-Cleaved PARP (D214) (Cat. #9541, Cell Signaling Technology, USA), anti-p27 (Cat. #554069, BD Biosciences, USA) anti-p70S6K (Cat. #2708, Cell Signaling Technology, USA), anti-p-p70S6K (T421/S424) (Cat. #9204, Cell Signaling Technology, USA), anti-pS6 (S235/236) (Cat. #4858, Cell Signaling Technology, USA), anti-S6 (Cat. #2217, Cell Signaling Technology, USA), anti-ULK1 (Cat. #8054, Cell Signaling Technology, USA), anti-p-ULK1 (S757) (Cat. #14202, Cell Signaling Technology, USA), anti-Vinculin (Cat. #18058, Abcam, UK), anti-4E- BP1 (Cat. #9644, Cell Signaling Technology, USA), anti-p-4E-BP1 (T37/46) (Cat. #2855, Cell Signaling Technology, USA). After incubation with appropriate horseradish peroxidase-conjugated secondary antibodies (Cat. #NA931V and #NA934V, GE Healthcare, USA), signal was detected using Immobilon Forte HPR detection reagent (Cat. #WBLUF0500, Millipore, USA). Densitometry plots and signal intensity quantification were obtained using ImageJ software (U. S. National Institutes of Health, Bethesda, Maryland, USA). Chromatin immunoprecipitation assay AsPC-1 and MIA PaCa-2 cell lines cultured in normal serum (10% FBS) and nutrient deprivation (0%FBS) for 72 hours were crosslinked with 1% formaldehyde (Cat. #F79-500, Fisher Chemicals, USA) and chromatin was prepared using MNase enzymatic digestion according to the protocol. Chromatin immunoprecipitation (ChIP) was performed using SimpleChIP Enzymatic Chromatin ImmunoPrecipitation Kit (Magnetic Beads, Cat. #9005S, Cell Signaling Technology, USA). The obtained chromatin samples were incubated at 4°C overnight with the following antibodies: normal rabbit IgG (Cat. #2729, Cell Signaling technology, USA), anti-Fra-2 (Cat. #19967, Cell Signaling Technology, USA) and anti-H3 (Cat. #4620, Cell Signaling Technology, USA) as positive control. Immunoprecipitated chromatin was purified and analyzed by the real- time quantitative PCR using SimpleChIP Universal qPCR Master Mix (Cat. #88989, Cell Signaling Technology, USA). Data were analyzed with the fold enrichment method compared to an unrelated antibody (normal rabbit IgG). Primers used to amplify the indicated IGF1R and IRS2 promoters are listed in Table 6.
Docket No.103361-544WO1 RNA isolation and quantitative Real-time PCR Total RNA was isolated from cell lines and murine samples using TRIzol
TM Reagent (Cat. #15596026, Invitrogen, USA), following the instructions provided by the manufacturer. Pancreatic cancer and liver tissues from mice were fragmented with grinders on ice. RNA was retro-transcribed using the High-Capacity cDNA Reverse Transcription Kit (Cat. #4368813, Applied Biosystems, ThermoFisher Scientific, USA). For miR-15a analysis on our cohort of patients, RNA was extracted from paraffin-embedded PDAC samples using RecoverAll
TM Total Nucleic Acid Isolation (Cat. #AM1975, Invitrogen by ThermoFisher Scientific, USA), according to the manufacturer’s instructions. For qRT-PCR, TaqMan® miRNA assay (Assay ID 000389, ThermoFisher Scientific, USA) was used to detect mature miR-15a-5p. RNU44 (Assay ID 001094, ThermoFisher Scientific, USA) and snoRNA234 (Assay ID 001234, ThermoFisher Scientific, USA) were used as normalizers for human and mouse samples, respectively. TaqMan® gene expression assays (ThermoFisher Scientific, USA) were used to detect mRNA expression of: human FOSL2/Fra-2 (Assay ID Hs01050117_m1), human IGF1R (Assay ID Hs00609566_m1), human IRS2 (Assay ID Hs00275843_s1), mouse Fosl2/Fra-2 (Assay ID Mm0048442_m1), mouse Igf1r (Assay ID Mm00802831_m1), mouse Irs2 (Assay ID Mm03038438_m1), mouse Mapk8 (Assay ID Mm00489514_m1), mouse Igf1 (assay ID Mm00439560_m1) and mouse Krt19 (Assay ID Mm00492980_m1). Human ACTB (Assay ID Hs03023943_g1) and mouse Pgk1 (Assay ID Mm00435617_m1) were used as normalizers. Dual-Luciferase reporter assay The predicted Fra-2 binding sequences on IGF1R and IRS2 promoter were amplified by PCR using specific primers. After digestion with NheI and XhoI (New England Biolabs), PCR products were cloned into pGL3-promoter vector (Promega). The mutants of Fra-2 binding sequence on IGF1R and IRS2 promoter were generated using QuikChange II XL Site-Directed Mutagenesis Kit (Agilent), according to the manufacturer’s protocol. AsPC-1 cells were co- transfected with 1 mg of pGL3-promoter constructs and 100 ng of pRL-TK (Renilla luciferase control reporter, Promega) in 12-well plate using Lipofectamine 2000 (Life Technologies) according to manufacturer’s recommendations. After 4 hours from transfection, cells were cultured in normal serum (10% FBS) or in nutrient deprivation (0% FBS). After 72hr, Dual- Luciferase Assay (Promega) was performed to measure the reporter activity. Primers are listed in Table 6.
Docket No.103361-544WO1 In vivo experiments (GL generation and nude mice) KPP mice (Kras
LSL-G12D, Ptf1a
Cre-ERTM, Pten
flox) were purchased from The Jackson Laboratory, USA. GL model was generated crossbreeding KPP and Mir15a
KO mice. GL mice were viable, efficiently reproduced, and, at birth, had no macroscopic abnormalities. Correct Mendelian ratios were observed among littermates. At 6-8 weeks of age, KPP and GL mice were injected 3x times, one every other day, with 9 mg/40 gr of Tamoxifen (Cat. #S1238, Selleckchem, USA) resuspended in corn oil (Cat. #S6701, Selleckchem, USA). After the induction, mice were randomly distributed in two different cohorts, fed with either control diet (C-diet, TD.91352, Envigo, USA) or low protein diet (LP-diet, TD.99168, Envigo, USA) for 60 days as described (Figure 4A). At the endpoint, mice fasted for 4 hours and blood samples were collected in EDTA-coated tubes through intracardiac bleed. Complete blood samples were further centrifuged, and sera were used to assess the circulating levels of IGF1 with Mouse/Rat IGF1 Quantikine ELISA kit (Cat. #MG100, R&D Systems, USA) according to the manufacturer’s protocol. To evaluate the tumor growth and onset of PDAC cells, primary tumors were established by subcutaneous injection of 1.5 × 10
6 wild-type (17 mice) and Fra-2
KO (16 mice) AsPC-1 cells into the flanks of female athymic nude mice (The Jackson Laboratory, USA). At the tumor onset (Day 0), mice were randomly distributed in two different cohorts, fed with either control diet (C- diet, TD.91352, Envigo, USA) or low protein diet (LP-diet, TD.99168, Envigo, USA) for 3 weeks as described (Fig.16a). At days 4 after the tumor onset, mice were further distributed in two groups treated orally and daily with 50 mg/kg of Linsitinib (OSI-906, Cat. #HY-10191, MedChemExpress, USA) dissolved in a 25 mM tartaric acid solution (Cat. #HY-Y0293, MedChemExpress, USA) or with vehicle alone. Growth of primary tumors was monitored by measuring tumor width (W) and length (L) with a caliper two times per week and calculating tumor volume based on the formula: Tumor volume (mm3) = (W
2 × L)/2. Bioinformatics analyses Genes (fragments per kilobase of exon per million mapped fragments - FPKM) and miRNA isoforms (reads per million mapped reads or counts per million mapped reads - RPM) L3 expression data, along with patients' clinical (e.g., patient survival) data from the TCGA-PDAC dataset, were downloaded from the Genomic Data Commons Data Portal (portal.gdc.cancer.gov). In this work, a cumulative expression for hsa-miR-15a-5p was considered and generated by the contribution of all miRNA isoforms having up to one nucleotide added at 5'-end. As quality control, levels of tumor purity in TCGA samples were evaluated and leveraged using the
Docket No.103361-544WO1 ESTIMATE method. Differences in the amount of neoplastic cells in relation to miR-15a expression were excluded. The analysis for Clariom S Human Affymetrix panel (of ~21K genes) was carried out by Transcriptome Analysis Console (TAC) software (v4 - ThermoFisher Scientific) and consisted of three main steps: 1) data quality control; 2) normalization (signal space transformation robust multiple-array average); 3) differentially expression analysis employing the eBayes method from limma R package included in TAC software. Upregulated genes with a Fold-Change>2.0 and a p value <0.01 were considered for the downstream analyses. The analysis of the Clariom™ S Mouse Affymetrix panel (of ~22K genes) followed the same steps described above. Differential expressed genes with |Fold-Change|>1.5 and p value<0.05 were considered for the downstream analyses. Predicted target genes for miR-15a-5p, considered in Figure 1A, were taken from the TargetScan tool (v7.2). Functional enrichment analyses were performed by using an Ingenuity Pathway Analysis (IPA) software (v90348151). Settings used included experimentally observed data for the human species for the enrichment analyses present in Figure 1A and observed data for the mouse species for the enrichment analyses present in Figure 4D. The heat map presented in Figure 4B was generated by using the pheatmap (v1.0.12) R (v4.2.2) package. Survival and statistical analysis Survival analysis of the TCGA dataset and the independent cohort of PDAC. miR-15a, Fra-2 and IGF1R expression levels were obtained by The Cancer Genome Atlas (TCGA) from 176 PDAC tissue samples. The expression levels of miR-15a, Fra-2 and IGF1R was assessed by qRT-PCR and IHC staining in an independent cohort of 38 PDAC tissue samples. In 1 case, clinical information was not available and the patient was excluded from survival analysis. For each cohort, the Kaplan–Meier method was performed to generate survival curves and the statistical significance of the difference between survival curves of high- vs. low-expression groups was evaluated using the log-rank test. The cut-off point for the two groups was changed iteratively, and the cut-off that reached the most significant p-value was selected. Graphs and statistical analyses were performed using PRISM (version 9, GraphPad, Inc.). In all experiments, differences were considered significant when p-value was < 0.05. Statistical analyses including Kaplan–Meyer survival analyses, paired and unpaired t-tests, Mann–Whitney unpaired t-test and Spearman correlation test and two-way ANOVA test were used as appropriate and as specified in the legend of each figure.
Docket No.103361-544WO1 It will be apparent to those skilled in the art that various modifications and variations can be made in the present disclosure without departing from the scope or spirit of the invention. Other embodiments of the disclosure will be apparent to those skilled in the art from consideration of the specification and practice of the methods disclosed herein. It is intended that the specification and examples be considered as exemplary only, with a true scope and spirit of the invention being indicated by the following claims.
 Table 2A. List of significantly overexpressed genes in the AsPC-1 cell line cultured in nutrient deprivation compared to normal serum (p-value < 0.01 and Fold-Change > 2.0).
 Table 2B. List of significantly overexpressed genes in the MIA PaCa-2 cell lines cultured in nutrient deprivation compared to normal serum (p-value < 0.01 and Fold-Change > 2.0).
 Docket No.103361-544WO1 Table 3. Summary of the available clinical features of the independent cohort of 38 PDAC patients. (PD, pancreaticoduodenectomy (Whipple procedure); PPPD, pylorus-preserving pancreaticoduodenectomy (Traverso-Longmire procedure); DSP, distal splenopancreatectomy; SP, splenopancreatectomy).
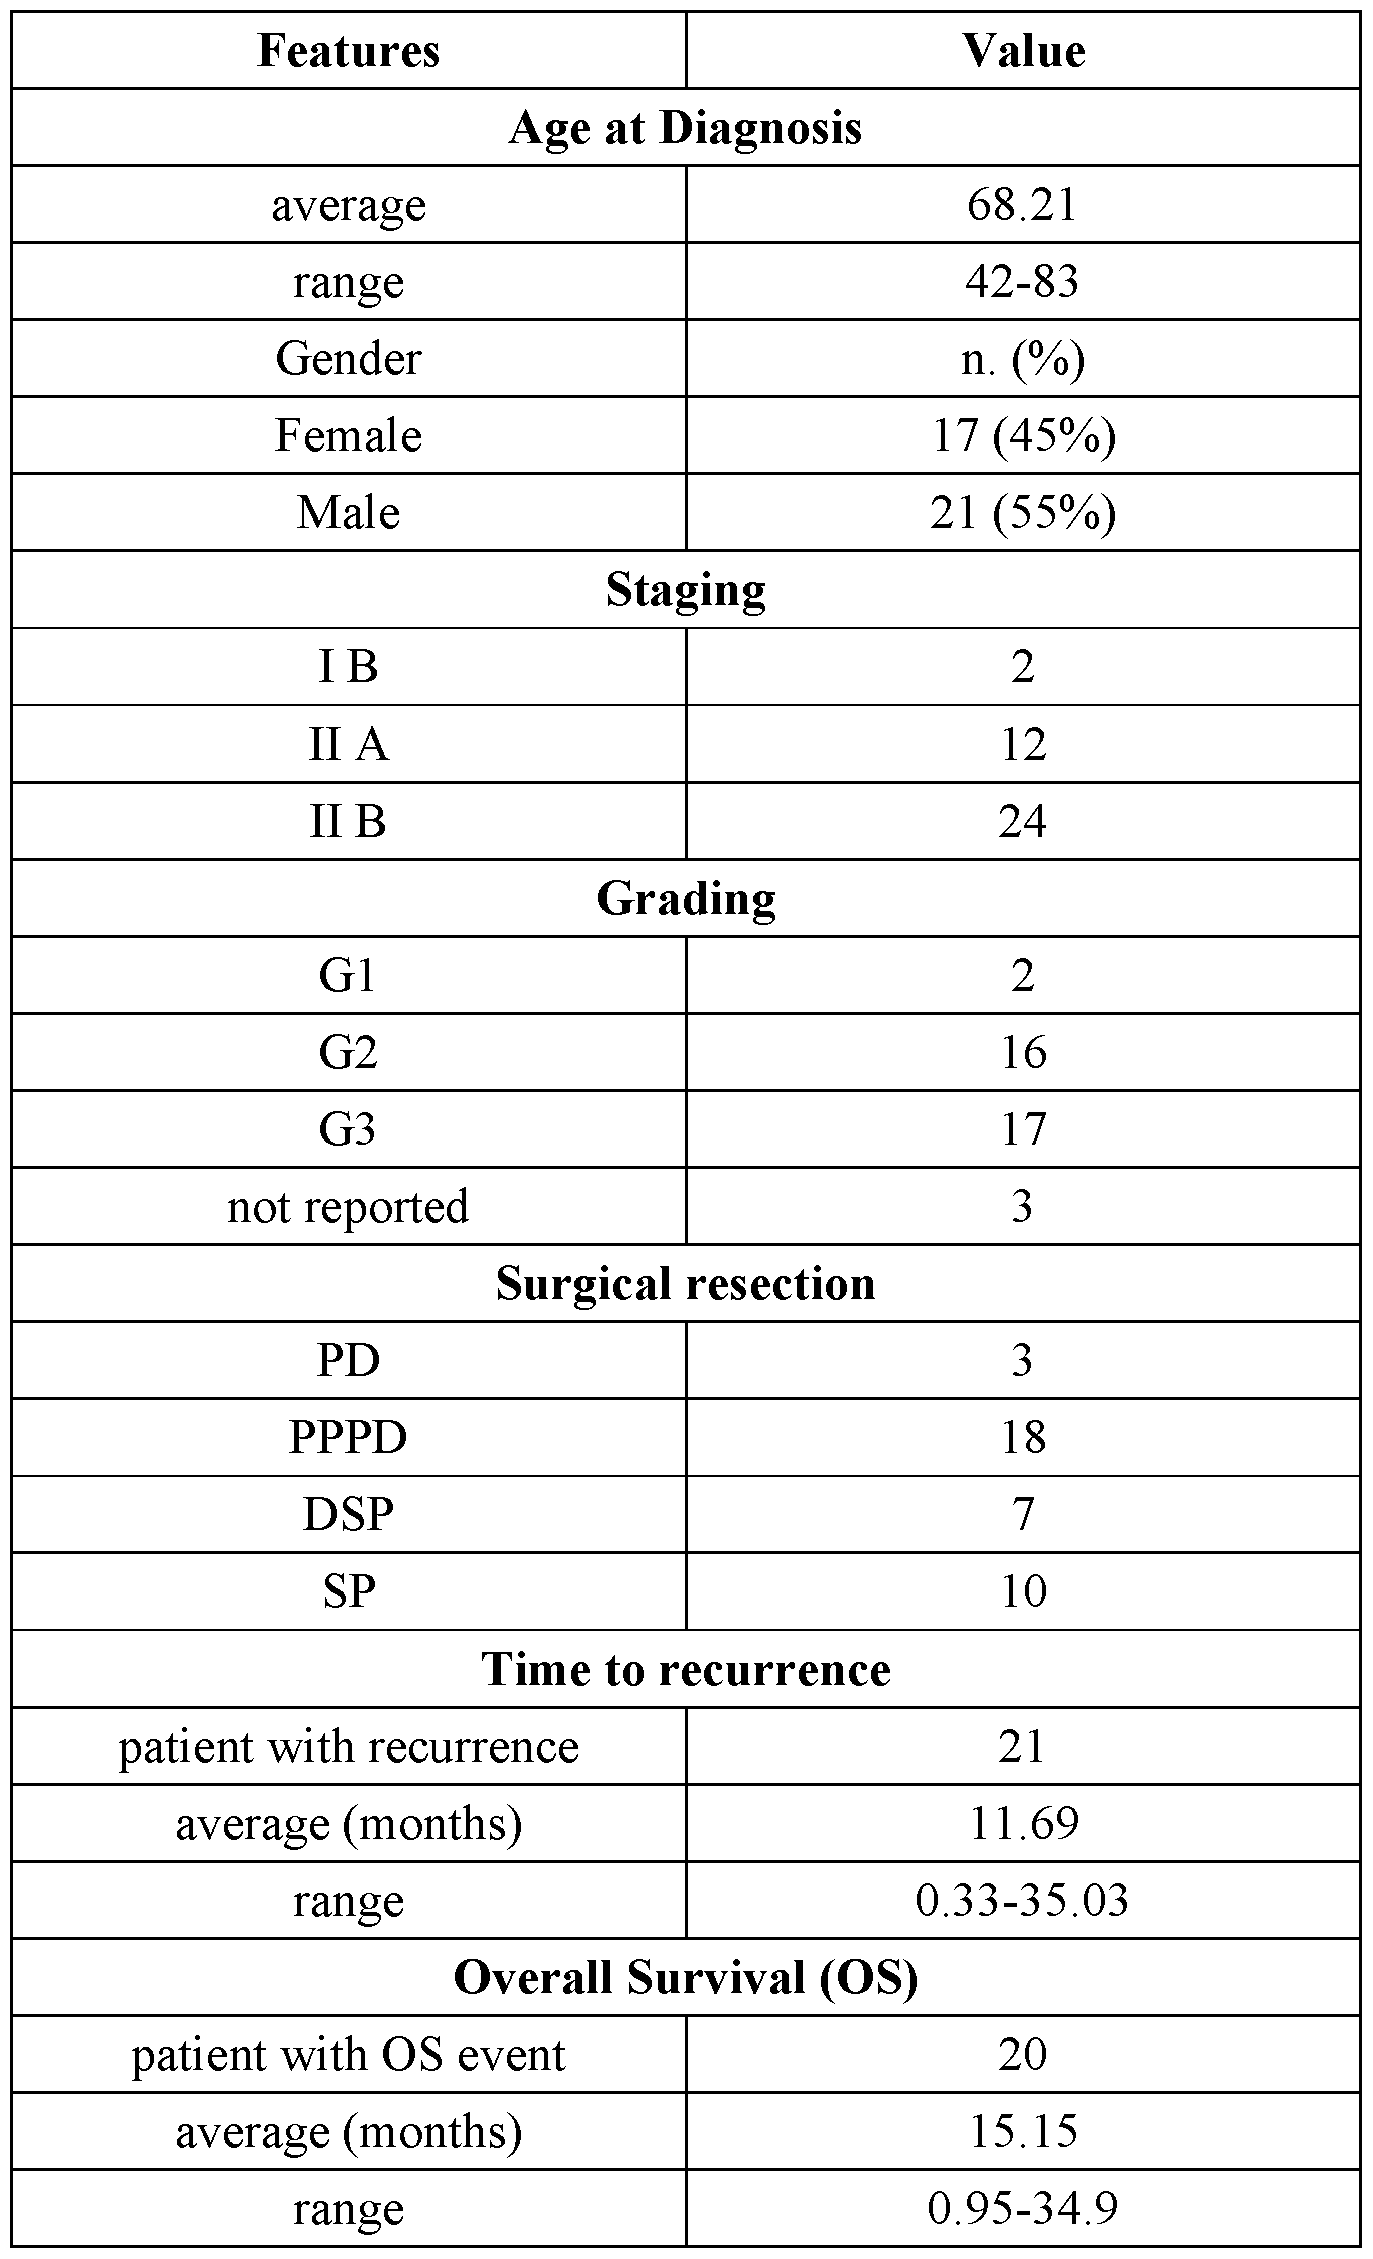 Docket No.103361-544WO1 Table 4. The individual clinical features and the expression of miR-15a (by qRT-PCR), Fra-2 and IGF1R (by IHC staining) in tumor samples of each patient included in the independent cohort. Fra-2 and IGF1R levels are expressed as percentage of positive tumor cells.
 Docket No.103361-544WO1 Table 4 (con’t)
 Docket No.103361-544WO1 Table 5. List of differentially expressed genes in PDAC from KPP and GL-mice fed with Control diet (n=5 mice per group, p-value<0.05 and |Fold-Change|>1.5).
 Table 6. The primers were designed as described in the materials and methods section.
