WO2025009381A1 - 異常検出装置、異常検出システム及び異常検出方法 - Google Patents
異常検出装置、異常検出システム及び異常検出方法 Download PDFInfo
- Publication number
- WO2025009381A1 WO2025009381A1 PCT/JP2024/021994 JP2024021994W WO2025009381A1 WO 2025009381 A1 WO2025009381 A1 WO 2025009381A1 JP 2024021994 W JP2024021994 W JP 2024021994W WO 2025009381 A1 WO2025009381 A1 WO 2025009381A1
- Authority
- WO
- WIPO (PCT)
- Prior art keywords
- embedding
- information
- anomaly detection
- machine learning
- learning model
- Prior art date
- Legal status (The legal status is an assumption and is not a legal conclusion. Google has not performed a legal analysis and makes no representation as to the accuracy of the status listed.)
- Ceased
Links
Images






Classifications
-
- G—PHYSICS
- G06—COMPUTING OR CALCULATING; COUNTING
- G06F—ELECTRIC DIGITAL DATA PROCESSING
- G06F11/00—Error detection; Error correction; Monitoring
- G06F11/07—Responding to the occurrence of a fault, e.g. fault tolerance
-
- G—PHYSICS
- G06—COMPUTING OR CALCULATING; COUNTING
- G06F—ELECTRIC DIGITAL DATA PROCESSING
- G06F11/00—Error detection; Error correction; Monitoring
- G06F11/30—Monitoring
- G06F11/34—Recording or statistical evaluation of computer activity, e.g. of down time, of input/output operation ; Recording or statistical evaluation of user activity, e.g. usability assessment
-
- G—PHYSICS
- G06—COMPUTING OR CALCULATING; COUNTING
- G06N—COMPUTING ARRANGEMENTS BASED ON SPECIFIC COMPUTATIONAL MODELS
- G06N20/00—Machine learning
Definitions
- the present invention relates to an anomaly detection device, an anomaly detection system, and an anomaly detection method.
- microservices architecture a development methodology known as "microservices architecture” is gaining attention as a way to streamline application development. Unlike traditional monolithic architectures in which all functions and components are integrated into a single code base, microservices architecture breaks down the functions of an application into small “services,” with each service connecting through an API. Compared to traditional monolithic approaches, microservices are more scalable and flexible, allowing for the construction of flexible, scalable systems and the realization of efficient software development and operation.
- microservices architectures become more widespread along with cloud computing, distributed system architectures, and CI/CD (Continuous Integration/Continuous Delivery), it is becoming increasingly important to monitor applications and detect anomalies.
- CI/CD Continuous Integration/Continuous Delivery
- Patent Document 1 discloses a method for detecting anomalies using a log that records events that occur in an application during a predetermined period of time.
- Patent Document 1 discloses a technology that "This patent application discloses a system and method for processing log data from heterogeneous systems, applications, sensors, or instruments. It receives heterogeneous logs from any unknown system or application, generates regular expression patterns from heterogeneous log sources using machine learning, and extracts log patterns. It also generates models and profiles from training logs based on different conditions and updates a global model database that stores all generated models over time.
- Patent document 1 describes a method for detecting abnormal behavior that occurs in an application by training a machine learning model using log data that records the behavior of the application.
- telemetry information includes not only log data but also metric and trace information. Traces with graph characteristics indicate interactions between services, and metrics with time characteristics indicate dependencies within services, so it is desirable to analyze them together with log data in order to gain insight into the behavior of the entire application.
- no anomaly detection method has been provided that takes into account all of logs, metrics, and traces.
- the present disclosure therefore aims to provide an anomaly detection method that can detect anomalies in microservices with high accuracy by generating a machine learning model that takes into account the characteristics of logs, metrics, and traces in telemetry information.
- a representative anomaly detection device of the present invention includes a processor and a memory, and the memory includes a telemetry information acquisition unit that acquires first telemetry information from a first set of microservices, the first telemetry information including log information including a log indicating the behavior of the microservice, trace information including a trace indicating the relationship between multiple microservices, and metric information including a metric indicating a measurement value related to the performance of the microservice; an embedding generation unit that processes learning telemetry information extracted from the first telemetry information using a neural network to generate trace embeddings corresponding to the trace information, log embeddings corresponding to the log information, and metric embeddings corresponding to the metric information; a model generation unit that generates a machine learning model for anomaly detection that determines the presence or absence of an anomaly in the microservice based on the trace embedding, the log embedding, and the metric embedding; and a processing instruction for causing the processor to function as
- FIG. 1 illustrates a computer system for implementing an embodiment of the present disclosure.
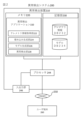
- FIG. 2 is a diagram illustrating an example of a configuration of an anomaly detection system according to an embodiment of the present disclosure.
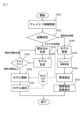
- FIG. 3 is a diagram showing an overall flow of the abnormality detection means according to an embodiment of the present disclosure.
- FIG. 4 is a diagram illustrating a flow of a model generation process in a model generation stage according to an embodiment of the present disclosure.
- FIG. 5 is a diagram illustrating a flow of an anomaly detection process in the anomaly detection stage according to an embodiment of the present disclosure.
- FIG. 6 is a diagram illustrating an example of an operation for generating a machine learning model for anomaly detection according to an embodiment of the present disclosure.
- FIG. 1 illustrates a computer system for implementing an embodiment of the present disclosure.
- FIG. 2 is a diagram illustrating an example of a configuration of an anomaly detection system according to an embodiment of the present disclosure.
- FIG. 3 is a diagram showing an overall flow of the
- FIG. 7 illustrates an example process for generating embeddings for a trace according to an embodiment of the present disclosure.
- FIG. 8 illustrates an example process for generating an embedding for a metric according to an embodiment of the present disclosure.
- FIG. 9 is a diagram illustrating an example process for generating embedding for a log according to an embodiment of the present disclosure.
- FIG. 10 is a diagram illustrating an example of the operation of an aggregation layer according to an embodiment of the present disclosure.
- FIG. 11 is a diagram illustrating an example of a configuration of a neural network that functions as a machine learning model for anomaly detection according to an embodiment of the present disclosure.
- FIG. 12 is a diagram illustrating an example of a process for storing and acquiring a machine learning model for anomaly detection according to an embodiment of the present disclosure.
- FIG. 13 is a diagram illustrating an example of a logical database schema of a model DB according to an embodiment of the present disclosure.
- FIG. 14 is a diagram illustrating an example of an anomaly detection management screen according to an embodiment of the present disclosure.
- FIG. 15 is a diagram illustrating an example of a cloud computing environment according to an embodiment of the present disclosure.
- An anomaly detection means relates to generating a machine learning model capable of detecting anomalies and causes of anomalies in telemetry information based on embeddings capturing respective features of metrics, logs, and traces included in telemetry information related to a microservice.
- the anomaly detection means may include a telemetry information acquisition process for acquiring telemetry information from the microservice, a model generation process for generating a machine learning model for anomaly detection based on the acquired telemetry information, and anomaly detection process for detecting anomalies in the microservice using the machine learning model for anomaly detection thus generated.
- the telemetry information acquisition process is a process for acquiring telemetry information from microservices, and may be performed using existing methods such as Loki (registered trademark), Prometheus (registered trademark), and Tempo (registered trademark), which acquire log files, metrics, and traces.
- the model generation process is a process for generating a machine learning model using embeddings that capture the respective features of the metrics, logs, and traces acquired by the telemetry information acquisition process.
- the "embedding” here refers to a data structure that represents the respective features of the metrics, logs, and traces in a low-dimensional space, and may include, for example, continuous vectors or graph representations.
- the features for generating the embeddings may be selected by methods such as PCA (Principal Component Analysis), Mutual Information, or SHAP (Shapley Additive exPlanations).
- the anomaly detection process is a process for detecting anomalies in a microservice by analyzing telemetry information using a machine learning model for anomaly detection generated by the model generation process.
- the machine learning model for anomaly detection may generate anomaly detection results indicating the probability that an anomaly exists in a specified microservice, and output the results to a user.
- the anomaly detection means of the embodiment of the present disclosure by training a machine learning model using embeddings that capture features in logs, metrics, and traces, it is possible to obtain a machine learning model for anomaly detection that is capable of detecting a wide range of anomalies that take into account various aspects of a microservice.
- the main components of the computer system 100 include one or more processors 102, memory 104, a terminal interface 112, a storage interface 113, an I/O (input/output) device interface 114, and a network interface 115. These components may be interconnected via a memory bus 106, an I/O bus 108, a bus interface unit 109, and an I/O bus interface unit 110.
- Computer system 100 may include one or more general purpose programmable central processing units (CPUs) 102A and 102B, collectively referred to as processors 102. In some embodiments, computer system 100 may include multiple processors, and in other embodiments, computer system 100 may be a single CPU system. Each processor 102 executes instructions stored in memory 104 and may include an on-board cache.
- CPUs general purpose programmable central processing units
- memory 104 may include random access semiconductor memory, storage devices, or storage media (either volatile or non-volatile) for storing data and programs. Memory 104 may store all or a portion of the programs, modules, and data structures that implement the functions described herein. For example, memory 104 may store anomaly detection application 150. In some embodiments, anomaly detection application 150 may include instructions or descriptions that execute on processor 102 the functions described below.
- anomaly detection application 150 may be implemented in hardware via semiconductor devices, chips, logic gates, circuits, circuit cards, and/or other physical hardware devices instead of or in addition to a processor-based system. In some embodiments, anomaly detection application 150 may include data other than instructions or descriptions. In some embodiments, cameras, sensors, or other data input devices (not shown) may be provided to communicate directly with bus interface unit 109, processor 102, or other hardware of computer system 100.
- Computer system 100 may include a bus interface unit 109 that provides communication between processor 102, memory 104, display system 124, and I/O bus interface unit 110.
- I/O bus interface unit 110 may be coupled to an I/O bus 108 for transferring data to and from various I/O units.
- I/O bus interface unit 110 may communicate via I/O bus 108 with multiple I/O interface units 112, 113, 114, and 115, also known as I/O processors (IOPs) or I/O adapters (IOAs).
- IOPs I/O processors
- IOAs I/O adapters
- the display system 124 may include a display controller, a display memory, or both.
- the display controller may provide video, audio, or both data to the display device 126.
- the computer system 100 may also include one or more sensors or other devices configured to collect data and provide the data to the processor 102.
- computer system 100 may include biometric sensors to collect data such as heart rate data or stress level data, environmental sensors to collect data such as humidity data, temperature data, or pressure data, and motion sensors to collect acceleration data, movement data, etc. Other types of sensors may also be used.
- Display system 124 may be connected to a display device 126, such as a standalone display screen, a television, a tablet, or a handheld device.
- the I/O interface unit provides the ability to communicate with various storage or I/O devices.
- the terminal interface unit 112 may be fitted with user I/O devices 116, such as user output devices such as a video display, a television with speakers, and user input devices such as a keyboard, a mouse, a keypad, a touchpad, a trackball, buttons, a light pen, or other pointing device.
- user input devices such as a keyboard, a mouse, a keypad, a touchpad, a trackball, buttons, a light pen, or other pointing device.
- a user may use a user interface to operate the user input devices to input input data and instructions to the user I/O devices 116 and the computer system 100, and to receive output data from the computer system 100.
- the user interface may be displayed on a display, played through speakers, or printed via a printer, for example, via the user I/O devices 116.
- Storage interface 113 allows for the attachment of one or more disk drives or direct access storage device 117 (usually a magnetic disk drive storage device, but may be an array of disk drives or other storage device configured to appear as a single disk drive).
- storage device 117 may be implemented as any secondary storage device.
- the contents of memory 104 may be stored in storage device 117 and retrieved from storage device 117 as needed.
- I/O device interface 114 may provide an interface to other I/O devices such as printers, fax machines, etc.
- Network interface 115 may provide a communications path to allow computer system 100 and other devices to communicate with each other. This communications path may be, for example, network 130.
- computer system 100 may be a device that receives requests from other computer systems (clients) without a direct user interface, such as a multi-user mainframe computer system, a single-user system, or a server computer.
- computer system 100 may be a desktop computer, a portable computer, a laptop, a tablet computer, a pocket computer, a telephone, a smartphone, or any other suitable electronic device.
- FIG. 2 is a diagram illustrating an example of the configuration of an anomaly detection system 200 according to an embodiment of the present disclosure.
- the anomaly detection system 200 is a system for detecting anomalies related to microservices by generating a machine learning model that takes into account the characteristics of logs, metrics, and traces in telemetry information.
- the anomaly detection system 200 includes an anomaly detection device 210, a communication network 250, and a user terminal 260.
- the anomaly detection device 210 and the user terminal 260 may be connected to each other via the communication network 250.
- the anomaly detection device 210 is a device for detecting anomalies related to microservices by generating a machine learning model that takes into account the characteristics of logs, metrics, and traces in telemetry information, and as shown in FIG. 2, mainly includes a memory 220, a storage unit 230, a processor 244, and an input/output unit 246. In one embodiment, the anomaly detection device 210 may be implemented by the computer system 100 shown in FIG.
- the memory 220 is a memory for storing an anomaly detection application 150 for implementing the functions of the anomaly detection means according to an embodiment of the present disclosure. As shown in FIG. 2, this anomaly detection application 150 may include processing instructions for implementing the functions of software modules such as a telemetry information acquisition unit 222, an embedding generation unit 224, a model generation unit 226, and an anomaly detection unit 228.
- this anomaly detection application 150 may include processing instructions for implementing the functions of software modules such as a telemetry information acquisition unit 222, an embedding generation unit 224, a model generation unit 226, and an anomaly detection unit 228.
- the telemetry information acquisition unit 222 is a functional unit for acquiring telemetry information related to the microservice.
- the telemetry information acquisition unit 222 may be an existing method such as Loki (registered trademark), Prometheus (registered trademark), and Tempo (registered trademark) that acquires log information, metric information, and trace information as telemetry information.
- the telemetry information acquisition unit 222 may also store the acquired telemetry information in a telemetry information DB 232 stored in the storage unit 230. The details of the operation of the telemetry information acquisition unit 222 will be described later, and therefore will not be described here.
- the embedding generation unit 224 is a functional unit for processing the telemetry information acquired by the telemetry information acquisition unit 222 and generating embeddings capturing features.
- the embedding generation unit 224 can generate embeddings that express, in a low-dimensional space, service-related features in the trace information, semantic features and log-related features in the log information, and time features and metric-related features in the metric information. The details of the operation of the embedding generation unit 224 will be described later, and therefore will not be described here.
- the model generator 226 generates a machine learning model for detecting anomalies in the telemetry information using the embeddings generated by the embedding generator 224.
- the model generator 226 may store the generated machine learning model in a model DB 234 stored in the storage unit 230. The details of the operation of the model generating unit 226 will be described later, and therefore will not be described here.
- the anomaly detection unit 228 is a functional unit for detecting anomalies in a microservice by acquiring a machine learning model for anomaly detection generated by the model generation unit 226 and stored in the model DB 234, and then analyzing telemetry information related to the microservice using the machine learning model for anomaly detection.
- the anomaly detection unit 228 may present an anomaly detection result indicating an anomaly detected in the microservice and information related to the cause of the anomaly, etc., to a user such as a system administrator. The details of the operation of the abnormality detection unit 228 will be described later, and therefore will not be described here.
- the storage unit 230 is a storage area that contains a database (hereinafter, "DB") for storing various information related to the embodiments of the present disclosure, and may include a telemetry information DB 232 and a model DB 234, as shown in FIG. 2.
- DB database
- the telemetry information DB 232 is a database for storing telemetry information related to microservices acquired by the telemetry information acquisition unit 222.
- the telemetry information DB 232 may include log information, trace information, and metric information related to multiple microservices.
- the model DB 234 is a database for storing the machine learning model for anomaly detection generated by the model generation unit 226.
- This model DB 234 may be configured in a database format that is selected based on the characteristics and requirements of the machine learning model for anomaly detection.
- the processor 244 is a processing unit for executing processing instructions that define the functions of each functional unit of the anomaly detection application 150 stored by the memory 220.
- the input/output unit 246 is a functional unit for accepting information input to the anomaly detection device 210 and outputting the anomaly detection results generated by the anomaly detection device 210.
- the input/output unit 246 may include, for example, a keyboard, a mouse, a display that displays a GUI (Graphical User Interface), and the like.
- the input/output unit 246 may provide the user terminal 260 with a GUI that inputs and outputs various types of information.
- Communication network 250 may include, for example, a local area network (LAN), a wide area network (WAN), a satellite network, a cable network, a WiFi network, or any combination thereof.
- LAN local area network
- WAN wide area network
- satellite network a satellite network
- cable network a cable network
- WiFi network any combination thereof.
- the user terminal 260 is a terminal device that can be used by a user of the anomaly detection device 210. By using the user terminal 260, the user can request the execution of anomaly detection for a specific microservice and check the anomaly detection result.
- the user terminal 260 may include, for example, a smartphone, a smart watch, a tablet, a personal computer, etc. of a user that manages a microservice, and is not particularly limited.
- FIG. 2 illustrates an example of a configuration including one user terminal 260. However, the number of user terminals 260 is not limited, and a configuration including multiple user terminals 260 is also possible.
- the anomaly detection system described above enables highly accurate anomaly detection that takes into account telemetry information such as log information, metric information, and trace information related to microservices.
- the anomaly detection device 210 may include functional units such as a telemetry information acquisition unit 222, an embedding generation unit 224, a model generation unit 226, and an anomaly detection unit 228, and databases such as a telemetry information DB 232 and a model DB 234, in order to realize the respective functions of the anomaly detection means according to the embodiment of the present disclosure.
- functional units such as a telemetry information acquisition unit 222, an embedding generation unit 224, a model generation unit 226, and an anomaly detection unit 228, and databases such as a telemetry information DB 232 and a model DB 234, in order to realize the respective functions of the anomaly detection means according to the embodiment of the present disclosure.
- FIG. 3 is a diagram showing an overall flow 300 of the anomaly detection means according to an embodiment of the present disclosure.
- the overall flow 300 of the anomaly detection means mainly includes two stages: a model generation stage in which a machine learning model for anomaly detection is generated based on telemetry information, and an anomaly detection stage in which anomaly detection is performed for a specific microservice using the generated machine learning model for anomaly detection.
- the telemetry information acquisition unit 222 acquires telemetry information related to the microservice.
- the telemetry information acquisition unit 222 may use existing methods such as Loki (registered trademark), Prometheus (registered trademark), and Tempo (registered trademark) that acquire log information, metric information, and trace information as telemetry information.
- metric information refers to information that includes a collection of metrics that provide quantitative measurements of hardware or software performance, such as CPU utilization or memory usage over a particular period of time.
- log information refers to information including a text log generated by a system when a specific code block in a microservice is executed. The log here may include, for example, text information indicating the content of the executed code block and a timestamp indicating the date and time when the code block was executed.
- trace information refers to information that includes traces that show relationships between different components of a microservices ecosystem of multiple microservices, such as a relationship diagram that shows, in graphical form, relationships between dependent services that are called by a service to perform a processing task.
- step S310 the embedding generation unit 224 determines whether the current process is in the model generation stage or the anomaly detection stage. This determination may be made based on, for example, a user's instruction. As an example, the user may select either the model generation stage or the anomaly detection stage on an anomaly detection management screen 1400 described later. If it is the model generation stage, the process proceeds to step S320. If it is the anomaly detection stage, the process proceeds to step S340.
- the embedding generation unit 224 divides the telemetry information acquired in step S305 into a learning set for training a machine learning model and a validation set for testing the trained machine learning model, then extracts features in the learning set of the telemetry information and generates an embedding based on the extracted features.
- the embedding here may be a graph representation or vector that expresses the features in an abstracted low-dimensional space.
- step S320 the model generation unit 226 trains a machine learning model for anomaly detection using the embedded telemetry information, such as the graph representation and vectors, generated in step S315.
- step S325 the model generation unit 226 performs anomaly detection processing on the validation set of telemetry information generated in step S315 using the machine learning model for anomaly detection generated in step S320. If the accuracy of anomaly detection on the validation set of telemetry information is less than a predetermined performance threshold, the process returns to step S315, and a new embedding is generated for the telemetry information. On the other hand, if the accuracy of anomaly detection on the validation set of telemetry information is equal to or greater than the predetermined performance threshold, the process proceeds to step S330.
- the model generation unit 226 compares the machine learning model for anomaly detection generated in step S325 with an existing machine learning model stored in the model DB 234, and determines whether to update the existing machine learning model based on the newly generated machine learning model for anomaly detection, or to save it as a new machine learning model for anomaly detection.
- the model generation unit 226 may determine whether to update the existing machine learning model based on the newly generated machine learning model, or to save it as a new machine learning model for anomaly detection, based on metadata (model ID, accuracy, etc.) related to each machine learning model.
- step S335 the model generation unit 226, in accordance with the determination in step S330, updates the existing machine learning model stored in the model DB 234 based on the machine learning model for anomaly detection generated in step S325, or stores the machine learning model for anomaly detection generated in step S325 in the model DB 234 as a new machine learning model.
- step S340 the anomaly detection unit 228 retrieves a machine learning model for anomaly detection from the model DB 234.
- step S345 the anomaly detection unit 228 uses the machine learning model for anomaly detection acquired in step S340 to convert the telemetry information acquired in step S305 into the same format (e.g., graph representation, vector) as the embedding generated in step S315.
- the same format e.g., graph representation, vector
- the anomaly detection unit 228 uses the machine learning model for anomaly detection acquired in step S340 to analyze the telemetry information converted in step S345, thereby detecting anomalies related to the microservice corresponding to the telemetry information.
- the anomaly detection unit 228 may use, for example, a statistical method such as PCA or a machine learning method such as SHAP to detect anomalies in the telemetry information.
- step S355 the anomaly detection unit 228 visualizes the results of the anomaly detection in step S350, and presents the anomaly detection results indicating the anomalies related to the microservices and their causes to the user on a GUI (Graphical User Interface) displayed on the user terminal 260 via the input/output unit 246 shown in FIG. 2.
- GUI Graphic User Interface
- the anomaly detection means shown in Figure 3 generates a machine learning model that takes into account the characteristics of logs, metrics, and traces in telemetry information, making it possible to detect anomalies in microservices with high accuracy.
- FIG. 4 is a diagram showing the flow of a model generation process 400 in the model generation stage according to an embodiment of the present disclosure.
- the model generation process 400 shown in FIG. 4 is a process for generating a machine learning model for anomaly detection for detecting anomalies in a microservice based on telemetry information related to the microservice, and is performed by the telemetry information acquisition unit 222, the embedding generation unit 224, and the model generation unit 226 shown in FIG. 2.
- the telemetry information acquisition unit 222 acquires telemetry information related to the target microservice.
- the telemetry information acquisition unit 222 may use existing methods such as Loki (registered trademark), Prometheus (registered trademark), and Tempo (registered trademark) that acquire log information, metric information, and trace information as telemetry information.
- the embedding generation unit 224 divides the telemetry information acquired in step S405 into a learning set for training a machine learning model and a validation set for testing the trained machine learning model, then extracts features in the learning set of the telemetry information and generates embeddings based on the extracted features.
- the embedding generation unit 224 may divide the telemetry information into the learning set and the validation set using a cross-validation method.
- the log information, trace information, and metric information included in the telemetry information each have a different data structure to express different characteristics related to the microservice. For example, a trace showing the relationship between multiple microservices is expressed in a graph format having spatial and temporal dependency, a log showing the behavior of a microservice is expressed in a natural language format related to a specific periodicity, and a metric related to the performance of a microservice is expressed in a numerical format having seasonality. Due to the structural differences between log information, trace information, and metric information, it is difficult to generate embeddings that capture the important characteristics of each, and no means for anomaly detection that takes into account all of the log information, trace information, and metric information has been provided in the past.
- the embedding generation unit 224 uses embedding means that take into account the respective characteristics of the log information, trace information, and metric information contained in the telemetry information to generate embeddings that express the respective characteristics of the log information, trace information, and metric information in a low-dimensional space, and then aggregates these three embeddings to generate a machine learning model that is capable of highly accurate anomaly detection based on the telemetry information.
- the embedding generation unit 224 extracts service relationship features indicating hierarchical relationships between multiple microservices from the trace information in the learning set of telemetry information, and processes these service relationship features using a predetermined graph embedding technique to generate a trace embedding that represents the service relationship features in a low-dimensional space.
- the embedding generation unit 224 extracts semantic features indicating the contents of the logs that show the behavior of the microservice in text format and log relational features indicating the relationships between multiple logs from the log information in the learning set of telemetry information, and processes the semantic features and log relational features using a predetermined graph embedding method to generate log embeddings that express the semantic features and log relational features in a low-dimensional space.
- the embedding generation unit 224 extracts temporal features indicating the temporal periodicity of measurement values related to the performance of the microservice and metric relationship features indicating dependencies between multiple metrics from the metric information in the learning set of telemetry information, and processes the temporal features and metric relationship features using a predetermined temporal embedding method to generate a metric embedding that represents the temporal features and the metric relationship features in a low-dimensional space.
- the embedding generator 224 may generate a low-dimensional graph representation showing the relationships and patterns present in the logs and traces, and convert the metrics into low-dimensional vectors. This conversion of the metrics may be performed, for example, by so-called one-hot encoding or label encoding.
- a machine learning model capable of detecting anomalies that takes into account service relationship features that indicate the hierarchical relationships between multiple microservices, semantic features that indicate the contents of logs that show the behavior of the microservices in text format, log relationship features that indicate the relationships between multiple logs, time features that indicate the temporal periodicity of measurements related to the performance of the microservices, and metric relationship features that indicate dependencies between multiple metrics.
- step S415 the model generation unit 226 trains a machine learning model for anomaly detection using the embedding of telemetry information, such as the graph representation and vectors, generated in step S410. More specifically, the model generation unit 226 may generate a trained machine learning model for anomaly detection by having an untrained machine learning model, such as a GNN, learn features and relationships in the telemetry information using the embedding of the graph representation and vectors, generated in step S315.
- an untrained machine learning model such as a GNN
- step S420 the model generation unit 226 performs anomaly detection processing on the validation set of telemetry information generated in step S410 using the machine learning model for anomaly detection generated in step S410. If the accuracy of anomaly detection on the validation set of telemetry information is less than a predetermined performance threshold, the process returns to step S410, and a new embedding is generated for the telemetry information. On the other hand, if the accuracy of anomaly detection on the validation set of telemetry information is equal to or greater than the predetermined performance threshold, the process proceeds to step S425.
- the performance thresholds here may be appropriately set by the user based on business needs, trial and error, simulation results, and the like.
- step S425 the model generation unit 226 compares the machine learning model for anomaly detection generated in step S420 with an existing machine learning model stored in the model DB 234, and either updates the existing machine learning model based on the newly generated machine learning model for anomaly detection, or saves it as a new machine learning model for anomaly detection.
- model generation process 400 by training a machine learning model such as a GNN using embeddings that capture service-related features, semantic features, log-related features, temporal features, and metric-related features in the log information, metric information, and trace information, it is possible to generate a machine learning model for anomaly detection that can detect anomalies in various aspects of a microservice.
- a machine learning model such as a GNN using embeddings that capture service-related features, semantic features, log-related features, temporal features, and metric-related features in the log information, metric information, and trace information
- FIG. 5 is a diagram showing the flow of an anomaly detection process 500 in the anomaly detection stage according to an embodiment of the present disclosure.
- the anomaly detection process 500 shown in FIG. 5 is a process for detecting an anomaly in a specific microservice by analyzing telemetry information related to the microservice using a machine learning model for anomaly detection generated by the model generation process 400 shown in FIG. 4, and is performed by the anomaly detection unit 228 shown in FIG. 2.
- the telemetry information acquisition unit 222 acquires telemetry information related to the target microservice.
- the telemetry information acquisition unit 222 may use existing methods such as Loki (registered trademark), Prometheus (registered trademark), and Tempo (registered trademark) that acquire log information, metric information, and trace information as telemetry information.
- step S510 the anomaly detection unit 228 obtains from the model DB 234 the machine learning model for anomaly detection generated by the model generation process 400 shown in FIG. 4.
- step S515 the anomaly detection unit 228 uses the machine learning model for anomaly detection acquired in step S510 to convert the telemetry information acquired in step S505 into the same format (e.g., graph representation, vector) as the embedding generated in step S410 of the model generation process 400 shown in FIG. 4.
- the same format e.g., graph representation, vector
- the anomaly detection unit 228 uses the machine learning model for anomaly detection acquired in step S510 to analyze the telemetry information converted in step S515, thereby detecting anomalies related to the microservice corresponding to the telemetry information.
- the anomaly detection unit 228 may use, for example, a statistical method such as PCA or a machine learning method such as SHAP to detect anomalies in the telemetry information.
- step S525 the anomaly detection unit 228 visualizes the results of the anomaly detection in step S520, and presents the anomaly detection results indicating the anomalies related to the microservices and their causes to the user on a GUI (Graphical User Interface) displayed on the user terminal 260 via the input/output unit 246 shown in FIG. 2.
- GUI Graphic User Interface
- the anomaly detection process 500 described above it is possible to detect anomalies in a microservice by analyzing telemetry information related to the microservice.
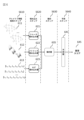
- FIG. 6 is a diagram showing an example of the operation when generating a machine learning model for anomaly detection according to an embodiment of the present disclosure.
- the operation shown in FIG. 6 substantially corresponds to step S415 in the model generation process 400 described with reference to FIG. 4, and is an operation for generating a machine learning model for anomaly detection using telemetry information.
- the telemetry information including trace information 611, metric information 612, and log information 613 is acquired by the telemetry information acquisition unit 222. Then, each of the trace information 611, metric information 612, and log information 613 is input to a different embedding layer of the neural network. More specifically, the trace information 611 may be input to a trace embedding layer 621, the metric information 612 to a metric embedding layer 622, and the log information 613 to a log embedding layer 623.
- Each of the trace embedding layer 621, the metric embedding layer 622, and the log embedding layer 623 extracts features from the input telemetry information.
- the trace embedding layer 621 may extract service relationship features from the trace information 611 that indicate hierarchical relationships between multiple microservices.
- the metric embedding layer 622 may extract from the metric information 612 temporal features that indicate the temporal periodicity of measurements related to the performance of the microservices and metric relationship features that indicate dependencies between multiple metrics.
- the log embedding layer 623 may extract from the log information 613 semantic features indicating the contents of logs that indicate the behavior of the microservice in text format, and log relationship features indicating the relationships between multiple logs.
- the trace embedding layer 621, the metric embedding layer 622, and the log embedding layer 623 may each use an existing feature extraction means, and there is no particular limitation here.
- Each of the trace embedding layer 621, the metric embedding layer 622, and the log embedding layer 623 may be configured to apply an embedding means set based on the characteristics of the input telemetry information.
- the trace embedding layer 621 and the log embedding layer 623 may be configured to perform graph embedding on the extracted features
- the metric embedding layer 622 may be configured to perform temporal embedding on the extracted features.
- an aggregation step S630 the embeddings generated by the embedding layers 621, 622, and 623 are aggregated by an aggregation layer 635 to generate a single latent representation to be input to the prediction layer 641 (also called a fully connected layer or dense layer).
- This latent representation is information that represents the trace embedding, log embedding, and metric embedding in a low-dimensional space, and may be, for example, a vector or graph representation.
- a prediction step S640 the latent representations generated in the aggregation step S630 are input to a prediction layer 641 (dense layer).
- the prediction layer 641 can generate an anomaly score 645 indicating the presence or absence of anomalies in the telemetry information related to the microservice by using an activation function such as a ReLU (Rectified Linear Unit) function for the input latent representation.
- the accuracy of the prediction layer 641 can be evaluated by comparing the generated anomaly score 645 with, for example, a ground truth indicating an actual anomaly in the telemetry information.
- the parameters of the trace embedding layer 621, the metric embedding layer 622, the log embedding layer 623, the aggregation layer 635, and the prediction layer 641 may be frozen and stored as a machine learning model for anomaly detection.
- a machine learning model for anomaly detection by training a machine learning model such as a GNN using embeddings that capture service-related features, semantic features, log-related features, temporal features, and metric-related features in log information, metric information, and trace information, it is possible to generate a machine learning model for anomaly detection that can detect anomalies in various aspects of a microservice.
- one aspect of the present disclosure relates to generating embeddings that represent meaningful features in a low-dimensional data space for each of the metric information, trace information, and log information contained in the telemetry information.
- FIGS. 1-10 An example of a process for generating embeddings for metric information, trace information, and log information according to an embodiment of the present disclosure will be described with reference to FIGS.
- trace information is information that includes traces showing relationships between different components of a microservice ecosystem consisting of multiple microservices.
- the traces here may be, for example, a relationship diagram showing relationships in a graphical format with dependent services that are called by a service to perform a processing task.
- the anomaly detection means according to the embodiment of the present disclosure can generate anomaly detection results with higher accuracy by taking into account the relationships between services expressed in a trace.
- a dependency relationship is formed between the first service and the second service.
- the second service may also call other services (third and fourth services), and these services may also call other services, and a dependency relationship exists between all of these called services.
- a "service call chain" in which many services are linked by dependencies is formed, and information indicating this service call chain is called a "trace.” 7 shows an example of a trace 710. In the trace 710, a node corresponding to a first service 700 and a node corresponding to a second service 702 are connected by a dependency relationship 701.
- each node in trace 710 is input to a trace embedding layer 715 of a graph-based machine learning model such as a GNN.
- the trace embedding layer 715 then extracts features of service relationships that indicate hierarchical relationships between multiple microservices shown in trace 710, and then generates a trace embedding 720 that represents, in vector form, the node attributes of each node, neighborhood information that indicates the relationships between the nodes, and global information that indicates the cluster in which the microservice is implemented.
- a graph embedding means for generating the trace embedding 720 for example, matrix factorization, random walk-based methods, graph convolutional networks (GCN), graph attention networks (GAT), etc. may be used.
- FIG. 8 is a diagram showing an example of a process for generating embeddings for metrics according to an embodiment of the present disclosure.
- a metric according to an embodiment of the present disclosure is information including a set of metrics that indicate measurements that quantitatively indicate the performance of hardware or software.
- the metrics here may include, for example, CPU usage or memory usage during a specific period of time.
- the usage of a microservice may fluctuate periodically (for example, the usage of a microservice used by a company increases during the company's business hours and decreases outside of business hours). For this reason, the time periodicity of a microservice is also reflected in the metrics. Furthermore, among multiple metrics, there are metrics that are dependent on each other (for example, CPU usage is proportional to memory usage). As described above, the anomaly detection means according to the embodiment of the present disclosure can generate anomaly detection results with higher accuracy by taking into account periodicity in metrics and relationships between metrics.
- the metrics 805 in the acquired telemetry information are input to the embedding layer 810 of the neural network, which extracts from the input metrics 805 temporal features indicating the temporal periodicity of measurements related to the performance of the microservice and metric relationship features indicating dependencies between multiple metrics, and generates low-dimensional representations such as vectors as metric embeddings 815 based on the extracted features.
- the embedding layer 810 here may be, for example, a layer of a recurrent neural network with an attention mechanism that learns the interdependencies of multiple metrics, or a temporal attention layer that learns the periodicity and inter-dependency features of the metrics.
- a temporal embedding method for metric information it is possible to generate metric embeddings that express temporal features that indicate periodicity in the metrics and metric relationship features that indicate the relationships between metrics.
- FIG. 9 is a diagram illustrating an example of a process for generating an embedding for a log according to an embodiment of the present disclosure.
- a log according to an embodiment of the present disclosure is information including a text-format log that is generated by a system when a specific code block in a microservice is executed.
- the log here may include, for example, text information indicating the contents of the executed code block and a timestamp indicating the date and time when the code block was executed.
- the content of a log is expressed as text written in a natural language, so it is desirable to take into account the semantic content of this text when generating an embedding for the log. Also, since a log may contain content related to other logs (e.g., successive logs), it is desirable to reflect the relationships between these logs in the embedding.
- FIG. 9 illustrates an example of a log sequence 910 that is made up of multiple logs related to the behavior of a particular microservice.
- the textual content of each log in the log sequence 910 can be represented as a semantic vector 912.
- the semantic vector 912 may be generated, for example, by one-hot encoding.
- a log graph 920 can be generated, showing each log as a node 922 with semantic vectors as features, and showing the relationships between successive logs as edges 924.
- each node in the log graph 920 is input to a log embedding layer 930 of a graph-based machine learning model such as a GNN, similar to the embedding of a trace described with reference to Fig. 7.
- the log embedding layer 930 then extracts semantic features indicating the contents of the log indicating the behavior of the microservice in a text format and log relation features indicating the relationship between multiple logs, and then generates a log embedding 935 that expresses, in a vector format, the node attributes of each node, neighborhood information indicating the relationship between the nodes, and global information indicating the cluster in which the microservice is implemented.
- a graph embedding means for generating the log embedding 935 for example, matrix factorization, random walk-based methods, graph convolutional networks (GCN), graph attention networks (GAT), etc. may be used.
- log embeddings that express semantic features that indicate the semantic content of logs, and log relational features that indicate the relationships between logs.
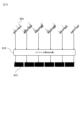
- FIG. 10 is a diagram illustrating an example of the operation of the aggregation layer according to an embodiment of the present disclosure.
- embeddings generated for each of the trace information, log information, and metric information contained in the telemetry information are aggregated by the aggregation layer of the neural network to generate a single latent representation.
- FIG. 10 describes an example of the operation of the aggregation layer.
- an embedding set 1010 consisting of trace embeddings, log embeddings, and metric embeddings is input to an aggregation layer 1020.
- the aggregation layer 1020 maps detailed timestamps of the period during which the telemetry information (trace information, log information, metric information) that was the source of each embedding included in the embedding set 1010 was acquired to discrete units such as hours, days, and weeks, and then aggregates embeddings that correspond to the same time unit into time-unit embeddings.
- the aggregation layer 1020 then aggregates the time unit embeddings into a temporal embedding 1030, for example by a concatenation operation such as addition or matrix dot product.
- a fusion layer 1040 fuses the temporal embeddings 1030, for example by concatenation operations such as addition or matrix dot product, to generate a single latent representation 1050.
- This latent representation 1050 is information that represents the trace embedding, log embedding, and metric embedding in a low-dimensional space, and may be, for example, a vector or graph representation.
- a machine learning model for anomaly detection can be generated to detect anomalies in telemetry information.
- FIG. 11 is a diagram showing an example of the configuration of a neural network 1150 that functions as a machine learning model for anomaly detection according to an embodiment of the present disclosure.
- the neural network 1150 includes an input layer 1100, multiple hidden layers 1101, and an output layer 1102. Furthermore, the input layer 1100, the hidden layer 1101, and the output layer 1102 are connected to each other by edges 1104 and 1106.
- the input layer 1100 inputs telemetry information (e.g., embeddings generated from the telemetry information) represented in a low-dimensional space.
- telemetry information e.g., embeddings generated from the telemetry information
- Each node 1103 in the input layer 1100 then processes and transforms the input telemetry information to generate feature vectors consisting of features extracted from the telemetry information. These feature vectors are then input to the hidden layer 1101.
- Each hidden layer 1101 consists of multiple nodes 1105 that perform a series of operations on the input data. More specifically, the hidden layers 1101 apply an activation function to the values obtained by applying weights to the input feature vectors.
- the weights for the feature vectors may be determined by a training process that minimizes the error of the results (predictions of anomalies) generated by the neural network 1150 relative to ground truth.
- the output layer 1102 receives the feature vectors transformed by applying weights and activation functions from the last hidden layer 1101 and generates an anomaly prediction result indicating the presence or absence of an anomaly in the telemetry information based on the feature vectors.
- the output layer 1102 then generates a probability distribution over the output classes using an activation function different from that of the hidden layer 1101, such as a softmax function.
- the anomaly prediction result may be information indicating the probability that an anomaly exists in the telemetry. For example, if the anomaly prediction result indicates a probability exceeding "50%", it may be determined that an anomaly exists in the telemetry information.
- the weights applied to the feature vectors can be adjusted, but in the anomaly detection stage, the weights and the parameters of each layer of the neural network 1150 are frozen.
- a wrapper such as SHAP (Shapley Additive exPlanations) may be implemented around neural network 1150 to rank the features used to generate the anomaly predictions.
- the wrapper can compute a measure of importance for each feature used in the predictions made by neural network 1150.
- a wrapper such as SHAP may be used to determine the relative contribution of each feature of the telemetry information to anomaly detection, and a higher weight may be applied to the feature with a higher contribution.
- the SHAP may generate and output the reason why a particular anomaly prediction result was generated (e.g., an explanation of why an anomaly was determined to exist) and possible causes of the anomaly by ranking the features used to generate the anomaly prediction result.
- the neural network 1150 shown in FIG. 11 makes it possible to detect the presence or absence of anomalies in a microservice with high accuracy based on the telemetry information of the microservice.
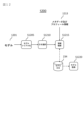
- FIG. 12 is a diagram showing an example of a process 1200 for storing and retrieving a machine learning model for anomaly detection according to an embodiment of the present disclosure.
- the process 1200 is a process for storing a machine learning model for anomaly detection in the model DB 234 after generating the model, and a process for retrieving a trained machine learning model for anomaly detection from the model DB 234 when performing anomaly detection on telemetry information, and is performed by the model generation unit 226 and the anomaly detection unit 228.
- the model generation unit 226 performs serialization to convert the machine learning model 1201 for anomaly detection generated by, for example, the model generation process 400 shown in FIG. 4 into a predetermined format.
- the model generation unit 226 may convert the machine learning model 1201 for anomaly detection into a format such as JSON, Pickle, or Protocol Buffer.
- the model generation unit 226 selects a database method for saving the machine learning model 1201 for anomaly detection.
- the database method here is a database configuration and management method that specifies the rules for storing and retrieving data. In principle, it is desirable to select a database method that allows high-performance reading and writing of large amounts of data and storage of binary data and metadata, but the method may be selected depending on the application and performance of the machine learning model 1201 for anomaly detection. Examples of database methods include MongoDB (registered trademark), Cassandra (registered trademark), Redis (registered trademark), and DynamoDB (registered trademark).
- the model generation unit 226 associates the machine learning model for anomaly detection 1201 with the metadata and profile information 1213, and then stores the model in the model DB 234 configured using the database method selected in step S1210.
- the metadata and profile information 1213 may include, for example, information on the generation date and time of the machine learning model for anomaly detection 1201, architecture, metric statistics for evaluation, data coverage, version, project ID, and serial format.
- the machine learning model for anomaly detection 1201 when storing the machine learning model for anomaly detection 1201 in the model DB 234, the machine learning model for anomaly detection 1201 may be saved as a new model, or an existing model may be updated based on the machine learning model for anomaly detection 1201.
- the model generation unit 226 may determine whether to update the existing machine learning model based on the newly generated machine learning model, or to save it as a new machine learning model for anomaly detection, based on metadata and profile information 1213 related to each machine learning model.
- the anomaly detection unit 228 when performing anomaly detection on the telemetry information, acquires the machine learning model 1201 for anomaly detection from the model DB 234.
- the anomaly detection unit 228 may acquire an appropriate machine learning model 1201 for anomaly detection from the model DB 234, for example, by performing a search based on the metadata and profile information 1213 associated with the machine learning model 1201 for anomaly detection.
- the anomaly detection unit 228 may convert the acquired machine learning model 1201 for anomaly detection from a serial format to a model object format.
- the machine learning model for anomaly detection can be stored in an appropriate database and can be easily retrieved when performing anomaly detection on telemetry information.
- FIG. 13 is a diagram illustrating an example of a logical database schema 1300 of a model DB according to an embodiment of the present disclosure.
- the logical database schema 1300 here is a database structure for storing a machine learning model for anomaly detection according to an embodiment of the present disclosure in the above-mentioned model DB 234.
- the logical database schema 1300 of the model DB 234 may include a model ID 1301 that uniquely identifies a particular machine learning model for anomaly detection, and for the machine learning model for anomaly detection, a model ID 1301, a generation date and time 1302, a model architecture 1303, metric statistics 1304, data coverage 1305, a version 1306, a project ID 1307, and a serial format 1308.
- the model ID 1301 is information indicating a unique identifier for identifying a machine learning model for anomaly detection.
- the creation date and time 1302 is information indicating a timestamp such as the creation date and time or the update date and time of the machine learning model for anomaly detection.
- the model architecture 1303 is information indicating the architecture and network format that represent the design and structure of a machine learning model for anomaly detection. Metric statistics are information that indicates statistical indicators or evaluation indicators that are measured to evaluate the performance of a machine learning model for anomaly detection.
- Data coverage 1305 is an index indicating the range and comprehensiveness of data used to train and evaluate a machine learning model for anomaly detection.
- Version 1306 is information indicating a number or identifier for managing the version of the machine learning model for anomaly detection.
- the project ID 1307 is information indicating a unique identifier for identifying the project to which the machine learning model for anomaly detection belongs.
- the serial format 1308 is information indicating the type or format of data when serializing the machine learning model for anomaly detection.
- a row 1309 is information indicating the data type of each type of data stored in the logical database schema 1300 .
- Row 1310 shows an example of information about a machine learning model for anomaly detection stored in logical database schema 1300 .
- the logical database schema 1300 of the model DB 234 shown in FIG. 13 allows efficient storage and retrieval of machine learning models for anomaly detection. For example, in one embodiment, a user can search for machine learning models for anomaly detection with "accuracy of 97% or higher" in the logical database schema 1300, or for machine learning models for anomaly detection in the "GNN" architecture format.
- the logical database schema 1300 also allows a user to easily compare multiple models across multiple architectures or projects.
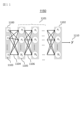
- FIG. 14 is a diagram illustrating an example of an anomaly detection management screen 1400 according to an embodiment of the present disclosure.
- the anomaly detection management screen 1400 is a user interface for inputting settings for generating a machine learning model for anomaly detection and for confirming the results of anomaly detection processing performed on telemetry information, and may be output to and displayed on the user terminal 260 via the input/output unit 246 shown in FIG. 2, for example.
- the anomaly detection management screen 1400 may include a save button 1401, a setting button 1402, a cluster name setting window 1403, a namespace setting window 1404, a time range setting window 1405, an anomaly graph display window 1406, a metric display window 1407, a log display window 1408, a trace display window 1409, and a details display window 1410.
- the save button 1401 is a button for saving the information displayed on the anomaly detection management screen 1400 .
- a settings button 1402 is a button for opening a screen (not shown) for inputting settings when generating a machine learning model for anomaly detection.
- the cluster name setting window 1403 is a button for selecting and specifying the physical cluster (such as a set of servers) in which the target microservice is implemented.
- the namespace setting window 1404 is a button for selecting and specifying a virtual cluster implemented on one physical cluster.
- the time range setting window 1405 is a button for setting the time range for acquiring telemetry information.
- the anomaly graph display window 1406 is a window that displays an anomaly graph showing the number of anomalies detected in the target telemetry information over time for a given period of time.
- the metric display window 1407 is a window that shows the most anomaly-prone metrics by time for a given period of time, allowing a user to identify the microservice in which the most anomaly-prone metric occurred.
- the log display window 1408 is a window that shows the logs with the most frequent anomalies by time for a given period of time. The log display window 1408 allows a user to identify the microservice in which the metric with the most frequent anomalies occurred.
- the trace display window 1409 is a window that shows the traces with the most frequent anomalies by time for a given period of time. The trace display window 1409 allows the user to see the hierarchical relationship of services in the traces with the most frequent anomalies.
- the details display window 1410 is a window for displaying detailed information about a particular metric, log, or trace selected by the user. For example, the user can use the details display window 1410 to check the log about a particular microservice in which an abnormality has occurred.
- a user of the anomaly detection device 210 can input settings for generating a machine learning model for anomaly detection, and can easily check the results of the anomaly detection process performed on the telemetry information.
- FIG. 15 is a diagram illustrating an example of a cloud computing environment 1500 according to an embodiment of the present disclosure.
- the cloud computing environment 1500 may be used to realize the anomaly detection system 200 according to an embodiment of the present disclosure.
- the anomaly detection system 200 according to an embodiment of the present disclosure and the microservices that are the subject of anomaly detection may be implemented in the same or different cloud computing environments.
- the cloud computing environment 1500 is composed of one or more cloud computing nodes, and each computing node operates in cooperation with a storage device 1507, a computing machine 1508, and a network device 1509. Each computing node also communicates with local computing devices used by cloud users, such as a desktop computer 1510, a laptop computer 1501, a smartphone 1502, a drone 1503, a hospital computer system 1504, an automobile computer system 1505, and a bank computer system 1506.
- cloud users such as a desktop computer 1510, a laptop computer 1501, a smartphone 1502, a drone 1503, a hospital computer system 1504, an automobile computer system 1505, and a bank computer system 1506.
- each computing node may be grouped into one or more subnetworks, either physically or virtually, such as private, community, public, or hybrid clouds.
- This cloud computing environment 1500 makes it possible to provide a variety of software and services as a cloud computing model.
- the cloud computing model is a model of service delivery for enabling on-demand, convenient network access to a shared pool of configurable computing resources (e.g., networks, network bandwidth, servers, processing, memory, storage, applications, virtual machines, and services) that can be rapidly provisioned and released with minimal management effort or interaction with a service provider.
- This cloud model can include at least five characteristics, at least three service models, and at least four deployment models.
- On-demand self-service Cloud consumers can automatically and unilaterally provision computing capacity, such as server time and network storage, on an as-needed basis, without the need for human interaction with the provider of the service.
- Pervasive Network Access Capabilities are available over the network and accessed through standard mechanisms facilitating use by heterogeneous thin or thick client platforms (eg, cell phones, laptops and PDAs).
- Resource Pooling Provider computing resources are pooled to serve multiple consumers using a multi-tenant model, with different physical and virtual resources dynamically allocated and reallocated on demand. Consumers generally have no control or knowledge of the exact location of the resources provided, although there is a sense of location independence in that they may be able to specify location at a higher level of abstraction (e.g., country, state, or datacenter).
- Rapid Elasticity Capacity can be provisioned quickly and elastically, sometimes automatically, to quickly scale out and quickly release to quickly scale in. To the consumer, the capacity available to provision often appears unlimited, and any amount can be purchased at any time.
- Metered Services Cloud systems automatically control and optimize resource usage by leveraging metering capabilities at some level of abstraction appropriate to the type of service (e.g., storage, processing, bandwidth, and active user accounts). Resource usage can be monitored, controlled, and reported in a manner that provides transparency to both providers and consumers of the services being used.
- level of abstraction appropriate to the type of service (e.g., storage, processing, bandwidth, and active user accounts).
- SaaS Software as a Service
- the capability offered to the consumer is to use the provider's applications running on a cloud infrastructure.
- the applications are accessible from a variety of client devices through thin-client interfaces such as web browsers (e.g., web-based email).
- web browsers e.g., web-based email
- the consumer does not manage or control the underlying cloud infrastructure, including networks, servers, operating systems, storage, or even individual application capabilities.
- PaaS Platform as a Service
- the capability offered to the consumer is to deploy applications that the consumer has created or acquired, written using programming languages and tools supported by the provider, onto a cloud infrastructure.
- the consumer does not manage or control the underlying cloud infrastructure, including the network, servers, operating systems, or storage, but does have control over the deployed applications and, potentially, the application hosting environment configuration.
- IaaS Infrastructure as a Service
- the consumer does not manage or control the underlying cloud infrastructure, but has control over the operating systems, storage, deployed applications, and possibly limited control over selected networking components (e.g., host firewalls).
- the deployment model is typically as follows: Private Cloud: The cloud infrastructure is operated exclusively for an organization. It can be managed by that organization or a third party and can exist on-premise or off-premise.
- Cloud infrastructure is shared by several organizations to support a specific community that shares concerns (e.g., mission, security requirements, policies, and compliance considerations).
- the cloud infrastructure can be managed by those organizations or by a third party and can exist on-premise or off-premise.
- Public cloud Cloud infrastructure is made available to the general public or large industry groups and is owned by organizations that sell cloud services.
- Hybrid Cloud A combination of two or more clouds (private, community, or public) that remain unique entities in the cloud infrastructure but are tied together by standardized or proprietary technologies (e.g., cloud bursting for load balancing between clouds) that allow portability of data and applications.
- Cloud computing environments are service-based and focus on statelessness, low complexity, modularity, and semantic interoperability.
- An infrastructure that includes a network of interconnected nodes.
- a representative cloud computing node is as shown in FIG. 2 above.
- computer systems/servers that can operate in many other general-purpose or special-purpose computing system environments or configurations.
- Examples of well-known computing systems, environments, and/or configurations that may be suitable for use with a computer system/server include, but are not limited to, personal computer systems, server computer systems, thin clients, thick clients, handheld or laptop devices, multiprocessor systems, microprocessor-based systems, set-top boxes, programmable consumer electronics, network PCs, minicomputer systems, mainframe computer systems, and distributed cloud computing environments that include any of the above systems or devices.
- a computer system/server may be described in the general context of computer system-executable instructions, such as program modules, being executed by the computer system.
- program modules may include routines, programs, objects, components, logic, data structures, etc. that perform particular tasks or implement particular abstract data types.
- the computer system/server may be implemented in a distributed cloud computing environment where tasks are performed by remote processing devices linked through a communications network.
- program modules may be located in both local and remote computer system storage media, including memory storage devices.
- the anomaly detection means includes the following aspects:
- An abnormality detection device comprising: A processor and a memory,
- the memory includes: From the first set of microservices, Log information including logs showing the behavior of microservices; Trace information including traces showing relationships between multiple microservices; metric information including metrics that indicate measurements regarding the performance of the microservice; a telemetry information acquisition unit that acquires first telemetry information including: an embedding generation unit that processes learning telemetry information extracted from the first telemetry information using a neural network to generate a trace embedding corresponding to the trace information, a log embedding corresponding to the log information, and a metric embedding corresponding to the metric information; A model generation unit that generates a machine learning model for anomaly detection that determines whether or not an anomaly exists in a microservice based on the trace embedding, the log embedding, and the metric embedding; an anomaly detection unit that generates an anomaly detection result indicating the presence or absence of an anomaly in the second microservice by analyzing second telemetry information acquired
- the embedding generation unit includes: Extracting service relationship features indicating hierarchical relationships between multiple microservices from the trace information; processing the service relationship features using a predefined graph embedding technique to generate the trace embedding, which represents the service relationship features in a low-dimensional space; 2.
- the anomaly detection device according to claim 1,
- the embedding generation unit includes: Extracting from the log information semantic features indicating the contents of the log that indicates the behavior of the microservice in text format and log relationship features indicating relationships between multiple logs; processing the semantic features and the log-relationship features using a graph embedding technique to generate the log embedding, the log embedding representing the semantic features and the log-relationship features in a low-dimensional space; 3.
- the abnormality detection device according to claim 1 or 2.
- the embedding generation unit includes: Extracting from the metric information a time feature indicating a time periodicity of a measurement value related to the performance of the microservice and a metric relationship feature indicating a dependency relationship between a plurality of metrics; processing the temporal features and the metric-related features using a predefined temporal embedding technique to generate the metric embedding, the metric embedding representing the temporal features and the metric-related features in a low-dimensional space; 4.
- the abnormality detection device according to any one of claims 1 to 3.
- the embedding portion is Including an embedding layer in a neural network,
- the model generation unit An aggregation layer and a prediction layer in the neural network,
- the aggregation layer is generating a latent representation by aggregating the trace embedding, the log embedding, and the metric embedding using a predetermined concatenation operation method, and inputting the latent representation into the prediction layer;
- the prediction layer includes: generating an anomaly prediction result for verification telemetry information acquired from the first telemetry information based on the latent representation; If the anomaly prediction result satisfies a predetermined accuracy threshold, the parameters of the embedding layer, the aggregation layer, and the prediction layer are set as the machine learning model for anomaly detection. 5.
- the abnormality detection device according to any one of claims 1 to 4.
- the abnormality detection device includes: Further comprising a storage unit for storing a model database that stores information about the machine learning model for anomaly detection, The model generation unit Serializing the generated machine learning model for anomaly detection to generate a serial format machine learning model; storing the serial machine learning model and metadata and profile information characterizing the serial machine learning model in the model database; 6.
- the abnormality detection device according to any one of claims 1 to 5.
- the abnormality detection unit performing a search based on the profile information on the model database to obtain the serial machine learning model;
- the acquired machine learning model for anomaly detection is acquired by converting the acquired machine learning model in serial format from the serial format to a model object format. 7.
- the anomaly detection device according to claim 6.
- the anomaly detection means by training a machine learning model using the trace information, metric information, and log information contained in the telemetry information, it becomes possible to detect anomalies in a microservice based on the telemetry information.
- the anomaly detection means uses an embedding method selected in consideration of the unique characteristics and structures of each of the trace information, metric information, and log information, making it possible to generate embeddings that express the characteristics of each of the trace information, metric information, and log information in a low-dimensional space that abstracts the characteristics of each of the trace information, metric information, and log information.
- an embedding method selected in consideration of the unique characteristics and structures of each of the trace information, metric information, and log information, making it possible to generate embeddings that express the characteristics of each of the trace information, metric information, and log information in a low-dimensional space that abstracts the characteristics of each of the trace information, metric information, and log information.
- temporal embedding for metric information that has temporal periodicity and graph embedding for logs and traces that have a graph structure, it is possible to generate embeddings that capture characteristics such as the temporal characteristics of metric information, the hierarchical relationships of trace information, and the semantic content of log information.
- the features used to generate the anomaly prediction result can be ranked using a wrapper or similar to determine the reason why a particular anomaly prediction result was generated (such as an explanation of why it was determined that there was an anomaly) and possible causes of the anomaly.
- the anomalies and causes of the anomaly determined in this way can be presented to the user, for example, via a GUI, allowing the user to easily check the anomalies in the microservice and their causes.
- Anomaly detection application 200: Anomaly detection system
- 210 Anomaly detection device
- 220 Memory
- 222 Telemetry information acquisition unit
- 224 Embedding generation unit
- 226 Model generation unit
- 228 Anomaly detection unit
- 232 Telemetry information DB
- 244 Processor
- 246 Input/output unit
- 250 Communication network
- 260 User terminal
Landscapes
- Engineering & Computer Science (AREA)
- Theoretical Computer Science (AREA)
- General Engineering & Computer Science (AREA)
- Physics & Mathematics (AREA)
- General Physics & Mathematics (AREA)
- Software Systems (AREA)
- Quality & Reliability (AREA)
- Computer Hardware Design (AREA)
- Artificial Intelligence (AREA)
- Computer Vision & Pattern Recognition (AREA)
- Data Mining & Analysis (AREA)
- Evolutionary Computation (AREA)
- Medical Informatics (AREA)
- Computing Systems (AREA)
- Mathematical Physics (AREA)
- Debugging And Monitoring (AREA)
- Testing And Monitoring For Control Systems (AREA)
Abstract
本開示は、マイクロサービスに関する高精度の異常検出が可能な異常検出手法を提供することを目的とする。 このため、本開示の異常検出装置は、第1のマイクロサービスのセットから、ログ情報、トレース情報及びメトリック情報を含む第1のテレメトリ情報を取得するテレメトリ情報取得部と、トレース情報に対応するトレース埋め込みを生成し、ログ情報に対応するログ埋め込みを生成し、メトリック情報に対応するメトリック埋め込みを生成する埋め込み生成部と、トレース埋め込み、ログ埋め込み及びメトリック埋め込みに基づいてマイクロサービスについて異常の有無を判定する異常検出用の機械学習モデルを生成するモデル生成部と、異常検出用の機械学習モデルを用いて、第2のマイクロサービスのセットについて取得された第2のテレメトリ情報を解析することで、第2のマイクロサービスにおける異常の有無を示す異常検出結果を生成する異常検出部とを含む。
Description
本発明は、異常検出装置、異常検出システム及び異常検出方法に関する。
近年、モバイル、SNS、IoT等をはじめ、デジタル技術を活用して、ビジネス環境は大きく変化してしる。また、企業は、顧客のニーズの変化に柔軟に対応することが求められている。
そのような中、アプリケーション開発を効率化する手法として、いわゆる「マイクロサービスアーキテクチャ」という開発手法が注目を集めている。このマイクロサービスアーキテクチャでは、全ての機能やコンポーネントが1つのコードベースに統合されている従来のモノリシック(一枚板)アーキテクチャとは異なり、アプリケーションが持つ機能が細かい「サービス」に分割され、それぞれのサービスはAPIを通じて連携している。マイクロサービスは、従来のモノリシックなアプローチに比べて、拡張性・柔軟性に優れており、柔軟でスケーラブルなシステムを構築し、効率的なソフトウェアの開発と運用を実現させることができる。
このようなマイクロサービスアーキテクチャがクラウドコンピューティング、分散システムアーキテクチャ及びCI/CD(Continuous Integration/Continuous Delivery)と共に普及する中、アプリケーションを監視し、異常を検出することが重要となりつつある。そして、アプリケーションに対する異常検出を支援するためには、アプリケーションの挙動やサービス間の相互作用に関する情報として、メトリック、ログ、及びトレースを含むテレメトリ情報を用いることが有用である。
例えば、所定の期間においてアプリケーションについて発生したイベントを記録するログを用いて、異常検出を行う手法として、米国特許第9928155号(特許文献1)が存在する。
特許文献1には、「本特許出願には、異種のシステムやアプリケーション、センサ、又は計器からのログデータを処理するためのシステム及び方法が開示されている。これは、任意の未知のシステムやアプリケーションから異種のログを受信し、機械学習を使用して異種のログソースから正規表現のパターンを生成し、ログパターンを抽出する。また、異なる条件に基づいてトレーニングログからモデルやプロファイルを生成し、時間の経過と共に生成された全てのモデルを格納するグローバルなモデルデータベースを更新する。さらに、本番システムで実行されている1つ以上のアプリケーション、センサ、又は計器か
らの生のログメッセージをトークン化し、トークン化されたストリームをデータオブジェクトに変換して異常検出及びログメッセージの異常警告のためにログメッセージを異なる異常検出器に転送する。そして、本番システムで実行されている1つ以上のアプリケーション、センサ、又は計器から異常警告を生成する。」技術が開示されている。
特許文献1には、「本特許出願には、異種のシステムやアプリケーション、センサ、又は計器からのログデータを処理するためのシステム及び方法が開示されている。これは、任意の未知のシステムやアプリケーションから異種のログを受信し、機械学習を使用して異種のログソースから正規表現のパターンを生成し、ログパターンを抽出する。また、異なる条件に基づいてトレーニングログからモデルやプロファイルを生成し、時間の経過と共に生成された全てのモデルを格納するグローバルなモデルデータベースを更新する。さらに、本番システムで実行されている1つ以上のアプリケーション、センサ、又は計器か
らの生のログメッセージをトークン化し、トークン化されたストリームをデータオブジェクトに変換して異常検出及びログメッセージの異常警告のためにログメッセージを異なる異常検出器に転送する。そして、本番システムで実行されている1つ以上のアプリケーション、センサ、又は計器から異常警告を生成する。」技術が開示されている。
特許文献1に記載の手段では、アプリケーションの挙動を記録するログデータを用いて機械学習モデルを訓練することで、アプリケーションにおいて発生する異常の挙動を検出する手法が記載されている。
しかし、特許文献1のような従来のログデータに基づく異常検出手法では、ログの意味的特徴、グラフベースの特徴、又はその相互作用は考慮されないため、クラウド環境等のような、複雑且つダイナミックなシステム環境への有効性が限定されてしまう。
また、実際には、テレメトリ情報は、ログデータのみならず、メトリック及びトレースの情報を含む。グラフ特徴を有するトレースは、サービス間の相互作用を示し、時間的特徴を有するメトリックは、サービス内の依存関係を示すため、アプリケーション全体の挙動に関する洞察を得る観点から、ログデータと共に解析することが望ましい。しかし、ログ、メトリック及びトレースの基本構造の相違により、ログ、メトリック及びトレースを全て考慮する異常検出手法が提供されていない。
そこで、本開示は、テレメトリ情報におけるログ、メトリック及びトレースのぞれぞれの特徴を考慮する機械学習モデルを生成することで、マイクロサービスに関する高精度の異常検出が可能な異常検出手法を提供することを目的とする。
上記の課題を解決するために、代表的な本発明の異常検出装置の一つは、プロセッサとメモリとを備え、前記メモリは、第1のマイクロサービスのセットから、マイクロサービスの挙動を示すログを含むログ情報と、複数のマイクロサービスの関係を示すトレースを含むトレース情報と、マイクロサービスの性能に関する測定値を示すメトリックを含むメトリック情報と、を含む第1のテレメトリ情報を取得するテレメトリ情報取得部と、前記第1のテレメトリ情報から抽出した学習用テレメトリ情報をニューラルネットワークによって処理することで、前記トレース情報に対応するトレース埋め込みを生成し、前記ログ情報に対応するログ埋め込みを生成し、前記メトリック情報に対応するメトリック埋め込みを生成する埋め込み生成部と、前記トレース埋め込み、前記ログ埋め込み及び前記メトリック埋め込みに基づいて、マイクロサービスについて異常の有無を判定する異常検出用の機械学習モデルを生成するモデル生成部と、前記異常検出用の機械学習モデルを用いて、第2のマイクロサービスのセットについて取得された第2のテレメトリ情報を解析することで、前記第2のマイクロサービスにおける異常の有無を示す異常検出結果を生成する異常検出部として前記プロセッサを機能させるための処理命令を含む。
本開示によれば、テレメトリ情報におけるログ、メトリック及びトレースのぞれぞれの特徴を考慮する機械学習モデルを生成することで、マイクロサービスに関する高精度の異常検出が可能な異常検出手法を提供することができる。
上記以外の課題、構成及び効果は、以下の発明を実施するための形態における説明により明らかにされる。
上記以外の課題、構成及び効果は、以下の発明を実施するための形態における説明により明らかにされる。
以下、図面を参照して、本発明の実施形態について説明する。なお、この実施形態により本発明が限定されるものではない。また、図面の記載において、同一部分には同一の符号を付して示している。
また、「第1」、「第2」、「第3」等の用語は、本開示において様々な要素又は構成要素を説明するのに用いられる場合があるが、これらの要素又は構成要素はこれらの用語によって限定されるべきでないことが理解されるであろう。これらの用語は、或る要素又は構成要素を別の要素又は構成要素と区別するためにのみ用いられる。したがって、以下で論述する第1の要素又は構成要素は、本発明概念の教示から逸脱することなく第2の要素又は構成要素と呼ぶこともできる。
また、「第1」、「第2」、「第3」等の用語は、本開示において様々な要素又は構成要素を説明するのに用いられる場合があるが、これらの要素又は構成要素はこれらの用語によって限定されるべきでないことが理解されるであろう。これらの用語は、或る要素又は構成要素を別の要素又は構成要素と区別するためにのみ用いられる。したがって、以下で論述する第1の要素又は構成要素は、本発明概念の教示から逸脱することなく第2の要素又は構成要素と呼ぶこともできる。
(本開示の概要)
本開示の実施形態に係る異常検出手段は、マイクロサービスに関するテレメトリ情報に含まれるメトリック、ログ及びトレースのそれぞれの特徴を捉えた埋め込みに基づいて、テレメトリ情報における異常及び異常の要因を検出することができる機械学習モデルを生成することに関する。本開示の実施形態に係る異常検出手段は、マイクロサービスからテレメトリ情報を取得するテレメトリ情報取得処理、取得したテレメトリ情報に基づいて異常検出用の機械学習モデルを生成するモデル生成処理、及びこのように生成した異常検出用の機械学習モデルを用いてマイクロサービスにおける異常を検出する異常検出処理を含んでもよい。
本開示の実施形態に係る異常検出手段は、マイクロサービスに関するテレメトリ情報に含まれるメトリック、ログ及びトレースのそれぞれの特徴を捉えた埋め込みに基づいて、テレメトリ情報における異常及び異常の要因を検出することができる機械学習モデルを生成することに関する。本開示の実施形態に係る異常検出手段は、マイクロサービスからテレメトリ情報を取得するテレメトリ情報取得処理、取得したテレメトリ情報に基づいて異常検出用の機械学習モデルを生成するモデル生成処理、及びこのように生成した異常検出用の機械学習モデルを用いてマイクロサービスにおける異常を検出する異常検出処理を含んでもよい。
テレメトリ情報取得処理は、マイクロサービスからテレメトリ情報を取得するための処理であり、例えばログファイル、メトリック及びトレースを取得するLoki(登録商標)、Prometheus(登録商標)及びTempo(登録商標)等の既存の手法によって行われてもよい。
モデル生成処理は、テレメトリ情報取得処理によって取得されたメトリック、ログ及びトレースのそれぞれの特徴を捉えた埋め込みを用いて機械学習モデルを生成するための処理である。ここでの「埋め込み」とは、メトリック、ログ及びトレースのそれぞれの特徴を低次元空間で表現するデータ構造であり、例えば連続ベクトルやグラフ表現を含んでもよい。埋め込みを生成するための特徴は、例えばPCA(Principal Component Analysis)、Mutual Information、又はSHAP(SHapley Additive exPlanations)等の手法によって選択されてもよい。
異常検出処理は、モデル生成処理によって生成された異常検出用の機械学習モデルを用いてテレメトリ情報を解析することで、マイクロサービスにおける異常を検出するための処理である。この異常検出処理では、異常検出用の機械学習モデルは、所定のマイクロサービスにおいて異常が存在する確率を示す異常検出結果を生成し、ユーザに出力してもよい。
本開示の実施形態に係る異常検出手段によれば、ログ、メトリック及びトレースにおける特徴を捉えた埋め込みを用いて機械学習モデルを訓練することで、マイクロサービスの様々な側面を考慮した、幅広い異常検出か可能な異常検出用の機械学習モデルを得ることができる。また、本開示の実施形態に係る異常検出手段の一態様では、解析したログ、メトリック及びトレースに基づいて、検出した異常の要因をユーザに通知することができる。
このように、マイクロサービスに関する高精度の異常検出が可能となる。
このように、マイクロサービスに関する高精度の異常検出が可能となる。
次に、図1を参照して、本開示の実施形態を実施するためのコンピュータシステム100について説明する。本明細書で開示される様々な実施形態の機構及び装置は、任意の適切なコンピューティングシステムに適用されてもよい。コンピュータシステム100の主要コンポーネントは、1つ以上のプロセッサ102、メモリ104、端末インターフェース112、ストレージインタフェース113、I/O(入出力)デバイスインタフェース114、及びネットワークインターフェース115を含む。これらのコンポーネントは、メモリバス106、I/Oバス108、バスインターフェースユニット109、及びI/Oバスインターフェースユニット110を介して、相互的に接続されてもよい。
コンピュータシステム100は、プロセッサ102と総称される1つ又は複数の汎用プログラマブル中央処理装置(CPU)102A及び102Bを含んでもよい。ある実施形態では、コンピュータシステム100は複数のプロセッサを備えてもよく、また別の実施形態では、コンピュータシステム100は単一のCPUシステムであってもよい。各プロセッサ102は、メモリ104に格納された命令を実行し、オンボードキャッシュを含んでもよい。
ある実施形態では、メモリ104は、データ及びプログラムを記憶するためのランダムアクセス半導体メモリ、記憶装置、又は記憶媒体(揮発性又は不揮発性のいずれか)を含んでもよい。メモリ104は、本明細書で説明する機能を実施するプログラム、モジュール、及びデータ構造の全て又は一部を格納してもよい。例えば、メモリ104は、異常検出アプリケーション150を格納していてもよい。ある実施形態では、異常検出アプリケーション150は、後述する機能をプロセッサ102上で実行する命令又は記述を含んでもよい。
ある実施形態では、異常検出アプリケーション150は、プロセッサベースのシステムの代わりに、又はプロセッサベースのシステムに加えて、半導体デバイス、チップ、論理ゲート、回路、回路カード、及び/又は他の物理ハードウェアデバイスを介してハードウェアで実施されてもよい。ある実施形態では、異常検出アプリケーション150は、命令又は記述以外のデータを含んでもよい。ある実施形態では、カメラ、センサ、又は他のデータ入力デバイス(図示せず)が、バスインターフェースユニット109、プロセッサ102、又はコンピュータシステム100の他のハードウェアと直接通信するように提供されてもよい。
コンピュータシステム100は、プロセッサ102、メモリ104、表示システム124、及びI/Oバスインターフェースユニット110間の通信を行うバスインターフェースユニット109を含んでもよい。I/Oバスインターフェースユニット110は、様々なI/Oユニットとの間でデータを転送するためのI/Oバス108と連結していてもよい。I/Oバスインターフェースユニット110は、I/Oバス108を介して、I/Oプロセッサ(IOP)又はI/Oアダプタ(IOA)としても知られる複数のI/Oインタフェースユニット112,113,114、及び115と通信してもよい。
表示システム124は、表示コントローラ、表示メモリ、又はその両方を含んでもよい。表示コントローラは、ビデオ、オーディオ、又はその両方のデータを表示装置126に提供することができる。また、コンピュータシステム100は、データを収集し、プロセッサ102に当該データを提供するように構成された1つ又は複数のセンサ等のデバイスを含んでもよい。
例えば、コンピュータシステム100は、心拍数データやストレスレベルデータ等を収集するバイオメトリックセンサ、湿度データ、温度データ、圧力データ等を収集する環境センサ、及び加速度データ、運動データ等を収集するモーションセンサ等を含んでもよい。これ以外のタイプのセンサも使用可能である。表示システム124は、単独のディスプレイ画面、テレビ、タブレット、又は携帯型デバイスなどの表示装置126に接続されてもよい。
I/Oインタフェースユニットは、様々なストレージ又はI/Oデバイスと通信する機能を備える。例えば、端末インタフェースユニット112は、ビデオ表示装置、スピーカテレビ等のユーザ出力デバイスや、キーボード、マウス、キーパッド、タッチパッド、トラックボール、ボタン、ライトペン、又は他のポインティングデバイス等のユーザ入力デバイスのようなユーザI/Oデバイス116の取り付けが可能である。ユーザは、ユーザインターフェースを使用して、ユーザ入力デバイスを操作することで、ユーザI/Oデバイス116及びコンピュータシステム100に対して入力データや指示を入力し、コンピュータシステム100からの出力データを受け取ってもよい。ユーザインターフェースは例えば、ユーザI/Oデバイス116を介して、表示装置に表示されたり、スピーカによって再生されたり、プリンタを介して印刷されたりしてもよい。
ストレージインタフェース113は、1つ又は複数のディスクドライブや直接アクセスストレージ装置117(通常は磁気ディスクドライブストレージ装置であるが、単一のディスクドライブとして見えるように構成されたディスクドライブのアレイ又は他のストレージ装置であってもよい)の取り付けが可能である。ある実施形態では、ストレージ装置117は、任意の二次記憶装置として実装されてもよい。メモリ104の内容は、ストレージ装置117に記憶され、必要に応じてストレージ装置117から読み出されてもよい。I/Oデバイスインタフェース114は、プリンタ、ファックスマシン等の他のI/Oデバイスに対するインターフェースを提供してもよい。ネットワークインターフェース115は、コンピュータシステム100と他のデバイスが相互的に通信できるように、通信経路を提供してもよい。この通信経路は、例えば、ネットワーク130であってもよい。
ある実施形態では、コンピュータシステム100は、マルチユーザメインフレームコンピュータシステム、シングルユーザシステム、又はサーバコンピュータ等の、直接的ユーザインターフェースを有しない、他のコンピュータシステム(クライアント)からの要求を受信するデバイスであってもよい。他の実施形態では、コンピュータシステム100は、デスクトップコンピュータ、携帯型コンピューター、ノートパソコン、タブレットコンピュータ、ポケットコンピュータ、電話、スマートフォン、又は任意の他の適切な電子機器であってもよい。
次に、図2を参照して、本開示の実施形態に係る異常検出システムについて説明する。
図2は、本開示の実施形態に係る異常検出システム200の構成の一例を示す図である。異常検出システム200は、テレメトリ情報におけるログ、メトリック及びトレースのぞれぞれの特徴を考慮する機械学習モデルを生成することで、マイクロサービスに関する異常を検出するためのシステムである。図2に示すように、異常検出システム200は、異常検出装置210と、通信ネットワーク250と、ユーザ端末260とからなる。異常検出装置210とユーザ端末260とは、通信ネットワーク250を介して互いに接続されてもよい。
異常検出装置210は、テレメトリ情報におけるログ、メトリック及びトレースのぞれぞれの特徴を考慮する機械学習モデルを生成することで、マイクロサービスに関する異常を検出する検出するための装置であり、図2に示すように、メモリ220、記憶部230、プロセッサ244及び入出力部246を主に含む。
ある実施形態では、異常検出装置210は、図1に示すコンピュータシステム100によって実装されてもよい。
ある実施形態では、異常検出装置210は、図1に示すコンピュータシステム100によって実装されてもよい。
メモリ220は、本開示の実施形態に係る異常検出手段の機能を実施するための異常検出アプリケーション150を格納するためのメモリである。この異常検出アプリケーション150は、図2に示すように、テレメトリ情報取得部222、埋め込み生成部224、モデル生成部226及び異常検出部228等のソフトウェアモジュールの機能を実施するための処理命令を含んでもよい。
テレメトリ情報取得部222は、マイクロサービスに関するテレメトリ情報を取得するための機能部である。ある実施形態では、テレメトリ情報取得部222は、例えばログ情報、メトリック情報及びトレース情報をテレメトリ情報として取得するLoki(登録商標)、Prometheus(登録商標)及びTempo(登録商標)等の既存の手法であってもよい。また、テレメトリ情報取得部222は、取得したテレメトリ情報を記憶部230に格納されるテレメトリ情報DB232に保存してもよい。
なお、テレメトリ情報取得部222による動作の詳細については後述するため、ここではその説明を省略する。
なお、テレメトリ情報取得部222による動作の詳細については後述するため、ここではその説明を省略する。
埋め込み生成部224は、テレメトリ情報取得部222によって取得されたテレメトリ情報を処理し、特徴を捉えた埋め込みを生成するための機能部である。ある実施形態では、埋め込み生成部224は、トレース情報におけるサービス関係の特徴、ログ情報における意味的特徴及びログ関係の特徴、並びにメトリック情報における時間的特徴及びメトリック関係の特徴のそれぞれを低次元空間で表現する埋め込みを生成することができる。
なお、埋め込み生成部224による動作の詳細については後述するため、ここではその説明を省略する。
なお、埋め込み生成部224による動作の詳細については後述するため、ここではその説明を省略する。
モデル生成部226は、埋め込み生成部224によって生成された埋め込みを用いて、テレメトリ情報における異常を検出するための機械学習モデルを生成する。ある実施形態では、モデル生成部226は、生成した機械学習モデルを記憶部230に格納されるモデルDB234に保存してもよい。
なお、モデル生成部226による動作の詳細については後述するため、ここではその説明を省略する。
なお、モデル生成部226による動作の詳細については後述するため、ここではその説明を省略する。
異常検出部228は、モデル生成部226によって生成され、モデルDB234に保存されている異常検出用の機械学習モデルを取得した後、当該異常検出用の機械学習モデルを用いてマイクロサービスに関するテレメトリ情報を解析することで、当該マイクロサービスにおける異常を検出するための機能部である。ある実施形態では、異常検出部228は、マイクロサービスに関して検出した異常と、当該異常の要因等に関する情報を示す異常検出結果をシステム管理者等のユーザに提示してもよい。
なお、異常検出部228による動作の詳細については後述するため、ここではその説明を省略する。
なお、異常検出部228による動作の詳細については後述するため、ここではその説明を省略する。
記憶部230は、本開示の実施形態に係る各種情報を格納するためのデータベース(以下、「DB」)を収容する記憶領域であり、図2に示すように、テレメトリ情報DB232及びモデルDB234を含んでもよい。
テレメトリ情報DB232は、テレメトリ情報取得部222によって取得された、マイクロサービスに関するテレメトリ情報を格納するためのデータベースである。ある実施形態では、このテレメトリ情報DB232は、複数のマイクロサービスに関するログ情報、トレース情報及びメトリック情報を含んでもよい。
モデルDB234は、モデル生成部226によって生成された、異常検出用の機械学習モデルを格納するためのデータベースである。このモデルDB234は、異常検出用の機学習モデルの特性や要件に基づいて選択されるデータベース方式で構成されてもよい。
プロセッサ244は、メモリ220によって格納される異常検出アプリケーション150の各機能部の機能を規定する処理命令を実施するための処理部である。
入出力部246は、異常検出装置210に入力される情報を受け付けると共に、異常検出装置210によって生成される異常検出結果を出力するための機能部である。ある実施形態では、入出力部246は、例えばキーボード、マウス、GUI(Graphical User Interface)を表示するディスプレイ等を含んでもよい。ある実施形態では、入出力部246は、各種情報の入出力を行うGUIをユーザ端末260に提供してもよい。
通信ネットワーク250は、例えばローカルエリアネットワーク(LAN)、ワイドエリアネットワーク(WAN)、衛星ネットワーク、ケーブルネットワーク、WiFiネットワーク、又はそれらの任意の組み合わせを含むものであってもよい。
ユーザ端末260は、異常検出装置210のユーザによって利用可能な端末装置である。ユーザは、ユーザ端末260を用いることで、特定のマイクロサービスに対する異常検出の実行を要求したり、異常検出結果を確認したりすることができる。一例として、ユーザ端末260は、例えばマイクロサービスを管理するユーザのスマートフォン、スマートウォッチ、タブレット、パソコン等を含んでもよく、特に限定されない。
なお、図2では、説明の便宜上、1つのユーザ端末260を含む構成を一例として説明しているが、ユーザ端末260の数は限定されず、複数のユーザ端末260を含む構成も可能である。
なお、図2では、説明の便宜上、1つのユーザ端末260を含む構成を一例として説明しているが、ユーザ端末260の数は限定されず、複数のユーザ端末260を含む構成も可能である。
以上説明した異常検出システムによれば、マイクロサービスに関するログ情報、メトリック情報及びトレース情報等のテレメトリ情報を考慮した、高精度の異常検出が可能となる。
上述したように、異常検出装置210は、本開示の実施形態に係る異常検出手段のそれぞれの機能を実現するために、テレメトリ情報取得部222、埋め込み生成部224、モデル生成部226及び異常検出部228等の機能部や、テレメトリ情報DB232及びモデルDB234等のデータベースを含んでもよい。次に、図3を参照して、本開示の実施形態に係る異常検出装置に含まれる機能部やデータベースによって実現され、本開示の実施形態に係る異常検出手段の全体の流れについて説明する。
図3は、本開示の実施形態に係る異常検出手段の全体の流れ300を示す図である。異常検出手段の全体の流れ300は、テレメトリ情報に基づいて異常検出用の機械学習モデルを生成するモデル生成段階と、生成した異常検出用の機械学習モデルを用いて所定のマイクロサービスに対する異常検出を行う異常検出段階との2つの段階を主に含む。
まず、ステップS305では、テレメトリ情報取得部222は、マイクロサービスに関するテレメトリ情報を取得する。ここで、テレメトリ情報取得部222は、例えばログ情報、メトリック情報及びトレース情報をテレメトリ情報として取得するLoki(登録商標)、Prometheus(登録商標)及びTempo(登録商標)等の既存の手法を用いてもよい。
本開示では、「メトリック情報」とは、ハードウェア又はソフトウェアの性能を定量的に示す測定値を示すメトリックの集合を含む情報である。ここでのメトリックは、例えば特定の期間におけるCPU使用率やメモリ使用量等を含んでもよい。
また、本開示では、「ログ情報」とは、マイクロサービスにおける特定のコードブロックが実行された時にシステムによって生成されるテキスト形式のログを含む情報である。ここでのログは、例えば実行されたコードブロックの内容を示すテキスト情報と、当該コードブロックが実行された日時を示すタイムスタンプとを含んでもよい。
また、本開示では、「トレース情報」とは、複数のマイクロサービスからなるマイクロサービスエコシステムの異なるコンポーネント間の関係を示すトレースを含む情報である。ここでのトレースは、例えばある処理タスクを実行するためサービスによって呼び出される従属サービスとの関係をグラフ形式で示す関係図であってもよい。
また、本開示では、「ログ情報」とは、マイクロサービスにおける特定のコードブロックが実行された時にシステムによって生成されるテキスト形式のログを含む情報である。ここでのログは、例えば実行されたコードブロックの内容を示すテキスト情報と、当該コードブロックが実行された日時を示すタイムスタンプとを含んでもよい。
また、本開示では、「トレース情報」とは、複数のマイクロサービスからなるマイクロサービスエコシステムの異なるコンポーネント間の関係を示すトレースを含む情報である。ここでのトレースは、例えばある処理タスクを実行するためサービスによって呼び出される従属サービスとの関係をグラフ形式で示す関係図であってもよい。
次に、ステップS310では、埋め込み生成部224は、現在の処理がモデル生成段階にあるか異常検出段階にあるかを判定する。この判定は、例えばユーザの指示に基づいて行われてもよい。一例として、ユーザは、後述する異常検出管理画面1400において、モデル生成段階又は異常検出段階のいずれかを選択してもよい。
モデル生成段階の場合、本処理はステップS320へ進む。一方、異常検出段階の場合、本処理はステップS340へ進む。
モデル生成段階の場合、本処理はステップS320へ進む。一方、異常検出段階の場合、本処理はステップS340へ進む。
現在の処理がモデル生成段階にあると判定された場合、ステップS315では、埋め込み生成部224は、ステップS305で取得されたテレメトリ情報を、機械学習モデルを訓練するための学習セットと、訓練した機械学習モデルをテストするための検証セットとに分割した後、テレメトリ情報の学習セットにおける特徴を抽出し、抽出した特徴に基づいた埋め込みを生成する。ここでの埋め込みは、特徴を抽象化した低次元空間で表現するグラフ表現やベクトル等であってもよい。
次に、ステップS320では、モデル生成部226は、ステップS315で生成されたグラフ表現やベクトル等のテレメトリ情報の埋め込みを用いて、異常検出用の機械学習モデルを訓練する。
次に、ステップS325では、モデル生成部226は、ステップS320で生成した異常検出用の機械学習モデルを用いて、ステップS315で生成したテレメトリ情報の検証セットに対する異常検出処理を行う。テレメトリ情報の検証セットに対する異常検出の精度が所定の性能閾値未満の場合、本処理はステップS315へ戻り、テレメトリ情報に対する新たな埋め込みが生成される。一方、テレメトリ情報の検証セットに対する異常検出の精度が所定の性能閾値以上の場合、本処理はステップS330へ進む。
次に、ステップS330では、モデル生成部226は、ステップS325で生成した異常検出用の機械学習モデルと、モデルDB234に保存されている既存の機械学習モデルを比較し、新たに生成した異常検出用の機械学習モデルに基づいて既存の機械学習モデルを更新するか、新たな異常検出用の機械学習モデルとして保存すべきかを判定する。ある実施形態では、モデル生成部226は、新たに生成した機械学習モデルに基づいて既存の機械学習モデルを更新するか、新たな異常検出用の機械学習モデルとして保存すべきかを、それぞれの機械学習モデルに関するメタデータ(モデルID、精度等)に基づいて判定してもよい。
次に、ステップS335では、モデル生成部226は、ステップS330の判定に従って、ステップS325で生成した異常検出用の機械学習モデルに基づいてモデルDB234に保存されている既存の機械学習モデルを更新するか、ステップS325で生成した異常検出用の機械学習モデルを新たな機械学習モデルとしてモデルDB234に保存する。
ステップS310で現在の処理が異常検出段階にあると判定された場合、ステップS340では、異常検出部228は、モデルDB234から、異常検出用の機械学習モデルを取得する。
次に、ステップS345では、異常検出部228は、ステップS340で取得した異常検出用の機械学習モデルを用いて、ステップS305で取得されたテレメトリ情報を、ステップS315で生成した埋め込みと同じ形式(例えば、グラフ表現、ベクトル)に変換する。
次に、ステップS350では、異常検出部228は、ステップS340で取得した異常検出用の機械学習モデルを用いて、ステップS345で変換したテレメトリ情報を解析することで、当該テレメトリ情報に対応するマイクロサービスに関する異常を検出する。ここで、異常検出部228は、テレメトリ情報に対して異常を検出するために、例えばPCA等の統計的な手法や、SHAP等の機械学習手法を用いてもよい。
次に、ステップS355では、異常検出部228は、ステップS350での異常検出の結果を可視化し、マイクロサービスに関する異常及びその要因を示す異常検出結果を、図2に示す入出力部246を介して、ユーザ端末260に表示されるGUI(Graphical User Interface)でユーザに提示する。
図3に示す異常検出手段によれば、テレメトリ情報におけるログ、メトリック及びトレースのぞれぞれの特徴を考慮する機械学習モデルを生成することで、マイクロサービスに関する高精度の異常検出が可能となる。
次に、図4を参照して、本開示の実施形態に係るモデル生成段階における処理の流れについて説明する。
図4は、本開示の実施形態に係るモデル生成段階におけるモデル生成処理400の流れを示す図である。図4に示すモデル生成処理400は、マイクロサービスに関するテレメトリ情報に基づいて、当該マイクロサービスにおける異常を検出するための異常検出用の機械学習モデルを生成するための処理であり、図2に示すテレメトリ情報取得部222、埋め込み生成部224及びモデル生成部226によって実施される。
まず、ステップS405では、テレメトリ情報取得部222は、対象のマイクロサービスに関するテレメトリ情報を取得する。上述したように、ここで、テレメトリ情報取得部222は、例えばログ情報、メトリック情報及びトレース情報をテレメトリ情報として取得するLoki(登録商標)、Prometheus(登録商標)及びTempo(登録商標)等の既存の手法を用いてもよい。
次に、ステップS410では、埋め込み生成部224は、ステップS405で取得されたテレメトリ情報を、機械学習モデルを訓練するための学習セットと、訓練した機械学習モデルをテストするための検証セットとに分割した後、テレメトリ情報の学習セットにおける特徴を抽出し、抽出した特徴に基づいた埋め込みを生成する。ある実施形態では、埋め込み生成部224は、交差検証手法(cross-validation)を用いてテレメトリ情報を学習セットと検証セットとに分割してもよい。
テレメトリ情報に含まれるログ情報、トレース情報及びメトリック情報のそれぞれは、マイクロサービスに関する異なる特性を表現するために、異なるデータ構造を有する。例えば、複数のマイクロサービスの関係を示すトレースは、空間的及び時間的な依存性(spatial and temporal dependency)を有するグラフ形式で表現され、マイクロサービスの挙動を示すログは、特定の期間(periodicity)に関する自然言語形式で表現され、マイクロサービスの性能に関するメトリックは、時間的周期性(seasonality)を有する数値形式で表現される。
ログ情報、トレース情報及びメトリック情報のそれぞれの構造的な相違により、それぞれの重要な特徴を捉えた埋め込みの生成が難しく、従来では、ログ情報、トレース情報及びメトリック情報の全てを考慮した異常検出用手段が提供されていない。
ログ情報、トレース情報及びメトリック情報のそれぞれの構造的な相違により、それぞれの重要な特徴を捉えた埋め込みの生成が難しく、従来では、ログ情報、トレース情報及びメトリック情報の全てを考慮した異常検出用手段が提供されていない。
そこで、本開示の実施形態に係る埋め込み生成部224は、テレメトリ情報に含まれるログ情報、トレース情報及びメトリック情報のそれぞれの特性を考慮した埋め込み手段を用いて、ログ情報、トレース情報及びメトリック情報のそれぞれの特徴を低次元空間で表現する埋め込みを生成した後、これらの3つの埋め込みを集約することで、テレメトリ情報に基づいて高精度の異常検出が可能な機械学習モデルを生成することに関する。
より具体的には、埋め込み生成部224は、テレメトリ情報の学習セットにおけるトレース情報から、複数のマイクロサービス間の階層関係を示すサービス関係の特徴を抽出し、所定のグラフ埋め込み手法を用いてこれらのサービス関係の特徴を処理することで、サービス関係の特徴を低次元空間で表現するトレース埋め込みを生成する。
また、埋め込み生成部224は、テレメトリ情報の学習セットにおけるログ情報から、マイクロサービスの挙動をテキスト形式で示すログの内容を示す意味的特徴と、複数のログ間の関係を示すログ関係の特徴とを抽出し、所定のグラフ埋め込み手法を用いて意味的特徴及びログ関係の特徴を処理することで、意味的特徴及びログ関係の特徴とを低次元空間で表現するログ埋め込みを生成する。
更に、埋め込み生成部224は、テレメトリ情報の学習セットにおけるメトリック情報から、マイクロサービスの性能に関する測定値の時間的周期性を示す時間的特徴と、複数のメトリック間の依存関係を示すメトリック関係の特徴とを抽出し、所定の時間的埋め込み手法を用いて時間的特徴及びメトリック関係の特徴を処理することで、時間的特徴とメトリック関係の特徴とを低次元空間で表現するメトリック埋め込みを生成する。
また、埋め込み生成部224は、テレメトリ情報の学習セットにおけるログ情報から、マイクロサービスの挙動をテキスト形式で示すログの内容を示す意味的特徴と、複数のログ間の関係を示すログ関係の特徴とを抽出し、所定のグラフ埋め込み手法を用いて意味的特徴及びログ関係の特徴を処理することで、意味的特徴及びログ関係の特徴とを低次元空間で表現するログ埋め込みを生成する。
更に、埋め込み生成部224は、テレメトリ情報の学習セットにおけるメトリック情報から、マイクロサービスの性能に関する測定値の時間的周期性を示す時間的特徴と、複数のメトリック間の依存関係を示すメトリック関係の特徴とを抽出し、所定の時間的埋め込み手法を用いて時間的特徴及びメトリック関係の特徴を処理することで、時間的特徴とメトリック関係の特徴とを低次元空間で表現するメトリック埋め込みを生成する。
一例として、ここで、埋め込み生成部224は、ログ及びトレースに存在する関係やパターンを示す低次元のグラフ表現を生成し、メトリックを低次元のベクトルに変換してもよい。このメトリックの変換は、例えばいわゆるワンホットエンコーディング(One-Hot Encoding)やラベルエンコーディング(Label Encoding)によって行われてもよい。
このように、所定のマイクロサービスのセットについて、複数のマイクロサービス間の階層関係を示すサービス関係の特徴、マイクロサービスの挙動をテキスト形式で示すログの内容を示す意味的特徴、複数のログ間の関係を示すログ関係の特徴、マイクロサービスの性能に関する測定値の時間的周期性を示す時間的特徴と、複数のメトリック間の依存関係を示すメトリック関係の特徴とを考慮した異常検出が可能な機械学習モデルを生成することができる。
次に、ステップS415では、モデル生成部226は、ステップS410で生成されたグラフ表現やベクトル等のテレメトリ情報の埋め込みを用いて、異常検出用の機械学習モデルを訓練する。より具体的には、ここで、モデル生成部226は、ステップS315で生成されたグラフ表現やベクトル等の埋め込みを用いて、テレメトリ情報における特徴や関係を未訓練のGNN等の機械学習モデルに学習させることで、訓練済みの異常検出用の機械学習モデルを生成してもよい。
次に、ステップS420では、モデル生成部226は、ステップS410で生成した異常検出用の機械学習モデルを用いて、ステップS410で生成したテレメトリ情報の検証セットに対する異常検出処理を行う。テレメトリ情報の検証セットに対する異常検出の精度が所定の性能閾値未満の場合、本処理はステップS410へ戻り、テレメトリ情報に対する新たな埋め込みが生成される。一方、テレメトリ情報の検証セットに対する異常検出の精度が所定の性能閾値以上の場合、本処理はステップS425へ進む。
なお、ここでの性能閾値は、ビジネスのニーズ、試行錯誤、シミュレーション結果等に基づいて、ユーザによって適宜に設定されてもよい。
なお、ここでの性能閾値は、ビジネスのニーズ、試行錯誤、シミュレーション結果等に基づいて、ユーザによって適宜に設定されてもよい。
次に、ステップS425では、モデル生成部226は、ステップS420で生成した異常検出用の機械学習モデルを、モデルDB234に保存されている既存の機械学習モデルを比較し、新たに生成した異常検出用の機械学習モデルに基づいて既存の機械学習モデルを更新するか、新たな異常検出用の機械学習モデルとして保存する。
以上説明したモデル生成処理400によれば、ログ情報、メトリック情報及びトレース情報におけるサービス関係の特徴、意味的特徴、ログ関係の特徴、時間的特徴及びメトリック関係の特徴を捉えた埋め込みを用いてGNN等の機械学習モデルを訓練することで、マイクロサービスの様々な側面について異常検出が可能な異常検出用の機械学習モデルを生成することができる。
次に、図5を参照して、本開示の実施形態に係る異常検出段階における異常検出処理について説明する。
図5は、本開示の実施形態に係る異常検出段階における異常検出処理500の流れを示す図である。図5に示す異常検出処理500は、図4に示すモデル生成処理400によって生成された異常検出用の機械学習モデルを用いて、所定のマイクロサービスに関するテレメトリ情報を解析することで、当該マイクロサービスにおける異常を検出するための処理であり、図2に示す異常検出部228によって実施される。
まず、ステップS505では、テレメトリ情報取得部222は、対象のマイクロサービスに関するテレメトリ情報を取得する。上述したように、ここで、テレメトリ情報取得部222は、例えばログ情報、メトリック情報及びトレース情報をテレメトリ情報として取得するLoki(登録商標)、Prometheus(登録商標)及びTempo(登録商標)等の既存の手法を用いてもよい。
次に、ステップS510では、異常検出部228は、モデルDB234から、図4に示すモデル生成処理400によって生成された異常検出用の機械学習モデルを取得する。
次に、ステップS515では、異常検出部228は、ステップS510で取得した異常検出用の機械学習モデルを用いて、ステップS505で取得されたテレメトリ情報を、図4に示すモデル生成処理400のステップS410で生成した埋め込みと同じ形式(例えば、グラフ表現、ベクトル)に変換する。
次に、ステップS520では、異常検出部228は、ステップS510で取得した異常検出用の機械学習モデルを用いて、ステップS515で変換したテレメトリ情報を解析することで、当該テレメトリ情報に対応するマイクロサービスに関する異常を検出する。ここで、異常検出部228は、テレメトリ情報に対して異常を検出するために、例えばPCA等の統計的な手法や、SHAP等の機械学習手法を用いてもよい。
次に、ステップS525では、異常検出部228は、ステップS520での異常検出の結果を可視化し、マイクロサービスに関する異常及びその要因を示す異常検出結果を、図2に示す入出力部246を介して、ユーザ端末260に表示されるGUI(Graphical User Interface)でユーザに提示する。
以上説明した異常検出処理500によれば、マイクロサービスに関するテレメトリ情報を解析することで、当該マイクロサービスにおける異常を検出することができる。
次に、図6を参照して、本開示の実施形態に係る異常検出用の機械学習モデルを生成する際の動作について説明する。
図6は、本開示の実施形態に係る異常検出用の機械学習モデルを生成する際の動作の一例を示す図である。図6に示す動作は、図4を参照して説明したモデル生成処理400におけるステップS415に実質的に対応し、テレメトリ情報を用いて異常検出用の機械学習モデルを生成するための動作である。
まず、図6に示すように、テレメトリ情報取ステップS610では、トレース情報611、メトリック情報612及びログ情報613を含むテレメトリ情報がテレメトリ情報取得部222によって取得される。
その後、トレース情報611、メトリック情報612及びログ情報613のそれぞれは、ニューラルネットワークの異なる埋め込み層に入力される。より具体的には、トレース情報611は、トレース埋め込み層621に入力され、メトリック情報612はメトリック埋め込み層622に入力され、ログ情報613はログ埋め込み層623に入力されてもよい。
その後、トレース情報611、メトリック情報612及びログ情報613のそれぞれは、ニューラルネットワークの異なる埋め込み層に入力される。より具体的には、トレース情報611は、トレース埋め込み層621に入力され、メトリック情報612はメトリック埋め込み層622に入力され、ログ情報613はログ埋め込み層623に入力されてもよい。
トレース埋め込み層621、メトリック埋め込み層622及びログ埋め込み層623のそれぞれは、入力されるテレメトリ情報から特徴を抽出する。
例えば、トレース埋め込み層621は、トレース情報611から、複数のマイクロサービス間の階層関係を示すサービス関係の特徴を抽出してもよい。
例えば、トレース埋め込み層621は、トレース情報611から、複数のマイクロサービス間の階層関係を示すサービス関係の特徴を抽出してもよい。
メトリック埋め込み層622は、メトリック情報612から、マイクロサービスの性能に関する測定値の時間的周期性を示す時間的特徴と、複数のメトリック間の依存関係を示すメトリック関係の特徴とを抽出してもよい。
ログ埋め込み層623は、ログ情報613から、マイクロサービスの挙動をテキスト形式で示すログの内容を示す意味的特徴と、複数のログ間の関係を示すログ関係の特徴とを抽出してもよい。
ここで、特徴を抽出するためには、トレース埋め込み層621、メトリック埋め込み層622及びログ埋め込み層623のそれぞれは、既存の特徴抽出手段を用いてもよく、ここでは特に限定されない。
ログ埋め込み層623は、ログ情報613から、マイクロサービスの挙動をテキスト形式で示すログの内容を示す意味的特徴と、複数のログ間の関係を示すログ関係の特徴とを抽出してもよい。
ここで、特徴を抽出するためには、トレース埋め込み層621、メトリック埋め込み層622及びログ埋め込み層623のそれぞれは、既存の特徴抽出手段を用いてもよく、ここでは特に限定されない。
トレース埋め込み層621、メトリック埋め込み層622及びログ埋め込み層623のそれぞれは、入力されるテレメトリ情報の特性に基づいて設定された埋め込み手段を適用するように構成されてもよい。一例として、トレース埋め込み層621及びログ埋め込み層623は、抽出した特徴に対してグラフ埋め込み(graph embedding)、メトリック埋め込み層622は、抽出した特徴に対して時間的埋め込み(temporal embedding)を実施するように構成されてもよい。
次に、集約ステップS630では、埋め込み層621、622、623によって生成されるそれぞれの埋め込みは、集約層635(aggregation layer)によって集約され、予測層641(全結合層やdense layerともいう)に入力されるための単一の潜在表現が生成される。この潜在表現は、トレース埋め込み、ログ埋め込み及びメトリック埋め込みを低次元空間で表現する情報であり、例えばベクトルやグラフ表現であってもよい。
次に、予測ステップS640では、集約ステップS630で生成された潜在表現が予測層641(dense layer)に入力される。予測層641は、入力される潜在表現に対してReLU(Rectified Linear Unit)関数等の活性化関数を用いることで、マイクロサービスに関するテレメトリ情報における異常の有無を示す異常スコア645を生成することができる。生成された異常スコア645を、例えばテレメトリ情報における実際の異常を示すグラウンドトゥルースと比較することで、予測層641の精度を評価することができる。この比較の結果、予測層641の精度が所定の精度閾値以上の場合、トレース埋め込み層621、メトリック埋め込み層622及びログ埋め込み層623、集約層635及び予測層641のパラメータが凍結され、異常検出用の機械学習モデルとして保存されてもよい。
図6に示す、異常検出用の機械学習モデルを生成する際の動作によれば、ログ情報、メトリック情報及びトレース情報におけるサービス関係の特徴、意味的特徴、ログ関係の特徴、時間的特徴及びメトリック関係の特徴を捉えた埋め込みを用いてGNN等の機械学習モデルを訓練することで、マイクロサービスの様々な側面について異常検出が可能な異常検出用の機械学習モデルを生成することができる。
上述したように、本開示の一態様は、テレメトリ情報に含まれるメトリック情報、トレース情報及びログ情報のそれぞれについて、有意義な特徴を低次元のデータ空間で表現する埋め込みを生成することに関する。
次に、図7~9を参照して、本開示の実施形態に係るメトリック情報、トレース情報及びログ情報に対する埋め込みを生成する処理の一例について説明する。
次に、図7~9を参照して、本開示の実施形態に係るメトリック情報、トレース情報及びログ情報に対する埋め込みを生成する処理の一例について説明する。
図7は、本開示の実施形態に係るトレース情報に対する埋め込みを生成する処理の一例を示す図である。上述したように、本開示の実施形態に係るトレース情報とは、複数のマイクロサービスからなるマイクロサービスエコシステムの異なるコンポーネント間の関係を示すトレースを含む情報である。ここでのトレースは、例えばある処理タスクを実行するためサービスによって呼び出される従属サービスとの関係をグラフ形式で示す関係図であってもよい。
上述したように、本開示の実施形態に係る異常検出手段は、トレースで表現されるサービス間の関係を考慮するすることで、より高精度の異常検出結果を生成することができる。
上述したように、本開示の実施形態に係る異常検出手段は、トレースで表現されるサービス間の関係を考慮するすることで、より高精度の異常検出結果を生成することができる。
より具体的には、マイクロサービスにおける第1のサービスが第2のサービスを呼び出した場合、第1のサービス及び第2のサービスの間には依存関係が形成される。また、第2のサービスは、他のサービス(第3、第4のサービス)を呼び出し、これらのサービスも他のサービスを更に呼び出す場合があり、これらの全ての呼び出されたサービスの間には依存関係が存在する。このように、多数のサービスが依存関係で結ばれる「サービス呼び出し連鎖」が形成され、このサービス呼び出し連鎖を示す情報は「トレース」と呼ばれる。
図7に示すように、一例として、トレース710が示される。トレース710には、第1のサービス700に対応するノードや、第2のサービス702に対応するノードは、依存関係701によって接続される。
図7に示すように、一例として、トレース710が示される。トレース710には、第1のサービス700に対応するノードや、第2のサービス702に対応するノードは、依存関係701によって接続される。
トレース710に対する埋め込みを生成する場合、トレース710における各ノードがGNN等のグラフベースの機械学習モデルのトレース埋め込み層715に入力される。その後、トレース埋め込み層715は、トレース710に示される、複数のマイクロサービス間の階層関係を示すサービス関係の特徴を抽出した後、各ノードのノード属性、ノード間の関係を示す近隣情報(neighborhood information)、マイクロサービスが実装されているクラスタを示すグローバル情報(global information)をベクトル形式で表現するトレース埋め込み720を生成する。
ここで、トレース埋め込み720を生成するグラフ埋め込み手段として、例えば行列因子分解(Matrix factorization)、ランダムウォークベース手法(Random walk-based methods)、グラフ畳み込みネットワーク(Graph Convolutional Networks; GCN)グラフ注意ネットワーク(Graph Attention Networks;GAT)等を用いてもよい。
ここで、トレース埋め込み720を生成するグラフ埋め込み手段として、例えば行列因子分解(Matrix factorization)、ランダムウォークベース手法(Random walk-based methods)、グラフ畳み込みネットワーク(Graph Convolutional Networks; GCN)グラフ注意ネットワーク(Graph Attention Networks;GAT)等を用いてもよい。
このように、トレース情報に対してグラフ埋め込み手法を用いることで、複数のマイクロサービス間の階層関係を示すサービス関係の特徴を表現するトレース埋め込みを生成することができる。
図8は、本開示の実施形態に係るメトリックに対する埋め込みを生成する処理の一例を示す図である。上述したように、本開示の実施形態に係るメトリックとは、ハードウェア又はソフトウェアの性能を定量的に示す測定値を示すメトリックの集合を含む情報である。ここでのメトリックは、例えば特定の期間におけるCPU使用率やメモリ使用量等を含んでもよい。
また、一般に、マイクロサービスの使用量は、周期的に変動することがある(例えば、企業で用いられるマイクロサービスは、当該企業の営業時間内では使用量が増加し、営業時間外では使用量が減る等)。このため、マイクロサービスにおける時間的な周期性は、メトリックにおいても反映される。更に、複数のメトリックの中で、依存関係にあるメトリックが存在する(例えば、CPU使用量がメモリ使用量と比例する等)。
上述したように、本開示の実施形態に係る異常検出手段は、メトリックにおける周期性や、メトリック間の関係を考慮するすることでより高精度の異常検出結果を生成することができる。
上述したように、本開示の実施形態に係る異常検出手段は、メトリックにおける周期性や、メトリック間の関係を考慮するすることでより高精度の異常検出結果を生成することができる。
図8に示すように、取得したテレメトリ情報におけるメトリック805は、ニューラルネットワークの埋め込み層810に入力することで、埋め込み層810は、入力したメトリック805から、マイクロサービスの性能に関する測定値の時間的周期性を示す時間的特徴と、複数のメトリック間の依存関係を示すメトリック関係の特徴とを抽出し、抽出した特徴に基づいて、ベクトル等の低次元表現をメトリック埋め込み815として生成することができる。
ここでの埋め込み層810は、例えば、複数のメトリックの相互依存性を学習するアテンションメカニズムを備える回帰型ニューラルネットワークのレイヤや、メトリックの周期性や内部依存性の特徴を学習する時間的アテンションレイヤ(Temporal attention layer)であってもよい。
このように、メトリック情報に対して時間的埋め込み主要を用いることで、メトリックにおける周期性を示す時間的特徴や、メトリック間の関係性を示すメトリック関係の特徴を表現するメトリック埋め込みを生成することができる。
このように、メトリック情報に対して時間的埋め込み主要を用いることで、メトリックにおける周期性を示す時間的特徴や、メトリック間の関係性を示すメトリック関係の特徴を表現するメトリック埋め込みを生成することができる。
図9は、本開示の実施形態に係るログに対する埋め込みを生成する処理の一例を示す図である。上述したように、本開示の実施形態に係るログとは、マイクロサービスにおける特定のコードブロックが実行された時にシステムによって生成されるテキスト形式のログを含む情報である。ここでのログは、例えば実行されたコードブロックの内容を示すテキスト情報と、当該コードブロックが実行された日時を示すタイムスタンプとを含んでもよい。
一般に、ログの内容は、自然言語で構成されているテキストで表現されているため、ログに対する埋め込みを生成するに当たって、このテキストの意味的内容(semantic content)を考慮することが望ましい。また、ログは、他のログ(例えば、連続するログ)に関連する内容を含むことがあるため、これらのログ間の関係を埋め込みに反映させることが望ましい。
図9には、特定のマイクロサービスの挙動に関する複数のログからなるログシーケンス910の一例を示す。ログシーケンス910における各ログのテキストの内容は、意味的ベクトル912として表現することができる。この意味的ベクトル912は、例えばワンホットエンコーディング等によって生成されてもよい。
このログシーケンス910に基づいて、各ログを、意味的ベクトルを特徴として有するノード922として示し、連続するログ間の関係をエッジ924として示すロググラフ920を生成することができる。
このログシーケンス910に基づいて、各ログを、意味的ベクトルを特徴として有するノード922として示し、連続するログ間の関係をエッジ924として示すロググラフ920を生成することができる。
次に、ロググラフ920に対する埋め込みを生成する場合、図7を参照して説明したトレースの埋め込みと同様に、ロググラフ920における各ノードがGNN等のグラフベースの機械学習モデルのログ埋め込み層930に入力される。その後、ログ埋め込み層930は、マイクロサービスの挙動をテキスト形式で示す前記ログの内容を示す意味的特徴と、複数のログ間の関係を示すログ関係の特徴とを抽出した後、各ノードのノード属性、ノード間の関係を示す近隣情報(neighborhood information)、マイクロサービスが実装されているクラスタを示すグローバル情報(global information)をベクトル形式で表現するログ埋め込み935を生成する。
ここで、ログ埋め込み935を生成するグラフ埋め込み手段として、例えば行列因子分解(Matrix factorization)、ランダムウォークベース手法(Random walk-based methods)、グラフ畳み込みネットワーク(Graph Convolutional Networks; GCN)グラフ注意ネットワーク(Graph Attention Networks;GAT)等を用いてもよい。
ここで、ログ埋め込み935を生成するグラフ埋め込み手段として、例えば行列因子分解(Matrix factorization)、ランダムウォークベース手法(Random walk-based methods)、グラフ畳み込みネットワーク(Graph Convolutional Networks; GCN)グラフ注意ネットワーク(Graph Attention Networks;GAT)等を用いてもよい。
このように、ログ情報に対してグラフ埋め込み手法を用いることで、ログの意味的内容を示す意味的特徴や、ログ間の関係を示すログ関係の特徴を表現するログ埋め込みを生成することができる。
次に、図10を参照して、本開示の実施形態に係る集約層の動作について説明する。
図10は、本開示の実施形態に係る集約層の動作の一例を示す図である。上述したように、異常検出用の機械学習モデルを生成する際、テレメトリ情報に含まれるトレース情報、ログ情報及びメトリック情報のそれぞれについて生成された埋め込みは、ニューラルネットワークの集約層によって集約され、単一の潜在表現が生成される。図10では、集約層の動作の一例について説明する。
まず、トレース埋め込み、ログ埋め込み及びメトリック埋め込みからなる埋め込みセット1010は、集約層1020に入力される。集約層1020は、埋め込みセット1010に含まれるそれぞれの埋め込みの元となったテレメトリ情報(トレース情報、ログ情報、メトリック情報)が取得された期間の細かなタイムスタンプを、時間単位、日単位、週単位などの離散単位にマッピングさせた後、同じ時間単位に対応する埋め込みを時間単位埋め込み(time-unit embeddings)に集約する。
その後、集約層1020は、例えば加算や行列内積などの連結演算によって、時間単位埋め込みを時間的埋め込み(temporal embedding)1030に集約する。
その後、集約層1020は、例えば加算や行列内積などの連結演算によって、時間単位埋め込みを時間的埋め込み(temporal embedding)1030に集約する。
次に、融合層1040は、例えば加算や行列内積などの連結演算によって、時間的埋め込み1030を融合し、単一の潜在表現1050を生成する。この潜在表現1050は、トレース埋め込み、ログ埋め込み及びメトリック埋め込みを低次元空間で表現する情報であり、例えばベクトルやグラフ表現であってもよい。
このように、集約層を用いてトレース埋め込み、ログ埋め込み及びメトリック埋め込みを集約することで、テレメトリ情報における異常を検出するための異常検出用の機械学習モデルを生成することができる。
次に、図11を参照して、本開示の実施形態に係る異常検出用の機械学習モデルとして機能するニューラルネットワークの構成について説明する。
図11は、本開示の実施形態に係る異常検出用の機械学習モデルとして機能するニューラルネットワーク1150の構成の一例を示す図である。図11に示すように、ニューラルネットワーク1150は、入力層1100、複数の隠れ層1101、及び出力層1102を含む。また、入力層1100、隠れ層1101及び出力層1102は、エッジ1104、1106によって互いに接続されている。
入力層1100は、低次元空間に表現されているテレメトリ情報(例えば、テレメトリ情報から生成されている埋め込み)を入力する。次に、入力層1100における各ノード1103は、入力したテレメトリ情報に対する処理や変換を行うことで、テレメトリ情報から抽出した特徴からなる特徴ベクトルを生成する。その後、これらの特徴ベクトルは、隠れ層1101に入力される。
隠れ層1101のそれぞれは、入力データに対して一連の演算を実行する複数のノード1105からなる。より具体的には、隠れ層1101は、入力する特徴ベクトルに対する重みを適用することで得られる値に対して活性化関数を適用する。特徴ベクトルに対する重みは、ニューラルネットワーク1150によって生成される結果(異常の予測)のグラウンドトゥルースに対する誤差を最小化する訓練処理によって判定されてもよい。
出力層1102は、最後の隠れ層1101から、重みの適用及び活性化関数の適用によって変換された特徴ベクトルを入力し、これらの特徴ベクトルに基づいて、テレメトリ情報における異常の有無を示す異常予測結果を生成する。次に、出力層1102は、例えばソフトマックス関数等の隠れ層1101とは異なる活性化関数を用いて、出力クラスにわたって確率分布を生成する。ある実施形態では、この異常予測結果は、テレメトリにおいて異常が存在する確率を示す情報であってもよい。例えば、異常予測結果が「50%」を超える確率を示す場合、テレメトリ情報において異常が存在すると判定されてもよい。
なお、異常検出用の機械学習モデルを生成するモデル生成段階では、特徴ベクトルに対して適用する重みは調整可能であるが、異常検出段階では、重みや、ニューラルネットワーク1150の各層のパラメータはフリーズ(凍結)される。
なお、異常検出用の機械学習モデルを生成するモデル生成段階では、特徴ベクトルに対して適用する重みは調整可能であるが、異常検出段階では、重みや、ニューラルネットワーク1150の各層のパラメータはフリーズ(凍結)される。
ある実施形態では、異常予測結果の生成に用いられる特徴のランク付けを行うSHAP(SHapley Additive exPlanations)等のラッパー(wrapper)をニューラルネットワーク1150に実装してもよい。ラッパーは、ニューラルネットワーク1150による予測に用いられる各特徴の重要性の尺度を計算することができる。
異常検出用の機械学習モデルを生成するモデル生成段階では、SHAP等のラッパーを用いることで、異常検出に対するテレメトリ情報の各特徴の相対的な貢献度を特定し、貢献度がより高い特徴に対してより高い重みを適用してもよい。また、異常検出段階では、このSHAPは、異常予測結果の生成に用いられる特徴のランク付けを行うことで、特定の異常予測結果が生成された理由(なぜ異常があると判定されたかを示す説明等)や、異常の要因の候補を生成し、出力することができる。
異常検出用の機械学習モデルを生成するモデル生成段階では、SHAP等のラッパーを用いることで、異常検出に対するテレメトリ情報の各特徴の相対的な貢献度を特定し、貢献度がより高い特徴に対してより高い重みを適用してもよい。また、異常検出段階では、このSHAPは、異常予測結果の生成に用いられる特徴のランク付けを行うことで、特定の異常予測結果が生成された理由(なぜ異常があると判定されたかを示す説明等)や、異常の要因の候補を生成し、出力することができる。
図11に示すニューラルネットワーク1150によれば、マイクロサービスのテレメトリ情報に基づいて、マイクロサービスにおける異常の有無を高精度で検出することが可能となる。
次に、図12を参照して、本開示の実施形態に係る異常検出用の機械学習モデルをモデルDBに格納又は取得する処理の流れについて説明する。
図12は、本開示の実施形態に係る異常検出用の機械学習モデルの格納・取得処理1200の一例を示す図である。格納・取得処理1200は、異常検出用の機械学習モデルを生成した後、モデルDB234に格納するための処理や、テレメトリ情報に対して異常検出を行う際に、訓練済みの異常検出用の機械学習モデルをモデルDB234から取得するための処理であり、モデル生成部226及び異常検出部228によって実施される。
まず、ステップS1205では、モデル生成部226は、例えば図4に示すモデル生成処理400によって生成した異常検出用の機械学習モデル1201を所定の形式に変換するシリアル化を行う。例えば、ここで、モデル生成部226は、異常検出用の機械学習モデル1201をJSON、Pickle、Protocol Buffer等の形式に変換してもよい。
次に、ステップS1210では、モデル生成部226は、異常検出用の機械学習モデル1201を保存するデータベース方式を選択する。ここでのデータベース方式とは、データの格納及び取得に関するルールを規定する、データベースの構成・管理方法である。原則として、大量のデータの高性能の読み書き動作や、バイナリーデータ及びメタデータの格納が可能なデータベース方式を選択することが望ましいが、異常検出用の機械学習モデル1201の用途や性能に応じて選択されてもよい。データベース方式の例として、例えばMongoDB(登録商標)、Cassandra(登録商標)、Redis(登録商標)及びDynamoDB(登録商標)等が考えられる。
次に、ステップS1215では、モデル生成部226は、異常検出用の機械学習モデル1201を、メタデータ及びプロフィール情報1213に対応付けた後、ステップS1210で選択したデータベース方式で構成されるモデルDB234に格納する。メタデータ及びプロフィール情報1213は、例えば異常検出用の機械学習モデル1201の生成日時、アーキテクチャ、評価するためのメトリック統計、データカバレッジ、バージョン、プロジェクトID、シリアル形式の情報を含んでもよい。
上述したように、異常検出用の機械学習モデル1201をモデルDB234に格納する際、異常検出用の機械学習モデル1201を新たなモデルとして保存してもよく、既存のモデルを異常検出用の機械学習モデル1201に基づいて更新してもよい。ある実施形態では、モデル生成部226は、新たに生成した機械学習モデルに基づいて既存の機械学習モデルを更新するか、新たな異常検出用の機械学習モデルとして保存すべきかを、それぞれの機械学習モデルに関するメタデータ及びプロフィール情報1213に基づいて判定してもよい。
上述したように、異常検出用の機械学習モデル1201をモデルDB234に格納する際、異常検出用の機械学習モデル1201を新たなモデルとして保存してもよく、既存のモデルを異常検出用の機械学習モデル1201に基づいて更新してもよい。ある実施形態では、モデル生成部226は、新たに生成した機械学習モデルに基づいて既存の機械学習モデルを更新するか、新たな異常検出用の機械学習モデルとして保存すべきかを、それぞれの機械学習モデルに関するメタデータ及びプロフィール情報1213に基づいて判定してもよい。
次に、ステップS1220では、テレメトリ情報に対して異常検出を行う際、異常検出部228は、モデルDB234から、異常検出用の機械学習モデル1201を取得する。ここで、異常検出部228は、例えば異常検出用の機械学習モデル1201に対応付けられているメタデータ及びプロフィール情報1213に基づく検索を実施することで、適切な異常検出用の機械学習モデル1201をモデルDB234から取得してもよい。また、異常検出用の機械学習モデル1201を取得した後、異常検出部228は、取得した異常検出用の機械学習モデル1201をシリアル形式からモデルオブジェクト形式に変換してもよい。
以上説明した格納・取得処理1200によれば、異常検出用の機械学習モデルを適切なデータベースに格納すると共に、テレメトリ情報に対して異常検出を行う際に、容易に取得することができる。
次に、図13を参照して、本開示の実施形態に係るモデルDBの論理的データベーススキーマについて説明する。
図13は、本開示の実施形態に係るモデルDBの論理的データベーススキーマ1300の一例を示す図である。ここでの論理的データベーススキーマ1300は、上述したモデルDB234において本開示の実施形態に係る異常検出用の機械学習モデルを格納するためのデータベースの構造である。
図13に示すように、モデルDB234の論理的データベーススキーマ1300は、特定の異常検出用の機械学習モデルを一意に識別するモデルID1301、異常検出用の機械学習モデルについて、モデルID1301、生成日時1302、モデルアーキテクチャ1303、メトリック統計1304、データカバレッジ1305、バージョン1306、プロジェクトID1307及びシリアル形式1308を含んでもよい。
モデルID1301は、異常検出用の機械学習モデルを識別するための一意の識別子を示す情報である。。
生成日時1302は、異常検出用の機械学習モデルの生成日時や更新日時などのタイムスタンプを示す情報である。
モデルアーキテクチャ1303は、、異常検出用の機械学習モデルの設計や構造を表すアーキテクチャやネットワークの形式を示す情報である。
メトリック統計は、異常検出用の機械学習モデルの性能を評価するために計測される統計的な指標や評価指標を示す情報である。
データカバレッジ1305は、異常検出用の機械学習モデルの訓練や評価に使用されるデータの範囲や網羅性を示す指標である。
生成日時1302は、異常検出用の機械学習モデルの生成日時や更新日時などのタイムスタンプを示す情報である。
モデルアーキテクチャ1303は、、異常検出用の機械学習モデルの設計や構造を表すアーキテクチャやネットワークの形式を示す情報である。
メトリック統計は、異常検出用の機械学習モデルの性能を評価するために計測される統計的な指標や評価指標を示す情報である。
データカバレッジ1305は、異常検出用の機械学習モデルの訓練や評価に使用されるデータの範囲や網羅性を示す指標である。
バージョン1306は、異常検出用の機械学習モデルのバージョン管理をするための番号や識別子を示す情報である。
プロジェクトID1307は、異常検出用の機械学習モデルが所属するプロジェクトを識別するための一意の識別子を示す情報である。
シリアル形式1308は、異常検出用の機械学習モデルをシリアル化する際のデータの形式やフォーマットを示す情報である。
行1309は、論理的データベーススキーマ1300に格納される各種データのデータ種類を示す情報である。
行1310は、論理的データベーススキーマ1300に格納される異常検出用の機械学習モデルの情報の一例を示す。
プロジェクトID1307は、異常検出用の機械学習モデルが所属するプロジェクトを識別するための一意の識別子を示す情報である。
シリアル形式1308は、異常検出用の機械学習モデルをシリアル化する際のデータの形式やフォーマットを示す情報である。
行1309は、論理的データベーススキーマ1300に格納される各種データのデータ種類を示す情報である。
行1310は、論理的データベーススキーマ1300に格納される異常検出用の機械学習モデルの情報の一例を示す。
図13に示すモデルDB234の論理的データベーススキーマ1300によれば、異常検出用の機械学習モデルの効率的な格納や検索が可能となる。例えば、ある実施形態では、ユーザは、論理的データベーススキーマ1300において、「精度が97%以上」の異常検出用の機械学習モデルを検索したり、「GNN」とのアーキテクチャ形式の異常検出用の機械学習モデルを検索したりすることができる。また、論理的データベーススキーマ1300によれば、ユーザは、複数のアーキテクチャやプロジェクトの間で、複数のモデルを容易に比較することができる。
次に、図14を参照して、本開示の実施形態に係る異常検出管理画面について説明する。
図14は、本開示の実施形態に係る異常検出管理画面1400の一例を示す図である。異常検出管理画面1400は、異常検出用の機械学習モデルを生成する際の設定を入力すると共に、テレメトリ情報に対して実施される異常検出処理の結果を確認するためのユーザインターフェースであり、例えば図2に示す入出力部246を介して、ユーザ端末260に出力し、表示されてもよい。
図14に示すように、異常検出管理画面1400は、保存ボタン1401、設定ボタン1402、クラスタ名設定ウインドウ1403、ネームスペース設定ウインドウ1404、時間範囲設定ウインドウ1405、異常グラフ表示ウインドウ1406、メトリック表示ウインドウ1407、ログ表示ウインドウ1408、トレース表示ウインドウ1409及び詳細表示ウインドウ1410を含んでもよい。
保存ボタン1401は、異常検出管理画面1400に表示されている情報を保存するためのボタンである。
設定ボタン1402は、異常検出用の機械学習モデルを生成する際の設定を入力するための画面(図示せず)を開くためのボタンである。
クラスタ名設定ウインドウ1403は、対象のマイクロサービスが実装されている物理的なクラスタ(サーバのセット等)を選択し、特定するためのボタンである。
ネームスペース設定ウインドウ1404は、1つの物理的なクラスタ上で実装されている仮想クラスタを選択し、特定するためのボタンである。
時間範囲設定ウインドウ1405は、テレメトリ情報が取得される時間範囲を設定するためのボタンである。
設定ボタン1402は、異常検出用の機械学習モデルを生成する際の設定を入力するための画面(図示せず)を開くためのボタンである。
クラスタ名設定ウインドウ1403は、対象のマイクロサービスが実装されている物理的なクラスタ(サーバのセット等)を選択し、特定するためのボタンである。
ネームスペース設定ウインドウ1404は、1つの物理的なクラスタ上で実装されている仮想クラスタを選択し、特定するためのボタンである。
時間範囲設定ウインドウ1405は、テレメトリ情報が取得される時間範囲を設定するためのボタンである。
異常グラフ表示ウインドウ1406は、所定の期間について、対象のテレメトリ情報において検出された異常の数を時間毎に示す異常グラフを示すウインドウである。
メトリック表示ウインドウ1407は、所定の期間について、異常が最も多発しているメトリックを時間毎に示すウインドウである。メトリック表示ウインドウ1407によれば、ユーザは、異常が最も多発しているメトリックが発生したマイクロサービスを特定することができる。
ログ表示ウインドウ1408は、所定の期間について、異常が最も多発しているログを時間毎に示すウインドウである。ログ表示ウインドウ1408によれば、ユーザは、異常が最も多発しているメトリックが発生したマイクロサービスを特定することができる。
トレース表示ウインドウ1409は、所定の期間について、異常が最も多発しているトレースを時間毎に示すウインドウである。トレース表示ウインドウ1409によれば、ユーザは、異常が最も多発しているトレースにおけるサービスの階層関係を確認することができる。
メトリック表示ウインドウ1407は、所定の期間について、異常が最も多発しているメトリックを時間毎に示すウインドウである。メトリック表示ウインドウ1407によれば、ユーザは、異常が最も多発しているメトリックが発生したマイクロサービスを特定することができる。
ログ表示ウインドウ1408は、所定の期間について、異常が最も多発しているログを時間毎に示すウインドウである。ログ表示ウインドウ1408によれば、ユーザは、異常が最も多発しているメトリックが発生したマイクロサービスを特定することができる。
トレース表示ウインドウ1409は、所定の期間について、異常が最も多発しているトレースを時間毎に示すウインドウである。トレース表示ウインドウ1409によれば、ユーザは、異常が最も多発しているトレースにおけるサービスの階層関係を確認することができる。
詳細表示ウインドウ1410は、ユーザによって選択された特定のメトリック、ログ、又はトレースに関する詳細情報を表示するためのウインドウである。例えば、ユーザは、詳細表示ウインドウ1410を用いることで、異常が発生した特定のマイクロサービスに関するログを確認することができる。
図14に示す異常検出管理画面1400によれば、本開示の実施形態に係る異常検出装置210のユーザは、異常検出用の機械学習モデルを生成する際の設定を入力すると共に、テレメトリ情報に対して実施される異常検出処理の結果を容易に確認することができる。
次に、図15を参照して、本開示の実施形態に係るクラウドコンピューティング環境について説明する。
図15は、本開示の実施形態に係るクラウドコンピューティング環境1500の一例を示す図である。クラウドコンピューティング環境1500は、本開示の実施形態に係る異常検出システム200を実現するために用いてもよい。例えば、本開示の実施形態に係る異常検出システム200や、異常検出の対象となるマイクロサービスは、同一又は異なるクラウドコンピューティング環境において実装されてもよい。
クラウドコンピューティング環境1500は、1つ以上のクラウドコンピューティングノードから構成されており、各コンピューティングノードは、ストレージデバイス1507、コンピューティングマシン1508及びネットワークデバイス1509が連携して動作する。また、各コンピューティングノードは、デスクトップコンピューター1510、ノートパソコン1501、スマートフォン1502、ドローン1503、病院のコンピュータシステム1504、自動車のコンピュータシステム1505、銀行のコンピュータシステム1506などの、クラウドユーザが使用するローカルのコンピューティングデバイスと通信する。
また、各コンピューティングノードは、プライベート、コミュニティ、パブリック、又はハイブリッドクラウドなど、物理的又は仮想的に1つ以上のサブネットワークにグループ化されてもよい。このクラウドコンピューティング環境1500によれば、様々なソフトウェアやサービスをクラウドコンピューティングモデルとして提供することが可能となる。
一般に、クラウドコンピューティングモデルとは、最小限の管理努力又はサービス・プロバイダとの対話で迅速に供給及び解放することができる構成可能なコンピューティング・リソース(例えば、ネットワーク、ネットワーク帯域幅、サーバ、処理、メモリ、ストレージ、アプリケーション、仮想マシン、及びサービス)の共有プールに対するオンデマンドの便利なネットワーク・アクセスを可能にするためのサービス配信のモデルである。このクラウドモデルは、少なくとも5つの特性、少なくとも3つのサービスモデル、及び少なくとも4つの展開モデルを含むことができる。
具体的には、以下が典型的な特性である。
オンデマンドのセルフサービス:クラウド・コンシューマは、サーバ時間及びネットワーク・ストレージといったコンピューティング能力を、必要に応じて、人間がサービスのプロバイダと対話する必要なく自動的に、一方的に供給することができる。
オンデマンドのセルフサービス:クラウド・コンシューマは、サーバ時間及びネットワーク・ストレージといったコンピューティング能力を、必要に応じて、人間がサービスのプロバイダと対話する必要なく自動的に、一方的に供給することができる。
広範なネットワーク・アクセス:能力は、ネットワーク上で利用可能であり、異種のシン又はシック・クライアント・プラットフォーム(例えば、携帯電話、ラップトップ及び PDA)による使用を促進する標準的な機構を通じてアクセスされる。
リソースのプール化:プロバイダのコンピューティング・リソースは、マルチ・テナント・モデルを用いて、複数のコンシューマに供されるようにプールされ、異なる物理及び仮想リソースは、要求に応じて動的に割り当て及び再割り当てされる。コンシューマは、一般に、提供されるリソースの正確な位置に関する制御又は知識を有していないが、より高いレベルの抽象概念(例えば、国、州、又はデータセンタ)で位置を指定することができる場合があるという点で、位置独立の感覚が存在する。
リソースのプール化:プロバイダのコンピューティング・リソースは、マルチ・テナント・モデルを用いて、複数のコンシューマに供されるようにプールされ、異なる物理及び仮想リソースは、要求に応じて動的に割り当て及び再割り当てされる。コンシューマは、一般に、提供されるリソースの正確な位置に関する制御又は知識を有していないが、より高いレベルの抽象概念(例えば、国、州、又はデータセンタ)で位置を指定することができる場合があるという点で、位置独立の感覚が存在する。
迅速な弾力性:能力は、迅速かつ弾力的に、場合によっては自動的に供給されてすばやくスケール・アウトし、迅速に解放されてすばやくスケール・インすることができる。コンシューマにとっては、供給するために利用可能な能力は、無制限に見えることが多く、いつでもどんな量でも購入することができる。
計測されるサービス:クラウド・システムは、サービスのタイプ(例えば、ストレージ、処理、帯域幅、及びアクティブなユーザアカウント)に適した何らかの抽象レベルで計量能力を活用することによって、リソース使用を自動的に制御及び最適化する。リソース使用は、利用されるサービスのプロバイダとコンシューマの両方にとって透明性をもたらすように、監視し、制御し、報告することができる。
サービス・モデルは、典型的には以下のとおりである。
サービスとしてのソフトウェア(SaaS;Software as a Service):コンシューマに提供される能力は、クラウド・インフラストラクチャ上で実行されるプロバイダのアプリケーションを使用することである。アプリケーションは、ウェブブラウザなどのシンクライアント・インタフェース(例えば、ウェブ・ベースの電子メール)を通じて、種々のクライアントデバイスからアクセス可能である。限定されたユーザ特有のアプリケーション構成設定を可能な例外として、コンシューマは、ネットワーク、サーバ、オペレーティング・システム、ストレージ、又は個々のアプリケーション能力をも含む基盤となるクラウド・インフラストラクチャを管理又は制御しない。
サービスとしてのソフトウェア(SaaS;Software as a Service):コンシューマに提供される能力は、クラウド・インフラストラクチャ上で実行されるプロバイダのアプリケーションを使用することである。アプリケーションは、ウェブブラウザなどのシンクライアント・インタフェース(例えば、ウェブ・ベースの電子メール)を通じて、種々のクライアントデバイスからアクセス可能である。限定されたユーザ特有のアプリケーション構成設定を可能な例外として、コンシューマは、ネットワーク、サーバ、オペレーティング・システム、ストレージ、又は個々のアプリケーション能力をも含む基盤となるクラウド・インフラストラクチャを管理又は制御しない。
サービスとしてのプラットフォーム(PaaS;Platform as a Service):コンシューマに提供される能力は、プロバイダによってサポートされるプログラミング言語及びツールを用いて作成される、コンシューマが作成又獲得したアプリケーションを、クラウド・インフラストラクチャ上に展開することである。コンシューマは、ネットワーク、サーバ、オペレーティング・システム、又はストレージを含む基盤となるクラウド・インフラストラクチャを管理又は制御しないが、展開されたアプリケーション、及び場合によってはアプリケーション・ホスティング環境構成に対する制御を有する。
サービスとしてのインフラストラクチャ(IaaS;Infrastructure as a Service):コンシューマに提供される能力は、処理、ストレージ、ネットワーク、及び他の基本的なコンピューティング・リソースを供給することであり、ここで、コンシューマは、オペレーティング・システム及びアプリケーションを含むことができる任意のソフトウェアを展開して実行させることができる。コンシューマは、基盤となるクラウド・インフラストラクチャを管理又は制御しないが、オペレーティング・システム、ストレージ、展開されたアプリケーションに対する制御、及び場合によっては選択されたネットワーキング・コンポーネント(例えば、ホストのファイアウォール)の限定的な制御を有する。
展開モデルは典型的には以下の通りである。
プライベート・クラウド:クラウド・インフラストラクチャは、ある組織のためだけに操作される。クラウド・インフラストラクチャは、その組織又は第三者によって管理することができ、オンプレミス又はオフプレミスで存在することができる。
プライベート・クラウド:クラウド・インフラストラクチャは、ある組織のためだけに操作される。クラウド・インフラストラクチャは、その組織又は第三者によって管理することができ、オンプレミス又はオフプレミスで存在することができる。
コミュニティ・クラウド:クラウド・インフラストラクチャは、幾つかの組織によって共有され、関心事項(例えば、ミッション、セキュリティ要件、ポリシー、及びコンプライアンス上の考慮事項)を共有する特定のコミュニティをサポートする。クラウド・インフラストラクチャは、それらの組織又は第三者により管理することができ、オンプレミス又はオフプレミスで存在することができる。
パブリック・クラウド:クラウド・インフラストラクチャは、一般公衆又は大規模な業界グループが利用できるようにされており、クラウド・サービスを販売する組織によって所有される。
ハイブリッド・クラウド:クラウド・インフラストラクチャは、固有のエンティティを残しているが、データ及びアプリケーションのポータビリティを可能にする標準化された又は専用の技術(例えば、クラウド間の負荷平衡のためのクラウド・バースティング)によって互いに結び付けられた2つ又はそれより多いクラウド(プライベート、コミュニティ、又はパブリック)の組合せである。
クラウドコンピューティング環境は、サービス提供を中心としており、無国籍性、低い結語ウド、モジュール性、及び意味論的相互運用性に焦点を合わせている。クラウドコンピューティングの中心は、相互接続されたノードのネットワークを含むインフラスト ラクチャである。代表的なクラウドコンピューティングノードは、上記図2に示すようなものである。具体的には、クラウドコンピューティングノード内には、他の多数の汎用又は専用コンピューティングシステム環境又は構成で動作可能なコンピュータシステム/サーバが存在する。コンピュータシステム/サーバと共に用いるのに適したものとすることができる周知のコンピューティングシステム、環境、及び/又は構成の例は、パーソナルコンピュータシステム、サーバコンピュータシステム、シンクライアント、シッククライアント、手持ち式又はラップトップ型デバイス、マルチプロセッサシステム、マイクロプロセッサ・ベースのシステム、セットトップボックス、プログラム可能コンシューマ・エレクトロニクス、ネットワークPC、ミニコンピュータシステム、メイン フレームコンピュータシステム、及び上記システム又はデバイスなどのいずれかを含む分散型クラウドコンピューティング環境を含むが、これらに限定されない。コンピュータシステム/サーバは、コンピュータシステムによって実行されているプログラム・モジュールなどのコンピュータシステム実行可能命令の一般的なコンテキストで説明することができる。一般に、プログラム・モジュールは、特定のタスクを実施する、又は特定の抽象データ型式を実装する、ルーチン、プログラム、オブジェクト、コンポーネント、論理、データ構造などを含むことができる。コンピュータシステム/サーバは、通信ネットワークを通じてリンクされた遠隔処理デバイスによってタスクが行われる分散型クラウドコンピューティング環境内で実施することができる。分散型クラウドコンピューティング環境においては、プログラム・モジュールは、メモリ・ストレージデバイスを含むローカル及び遠隔の両方のコンピュータシステム・ストレージ媒体内に配置することができる。
上述したように、本開示の実施形態に係る異常検出手段は、以下の態様を含む。
(態様1)
異常検出装置であって、
プロセッサとメモリとを備え、
前記メモリは、
第1のマイクロサービスのセットから、
マイクロサービスの挙動を示すログを含むログ情報と、
複数のマイクロサービスの関係を示すトレースを含むトレース情報と、
マイクロサービスの性能に関する測定値を示すメトリックを含むメトリック情報と、
を含む第1のテレメトリ情報を取得するテレメトリ情報取得部と、
前記第1のテレメトリ情報から抽出した学習用テレメトリ情報をニューラルネットワークによって処理することで、前記トレース情報に対応するトレース埋め込みを生成し、前記ログ情報に対応するログ埋め込みを生成し、前記メトリック情報に対応するメトリック埋め込みを生成する埋め込み生成部と、
前記トレース埋め込み、前記ログ埋め込み及び前記メトリック埋め込みに基づいて、マイクロサービスについて異常の有無を判定する異常検出用の機械学習モデルを生成するモデル生成部と、
前記異常検出用の機械学習モデルを用いて、第2のマイクロサービスのセットについて取得された第2のテレメトリ情報を解析することで、前記第2のマイクロサービスにおける異常の有無を示す異常検出結果を生成する異常検出部、
として前記プロセッサを機能させるための処理命令を含むことを特徴とする異常検出装置。
異常検出装置であって、
プロセッサとメモリとを備え、
前記メモリは、
第1のマイクロサービスのセットから、
マイクロサービスの挙動を示すログを含むログ情報と、
複数のマイクロサービスの関係を示すトレースを含むトレース情報と、
マイクロサービスの性能に関する測定値を示すメトリックを含むメトリック情報と、
を含む第1のテレメトリ情報を取得するテレメトリ情報取得部と、
前記第1のテレメトリ情報から抽出した学習用テレメトリ情報をニューラルネットワークによって処理することで、前記トレース情報に対応するトレース埋め込みを生成し、前記ログ情報に対応するログ埋め込みを生成し、前記メトリック情報に対応するメトリック埋め込みを生成する埋め込み生成部と、
前記トレース埋め込み、前記ログ埋め込み及び前記メトリック埋め込みに基づいて、マイクロサービスについて異常の有無を判定する異常検出用の機械学習モデルを生成するモデル生成部と、
前記異常検出用の機械学習モデルを用いて、第2のマイクロサービスのセットについて取得された第2のテレメトリ情報を解析することで、前記第2のマイクロサービスにおける異常の有無を示す異常検出結果を生成する異常検出部、
として前記プロセッサを機能させるための処理命令を含むことを特徴とする異常検出装置。
(態様2)
前記埋め込み生成部は、
前記トレース情報から、複数のマイクロサービス間の階層関係を示すサービス関係の特徴を抽出し、
所定のグラフ埋め込み手法を用いて前記サービス関係の特徴を処理することで、前記サービス関係の特徴を低次元空間で表現する前記トレース埋め込みを生成する、
ことを特徴とする、態様1に記載の異常検出装置。
前記埋め込み生成部は、
前記トレース情報から、複数のマイクロサービス間の階層関係を示すサービス関係の特徴を抽出し、
所定のグラフ埋め込み手法を用いて前記サービス関係の特徴を処理することで、前記サービス関係の特徴を低次元空間で表現する前記トレース埋め込みを生成する、
ことを特徴とする、態様1に記載の異常検出装置。
(態様3)
前記埋め込み生成部は、
前記ログ情報から、マイクロサービスの挙動をテキスト形式で示す前記ログの内容を示す意味的特徴と、複数のログ間の関係を示すログ関係の特徴とを抽出し、
所定のグラフ埋め込み手法を用いて前記意味的特徴及び前記ログ関係の特徴を処理することで、前記意味的特徴及び前記ログ関係の特徴とを低次元空間で表現する前記ログ埋め込みを生成する、
ことを特徴とする、態様1又は2に記載の異常検出装置。
前記埋め込み生成部は、
前記ログ情報から、マイクロサービスの挙動をテキスト形式で示す前記ログの内容を示す意味的特徴と、複数のログ間の関係を示すログ関係の特徴とを抽出し、
所定のグラフ埋め込み手法を用いて前記意味的特徴及び前記ログ関係の特徴を処理することで、前記意味的特徴及び前記ログ関係の特徴とを低次元空間で表現する前記ログ埋め込みを生成する、
ことを特徴とする、態様1又は2に記載の異常検出装置。
(態様4)
前記埋め込み生成部は、
前記メトリック情報から、前記マイクロサービスの性能に関する測定値の時間的周期性を示す時間的特徴と、複数のメトリック間の依存関係を示すメトリック関係の特徴とを抽出し、
所定の時間的埋め込み手法を用いて前記時間的特徴及び前記メトリック関係の特徴を処理することで、前記時間的特徴と前記メトリック関係の特徴とを低次元空間で表現する前記メトリック埋め込みを生成する、
ことを特徴とする、態様1乃至3に記載の異常検出装置。
前記埋め込み生成部は、
前記メトリック情報から、前記マイクロサービスの性能に関する測定値の時間的周期性を示す時間的特徴と、複数のメトリック間の依存関係を示すメトリック関係の特徴とを抽出し、
所定の時間的埋め込み手法を用いて前記時間的特徴及び前記メトリック関係の特徴を処理することで、前記時間的特徴と前記メトリック関係の特徴とを低次元空間で表現する前記メトリック埋め込みを生成する、
ことを特徴とする、態様1乃至3に記載の異常検出装置。
(態様5)
前記埋め込み部は、
ニューラルネットワークにおける埋め込み層を含み、
前記モデル生成部は、
前記ニューラルネットワークにおける集約層及び予測層を含み、
前記集約層は、
所定の連結演算手法を用いて前記トレース埋め込み、前記ログ埋め込み及び前記メトリック埋め込みのそれぞれを集約した潜在表現を生成し、前記潜在表現を前記予測層に入力し、
前記予測層は、
前記潜在表現に基づいて、前記第1のテレメトリ情報から取得した検証用テレメトリ情報に対する異常予測結果を生成し、
前記異常予測結果が所定の精度閾値を満たす場合、前記埋め込み層、前記集約層及び前記予測層のそれぞれのパラメータを前記異常検出用の機械学習モデルとする、
ことを特徴とする、態様1乃至4に記載の異常検出装置。
前記埋め込み部は、
ニューラルネットワークにおける埋め込み層を含み、
前記モデル生成部は、
前記ニューラルネットワークにおける集約層及び予測層を含み、
前記集約層は、
所定の連結演算手法を用いて前記トレース埋め込み、前記ログ埋め込み及び前記メトリック埋め込みのそれぞれを集約した潜在表現を生成し、前記潜在表現を前記予測層に入力し、
前記予測層は、
前記潜在表現に基づいて、前記第1のテレメトリ情報から取得した検証用テレメトリ情報に対する異常予測結果を生成し、
前記異常予測結果が所定の精度閾値を満たす場合、前記埋め込み層、前記集約層及び前記予測層のそれぞれのパラメータを前記異常検出用の機械学習モデルとする、
ことを特徴とする、態様1乃至4に記載の異常検出装置。
(態様6)
前記異常検出装置は、
前記異常検出用の機械学習モデルに関する情報を保存するモデルデータベースを格納する記憶部を更に含み、
前記モデル生成部は、
生成した前記異常検出用の機械学習モデルに対するシリアル化を行うことで、シリアル形式の機械学習モデルを生成し、
前記シリアル形式の機械学習モデルと、前記シリアル形式の機械学習モデルを特徴付けるメタデータ及びプロフィール情報とを前記モデルデータベースに保存する、
ことを特徴とする、態様1乃至5に記載の異常検出装置。
前記異常検出装置は、
前記異常検出用の機械学習モデルに関する情報を保存するモデルデータベースを格納する記憶部を更に含み、
前記モデル生成部は、
生成した前記異常検出用の機械学習モデルに対するシリアル化を行うことで、シリアル形式の機械学習モデルを生成し、
前記シリアル形式の機械学習モデルと、前記シリアル形式の機械学習モデルを特徴付けるメタデータ及びプロフィール情報とを前記モデルデータベースに保存する、
ことを特徴とする、態様1乃至5に記載の異常検出装置。
(態様7)
前記異常検出部は、
前記モデルデータベースに対して、前記プロフィール情報に基づく検索を実施することで、前記シリアル形式の機械学習モデルを取得し、
取得したシリアル形式の機械学習モデルをシリアル形式からモデルオブジェクト形式に変換することで、前記異常検出用の機械学習モデルを取得する、
ことを特徴とする、態様6に記載の異常検出装置。
前記異常検出部は、
前記モデルデータベースに対して、前記プロフィール情報に基づく検索を実施することで、前記シリアル形式の機械学習モデルを取得し、
取得したシリアル形式の機械学習モデルをシリアル形式からモデルオブジェクト形式に変換することで、前記異常検出用の機械学習モデルを取得する、
ことを特徴とする、態様6に記載の異常検出装置。
(態様8)
前記第2のテレメトリ情報におけるログ情報、トレース情報及びメトリック情報のそれぞれに関する異常の有無を示す前記異常検出結果をGUIに表示する入出力部を更に含む、
ことを特徴とする、態様1乃至7に記載の異常検出装置。
前記第2のテレメトリ情報におけるログ情報、トレース情報及びメトリック情報のそれぞれに関する異常の有無を示す前記異常検出結果をGUIに表示する入出力部を更に含む、
ことを特徴とする、態様1乃至7に記載の異常検出装置。
本開示の実施形態に係る異常検出手段において、テレメトリ情報に含まれるトレース情報、メトリック情報及びログ情報を用いて機械学習モデルを訓練することで、テレメトリ情報に基づいてマイクロサービスにおける異常を検出することが可能となる。
より具体的には、本開示の実施形態に係る異常検出手段では、トレース情報、メトリック情報及びログ情報のそれぞれの固有の特徴及び構造を考慮して選択した埋め込み手法を用いることで、トレース情報、メトリック情報及びログ情報のそれぞれの特徴を抽象化した、低次元空間で表現する埋め込みを生成することができる。例えば、本開示では、時間的周期性を有するメトリック情報に対しては時間的埋め込み(temporal embedding)、グラフ構造を有するログやトレースに対してはグラフ埋め込み(graph embedding)を用いることで、メトリック情報の時間的な特徴、トレース情報の階層関係、ログ情報の意味的内容などの特徴を捉えた埋め込みを生成することができる。
また、トレース情報、メトリック情報及びログ情報のそれぞれについて生成した埋め込みに基づいて機械学習モデルを訓練することで、メトリック情報の時間的な特徴、トレース情報の階層関係、ログ情報の意味的内容等に関する異常を検出することができる、異常検出用の機械学習モデルを得ることができる。このように生成した異常検出用の機械学習モデルをマイクロサービスから取得したテレメトリ情報に対して適用することで、メトリック情報、トレース情報及びログ情報を全て考慮する、高精度の異常検出が可能となる。
更に、異常検出用の機械学習モデルを用いてテレメトリ情報に対する異常検出を行う際、異常予測結果の生成に用いられる特徴のランク付けをラッパーなどで行うことで、特定の異常予測結果が生成された理由(なぜ異常があると判定されたかを示す説明等)や、異常の要因の候補を判定することができる。このように判定した異常や、異常の要因は、例えばGUIを介してユーザに提示することで、ユーザは、マイクロサービスにおける異常やその原因を容易に確認することができる。
このように、本開示によれば、テレメトリ情報におけるログ、メトリック及びトレースのぞれぞれの特徴を考慮する機械学習モデルを生成することで、マイクロサービスに関する高精度の異常検出が可能な異常検出手法を提供することができる。
以上、本発明の実施の形態について説明したが、本発明は、上述した実施の形態に限定されるものではなく、本発明の要旨を逸脱しない範囲において種々の変更が可能である。
150:異常検出アプリケーション,200:異常検出システム,210:異常検出装置,220:メモリ,222:テレメトリ情報取得部,224:埋め込み生成部,226:モデル生成部,228:異常検出部,232:テレメトリ情報DB,234:モデルDB,244:プロセッサ,246:入出力部,250:通信ネットワーク,260:ユーザ端末
Claims (12)
- 異常検出装置であって、
プロセッサとメモリとを備え、
前記メモリは、
第1のマイクロサービスのセットから、
:マイクロサービスの挙動を示すログを含むログ情報と、
:複数のマイクロサービスの関係を示すトレースを含むトレース情報と、
:マイクロサービスの性能に関する測定値を示すメトリックを含むメトリック情報と、
を含む第1のテレメトリ情報を取得するテレメトリ情報取得部と、
前記第1のテレメトリ情報から抽出した学習用テレメトリ情報をニューラルネットワークによって処理することで、前記トレース情報に対応するトレース埋め込みを生成し、前記ログ情報に対応するログ埋め込みを生成し、前記メトリック情報に対応するメトリック埋め込みを生成する埋め込み生成部と、
前記トレース埋め込み、前記ログ埋め込み及び前記メトリック埋め込みに基づいて、マイクロサービスについて異常の有無を判定する異常検出用の機械学習モデルを生成するモデル生成部と、
前記異常検出用の機械学習モデルを用いて、第2のマイクロサービスのセットについて取得された第2のテレメトリ情報を解析することで、前記第2のマイクロサービスにおける異常の有無を示す異常検出結果を生成する異常検出部、
として前記プロセッサを機能させるための処理命令を含むことを特徴とする異常検出装置。 - 前記埋め込み生成部は、
前記トレース情報から、複数のマイクロサービス間の階層関係を示すサービス関係の特徴を抽出し、
所定のグラフ埋め込み手法を用いて前記サービス関係の特徴を処理することで、前記サービス関係の特徴を低次元空間で表現する前記トレース埋め込みを生成する、
ことを特徴とする、請求項1に記載の異常検出装置。 - 前記埋め込み生成部は、
前記ログ情報から、マイクロサービスの挙動をテキスト形式で示す前記ログの内容を示す意味的特徴と、複数のログ間の関係を示すログ関係の特徴とを抽出し、
所定のグラフ埋め込み手法を用いて前記意味的特徴及び前記ログ関係の特徴を処理することで、前記意味的特徴及び前記ログ関係の特徴とを低次元空間で表現する前記ログ埋め込みを生成する、
ことを特徴とする、請求項1に記載の異常検出装置。 - 前記埋め込み生成部は、
前記メトリック情報から、前記マイクロサービスの性能に関する測定値の時間的周期性を示す時間的特徴と、複数のメトリック間の依存関係を示すメトリック関係の特徴とを抽出し、
所定の時間的埋め込み手法を用いて前記時間的特徴及び前記メトリック関係の特徴を処理することで、前記時間的特徴と前記メトリック関係の特徴とを低次元空間で表現する前記メトリック埋め込みを生成する、
ことを特徴とする、請求項1に記載の異常検出装置。 - 前記埋め込み部は、
ニューラルネットワークにおける埋め込み層を含み、
前記モデル生成部は、
前記ニューラルネットワークにおける集約層及び予測層を含み、
前記集約層は、
所定の連結演算手法を用いて前記トレース埋め込み、前記ログ埋め込み及び前記メトリック埋め込みのそれぞれを集約した潜在表現を生成し、前記潜在表現を前記予測層に入力し、
前記予測層は、
前記潜在表現に基づいて、前記第1のテレメトリ情報から取得した検証用テレメトリ情報に対する異常予測結果を生成し、
前記異常予測結果が所定の精度閾値を満たす場合、前記埋め込み層、前記集約層及び前記予測層のそれぞれのパラメータを前記異常検出用の機械学習モデルとする、
ことを特徴とする、請求項1に記載の異常検出装置。 - 前記異常検出装置は、
前記異常検出用の機械学習モデルに関する情報を保存するモデルデータベースを格納する記憶部を更に含み、
前記モデル生成部は、
生成した前記異常検出用の機械学習モデルに対するシリアル化を行うことで、シリアル形式の機械学習モデルを生成し、
前記シリアル形式の機械学習モデルと、前記シリアル形式の機械学習モデルを特徴付けるメタデータ及びプロフィール情報とを前記モデルデータベースに保存する、
ことを特徴とする、請求項1に記載の異常検出装置。 - 前記異常検出部は、
前記モデルデータベースに対して、前記プロフィール情報に基づく検索を実施することで、前記シリアル形式の機械学習モデルを取得し、
取得したシリアル形式の機械学習モデルをシリアル形式からモデルオブジェクト形式に変換することで、前記異常検出用の機械学習モデルを取得する、
ことを特徴とする、請求項6に記載の異常検出装置。 - 前記第2のテレメトリ情報におけるログ情報、トレース情報及びメトリック情報のそれぞれに関する異常の有無を示す前記異常検出結果をGUIに表示する入出力部を更に含む、
ことを特徴とする、請求項1に記載の異常検出装置。 - テレメトリ情報における異常を判定する異常検出装置と、
クライアント端末とが通信ネットワークを介して接続される異常検出システムにおいて、
前記異常検出装置は、
プロセッサとメモリとを備え、
前記メモリは、
第1のマイクロサービスのセットから、
:マイクロサービスの挙動を示すログを含むログ情報と、
:複数のマイクロサービスの関係を示すトレースを含むトレース情報と、
:マイクロサービスの性能に関する測定値を示すメトリックを含むメトリック情報と、
を含む第1のテレメトリ情報を取得するテレメトリ情報取得部と、
前記第1のテレメトリ情報から抽出した学習用テレメトリ情報をニューラルネットワークによって処理することで、前記トレース情報に対応するトレース埋め込みを生成し、前記ログ情報に対応するログ埋め込みを生成し、前記メトリック情報に対応するメトリック埋め込みを生成する埋め込み生成部と、
前記トレース埋め込み、前記ログ埋め込み及び前記メトリック埋め込みに基づいて、マイクロサービスについて異常の有無を判定する異常検出用の機械学習モデルを生成するモデル生成部と、
前記異常検出用の機械学習モデルを用いて、第2のマイクロサービスのセットについて取得された第2のテレメトリ情報を解析することで、前記第2のマイクロサービスにおける異常の有無を示す異常検出結果を生成し、前記クライアント端末に出力する異常検出部、
として前記プロセッサを機能させるための処理命令を含むことを特徴とする異常検出システム。 - 前記異常検出装置は、
前記異常検出用の機械学習モデルに関する情報を保存するモデルデータベースを格納する記憶部を更に含み、
前記モデル生成部は、
生成した前記異常検出用の機械学習モデルに対するシリアル化を行うことで、シリアル形式の機械学習モデルを生成し、
前記シリアル形式の機械学習モデルと、前記シリアル形式の機械学習モデルを特徴付けるメタデータ及びプロフィール情報とを前記モデルデータベースに保存する、
ことを特徴とする、請求項9に記載の異常検出システム。 - 前記異常検出部は、
前記モデルデータベースに対して、前記プロフィール情報に基づく検索を実施することで、前記シリアル形式の機械学習モデルを取得し、
取得したシリアル形式の機械学習モデルをシリアル形式からモデルオブジェクト形式に変換することで、前記異常検出用の機械学習モデルを取得する、
ことを特徴とする、請求項10に記載の異常検出システム。 - 異常検出装置において実行されている異常検出方法であって、
異常検出装置は、
プロセッサとメモリと記憶部とを備え、
前記記憶部は、
異常検出用の機械学習モデルに関する情報を保存するモデルデータベースを格納し、
前記メモリは、
第1のマイクロサービスのセットから、
マイクロサービスの挙動を示すログを含むログ情報と、
複数のマイクロサービスの関係を示すトレースを含むトレース情報と、
マイクロサービスの性能に関する測定値を示すメトリックを含むメトリック情報と、
を含む第1のテレメトリ情報を取得する工程と、
前記第1のテレメトリ情報を学習用テレメトリ情報と検証用テレメトリ情報とに分割する工程と、
前記学習用テレメトリ情報における前記トレース情報から、複数のマイクロサービス間の階層関係を示すサービス関係の特徴を抽出する工程と、
前記学習用テレメトリ情報における前記ログ情報から、マイクロサービスの挙動をテキスト形式で示す前記ログの内容を示す意味的特徴と、複数のログ間の関係を示すログ関係の特徴とを抽出する工程と、
前記学習用テレメトリ情報における前記メトリック情報から、前記マイクロサービスの性能に関する測定値の時間的周期性を示す時間的特徴と、複数のメトリック間の依存関係を示すメトリック関係の特徴とを抽出する工程と、
ニューラルネットワークにおける第1の埋め込み層を用いて、所定のグラフ埋め込み手法によって前記サービス関係の特徴を処理することで、前記サービス関係の特徴を低次元空間で表現するトレース埋め込みを生成する工程と、
前記ニューラルネットワークにおける第2の埋め込み層を用いて、所定のグラフ埋め込み手法によって前記意味的特徴及び前記ログ関係の特徴を処理することで、前記意味的特徴及び前記ログ関係の特徴とを低次元空間で表現するログ埋め込みを生成する工程と、
前記ニューラルネットワークにおける第3の埋め込み層を用いて、所定の時間的埋め込み手法によって前記時間的特徴及び前記メトリック関係の特徴を処理することで、前記時間的特徴と前記メトリック関係の特徴とを低次元空間で表現するメトリック埋め込みを生成する工程と、
前記ニューラルネットワークにおける集約層を用いて、所定の連結演算手法によって前記トレース埋め込み、前記ログ埋め込み及び前記メトリック埋め込みのそれぞれを集約した潜在表現を生成する工程と、
前記ニューラルネットワークにおける予測層を用いて、前記潜在表現に基づいて、前記検証用テレメトリ情報に対する異常予測結果を生成する工程と、
前記異常予測結果が所定の精度閾値を満たす場合、前記第1の埋め込み層、前記第2の埋め込み層、前記第3の埋め込み層、前記集約層及び前記予測層のそれぞれのパラメータに基づいて異常検出用の機械学習モデルを生成する工程と、
生成した前記異常検出用の機械学習モデルに対するシリアル化を行うことで、シリアル形式の機械学習モデルを生成する工程と、
前記シリアル形式の機械学習モデルと、前記シリアル形式の機械学習モデルを特徴付けるメタデータ及びプロフィール情報とを前記モデルデータベースに保存する工程と、
前記モデルデータベースに対して、前記プロフィール情報に基づく検索を実施することで、前記シリアル形式の機械学習モデルを取得する工程と、
取得したシリアル形式の機械学習モデルをシリアル形式からモデルオブジェクト形式に変換することで、前記異常検出用の機械学習モデルを取得する工程と、
前記異常検出用の機械学習モデルを用いて、第2のマイクロサービスのセットについて取得された第2のテレメトリ情報を解析することで、前記第2のマイクロサービスにおける異常の有無を示す異常検出結果を生成する工程と、
を前記プロセッサに実行させる処理命令を含むことを特徴とする異常検出方法。
Applications Claiming Priority (2)
| Application Number | Priority Date | Filing Date | Title |
|---|---|---|---|
| JP2023-109014 | 2023-07-03 | ||
| JP2023109014A JP2025007543A (ja) | 2023-07-03 | 2023-07-03 | 異常検出装置、異常検出システム及び異常検出方法 |
Publications (1)
| Publication Number | Publication Date |
|---|---|
| WO2025009381A1 true WO2025009381A1 (ja) | 2025-01-09 |
Family
ID=94172080
Family Applications (1)
| Application Number | Title | Priority Date | Filing Date |
|---|---|---|---|
| PCT/JP2024/021994 Ceased WO2025009381A1 (ja) | 2023-07-03 | 2024-06-18 | 異常検出装置、異常検出システム及び異常検出方法 |
Country Status (2)
| Country | Link |
|---|---|
| JP (1) | JP2025007543A (ja) |
| WO (1) | WO2025009381A1 (ja) |
Cited By (1)
| Publication number | Priority date | Publication date | Assignee | Title |
|---|---|---|---|---|
| CN120166049A (zh) * | 2025-02-28 | 2025-06-17 | 四川天邑康和通信股份有限公司 | 基于人工智能的融合网关运行监控方法、装置及设备 |
Families Citing this family (3)
| Publication number | Priority date | Publication date | Assignee | Title |
|---|---|---|---|---|
| JP7844731B1 (ja) * | 2025-10-17 | 2026-04-13 | 株式会社インターネットイニシアティブ | 異常管理装置、および異常管理方法 |
| JP7844733B1 (ja) * | 2025-10-29 | 2026-04-13 | 株式会社インターネットイニシアティブ | 異常管理装置、および異常管理方法 |
| JP7844736B1 (ja) * | 2025-11-06 | 2026-04-13 | 株式会社インターネットイニシアティブ | 異常管理装置、および異常管理方法 |
Citations (3)
| Publication number | Priority date | Publication date | Assignee | Title |
|---|---|---|---|---|
| US20200364612A1 (en) * | 2019-05-16 | 2020-11-19 | Visa International Service Association | System, Method, and Computer Program Product for Verifying Integrity of Machine Learning Models |
| US20220172067A1 (en) * | 2020-11-30 | 2022-06-02 | International Business Machines Corporation | Learning from distributed traces for anomaly detection and root cause analysis |
| WO2022111154A1 (en) * | 2020-11-30 | 2022-06-02 | International Business Machines Corporation | Proactive anomaly detection |
-
2023
- 2023-07-03 JP JP2023109014A patent/JP2025007543A/ja active Pending
-
2024
- 2024-06-18 WO PCT/JP2024/021994 patent/WO2025009381A1/ja not_active Ceased
Patent Citations (3)
| Publication number | Priority date | Publication date | Assignee | Title |
|---|---|---|---|---|
| US20200364612A1 (en) * | 2019-05-16 | 2020-11-19 | Visa International Service Association | System, Method, and Computer Program Product for Verifying Integrity of Machine Learning Models |
| US20220172067A1 (en) * | 2020-11-30 | 2022-06-02 | International Business Machines Corporation | Learning from distributed traces for anomaly detection and root cause analysis |
| WO2022111154A1 (en) * | 2020-11-30 | 2022-06-02 | International Business Machines Corporation | Proactive anomaly detection |
Non-Patent Citations (1)
| Title |
|---|
| JASMIN BOGATINOVSKI; SASHO NEDELKOSKI: "Multi-Source Anomaly Detection in Distributed IT Systems", ARXIV.ORG, CORNELL UNIVERSITY LIBRARY, 201 OLIN LIBRARY CORNELL UNIVERSITY ITHACA, NY 14853, 13 January 2021 (2021-01-13), 201 Olin Library Cornell University Ithaca, NY 14853 , XP081858542 * |
Cited By (1)
| Publication number | Priority date | Publication date | Assignee | Title |
|---|---|---|---|---|
| CN120166049A (zh) * | 2025-02-28 | 2025-06-17 | 四川天邑康和通信股份有限公司 | 基于人工智能的融合网关运行监控方法、装置及设备 |
Also Published As
| Publication number | Publication date |
|---|---|
| JP2025007543A (ja) | 2025-01-17 |
Similar Documents
| Publication | Publication Date | Title |
|---|---|---|
| US11513930B2 (en) | Log-based status modeling and problem diagnosis for distributed applications | |
| US11755452B2 (en) | Log data collection method based on log data generated by container in application container environment, log data collection device, storage medium, and log data collection system | |
| Shukla et al. | Riotbench: An iot benchmark for distributed stream processing systems | |
| CN104331477B (zh) | 基于联邦式检索的云平台并发性能测试方法 | |
| US11474892B2 (en) | Graph-based log sequence anomaly detection and problem diagnosis | |
| JP2025007543A (ja) | 異常検出装置、異常検出システム及び異常検出方法 | |
| US20230018975A1 (en) | Monolith database to distributed database transformation | |
| US20170109657A1 (en) | Machine Learning-Based Model for Identifying Executions of a Business Process | |
| CN108733532B (zh) | 大数据平台的健康度管控方法、装置、介质及电子设备 | |
| US20170109676A1 (en) | Generation of Candidate Sequences Using Links Between Nonconsecutively Performed Steps of a Business Process | |
| JP2023036681A (ja) | タスク処理方法、処理装置、電子機器、記憶媒体及びコンピュータプログラム | |
| US20170109668A1 (en) | Model for Linking Between Nonconsecutively Performed Steps in a Business Process | |
| US20170109667A1 (en) | Automaton-Based Identification of Executions of a Business Process | |
| JP6419081B2 (ja) | トランスフォーム生成システム | |
| US20170109636A1 (en) | Crowd-Based Model for Identifying Executions of a Business Process | |
| US11748219B1 (en) | Application event logging augmentation | |
| US11853330B1 (en) | Data structure navigator | |
| KR20150118963A (ko) | 큐 모니터링 및 시각화 | |
| US20170109639A1 (en) | General Model for Linking Between Nonconsecutively Performed Steps in Business Processes | |
| CN114756301A (zh) | 日志处理方法、装置和系统 | |
| US20170109638A1 (en) | Ensemble-Based Identification of Executions of a Business Process | |
| US20170109640A1 (en) | Generation of Candidate Sequences Using Crowd-Based Seeds of Commonly-Performed Steps of a Business Process | |
| US11995562B2 (en) | Integrating documentation knowledge with log mining for system diagnosis | |
| US20220179764A1 (en) | Multi-source data correlation extraction for anomaly detection | |
| US12430570B2 (en) | Artificial intelligence driven log event association |
Legal Events
| Date | Code | Title | Description |
|---|---|---|---|
| 121 | Ep: the epo has been informed by wipo that ep was designated in this application |
Ref document number: 24835895 Country of ref document: EP Kind code of ref document: A1 |
|
| NENP | Non-entry into the national phase |
Ref country code: DE |