METHODS FOR IDENTIFYING COMPOUNDS AFFECTING HUMAN HEALTH Related Applications [001] This application claims priority to U.S. Ser. No. 63/524,569 filed on June 30, 2023, which is hereby incorporated into this application in its entirety. Field of the Disclosure [002] This disclosure relates to the use of multi-omic data (transcriptomics, proteomics, metabolomics) in the preclinical setting of model organisms and/or cells treated with test sample exposure to identify which human health concerns are most impacted and to identify compounds with therapeutic potential. Background of the Disclosure [003] Recognition of the role that aging plays in disease has shifted some of the focus from treating individual age-related diseases to developing therapeutics that target the aging process itself. With that has come a demand for expanded testing of anti-aging therapeutics and nutraceuticals in a variety of model systems. The nematode worm C. elegans as one type of model system is an efficient and proven model for studying aging mechanisms and testing aging interventions. C. elegans are easily grown in a controlled environment using in vitro culture techniques and have a short, three-week lifespan that enables high throughput and multigenerational longevity studies. C. elegans is the most common model for testing age-related drugs owing to its relatively strong predictivity of the likelihood a drug might increase the lifespan in higher organisms. C. elegans lifespan assays can be used to meet growing demand for early qualification and safety testing of potential longevity drugs. As with other fields of drug discovery and development, those of skill in the art working on longevity drug development are increasingly emphasizing understanding the mode of action of such drugs. Understanding the mode of action of drugs enables the rational design of improved derivatives or combination therapies as well as identifying potential side effects early. Cross-species analysis of aging transcriptomes has revealed that there are evolutionarily conserved pathways influencing aging [Komljenovic A, Li H, Sorrentino V, Kutalik Z, Auwerx J, Robinson-Rechavi M. Cross-species functional modules link
proteostasis to human normal aging. PLoS Comput Biol.2019;15: e1007162.; Möller S, Saul N, Cohen AA, Köhling R, Sender S, Murua Escobar H, et al. Healthspan pathway maps in and humans highlight transcription, proliferation/biosynthesis and lipids. Aging .2020;12: 12534–12581.; Fang EF, Waltz TB, Kassahun H, Lu Q, Kerr JS, Morevati M, et al. Tomatidine enhances lifespan and healthspan in C. elegans through mitophagy induction via the SKN-1/Nrf2 pathway. Sci Rep. 2017;7: 46208.; Chen J, Ou Y, Li Y, Hu S, Shao L-W, Liu Y. Metformin extends lifespan through lysosomal pathway. Elife. 2017;6. doi:10.7554/eLife.31268; Ewald CY, Castillo-Quan JI, Blackwell TK. Untangling Longevity, Dauer, and Healthspan in Caenorhabditis elegans Insulin/IGF-1-Signalling. Gerontology. 2018;64: 96–104.; Iwasa H, Yu S, Xue J, Driscoll M. Novel EGF pathway regulators modulate C. elegans healthspan and lifespan via EGF receptor, PLC-gamma, and IP3R activation. Aging Cell. 2010;9: 490–505.; Bansal A, Zhu LJ, Yen K, Tissenbaum HA. Uncoupling lifespan and healthspan in Caenorhabditis elegans longevity mutants. Proc Natl Acad Sci U S A. 2015;112: E277–86.; Newell Stamper BL, Cypser JR, Kechris K, Kitzenberg DA, Tedesco PM, Johnson TE. Movement decline across lifespan of Caenorhabditis elegans mutants in the insulin/insulin-like signaling pathway. Aging Cell. 2018;17. doi:10.1111/acel.12704 and a set of conserved signaling pathways can be derived. As a result, various model systems (e.g., mouse, rat, fly, worm, fish, and human, as well as cells derived from the same) can be used to find molecular mechanisms of action via transcriptomics mapped to pathways and cross correlated to health concerns. [004] This disclosure provides solutions to these problems. For instance, in some embodiments, this disclosure provides methods for identifying: 1) optimal structure-function claims for a test sample at molecular mechanism of action detail; 2) the molecular biomarkers for use in clinical trials; and, 3) the optimal sets of phenotyping assays for behavioral and morphological validation of the molecular health concern findings. This disclosure thereby provides solutions to these and other art-recognized, and unrecognized, problems. Summary of the Disclosure [005] This disclosure, in some embodiments, provides methods for identifying: 1) optimal structure-function claims for a test sample at molecular mechanism of action detail; 2) the molecular biomarkers for use in clinical trials; and, 3) the optimal sets of phenotyping assays for
behavioral and morphological validation of the molecular health concern findings. [006] In embodiments provided herein are methods for identifying a test composition that affects a human health concern using a non-human model organism, comprising: providing one or more look up tables comprising a list of genes associated with the human health concern; contacting the non-human model organism with one or more test compositions during an incubation period; generating one or more profiles of gene expression from the model organism after the incubation period; recording a change in the one or more profiles as compared to a control set of gene expression profiles generated from an untreated cohort of the non-human model organisms providing a subset of differentially expressed genes; and, mapping the subset to the look up table and identifying one or more differentially expressed genes in the subset that are common to those in the look up table, thereby identifying a test compound that affects the human health concern. [007] In some embodiments, this disclosure provides methods for using model animals such as C. elegans and/or zebrafish, and/or cell lines (e.g., human cell lines), to obtain gene transcriptional data to identify areas of biological activity related to one or more human health conditions, the method comprising exposing model animals to one or more compounds and/or environmental conditions and determining the expression of multiple messenger RNAs (mRNAs) using at least one assay selected from the group consisting of RNA seq, microarray, quantitative polymerase chain reaction (QPCR), transcriptional reporter construct. In some embodiments, the human health condition is selected from the group consisting of immunity, digestive tract health, muscle function, aging, energy, energy metabolism, skin health, mood regulation, brain health, heart health, stress management, inflammation, and weight management. In some embodiments, this disclosure provides methods for using C. elegans to obtain gene transcriptional data to identify areas of biological activity related to one or more human health conditions, the method comprising exposing model animals and/or cell lines to one or more compounds and/or environmental conditions and characterizing protein activity using at least one assay selected from the group consisting of liquid chromatography-mass spectrometry (LCMS), semalogic, enzyme-linked immunosorbent assay (ELISA), western blot, immunostaining, thin-layer chromatography, and a protein activity assay. In some embodiments, the protein is an enzyme use of metabolic flux analysis to identify areas of biological activity where protein activity of a gene creates changes in metabolites that influence health concerns. Enzyme levels may be static but flux through pathways is monitored to read out
the level of activity of the cellular signaling pathway. In some embodiments, the methods of this disclosure, or any combination thereof, can be used to determine lifespan, healthspan, inflammation, brain health, or digestive tract health; and/or to avoid premature death, early aging, sarcopenia, inflammation, neurodegeneration; and/or to optimize intestinal microbiota). In some embodiments, the methods can be used for determining genetic regulation, protein quantification, and/or metabolic data. In some embodiments, the methods can also comprise carrying out a confirming assay in the animal model and/or cell line. In some embodiments, the compound assayed is for a human clinical study or human clinical trial. In some embodiments, the data generated by such methods indicates specific health concern assays for human testing. Other embodiments are also contemplated as will be apparent to those of skill in the art from this disclosure. Brief Description of the Drawings [008] Figure 1 shows RNAseq data from young (adult day 2) and aged (adult day 2) treated with JadeAging® and its individual active ingredients (Rehmannia (plant root), Poria (Wolfiporia cocos; mushroom), and Ginseng) as a principal component analysis (PCA) plot set in two dimensions to reveal patterns in complex data sets. When the data is plotted along these few dimensions, the samples form clusters based on their overall similarity to one another, wherein (A) shows the outliers clustering as a separate group from the rest of the day 2 and day 9 samples and (B) shows after eliminating the outlier samples, the day 2 and day 9 groups form distinct clusters separated horizontally. See Example 1. [009] Figure 2 shows a Volcano plot of differentially expressed genes (DEG) for JadeAging® treated worms at day 2 (A) and day 9 (B), wherein each dot represents a gene within the comparison performed and showing the magnitude of change. The log ratio of the fold change is on the X axis, and the negative log of P-adj-value is on the Y axis. The vertical and horizonal dashed lines are the predetermined threshold and dots (e.g., expressed genes) in the quadrant above and to the left or right of the dashed line respectively (color dots), are identified generating the one or more profiles of gene expression from the model organism. Colored dots indicate differential gene expression that exceeds defined significance and fold-change thresholds. Black dots = not significant, Green dots = > 1.5-fold change in expression and P-value < 0.05, purple = < -1.5-fold change in expression and P-value < 0.05. See Example 1.
[0010] Figure 3 shows a Volcano plot of differentially expressed genes (DEG) for Ginseng treated worms at day 2 (A) and day 9 (B), wherein the profile of gene expression is identified based on the predetermined threshold (vertical and horizontal dashed lines). Each dot represents a gene within the comparison performed and magnitude of change. The log ratio of the fold change is on the X axis, and the negative log of P-adj-value is on the Y axis. Colored dots indicate differential gene expression that exceeds defined significance and fold-change thresholds. Black dots = not significant, Green dots = > 1.5-fold change in expression and P-value < 0.05, purple = < -1.5-fold change in expression and P-value < 0.05. See Example 1. [0011] Figure 4 shows a Volcano plot of differentially expressed genes for Poria treated worms at day 2 (A) and day 9 (B), wherein the profile of gene expression is identified based on the predetermined threshold (vertical and horizontal dashed lines). Each dot represents a gene within the comparison performed. The log ratio of the fold change is on the X axis, and the negative log of P-adj/P-value is on the Y axis. Colored dots indicate differential gene expression that exceeds defined significance and fold-change thresholds. Black dots = not significant, Green dots = > 1.5- fold change in expression and P-value < 0.05, purple = < -1.5-fold change in expression and P- value < 0.05. See Example 1. [0012] Figure 5 shows a Volcano plot of differentially expressed genes for Rehmannia treated works at day 2 (A) and day 9 (B), wherein the profile of gene expression is identified based on the predetermined threshold (vertical and horizontal dashed lines). Each dot represents a gene within the comparison performed. The log ratio of the fold change is on the X axis, and the negative log of P-adj/P-value is on the Y axis. Colored dots indicate differential gene expression that exceeds defined significance and fold-change thresholds. Black dots = not significant, Green dots = > 1.5- fold change in expression and P-value < 0.05, purple = < -1.5-fold change in expression and P- value < 0.05. See Example 1. [0013] Figure 6 shows the number of differentially expressed genes (DEG) for each treatment group. Each bar represents the total number of upregulated (green) and downregulated (purple) DEGs in the treatment groups at day 2 and day 9. For JadeAging® at day 2, 37 genes were upregulated and 6 were downregulated. At day 9 of JadeAging® treatment, 10 genes were upregulated and 58 were downregulated. Animals treated with Ginseng also showed more
differentially expressed genes on day 9, whereas animals treated with Poria had the same number of differentially expressed genes at the two timepoints, and Rehmannia showed a larger number of differentially expressed genes on day 2. These profiles of gene expression for each treatment group are then mapped to the look up tables (e.g., Tables 1 to 6) to identify any genes in common wherein the treatment is identified as affecting longevity. See Example 1. [0014] Figure 7 shows a map of the related 93 genes known to be associated with longevity and identification of six DEG (shaded boxes) in young adults (day 2) following treatment with JadeAging®. See Example 1. [0015] Figure 8 shows a map of the related 93 genes known to be associated with longevity and identification of five DEG (shaded boxes) in aged adults (day 9) following treatment with JadeAging®. See Example 1. [0016] Figure 9 shows a volcano plot of 1314 genes at day 2 (A) and 1128 genes at day 9 (B) that were differential expressed (e.g., showed 1.5-fold or greater change in expression relative to control “predetermined threshold value”) in the KO variant non-human model organism. See Example 2. [0017] Figure 10 shows volcano plots of differentially expressed genes with a low dose of the test composition at 2 hrs (A) and 24 hours (C); and with a high dose of the test composition at 2 hours (B) and 24 hours (D). The predetermined threshold is represented by horizontal and vertical dashed lines. Colored dots indicate differential gene expression that exceeds defined significance and fold- change thresholds (p≤0.05 and 1.25-fold, respectively). Positive values mean that the gene is expressed at higher levels in the Treatment Z-treated groups, and negative values mean the gene is expressed at higher levels in the DMSO control. The farther the dot is from the origin point on the x-axis, the greater the expression fold-change. See Example 3. [0018] Figure 11 illustrates the shared genes of C. elegans and zebrafish as compared to human demonstrating their usefulness as a non-human model organism of this disclosure. [0019] Detailed Description of the Invention [0020] This disclosure relates to animal model systems and uses thereof for highly efficient generation of preclinical data. The models and methods can be used for identifying a test composition that affects a human health concern. In embodiments, the human health concern is
selected from longevity, energy metabolism, cardiovascular health, metabolic syndrome, neurodegenerative disorders, muscle function. In other embodiments, the human health concern is a genetic condition. The methods of the disclosure use a non-human model organism such as C. elegans (herein also referred to as “worms”), zebrafish, fruit fly, xenopus, or rodents, such as mice and rats. In certain embodiments, the methods use “wild-type” model organism. In other embodiments, the methods use a variant non-human model organism, such as an organism with a knock-out or knock-in of a gene associated with a human health condition or disease. In alternative embodiments, the methods use a disease induced model organisms wherein the organism was exposed to a compound or infectious agent that induced a disease. [0021] Applicants found that by generating look up table(s) (a list or profile of genes) with which to compare differentially expressed genes (“DEG”) from a test model organism, wherein those DEG were identified based on a predetermined threshold, test compositions could be identified that affect a human health concern or disease. In embodiments provided herein are methods for identifying a test composition that affects a human health concern using a non-human model organism, comprising: providing one or more look up tables comprising a list of genes associated with the human health concern; contacting the non-human model organism with one or more test compositions during an incubation period; generating one or more profiles of gene expression from the model organism after the incubation period; recording a change in the one or more profiles as compared to a control set of gene expression profiles generated from an untreated cohort of the non-human model organisms providing a subset of differentially expressed genes; and, mapping the subset to the look up table and identifying one or more differentially expressed genes in the subset that are common to those in the look up table, thereby identifying a test compound that affects the human health concern. See Example 1 and Figures 2-8. [0022] In certain embodiments provided herein are methods for identifying a test composition that affects a human health concern using variant non-human model organism, comprising: providing the variant non-human model organism comprising a knock-out (KO) or knock-in (KI) of a gene associated with the human health concern; providing one or more look up tables comprising a list of genes associated with the human health concern, wherein the list of genes comprises a profile of genes differentially expressed in the knock-out (KO) or knock-in (KI) non- human model organism compared to a corresponding model organism without the variant;
contacting the variant non-human model organism with one or more test compositions during an incubation period; generating one or more profiles of differentially expressed genes from the variant model organism after the incubation period compared to a control variant model organism; and, mapping the profile of expressed genes to the look up table and identifying one or more expressed genes in the profile that are common to those in the look up table, thereby identifying a test compound that affects the human health concern. See Example 2 and Figure 9. [0023] In certain other embodiments provided herein are methods for identifying a test composition that affects a human health concern using a non-human model organism, comprising: providing one or more look up tables comprising a list of genes associated with the human health concern, wherein the list of genes comprises a profile of genes differentially expressed in a knock- out (KO) or knock-in (KI) non-human model organism compared to a corresponding model organism without the variant; contacting the corresponding model organism without the variant with one or more test compositions during an incubation period; generating one or more profiles of differentially expressed genes from the model organism of step b. after the incubation period compared to a control model organism that was not treated with the test composition; and, mapping the profile of expressed genes to the look up table and identifying one or more expressed genes in the profile that are common to those in the look up table, thereby identifying a test compound that affects the human health concern. See Example 2. [0024] In embodiments provided herein are methods for identifying a test composition that affects a human health concern using an induced non-human model organism, comprising: providing the induced non-human model organism, wherein the non-human model organism is contacted with a health concern compound to induce a condition associated with the human health concern; providing one or more look up tables comprising a list of genes associated with the human health concern, wherein the list of genes comprises a profile of genes differentially expressed in the induced non-human model organism compared to a corresponding model organism without the induced condition; contacting the induced non-human model organism with one or more test compositions during an incubation period; generating one or more profiles of differentially expressed genes from the induced model organism after the incubation period compared to a control model organism not treated with the test compositions; and, mapping the profile of expressed genes to the look up table and identifying one or more expressed genes in the profile
that are common to those in the look up table, thereby identifying a test compound that affects the human health concern. See Example 3 and Figure 10. [0025] In certain other embodiments provided herein are methods for identifying a test composition that affects a human health concern using an induced non-human model organism, comprising: providing the induced non-human model organism, wherein the non-human model organism is contacted with a health concern compound to induce a condition associated with the human health concern; providing one or more look up tables comprising a list of genes associated with the human health concern, wherein the list of genes comprises a profile of genes differentially expressed in the induced non-human model organism compared to a corresponding model organism without the induced condition; contacting the wild-type non-human model organism with one or more test compositions during an incubation period; generating one or more profiles of differentially expressed genes from the wild-type model organism after the incubation period compared to the wild-type model organism not treated with the test compositions; and, mapping the profile of expressed genes to the look up table and identifying one or more expressed genes in the profile that are common to those in the look up table, thereby identifying a test compound that affects the human health concern. See Example 3. [0026] Definitions [0027] As used herein, the terms "a" or "an" are used, as is common in patent documents, to include one or more than one, independent of any other instances or usages of "at least one" or "one or more." [0028] As used herein, the term "or" is used to refer to a nonexclusive or, such that "A or B" includes "A but not B," "B but not A," and "A and B," unless otherwise indicated. [0029] As used herein, the term "about" is used to refer to an amount that is approximately, nearly, almost, or in the vicinity of being equal to or is equal to a stated amount, e.g., the state amount plus/minus about 5%, about 4%, about 3%, about 2% or about 1%. [0030] As used herein, the term "gene editing" refers a type of genetic engineering in which DNA is inserted, replaced, or removed from a genome using gene editing tools. Examples of gene editing tools include, without limitation, zinc finger nucleases, TALEN and CRISPR. In embodiments,
the variant non-human model organisms ger generated using gene editing for knock-out or knock- in modified organisms. [0031] "Genetic disease or condition" as used herein refers to a disease, partially or completely, directly or indirectly, caused by one or more abnormalities in the genome, especially a condition that is present from birth. The abnormality may be a mutation, an insertion or a deletion. The abnormality may affect the coding sequence of the gene or its regulatory sequence. The genetic disease may be, but is not limited to epilepsy, DMD, hemophilia, cystic fibrosis, Huntington's chorea, familial hypercholesterolemia (LDL receptor defect), hepatoblastoma, Wilson's disease, congenital hepatic porphyria, inherited disorders of hepatic metabolism, Lesch Nyhan syndrome, sickle cell anemia, thalassaemias, xeroderma pigmentosum, Fanconi's anemia, retinitis pigmentosa, ataxia telangiectasia, Bloom's syndrome, retinoblastoma, and Tay-Sachs disease. “Clinical variants” are used herein, are those genes that lead to a genetic disease wherein expression of the gene results in one or more amino acid changes as compared to wild type allele that does not lead to disease. [0032] As used herein, the terms "increase," "increased," "increasing," "improved," (and grammatical variations thereof), describe, for example, an increase of at least about 5%, 10%, 15%, 20%, 25%, 35%, 50%, 75%, 80%, 85%, 90%, 95%, 97%), 98%), 99%), or 100% as compared to a control. In embodiments, the increase in the context of a heterogenous gene or clinical variant thereof, is measured and/or determined via phenotypic assay to assess function of the expressed gene. [0033] A "normal" or "wild type" nucleic acid, nucleotide sequence, polypeptide or amino acid sequence refers to a naturally occurring or endogenous nucleic acid, nucleotide sequence, polypeptide or amino acid sequence that has not undergone a change. As used herein, the wild type sequence may be a disease gene, but does not comprise a mutation leading to a pathogenic phenotype. It is understood there is a distinction between a wild type disease gene (e.g. those without a mutation leading to a pathogenic phenotype and may be an allele reflective of a “normal” heterogenous population) and clinical variants that comprise one or more mutations of those disease genes and that may have a pathogenic phenotype. In embodiments, the normal gene or wild type gene may be the most prevalent allele of the gene in a heterogenous population.
[0034] As used herein, the terms "reduce," "reduced," "reducing," "reduction," "diminish," "suppress," and "decrease" (and grammatical variations thereof), describe, for example, a decrease of at least about 5%, 10%, 15%, 20%, 25%, 35%, 50%, 75%, 80%, 85%, 90%, 95%, 97%), 98%), 99%), or 100% as compared to a control. In embodiments, the reduction in the context of a heterogenous gene or clinical variant thereof, is measured and/or determined via phenotypic assay to assess function of the expressed gene. [0035] "Variant" with respect to a peptide or polypeptide that differs in one or more amino acid sequence by the insertion, deletion, or conservative substitution of amino acids as compared to a normal or wild type sequence. The variant may further exhibit a phenotype that is quantitatively distinguished from a phenotype of the normal or wild type expressed gene. In embodiments, clinical variant refers to a disease gene with one or more amino acid changes as compared to the normal or wild type disease gene. [0036] Identifying a Test Composition that Affects a Human Health Concern [0037] This disclosure relates to methods for identifying a test composition via generating a profile of differentially expressed genes (DEG) and mapping to a look up table (comprising a list of genes associated with the human health concern) and identifying one or more expressed genes in the profile that are common to those in the look up table, thereby identifying a test compound that affects the human health concern. These methods create science-based evidence to bring high confidence for obtaining an efficacy finding in a product. This disclosure, in some embodiments, provides methods for identifying: 1) optimal structure-function claims for a test sample at molecular mechanism of action detail; 2) the molecular biomarkers for use in clinical trials; and, 3) the optimal sets of phenotyping assays for behavioral and morphological validation of the molecular health concern findings. [0038] In some embodiments, transcriptomics (e.g., RNA-seq) is used for gene expression analysis, with which cellular signaling pathways are mapped to uncover the various effects a compound or compounds (e.g., nutraceutical) have on gene expression in the animal. See Figure 7 and 8. At the core of the technology is RNA-seq analysis that can detect which genes are being activated by treatment with a test composition. Activation of various signaling pathways by test- sample treatment yields a molecular mechanism of action (mMoA) understanding of types of applications for which a test composition will be efficacious. As a result, measuring the levels of
mRNA with transcriptomics can provide insight into which genes are turned on or off (e.g. differentially expressed genes) by an exposure to a particular treatment or test composition (e.g., nutraceutical). [0039] Transcriptomics using RNA-seq measures the response of each gene when exposed to a test composition. A series of genes are tested for mRNA expression changes with (+) and without (-) test composition. For instance, when 100 genes are examined for mRNA expression changes, only a small percentage will show a differential expression. Yet, with the 20,000 genes of human genome, very large datasets (~20 Gb) of gene expression effects are recorded. This results in a Differential Gene Expression (DGE) dataset that can then be mapped to cellular signaling pathways and help identify which health concerns are being impacted. DGE data from transcriptomics analysis allow identification of various health concerns that may be impacted by exposure to a test composition. For example, a nutraceutical may have a positive impact on the pathways that promote healthy aging. Alternatively, the same nutraceutical might lead to a reduction in inflammation pathways. As a result, the use of transcriptomics can be a powerful tool for identifying the various structure function applications that are triggered with nutraceutical treatment. [0040] Lists of human genes that implicated in pathways related to longevity (e.g., insulin- insulin signaling (IIS)) were curated. These curated pathway lists were drawn from WormBase, KEGG, and other published databases and literature. These non-limiting exemplary (unless otherwise specified) genes are shown below in Tables 1-6 . See Example 1. [0041] In preferred embodiments, the lists of genes implicated in specific longevity pathways can be compared with the list of the human orthologs of the DEGs identified in our experimental treatment groups. The user is then able to make a statement such as “treatment with compound X is likely to exert a pro-longevity effect via the IIS mechanistic pathway”. Although only a few of the genes might individually have highly significant changes in expression, collectively, the connectivity of the pathways can suggest a coherent hypothesis for a mechanism of action. Since a gene or pathway might be upregulated in response to a stress or downregulated due to relief of the stress, direction of change is not considered, only whether the expression of the genes has changed. For visualization, pathway genes were given a score based on the fold change weighted by the log
of the P value, and this score was color mapped by magnitude and direction to produce the pathway diagrams. [0042] To understand the impact of the compound treatment on brain health using the assays disclosed herein with zebrafish as the model organism, a number of exemplary (non-limiting unless otherwise indicated) zebrafish gene lists specific for different molecular pathways, as shown below: [0043] 1) Ubiquitin-mediated proteolysis: ubc, ubb, uba52, rps27a, uba1, uba7, sae1, uba2, uba3, si:dkey-82j4.2, ube2al, ube2a, ube2b, ube2c, ube2d4, ube2d3, ube2d1b, ube2d2l, ube2d2, ube2d1a, ube2e3, ube2e2, ube2e1, ube2f, ube2g1b, ube2g1a, ube2g2, ube2h, ube2ia, ube2ib, ube2j1, ube2j2, ube2l3a, ube2l3b, si:ch1073-205c8.3, ube2nb, ube2na, ube2o, ube2q1, ube2ql1, ube2q2, ube2r2, cdc34a, cdc34b, ube2s, ube2wb, ube2wa, ube2z, ube2kb, ube2ka, birc6, ube3a, ube3b, ube3c, smurf2, smurf1, itcha, itchb, NEDD4-like E3 ubiquitin-protein ligase, wwp2, trip12, nedd4l, huwe1, ubr5, herc1, herc2, herc3, herc4, herc56.3, herc56.4, herc56.2, si:ch73-190m4.1, ube4a, ube4b, stub1, ppil2, prpf19, ubox5, mdm2, cbl, cblb, cblc, prkn, siah1, traf6, map3k1, cop1, rchy1, birc2, xiap, birc7, pias1b, pias1a, pias2, pias4a, pias4b, syvn1, aire, mgrn1b, mgrn1a, fancl, mid1, trim32, trim37, rbx1, cul1a, cul1b, skp1, fbxw11a, fbxw11b, skp2, fbxw7, fbxo2, fbxo4, cul2, elocb, eloca, elob, vhl, vhll, cul3a, cul3b, keap1b, keap1a, klhl13, si:rp71-68n21.9, si:dkey- 263f15.2, rhobtb4, rhobtb2b, rhobtb1, cul4b, cul4a, ddb1, ddb2, ercc8, det1, rnf7, cul5b, cul5a, socs1a, socs1b, socs3b, socs3a, fbxw8, anapc11, anapc2, cdc20, fzr1a, fzr1b, anapc1, cdc27, anapc4, anapc5, cdc16, anapc7, cdc23, anapc10, cdc26, anapc13, anapc15, and anapc16; [0044] 2) Proteosome: psmd3, psmd9, psmd12, psmd11b, psmd11a, psmd6, psmd7, psmd13, psmd14, psmd8, sem1, psmd4b, psmd4a, psmd2, psmd1, adrm1, psmc2, psmc1a, psmc1b, psmc5, psmc6, psmc3, psmc4, psme1, psme2, psme3, psme4a, psme4b, psma6a, psma6l, psma6b, psma2a, psma2b, psma4, psma8, psma5, psma1, psma3, psmb6, psmb12, psmb7, psmb13a, psmb10, psmb3, psmb2, psmb5, psmb1, psmb4, psmb9a, psmb9b, psmb8a, psmb8f, psmb11a, psmb11b, ifng1, psmf1, and pomp; [0045] 3) Protein processing in endoplasmic reticulum: sec61a1, sec61a1l, sec61b, sec61g, sec62, sec63, rpn1, rpn2, dad1, tusc3, ddost, stt3a, stt3b, mogs, ckap4, rrbp1a, rrbp1b, si:ch211-195b11.7, hyou1, hspa5, dnajb11, dnajc1, dnajc3a, dnajc3b, dnajc10, hsp90b1, ganab, ganaba, prkcsh, canx, si:ch211-274f20.2, pdia7, pdia8, pdia3, calr3a, calr3b, calr, man1a1, man1a2, man1b1a, man1b1b,
lman2, lman1, preb, sar1b, sar1ab, sar1aa, sec13, sec31a, sec31b, sec23b, sec23a, sec24a, sec24c, sec24d, sec24b, si:dkey-13n15.2, uggt2, uggt1, edem1, edem2, edem3, si:ch211-282j22.3, p4hb, pdia4, pdia6, txndc5, ero1a, ero1b, os9, erlec1, ssr1, ssr2, ssr3, ssr4, bcap31, tram1, zgc:113278, derl1, derl2, derl3, ubxn4, ubxn1, ubxn2a, ubxn6, ubxn8, nsfl1c, svip, vcp, zgc:136908, nploc4, ufd1l, hsp70.3, hsc70, hspa8, hsp70l, hspa1b, hsp70.2, hsp70.1, hspa8b, dnaja1, dnaja2a, dnaja2b, dnajb1b, dnajb1a, dnajb2, dnajb12a, dnajc5aa, dnajc5ga, dnajc5gb, dnajc5b, dnajc5ab, hsp90ab1, hsp90aa1.1, hsp90aa1.2, hspa4l, hsph1, bag1, bag2, hspbp1, cryaa, cryaba, yod1, plaa, rad23b, rad23aa, rad23ab, ubqln4, ngly1, atxn3, ube4b, eif2ak1, eif2ak2, eif2ak3, eif2ak4, eif2s1b, eif2s1a, nfe2l2a, atf4a, atf4b, ddit3, bcl2b, bcl2a, atf6, atf6b, wfs1b, wfs1a, mbtps1, mbtps2, xbp1, ern2, traf2b, traf2a, , map3k5, si:ch211-1i11.3, map2k7, mapk10, mapk8a, mapk8b, mapk9, baxa, zgc:153993, si:ch211-202f3.3, capn1a, capn1, capn1b, si:dkeyp-50d11.2, capn2a, capn2b, capn8, capn2l, marchf6, ube2j1, ube2j2, ube2g1b, ube2g1a, ube2g2, syvn1, rnf185, rnf5, selenos, sel1l, herpud1, amfra, stub1, ube2d4, ube2d3, ube2d1b, ube2d2l, ube2d2, ube2d1a, prkn, rbx1, cul1a, cul1b, skp1, fbxo2, fbxo6.3, and fbxo44.7; [0046] 4) Tyrosine metabolism: got1, got1l1, got2b, got2a, tat, si:dkey-40g16.6, hpda, hpdb, hgd, gstz1, fah, tyr, th, th2, dct, tyrp1b, tyrp1a, ddc, dbh, pnmt, comtb, comta, tomt, mao, si:ch211- 127i16.2, aoc2, aldh3b1, aldh3b2, adh5, adh8a, adh5l, adh8b, zgc:77938, tpo, epx, aox6, aox5, fahd1, and mif; [0047] 5) Apoptosis: tnfsf10, hdr, faslg, fas, fadd, tnfa, tnfrsf1a, tradd, cflara, casp8, casp8l2, casp22, casp8l1, casp6a, casp6b.1, casp3a, casp3b, LOC798445, casp7, casp21, bida, baxa, LOC100004321, zgc:153993, diabloa, diablob, septin4b, septin4a, zgc:174193, LOC560917, LOC797799, si:dkey-33c12.10, LOC110438965, LOC110438948, cycsb, apaf1, casp9, prf1.1, prf1.5, prf1.2, prf1.8, prf1.6, prf1.3, prf1.9, gzm3, gzm3.3, si:ch211-165b19.5, gzm3.4, tuba1b, tuba8l2, tuba4l, tuba5, tuba8l4, tuba2, tuba7l, tuba8l3, tuba1c, tuba1a, zgc:123298, tuba8l5, si:ch211-114n24.6, mcl1a, actb1, actb2, sptan1, lmna, lmnb1, lmnb2, lmnl3, parp1, parp3, parp2, parp4, dffa, dffb, endog, LOC101885345, endonuclease G, mitochondrial-like [KO:K01173], aifm1, ern2, traf2b, traf2a, LOC100005446, itpr1b, itpr1a, itpr2, itpr3, si:ch211-202f3.3, capn1a, capn1, capn1b, si:dkeyp-50d11.2, capn2a, capn2b, capn8, capn2l, eif2ak3, eif2s1b, eif2s1a, atf4a, atf4b, ddit3, ctsba, ctsbb, ctsc, ctsd, napsa, ctsf, ctsh, ctsk, ctsla, ctslb, cts12, zgc:174154, ctsl.1, si:dkey-26g8.5, si:dkey-239j18.3, zgc:174153, zgc:174855, si:dkey-239j18.2, ctso, ctss2.1, ctss2.2,
ctss1, ctsz, LOC100333521, birc2, xiap, birc5a, birc5b, bcl2l11, bcl2l1, bcl2b, bcl2a, daxx, ripk1l, dab2ipb, dab2ipa, map3k5, si:ch211-1i11.3, mapk10, mapk8a, mapk8b, mapk9, badb, bada, jun, fosab, si:ch211-153j24.3, fosaa, tp53, LOC795766, map3k14a, chuk, ikbkb, ikbkg, nfkbiab, nfkbiaa, nfkb1, rela, ptpn13, gadd45aa, gadd45ga, gadd45ab, gadd45ba, gadd45bb, gadd45gb.1, traf1, atm, pidd1, pmaip1, casp2, ngfb, ngfa, ntrk1, csf2rb, pik3cd, pik3ca, pik3cb, pik3r2, pik3r3b, pik3r1, pdpk1b, pdpk1a, akt2l, akt3a, akt2, akt3b, akt1, hrasb, hrasa, kras, zgc:55558, nras, raf1a, raf1b, map2k1, map2k2a, map2k2b, mapk1, and mapk3; [0048] 6) Oxidative Phosphorylation: ND1, ND2, ND3, ND4, ND4L, ND5, ND6, ndufs1, zgc:123301, ndufs2, ndufs3, ndufs4, ndufs5, ndufs6, ndufs7, ndufs8a, ndufs8b, ndufv1, zgc:123290, ndufv2, ndufv3, ndufa1, ndufa2, ndufa3, ndufa4a, ndufa4b, ndufa4l2a, ndufa4l2, ndufa5, ndufa6, ndufa7, ndufa8, ndufa9a, ndufa10, ndufab1b, ndufab1a, ndufa11, ndufa12, ndufa13, ndufb2, ndufb3, ndufb4, ndufb5, ndufb6, ndufb7, ndufb8, ndufb9, ndufb10, ndufb11, ndufc1, ndufc2, sdha, sdhb, sdhc, sdhda, sdhdb, uqcrfs1, CYTB, cyc1, uqcrc1, uqcrc2a, uqcrc2b, uqcrh, uqcrb, uqcrq, uqcr10, si:ch1073-325m22.2, cox10, COX3, COX1, COX2, cox4i1, cox4i2, cox4i1l, cox5aa, cox5ab, cox5bb, cox5ba, cox5b2, cox6a2, cox6a1, cox6b2, cox6b1, cox6c, cox7a2l, cox7a2a, cox7a2b, cox7a1, cox7b, cox7c, cox8b, cox8a, si:dkey-85n7.8, cox11, cox15, cox17, cycsb, atp5fa1, atp5f1b, zgc:163069, atp5f1c, atp5f1d, atp5f1e, atp5po, ATP6, atp5pb, atp5mc3b, atp5mc3a, atp5mc1, atp5pd, atp5meb, atp5mea, atp5mf, atp5l, atp5pf, ATP8, atp6v1aa, atp6v1ab, atp6v1b2, atp6v1ba, atp6v1c1a, atp6v1c1b, atp6v1c2, atp6v1d, atp6v1e1b, atp6v1e1a, atp6v1f, atp6v1g1, atp6v1h, atp6v0a1a, atp6v0a1b, tcirg1b, tcirg1a, atp6v0a2a, atp6v0a2b, si:ch73-173p19.2, atp6v0ca, atp6v0cb, atp6v0b, atp6v0d1, atpv0e2, atp6v0e1, atp6ap1b, atp6ap1a, ppa1b, ppa2, ppa1a, and lhpp; [0049] 7) Mitophagy: bcl2l13, eif2ak3, atf4a, atf4b, mapk10, mapk8a, mapk8b, mapk9, jun, pink1, tomm7, prkn, uba52, rps27a, ubc, ubb, mfn1b, mfn2, rhot1a, rhot1b, rhot2, usp8, usp30, LOC100537262, tax1bp1b, tax1bp1a, sqstm1, calcoco2, optn, nbr1a, nbr1b, tbk1, gabarapl2, gabarapb, gabarapa, zgc:92606, map1lc3b, map1lc3c, map1lc3a, map1lc3cl, ambra1a, ambra1b, atg5, atg9a, atg9b, mitfa, mitfb, tfeb, tfe3a, tfe3b, becn1, bcl2l1, pgam5, csnk2a2a, csnk2a1, zgc:86598, csnk2a2b, csnk2a4, csnk2b, src, ulk1b, ulk1a, fundc1, hif1ab, hif1al, hif1aa, e2f1, rela, bnip3, zgc:73226, bnip4, hrasb, hrasa, kras, zgc:55558, nras, si:ch73-116o1.2, mras, rras, rras2, tp53, bnip3lb, bnip3la, foxo3a, foxo3b, cited2, sp1, tbc1d15, tbc1d17, rab7a, rab7b, zgc:100918,
si:dkey-13a21.4, and fis1; and, [0050] 8) Calcium Signaling: slc8a1a, slc8a3, slc8a2b, slc8a1b, slc8a4a, slc8a2a, slc8a4b, atp2b3b, atp2b1a, atp2b2, atp2b1b, atp2b3a, chrm1a, chrm1b, chrm3a, chrm3b, chrm5a, chrm5b, adora2aa, adora2ab, adora2b, adrb1, adrb2b, adrb2a, adrb3b, adrb3a, drd1b, drd1a, LOC563567, drd6b, drd7, drd5a, drd5, hrh2a, hrh2b, LOC797212, htr4, si:dkey-247m21.3, htr5ab, htr5aa, htr6, htr7a, htr7b, htr7, htr7c, gnas, gnal, gnal2, adcy1b, adcy1a, adcy2a, adcy2b, adcy3a, adcy7, adcy8, si:dkey-206f10.1, si:ch211-132f19.7, adcy9, LOC101884360, prkacba, prkacab, prkacbb, prkacaa, pln, atp2a1, atp2a3, atp2a1l, atp2a2a, si:dkey-28b4.8, atp2a2b, hrc, stim1a, stim1b, stim2b, stim2a, orai1a, orai1b, orai2, cacna1c, cacna1da, cacna1db, cacna1fb, cacna1fa, cacna1sb, cacna1sa, cacna1ab, cacna1aa, cacna1ba, cacna1bb, cacna1e, cacna1eb, cacna1g, cacna1ha, cacna1i, chrna7a, FO907089.1, chrna11, si:ch73-380n15.2, p2rx1, p2rx2, p2rx3a, p2rx3b, p2rx4b, p2rx4a, p2rx5, p2rx8, p2rx7, grin1b, grin1a, grin2ab, grin2aa, grin2cb, grin2ca, grin2db, grin2da, ryr1a, ryr1b, ryr2a, ryr2b, ryr3, trdn, casq1a, casq1b, casq2, unm_hu7910, cysltr1, cysltr3, cysltr2b, cysltr2a, chrm2a, chrm2b, adra1aa, adra1ab, adra1bb, adra1ba, adra1d, agtr1a, agtr1b, ednraa, ednrab, ednrba, ednrbb, f2r, BX323555.4, si:dkey-163m14.7, si:dkey-163m14.2, LOC799156, LOC100149161, si:dkey-163m14.6, LOC799227, f2r2.1, grm1b, grm1a, grm5a, grm5b, grpr, hrh1, htr2aa, htr2ab, htr2b, htr2cl1, lhcgr, ntsr1, oxtra, oxtrb, avpr1ab, avpr1aa, ltb4r2b, ltb4r2a, ptafr, ptger1c, ptger1b, ptger1a, ptger3, ptgfr, bdkrb1, si:dkey-63b1.1, bdkrb2, tacr1b, tacr1a, tacr2, tacr3a, tacr3l, FO904943.1, tbxa2r, trhrb, trhra, trhr2, CABZ01084942.1, cckar, cckbra, cckbr , cxcr4a, cxcr4b, gnaq, gna11a, gna11b, gna14a, gna14, gna15.4, gna15.1, egf, pdgfaa, pdgfab, pdgfbb, si:ch211-79m20.1, pdgfc, pdgfd, fgf1b, fgf1a, fgf2, fgf10a, fgf3, fgf6a, fgf17, fgf8a, fgf4, fgf16, fgf18a, fgf6b, fgf20b, fgf7, fgf5, fgf22, fgf24, fgf9, fgf18b, fgf10b, fgf8b, fgf20a, fgf19, fgf21, fgf23, vegfaa, vegfab, vegfc, vegfd, ngfb, ngfa, hgfa, hgf2, mst1, gdnfa, gdnfb, egfra, LOC571431, erbb2, erbb3b, LOC100149258, erbb3a, erbb4a, si:ch73-383l1.1, erbb4b, pdgfra, pdgfrb, fgfr1a, fgfr1bl, fgfr1b, fgfr2, fgfr3, fgfr4, flt1, kdrl, flt4, kdr, ntrk1, ntrk2b, ntrk2a, ntrk3a, ntrk3b, met, mst1rb, mst1ra, ret, ighv4-5, plcd1b, plcd3a, plcd1a, plcd4a, plcd3b, plcb3, plcb2, LOC100149080, plcb4, plcg1, plcg2, plce1, itpr1b, itpr1a, itpr2, itpr3, CR318624.2, tpcn1, tpcn2, mcoln1b, mcoln1a, mcoln2, mcoln3b, mcoln3a, sphk1, sphk2, mcu, vdac1, vdac2, vdac3, zgc:56235, slc25a5, slc25a4, slc25a6, si:dkey-251i10.1, ppifb, ppifa, ppiaa, tnnc1a, tnnc1b, tnnc2.2, si:rp71-17i16.4, calm3b, calm2b, calm1b, calm1a, calm2a, calm3a, calml4a, calml4b,
phkg1a, phkg2, phkg1b, phkb, phka2, phka1a, mylk3, mylk2, mylkb, mylka, mylk4b, mylk4a, mylk5, camk1gb, camk1a, camk1b, camk1db, camk1da, camk1ga, camk2d2, camk2d1, camk2a, camk2b1, camk2g2, camk2b, camk2g1, camk4, ppp3ca, ppp3cca, ppp3cb, ppp3ccb, ppp3r1b, ppp3r1a, nos1, nos2b, nos2a, pde1a, pde1cb, pde1ca, ptk2bb, ptk2ba, itpkb, itpkca, itpkcb, itpka, prkcaa, si:ch73-374l24.1, prkcba, prkcbb, and prkcg. [0051] When analyzing large, complex datasets, such as transcriptomic data, it is helpful to reduce the dimensions to reveal patterns that can be used to evaluate the quality of the data and whether it makes sense given the conditions tested. Reduction of the data to a two-dimensional plot shows how the replicate samples broadly compare with one another ahead of further analysis. Ideally, replicates of each condition form distinct clusters indicating that each condition holistically exhibited a distinct and reproducible expression profile that can be determined. See Figure 1. Principal component analysis (PCA) of all samples together show all of the Day 2 treatments horizontally separated from all of the Day 9 treatments along the first principal component axis (PC1) which is what we expect from samples collected at different stages in the lifecycle. Replicates within each sample all cluster together, indicating that the responses were consistent within each treatment. At both timepoints, the treatment replicates are separated from the control samples along the PC2 axis. Another approach to comparing the individual replicates is a correlation matrix. The gene counts for each replicate compared with every other replicate, ordered by hierarchical clustering, and plotted as a heatmap. As with the PCA plot, the two major clusters are based on the collection day. [0052] Metabolomics and Proteomics Sample Preparation [0053] For preparation of samples for metabolomics and proteomics assays, animal populations can be expanded to 10,000-15,000 animals per treatment and synchronized by bleaching and larval arrest. Synchronized larvae (L1 stage) can be plated on inactivated bacteria containing no treatment and grown to late larval stage (L4). At this point, worms can be harvested by washing the worm off plates and collecting in a filter.10,000-15,000 animals per replicate can be transferred to fresh solid agar media containing each of the compound treatments and treated for 48 hours before harvesting. Animals can be released from the treatment plates by flooding with M9 buffer and then collected by passing over a filter. The animals can be scrubbed with five additional rinses on the
filter to remove residual bacteria and compounds. Animals can then be transferred to 1.5mL tubes and pelleted by centrifugation. The M9 supernatant can be discarded and the worm pellets were frozen in a dry ice and ethanol bath and stored at -80ºC. Once thawed on ice, the samples can be mixed with 8 μL/mg of 80% deoxygenated methanol and homogenized on a MM 400 mill mixer with the aid of two metal beads at 30Hz for 3 min, followed by centrifugation at 21,000 g and 5°C for 10 min. The cleared supernatant of each sample can be diluted 10 fold with the IS solution. Ten-point calibration solutions can be prepared with the use of standard substances of all the targeted metabolites in the IS solution. The concentration range can be, for example, for 0.0001 to 20 nmol/mL for each compound. For quantitation of nucleotides and the other negatively charged metabolites (nicotinic acid, NAD, NADH, NADP, NADPH, NAAD, etc.), 10 μL aliquots of each calibration solution and each sample solution can be injected to run UPLC-MRM/MS with (-) ion detection on a Waters UPLC system hyphenated to a Sciex QTRAP 6500 Plus mass spectrometer. A C18 UPLC column (2.1*100 mm, 1.9 μm) can be used for LC separation. The mobile phase can be a 2% to 40% gradient of tributylamine buffer (A) and acetonitrile-methanol (B) over 25 min at 0.25 mL/min at 50°C. For quantitation of the positively charged metabolites, 10 μL aliquots of each calibration solution and each sample solution can be injected to run UPLC-MRM/MS with (+) ion detection on an Agilent 1290 UHPLC system coupled to An Agilent 6495C QQQ mass spectrometer. A polar C18 UPLC column (2.1*100 mm, 1.6 μm) was used for LC separation and the mobile phase can be 2-mM ammonium acetate buffer (A) and methanol (B) at 0.25 mL/min and 40 °C for gradient elution: 2% to 25% B over 15 minutes. Concentrations of the detected analytes can be calculated with internal standard calibration by interpolating the constructed linear- regression curves of individual compounds, with the analyte-to-internal standard peak ratios measured from sample solutions, in an appropriate concentration range for each metabolite. [0054] In certain embodiments, this disclosure provides multiple preferred aspects, including methods for using C. elegans to obtain gene transcriptional data to identify areas of biological activity related to one or more human health conditions, the method comprising exposing C. elegans organisms to one or more compounds and/or environmental conditions and determining the expression of multiple messenger RNAs (mRNAs) using at least one assay selected from the group consisting of RNA seq, microarray, quantitative polymerase chain reaction (QPCR), transcriptional reporter construct. In some embodiments, the human health condition is selected
from the group consisting of immunity, digestive tract health, muscle function, aging, energy, energy metabolism, skin health, mood regulation, brain health, heart health, stress management, inflammation, and weight management. In some embodiments, this disclosure relates to methods for using C. elegans to obtain gene transcriptional data to identify areas of biological activity related to one or more human health conditions, the method comprising exposing C. elegans organisms to one or more compounds and/or environmental conditions and characterizing protein activity using at least one assay selected from the group consisting of liquid chromatography-mass spectrometry (LCMS), semalogic, enzyme-linked immunosorbent assay (ELISA), western blot, immunostaining, thin-layer chromatography, and a protein activity assay. In some embodiments, the protein is an enzyme use of metabolic flux analysis to identify areas of biological activity where protein activity of a gene creates changes in metabolites that influence health concerns. Enzyme levels may be static but flux through a pathways can be monitored to read out the level of activity of the cellular signaling pathway. In some embodiments, the methods can relate to determining lifespan, healthspan, inflammation, brain health, or digestive tract health; and/or to avoid premature death, early aging, sarcopenia, inflammation, neurodegeneration; and/or to optimize intestinal microbiota). In some embodiments, the methods can be used for determining genetic regulation, protein quantification, and/or metabolic data. In some embodiments, the methods can be used as a confirming assay in C. elegans or a different organism or cell line. In some embodiments, the compound being assayed is for a human clinical study or human clinical trial. In some embodiments, the data indicates specific health concern assays for human testing. [0055] In some embodiments, this disclosure provides methods for identifying a treatment compound for treating a detrimental human complex health condition, the method comprising: exposing an animal or cell line model of the human complex health condition to one or more first test compounds and/or environmental conditions to generate a treated animal cohort; performing a transcriptional analysis of the treated animal cohort, the transcriptional assay comprising determining the expression of multiple messenger RNAs (mRNAs); mapping the transcriptional analysis to one or more cellular signaling pathway(s) detrimentally affected by the one or more test compounds and/or test environmental conditions; correlating the one or more detrimentally affected cellular signaling pathway(s) to the human complex health phenotype; treating the animal or cell line model with a second test compound that corrects a defect in the detrimentally affected
cellular signaling pathway(s); treating a human being in need of treatment of the detrimental human complex health condition with the second test compound, wherein: the detrimental human complex health condition is corrected; and, the second test compound was not previously known to be corrective of the detrimental human complex health condition. In some embodiments, the human complex health phenotype is selected from the group consisting of immunity, digestive tract health, muscle function, aging, energy, energy metabolism, skin health, mood regulation, brain health, heart health, stress management, inflammation, and weight management. In some embodiments, the methods comprise performing a proteomics analysis of the treated C. elegans cohort, wherein protein activity is characterized using at least one assay selected from the group consisting of liquid chromatography-mass spectrometry (LCMS), semalogic, enzyme-linked immunosorbent assay (ELISA), western blot, immunostaining, thin-layer chromatography, and a protein activity assay. In some embodiments, the protein is an enzyme identified using a metabolic flux analysis to identify areas of biological activity where protein activity of a gene creates changes in metabolites that influence the complex health phenotype. In some embodiments, the levels of the enzyme may be static but flux through a pathways can be monitored to read out the level of activity of the cellular signaling pathway. In some embodiments, the methods further comprise performing a phenotype assay to determine lifespan, healthspan, inflammation, brain health, or digestive tract health; and/or to avoid premature death, early aging, sarcopenia, inflammation, neurodegeneration; and/or to optimize intestinal microbiota of the treated C. elegans cohort. In some embodiments, the methods can be used for determining genetic regulation, protein quantification, and/or metabolic data. [0056] Non-Human Model Organism [0057] Provided herein are model organism used in the methods of this disclosure. In certain embodiments those model organisms are selected from C. elegans or zebrafish (Danio reiro). In certain embodiments, the model organisms are wild-type, both for use in generating the look up table and/or for testing (e.g., contacting with the test composition). In other embodiments, the model organisms have been modified either by exposure to known toxicant or infectious agent, or via genetic modification (e.g., transgenic non-human model organisms). [0058] As used herein, transgenic organisms include both a mutation and/or heterologous gene inserted into the genome and expressed and transient expression of a transgene from an expression
vector. In some embodiments, as in the methods disclosed herein, one or more potential therapeutic agents can be identified that transform the modified phenotype of the cell or animal into a normal phenotype. In embodiments, the animal is a vertebrate selected from an avian, a fish, a reptile, a mammal, or an amphibian. In other embodiments, the animal is an invertebrate selected from a Porifera, a Cnidaria, a Platyhelmintes, a Nematoda, an Annelida, a Mollusca, an Arthropoda, or an Echinodermata. In certain embodiments, the animal is a nematode (e.g., C. elegans), a fruit fly, a zebrafish or a frog (e.g., xenopus). In further embodiments, the animal is a metazoan. In other embodiments, the animal is a primate, mammal, rodent or fly. In embodiments, the animal is a parasite species. In other embodiments, the animal is a Chordata, Actinopterygii or Nematoda. In specific embodiments, the animal is Danio rerio zebrafish or C. elegans nematode. [0059] Such transgenic animals can be prepared using nucleic acid constructs as has been described previously (e.g., creating transgenic C. elegans lines using the MosSCI method of Frøkjær-Jensen, et al. (Nat Genet. 40(11): 1375–1383 (2008)). Briefly, to produce transgenic C. elegans, an injection mix can be created using multiple components such as the target plasmid pNU2006 (e.g., at 15ng/ul), an eft-3p::Mosase pNU272 plasmid (e.g., at 10ng/ul) to provide the transposase activity, plasmids encoding fluorescent proteins for visual indication (e.g., red fluorescent protein plasmids pGH8 (at 10ng/ul), pCFJ104 (at 10ng/ul), and pCFJ90 (at 1.25ng/ul) for mCherry expression controlled by the rab-3, myo-3, and myo-2 promoters respectively; and/or other fluorescent plasmid markers), plasmid(s) providing selection against extrachromosomal arrays (e.g., the pMA122 plasmid at, e.g., 10ng/ul, which has a heat shock inducible expression of the toxic protein peel-1). The components are typically mixed, typically also including water to a particular volume (e.g., 20ul). C. elegans are typically prepared for injection by growth on HB101 bacteria. The injected strain is COP93 which are derived from EG6699 - ttTi5605 II; unc-119(ed3) III; oxEx1578 [eft-3p::GFP + Cbr-unc-119] - by selecting against oxEx1578. The strain generated has a Mos1 insertion at ttTi5605 on Chromosome II and the unc-119(ed3) mutation in the background. Upon activation by the Mosase transposase, the Mos1 “hops” out of the genome creating a double-stranded break. The repair of this break by homologous recombination can be co-opted to also introduce DNA sequences that are between the two homology arms. To achieve this, young adult animals are selected for injections. Animals are injected into the gonad using a micropipette needle containing the injection mix. After injection animals are recovered, incubated
and allowed to reproduce on Nematode Growth Media plates. When the progeny animals have cleared the plate of food (approximately 7 days), these are assayed for rescue of the unc-119 movement phenotype. Heat shock is typically then performed at 34oC for 4 hrs. Two days later, animals rescued for the unc-119 movement phenotype without the red fluorescent array markers are then selected, and PCR is used to confirm integration at the locus and the absence of the Mos1 sequence. Other methods are also available as is understood by those of ordinary skill in the art. [0060] Alternative methods for generation of transgenic cell and/or animal lines are also available including extrachromosomal array and CRISPR/Cas9, as in known in the art. CRISPR techniques can be deployed to directly mutate genes and the like within the genome of a cell and/or animal loci. (Kim H et al. Genetics. Aug;197(4):1069-80 (2014); Farboud, et al. Genetics.199(4):959-71 (2015); and, Paix et al. Genetics.201(1):47-54 (2015)). In some embodiments, the clinical variant can be incorporated into the genome of a cell and/or animal by CRISPR as an amino-acid-swap which substitutes the native amino acid with the amino acid change seen in the patient. Briefly, in some embodiments, injections are performed with a dpy-10 sgRNA and a dpy-10 oligonucleotide repair template in the injection mix, and homology-mediated mutagenesis of a dpy-10 locus can be used to detect which injections have a high transformation potential. Typically an injection mix includes a set of sgRNAs targeting a clinical variant editing locus, another repair template instructing for content of clinical variant edit, and Cas9 protein. Typically, ~20 animal gonads are injected with approximately 10-50 nl of injection mix, and three to five days later populations with high frequency of Rol phenotype are identified and isolated for population expansion. After egg lay, the adults are harvested, and PCR is specifically designed to distinguish between homozygous mutant, homozygous wild-type and heterozygous animals is carried out. Animals from populations PCR positive for the mutation are isolated for population expansion and, after egg lay, the adult is PCR tested again to detect presence of homozygosity. Mutations are confirmed by sequencing. The examples describe an embodiment using with CRISPR/Cas9 system to create animals expressing SLC6A4 variants (Gly56Ala and Lys605Asn), and the identification of SLC6A4 antagonists using those animals (e.g., the Gly56Ala and Lys605Asn lines are treated with compound and pharyngeal pumping is tested with the ScreenChipTM; a significant difference from wild-type being an indicator of potential drug effectiveness).
[0061] In some embodiments, a zebrafish gene knock out of a human health condition associated gene can be obtained from either genetic stock centers or made with gene knock-out techniques (e.g., CRISPR-based gene deletion). [0062] SPECIFIC EMBODIMENTS [0063] In certain embodiments provided herein is a method for identifying a test composition that affects a human health concern using a non-human model organism, comprising providing one or more look up tables comprising a list of genes associated with the human health concern; contacting the non-human model organism with one or more test compositions during an incubation period; generating one or more profiles of gene expression from the model organism after the incubation period; recording a change in the one or more profiles as compared to a control set of gene expression profiles generated from an untreated cohort of the non-human model organisms providing a subset of differentially expressed genes; and, mapping the subset to the look up table and identifying one or more differentially expressed genes in the subset that are common to those in the look up table, thereby identifying a test compound that affects the human health concern. [0064] In one embodiment provided herein is a method for identifying a test composition that affects a human health concern using variant non-human model organism, comprising providing the variant non-human model organism comprising a knock-out (KO) or knock-in (KI) of a gene associated with the human health concern; providing one or more look up tables comprising a list of genes associated with the human health concern, wherein the list of genes comprises a profile of genes differentially expressed in the knock-out (KO) or knock-in (KI) non-human model organism compared to a corresponding model organism without the variant; contacting the variant non- human model organism with one or more test compositions during an incubation period; generating one or more profiles of differentially expressed genes from the variant model organism after the incubation period compared to a control variant model organism; and, mapping the profile of expressed genes to the look up table and identifying one or more expressed genes in the profile that are common to those in the look up table, thereby identifying a test compound that affects the human health concern.
[0065] In another embodiment provided herein is a method for identifying a test composition that affects a human health concern using a non-human model organism, comprising providing one or more look up tables comprising a list of genes associated with the human health concern, wherein the list of genes comprises a profile of genes differentially expressed in a knock-out (KO) or knock- in (KI) non-human model organism compared to a corresponding model organism without the variant; contacting the corresponding model organism without the variant or a cell line with one or more test compositions during an incubation period; generating one or more profiles of differentially expressed genes from the model organism or cell line of step b. after the incubation period compared to a control model organism that was not treated with the test composition; and, mapping the profile of expressed genes to the look up table and identifying one or more expressed genes in the profile that are common to those in the look up table, thereby identifying a test compound that affects the human health concern. [0066] In yet another embodiment provided herein is a method for identifying a test composition that affects a human health concern using an induced non-human model organism, comprising: providing the induced non-human model organism, wherein the non-human model organism is contacted with a health concern compound to induce a condition associated with the human health concern; providing one or more look up tables comprising a list of genes associated with the human health concern, wherein the list of genes comprises a profile of genes differentially expressed in the induced non-human model organism compared to a corresponding model organism without the induced condition; contacting the induced non-human model organism with one or more test compositions during an incubation period; generating one or more profiles of differentially expressed genes from the induced model organism after the incubation period compared to a control model organism not treated with the test compositions; and, mapping the profile of expressed genes to the look up table and identifying one or more expressed genes in the profile that are common to those in the look up table, thereby identifying a test compound that affects the human health concern. [0067] In one embodiment provided herein is a method for identifying a test composition that affects a human health concern using an induced non-human model organism, comprising providing the induced non-human model organism, wherein the non-human model organism is
contacted with a health concern compound to induce a condition associated with the human health concern; providing one or more look up tables comprising a list of genes associated with the human health concern, wherein the list of genes comprises a profile of genes differentially expressed in the induced non-human model organism compared to a corresponding model organism without the induced condition; contacting a non-human model organism or a cell line with one or more test compositions during an incubation period; generating one or more profiles of differentially expressed genes from the model organism or cell line after the incubation period compared to a control model organism or cell line not treated with the test compositions; and, mapping the profile of expressed genes to the look up table and identifying one or more expressed genes in the profile that are common to those in the look up table, thereby identifying a test compound that affects the human health concern. [0068] In another embodiment provided herein is a method for identifying a human health concern to be treated with a test composition, comprising contacting a non-human model organism with one or more test compositions during an incubation period; generating one or more profiles of gene expression, protein and/or metabolite from the model organism after the incubation period; recording a change in the one or more profiles as compared to a control set of gene expression, protein and/or metabolite profiles generated from an untreated cohort of the non-human model organisms; and, mapping the change in one or more profiles, or a subset thereof, to a lookup table comprising one or more non-human model organism genotypic expression profiles correlated to the human health concern with a known genotypic expression profile; thereby identifying the human health concern to be treated with the test composition. [0069] In another embodiment provided herein is a method for identifying a test composition that affects a human health concern using variant non-human model organism, comprising providing one or more look up tables comprising a list of genes associated with the human health concern, mapping the profile of expressed genes after test compound treatment to the look up table and identifying the compound treatments with one or more expressed genes in the profile that are common to those in the look up table, thereby identifying a test compound that affects the human health concern; and, contacting the variant non-human model organism with one or more test
compositions during an incubation period and measuring a phenotypic rescue effect - where the phenotype can be behavioral, physiological, or molecular. [0070] In embodiments provided herein is a method of any preceding embodiment wherein the human health concern is selected from longevity, energy metabolism, cardiovascular health, metabolic syndrome, neurodegenerative disorders, muscle function. [0071] In embodiments provided herein is a method of any preceding embodiment, wherein the human health concern is longevity and the look up tables are selected from the group consisting of insulin signaling (Table 1), autophagy (Table 2), mTor signaling and energy metabolism (Table 3), mitochondrial health and oxidative stress (Table 4), stress response (Table 5), and growth and development (Table 6). [0072] In embodiments provided herein is a method of any preceding embodiment, wherein the look up table is generated based on gene expression pathway analysis and expression profiles from the literature. [0073] In embodiments provided herein is a method of any preceding embodiment, wherein the mapping comprises identifying one or more expressed genes in common between the profile and look up table. [0074] In embodiments provided herein is a method of any preceding embodiment, wherein the differentially expressed gene is upregulated compared to a corresponding gene on the look up table. [0075] In embodiments provided herein is a method of certain preceding embodiments, wherein the differentially expressed gene is downregulated compared to a corresponding gene on the look up table. [0076] In embodiments provided herein is a method of any preceding embodiment, wherein the differentially expressed gene is identified based on a predetermined threshold value. [0077] In embodiments provided herein is a method of any preceding embodiment, wherein the human health concern is a rare genetic disease.
[0078] In embodiments provided herein is a method of any preceding embodiment, wherein the differentially expressed gene is a gene having an expression level of equal to or greater than 1.5- fold with a false discovery rate (FDR)-adjusted P-value of < 0.05. [0079] In embodiments provided herein is a method of any preceding embodiment wherein the non-human model organism is selected from a nematode or zebrafish. [0080] In embodiments provided herein is a method of any preceding embodiment, wherein the generating one or more profiles of differentially expressed genes comprises performing a transcriptional analysis, wherein the gene expression activity is characterized using at least one assay selected from the group consisting of RNA seq, microarray, quantitative polymerase chain reaction (QPCR), or transcriptional reporter construct. [0081] In embodiments provided herein is a method of any preceding embodiment, wherein the test composition is selected from pre-clinical therapeutic agents, clinical development therapeutic agents, FDA approved therapeutic agents, dietary supplements, nutraceuticals or vitamins. [0082] In embodiments provided herein is a method of any preceding embodiment, wherein the test composition comprises a mixture of active ingredients. [0083] In alternative embodiments provided herein is a method of any preceding embodiment, wherein the test composition comprises a single active ingredient. [0084] This disclosure provides additional aspects and embodiments as would be understood by those of ordinary skill in the art. [0085] The terms “about”, “approximately”, and the like, when preceding a list of numerical values or range, refer to each individual value in the list or range independently as if each individual value in the list or range was immediately preceded by that term. The terms mean that the values to which the same refer are exactly, close to, or similar thereto. Optional or optionally means that the subsequently described event or circumstance can or cannot occur, and that the description includes instances where the event or circumstance occurs and instances where it does not. Ranges may be expressed herein as from about one particular value, and/or to about another
particular value. When such a range is expressed, another aspect includes from the one particular value and/or to the other particular value. Similarly, when values are expressed as approximations, by use of the antecedent about or approximately, it will be understood that the particular value forms another aspect. It will be further understood that the endpoints of each of the ranges are significant both in relation to the other endpoint, and independently of the other endpoint. Ranges (e.g., 90-100%) are meant to include the range per se as well as each independent value within the range as if each value was individually listed. [0086] All references cited within this disclosure are hereby incorporated by reference in their entirety. Certain embodiments are further described in the following examples. These embodiments are provided as examples only and are not intended to limit the scope of the claims in any way.
[0087] EXAMPLES [0088] Example 1: Generating gene expression profiles using C. elegans to identify anti-aging (longevity) mechanisms relevant to humans and predict human aging pathway activations. [0089] Provided herein are methods of using compound treatment to generate data from RNAseq, providing curated Look Up Tables of a group of genes associated with aging and longevity, methods for generating one or more profiles of gene expression from the C. elegans after treatment with the test composition, interpreting the data to identify the differentially expressed genes (DEG), and mapping the DEG to the look up table and identifying one or more differentially expressed genes in the profile that are common to those in the look up table generate. This method can be used with any test composition to understand if that composition would affect a human health concern (e.g., aging). C. elegans worms (“worms”) are the model organism used in these examples. [0090] RNA sequencing (RNA-seq) was used to examine gene expression and determine which biological pathways are affected by exposure to JadeAging® longevity formulation (Chenland Nutritionals, Inc.) and its active ingredients (Rehmannia (plant root), Poria (Wolfiporia cocos; mushroom), and Ginseng). These pathways may explain the beneficial effects of JadeAging® on health, including mitochondrial health and protection against reactive oxygen species (ROS). [0091] To identify whether JadeAging® could affect health and vitality of the worms, global gene expression was analyzed by mRNA sequencing (RNA-Seq). Both young (adult day 2) and aged (adult day 9) animals were collected after treatment with either 100 mg/mL JadeAging®, 222 mg/mL Rehmannia, 37 mg/mL Poria, or 50 mg/mL Ginseng. The molecular pathways modulated by treatment with JadeAging® provide insight into how these pathways might contribute to the mechanism of action of JadeAging® and how this correlate to the known mechanisms of aging, health, and vitality. [0092] Worm Feeding: To prevent chemical modification or metabolism of the test article by the food bacteria, animals were fed on a lawn of inactivated E. coli, strain OP50. Cultures of OP50 were inactivated via exposure to 0.5% paraformaldehyde for 1 hour followed by 5 washes in M9 (Beydoun et al.2021). Bacteria were dispersed by passing through a 5 µM filter during the wash steps. The quantity and distribution of food bacteria were calibrated to ensure adequate access to
food for the duration of assay while maintaining visibility of the animals. [0093] Delivery strategy: The compound concentrations (or dosages) in this study are based on the total volume of agar in the solid media. Compounds are dissolved in a working solution and then combined directly with the food bacteria before seeding on agar plates. Water-soluble compounds will diffuse throughout the agar but less soluble compounds may be more concentrated in the food. Once the food spots are dried, the compounds are allowed to equilibrate with the food bacteria and the agar for at least 24 hours before animals are introduced. [0094] Worm harvesting and RNA extraction: Adult animals were harvested, cleaned by filtration, and frozen in RNA stabilization reagent. RNA was extracted from all samples using Quick-RNA Miniprep Plus Kit (Zymo Research). All samples exceeded our threshold for RNA quantity and quality. RNA samples were submitted to Novogene Co. Ltd. and subjected to more stringent quality control (QC), being tested on a Qubit for concentration and run on an agarose gel and on the Agilent 2100 to assess RNA quality and integrity. During Novogene’s QC, several samples received a score below the standard quality limits. After discussion with Novogene samples with an RNA integrity number (RIN) of 4.3 and above were carried forward. [0095] RNA-Seq library preparation and sequencing: The total RNA was enriched for poly- mRNA using oligo(dT) paramagnetic beads. DNA libraries were then constructed from this input mRNA using the NEBNext UltraTM II RNA Library Prep Kit. This creates a ready-to-sequence dsDNA library that retains the strand-specific information in the original mRNA. These libraries were then further tested by the Qubit for concentration and the Agilent 2100 for library size distribution and quality. In order to properly pool the libraries and load them onto sequencing lanes to ensure the correct number of reads per sample, an even more precise quantification of the library was done via qPCR, and the samples were loaded onto the NovaSeq 6000 platform for a paired- end sequencing run of 150 bp for each end (PE150). The loading concentrations were designed to obtain at least 6.0 Gb (which is the number of billion bases of raw data, determined by the number of reads multiplied by the length of each read). [0096] As a QC step we used a principal component analysis (PCA) for all samples and conditions. Examining this PCA revealed that three samples (“Outliers”) were not behaving as expected Figure 1 (A). These three outlier samples were eliminated from the expression analysis and the PCA reran,
the results of which are presented in Figure 1(B). With this restricted set of data, all of the Day 2 treatments horizontally separated from all of the Day 9 treatments along the first principal component axis (PC1) which is what we expect from samples collected at different stages in the life cycle. Other QC metrics were also evaluated, such as the distribution of the log of the un- normalized gene counts and the distribution of mapped reads over gene features across the genome. All QC metrics were met for the restricted data set. [0097] ROSALIND® RNA-seq Methods: Data was analyzed by ROSALIND® (https://rosalind.bio/), with a HyperScale architecture developed by ROSALIND, Inc. (San Diego, CA). Individual sample counts were normalized via Relative Log Expression (RLE) using DESeq2 R library (“Moderated Estimation of Fold Change and Dispersion for RNA-Seq Data with DESeq2 | Genome Biology | Full Text” n.d.). Read Distribution percentages, violin plots, identity heatmaps, and sample MDS plots were generated as part of the QC step. DEseq2 was also used to calculate fold changes and p-values and perform optional covariate correction. Clustering of genes for the final heatmap of differentially expressed genes was done using the PAM (Partitioning Around Medoids) method using the fpc R library (Hennig, C. Cran-package fpc. https://cran.r- project.org/web/packages/fpc/index.html). [0098] Differential gene expression was performed with EdgeR using false likelihood ratio tests based on linear models. The likelihood ratios were used to determine the p-values which were subsequently corrected for using the Benjamini-Hochberg (BH) procedure false discovery rate (FDR) method. [0099] Genetic pathway analysis: Gene Ontology (GO) enrichment analysis on differentially- expressed genes was conducted using (www.geneontology.org website) and ROSALIND. For the ROSALIND analysis, hypergeometric distribution was used to analyze the enrichment of pathways, gene ontology, domain structure, and other ontologies. The topGO R library (Alexa and Rahnenführer, n.d.), was used to determine local similarities and dependencies between GO terms in order to perform Elim pruning correction. Several database sources were referenced for enrichment analysis, including Interpro (Mitchell et al.2019), NCBI (Geer et al.2010), MSigDB (Subramanian et al. 2005; Liberzon et al. 2011), REACTOME (Fabregat et al. 2018), WikiPathways (Slenter et al. 2018). Enrichment was calculated relative to a set of background
genes relevant for the experiment. [00100] Targeted pathway analysis: C. elegans genes orthologous to human genes and pathways of interest were identified using OrthoList2 (“OrthoList 2: A New Comparative Genomic Analysis of Human and Caenorhabditis Elegans Genes - PubMed” n.d.). The identified C. elegans genes were then extracted from the set of differentially expressed genes for focused analysis. Gene components of the longevity pathway were determined using WormBase, KEGG, and REACTOME. [00101] To identify whether treatment with a compound or other manipulation had effects on an anti-aging mechanism of action related to the human condition of aging (e.g. longevity), the lists of relaxed cutoff differentially-expressed genes (“loose DEGs”) in the C. elegans organism was used to created a list of DEG human gene orthologs. [00102] Separately, look up tables (“LUTs”) of human genes that are implicated in pathways related to longevity (e.g., insulin- insulin signaling (IIS)) were curated. These curated LUT molecular lists were drawn from WormBase, KEGG, and other published databases and literature. These LUTs allow us to map molecular objects (genes, proteins, small molecules, etc.) to human health concerns via the intermediary of molecular interaction/reaction/relation networks (KEGG pathway maps, BRITE hierarchies and KEGG modules). It is not simply an enrichment process; rather it is a set operation to generate a new set. The curated longevity LUTs are show below in Tables 1-6: Table 1 Insulin signaling C. elegans se

FOXO1, FOXO3, FOXO4, daf-16 FOXO6 Forkhead box protein O al- se nit nit nit de se
Table 2 Autophagy C. elegans H Othl D i ti r
Table 3 mTOR signaling and energy metabolism C. elegans in
F49C12.12 RNASEK Uncharacterized protein SFN YWHAB YWHAE ng g r nt ex se ng
Table 4 Mitochondrial health and oxidative stress C. elegans H hl D i i ng se 1, 0,
Poly [ADP-ribose] polymerase parp-1 PARP1, PARP2 1 se in in in in 1, 1, er
Table 5 Stress response C. elegans S-
GSTA4, HPGD5 transferase gst-36 GSTA1 GSTA2 GSTA3 S- S- ng or un ng 1, 1,
Table 6 Growth and Development C. elegans or
fard-1 FAR1, FAR2 Fatty acyl-CoA reductase Delta(9)-fatty-acid desaturase se se or [00103]
g p p g y p y e then cross- referenced with the list of the human orthologs of the DEGs identified in our experimental treatment groups. A statement such as “treatment with compound X is likely to exert a pro- longevity effect via the insulin signaling mechanistic network” could then be made. Although only a few of the genes might individually have highly significant changes in expression, collectively, the connectivity of the pathways can suggest a coherent hypothesis for a mechanism of action. Since a gene or pathway might be upregulated in response to a stress or downregulated due to relief of the stress, direction of change is not considered, only whether the expression of the genes has changed.
[00104] Differential Gene Expression. To identify genes that are differentially expressed with JadeAging® treatment in an unbiased manner, the gene counts for each of the JadeAging®- treated samples were compared against the vehicle control. Differentially expressed genes (DEGs) are defined here as genes whose expression level exceeds 1.5-fold with an FDR-adjusted P-value of < 0.05. However, there is a continuum of genes above and below these thresholds. Volcano plots are a type of scatterplot where the statistical significance and magnitude of change are plotted against each gene. The genetic response to JadeAging® treatment is illustrated as volcano plots (Fig.2). The volcano plots for Ginseng, Poria and Rehmannia in Figs.3, 4 and 5, respectively.
[00105] DEGs in samples from both day 2 and day 9 were also determined for all treatment groups (Fig. 6). As shown therein, ginseng-treated animals showed the largest number of DEGs both day 2 (326 DEGs) and day 9 (812 DEGs). The observed DEGs resulting from each treatment at days 2 and 9 are summarized below in Tables 7 and 8.
Table 7 DEGs in common between JadeAging® and Poria, Ginseng and Rehmannia at day 2 ng
Table 8 DEGs in common between JadeAging® and Poria, Ginseng and Rehmannia at day 9 ng
[00106] Individual genes with the greatest change in expression after treatment with JadeAging® are listed in the following tables (Tables 9-13). Table 9 JadeAging vs. Vehicle Control: Top 20 differentially downregulated genes at Day 2
Table 10 JadeAging® vs. Vehicle Control: Differentially downregulated genes at Day 2
Table 11 JadeAging® vs. Vehicle Control: Top 20 differentially downregulated genes at Day 9
Y51H4A.7 Probable urocanate hydratase -1.65437 6.71E-03 10 Rb3i i l l 10 165405 0009738
Table 12 JadeAging® vs. Vehicle Control: Differentially upregulated genes at Day 9
Table 13 JadeA in ® vs Vehicle Control: To 20 differentiall downre ulated enes at Da 9
ligase cyp-34A2 CYtochrome P450 family -1.67895 3.09E-03

[00107] Pathway Mapping. To use the profile to determine if the test composition (JadeAging®) affects the human health concern of longevity, the expressed genes affected by JadeAging® are compared to genes within the canonical longevity pathway and additional supporting pathways that make up the LUT (e.g., Tables 1-6) [00108] Treatment with JadeAging® significantly affected the expression of several genes with established roles in longevity (as mapped and identified by comparing to the LUT for longevity, including those involved in stress resistance and autophagy. For pathway analysis a relaxed cutoff of P < 0.1 and fold change of ± 1.25 was used to identify differentially expressed genes. Of the 93 genes known to be associated with longevity, six were found to be differentially expressed in young adults (day 2) exposed to JadeAging® and five were found to be differentially expressed in aged adults (day 9) after exposure to JadeAging® (Figs.14 and 15, Table 14).
Table 14 Lifespan (e.g., longevity) associated genes with altered expression in JadeAging® vs VC
e gy/ g

[00109] Several key members of canonical longevity pathways were differentially expressed in JadeAging®-treated animals. The manners in which JadeAging® might contribute to longevity in the context of these pathways. [00110] Nutrient sensing pathways that contribute to longevity [00111] The insulin/insulin-like growth factor-1 signaling (“IIS”) pathway was the first pathway implicated in genetic regulation of lifespan and aging. The discovery that loss of function of the insulin receptor DAF-2 could more than double lifespan in C. elegans was a landmark finding that helped launch the field of aging research (Kenyon et al.1993). Daf-2 is downregulated in aged adult (day 9) animals treated with JadeAging® (Figure 8 Table 14). [00112] Another important pathway involved in regulation of lifespan through nutrient sensing activities is the Target of Rapamycin (TOR) pathway. TOR is a key nutrient sensor and master regulator of growth and energy metabolism in animals (Blackwell et al. 2019). Signaling
through TOR involves two distinct protein complexes, mTORC1 and mTORC2, that regulate different physiological processes that can affect lifespan. The mTORC1 acts largely through ribosomal S6 kinase (S6K). Inhibition of the S6K protein, encoded by rsks-1, significantly increases lifespan (Hansen et al.2007) (Hansen et al.2007). Treatment with JadeAging® causes a modest decrease in rsks-1 in day 9 animals (Figure 8, Table 14). Interestingly, the IIS and TOR pathways interact, and animals with decreased function in both daf-2 and rsks-1 show a synergistic lifespan extension (Chen et al.2013). [00113] One main mechanism by which the TOR pathway leads to lifespan extension is by promoting autophagy. The gene cpr-1, which encodes a worm ortholog of Cathepsin B, was significantly upregulated in JadeAging®-treated animals at day 2 (Figure 7, Table 14). Cathepsins control proteloytic degradation within the lysosome, which is critical for autophagy. [00114] Stress-related pathways that contribute to longevity [00115] Across species, from yeast to humans, moderate levels of stress evoke protective responses that promote longevity (Kishimoto, Uno, and Nishida 2018). The transcription factor SKN-1 is an ortholog of human Nuclear Respiratory Factor (Nrf) that works in conjunction with DAF-16 to activate transcriptional responses to xenobiotic and oxidative stress (Tullet et al.2008). DAF-16/SKN-1 are best known as key effectors of insulin signaling but also interface with other longevity-promoting pathways. Although skn-1 and daf-16 expressions were unchanged, downstream stress response effectors, glutathione transferases (GSTs), were affected. Gst-4 was down-regulated in both day 2 and day 9 animals after treatment with JadeAging® (Figs.7 and 8, Table 1.1). By contrast, gst-5 was upregulated in day 2 and day 9 adults (Figs.7 and 8, Table 14) and gst-20 was modestly upregulated in day 2 adults (Fig. 7, Table 14). Decreases in gst-5 expression have been shown to cause reduced lifespan (Ayyadevara et al. 2007), whereas other GSTs likely have tissue specific effects on longevity. [00116] Another target of DAF-16 is stress-response protein, SIP-1. Decreased expression of sip-1 has been shown to cause decrease in lifespan (Morley and Morimoto 2004). Sip-1 expression has been shown to be slightly elevated in animals lacking the rsks-1 gene as well (Seo et al.2013). Day 9 adults treated with JadeAging® had upregulated sip-1 (Fig.8, Table 14).
[00117] RNAsek (PHI-62) influences DAF-16-dependent transcription, and its knockdown reduces lifespan (McCormick et al. 2012). Phi-62 was downregulated in day 2 animals treated with JadeAging® but not affected in older animals (Fig.7, Table 14). [00118] Finally, germline ablation leads to lifespan extension and depends not only on DAF- 16, but also the nuclear hormone receptor, DAF-12 (Hsin and Kenyon 1999). Increased DAF-12 levels cause increased lifespan (Gerisch et al. 2007). Daf-12 was upregulated in day 2 animals treated with JadeAging® (Fig.7, Table 14). [00119] Interaction of JadeAging® components [00120] We also looked at longevity-related differentially expressed genes in animals treated with the three components of JadeAging®: Rehmannia, Poria, and Ginseng. Some genes that were upregulated in JadeAging®, like cpr-1, gst-5, gst-20, were also upregulated in animals treated with Ginseng. Likewise, gst-4, which was downregulated in JadeAging®, was also downregulated in Poria and Rehmannia treated animals. On the other hand, some genes that were differentially expressed in JadeAging® treated animals, like rsks-1, sip-1, phi-62, daf-12, and daf-2, were not found to have significant differential expression in any of the components of JadeAging®. [00121] Based on the findings, it can be concluded that JadeAging® has a significant effect on the gene expression related to nutrient sensing, stress-related pathways, and oxidation-reduction processes. The downregulation of daf-2 and rsks-1 and upregulation of cpr-1 in response to JadeAging® treatment suggest the activation of the TOR pathway and promotion of autophagy. Moreover, the enrichment for genes related to defense against Gram-negative bacteria and the innate immune response suggests a potential link between JadeAging® treatment and increased lifespan. The similarities in DEGs between JadeAging® and Ginseng treatment groups suggest a potential overlap in their mechanisms of action. Further studies are warranted to elucidate the underlying mechanisms of JadeAging® and its potential therapeutic applications in aging-related diseases.
[00122] Example 2: Analyzing Transcriptomics Data from a C. elegans genetic model disease to identify potential therapeutic compounds [00123] Provided herein are methods of using a model of a genetic disorder to analyze data from differentially expressed genes between a genetic model (e.g., with a knock out or knock-in of a gene associated with a genetic disorder) and a corresponding control model organism, generating lookup tables based on those DEG (e.g., up or down regulated genes) and then using the look up tables as a comparator to a test model organism and a test composition. These lookup tables are matched with transcriptional profiles after compound treatment to identify therapeutic compounds that can reverse the effects of the disorder at the molecular level. [00124] RNAseq data was generated using methods described in Example 1. RNA was extracted from N2 wild-type worms at day 2 and day 9 of adulthood to serve as a reference data set. RNA was also extracted from a C. elegans strain containing a knockout (KO) of a gene that has a human homolog that is linked to a rare genetic disorder. Any animal model of disease can be used for this analysis. Animals from this KO strain were also harvested at day 2 and day 9 of adulthood. From the extracted RNA samples, a library was prepared, sequencing was performed, and data was mapped to the C. elegans transcriptome as described in Example 1. [00125] To identify genes that are differentially expressed in the KO, the gene counts for each of the KO samples were compared against the wild type control. Differentially expressed genes (DEG) are defined here as genes whose expression level exceeds 1.5-fold with an FDR- adjusted p-value of < 0.05. However there is a continuum of genes above and below these thresholds. The gene expression profile of the KO animals diverged from that of wild-type animals at both day 2 and day 9 of adulthood. Overall, a set of 1314 genes at day 2 and 1128 genes at day 9 showed 1.5-fold or greater change in expression relative to control. See Figure 9. Human homologs for each C. elegans gene were identified. Individual genes with the greatest change in expression were used to create two lookup tables, one for genes upregulated in the KO and one for genes downregulated (Tables 15 and 16, respectively). Table 15 e

Y47H9C.1 hypothetical protein 9.71 < 0.001 1 1 1 1 1 1 1 1 1 1 1 1 1 1 1 1 1 1 1 1
Nematode Specific Peptide nspc-16 family, group C 5.56 < 0.001 1 1 1 1 1 1 1 1 1 1 1 1 1
Table 16 e 1 1 1
F54F7.9 hypothetical protein -5.02 < 0.001 1 1 1 1 1 1 1 1 1 1 1 1 1 1 1 1 1 1 1 1 1
amt-1 Putative ammonium transporter 1 -3.34 < 0.001 1 1 1 1 1 1 1 1 1 1 1 1 1
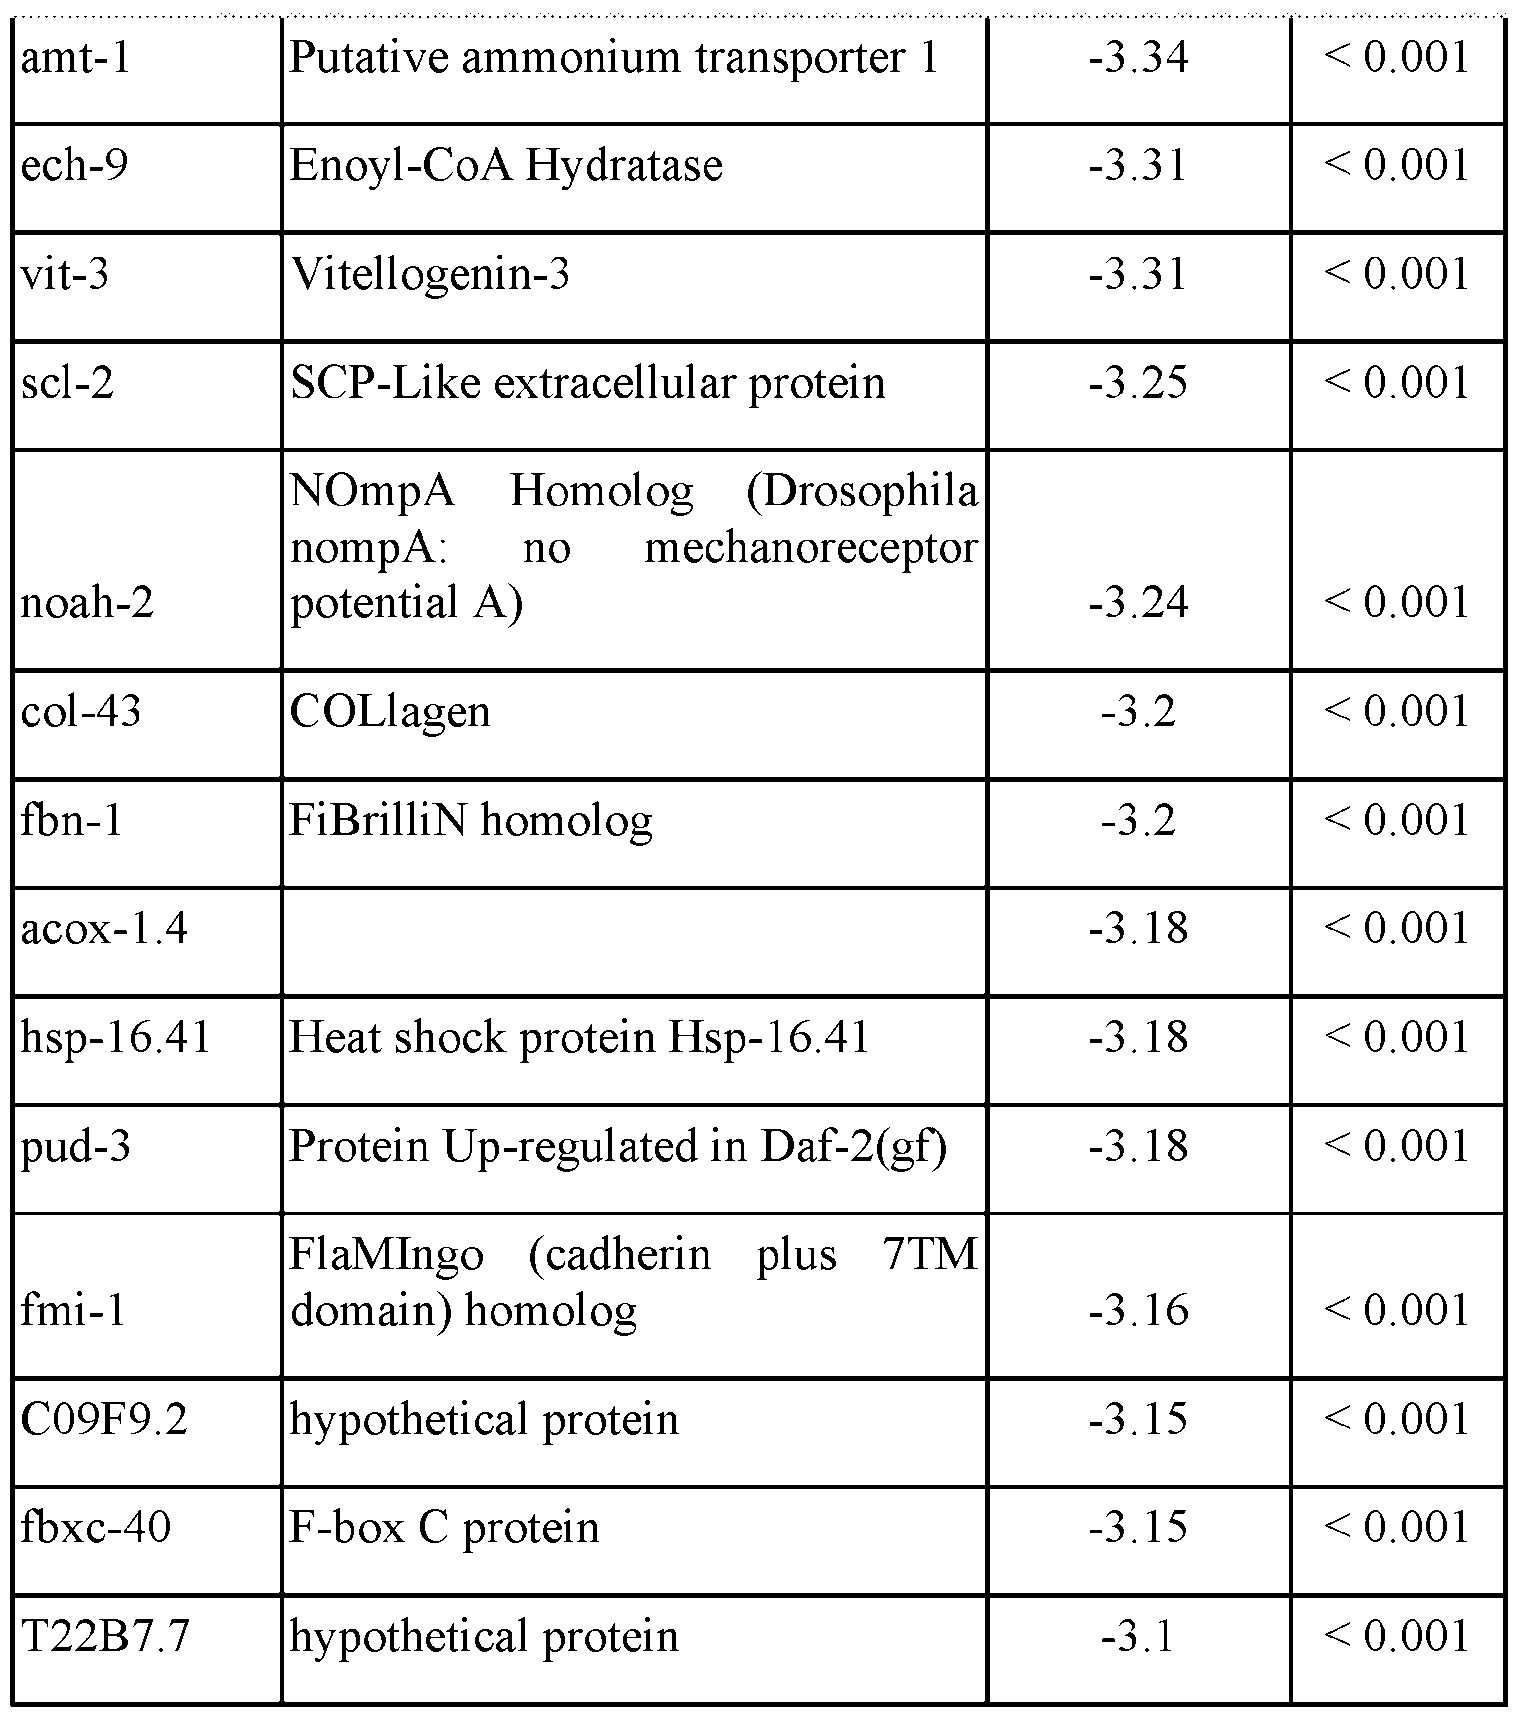
[00126] To identify potential therapeutic compounds to treat the disease, the expression profiles generated in human cell culture after small molecule treatment as reported in L1000 were compared to the LUT of the top 100 up and down regulated genes in the genetic disease model. (Subramanian, et al.. A Next Generation Connectivity Map: L1000 Platform and the First 1,000,000 Profiles. Cell. 2017 Nov 30;171(6):1437-1452.e17. doi: 10.1016/j.cell.2017.10.049. PMID: 29195078; PMCID: PMC5990023). Additional LUTs were generated from the literature. Molecules that have an expression profile opposite of that seen in our KO vs wild type data set were identified. For example, if gene X is upregulated in KO animals, then we look for drugs where gene X is downregulated after treatment. This is done on a genome-wide scale using a variety of
bioinformatic tools (L1000FWD and L1000CDS2). Using the day two and day nine datasets we generated a list of 23 compounds that were hits two or more of the analyses (Table 17). This is a list of potential therapeutic compounds that can be tested in the animal model. An additional 17 compounds were identified using the LUTs from the literature, for a total of 40 compounds tested. Table 17 Compound hits identified

[00127] To determine the therapeutic potential of compounds for this genetic disorder, RNA is harvested from wild-type animals treated with the compounds as well as untreated controls. Sequencing reads are generated as described in Example 1. The treated group is compared with the untreated control group and DEGs are identified. These are then compared with the genes in the lookup tables for the genetic disorder. Compounds that cause an upregulation in genes in the downregulated lookup table and a downregulation in genes in the upregulated lookup table are good candidates for having a therapeutic effect. [00128] Alternatively, rescue of a phenotype is used to determine the therapeutic potential. The disease model KO animals have a phenotype of reduced movement with age. Aged locomotion was tested on solid media. Animals were synchronized by bleaching (WormBook, Maintenance of C. elegans), and raised on solid media to the L4 stage. Animals were then transferred to liquid culture where they were treated with the test compounds and aged to day 12 of adulthood. On day 12, ~25 animals were placed onto the center of assay plates that were baited with a paralytic agent (sodium azide, NaN
3) along the perimeter. The motile fraction was quantified as the number of worms outside the center circle divided by the total number of worms on the plate. [00129] After treatment with the 40 compounds, one compound was identified that significantly rescued the movement phenotype of the disease model KO. This compound, identified by using the LUTs was validated as a potential therapeutic. [00130] Example 3: Generating and Analyzing Transcriptomics Data from Danio rerio to understand the effect of a treatment on neuroprotection and brain health using an induced non- human model organism [00131] Provided herein are methods of using the zebrafish model organism and treating with a compound to induce a disease-like state (compound or induced disease model). The transcriptomic profile from these treated (disease induced) animals are characterized using RNAseq and a look up table is generated based on the DEG between the expression profile of the induced animal model and a control (corresponding model organism with the induced condition). The compound disease model zebrafish are then treated with potential therapeutic compounds and RNAseq is performed to generate one or more profiles of differentially expressed genes. The lookup tables are used to identify effective therapeutic compounds that can reverse the effects of
the disease at the molecular level, wherein the expression profiles are mapped to the look up table identifying one or more expressed genes in the profile that are common to those in the look up table. [00132] To identify potential mechanisms of action through which a test composition could affect oxidative stress-associated diseases, global gene expression was analyzed by RNA-seq. To examine the early response to a test composition pretreatment prior to paraquat (PQT) exposure (widely used to catalyze the formation of ROS, more specifically, the superoxide free radical. Paraquat will undergo redox cycling in vivo, being reduced by an electron donor such as NADPH, before being oxidized by an electron receptor such as dioxygen to produce superoxide, a major ROS) we used lower concentrations of compound and sampled at earlier time points compared to the survival, movement, and morphology assays. Larval zebrafish (3 dpf) were pretreated with dilutions of Treatment Z (0.03, 0.1, 0.3 μM), 0.1 μM Positive Control (PC), or 0.003% DMSO for 4 hours before the addition of PQT to 3 mM. An additional DMSO control group was not exposed to PQT. 3 replicates of pooled fish per treatment (n=22-27 fish per replicate) were harvested for RNA extraction per time point (2 and 24 hours post-PQT exposure). [00133] Compound treatment and fish harvesting. At 3 dpf, fish were treated with Treatment Z (0.03, 0.1, 0.3 μM), 0.1 μM PC, or 0.003% DMSO (n= 150 fish per concentration) for approximately 4 hours before the addition of PQT (1 M stock in sterile water) to a final concentration of 3 mM. Dilutions of Treatment Z and PC were prepared with 0.003% DMSO. An additional 0.003% DMSO control group (n=150) was not exposed to PQT. Half of each treatment group (n=75) was collected after 2 hours of PQT treatment. The remaining fish were collected after 24 hours of PQT treatment. 3 replicates per time point (n~25 per replicate) were euthanized and collected into 400 μL of 1x DNA/RNA Shield solution (Zymo Research) and stored at 4 °C until RNA extraction. Fish without a heartbeat were excluded from collection. [00134] RNA preparation and QC. To extract RNA, samples were homogenized in DNA/RNA Shield by bead mill and processed using the Quick-RNA Miniprep Plus kit (Zymo Research). All samples exceeded our threshold for RNA quantity and quality as measured by Qubit RNA BR and IQ assays (ThermoFisher Scientific). RNA samples were submitted to Novogene Co. Ltd for sequencing and subjected to more stringent QC: tested on a Qubit for concentration and run
on an agarose gel and on the Agilent 2100 to assess RNA quality and integrity. All samples had an RNA Integrity Number (RIN) of 9.5 or higher (range is 0-10, with 10 being “perfect”). [00135] Library construction and sequencing. The total RNA was then enriched for poly- mRNA using oligo(dT) paramagnetic beads. DNA libraries were then constructed from this input mRNA using the NEBNext UltraTM II RNA Library Prep Kit. This creates a ready-to-sequence dsDNA library that retains the strand-specific information in the original mRNA. These libraries were then further tested by the Qubit for concentration and the Agilent 2100 for library size distribution and quality. In order to properly pool the libraries and load them onto sequencing lanes to ensure the correct number of reads per sample, an even more precise quantification of the library was done via qPCR, and the samples were loaded onto the NovaSeq 6000 platform for a paired- end sequencing run of 150 bp for each end (PE150). The loading concentrations were designed to obtain at least 6.0 Gb (which is the number of billion bases of raw data, determined by the number of reads multiplied by the length of each read). [00136] Generation of a lookup table. To identify genes that are differentially expressed after treatment with paraquat (PQT) to induce a disease state, the gene counts for the samples treated with PQT were compared against the DMSO only control at the 24 hours post-exposure timepoint. Differentially-expressed genes (DEGs) are defined here as genes whose expression level exceeds 1.25-fold with a p-value of ≤0.05. We identified 109 genes that were differentially regulated between animals exposed to 3 mM PQT and those exposed to only 0.003% DMSO at 24 hours post-exposure. Additional lookup tables were created based on the literature to identify inflammation and mitochondrial function genes. [00137] Differential gene expression analysis. To identify genes that are differentially expressed after pretreatment with a test composition, the gene counts for the samples treated with the high and low concentrations of the test composition were compared against the DMSO + PQT control. Differentially-expressed genes (DEGs) are defined here as genes whose expression level exceeds 1.25-fold with a p-value of ≤0.05. However, there was a continuum of genes above and below these thresholds. See Figure 10
[00138] There were an increased number of DEGs for all Treatment Z concentrations at 24 h post-PQT exposure compared to those at the 2 h timepoint. Within each timepoint, there were more DEGs with increasing concentrations (Table 18). Table 18 DE f hi l l f P T

oxidative stress at a molecular level, we compared DEGs in these comparison groups to the lookup table created from PQT treatment. The PQT lookup table was able to identify genes where expression levels were restored by treatment with Treatment Z or positive control (PC) (Table 19).
Table 19 M
cytochrome P450, family 2, subfamily
[00140] DEGs from Treatment Z and PC treatment groups were also compared to a look up table of inflammation and mitochondrial function genes (Tables 20 and 21). Table 20 Selection of differentially-expressed genes at 2 h post-PQT exposure e 4
Table 21 Selection of differentially-expressed genes at 24 h post-PQT exposure e 0 5 6 7 7 5 7 5 1 8 5 9

[00141] 109 genes were identified that were differentially regulated between animals exposed to 3 mM PQT and those exposed to only 0.003% DMSO at 24 hours post-exposure.
Several interesting genes were identified that had increased expression with PQT treatment but decreased expression with Treatment Z, including key genes in the oxidative stress response. This expression pattern suggests that Treatment Z may modulate the cellular response to oxidative stress induced by PQT, resulting in a change in the transcriptional response of genes involved in this process. [00142] Treatment with PQT significantly affected the expression of several genes with established roles in response to oxidative stress, including glutathione S-transferases (gsto1, gsto2, and gsta.2), glutamate cysteine ligase subunit C (gclc), and oxidative stress induced growth inhibitor 1 (osgn1). Glutathione S-Transferases (GSTs) protect cells from oxidative damage by modifying reactive molecules. Two omega (gsto1 and gsto2) and one alpha (gsta.2) GSTs were upregulated by PQT but down-regulated with Treatment Z pretreatment. Upregulation of GSTs in response to PQT is thought to reflect a cellular attempt to counteract oxidative stress. However, pretreatment with the compound Treatment Z attenuated the upregulation of these GST genes in response to PQT, suggesting that the protective effect of Treatment Z renders the oxidative stress response less necessary. [00143] Similarly, gclc and osgn1 upregulation in response to PQT was attenuated by Treatment Z treatment. GCLC is a subunit of glutamate cysteine ligase, an enzyme involved with the production of cellular antioxidants. In human lymphocytes, GCLC activity increased in response to oxidative stress.
8 The oxidative stress induced growth inhibitor 1 (osgn1) is upregulated in response to oxidative stress and may play a role in the regulation of autophagy in lung cells after smoking-induced stress.
9 The expression changes in these genes may point to some of the mechanisms of the amelioration of the PQT-stress by Treatment Z.
[00144] In conclusion, the treatment with Treatment Z had a broad impact on gene expression, which suggests several hypotheses for the mechanism of action of the observed survival, movement, and morphological effects. Treatment with Treatment Z produced a response of a large number of genes, with high representation among genes involved in inflammatory pathways and the oxidation reduction process. Additionally, we found a transcriptional response to PQT as seen by a change in expression of 109 genes, that was partially reversed by pre-treatment with Treatment Z. Among the 22 genes most significantly changed and that are candidates for
biomarkers of therapeutic efficacy were oxidative stress protective genes of gsto1, gsto2, gsta.2, osgn1, and gclc. Therefore, Treatment Z may have therapeutic potential in reversing disease states associated with oxidative stress and inflammation. [00145] While certain embodiments have been described in terms of the preferred embodiments, it is understood that variations and modifications will occur to those skilled in the art. Therefore, it is intended that the appended claims cover all such equivalent variations that come within the scope of the following claims.


