WO2025006973A2 - Methods for treating immune related adverse events - Google Patents
Methods for treating immune related adverse events Download PDFInfo
- Publication number
- WO2025006973A2 WO2025006973A2 PCT/US2024/036139 US2024036139W WO2025006973A2 WO 2025006973 A2 WO2025006973 A2 WO 2025006973A2 US 2024036139 W US2024036139 W US 2024036139W WO 2025006973 A2 WO2025006973 A2 WO 2025006973A2
- Authority
- WO
- WIPO (PCT)
- Prior art keywords
- biomarker
- measured
- ici
- level
- subject
- Prior art date
- Legal status (The legal status is an assumption and is not a legal conclusion. Google has not performed a legal analysis and makes no representation as to the accuracy of the status listed.)
- Ceased
Links
Classifications
-
- G—PHYSICS
- G01—MEASURING; TESTING
- G01N—INVESTIGATING OR ANALYSING MATERIALS BY DETERMINING THEIR CHEMICAL OR PHYSICAL PROPERTIES
- G01N33/00—Investigating or analysing materials by specific methods not covered by groups G01N1/00 - G01N31/00
- G01N33/48—Biological material, e.g. blood, urine; Haemocytometers
- G01N33/50—Chemical analysis of biological material, e.g. blood, urine; Testing involving biospecific ligand binding methods; Immunological testing
- G01N33/68—Chemical analysis of biological material, e.g. blood, urine; Testing involving biospecific ligand binding methods; Immunological testing involving proteins, peptides or amino acids
- G01N33/6893—Chemical analysis of biological material, e.g. blood, urine; Testing involving biospecific ligand binding methods; Immunological testing involving proteins, peptides or amino acids related to diseases not provided for elsewhere
-
- G—PHYSICS
- G01—MEASURING; TESTING
- G01N—INVESTIGATING OR ANALYSING MATERIALS BY DETERMINING THEIR CHEMICAL OR PHYSICAL PROPERTIES
- G01N2800/00—Detection or diagnosis of diseases
- G01N2800/34—Genitourinary disorders
- G01N2800/347—Renal failures; Glomerular diseases; Tubulointerstitial diseases, e.g. nephritic syndrome, glomerulonephritis; Renovascular diseases, e.g. renal artery occlusion, nephropathy
-
- G—PHYSICS
- G01—MEASURING; TESTING
- G01N—INVESTIGATING OR ANALYSING MATERIALS BY DETERMINING THEIR CHEMICAL OR PHYSICAL PROPERTIES
- G01N2800/00—Detection or diagnosis of diseases
- G01N2800/52—Predicting or monitoring the response to treatment, e.g. for selection of therapy based on assay results in personalised medicine; Prognosis
-
- G—PHYSICS
- G01—MEASURING; TESTING
- G01N—INVESTIGATING OR ANALYSING MATERIALS BY DETERMINING THEIR CHEMICAL OR PHYSICAL PROPERTIES
- G01N2800/00—Detection or diagnosis of diseases
- G01N2800/60—Complex ways of combining multiple protein biomarkers for diagnosis
Definitions
- Immune checkpoint blockade also called immune checkpoint inhibitor (ICI)
- IRB immune checkpoint inhibitor
- T-cell activity can also increase T cell autoreactivity leading to the development of immune-related adverse events (irAEs).
- irAEs immune-related adverse events
- Over 60% of patients treated with immune checkpoint blockade will develop at least one irAE (4, 5). Since the development of irAEs is associated with increased immune activity, studies among more common irAEs, such as dermatitis, colitis and various endocrinopathies, are linked with increased ICI efficacy.
- AIN acute interstitial nephritis
- the current disclosure provides for improved methods of identifying and treating patients with immune checkpoint inhibitor (ICI) therapy toxicity and response and is based on the finding that biomarkers can predict whether a subject experiencing adverse symptoms and undergoing ICI therapy is developing an immune-related adverse event (irAE) due to the ICI therapy or due to a pathology not directly related to the ICI therapy.
- ICI immune checkpoint inhibitor
- the methods include a method for evaluating a subject comprising measuring the level of, of at least or of at most 1, 2, 3, 4, 5, 6, 7, 8, 9, 10, 11, 12, 13 ,14, 15, 16, 17, 18, 19, 20, 21, 22, 23, 24, 25, 26, 27, 28, 29, 30, 31, 32, 33, 34, 35, 36, 37, 38, 39, 40, 41, 42, 43, 44, 45, 46, 47, 48, 49, 50, 51, 52, 53, 54, 55, or 56 biomarkers (or any range derivable therein) in one or more biological sample(s) from the subject, wherein the biomarker(s) are IL5, CD274, TNFSF4, FAS, IL20, TSLP, TNFSF15, CCL1, IL6, TNF, CLEC4A, NCR1, FGF19, IL5RA, MUC16, CCL3, VCAM1, EPO, IFNL1, MMP3, IL9, IL16, IL36A, FLT1, IL18, IL12RB1, KITLG, LTF, CCL18,
- Also described is a method for making an antibody-protein complex comprising contacting a biological sample from a subject with one or more antibodies that bind to 1, 2, 3, 4, 5, 6, 7, 8, 9, 10, 11, 12, 13 ,14, 15, 16, 17, 18, 19, 20, 21, 22, 23, 24, 25, 26, 27, 28, 29, 30, 31, 32, 33, 34, 35, 36, 37, 38, 39, 40, 41, 42, 43, 44, 45, 46, 47, 48, 49, 50, 51, 52, 53, 54, 55, or 56 biomarkers (or any range derivable therein), wherein the one or more biomarker(s) are IL5, CD274, TNFSF4, FAS, IL20, TSLP, TNFSF15, CCL1, IL6, TNF, CLEC4A, NCR1, FGF19, IL5RA, MUC16, CCL3, VCAM1, EPO, IFNL1, MMP3, IL9, IL16, IL36A, FLT1, IL18, IL12RB1, KITLG, LTF, CCL18, LCN
- Methods include treating an immune related adverse event in a subject undergoing ICI therapy, the method comprising administering a non-ICI therapeutic agent to a subject that has had the level of 1, 2, 3, 4, 5, 6, 7, 8, 9, 10, 11, 12, 13 ,14, 15, 16, 17, 18, 19, 20, 21, 22, 23, 24, 25, 26, 27, 28, 29, 30, 31, 32, 33, 34, 35, 36, 37, 38, 39, 40, 41, 42, 43, 44, 45, 46, 47, 48, 49, 50, 51, 52, 53, 54, 55, or 56 biomarkers (or any range derivable therein) measured in one or more biological sample(s) from the subject, wherein the biomarker(s) are one or more of IL5, CD274, TNFSF4, FAS, IL20, TSLP, TNFSF15, CCL1, IL6, TNF, CLEC4A, NCR1, FGF19, IL5RA, MUC16, CCL3, VCAM1, EPO, IFNL1, MMP3, IL9, IL16, IL36A
- Methods also include managing or treating non-ICI induced kidney dysfunction in a subject undergoing ICI therapy, the method comprising administering a non-ICI therapeutic agent to a subject that has had the level of 1, 2, 3, 4, 5, 6, 7, 8, 9, 10, 11, 12, 13 ,14, 15, 16, 17, 18, 19, 20, 21, 22, 23, 24, 25, 26, 27, 28, 29, 30, 31, 32, 33, 34, 35, 36, 37, 38, 39, 40, 41, 42, 43, 44, 45, 46, 47, 48, 49, 50, 51, 52, 53, 54, 55, or 56 biomarkers (or any range derivable therein) measured in one or more biological sample(s) from the subject, wherein the biomarker(s) are one or more of IL5, CD274, TNFSF4, FAS, IL20, TSLP, TNFSF15, CCL1, IL6, TNF, CLEC4A, NCR1, FGF19, IL5RA, MUC16, CCL3, VCAM1, EPO, IFNL1, MMP3, IL9, IL16
- Methods include a method for treating kidney dysfunction in a subject, the method comprising administering an ICI therapy or administering a non-ICI therapeutic agent to a subject that has had the level of 1, 2, 3, 4, 5, 6, 7, 8, 9, 10, 11, 12, 13 ,14, 15, 16, 17, 18, 19, 20, 21, 22, 23, 24, 25, 26, 27, 28, 29, 30, 31, 32, 33, 34, 35, 36, 37, 38, 39, 40, 41, 42, 43, 44, 45, 46, 47, 48, 49, 50, 51, 52, 53, 54, 55, or 56 biomarkers (or any range derivable therein) measured in one or more biological sample(s) from the subject, wherein the biomarker(s) are one or more of IL5, CD274, TNFSF4, FAS, IL20, TSLP, TNFSF15, CCL1, IL6, TNF, CLEC4A, NCR1, FGF19, IL5RA, MUC16, CCL3, VCAM1, EPO, IFNL1, MMP3, IL9, IL16,
- a method for diagnosing or prognosing a subject with kidney dysfunction comprising: a) measuring the level of 1, 2, 3, 4, 5, 6, 7, 8, 9, 10, 11, 12, 13 ,14, 15, 16, 17, 18, 19, 20, 21, 22, 23, 24, 25, 26, 27, 28, 29, 30, 31, 32, 33, 34, 35, 36, 37, 38, 39, 40, 41, 42, 43, 44, 45, 46, 47, 48, 49, 50, 51, 52, 53, 54, 55, or 56 biomarkers (or any range derivable therein) in one or more biological sample(s) from the subject; and b) diagnosing or prognosing the subject with ICI induced kidney dysfunction or non-ICI induced kidney dysfunction based on the measured level of the biomarker(s), wherein the biomarker(s) are one or more of IL5, CD274, TNFSF4, FAS, IL20, TSLP, TNFSF15, CCL1, IL6, TNF, CLEC4A, NCR1, FGF19, IL5RA,
- a method of monitoring a subject that has been administered ICI therapy comprising: a) measuring the level of 1, 2, 3, 4, 5, 6, 7, 8, 9, 10, 11, 12, 13 ,14, 15, 16, 17, 18, 19, 20, 21, 22, 23, 24, 25, 26, 27, 28, 29, 30, 31, 32, 33, 34, 35, 36, 37, 38, 39, 40, 41, 42, 43, 44, 45, 46, 47, 48, 49, 50, 51, 52, 53, 54, 55, or 56 biomarkers (or any range derivable therein) in one or more biological sample(s) from the subject; and b) administering ICI therapy or an additional therapeutic agent that excludes ICI therapy based on the measured level of the one or more biomarkers, wherein the biomarker(s) are one or more of IL5, CD274, TNFSF4, FAS, IL20, TSLP, TNFSF15, CCL1, IL6, TNF, CLEC4A, NCR1, FGF19, IL5RA, MUC16, CCL3, VCAM
- kits comprising agents for detecting one or more biomarker(s), wherein the biomarker(s) are one or more of IL5, CD274, TNFSF4, FAS, IL20, TSLP, TNFSF15, CCL1, IL6, TNF, CLEC4A, NCR1, FGF19, IL5RA, MUC16, CCL3, VCAM1, EPO, IFNL1, MMP3, IL9, IL16, IL36A, FLT1, IL18, IL12RB1, KITLG, LTF, CCL18, LCN2, CXCL13, S100A8, CXCL9, CD79A, CCR7, CXCL1, C3, TREM1, IL7R, CD19, LTB, MS4A1, SAA1, CXCL10, C1QB, TNFRSF17, CTLA4, CXCL6, CD27, CD38, CXCL11, CD163, FCGR3A, ITGAX, CD7, C1QA, RUNX3,
- the biological sample may comprise or exclude urine, serum, plasma, tissue, and/or any other body fluid sample.
- the biological sample may comprise a urine sample.
- the biological sample may comprise a plasma sample.
- the biological sample may comprise a urine and plasma sample.
- the methods may include measuring, evaluating, and/or determining the protein level of the biomarker(s).
- the methods may include measuring, evaluating, and/or determining the mRNA level of the biomarker(s).
- the level of the biomarker(s) may be measured, determined, and/or evaluated using any protein or RNA detection assays that may include or exclude ELISA, NULISA, electromagnetic or electrochemical immunosensor and/or lateral flow or Luminex assay.
- At least the level of IL33 may be measured, and/or a biomarker may comprise at least IL33.
- At least the level of CSF1 may be measured, and/or a biomarker may comprise at least CSF1.
- At least the level of SLURP1 may be measured, and/or a biomarker may comprise at least SLURP1.
- At least the level of LTBR may be measured, and/or a biomarker may comprise at least LTBR.
- At least the level of IL18BP may be measured, and/or a biomarker may comprise at least IL18BP.
- At least the level of VEGFC may be measured, and/or a biomarker may comprise at least VEGFC.
- At least the level of IL13RA2 may be measured, and/or a biomarker may comprise at least IL13RA2.
- At least the level of MDK may be measured, and/or a biomarker may comprise at least MDK.
- At least the level of IL2RA may be measured, and/or a biomarker may comprise at least IL2RA.
- At least the level of TNFRSF11A may be measured, and/or a biomarker may comprise at least TNFRSF11A.
- At least the level of TNFRSF9 may be measured, and/or a biomarker may comprise at least TNFRSF9.
- At least the level of CXADR may be measured, and/or a biomarker may comprise at least CXADR.
- At least the level of IL36G may be measured, and/or a biomarker may comprise at least IL36G.
- At least the level of MMP9 may be measured, and/or a biomarker may comprise at least MMP9.
- At least the level of TNFRSF14 may be measured, and/or a biomarker may comprise at least TNFRSF14.
- At least the level of IL17A may be measured, and/or a biomarker may comprise at least IL17A.
- At least the level of CD40 may be measured, and/or a biomarker may comprise at least CD40.
- At least the level of CX3CL1 may be measured, and/or a biomarker may comprise at least CX3CL1.
- At least the level of TNFRSF1A may be measured, and/or a biomarker may comprise at least TNFRSF1A.
- At least the level of TREM1 may be measured, and/or a biomarker may comprise at least TREM1.
- At least the level of EGF may be measured, and/or a biomarker may comprise at least EGF.
- At least the level of CTF1 may be measured, and/or a biomarker may comprise at least CTF1.
- At least the level of CHI3L1 may be measured, and/or a biomarker may comprise at least CHI3L1.
- At least the level of IL1R1 may be measured, and/or a biomarker may comprise at least IL1R1.
- At least the level of TNFRSF8 may be measured, and/or a biomarker may comprise at least TNFRSF8.
- At least the level of SPP1 may be measured, and/or a biomarker may comprise at least SPP1.
- At least the level of IL15RA may be measured, and/or a biomarker may comprise at least IL15RA.
- At least the level of TNFRSF1B may be measured, and/or a biomarker may comprise at least TNFRSF1B.
- At least the level of TNFRSF18 may be measured, and/or a biomarker may comprise at least TNFRSF18.
- At least the level of IL5 may be measured, and/or a biomarker may comprise at least IL5.
- At least the level of CD274 may be measured, and/or a biomarker may comprise at least CD274.
- At least the level of TNFSF4 may be measured, and/or a biomarker may comprise at least TNFSF4.
- At least the level of FAS may be measured, and/or a biomarker may comprise at least FAS.
- At least the level of IL20 may be measured, and/or a biomarker may comprise at least IL20.
- At least the level of TSLP may be measured, and/or a biomarker may comprise at least TSLP.
- At least the level of TNFSF15 may be measured, and/or a biomarker may comprise at least TNFSF15.
- At least the level of CCL1 may be measured, and/or a biomarker may comprise at least CCL1.
- At least the level of IL6 may be measured, and/or a biomarker may comprise at least IL6.
- At least the level of TNF may be measured, and/or a biomarker may comprise at least TNF.
- At least the level of CLEC4A may be measured, and/or a biomarker may comprise at least CLEC4A.
- At least the level of NCR1 may be measured, and/or a biomarker may comprise at least NCR1.
- At least the level of FGF19 may be measured, and/or a biomarker may comprise at least FGF19.
- At least the level of IL5RA may be measured, and/or a biomarker may comprise at least IL5RA.
- At least the level of MUC16 may be measured, and/or a biomarker may comprise at least MUC16.
- At least the level of CCL3 may be measured, and/or a biomarker may comprise at least CCL3.
- At least the level of VCAM1 may be measured, and/or a biomarker may comprise at least VCAM1.
- At least the level of EPO may be measured, and/or a biomarker may comprise at least EPO.
- At least the level of IFNL1 may be measured, and/or a biomarker may comprise at least IFNL1.
- At least the level of MMP3 may be measured, and/or a biomarker may comprise at least MMP3.
- At least the level of IL9 may be measured, and/or a biomarker may comprise at least IL9.
- At least the level of IL16 may be measured, and/or a biomarker may comprise at least IL16.
- At least the level of IL36A may be measured, and/or a biomarker may comprise at least IL36A.
- At least the level of FLT1 may be measured, and/or a biomarker may comprise at least FLT1.
- At least the level of IL18 may be measured, and/or a biomarker may comprise at least IL18.
- At least the level of IL12RB1 may be measured, and/or a biomarker may comprise at least IL12RB1.
- At least the level of KITLG may be measured, and/or a biomarker may comprise at least KITLG.
- At least the level of LTF may be measured, and/or a biomarker may comprise at least LTF.
- At least the level of CCL18 may be measured, and/or a biomarker may comprise at least CCL18.
- At least the level of LCN2 may be measured, and/or a biomarker may comprise at least LCN2.
- At least the level of CXCL13 may be measured, and/or a biomarker may comprise at least CXCL13.
- At least the level of S100A8 may be measured, and/or a biomarker may comprise at least S100A8.
- At least the level of CXCL9 may be measured, and/or a biomarker may comprise at least CXCL9.
- At least the level of CD79A may be measured, and/or a biomarker may comprise at least CD79A.
- At least the level of CCR7 may be measured, and/or a biomarker may comprise at least CCR7.
- At least the level of CXCL1 may be measured, and/or a biomarker may comprise at least CXCL1.
- At least the level of CTLA4 may be measured, and/or a biomarker may comprise at least CTLA4.
- At least the level of C3 may be measured, and/or a biomarker may comprise at least C3.
- At least the level of TREM1 may be measured, and/or a biomarker may comprise at least TREM1.
- At least the level of IL7R may be measured, and/or a biomarker may comprise at least IL7R.
- At least the level of CD19 may be measured, and/or a biomarker may comprise at least CD19.
- At least the level of LTB may be measured, and/or a biomarker may comprise at least LTB.
- At least the level of MS4A1 may be measured, and/or a biomarker may comprise at least MS4A1.
- At least the level of SAA1 may be measured, and/or a biomarker may comprise at least SAA1.
- At least the level of CXCL10 may be measured, and/or a biomarker may comprise at least CXCL10.
- At least the level of C1QB may be measured, and/or a biomarker may comprise at least C1QB.
- At least the level of TNFRSF17 may be measured, and/or a biomarker may comprise at least TNFRSF17.
- At least the level of CXCL6 may be measured, and/or a biomarker may comprise at least CXCL6.
- At least the level of CD27 may be measured, and/or a biomarker may comprise at least CD27.
- At least the level of CD38 may be measured, and/or a biomarker may comprise at least CD38.
- At least the level of CXCL11 may be measured, and/or a biomarker may comprise at least CXCL11.
- At least the level of CD163 may be measured, and/or a biomarker may comprise at least CD163.
- At least the level of FCGR3A may be measured, and/or a biomarker may comprise at least FCGR3A.
- At least the level of ITGAX may be measured, and/or a biomarker may comprise at least ITGAX.
- At least the level of CD7 may be measured, and/or a biomarker may comprise at least CD7.
- At least the level of C1QA may be measured, and/or a biomarker may comprise at least C1QA.
- At least the level of RUNX3 may be measured, and/or a biomarker may comprise at least RUNX3.
- At least the level of SLAMF7 may be measured, and/or a biomarker may comprise at least SLAMF7.
- At least the level of IRF4 may be measured, and/or a biomarker may comprise at least IRF4.
- At least the level of SELL may be measured, and/or a biomarker may comprise at least SELL.
- At least the level of ZAP70 may be measured, and/or a biomarker may comprise at least ZAP70.
- At least the level of CD48 may be measured, and/or a biomarker may comprise at least CD48.
- At least the level of SIGLEC1 may be measured, and/or a biomarker may comprise at least SIGLEC1.
- At least the level of PDCD1 may be measured, and/or a biomarker may comprise at least PDCD1.
- At least the level of IL2RB may be measured, and/or a biomarker may comprise at least IL2RB.
- At least the level of JAK3 may be measured, and/or a biomarker may comprise at least JAK3.
- At least the level of CTSS may be measured, and/or a biomarker may comprise at least CTSS.
- At least the level of CSF2RB may be measured, and/or a biomarker may comprise at least CSF2RB.
- At least the level of IL2RG may be measured, and/or a biomarker may comprise at least IL2RG.
- At least the level of ISG20 may be measured, and/or a biomarker may comprise at least ISG20.
- At least the level of EBI3 may be measured, and/or a biomarker may comprise at least EBI3.
- At least the level of C2 may be measured, and/or a biomarker may comprise at least C2.
- At least the level of ITGAL may be measured, and/or a biomarker may comprise at least ITGAL.
- At least the level of CCR5 may be measured, and/or a biomarker may comprise at least CCR5.
- At least the level of IDO1 may be measured, and/or a biomarker may comprise at least IDO1.
- At least the level of LCP1 may be measured, and/or a biomarker may comprise at least LCP1.
- At least the level of CD5 may be measured, and/or a biomarker may comprise at least CD5.
- At least the level of CD6 may be measured, and/or a biomarker may comprise at least CD6.
- At least the level of SH2D1A may be measured, and/or a biomarker may comprise at least SH2D1A.
- At least the level of CYBB may be measured, and/or a biomarker may comprise at least CYBB.
- At least the level of CCL5 may be measured, and/or a biomarker may comprise at least CCL5.
- At least the level of IL10RA8 may be measured, and/or a biomarker may comprise at least IL10RA8.
- At least the levels of IL5 and FAS may be measured, and/or biomarkers may comprise at least or consist of IL5 and FAS.
- At least the levels of IL36A and TNFRSF8 may be measured, and/or biomarkers may comprise at least or consist of IL36A and TNFRSF8.
- At least the levels of IL5 and CXCL9 are measured and/or the biomarker(s) may comprise at least or consist of IL5 and CXCL9.
- At least the levels of FAS and TNFSF15 are measured and/or the biomarker(s) may comprise at least or consist of FAS and TNFSF15.
- At least the levels of FAS and TNFSF4 are measured and/or the biomarker(s) may comprise at least or consist of FAS and TNFSF4.
- At least the levels of FAS and IL20 are measured and/or the biomarker(s) may comprise at least or consist of FAS and IL20.
- At least the levels of FAS and TNF are measured and/or the biomarker(s) may comprise at least or consist of FAS and TNF.
- At least the levels of FAS and TSLP are measured and/or the biomarker(s) may comprise at least or consist of FAS and TSLP.
- At least the levels of IL5 and TSLP are measured and/or the biomarker(s) may comprise at least or consist of IL5 and TSLP. At least the levels of IL5 and CCL1 are measured and/or the biomarker(s) may comprise at least or consist of IL5 and CCL1. At least the levels of FAS and CCL1 are measured and/or the biomarker(s) may comprise at least or consist of FAS and CCL1. At least the levels of TNFSF4 and CXCL9 are measured and/or the biomarker(s) may comprise at least or consist of TNFSF4 and CXCL9.
- At least the levels of IL5 and IL20 are measured and/or the biomarker(s) may comprise at least or consist of IL5 and IL20. At least the levels of IL5 and TNFSF15 are measured and/or the biomarker(s) may comprise at least or consist of IL5 and TNFSF15. At least the levels of IL5 and TNF are measured and/or the biomarker(s) may comprise at least or consist of IL5 and TNF. At least the levels of IL5 and TNFSF4 are measured and/or the biomarker(s) may comprise at least or consist of IL5 and TNFSF4.
- At least the levels of IL5 and IL9 are measured and/or the biomarker(s) may comprise at least or consist of IL5 and IL9. At least the levels of FAS and CXCL9 are measured and/or the biomarker(s) may comprise at least or consist of FAS and CXCL9. At least the levels of CXCL9 and IL20 are measured and/or the biomarker(s) may comprise at least or consist of CXCL9 and IL20. At least the levels of FAS and IL9 are measured and/or the biomarker(s) may comprise at least or consist of FAS and IL9.
- At least the levels of CXCL9 and TNFSF15 are measured and/or the biomarker(s) may comprise at least or consist of CXCL9 and TNFSF15. At least the levels of TNF and TNFSF4 are measured and/or the biomarker(s) may comprise at least or consist of TNF and TNFSF4. At least the levels of wherein CXCL9 and CCL1 are measured and/or the biomarker(s) may comprise at least or consist of CXCL9 and CCL1. At least the levels of wherein TNFSF4 and TSLP are measured and/or the biomarker(s) may comprise at least or consist of TNFSF4 and TSLP.
- At least the levels of TNF and TNFSF15 are measured and/or the biomarker(s) may comprise at least or consist of TNF and TNFSF15. At least the levels of IL20 and CCL1 are measured and/or the biomarker(s) may comprise at least or consist of IL20 and CCL1. At least the levels of wherein TNF and IL20 are measured and/or the biomarker(s) may comprise at least or consist of TNF and IL20. At least the levels of wherein IL20 and TNFSF15 are measured and/or the biomarker(s) may comprise at least or consist of IL20 and TNFSF15.
- At least the levels of TNFSF4 and IL20 are measured and/or the biomarker(s) may comprise at least or consist of TNFSF4 and IL20. At least the levels of TNFSF4 and CCL1 are measured and/or the biomarker(s) may comprise at least or consist of TNFSF4 and CCL1. At least the levels of TNF and CXCL9 are measured and/or the biomarker(s) may comprise at least or consist of TNF and CXCL9. At least the levels of CXCL9 and TSLP are measured and/or the biomarker(s) may comprise at least or consist of CXCL9 and TSLP.
- At least the levels of IL20 and IL9 are measured and/or the biomarker(s) may comprise at least or consist of IL20 and IL9. At least the levels of TNFSF4 and TNFSF15 are measured and/or the biomarker(s) may comprise at least or consist of TNFSF4 and TNFSF15. At least the levels of CXCL9 and IL9 are measured and/or the biomarker(s) may comprise at least or consist of CXCL9 and IL9. At least the levels of TNFSF4 and IL9 are measured and/or the biomarker(s) may comprise at least or consist of TNFSF4 and IL9.
- At least the levels of IL20 and TSLP are measured and/or the biomarker(s) may comprise at least or consist of IL20 and TSLP. At least the levels of TNFSF15 and CCL1 are measured and/or the biomarker(s) may comprise at least or consist of TNFSF15 and CCL1. At least the levels of TNFSF15 and TSLP are measured and/or the biomarker(s) may comprise at least or consist of TNFSF15 and TSLP. At least the levels of TNFSF15 and IL9 are measured and/or the biomarker(s) may comprise at least or consist of TNFSF15 and IL9.
- At least the levels of TNF and TSLP are measured and/or the biomarker(s) may comprise at least or consist of TNF and TSLP.
- At least the levels of TNF and CCL1 are measured and/or the biomarker(s) may comprise at least or consist of TNF and CCL1.
- At least the levels of TNF and IL9 are measured and/or the biomarker(s) may comprise at least or consist of TNF and IL9.
- At least the levels of TSLP and CCL1 are measured and/or the biomarker(s) may comprise at least or consist of TSLP and CCL1.
- At least the levels of TSLP and IL9 are measured and/or the biomarker(s) may comprise at least or consist of TSLP and IL9.
- At least the levels of CCL1 and IL9 are measured and/or the biomarker(s) may comprise at least or consist of CCL1 and IL9. At least the levels of CCL1 and IL27 are measured and/or the biomarker(s) may comprise at least or consist of CCL1 and IL27. At least the levels of TNFRSF8 and TNFSF11 are measured and/or the biomarker(s) may comprise at least or consist of TNFRSF8 and TNFSF11. At least the levels of TNFSF11 and IL36A are measured and/or the biomarker(s) may comprise at least or consist of TNFSF11 and IL36A.
- At least the levels of FAS and IL36A may be measured, and/or biomarkers may comprise at least or consist of FAS and IL36A. At least the levels of FAS may be measured from a urine sample, and/or a urine biomarker may comprise FAS. At least the levels of IL36A may be measured from a plasma sample, and/or a plasma biomarker may comprise IL36A. At least the levels of FAS may be measured from a urine sample and the levels of IL36A may be measured from a plasma sample, and/or a urine biomarker may comprise FAS and a plasma biomarker may comprise IL36A.
- At least the levels of CXCL9 and TNFRSF8 are measured and/or biomarkers may comprise at least or consist of CXCL9 and TNFRSF8. At least the levels of CXCL9 may be measured from a urine sample, and/or a urine biomarker may comprise FAS. At least the levels of TNFRSF8 may be measured from a plasma sample, and/or a plasma biomarker may comprise TNFRSF8. At least the levels of IL5 and IL36A may be measured, and/or biomarkers may comprise at least or consist of IL5 and IL36A. At least the levels of IL5 may be measured from a urine sample, and/or a urine biomarker may comprise IL5.
- At least the levels of IL5 may be measured from a urine sample and the levels of IL36A may be measured from a plasma sample, and/or a urine biomarker may comprise IL5 and a plasma biomarker may comprise IL36A.
- At least the levels of CXCL9 and IL36A may be measured, and/or biomarkers may comprise at least or consist of CXCL9 and IL36A.
- At least the levels of CXCL9 may be measured from a urine sample, and/or a urine biomarker may comprise CXCL9.
- At least the levels of CXCL9 may be measured from a urine sample and the levels of IL36A may be measured from a plasma sample, and/or a urine biomarker may comprise CXCL9 and a plasma biomarker may comprise IL36A.
- At least the levels of FAS and TNFRSF8 may be measured, and/or biomarkers may comprise at least or consist of FAS and TNFRSF8.
- At least the levels of FAS may be measured from a urine sample and the levels of TNFRSF8 may be measured from a plasma sample, and/or a urine biomarker may comprise FAS and a plasma biomarker may comprise TNFRSF8.
- the biomarker may consist of one of IL5, CD274, TNFSF4, FAS, IL20, TSLP, TNFSF15, CCL1, IL6, TNF, CLEC4A, NCR1, FGF19, IL5RA, MUC16, CCL3, VCAM1, EPO, IFNL1, MMP3, IL9, IL16, IL36A, FLT1, IL18, IL12RB1, KITLG, LTF, CCL18, LCN2, CXCL13, S100A8, CXCL9, CD79A, CCR7, CXCL1, C3, TREM1, IL7R, CD19, LTB, MS4A1, SAA1, CXCL10, C1QB, TNFRSF17, CTLA4, CXCL6, CD27, CD38, CXCL11, CD163, FCGR3A, ITGAX, CD7, C1QA, RUNX3, SLAMF7, IRF4, SELL, ZAP70, CD48, SIGLEC1, PDCD
- the biomarker(s) may comprise or consist of 1, 2, 3, 4, 5, 6, 7, 8, 9, 10, 11, 12, 13 ,14, 15, 16, 17, 18, 19, 20, 21, 22, 23, 24, 25, 26, 27, 28, 29, 30, 31, 32, 33, 34, 35, 36, 37, 38, 39, 40, 41, 42, 43, 44, 45, 46, 47, 48, 49, 50, 51, 52, 53, 54, 55, or 56 of IL5, CD274, TNFSF4, FAS, IL20, TSLP, TNFSF15, CCL1, IL6, TNF, CLEC4A, NCR1, FGF19, IL5RA, MUC16, CCL3, VCAM1, EPO, IFNL1, MMP3, IL9, IL16, IL36A, FLT1, IL18, IL12RB1, KITLG, LTF, CCL18, LCN2, CXCL13, S100A8, CXCL9, CD79A, CCR7, CXCL1, C3, TREM1, IL7R, CD19, LTB, MS4A1,
- the one or more biological sample(s) may be from a subject who has been administered immune checkpoint inhibitor (ICI) therapy.
- the one or more biological sample(s) may be from a subject who has been administered at least one dose of ICI therapy.
- the subject may have been administered or administered at least 1, 2, 3, 4, 5, or 6 doses of ICI therapy within a time period of at least or at most 1, 2, 3, 4, 5, 6, 7 days or 1, 2, 3, 4, 5, 6, 7, 8, 9, 10, 11, 12 weeks or 1, 2, 3, 4, 5, 6, 7, 8, 9, 10, 11, 12, 13, 14, 15, 16, 17, 18, 19, 20, 21, 22, 23, 24, 25, 26, 27, 28, 29, or 30 months, or any derivable range therein.
- the ICI therapy may comprise a monotherapy or a combination ICI therapy.
- the ICI therapy may comprise an inhibitor of PD-1, PDL1, PDL2, CTLA-4, B7-1, B7-2, LAG3, and/or TIGIT.
- the ICI therapy may comprise an anti-PD-1 monoclonal antibody and/or an anti-CTLA-4 monoclonal antibody.
- the ICI therapy may comprise one or more of nivolumab, atezolizumab, avelumab, durvalumab, cemiplimab, pembrolizumab, pidilizumab, ipilimumab, tremelimumab, relatimab, opdualag, tebotelimab, bootszelimab, eftilagimod, ieramilimab, fianlimab, tiragolumab, vibostolimab, domvanalimab and/or etigilimab.
- the ICI therapy may exclude a monotherapy, combination ICI therapy, and/or an inhibitor of PD-1, PDL1, PDL2, CTLA-4, B7-1, B7-2, LAG3, and/or TIGIT.
- the ICI therapy may exclude an anti-PD-1 monoclonal antibody and/or an anti-CTLA- 4 monoclonal antibody.
- the ICI therapy may exclude one or more of nivolumab, atezolizumab, avelumab, durvalumab, cemiplimab, pembrolizumab, pidilizumab, ipilimumab, tremelimumab, relatimab, opdualag, tebotelimab, bootszelimab, eftilagimod, ieramilimab, fianlimab, tiragolumab, vibostolimab, domvanalimab and/or etigilimab.
- the one or more biological sample(s) may be from a subject with an immune-related adverse event (irAE).
- the one or more biological sample(s) may be from a subject that is suspected to have an irAE.
- the irAE may comprise acute interstitial nephritis (AIN) or another inflammatory lesion.
- the one or more biological sample(s) may be from a subject that has symptoms of kidney dysfunction.
- the one or more biological sample(s) may be from a subject that does not have symptoms of kidney dysfunction. Symptoms include, for example, hematuria, proteinuria, pyuria, hypertension, edema, oliguria, reduced kidney function, pulmonary edema, and/or heart failure.
- the biological sample may be from a subject that has cancer. Kidney dysfunction may include acute kidney injury.
- the subject may be one that has been determined to have an increase in serum creatinine.
- the subject may be one that has been determined to have a ⁇ 1.5-fold increase in serum creatinine.
- the subject may be one that has been determined to have greater than and/or equal increase in serum creatinine of or of at least 0.5, 1, 1.5, 2, 2.5, or 3-fold compared to the normal level.
- the biomarker may be further defined as a biomarker for AIN vs. non-AIN with an area under the curve (AUC) value of greater than 0.5.
- the biomarker may be further defined as a biomarker for AIN vs. non-AIN with an AUC value of greater than 0.85.
- the biomarker may be further defined as a biomarker for AIN vs.
- the biomarker may be defined as a biomarker for AIN vs. non-AIN with an area under the curve (AUC) value of or of greater than 0.5, 0.51, 0.52, 0.53, 0.54, 0.55, 0.56, 0.57, 0.58, 0.59, 0.6, 0.61, 0.62, 0.63, 0.64, 0.65, 0.66, 0.67, 0.68, 0.69, 0.7, 0.71, 0.72, 0.73, 0.74, 0.75, 0.76, 0.77, 0.78, 0.79, 0.8, 0.81, 0.82, 0.83, 0.84, 0.85, 0.86, 0.87, 0.88, 0.89, 0.9, 0.91, 0.92, 0.93, 0.94, 0.95, 0.96, 0.97, 0.98, 0.99, or any derivable range therein.
- AUC area under the curve
- the methods may comprise measuring, evaluating, and/or determining the level of at least 5 biomarkers described herein.
- the method may comprise measuring, evaluating, and/or determining the level of, of at least, or of at most 1, 2, 3, 4, 5, 6, 7, 8, 9, 10, 11, 12, 13, 14, 15, 16, 17, 18, 19, 20, 21, 22, 23, 24, 25, 26, 27, 28, 29, 30, 31, 32, 33, 34, 35, 36, 37, 38, 39, 40, 41, 42, 43, 44, 45, 46, 47, 48, 49, 50, 51, 52, 53, 54, 55, 56, or 57 biomarkers, or any range derivable therein.
- Measuring the biomarker may comprise measuring or determining the concentration of the protein or nucleic acid of the biomarker in a biological sample.
- the methods may comprise or further comprise comparing the measured, evaluated, and/or determined level of the biomarker(s) to a control.
- the level of the biomarker(s) may be determined to be increased relative to a control.
- the level of the biomarker(s) may be determined to be decreased relative to a control.
- the level of the biomarker(s) may be determined to be the same or not significantly different than a control.
- the control may comprise the level of the biomarker(s) in a biological sample from a subject determined to have non-ICI induced kidney dysfunction, a biological sample from a subject determined to not have kidney dysfunction, or a biological sample from a subject that has been administered ICI therapy and has been determined to have non-ICI induced kidney dysfunction.
- the control may comprise the level of the biomarker(s) in a biological sample from a subject determined to have ICI induced kidney dysfunction, a biological sample from a subject determined to have kidney dysfunction, or a biological sample from a subject that has been administered ICI therapy and has been determined to have ICI induced kidney dysfunction.
- the control may comprise a biological sample from a subject that is on ICI therapy.
- the control may comprise the level of biomarker in a biological sample from a subject previously treated for ICI induced kidney dysfunction.
- the methods may comprise or further comprise measuring the level of a control gene or protein.
- the control may be a protein level normalized by level of urine creatinine.
- the measured level of the biomarker may be a normalized level of the control gene or protein.
- the measured level of a biomarker may be divided by the level of a control to achieve normalization.
- the methods may comprise or further comprise diagnosing the subject based on the evaluated, measured, and/or determined level of the biomarker(s).
- the subject may be one that has been diagnosed with ICI induced AIN.
- the subject may be one that has been diagnosed with ICI induced AIN based on the measured level of the biomarkers.
- the methods may comprise or further comprise or exclude administration of an additional therapeutic agent.
- the additional therapeutic agent may comprise or exclude a steroid, a TNF-alpha inhibitor, glucocorticoid therapy, an IFN-gamma inhibitor, an IL-6 inhibitor, mycophenolate mofetil, cyclosporine, cyclophosphamide, Rituximab, JAK inhibitor, STAT inhibitor, and combinations thereof.
- the steroid may be a corticosteroid.
- Corticosteroids include cortisone, hydrocortisone, methylprednisolone, and prednisone.
- the TNF-alpha inhibitor may comprise or exclude infliximab or an anti-TNF-alpha antibody.
- the method may comprise or further comprise or exclude discontinuing a prescribed ICI administration after the level of the biomarker(s) has been measured, determined, or evaluated.
- the subject may be diagnosed with non-ICI kidney dysfunction based on the measured, determined, or evaluated level of the biomarker(s).
- the method may comprise or further comprise or exclude administering ICI therapy after the subject has been diagnosed with non-ICI kidney dysfunction.
- the method may comprise a subject restarting ICI therapy after previous discontinuation.
- the methods and kits of the disclosure may exclude evaluating, determining, measuring, or reagents for evaluating, measuring, or determining one or more of IL5, CD274, TNFSF4, FAS, IL20, TSLP, TNFSF15, CCL1, IL6, TNF, CLEC4A, NCR1, FGF19, IL5RA, MUC16, CCL3, VCAM1, EPO, IFNL1, MMP3, IL9, IL16, IL36A, FLT1, IL18, IL12RB1, KITLG, LTF, CCL18, LCN2, CXCL13, S100A8, CXCL9, CD79A, CCR7, CXCL1, C3, TREM1, IL7R, CD19, LTB, MS4A1, SAA1, CXCL10, C1QB, TNFRSF17, CTLA4, CXCL6, CD27, CD38, CXCL11, CD163, FCGR3A, ITGAX, CD7, C1QA, RUNX
- the subject may be diagnosed based on the measured level(s) of biomarker(s).
- the subject may be diagnosed with ICI induced kidney dysfunction when the level of the biomarker(s) is determined to be increased relative to a control.
- ICI induced kidney dysfunction may include ICI-AIN or an inflammatory kidney lesion.
- the subject may be diagnosed non- ICI kidney dysfunction.
- Non-ICI kidney dysfunction may comprise acute tubular necrosis, acute tubular injury, normal kidney, diabetic kidney disease, and/or hypertensive nephrosclerosis.
- the methods may comprise or further comprise administering ICI therapy after the subject has been diagnosed with non-ICI kidney dysfunction.
- the kits of the disclosure may comprise one or more negative or positive controls.
- kits may comprise antibodies and or reagents that allow detection of one or more biomarker(s). Kits may also include reagents for collecting one or more biological sample(s). Kits may include instructions for use.
- subject and “patient” may be used interchangeably and may refer to a human subject.
- the subject may be defined as a mammalian subject.
- the subject may also be a mouse, rat, pig, horse, non-human primate, cat, dog, cow, and the like.
- the subject may be a human subject.
- x, y, and/or z can refer to “x” alone, “y” alone, “z” alone, “x, y, and z,” “(x and y) or z,” “x or (y and z),” or “x or y or z.” It is specifically contemplated that x, y, or z may be specifically excluded from an embodiment or aspect.
- compositions and methods for their use can “comprise,” “consist essentially of,” or “consist of” any of the ingredients or steps disclosed throughout the specification.
- FIG. 3A-3B Identification of differentially expressed genes and relative abundance of immune cells in kidney injury.
- FIG. 3A Volcano plots for differentially expressed genes between AIN vs ATN and AIN vs HTN. Each dot represents a single gene, x-axis shows log2 fold change and y-axis shows log 10 change in statistical significance (p-adj value). Genes upregulated (log 2-fold or 4-fold linear) in AIN group are highlighted.
- FIG. 3B Expression of specific gene signature was used to determine immune cell score for infiltrating T cells, B cells, macrophages, neutrophils, dendritic cells and NK cells in different groups. Data represents cell score (log2 fold change) geometric mean ⁇ SEM for different groups. P value represents statistical analysis by Tukey’s multiple comparison test, *p ⁇ 0.05, **p ⁇ 0.01, ***p ⁇ 0.0005, **** p ⁇ 0.0001, (adj p value). [0039] FIG.4A-4E.
- T helper subsets Th1, Th2 and Th17(FIG. 4A) Treg (FIG.4B) and cytotoxic T cells (FIG.4C) score was determined and compared between three groups. Data represents cell score (log2 fold change) geometric mean ⁇ SEM for different groups. The p values were determined using Tukey’s multiple comparisons test *p ⁇ 0.05, **p ⁇ 0.01, ***p ⁇ 0.0005, **** p ⁇ 0.0001 (adj p value).
- FIG.5A-5E Transcriptional and histopathological analysis of TLS in kidney biopsy of AIN, ATN, and HTN.
- FIG. 5A Transcriptional and histopathological analysis of TLS in kidney biopsy of AIN, ATN, and HTN.
- FIG. 5B Gene scores for CXCL13, CCL19, CCL21 compared among AIN, ATN, and HTN groups. Data represents geometric mean (log 2-fold change) ⁇ SEM and p value were determined using Tukey’s multiple comparisons test, *p ⁇ 0.05, **p ⁇ 0.01, ***p ⁇ 0.0005, ****p ⁇ 0.0001 (adj p value).
- FIG.5C Representative H&E staining of kidney biopsy showing organized lymphocyte aggregates with CD20+ B cells adjacent to a CD3+ T cell zone (scale bar 100um).
- FIG.5D Representative H&E staining of kidney biopsy showing organized lymphocyte aggregates with CD20+ B cells adjacent to a CD3+ T cell zone
- FIG. 5E Heatmap of supervised clustering of differentially expressed genes for 12 chemokines, immune cells types, and B cell activation and differentiation in AIN group is shown.
- FIG. 6A-6C TLS detection based on chemokines present in urine and plasma of patients with ICI-AIN, ATN, or HTN. Chemokines associated with TLS gene signature were measured in urine and plasma using Luminex based multiplex chemokine assay.
- FIG. 6A TLS detection based on chemokines present in urine and plasma of patients with ICI-AIN, ATN, or HTN. Chemokines associated with TLS gene signature were measured in urine and plasma using Luminex based multiplex chemokine assay.
- FIG. 6A TLS detection based on chemokines present in urine and plasma of patients with ICI-AIN, ATN, or HTN. Chemokines associated with TLS gene signature were measured in urine and plasma using Luminex based multiplex chemokine assay.
- Urine chemokine levels were adjusted for urine creatinine levels and the urine chemokine to urine creatinine ratio (UCCR) was log 2 transformed. Urine TLS score was determined as the arthrimetic mean of the 12 UCCR. Plasma TLS scores were assessed for each of the 12 chemokines. Data represents protein concentration (log2 fold change) arthrimetic mean ⁇ SEM for different groups. The p values were determined using Tukey’s multiple comparisons test, *p ⁇ 0.05 (adj p value).
- FIG.6B Correlation between tissue TLS signature score and urine TLS signature score and tissue TLS signature score and plasma TLS signature score.
- FIG. 6C Correlation between gene expression in tissue and cytokine in urine for CXCL9 and CXCL10.
- FIG.7A-7B Identification of differentially expressed immune genes between ATN and HTN groups.
- FIG.7A Volcano plot for differentially expressed genes between ATN and HTN. Each dot represents a single gene, x-axis shows log2 fold change and y-axis shows log 10 change in statistical significance (p-adj value). Brown dots represent genes upregulated or downregulated in ATN group compared to HTN group.
- FIG. 7B shows
- FIG.8A-8B Top 10 differentially expressed genes between ATN vs HTN are listed along with the log2 fold change in expression and statistical significance.
- FIG. 9. LTB and IL7R as diagnostic markers for distinguishing ATN, AIN, and controls in tissue samples.
- FIG.10. CXCL9 as diagnostic marker for distinguishing non-AIN and AIN in urine samples.
- FIG. 11 Schematic of the NULISA workflow.
- FIG. 12 Volcano plot of urine proteins identified by NULISAseq in ICI-AIN vs non-AIN cases.
- Urine proteomic analysis applying NULISAseq was conducted on 25 ICI-AIN and 30 non-AIN cases (non-AIN cases include patients with biopsy proven ATN and HTN). Differential expression analysis on urine samples is shown. p-values were computed using Wilcoxon tests and corrected for multiple comparisons using the False Discovery Rate (FDR).
- FDR False Discovery Rate
- FIG.13 Boxplots of selected top protein targets show candidates that separate AIN from non-AIN. *p ⁇ 0.05, **p ⁇ 0.01, ***p ⁇ 0.0005, **** p ⁇ 0.0001.
- FIG.14 Heatmap of inflammatory protein targets. Criteria AUC > 0.75.
- FIG. 15. ROC curves for IL5, FAS, CXCL9, and an AIN Signature constructed using logistic regression which features IL5 and FAS with an AUC 0.941.
- FIG. 16 Role of Protein Targets (in urine) for AKI Patient Management on ICI Therapy: protein targets optimize patient management and treatment, enabling ICI therapy re- challenge in patients with cancer with continued immune monitoring.
- FIG. 17. Number of detectable proteins with p-adj ⁇ 0.05 in urine (73 markers), plasma (36 markers), and their intersection (14 markers). Five overlapping markers had AUC > 0.75 and p-adj ⁇ 0.05.
- FIG. 18A-18B Heatmaps (FIG. 18A) and PCA plot (FIG. 18B) showed that samples cluster strongly by tissue of origin.
- FIG. 19 Heatmaps (FIG. 18A) and PCA plot (FIG. 18B) showed that samples cluster strongly by tissue of origin.
- FIG. 22A-22B Heatmap (FIG. 22A) and PCA plot (FIG. 22B) for urine samples showed strong separation between AIN and non-AIN.
- FIG.23A-23C Results from logistics regression models used to create a urine ICI- AIN signature.
- FIG.23A shows results from a bootstrap logistic regression analysis in which IL5 and FAS were selected in greater than 80% of models.
- FIG. 23B shows results from forward stepwise selection, including IL5, FAS, and IL34.
- Figure 23C shows a classification and regression tree (CART) with partition rules for FAS and IL5.
- FIG. 24A-24B ROC (FIG.
- FIG. 24A results from logistics regression models used to create a plasma immune activation/irAE signature.
- FIG.25A shows results from a bootstrap logistic regression analysis; top markers included IL36A, SPP1, TNFRSF8, and CCL1.
- FIG. 25B shows results from forward stepwise selection, including TNFRSF8, TNFSF11, and IL36A.
- FIG.26A-26B Plasma immune activation/irAE Signature.
- FIG.26A shows a ROC plot of ICI-AIN signatures using IL36A, TNFRSF8, CXCL9, or IL36A+TNFRSF8.
- ICI-AIN Signature using IL36A and TNFRSF8 obtained an AUC value of 0.914.
- FIG. 26B shows a scatterplot of TNFRSF8 versus IL36A showing separation of ICI-AIN and non-AIN groups.
- FIG.27A-27C Results from logistics regression models used to create a plasma + urine ICI-AIN signature.
- FIG.27A shows results from a bootstrap logistic regression analysis; top markers include IL5_Urine, and IL36A_plasma.
- FIG. 27B shows results from forward stepwise selection, including IL5_Urine, CXCL9_Urine, and CEACAM5_Urine.
- Figure 27C shows a CART with partition rules for FAS_urine and IL36A_plasma.
- FIG. 28A-28B Urine+Plasma AIN Signature.
- FIG. 28A shows a ROC plot of an AIN Signature using FAS urine, IL36A plasma, IL5 urine, CXCL9 urine, or FAS urine+IL36 plasma.
- FIG.28B shows a scatterplot of FAS urine versus IL36A plasma showing a line (estimated with logistic regression) separating AIN and non-AIN groups.
- FIG.30 shows that illustrates the False Discovery Rate
- FIG.31A-31B ROC (FIG.31A) and ROC (FIG.31B) of urine ICI-AIN signature using expression of IL5, FAS, CXCL9, or IL5+CXCL9.
- Urine ICI-AIN Signature using IL5 and CXCL9 expression obtained an AUC of 0.934, higher than FAS, IL5, or CXCL9 alone.
- Urine ICI-AIN Signature using FAS and CXCL9 expression obtained an AUC of 0.886.
- FIG. 32A-32B Urine+Plasma AIN Signature.
- FIG. 32A-32B Urine+Plasma AIN Signature.
- FIG. 32A shows a ROC plot of an AIN Signature using FAS urine, IL36A plasma, IL5 urine, CXCL9 urine, or IL5 urine+IL36 plasma.
- AIN Signature using IL5 urine and IL36A plasma expression obtained an AUC value of 0.96, higher than FAS urine, IL5 urine, IL36A plasma, or CXCL9 urine alone.
- FIG. 32B shows a scatterplot of IL5 urine versus IL36A plasma showing a line (estimated with logistic regression) separating AIN and non-AIN groups.
- the methods are for treating a cancer with ICI therapy, for monitoring a subject being treated with ICI therapy, for treating an irAE, and/or for treating ICI induced AIN.
- the cancer may include, but are not limited to, cancers and tumors of all types, locations, sizes, and characteristics.
- compositions of the disclosure are suitable for treating, for example, pancreatic cancer, colon cancer, acute myeloid leukemia, adrenocortical carcinoma, AIDS-related cancers, AIDS-related lymphoma, anal cancer, appendix cancer, astrocytoma, childhood cerebellar or cerebral basal cell carcinoma, bile duct cancer, extrahepatic bladder cancer, bone cancer, colorectal cancer, osteosarcoma/malignant fibrous histiocytoma, brainstem glioma, brain tumor, cerebellar astrocytoma brain tumor, cerebral astrocytoma/malignant glioma brain tumor, ependymoma brain tumor, glioma, glioblastoma multiforme, medulloblastoma brain tumor, supratentorial primitive neuroectodermal tumors brain tumor, visual pathway and hypothalamic glioma, breast cancer, lymphoid cancer, bronchial adenomas/
- the cancer is aggressive cancer.
- the cancer is Stage I cancer.
- the cancer is Stage II cancer (e.g., IIA, IIB, IIC).
- the cancer is Stage III cancer (e.g., IIIA, IIIB, IIIC). In some aspects, the cancer is Stage IV cancer (e.g., IVA, IVB).
- Methods may involve the determination, administration, or selection of an appropriate cancer “management regimen” and predicting the outcome of the same.
- management regimen refers to a management plan that specifies the type of examination, screening, diagnosis, surveillance, care, and treatment (such as dosage, schedule and/or duration of a treatment) provided to a subject in need thereof (e.g., a subject diagnosed with cancer).
- Methods may involve the determination, administration, and/or selection of an appropriate irAE management regimen and predicting the outcome of the same.
- the phrase “irAE management regimen” refers to a management plan that specifies the type of examination, screening, diagnosis, surveillance, care, and/or treatment (such as dosage, schedule and/or duration of a treatment) provided to a subject in need thereof (e.g., a subject diagnosed with cancer).
- a subject in need thereof e.g., a subject diagnosed with cancer.
- the biomarker-based method may be combined with one or more other cancer diagnosis or screening tests at increased frequency if the patient is determined to be at high risk for recurrence or have a poor prognosis based on the biomarker as described above.
- the methods of the disclosure further include one or more monitoring tests.
- the monitoring protocol may include any methods known in the art.
- the monitoring includes obtaining one or more sample(s) and testing the sample(s) for diagnosis.
- the monitoring may include endoscopy, biopsy, laparoscopy, colonoscopy, blood test, plasma test, serum test, urine tests, fluid aspiration or drainage, genetic testing, endoscopic ultrasound, X-ray, barium enema x-ray, chest x-ray, barium swallow, a CT scan, a MRI, a PET scan, ultrasound, nuclear medicine (NM) scan, or PET/CT scan.
- the monitoring test comprises radiographic imaging.
- ROC analysis is a graphical plot that illustrates the performance of a binary classifier system as its discrimination threshold is varied. ROC analysis may be applied to determine a cut-off value or threshold setting of biomarker expression. For example, patients with one or more biological sample(s) determined to have biomarker expression value(s) above a certain cut-off threshold but below a higher cut- off threshold may be determined to have ICI-acute interstitial nephritis.
- Patients with one or more biological sample(s) determined to have one or more biomarker expression level(s) that surpasses the cut-off threshold for AIN may be determined to have an immune related adverse event and/or acute interstitial nephritis.
- the curve is created by plotting the true positive rate against the false positive rate at various threshold settings.
- the true-positive rate is also known as sensitivity in biomedical informatics, or recall in machine learning.
- the false-positive rate is also known as the fall-out and can be calculated as 1 - specificity).
- the ROC curve is thus the sensitivity as a function of fall-out.
- the ROC curve can be generated by plotting the cumulative distribution function (area under the probability distribution from –infinity to + infinity) of the detection probability in the y-axis versus the cumulative distribution function of the false-alarm probability in x-axis.
- ROC analysis provides tools to select possibly optimal models and to discard suboptimal ones independently from (and prior to specifying) the cost context or the class distribution. ROC analysis is related in a direct and natural way to cost/benefit analysis of diagnostic decision making.
- the ROC curve was first developed by electrical engineers and radar engineers during World War II for detecting enemy objects in battlefields and was soon introduced to psychology to account for perceptual detection of stimuli.
- ROC analysis since then has been used in medicine, radiology, biometrics, and other areas for many decades and is increasingly used in machine learning and data mining research.
- the ROC is also known as a relative operating characteristic curve, because it is a comparison of two operating characteristics (TPR and FPR) as the criterion changes.
- ROC analysis curves are known in the art and described in Metz CE (1978) Basic principles of ROC analysis. Seminars in Nuclear Medicine 8:283-298; Youden WJ (1950) An index for rating diagnostic tests. Cancer 3:32-35; Zweig MH, Campbell G (1993) Receiver-operating characteristic (ROC) plots: a fundamental evaluation tool in clinical medicine.
- Methods of the disclosure relate to treating subjects and patients with a cancer therapy and/or an additional therapeutic agent.
- the cancer therapy or additional therapeutic agent may be one described below and may be given with respect to a patient having been determined to have a certain biomarker profile. For example, the therapy described below is given to a patient determined to have an irAE, such as ICI induced AIN.
- the therapy described below may be given to a patient determined to have non-ICI induced kidney dysfunction.
- the methods may exclude administration of a therapy below to a subject determined to have an irAE, such as ICI induced AIN.
- the methods may exclude administration of a therapy below to a subject determined to have non-ICI induced kidney dysfunction.
- Also contemplated are combinations of the therapies described below.
- A. Immune Checkpoint Inhibitor (ICI) Therapy [0081]
- the methods of the disclosure relate to combination therapies with ICI therapy and/or subjects being treated with ICI therapies. Specific ICI therapies are described below. 1.
- PD-1, PDL1, and PDL2 inhibitors [0082] PD-1 can act in the tumor microenvironment where T cells encounter an infection or tumor.
- Activated T cells upregulate PD-1 and continue to express it in the peripheral tissues.
- Cytokines such as IFN-gamma induce the expression of PDL1 on epithelial cells and tumor cells.
- PDL2 is expressed on macrophages and dendritic cells.
- the main role of PD-1 is to limit the activity of effector T cells in the periphery and prevent excessive damage to the tissues during an immune response.
- Inhibitors of the disclosure may block one or more functions of PD-1 and/or PDL1 activity.
- Alternative names for “PD-1” include CD279 and SLEB2.
- Alternative names for “PDL1” include B7-H1, B7-4, CD274, and B7-H.
- PD-1, PDL1, and PDL2 are human PD-1, PDL1 and PDL2.
- the PD-1 inhibitor is a molecule that inhibits the binding of PD-1 to its ligand binding partners.
- the PD-1 ligand binding partners are PDL1 and/or PDL2.
- a PDL1 inhibitor is a molecule that inhibits the binding of PDL1 to its binding partners.
- PDL1 binding partners are PD-1 and/or B7-1.
- the PDL2 inhibitor is a molecule that inhibits the binding of PDL2 to its binding partners.
- a PDL2 binding partner is PD-1.
- the inhibitor may be an antibody, an antigen binding fragment thereof, an immunoadhesin, a fusion protein, or oligopeptide. Exemplary antibodies are described in U.S. Patent Nos. 8,735,553, 8,354,509, and 8,008,449, all incorporated herein by reference.
- Other PD-1 inhibitors for use in the methods and compositions provided herein are known in the art such as described in U.S. Patent Application Nos. US2014/0294898, US2014/022021, and US2011/0008369, all incorporated herein by reference.
- the PD-1 inhibitor is an anti-PD-1 antibody (e.g., a human antibody, a humanized antibody, or a chimeric antibody).
- the anti-PD- 1 antibody is selected from the group consisting of nivolumab, pembrolizumab, and pidilizumab.
- the PD-1 inhibitor is an immunoadhesin (e.g., an immunoadhesin comprising an extracellular or PD-1 binding portion of PDL1 or PDL2 fused to a constant region (e.g., an Fc region of an immunoglobulin sequence).
- the PDL1 inhibitor comprises AMP- 224.
- Nivolumab also known as MDX-1106-04, MDX- 1106, ONO-4538, BMS-936558, and OPDIVO®, is an anti-PD-1 antibody described in WO2006/121168.
- Pembrolizumab also known as MK-3475, Merck 3475, lambrolizumab, KEYTRUDA®, and SCH-900475, is an anti-PD-1 antibody described in WO2009/114335.
- Pidilizumab also known as CT-011, hBAT, or hBAT-1, is an anti-PD-1 antibody described in WO2009/101611.
- AMP-224 also known as B7-DCIg
- additional PD-1 inhibitors include MEDI0680, also known as AMP-514, and REGN2810.
- the immune checkpoint inhibitor is a PDL1 inhibitor such as Durvalumab, also known as MEDI4736, atezolizumab, also known as MPDL3280A, avelumab, also known as MSB00010118C, MDX-1105, BMS-936559, or combinations thereof.
- the immune checkpoint inhibitor is a PDL2 inhibitor such as rHIgM12B7.
- the inhibitor comprises the heavy and light chain CDRs or VRs of nivolumab, pembrolizumab, or pidilizumab. Accordingly, in one embodiment, the inhibitor comprises the CDR1, CDR2, and CDR3 domains of the VH region of nivolumab, pembrolizumab, or pidilizumab, and the CDR1, CDR2 and CDR3 domains of the VL region of nivolumab, pembrolizumab, or pidilizumab. In another embodiment, the antibody competes for binding with and/or binds to the same epitope on PD-1, PDL1, or PDL2 as the above- mentioned antibodies.
- the antibody has at least about 70, 75, 80, 85, 90, 95, 97, or 99% (or any derivable range therein) variable region amino acid sequence identity with the above-mentioned antibodies.
- CTLA-4, B7-1, and B7-2 Another immune checkpoint that can be targeted in the methods provided herein is the cytotoxic T-lymphocyte-associated protein 4 (CTLA-4), also known as CD152.
- CTLA-4 is found on the surface of T cells and acts as an “off” switch when bound to B7-1 (CD80) or B7-2 (CD86) on the surface of antigen-presenting cells.
- CTLA4 is a member of the immunoglobulin superfamily that is expressed on the surface of Helper T cells and transmits an inhibitory signal to T cells.
- CTLA4 is similar to the T-cell co-stimulatory protein, CD28, and both molecules bind to B7-1 and B7-2 on antigen-presenting cells.
- CTLA-4 transmits an inhibitory signal to T cells, whereas CD28 transmits a stimulatory signal.
- Intracellular CTLA- 4 is also found in regulatory T cells and may be important to their function. T cell activation through the T cell receptor and CD28 leads to increased expression of CTLA-4, an inhibitory receptor for B7 molecules.
- Inhibitors of the disclosure may block one or more functions of CTLA-4, B7-1, and/or B7-2 activity.
- the inhibitor blocks the CTLA-4 and B7-1 interaction. In some embodiments, the inhibitor blocks the CTLA-4 and B7-2 interaction.
- the immune checkpoint inhibitor is an anti-CTLA-4 antibody (e.g., a human antibody, a humanized antibody, or a chimeric antibody), an antigen binding fragment thereof, an immunoadhesin, a fusion protein, or oligopeptide.
- Anti-human-CTLA-4 antibodies (or VH and/or VL domains derived therefrom) suitable for use in the present methods can be generated using methods well known in the art. Alternatively, art recognized anti-CTLA-4 antibodies can be used.
- the anti- CTLA-4 antibodies disclosed in: US 8,119,129, WO 01/14424, WO 98/42752; WO 00/37504 (CP675,206, also known as tremelimumab; formerly ticilimumab), U.S. Patent No.6,207,156; Hurwitz et al., 1998; can be used in the methods disclosed herein.
- the teachings of each of the aforementioned publications are hereby incorporated by reference.
- Antibodies that compete with any of these art-recognized antibodies for binding to CTLA-4 also can be used.
- a humanized CTLA-4 antibody is described in International Patent Application No. WO2001/014424, WO2000/037504, and U.S.
- a further anti-CTLA-4 antibody useful as a checkpoint inhibitor in the methods and compositions of the disclosure is ipilimumab (also known as 10D1, MDX- 010, MDX- 101, and Yervoy®) or antigen binding fragments and variants thereof (see, e.g., WO01/14424).
- the inhibitor comprises the heavy and light chain CDRs or VRs of tremelimumab or ipilimumab.
- the inhibitor comprises the CDR1, CDR2, and CDR3 domains of the VH region of tremelimumab or ipilimumab, and the CDR1, CDR2 and CDR3 domains of the VL region of tremelimumab or ipilimumab.
- the antibody competes for binding with and/or binds to the same epitope on PD-1, B7-1, or B7-2 as the above- mentioned antibodies.
- the antibody has at least about 70, 75, 80, 85, 90, 95, 97, or 99% (or any derivable range therein) variable region amino acid sequence identity with the above-mentioned antibodies. 3.
- the ICI therapy may include or exclude a LAG-3 inhibitor such as relatimab or combinations of ICI therapies, such as opdualag.
- LAG-3 inhibitors may include or exclude tebotelimab, chlorogenic acid, RO-7247669, favezelimab, INCAGN-2385, IBI-110, eftilagimod alpha, sym-022, LBL-007, ABL-501, anti-LAG3 antibody, HLX26, IBI-323, ieramilimab, FS 118, EMB-02, fianlimab, and combinations thereof.
- the ICI therapy may include or exclude a TIGIT inhibitor such as tiragolumab or combinations of ICI therapies, such as atezolizumab.
- the ICI therapy may include or exclude vibostolimab, domvanalimab, EOS884448 (EOS-448), HLX53, SEA-TGT, etigilimab, BMS-986207, COM701, and combinations thereof.
- B. Immunostimulators [0094]
- the method may comprise or further comprise administration of an additional agent.
- the additional agent may be an immunostimulator.
- the term “immunostimulator” as used herein refers to a compound that can stimulate an immune response in a subject, and may include an adjuvant.
- an immunostimulator is an agent that does not constitute a specific antigen, but can boost the strength and longevity of an immune response to an antigen.
- Such immunostimulators may include, but are not limited to stimulators of pattern recognition receptors, such as Toll-like receptors, RIG-1 and NOD-like receptors (NLR), mineral salts, such as alum, alum combined with monphosphoryl lipid (MPL) A of Enterobacteria, such as Escherihia coli, Salmonella minnesota, Salmonella typhimurium, or Shigella flexneri or specifically with MPL (ASO4), MPL A of above-mentioned bacteria separately, saponins, such as QS-21, Quil-A, ISCOMs, ISCOMATRIX, emulsions such as MF59, Montanide, ISA 51 and ISA 720, AS02 (QS21+squalene+MPL.), liposomes and liposomal formulations such as AS01,
- the additional agent comprises an agonist for pattern recognition receptors (PRR), including, but not limited to Toll-Like Receptors (TLRs), specifically TLRs 2, 3, 4, 5, 7, 8, 9 and/or combinations thereof.
- PRR pattern recognition receptors
- TLRs Toll-Like Receptors
- additional agents comprise agonists for Toll-Like Receptors 3, agonists for Toll-Like Receptors 7 and 8, or agonists for Toll-Like Receptor 9; preferably the recited immunostimulators comprise imidazoquinolines; such as R848; adenine derivatives, such as those disclosed in U.S. Pat. No. 6,329,381, U.S. Published Patent Application 2010/0075995, or WO 2010/018132; immunostimulatory DNA; or immunostimulatory RNA.
- the recited immunostimulators comprise imidazoquinolines; such as R848; adenine derivatives, such as those disclosed in U.S. Pat. No. 6,329,381, U.S. Published Patent Application 2010/0075995, or WO 2010/018132; immunostimulatory DNA; or immunostimulatory RNA.
- the additional agents also may comprise immunostimulatory RNA molecules, such as but not limited to dsRNA, poly I:C or poly I:poly C12U (available as Ampligen.RTM., both poly I:C and poly I:polyC12U being known as TLR3 stimulants), and/or those disclosed in F. Heil et al., "Species-Specific Recognition of Single-Stranded RNA via Toll-like Receptor 7 and 8" Science 303(5663), 1526-1529 (2004); J. Vollmer et al., "Immune modulation by chemically modified ribonucleosides and oligoribonucleotides” WO 2008033432 A2; A.
- immunostimulatory RNA molecules such as but not limited to dsRNA, poly I:C or poly I:poly C12U (available as Ampligen.RTM., both poly I:C and poly I:polyC12U being known as TLR3 stimulants), and/or those disclosed in F. Heil
- an additional agent may be a TLR-4 agonist, such as bacterial lipopolysaccharide (LPS), VSV-G, and/or HMGB-1.
- additional agents may comprise TLR-5 agonists, such as flagellin, or portions or derivatives thereof, including but not limited to those disclosed in U.S. Pat. Nos.6,130,082, 6,585,980, and 7,192,725.
- additional agents may be proinflammatory stimuli released from necrotic cells (e.g., urate crystals).
- additional agents may be activated components of the complement cascade (e.g., CD21, CD35, etc.). In some embodiments, additional agents may be activated components of immune complexes. Additional agents also include complement receptor agonists, such as a molecule that binds to CD21 or CD35. In some embodiments, the complement receptor agonist induces endogenous complement opsonization of the synthetic nanocarrier. In some embodiments, immunostimulators are cytokines, which are small proteins or biological factors (in the range of 5 kD-20 kD) that are released by cells and have specific effects on cell-cell interaction, communication and behavior of other cells.
- the cytokine receptor agonist is a small molecule, antibody, fusion protein, or aptamer.
- the additional therapy comprises a cancer immunotherapy.
- Cancer immunotherapy (sometimes called immuno-oncology, abbreviated IO) is the use of the immune system to treat cancer. Immunotherapies can be categorized as active, passive or hybrid (active and passive). These approaches exploit the fact that cancer cells often have molecules on their surface that can be detected by the immune system, known as tumour- associated antigens (TAAs); they are often proteins or other macromolecules (e.g. carbohydrates). Active immunotherapy directs the immune system to attack tumor cells by targeting TAAs.
- TAAs tumour- associated antigens
- the immunotherapy comprises an inhibitor of a co- stimulatory molecule.
- the inhibitor comprises an inhibitor of B7-1 (CD80), B7-2 (CD86), CD28, ICOS, OX40 (TNFRSF4), 4-1BB (CD137; TNFRSF9), CD40L (CD40LG), GITR (TNFRSF18), and combinations thereof.
- Inhibitors include inhibitory antibodies, polypeptides, compounds, and nucleic acids.
- Dendritic cell therapy provokes anti-tumor responses by causing dendritic cells to present tumor antigens to lymphocytes, which activates them, priming them to kill other cells that present the antigen.
- Dendritic cells are antigen presenting cells (APCs) in the mammalian immune system. In cancer treatment they aid cancer antigen targeting.
- APCs antigen presenting cells
- One example of cellular cancer therapy based on dendritic cells is sipuleucel-T.
- One method of inducing dendritic cells to present tumor antigens is by vaccination with autologous tumor lysates or short peptides (small parts of protein that correspond to the protein antigens on cancer cells).
- peptides are often given in combination with adjuvants (highly immunogenic substances) to increase the immune and anti-tumor responses.
- adjuvants include proteins or other chemicals that attract and/or activate dendritic cells, such as granulocyte macrophage colony-stimulating factor (GM-CSF).
- GM-CSF granulocyte macrophage colony-stimulating factor
- Dendritic cells can also be activated in vivo by making tumor cells express GM- CSF. This can be achieved by either genetically engineering tumor cells to produce GM-CSF or by infecting tumor cells with an oncolytic virus that expresses GM-CSF.
- Another strategy is to remove dendritic cells from the blood of a patient and activate them outside the body.
- the dendritic cells are activated in the presence of tumor antigens, which may be a single tumor-specific peptide/protein or a tumor cell lysate (a solution of broken down tumor cells). These cells (with optional adjuvants) are infused and provoke an immune response.
- tumor antigens which may be a single tumor-specific peptide/protein or a tumor cell lysate (a solution of broken down tumor cells). These cells (with optional adjuvants) are infused and provoke an immune response.
- Dendritic cell therapies include the use of antibodies that bind to receptors on the surface of dendritic cells. Antigens can be added to the antibody and can induce the dendritic cells to mature and provide immunity to the tumor. Dendritic cell receptors such as TLR3, TLR7, TLR8 or CD40 have been used as antibody targets. 3.
- CAR-T cell therapy [00104] Chimeric antigen receptors (CARs, also known as chimeric immunoreceptors, chimeric T cell receptors or artificial T cell receptors) are engineered receptors that combine a new specificity with an immune cell to target cancer cells. Typically, these receptors graft the specificity of a monoclonal antibody onto a T cell. The receptors are called chimeric because they are fused of parts from different sources. CAR-T cell therapy refers to a treatment that uses such transformed cells for cancer therapy. [00105] The basic principle of CAR-T cell design involves recombinant receptors that combine antigen-binding and T-cell activating functions.
- CAR-T cells The general premise of CAR-T cells is to artificially generate T-cells targeted to markers found on cancer cells.
- Scientists can remove T-cells from a person, genetically alter them, and put them back into the patient for them to attack the cancer cells.
- CAR-T cells create a link between an extracellular ligand recognition domain to an intracellular signaling molecule which in turn activates T cells.
- the extracellular ligand recognition domain is usually a single-chain variable fragment (scFv).
- scFv single-chain variable fragment
- CAR-T cells The specificity of CAR-T cells is determined by the choice of molecule that is targeted.
- Exemplary CAR-T therapies include Tisagenlecleucel (Kymriah) and Axicabtagene ciloleucel (Yescarta). In some embodiments, the CAR-T therapy targets CD19. 4. Cytokine therapy [00107] Cytokines are proteins produced by many types of cells present within a tumor. They can modulate immune responses. The tumor often employs them to allow it to grow and reduce the immune response. These immune-modulating effects allow them to be used as drugs to provoke an immune response. Two commonly used cytokines are interferons and interleukins. [00108] Interferons are produced by the immune system.
- Adoptive T-cell therapy is a form of passive immunization by the transfusion of T- cells (adoptive cell transfer). They are found in blood and tissue and usually activate when they find foreign pathogens. Specifically, they activate when the T-cell's surface receptors encounter cells that display parts of foreign proteins on their surface antigens.
- TILs tumor infiltrating lymphocytes
- APCs antigen presenting cells
- the additional therapy comprises an oncolytic virus.
- An oncolytic virus is a virus that preferentially infects and kills cancer cells. As the infected cancer cells are destroyed by oncolysis, they release new infectious virus particles or virions to help destroy the remaining tumour. Oncolytic viruses are thought not only to cause direct destruction of the tumour cells, but also to stimulate host anti-tumour immune responses for long-term immunotherapy.
- the additional therapy comprises polysaccharides.
- the additional therapy comprises neoantigen administration.
- Many tumors express mutations. These mutations potentially create new targetable antigens (neoantigens) for use in T cell immunotherapy.
- the additional therapy comprises a chemotherapy.
- chemotherapeutic agents include (a) Alkylating Agents, such as nitrogen mustards (e.g., mechlorethamine, cylophosphamide, ifosfamide, melphalan, chlorambucil), ethylenimines and methylmelamines (e.g., hexamethylmelamine, thiotepa), alkyl sulfonates (e.g., busulfan), nitrosoureas (e.g., carmustine, lomustine, chlorozoticin, streptozocin) and triazines (e.g., dicarbazine), (b) Antimetabolites, such as folic acid analogs (e.g., methotrexate), pyrimidine analog
- cisplatin is a particularly suitable chemotherapeutic agent.
- Cisplatin has been widely used to treat cancers such as, for example, metastatic testicular or ovarian carcinoma, advanced bladder cancer, head or neck cancer, cervical cancer, lung cancer or other tumors.
- Cisplatin is not absorbed orally and must therefore be delivered via other routes such as, for example, intravenous, subcutaneous, intratumoral or intraperitoneal injection.
- Cisplatin can be used alone or in combination with other agents, with efficacious doses used in clinical applications including about 15 mg/m2 to about 20 mg/m2 for 5 days every three weeks for a total of three courses being contemplated in certain embodiments.
- the amount of cisplatin delivered to the cell and/or subject in conjunction with the construct comprising an Egr-1 promoter operably linked to a polynucleotide encoding the therapeutic polypeptide is less than the amount that would be delivered when using cisplatin alone.
- Other suitable chemotherapeutic agents include antimicrotubule agents, e.g., Paclitaxel (“Taxol”) and doxorubicin hydrochloride (“doxorubicin”).
- Doxorubicin is absorbed poorly and is preferably administered intravenously.
- appropriate intravenous doses for an adult include about 60 mg/m2 to about 75 mg/m2 at about 21-day intervals or about 25 mg/m2 to about 30 mg/m2 on each of 2 or 3 successive days repeated at about 3 week to about 4 week intervals or about 20 mg/m2 once a week.
- Nitrogen mustards are another suitable chemotherapeutic agent useful in the methods of the disclosure.
- a nitrogen mustard may include, but is not limited to, mechlorethamine (HN2), cyclophosphamide and/or ifosfamide, melphalan (L-sarcolysin), and chlorambucil.
- Cyclophosphamide (CYTOXAN®) is available from Mead Johnson and NEOSTAR® is available from Adria), is another suitable chemotherapeutic agent.
- Suitable oral doses for adults include, for example, about 1 mg/kg/day to about 5 mg/kg/day
- intravenous doses include, for example, initially about 40 mg/kg to about 50 mg/kg in divided doses over a period of about 2 days to about 5 days or about 10 mg/kg to about 15 mg/kg about every 7 days to about 10 days or about 3 mg/kg to about 5 mg/kg twice a week or about 1.5 mg/kg/day to about 3 mg/kg/day.
- the intravenous route is preferred.
- the drug also sometimes is administered intramuscularly, by infiltration or into body cavities.
- Additional suitable chemotherapeutic agents include pyrimidine analogs, such as cytarabine (cytosine arabinoside), 5-fluorouracil (fluouracil; 5-FU) and floxuridine (fluorode- oxyuridine; FudR).5-FU may be administered to a subject in a dosage of anywhere between about 7.5 to about 1000 mg/m2. Further, 5-FU dosing schedules may be for a variety of time periods, for example up to six weeks, or as determined by one of ordinary skill in the art to which this disclosure pertains.
- chemotherapeutic agent is recommended for treatment of advanced and metastatic pancreatic cancer, and will therefore be useful in the present disclosure for these cancers as well.
- the amount of the chemotherapeutic agent delivered to the patient may be variable.
- the chemotherapeutic agent may be administered in an amount effective to cause arrest or regression of the cancer in a host, when the chemotherapy is administered with the construct.
- the chemotherapeutic agent may be administered in an amount that is anywhere between 2 to 10,000 fold less than the chemotherapeutic effective dose of the chemotherapeutic agent.
- the chemotherapeutic agent may be administered in an amount that is about 20 fold less, about 500 fold less or even about 5000 fold less than the chemotherapeutic effective dose of the chemotherapeutic agent.
- the chemotherapeutics of the disclosure can be tested in vivo for the desired therapeutic activity in combination with the construct, as well as for determination of effective dosages.
- such compounds can be tested in suitable animal model systems prior to testing in humans, including, but not limited to, rats, mice, chicken, cows, monkeys, rabbits, etc. In vitro testing may also be used to determine suitable combinations and dosages, as described in the examples.
- the additional therapy or prior therapy comprises radiation, such as ionizing radiation.
- ionizing radiation means radiation comprising particles or photons that have sufficient energy or can produce sufficient energy via nuclear interactions to produce ionization (gain or loss of electrons).
- An exemplary and preferred ionizing radiation is an x-radiation.
- Means for delivering x-radiation to a target tissue or cell are well known in the art.
- Curative surgery includes resection in which all or part of cancerous tissue is physically removed, excised, and/or destroyed and may be used in conjunction with other therapies, such as the treatment of the present embodiments, chemotherapy, radiotherapy, hormonal therapy, gene therapy, immunotherapy, and/or alternative therapies.
- Tumor resection refers to physical removal of at least part of a tumor.
- treatment by surgery includes laser surgery, cryosurgery, electrosurgery, and microscopically-controlled surgery (Mohs’ surgery).
- a cavity may be formed in the body. Treatment may be accomplished by perfusion, direct injection, or local application of the area with an additional anti-cancer therapy.
- the biologic therapy may include or exclude a tyrosine kinase inhibitor.
- the tyrosine kinase inhibitor may include or exclude axitinib, dasatinib, erlotinib, imatinib, nilotinib, pazopanib, sunitinib, and combinations thereof.
- the biologic therapy may include or exclude a proteasome inhibitor.
- the proteasome inhibitor may include or exclude bortezomib, carfilzomib, ixazomib, and combinations thereof.
- the biologic therapy may include or exclude a mTOR inhibitor.
- the mTOR inhibitor may include or exclude temsirolimus, and/or everolimus.
- the biologic therapy may include or exclude a PI3K inhibitor.
- the PI3K inhibitor may include or exclude idelalisib.
- the biologic therapy may include or exclude a histone deacetylase inhibitor.
- the histone deacetylase inhibitor may include or exclude vorinostat and/or romidepsin.
- the biologic therapy may include or exclude vismodegib.
- the biologic therapy may include or exclude a BRAF or MEK inhibitor.
- the BRAF or MEK inhibitor may include or exclude vemurafenib, dabrafenib, encorafenib, trametinib, binimetinib, and combinations thereof.
- K. Other Agents include Glucocorticoid therapy, TNF-alpha inhibitors such as infliximab, IFN-gamma inhibitors, IL-6 inhibitors, Mycophenolate mofetil, Cyclosporine, Cyclophosphamide, JAK inhibitor, STAT inhibitor, and Rituximab, and/or other inhibitors of B cell or plasma cell activity and proliferation.
- Protein Assays A variety of techniques can be employed to measure expression levels of polypeptides and proteins in a biological sample to determine biomarker expression levels. Examples of such formats include, but are not limited to, enzyme immunoassay (EIA), radioimmunoassay (RIA), Western blot analysis, electrothermal or electrochemical magneto- immunosensors, lateral flow tests strip, Luminex, Nucleic acid Linked Immuno-Sandwich Assay (NULISA), and enzyme linked immunosorbent assay (ELISA). A skilled artisan can readily adapt known protein/antibody detection methods for use in determining protein expression levels of biomarkers.
- EIA enzyme immunoassay
- RIA radioimmunoassay
- Western blot analysis electrothermal or electrochemical magneto- immunosensors
- lateral flow tests strip Luminex
- NULISA Nucleic acid Linked Immuno-Sandwich Assay
- ELISA enzyme linked immunosorbent assay
- antibodies, or antibody fragments or derivatives can be used in methods such as Western blots, ELISA, or immunofluorescence techniques to detect biomarker expression.
- either the antibodies or proteins are immobilized on a solid support.
- Suitable solid phase supports or carriers include any support capable of binding an antigen or an antibody.
- Well-known supports or carriers include glass, polystyrene, polypropylene, polyethylene, dextran, nylon, amylases, natural and modified celluloses, polyacrylamides, gabbros, and magnetite.
- One skilled in the art will know many other suitable carriers for binding antibody or antigen, and will be able to adapt such support for use with the present disclosure.
- Immunohistochemistry methods are also suitable for detecting the expression levels of biomarkers.
- antibodies or antisera including polyclonal antisera, and monoclonal antibodies specific for each marker may be used to detect expression.
- the antibodies can be detected by direct labeling of the antibodies themselves, for example, with radioactive labels, fluorescent labels, hapten labels such as, biotin, or an enzyme such as horseradish peroxidase or alkaline phosphatase.
- unlabeled primary antibody is used in conjunction with a labeled secondary antibody, comprising antisera, polyclonal antisera or a monoclonal antibody specific for the primary antibody.
- Immunohistochemistry protocols and kits are well known in the art and are commercially available.
- Immunological methods for detecting and measuring complex formation as a measure of protein expression using either specific polyclonal or monoclonal antibodies are known in the art. Examples of such techniques include enzyme-linked immunosorbent assays (ELISAs), radioimmunoassays (RIAs), fluorescence-activated cell sorting (FACS) and antibody arrays.
- ELISAs enzyme-linked immunosorbent assays
- RIAs radioimmunoassays
- FACS fluorescence-activated cell sorting
- antibody arrays Such immunoassays typically involve the measurement of complex formation between the protein and its specific antibody.
- Radioisotope labels include, for example, 36S, 14C, 125I, 3H, and 131I.
- the antibody can be labeled with the radioisotope using the techniques known in the art.
- Fluorescent labels include, for example, labels such as rare earth chelates (europium chelates) or fluorescein and its derivatives, rhodamine and its derivatives, dansyl, Lissamine, phycoerythrin and Texas Red are available.
- the fluorescent labels can be conjugated to the antibody variant using the techniques known in the art. Fluorescence can be quantified using a fluorimeter.
- Various enzyme-substrate labels are available and U.S. Pat. Nos.4,275,149, 4,318,980 provides a review of some of these. The enzyme generally catalyzes a chemical alteration of the chromogenic substrate which can be measured using various techniques.
- the enzyme may catalyze a color change in a substrate, which can be measured spectrophotometrically.
- the enzyme may alter the fluorescence or chemiluminescence of the substrate.
- Techniques for quantifying a change in fluorescence are described above.
- the chemiluminescent substrate becomes electronically excited by a chemical reaction and may then emit light which can be measured (using a chemiluminometer, for example) or donates energy to a fluorescent acceptor.
- enzymatic labels include luciferases (e.g., firefly luciferase and bacterial luciferase; U.S. Pat. No.
- luciferin 2,3-dihydrophthalazinediones, malate dehydrogenase, urease, peroxidase such as horseradish peroxidase (HRPO), alkaline phosphatase, beta-galactosidase, glucoamylase, lysozyme, saccharide oxidases (e.g., glucose oxidase, galactose oxidase, and glucose-6-phosphate dehydrogenase), heterocyclic oxidases (such as uricase and xanthine oxidase), lactoperoxidase, microperoxidase, and the like.
- HRPO horseradish peroxidase
- alkaline phosphatase beta-galactosidase
- glucoamylase lysozyme
- saccharide oxidases e.g., glucose oxidase, galactose oxidase, and glucose-6
- a detection label is indirectly conjugated with an antibody.
- the antibody can be conjugated with biotin and any of the three broad categories of labels mentioned above can be conjugated with avidin, or vice versa.
- Biotin binds selectively to avidin and thus, the label can be conjugated with the antibody in this indirect manner.
- the antibody is conjugated with a small hapten (e.g., digoxin) and one of the different types of labels mentioned above is conjugated with an anti-hapten antibody (e.g., anti-digoxin antibody).
- the antibody need not be labeled, and the presence thereof can be detected using a labeled antibody, which binds to the antibody.
- Methods disclosed herein include measuring expression of genes and/or RNAs (RNAs) such as messenger RNAs (mRNAs) and noncoding RNAs (ncRNAs).
- Measurement of expression can be done by a number of processes known in the art.
- the process of measuring expression may begin by extracting RNA from a biological sample. Extracted mRNA and/or ncRNA can be detected by hybridization (for example by means of Northern blot analysis or DNA or RNA arrays (microarrays) after converting RNA into labeled cDNA) and/or amplification by means of a enzymatic chain reaction. Quantitative or semi-quantitative enzymatic amplification methods such as polymerase chain reaction (PCR) or quantitative real- time RT-PCR or semi-quantitative RT-PCR techniques or NULISA or bulk RNA sequencing can be used.
- PCR polymerase chain reaction
- RT-PCR quantitative real- time RT-PCR or semi-quantitative RT-PCR techniques
- NULISA or bulk RNA sequencing can be used.
- Suitable primers for amplification methods encompassed herein can be readily designed by a person skilled in the art.
- Other amplification methods include ligase chain reaction (LCR), transcription-mediated amplification (TMA), strand displacement amplification (SDA), isothermal amplification of nucleic acids, and nucleic acid sequence- based amplification (NASBA).
- LCR ligase chain reaction
- TMA transcription-mediated amplification
- SDA strand displacement amplification
- NASBA nucleic acid sequence- based amplification
- Expression levels of mRNAs and/or ncRNAs may also be measured by RNA sequencing methods known in the art.
- RNA sequencing methods may include mRNA-seq, total RNA-seq, targeted RNA-seq, small RNA-seq, single-cell RNA-seq, ultra-low-input RNA-seq, RNA exome capture sequencing, and ribosome profiling. Sequencing data may be processed an aligned using methods known in the art. [00136] To normalize the expression values of one gene among different samples, comparing the mRNA and/or ncRNA level of interest in the samples from the subject object of study with a control RNA level is possible. As it is used herein, a "control RNA" is an RNA of a gene for which the expression level does not differ among different non-diseased individuals.
- the gene may be constitutively expressed in all types of cells.
- a control RNA is preferably an mRNA derived from a housekeeping gene encoding a protein that is constitutively expressed and carrying out essential cell functions.
- a known amount of a control RNA may be added to the sample(s) and the value measured for the level of the RNA of interest may be normalized to the value measured for the known amount of the control RNA. Normalization for some methods, such as for sequencing, may comprise calculating the reads per kilobase of transcript per million mapped reads (RPKM) for a gene of interest, or may comprise calculating the fragments per kilobase of transcript per million mapped reads (FPKM) for a gene of interest.
- RPKM reads per kilobase of transcript per million mapped reads
- FPKM fragments per kilobase of transcript per million mapped reads
- Normalization methods may comprise calculating the log2-transformed count per million (log-CPM). It can be appreciated to one skilled in the art that any method of normalization that accurately calculates the expression value of an RNA for comparison between samples may be used.
- Methods disclosed herein may include comparing a measured expression level to a reference expression level.
- the term "reference expression level" refers to a value used as a reference for the values/data obtained from samples obtained from patients.
- the reference level can be an absolute value, a relative value, a value which has an upper and/or lower limit, a series of values, an average value, a median, a mean value, or a value expressed by reference to a control or reference value.
- a reference level can be based on the value obtained from an individual sample, such as, for example, a value obtained from a sample from the subject object of study but obtained at a previous point in time.
- the reference level can be based on a high number of samples, such as the levels obtained in a cohort of subjects having a particular characteristic.
- the reference level may be defined as the mean level of the patients in the cohort.
- the reference may be from subjects that are healthy, subjects without one or more neurological disorder(s), subjects that are age-matched, subjects that are gender-matched, and/or subjects that are race-matched.
- a reference level can be based on the expression levels of the markers to be compared obtained from samples from subjects who do not have a disease state or a particular phenotype.
- Some embodiments include determining that a measured expression level is higher than, lower than, increased relative to, decreased relative to, equal to, or within a predetermined amount of a reference expression level.
- a higher, lower, increased, or decreased expression level is at least 1, 1.5, 2, 2.5, 3, 3.5, 4, 4.5, 5, 5.5, 6, 7, 8, 9, 10, 12, 14, 16, 18, 20, 50, 100, 150, 200, 250, 500, or 1000 fold (or any derivable range therein) or at least 10, 20, 30, 40, 50, 60, 70, 80, 90, 100, 200, 300, 400, 500, 600, 700, 800, or 900% different than the reference level, or any derivable range therein.
- These values may represent a predetermined threshold level, and some embodiments include determining that the measured expression level is higher by a predetermined amount or lower by a predetermined amount than a reference level.
- a level of expression may be qualified as “low” or “high,” which indicates the patient expresses a certain gene or RNA at a level relative to a reference level or a level with a range of reference levels that are determined from multiple samples meeting particular criteria.
- the level or range of levels in multiple control samples is an example of this.
- that certain level or a predetermined threshold value is at, below, or above 1, 2, 3, 4, 5, 6, 7, 8, 9, 10, 11, 12, 13, 14, 15, 16, 17, 18, 19, 20, 21, 22, 23, 24, 25, 26, 27, 28, 29, 30, 31, 32, 33, 34, 35, 36, 37, 38, 39, 40, 41, 42, 43, 44, 45, 46, 47, 48, 49, 50, 51, 52, 53, 54, 55, 56, 57, 58, 59, 60, 61, 62, 63, 64, 65, 66, 67, 68, 69, 70, 71, 72, 73, 74, 75, 76, 77, 78, 79, 80, 81, 82, 83, 84, 85, 86, 87, 88, 89, 90, 91, 92, 93, 94, 95, 96, 97, 98, 99, 100 percentile, or any range derivable therein.
- a threshold level may be derived from a cohort of individuals meeting a particular criterion or set of criteria.
- the number in the cohort may be, be at least, or be at most 10, 20, 30, 40, 50, 60, 70, 80, 90, 100, 110, 120, 130, 140, 150, 160, 170, 180, 190, 200, 210, 220, 230, 240, 250, 260, 270, 280, 290, 300, 310, 320, 330, 340, 350, 360, 370, 380, 390, 400, 410, 420, 430, 440, 441, 450, 460, 470, 480, 490, 500, 510, 520, 530, 540, 550, 560, 570, 580, 590, 600, 700, 800, 900, 1000, 1100, 1200, 1300, 1400, 1500, 1600, 1700, 1800, 1900, 2000 or more (or any range derivable therein).
- a measured expression level can be considered equal to a reference expression level if it is within a certain amount of the reference expression level, and such amount may be an amount that is predetermined.
- the predetermined amount may be within 0.1, 0.2, 0.3, 0.4, 0.5, 0.6, 0.7, 0.8, 0.9, 1.0, 2, 3, 4, 5, 6, 7, 8, 9, 10, 11, 12, 13, 14, 15, 16, 17, 18, 19, 20, 21, 22, 23, 24, 25, 30, 35, 40, 45, or 50% of the reference level, or any range derivable therein.
- the comparison is to be made on a gene-by-gene and RNA-by-RNA basis.
- the methods include a method for evaluating a subject comprising one or more steps for measuring the level of one or more biomarker(s) from one or more biological sample(s) from the subject.
- biomarker refers to a biological molecule, or fragment of a biological molecule, the change and/or detection of which can be correlated with a particular physical condition or state.
- the biomarker(s) of the present disclosure may be correlated with an irAE, such as ICI-AIN.
- biomarkers include any suitable analyte, but are not limited to, biological molecules comprising nucleotides, nucleic acids, nucleosides, amino acids, sugars, fatty acids, steroids, metabolites, peptides, polypeptides, proteins, carbohydrates, lipids, hormones, antibodies, regions of interest that serve as surrogates for biological macromolecules and combinations thereof (e.g., glycoproteins, ribonucleoproteins, lipoproteins).
- the term also encompasses portions or fragments of a biological molecule, for example, peptide fragments of a protein or polypeptide. Table 17.
- Exemplary Biomarker **The sequences associated with the GenBank accession numbers are herein incorporated by reference for all purposes.
- methods involve obtaining one or more sample(s) from a subject.
- the methods of obtaining provided herein may include methods of biopsy such as fine needle aspiration, core needle biopsy, vacuum assisted biopsy, incisional biopsy, excisional biopsy, punch biopsy, shave biopsy, nephrectomy, or skin biopsy.
- the sample may be obtained from any other source including but not limited to blood, serum, plasma, urine, pericardial fluid, joint aspiration, pleural fluid, sweat, hair follicle, buccal tissue, tears, menses, feces, or saliva.
- any medical professional such as a doctor, nurse or medical technician, clinical coordinator may obtain a biological sample for testing.
- a sample may include but is not limited to, tissue, cells, or biological material from cells or derived from cells of a subject.
- the biological sample may be a heterogeneous or homogeneous population of cells or tissues.
- the biological sample may be obtained using any method known to the art that can provide a sample suitable for the analytical methods described herein.
- the sample may be obtained by non-invasive methods including but not limited to: scraping of the skin or cervix, swabbing of the cheek, saliva collection, urine collection, feces collection, collection of menses, tears, any type of body fluid, blood, plasma, or semen.
- the sample may be obtained by methods known in the art.
- the samples are obtained by biopsy. In other aspects the sample is obtained by swabbing, endoscopy, scraping, phlebotomy, or any other methods known in the art. In some cases, the sample may be obtained, stored, or transported using components of a kit of the present methods. In some cases, multiple samples, such as multiple plasma or serum samples may be obtained for diagnosis by the methods described herein. In other cases, multiple samples, such as one or more samples from one tissue type (for example kidney(s) or related tissues) and one or more samples from another specimen (for example serum, plasma, urine) may be obtained for diagnosis by the methods. Samples may be obtained at different times are stored and/or analyzed by different methods.
- tissue type for example kidney(s) or related tissues
- samples from another specimen for example serum, plasma, urine
- a sample may be obtained and analyzed by routine staining methods or any other cytological analysis methods.
- the biological sample may be obtained by a physician, nurse, or other medical professional such as a medical technician, endocrinologist, cytologist, phlebotomist, radiologist, or a pulmonologist.
- the medical professional may indicate the appropriate test or assay to perform on the sample.
- a molecular profiling business may consult on which assays or tests are most appropriately indicated.
- the patient or subject may obtain a biological sample for testing without the assistance of a medical professional, such as obtaining a whole blood sample, a urine sample, a fecal sample, a buccal sample, or a saliva sample.
- a biological sample for testing without the assistance of a medical professional, such as obtaining a whole blood sample, a urine sample, a fecal sample, a buccal sample, or a saliva sample.
- the sample is obtained by an invasive procedure including but not limited to: biopsy, needle aspiration, blood draw, endoscopy, or phlebotomy.
- the method of needle aspiration may further include fine needle aspiration, core needle biopsy, vacuum assisted biopsy, or large core biopsy.
- multiple samples may be obtained by the methods herein to ensure a sufficient amount of biological material.
- General methods for obtaining biological samples are also known in the art.
- the molecular profiling business may obtain the biological sample from a subject directly, from a medical professional, from a third party, or from a kit provided by a molecular profiling business or a third party.
- the biological sample may be obtained by the molecular profiling business after the subject, a medical professional, or a third party acquires and sends the biological sample to the molecular profiling business.
- the molecular profiling business may provide suitable containers, and excipients for storage and transport of the biological sample to the molecular profiling business.
- a medical professional need not be involved in the initial diagnosis or sample acquisition.
- An individual may alternatively obtain a sample through the use of an over the counter (OTC) kit.
- OTC kit may contain a means for obtaining said sample as described herein, a means for storing said sample for inspection, and instructions for proper use of the kit.
- OTC kit may contain a means for obtaining said sample as described herein, a means for storing said sample for inspection, and instructions for proper use of the kit.
- molecular profiling services are included in the price for purchase of the kit. In other cases, the molecular profiling services are billed separately.
- a sample suitable for use by the molecular profiling business may be any material containing tissues, cells, nucleic acids, genes, gene fragments, expression products, gene expression products, or gene expression product fragments of an individual to be tested. Methods for determining sample suitability and/or adequacy are provided.
- the subject may be referred to a specialist such as an oncologist, surgeon, nephrologist, or endocrinologist.
- the specialist may likewise obtain a biological sample for testing or refer the individual to a testing center or laboratory for submission of the biological sample.
- the medical professional may refer the subject to a testing center or laboratory for submission of the biological sample.
- the subject may provide the sample.
- a molecular profiling business may obtain the sample.
- the therapy provided herein may comprise administration of a combination of therapeutic agents, such as a first cancer therapy, a second cancer therapy, and/or treatment of an irAE.
- the therapies may be administered in any suitable manner known in the art.
- the first and second cancer treatment may be administered sequentially (at different times) or concurrently (at the same time).
- the first and second cancer treatments are administered in a separate composition.
- the first and second cancer treatments are in the same composition.
- Aspects of the disclosure relate to compositions and methods comprising therapeutic compositions.
- the different therapies may be administered in one composition or in more than one composition, such as 2 compositions, 3 compositions, or 4 compositions. Various combinations of the agents may be employed.
- the therapeutic agents of the disclosure may be administered by the same route of administration or by different routes of administration.
- the cancer therapy or treatment of an irAE is administered intravenously, intramuscularly, subcutaneously, topically, orally, transdermally, intraperitoneally, intraorbitally, by implantation, by inhalation, intrathecally, intraventricularly, or intranasally.
- the composition is administered intravenously, intramuscularly, subcutaneously, topically, orally, transdermally, intraperitoneally, intraorbitally, by implantation, by inhalation, intrathecally, intraventricularly, or intranasally.
- the appropriate dosage may be determined based on the type of disease to be treated, severity and course of the disease, the clinical condition of the individual, the individual's clinical history and response to the treatment, and the discretion of the attending physician.
- the treatments may include various “unit doses.” Unit dose is defined as containing a predetermined-quantity of the therapeutic composition. The quantity to be administered, and the particular route and formulation, is within the skill of determination of those in the clinical arts.
- a unit dose need not be administered as a single injection but may comprise continuous infusion over a set period of time.
- a unit dose comprises a single administrable dose.
- Precise amounts of the therapeutic composition also depend on the judgment of the practitioner and are peculiar to each individual. Factors affecting dose include physical and clinical state of the patient, the route of administration, the intended goal of treatment (alleviation of symptoms versus cure) and the potency, stability and toxicity of the particular therapeutic substance or other therapies a subject may be undergoing.
- Kits [00159] Certain aspects of the present invention also concern kits containing compositions of the invention or compositions to implement methods of the invention. In some aspects, kits can be used to evaluate one or more biomarkers.
- kits contains, contains at least or contains at most 1, 2, 3, 4, 5, 6, 7, 8, 9, 10, 11, 12, 13, 14, 15, 16, 17, 18, 19, 20, 21, 22, 23, 24, 25, 26, 27, 28, 29, 30, 31, 32, 33, 34, 35, 36, 37, 38, 39, 40, 41, 42, 43, 44, 45, 46, 47, 48, 49, 50, 100, 500, 1,000 or more probes, primers or primer sets, synthetic molecules, antibodies, or inhibitors, or any value or range and combination derivable therein.
- kits for evaluating biomarker activity or level in a cell may comprise components, which may be individually packaged or placed in a container, such as a tube, bottle, vial, syringe, or other suitable container means.
- kits Individual components may also be provided in a kit in concentrated amounts; in some aspects, a component is provided individually in the same concentration as it would be in a solution with other components. Concentrations of components may be provided as 1x, 2x, 5x, 10x, or 20x or more.
- Kits for using probes, antibodies, synthetic nucleic acids, nonsynthetic nucleic acids, and/or inhibitors of the disclosure for prognostic or diagnostic applications are included as part of the disclosure.
- any such molecules corresponding to any biomarker identified herein which includes antibodies that bind to such biomarkers as well as nucleic acid primers/primer sets and probes that are identical to or complementary to all or part of a biomarker, which may include noncoding sequences of the biomarker, as well as coding sequences of the biomarker.
- negative and/or positive control nucleic acids, antibodies, probes, and inhibitors are included in some kit aspects.
- a kit may include a sample that is a negative or positive control for methylation of one or more biomarkers.
- TLSs Tertiary lymphoid structures
- ICI immune checkpoint inhibitor
- AIN immune related adverse events
- TLS-associated inflammatory gene signatures are present in AIN and performed NanoString-based gene expression and multiplex 12-chemokine profiling on paired kidney tissue, urine and plasma specimens of 36 participants who developed acute kidney injury (AKI) on ICI therapy: AIN (18), acute tubular necrosis (9), or HTN nephrosclerosis (9).
- AIN 18
- acute tubular necrosis (9)
- HTN nephrosclerosis 9
- Increased T and B cell scores a Th1-CD8+ T cell axis accompanied by interferon-g and TNF superfamily signatures were detected in the ICI-AIN group.
- TLS signatures were significantly increased in AIN cases and supported by histopathological identification.
- urinary TLS signature scores correlated with ICI-AIN diagnosis but not paired plasma.
- Urinary CXCL9 correlated best to tissue CXCL9 expression (rho 0.75, p ⁇ 0.001) and the ability to discriminate AIN vs. non-AIN (AUC 0.781, p-value 0.003).
- the inventors report the presence of TLS signatures in irAEs, define distinctive immune signatures, identify chemokine markers distinguishing ICI-AIN from common AKI etiologies and demonstrate that urine chemokine markers may be used as a surrogate for ICI- AIN or renal irAE diagnoses.
- ICI therapy can be a highly effective cancer treatment option but increasing T-cell activity can also increase T cell autoreactivity leading to the development of immune related adverse events (irAEs).
- irAEs immune related adverse events
- Over 60% of patients treated with immune checkpoint blockade will develop at least one irAE (4, 5). Since the development of irAEs is associated with increased immune activity, studies among more common irAEs, such as dermatitis, colitis and various endocrinopathies, are linked with increased ICI efficacy. Less is known, however, in patient outcomes for uncommon irAEs such as renal irAEs, which usually manifest as acute interstitial nephritis (AIN) (6).
- AIN acute interstitial nephritis
- AIN Although 15-20% of patients on immune checkpoint blockade will develop acute kidney injury (AKI), only 2-5% of cases will be AIN (6-8). Timely and accurate diagnosis of AIN is complicated due to the lack of non-invasive diagnostic tests; as such, kidney biopsy remains the gold standard. In patients with cancer, a kidney biopsy may not always be feasible and when performed may carry a significant risk of morbidity such as major bleeding complications in 1.6-5% of cases; consequently, steroid therapy is often initiated empirically for presumed ICI-AIN (9-13). Difficulties in diagnosing AIN, the low frequency of ICI-AIN occurrence, and delays in AKI management contribute to the development of permanent functional kidney loss in over 50% of ICI-AIN patients despite glucocorticoid therapy (14).
- kidney biopsy results correlated with paired urine and plasma specimens providing a less invasive means of detecting ICI-AIN in patients receiving immune checkpoint therapy.
- This study is, to the inventors’ knowledge, the first to demonstrate the presence of distinguishing TLS features in ICI-AIN and in fact, any ICI-associated toxicity, that is detectable in both tissue and urine and identifies urine markers that can differentiate ICI-AIN from non-AIN.
- B. RESULTS Cohort characteristics and kidney injury assignment [00169] The inventors enrolled 36 patients who had received ICI therapy and underwent a clinically indicated kidney biopsy for AKI evaluation at The University of Texas MD Anderson Cancer Center (FIG. 1). Relevant clinical and pathological characteristics are presented in Table 1.
- each AKI stage was equally represented (3 stage 1, 3 stage 2 and 3 stage 3).
- AKI stage 1 3 stage 1, 0 stage 2, 1 stage 3).
- Percent of inflammation in the renal cortex was significantly higher in ICI-AIN compared to ATN and HTN groups (16).
- Median time from first ICI infusion to AKI for AIN was 145 days, 67 days ATN group and 197 days in the HTN group.
- Almost all ICI- AIN patients received corticosteroid therapy with 7 patients achieving complete renal recovery, 8 partial renal recovery and 3 with no renal recovery.
- AIN and ATN are the most frequently reported kidney pathologies from biopsied cancer patients on ICI therapy.
- AIN Although both are acute conditions of kidney injury with similar clinical presentation, only AIN can be treated with glucocorticoids and ATN is generally considered to be a toxic ischemic injury without any specific therapy.
- the inventors performed a comprehensive gene expression analysis using NanoString nCounter PanCancer Immune Profiling Panel. Out of 770 genes evaluated, in AIN vs ATN, a total of 23 differentially expressed genes (DEGs) with a fold change ⁇ 4 (p-Adj ⁇ 0.01) was detected.
- genes were upregulated in AIN compared to ATN.
- DEGs eight of the top ten most differentially expressed genes were inflammatory chemokines and immune associated genes (CCL18, CXCL11, CXCL10, CXCL9, CXCL8, CXCL7, TREM1) and (SLAMF1) a gene associated with activated T and B lymphocytes (FIG.3A and Table 2).
- SLAMF1 a gene associated with activated T and B lymphocytes
- the inventors used NanoString analysis to deconvolute immune cell gene expressions to identify and determine the abundance of T cell subsets infiltrating the kidneys.
- Our analysis showed an increase in Th1 cell score in the ICI-AIN group compared to HTN group but no differences in Th2 or Th17 cell scores amongst the three groups (FIG. 4A).
- a statistically significant increase in cytotoxic CD8+ T cell score was also detected in the AIN group compared to the ATN and HTN groups (FIG. 4C).
- T reg infiltrating T regulatory
- interferon (IFN)- ⁇ inducible chemokines CXCL9, -10 and -11 were observed to be differentially expressed in AIN vs ATN and an increase in the Th1 cell subset score was also observed, the inventors interrogated the three groups for genes associated with an IFN- ⁇ signature.
- TNFSF TNF superfamily
- TNFSF TNFSF-associated nephritis, colitis and arthritis
- Several TNFSF members are also associated with TLS development (26).
- TNFSF gene expression signature Our results showed significant upregulation of the TNFSF signature and TNF expression (FIG.4E) in the ICI-AIN group compared to ATN and HTN groups (Table 4 and Table 5). Studies have shown that both Th1 and Th17 cells can secrete TNF- ⁇ .
- ICI-AIN is Th1 mediated. 5.
- TLS Tertiary Lymphoid Structure
- ICI-triggered TLS development in tumor has been associated with clinical response in various cancer types; however, irAEs which are unique ICI side effects that resemble autoimmune responses have not been evaluated for the presence of TLS.
- the inventors investigated whether TLS development is associated with ICI-AIN.
- the inventors used an established, well-validated 12-chemokine TLS gene signature (CCL2, CCL3, CCL4, CCL5, CCL8, CCL18, CCL19, CCL21, CXCL9, CXCL10, CXCL11, CXCL13) that is correlated with improved survival among patients with colorectal cancer, melanoma and breast cancer (27-29).
- TLS signature found in ICI-AIN To further validate the TLS signature found in ICI-AIN, the inventors find a strong association of the ICI-AIN gene signature with TLS signatures for melanoma (CCL19, CCL21, CXCL13, CCR7, SELL, LAMP3, CXCR4, CD86, BCL6) and urothelial cancer (CD79A, MS4A1, LAMP3, POU2AF1), where several B cell genes associated with improved antigen presentation, and increased cytokine-mediated signaling were found to be significantly enhanced (33, 34).
- melanoma CCL19, CCL21, CXCL13, CCR7, SELL, LAMP3, CXCR4, CD86, BCL6
- urothelial cancer CD79A, MS4A1, LAMP3, POU2AF1
- the TLS signature for breast cancer also includes genes associated with T follicular helper (Tfh) cells which play a major role in the humoral immune response by facilitating B- cell activation, function and differentiation to memory B cells and plasmablasts leading to germinal center formation and mature TLS.
- Tfh T follicular helper
- the inventors investigated the TLS signature in breast carcinoma (CD200, PDCD1, CXCL13, CXCL9, CD38, ICOS, IFNG, CXCL13 alone) that includes Tfh (CD200, PDCD1 plus CXCL13) and Th1 genes (CD38, CXCL9, INFG) in ICI-AIN.
- Tfh CD200, PDCD1 plus CXCL13
- Th1 genes CD38, CXCL9, INFG
- TLS hematoxylin and eosin
- TLS density was determined by dividing the total number of tertiary lymphoid- like structures by the total biopsied kidney cortex area [mm 2 ].
- a significantly greater TLS density was observed in the ICI- AIN group compared to HTN (FIG. 5D).
- Supervised clustering of chemokines revealed an association of almost all chemokines with TLS formation in the AIN group.
- B cells Clustering of B cell genes expressed in the ICI-AIN cohort suggests that B cells (REL, LTB, CD20, CXCR5, PAX5, IRF8) were activated and differentiating into plasmablasts (CD62L, IRF4) and progressing towards organization of germinal centers (VCAM1, ITGA2B, TNFRSF17/BCMA, FIG.5E) (39, 40). 6. Elevated levels of urinary chemokines associated TLS in urine from ICI-AIN patients [00180] Kidney biopsies, especially in cancer patients, poses an increased risk of bleeding, and thus is not always a feasible option (9-12).
- the inventors then used the 12 chemokine TLS signature shown to be associated with improved clinical outcomes in melanoma, breast and colorectal carcinoma to evaluate the correlation of the individual urinary chemokines to the overall tissue TLS gene signature (28- 30).
- CXCL9 and CXCL10 in urine demonstrated a greater correlation with kidney tissue samples (R > 0.6, p ⁇ 0.005) and strong ability to discriminate AIN from ATN or HTN (AUC > 0.75, p ⁇ 0.005) suggesting the utility of this chemokine signature in the urine for diagnosing AIN without an invasive biopsy (FIG.6C and Table 9).
- Logistic regression was used to determine if several chemokines combined in a single score could improve this discrimination ability.
- These models achieved marginal improvement over individual chemokines (AUC of 0.82 for logistic regression combination rule vs AUC of 0.80 for CXCL10 alone) which were not statistically significant.
- TLS gene signatures have been observed in renal irAEs specifically, ICI-AIN, by histologic examination, and present in paired urine specimens by protein ELISA, providing an opportunity for non-invasive monitoring of ICI-AIN.
- This study represents the first demonstration of TLS signatures in ICI-associated nephritis and, in fact, any irAE-affected tissue.
- AKI is a common manifestation in patients with cancer receiving ICI therapy, etiologies include ischemic nephrotoxic tubular injury which can be manifested by ATN lesions, hemodynamic fluctuations in patients with underlying HTN nephrosclerosis, or AIN (41, 42). Since patients with ICI-AIN respond to glucocorticoid therapy unlike ATN or HTN, the inventors investigated the underlying mechanisms leading to the development of this condition (43). Our gene expression profile analysis confirmed the morphologic characteristics seen microscopically on kidney biopsy which suggests that ICI-AIN is distinct from both ATN and HTN nephrosclerosis.
- AIN is characterized by lymphocytic infiltration of the renal cortex and by gene expression analysis, ICI-AIN displayed an upregulation in genes associated with chemokine signaling and significant increases in immune cell scores compared to ATN and HTN nephrosclerosis.
- TLS signatures are distinguishing feature of ICI- AIN. TLS have been identified within a wide range of human cancers and at all stages of disease (48- 51). In primary and metastatic lesions, TLS have the same characteristics as in their primary sites but TLS in irAEs have not previously been identified.
- TLS signatures may be present in ICI-AIN.
- the inventors used a well-established 12 chemokine TLS signature to confirm an increase in ICI- AIN vs non-AIN cases and further validated the results with three additional TLS gene expression signatures (34, 35, 48).
- TLS Gene analysis for cellular components of TLS showed expression of B cells (REL, LTB, CD20, CXCR5, BCL6) and plasmablast associated genes (IRF4, CD62L) in the ICI-AIN cohort which likely reflects the TLS stage in which biopsies were obtained. Since TLS are also present in autoimmune conditions such as lupus nephritis and renal allograft rejection and is associated with end organ damage (40, 54-56), the inventors suspect that mature TLS with GC if observed in ICI-AIN would be functional and involved in active kidney disease.
- B cells REL, LTB, CD20, CXCR5, BCL6
- IRF4, CD62L plasmablast associated genes
- TNF expression in ICI-AIN and the top TNF superfamily members differentially expressed in ICI-AIN are not only associated with T and B cell activation, proliferation and differentiation (TNFRSF4/OX40 and TNFRSF13C/BAFFR), but have fundamental roles in TLS formation (LTB, TNFSF14/LIGHT) and are associated with maintaining the survival of plasma cells and autoantibody secretion (BCMA/TNFRSF17) (58- 60).
- TNF superfamily members are involved in the pathogenesis of ICI-AIN and TLS, and likely, the clinical response observed is a result of targeting TNF- ⁇ for the treatment of ICI-AIN.
- non-ICI associated AIN increased urinary TNF levels have been reported (60).
- urinary CXCL9 and 10 exhibited the greatest ability to discriminate AIN vs non-AIN.
- This study had several strengths including the use of three different approaches; histopathology, gene expression profile and multiplex chemokine assay, to differentiate ICI- AIN from ATN and HTN nephrosclerosis.
- This work is the first to demonstrate the presence of TLS signatures in irAEs and to identify several distinct immune signatures in ICI-AIN compared to ATN and HTN nephrosclerosis associated AKI in patients receiving ICI therapy. This work is also the first to demonstrate that urine may be a better biological fluid for non-invasive diagnosis and monitoring of acute kidney injury. Since the development or detection of TLS appears to be of paramount importance in positive anti-tumor response, additional investigation with larger numbers of cases will be necessary to determine if TLS development or characteristics of TLS in normal tissue (i.e. irAE organ sites) correlates with anti-tumor immune activity, and to investigate chemokine protein expression at tissue level to determine whether these inflammatory chemokines localize to TLS.
- FFPE formalin fixed paraffin embedded
- TLS histological scoring
- H&E Hematoxylin and Eosin
- Luminex MAGPIX multiplexing system was used to acquire data and xPONENT software (version 4.2) was used to analyze the data. All standards and samples were analyzed in duplicate. Urine specimens were normalized to urine creatinine measured using QuantiChromTM Creatinine Assay Kit - DICT-500 (BioAssay Systems, Hayward, CA). 5. RNA isolation and gene expression profiling [00196] Total RNA was extracted and purified using the RNeasy Mini Kit (Qiagen GmbH, Hilden, Germany) according to manufacture instructions. Quantity and quality of RNA was assayed using Qubit RNA HS Assay Kit (ThermoFisher Scientific).
- RNA profiling was performed on 100 ng of RNA extracted from FFPE human kidney samples for the expression of 770 immune oncology-related genes and housekeeping genes using the NanoString nCounter Human V.1.1 PanCancer Immune Profiling Panel (NanoString Technologies Inc, Seattle, WA). Raw data were normalized using the nSolverTM Analysis Software (Version 4.0) with the Advanced Analysis 2.0 plugin. Counts for target genes were normalized to internal synthetic positive controls and housekeeping genes. Data from the NanoString gene expression profiles have been submitted to the European Genome-phenome Archive (EGA) under accession no. EGAS00001006781. 6. Statistics [00197] Expression profiling of RNA samples was evaluated by log2 normalized count data.
- Log2 normalized counts were used for individual gene analyses, scores for immune signatures were calculated by the geometric mean of signature genes. Urine chemokine to urine creatinine ratios and plasma chemokine levels were transformed to log2 counts. For all specimens, differences in the means of log2 count data were evaluated using one-way ANOVA and Tukey’s multiple comparisons test. Statistical significance was considered at *P ⁇ 0.05 and **P ⁇ 0.01. For the volcano plots, ROSALIND cloud platform for nCounter data using Benjamini-Hochberg method was applied to calculate adjusted P-values with FDR threshold of 0.01 or 0.05 as specified. Statistical analyses were performed with GraphPad Prism 5.0 (GraphPad Software, Inc., San Diego, CA) and R version 4.1.1.
- Top 10 differentially expressed genes between AIN vs ATN Benjamini-Hochberg method was applied to calculate adjusted P-values with FDR threshold of 0.01. Table 3.
- Top 10 differentially expressed genes between AIN vs HTN. Benjamini-Hochberg method was applied to calculate adjusted P-values with FDR threshold of 0.01. Table 4.
- Top 5 TNF superfamily (TNFSF) genes upregulated in AIN vs ATN Benjamini-Hochberg method was applied to calculate adjusted P-values with FDR threshold of 0.01. Table 5.
- Top 5 TNF superfamily (TNFSF) genes upregulated in AIN vs HTN Benjamini-Hochberg method was applied to calculate adjusted P-values with FDR threshold of 0.01. Table 6.
- Example 2 Application of the markers for detecting ICI-AIN
- the inventors enrolled adult patients who developed acute kidney injury (AKI) after receiving immune checkpoint inhibitor (ICI) therapy. They collected urine, blood, and/or kidney/tissue specimen from consented patients. All kidney biopsies were clinically indicated and evaluated by a renal pathologist to establish a pathological diagnosis. They used the pathological diagnosis to determine the different study cohorts.
- Extracted RNA from fixed formalin embedded paraffin (FFPE) kidney tissue was quantified and quality assayed using Qubit RNA assay. RNA was used to analyze for the expression of immune oncology-related genes using the NanoString nCounter Human PanCancer Immune Profiling Panel (NanoString Technologies Inc, Seattle, WA).
- ATN is also an acute injury of the kidney where damage is found in the tubular cells, where the etiology may be ischemic related and not associated with ICI therapy.
- HTN is a hemodynamic mediated kidney injury also not considered to be related to ICI therapy toxicity.
- AIN has specific treatment recommendations whereas ATN and HTN do not require specific therapy.
- Example 1 shows the initial findings. They then performed additional investigation using the differential expression analysis of these cohorts. They grouped ATN and HTN together as “non-AIN” for the following analysis. The inventors performed unbiased computation of our data to identify genes that ideally separate ICI-AIN from non-AIN.
- the inventors filtered for only those genes with an AUC > 0.85. Next, they ranked the genes based on log2 fold change from largest to smallest value to identify the top genes with the largest fold change difference between ICI-AIN vs non- AIN. Out of the 770 genes that were analyzed, this table, represents the top 15 genes that ideally separate ICI-AIN vs non-AIN.
- genes and/or transcribed proteins of these genes, and or combinations can be used to diagnose irAEs in tissue or body fluids; and can be used for the prognosis, diagnosis, and/or monitoring of irAEs, response to irAE treatment, cancer treatment outcome, patient survival, and/or lead to improved anti-tumor and irAE management.
- Table 10 ICI-AIN vs non-AIN: Genes with AUC greater than 0.85, absolute log2 fold change greater than 2.5, and q-value (p-adj) smaller than 0.01. Genes are ordered by log2 fold change.
- the analyzed genes in the table below includes the original cohort and additional 6 ICI-AIN cases and 5 non-AIN cases for a total of 15 ICI-AIN cases and 23 non-AIN cases. Genes with AUC greater than 0.80 and q-value (p-adj) less than 0.01. Genes are ordered by log2 fold change and top 50 are listed. Table 11 [00204] LTB (lymphotoxin beta) was identified as a marker signature that can discriminate immune related adverse events associated with ICI therapy such as AIN (acute interstitial nephritis) from non-irAE or ICI related diseases.
- AIN acute interstitial nephritis
- tissue level of LTB is > 9.5 – this would support a diagnosis of AIN, stopping ICI therapy and initiating steroid therapy. If the level of LTB is ⁇ 9.5 this would suggest that the kidney injury is not associated with ICI therapy and the patient would be able to continue with life-saving and life prolonging ICI cancer therapy. If tissue is unavailable, we can also use this signature in body fluids such as urine. In FIG.10, the urine level of CXCL9 is >6.8 this would be strongly suggestive of ICI- AIN, stopping ICI therapy and starting steroid treatment.
- Urine markers for ICI-AIN vs non-AIN [00205] The inventors enrolled adult patients who developed acute kidney injury (AKI) after receiving immune checkpoint inhibitor (ICI) therapy. They collected urine, blood, and/or kidney/tissue specimen from consented patients. All kidney biopsies were clinically indicated and evaluated by a renal pathologist to establish a pathological diagnosis. They used the pathological diagnosis and medical chart review to determine the different study cohorts.
- AKI acute kidney injury
- ICI immune checkpoint inhibitor
- Urine specimens were collected from patients with biopsy-confirmed ICI- AIN or non-AIN cases where we evaluated 203 proteins using NUcleic acid Linked Immuno- Sandwich Assay (NULISATM).
- NULISA Assay Workflow Before the assay, urine samples received were thawed and centrifuged at 10,000g for 10 min. Supernatant from the urine samples were then analyzed using Alamar’s 200-plex Inflammation Panel targeting mostly inflammation and immune response-related cytokines and chemokines with NULISAseq, Alamar's novel proprietary proteomic platform.
- the capture antibody is conjugated with partially double-stranded DNA containing a poly-A tail and a target-specific barcode
- the detection antibody is conjugated with another partially double-stranded DNA containing a biotin group and a matching target-specific barcode (FIG.11, BOX 1).
- an immunocomplex is formed.
- the formed immunocomplexes are captured by added paramagnetic oligodT beads and subsequent dT-polyA hybridization (FIG. 11, BOX 2), and the sample matrix and unbound detection antibodies are removed by washing (FIG.11, BOX3).
- the formed immunocomplexes are then released into a low-salt buffer (FIG.11, BOX4).
- a second set of paramagnetic beads coated with streptavidin is introduced to capture the immunocomplexes in the solid phase a second time (FIG.
- FIG. 13 illustrates boxplots of selected top protein targets show candidates that separate AIN from non-AIN. *p ⁇ 0.05, **p ⁇ 0.01, ***p ⁇ 0.0005, **** p ⁇ 0.0001.
- FIG.14 is a heatmap of top inflammatory protein targets with AUC > 0.75.
- IL5 markers that are analyzed by NULISA: IL5, FAS, and CXCL9 were identified and Bootstrap model of these three candidates revealed that the combination of IL5 and FAS obtained an AUC (0.941) in discriminating ICI-AIN from non- AIN.
- Urine levels of IL5, FAS and/or CXCL9 can be strongly suggestive of ICI-AIN or non-AIN thus directing ICI therapy management and irAE management.
- Combinations of the 30 markers can be used to differentiate irAEs from non-irAEs for patients on ICI therapy.
- FIG 16 illustrates one example of how such markers can be used for patient care, where level of protein targets (in urine) can be used to assess for an irAE when a patient on ICI therapy experiences AKI. These protein targets can not only optimize patient management and treatment but also be used for immune monitoring with ICI therapy.
- ICI-AIN Urine markers for ICI-AIN vs non-AIN
- Urine proteomics defined an immune nephritis-associated signature
- ICI Immune checkpoint inhibitor
- Table 12 Urine markers for ICI-AIN vs non-AIN
- Urine proteomics defined an immune nephritis-associated signature
- ICI-AIN necessitates an invasive kidney biopsy with high risk morbidity.
- Urine and plasma proteomics revealed distinct profiles.
- Top urine proteins were associated with hypersensitivity (e.g., IL5), apoptosis (e.g., FAS), immune checkpoint proteins (e.g., TNFSF4, and PD-L1) and inflammatory chemokines (e.g., CXCL9, CCL1, and IL20).
- Top plasma proteins were associated with T cell and immune activation (e.g., IL36A, SPP1, TNFRSF8, IL17A, and TNF).
- Urine emerged as a more sensitive medium for detecting differences in protein with larger fold changes with pathway analysis revealing TNF signaling and JAK-STAT pathway.
- At least CXCL9, IL5, FAS, and TNFSF4 were associated with ICI- AIN, although IL5, FAS, and TNFSF4 exhibited higher area under the curve (AUC) measurements in receiver operating characteristics (ROC) plots than CXCL9.
- Statistical models including L1 regularized logistic regression and classification and regression tree (CART), pinpointed IL5 and FAS as the most effective markers for identifying ICI-AIN.
- a logistic regression model utilizing IL5 and FAS achieved an AUC of 0.94 in distinguishing ICI-AIN from non-AIN disease.
- ICI-AIN urine markers such as, but not limited to, CXCL9, IL5, FAS, and TNFSF4.
- the inventors determined that a combination of IL5 and FAS exhibited a strong ability to discriminate between ICI-AIN and non-AIN cases, with an AUC value of 0.94, outperforming all other markers and represents a novel urine ICI-AIN signature.
- ICI therapy including programmed cell death protein 1 (PD-1) inhibitors (i.e., pembrolizumab or nivolumab), programmed death-ligand 1 (PD-L1) inhibitors (i.e., durvalumab, atezolizumab, or avelumab), or a combination of PD-1 with cytotoxic T-lymphocyte-associated protein 4 (CTLA-4) inhibitors (i.e., ipilimumab or tremelimumab).
- PD-1 inhibitors i.e., pembrolizumab or nivolumab
- PD-L1 inhibitors i.e., durvalumab, atezolizumab, or avelumab
- CTLA-4 cytotoxic T-lymphocyte-associated protein 4
- AKI was defined according to the Kidney Disease: Improving Global Outcomes (KDIGO) classification guidelines (15). [00220] Cases were retrospectively grouped based on
- Non-AIN cases encompassed a random spectrum of other diagnoses as controls. Participants diagnosed with glomerular or vasculitic lesions by kidney biopsy or who received corticosteroid therapy before the first blood or urine collection were excluded. [00221] Additional data on patient demographics, comorbidities, medications, cancer type and stage, and laboratory test results were obtained through an electronic health record system. The study was approved by the University of Texas MD Anderson Cancer Center Institutional Review Board in accordance with the Declaration of Helsinki under approval number PA19- 0084. 2.
- Urine and blood samples were collected within a 2-hour window from the time of laboratory arrival, and aliquots were stored at -80 oC. Samples underwent processing as described previously.
- Urine and plasma specimens were processed according to the manufacturer’s instructions (summarized in FIG. 11). In short, samples were combined with a capture and detection antibody cocktail and incubated to form immunocomplexes (IC). IC were captured using oligo-dT beads, washed, and eluted, before incubation with streptavidin (SA) beads for recapturing the IC for oligonucleotide reporter ligation. A unique barcode sequence was assigned to each sample.
- SA streptavidin
- NGS next-generation sequencing
- the library was purified using Ampure XP reagent (Beckman Coulter, Indianapolis, IN), its concentration was quantified using Aibit 1X dsDNA HS assay kit (Thermo Fisher, Waltham, MA), and sequenced using a NextSeq 1000/2000 instrument (Illumina, San Diego, CA). 3. NULISAseq data processing and normalization [00224] NGS data was processed using the NULISAseq algorithm (Alamar Biosciences). The sample- (SMI) and target-specific (TMI) barcodes were quantified.
- Intraplate normalization was performed by dividing the target counts for each sample well by that well’s internal control count. Interplate normalization was performed using interplate control (IPC) normalization. For IPC normalization, counts were divided by target-specific medians of the three IPC wells on that plate, and then rescaled by the factor 104. To facilitate statistical analyses, IPC-normalized counts were log2-transformed. These log2 IPC-normalized counts are referred to as NULISA Protein Quantification (NPQ) units. 4. Standard curve and level of detection (LOD) determination [00225] To determine the LOD of NULISAseq in attomolar (aM), Cq values are transformed (2(37-Cq)) prior to 4PL curve fitting with 1/y2 error weighting.
- IPC interplate control
- the LOD was calculated as 3 times the standard deviation of the blank samples plus either the mean of the blanks or the y- intercept of the curve fit. These values were backfitted, and the maximum value was used to define the LOD in aM. 5.
- Statistics [00226] Profiling of samples was evaluated by log2 normalized count data. P-values were computed using Wilcoxon tests. Log fold changes were calculated by computing the difference in the mean of the log2 normalized between groups (e.g., ICI-AIN versus non-AIN). False Discovery Rate (FDR) was used to account for multiple comparisons. 65 Enrichr with KEGG 2021 pathways was used for gene set enrichment analysis.
- a cohort of 68 patients provided consent for specimen collection. Cases presenting glomerular or vasculitic findings, as well as those associated with systemic autoimmune diseases (e.g., sarcoid), and bad biopsies without a pathological or clinical diagnosis for AKI were excluded. This resulted in 55 cases, comprising of 25 ICI-AIN cases and 30 non-AIN cases. Among these, six patients were receiving corticosteroid treatment for AKI during the initial sample collection, leaving 22 ICI-AIN and 27 non-AIN cases for analysis. [00228] The clinical characteristics (Table 13) were largely comparable between the two groups.
- Detection was defined as those targets present in at least 50% of samples above the level of detection (LOD). Out of 203 available targets, 149 (73.4%) were detectable in urine samples, and 193 (95.1%) in plasma samples. Subsequently, the inventors filtered for only targets with a false discovery rate (FDR) ⁇ 0.05. Among the detectable proteins, 73 targets in urine and 36 in plasma were deemed significant. Of these, only 14 proteins overlapped between urine and plasma (FIG.17A). The inventors then ranked the 14 overlapping proteins by Area Under the ROC Curve (AUC). The results indicated a strong discriminatory ability between ICI-AIN and non-AIN detectable proteins.
- LOD level of detection
- Urine proteins identified novel biomarker proteins appearing in ICI-AIN but not non-AIN [00231] Urine, with its localized concentration of kidney derived proteins, may offer greater sensitivity, specificity, and predictable value in identifying kidney disease etiology. In an effort to distinguish between ICI-AIN from non-AIN, the inventors focused on selecting protein targets with large differences, i.e., fold change > 8.0.
- Top urine markers differentiated AKI etiology Based on the proteomic analysis, the inventors assessed the efficacy of the top markers in distinguishing between ICI-AIN from non-AIN cases using Heatmap and PCA analyses (FIG. 22A-B). The unsupervised clustering of urine samples and PCA analysis provided additional confirmation, clearly delineating between ICI-AIN and non-AIN samples (FIG. 22B). This underscored that the primary source of variability in these markers is the etiology of AKI. 6. Development of immune signatures [00235] To determine the optimal combination of proteins contributing to ICI-AIN or immune activation/irAE signatures, the inventors considered 3 sets of markers for construction: urine markers only, plasma markers only, and both urine and plasma markers.
- A. Logistic regression model with an ⁇ 1 sparsity-inducing penalty; B. ⁇ 100 repetitions of the logistic model with L1 penalty fit on bootstrap samples of the data. The fraction of times each marker is used in the model is recorded; C. Stepwise forward-selection with logistic regression and Akaike Information Criterion (AIC); and/or D. Classification and Regression Trees (CART) using default parameter settings. [00236] Based on the results of A-D for each marker set, the inventors selected 2 markers to construct a final signature using logistic regression. 7.
- Urine ICI-AIN signature IL-5 and FAS
- the logistic regression model selected features CXCL9, EGF, FAS, IL12P70, and IL5.
- IL5 and FAS emerged as the most frequently used features (in over 80% of models) in the bootstrap analysis (FIG. 23A).
- Forward stepwise selection identified features including IL5, FAS, and IL34 (FIG. 23B).
- Classification and Regression Trees (CART) using default parameter settings in R identified two features for the partition rule: FAS and IL5 (FIG.23C).
- the inventors constructed an ICI-AIN signature using logistic regression with the markers IL5 and FAS.
- the inventors calculated ROC curves for IL5, FAS, CXCL9, and the AIN Signature (FIG. 24A-B). Notably, this urine only, ICI-AIN Signature achieved the highest AUC value of 0.94, higher than any individual marker.
- the plot suggested that the performance of the signature can be attributed to the complementary nature of IL5 and FAS, where IL5 achieved very high sensitivity at reasonable specificity (100% sensitivity at > 50% specificity), and FAS achieved very high specificity at reasonable sensitivity (100% specificity at > 50% sensitivity) (FIG.24A). 8.
- Plasma immune activation/irAE signature IL36A and TNFRSF8 [00239] Using only plasma markers, the logistic regression model selected features IL36A, SPP1, TNFRSF8, and TREM1. IL36A was the most frequently selected feature in bootstrap analysis (67%) while several other features were selected in 41%-48% of models (e.g., SPP1, TNFRSF8, and CCL1) (FIG. 25A). Forward stepwise selection identified features including TNFRSF8, TNFRSF11, and IL36A (FIG.25B). CART analysis partitioned feature space using two features: CCL1 and IL27 (FIG.25C).
- the inventors constructed a plasma immune activation/irAE signature using logistic regression with the markers TNFRSF8 and IL36A.
- the inventors calculated ROC curves for TNFRSF8, IL36-A, CXCL9, and the AIN Signature (FIG.26A-B).
- the plasma Signature: IL36A and TNFRSF8 obtained an AUC value of 0.914, higher than any individual plasma marker (FIG.26A).
- Plasma + Urine immunotherapy signature FAS Urine and IL36A Plasma
- the inventors used both plasma and urine markers to conduct the logistic regression model which selected features such as CXCL9 Urine, IL36A Plasma, IL5 Urine, IL6 Urine, and TNFRSF8 Plasma.
- IL5 Urine was the most frequently selected marker in bootstrap analysis (89%) while other markers were all selected in fewer than 70% of models (FIG.27A).
- Forward stepwise selection identified IL5 Urine, CXCL9 Urine, and CEACAM5 Urine (FIG. 27B).
- Acute kidney injury associated with immune checkpoint inhibitor therapy incidence, risk factors and outcomes.
- Halimi JM Gatault P, Longuet H, Barbet C, Bisson A, Sautenet B, et al. Major Bleeding and Risk of Death after Percutaneous Native Kidney Biopsies: A French National Cohort Study.
- Presence of B cells in tertiary lymphoid structures is associated with a protective immunity in patients with lung cancer.
- Khan S Khan SA, Luo X, Fattah FJ, Saltarski J, Gloria-McCutchen Y, et al. Immune dysregulation in cancer patients developing immune-related adverse events.
Landscapes
- Life Sciences & Earth Sciences (AREA)
- Health & Medical Sciences (AREA)
- Engineering & Computer Science (AREA)
- Molecular Biology (AREA)
- Chemical & Material Sciences (AREA)
- Biomedical Technology (AREA)
- Urology & Nephrology (AREA)
- Hematology (AREA)
- Immunology (AREA)
- Biotechnology (AREA)
- Microbiology (AREA)
- Cell Biology (AREA)
- Proteomics, Peptides & Aminoacids (AREA)
- Food Science & Technology (AREA)
- Medicinal Chemistry (AREA)
- Physics & Mathematics (AREA)
- Analytical Chemistry (AREA)
- Biochemistry (AREA)
- General Health & Medical Sciences (AREA)
- General Physics & Mathematics (AREA)
- Pathology (AREA)
- Investigating Or Analysing Biological Materials (AREA)
Abstract
The current disclosure provides for improved methods of treating patients who have received immune checkpoint inhibitor (ICI) therapy and based on the finding that biomarkers can predict whether a subject experiencing adverse symptoms and undergoing ICI therapy is developing an irAE due to the ICI therapy or due to a pathology not directly related to the ICI therapy. The methods include a method for evaluating a subject comprising measuring the level of one or more biomarkers in a biological sample from the subject, wherein the biomarker(s) are one or more of IL5, CD274, TNFSF4, FAS, IL20, TSLP, TNFSF15, CCL1, IL6, TNF, CLEC4A, NCR1, FGF19, IL5RA, MUC16, CCL3, VCAM1, EPO, IFNL1, MMP3, IL9, IL16, IL36A, FLT1, IL18, IL12RB1, KITLG, LTF, CCL18, LCN2, CXCL13, S100A8, CXCL9, CD79A, CCR7, CXCL1, C3, TREM1, IL7R, CD19, LTB, MS4A1, SAA1, CXCL10, C1QB, TNFRSF17, CTLA4, CXCL6, CD27, CD38, CXCL11, CD163, FCGR3A, ITGAX, CD7, C1QA, RUNX3, SLAMF7, IRF4, SELL, ZAP70, CD48, SIGLEC1, PDCD1, IL2RB, JAK3, CTSS, CSF2RB, IL2RG, ISG20, EBI3, C2, ITGAL, CCR5, IDO1, LCP1, CD5, CD6, SH2D1A, CYBB, CCL5, IL10RA, VEGFC, IL13RA2, IL36G, MMP9, EGF, CTF1, CHI3L1, IL1R1, TNFRSF8, SPP1, IL15RA, TNFRSF1B, TNFRSF18, TNFRSF1A, CX3CL1, CD40, IL17A, TNFRSF14, CXADR, TNFRSF9, TNFRSF11A, TNFSF11, IL2RA, MDK, IL18BP, LTBR, SLURP1, CSF1, and IL33.
Description
METHODS FOR TREATING IMMUNE RELATED ADVERSE EVENTS BACKGROUND [0001] The present application claims priority to U.S. Provisional Application Serial No. 63/524,033 filed on June 29, 2023 and U.S. Provisional Application Serial No. 63/545,807 filed on October 26, 2023, the contents of which are incorporated by reference herein in their entirety. [0002] This invention was made with government support under DK119466 awarded by the National Institutes of Health. The government has certain rights in the invention. I. Field of the Invention [0003] The present invention relates generally to the fields of molecular biology and therapeutic diagnosis. More particularly, it concerns methods for diagnosing, treating, and monitoring subjects on immunotherapy. II. Background [0004] Immune checkpoint blockade (ICB – also called immune checkpoint inhibitor (ICI)) therapy can be a highly effective cancer treatment option but increasing T-cell activity can also increase T cell autoreactivity leading to the development of immune-related adverse events (irAEs). Over 60% of patients treated with immune checkpoint blockade will develop at least one irAE (4, 5). Since the development of irAEs is associated with increased immune activity, studies among more common irAEs, such as dermatitis, colitis and various endocrinopathies, are linked with increased ICI efficacy. Less is known, however, in patient outcomes for uncommon irAEs such as renal irAEs, which usually manifest as acute interstitial nephritis (AIN) (6). Although 15-20% of patients on immune checkpoint blockade will develop acute kidney injury (AKI), only 2-5% of cases will be AIN (6-8). Timely and accurate diagnosis of AIN is complicated due to the lack of non-invasive diagnostic tests; as such, kidney biopsy remains the gold standard. In patients with cancer, a kidney biopsy may not always be feasible and when performed may carry a significant risk of morbidity such as major bleeding complications in 1.6-5% of cases; consequently, steroid therapy is often initiated empirically for presumed ICI-AIN (9-13). While empiric steroid therapy is an option, this leads to discontinuation of ICI therapy potentially depriving life-saving treatment in cancer-responding patients. Difficulties in diagnosing AIN, the low frequency of ICI-AIN occurrence, and delays in AKI management contribute to the development of permanent functional kidney loss in over
pathophysiology of ICI-AIN will improve one’s ability to accurately diagnose AIN, enable prompt implementation of therapeutic strategies, and allow patients to restart on ICI therapy while monitoring for immune toxicity. SUMMARY [0005] The current disclosure provides for improved methods of identifying and treating patients with immune checkpoint inhibitor (ICI) therapy toxicity and response and is based on the finding that biomarkers can predict whether a subject experiencing adverse symptoms and undergoing ICI therapy is developing an immune-related adverse event (irAE) due to the ICI therapy or due to a pathology not directly related to the ICI therapy. The methods include a method for evaluating a subject comprising measuring the level of, of at least or of at most 1, 2, 3, 4, 5, 6, 7, 8, 9, 10, 11, 12, 13 ,14, 15, 16, 17, 18, 19, 20, 21, 22, 23, 24, 25, 26, 27, 28, 29, 30, 31, 32, 33, 34, 35, 36, 37, 38, 39, 40, 41, 42, 43, 44, 45, 46, 47, 48, 49, 50, 51, 52, 53, 54, 55, or 56 biomarkers (or any range derivable therein) in one or more biological sample(s) from the subject, wherein the biomarker(s) are IL5, CD274, TNFSF4, FAS, IL20, TSLP, TNFSF15, CCL1, IL6, TNF, CLEC4A, NCR1, FGF19, IL5RA, MUC16, CCL3, VCAM1, EPO, IFNL1, MMP3, IL9, IL16, IL36A, FLT1, IL18, IL12RB1, KITLG, LTF, CCL18, LCN2, CXCL13, S100A8, CXCL9, CD79A, CCR7, CXCL1, C3, TREM1, IL7R, CD19, LTB, MS4A1, SAA1, CXCL10, C1QB, TNFRSF17, CTLA4, CXCL6, CD27, CD38, CXCL11, CD163, FCGR3A, ITGAX, CD7, C1QA, RUNX3, SLAMF7, IRF4, SELL, ZAP70, CD48, SIGLEC1, PDCD1, IL2RB, JAK3, CTSS, CSF2RB, IL2RG, ISG20, EBI3, C2, ITGAL, CCR5, IDO1, LCP1, CD5, CD6, SH2D1A, CYBB, CCL5, IL10RA, VEGFC, IL13RA2, IL36G, MMP9, EGF, CTF1, CHI3L1, IL1R1, TNFRSF8, SPP1, IL15RA, TNFRSF1B, TNFRSF18, TNFRSF1A, CX3CL1, CD40, IL17A, TNFRSF14, CXADR, TNFRSF9, TNFRSF11A, TNFSF11, IL2RA, MDK, IL18BP, LTBR, SLURP1, CSF1, or IL33, or any combination thereof. Also described is a method for making an antibody-protein complex comprising contacting a biological sample from a subject with one or more antibodies that bind to 1, 2, 3, 4, 5, 6, 7, 8, 9, 10, 11, 12, 13 ,14, 15, 16, 17, 18, 19, 20, 21, 22, 23, 24, 25, 26, 27, 28, 29, 30, 31, 32, 33, 34, 35, 36, 37, 38, 39, 40, 41, 42, 43, 44, 45, 46, 47, 48, 49, 50, 51, 52, 53, 54, 55, or 56 biomarkers (or any range derivable therein), wherein the one or more biomarker(s) are IL5, CD274, TNFSF4, FAS, IL20, TSLP, TNFSF15, CCL1, IL6, TNF, CLEC4A, NCR1, FGF19, IL5RA, MUC16, CCL3, VCAM1, EPO, IFNL1, MMP3, IL9, IL16, IL36A, FLT1, IL18, IL12RB1, KITLG, LTF, CCL18, LCN2, CXCL13, S100A8, CXCL9, CD79A, CCR7, CXCL1, C3, TREM1, IL7R, CD19, LTB, MS4A1, SAA1, CXCL10, C1QB, TNFRSF17, CTLA4, CXCL6, CD27, CD38,
CXCL11, CD163, FCGR3A, ITGAX, CD7, C1QA, RUNX3, SLAMF7, IRF4, SELL, ZAP70, CD48, SIGLEC1, PDCD1, IL2RB, JAK3, CTSS, CSF2RB, IL2RG, ISG20, EBI3, C2, ITGAL, CCR5, IDO1, LCP1, CD5, CD6, SH2D1A, CYBB, CCL5, IL10RA, VEGFC, IL13RA2, IL36G, MMP9, EGF, CTF1, CHI3L1, IL1R1, TNFRSF8, SPP1, IL15RA, TNFRSF1B, TNFRSF18, TNFRSF1A, CX3CL1, CD40, IL17A, TNFRSF14, CXADR, TNFRSF9, TNFRSF11A, TNFSF11, IL2RA, MDK, IL18BP, LTBR, SLURP1, CSF1, and IL33. [0006] Methods include treating an immune related adverse event in a subject undergoing ICI therapy, the method comprising administering a non-ICI therapeutic agent to a subject that has had the level of 1, 2, 3, 4, 5, 6, 7, 8, 9, 10, 11, 12, 13 ,14, 15, 16, 17, 18, 19, 20, 21, 22, 23, 24, 25, 26, 27, 28, 29, 30, 31, 32, 33, 34, 35, 36, 37, 38, 39, 40, 41, 42, 43, 44, 45, 46, 47, 48, 49, 50, 51, 52, 53, 54, 55, or 56 biomarkers (or any range derivable therein) measured in one or more biological sample(s) from the subject, wherein the biomarker(s) are one or more of IL5, CD274, TNFSF4, FAS, IL20, TSLP, TNFSF15, CCL1, IL6, TNF, CLEC4A, NCR1, FGF19, IL5RA, MUC16, CCL3, VCAM1, EPO, IFNL1, MMP3, IL9, IL16, IL36A, FLT1, IL18, IL12RB1, KITLG, LTF, CCL18, LCN2, CXCL13, S100A8, CXCL9, CD79A, CCR7, CXCL1, C3, TREM1, IL7R, CD19, LTB, MS4A1, SAA1, CXCL10, C1QB, TNFRSF17, CTLA4, CXCL6, CD27, CD38, CXCL11, CD163, FCGR3A, ITGAX, CD7, C1QA, RUNX3, SLAMF7, IRF4, SELL, ZAP70, CD48, SIGLEC1, PDCD1, IL2RB, JAK3, CTSS, CSF2RB, IL2RG, ISG20, EBI3, C2, ITGAL, CCR5, IDO1, LCP1, CD5, CD6, SH2D1A, CYBB, CCL5, IL10RA, VEGFC, IL13RA2, IL36G, MMP9, EGF, CTF1, CHI3L1, IL1R1, TNFRSF8, SPP1, IL15RA, TNFRSF1B, TNFRSF18, TNFRSF1A, CX3CL1, CD40, IL17A, TNFRSF14, CXADR, TNFRSF9, TNFRSF11A, TNFSF11, IL2RA, MDK, IL18BP, LTBR, SLURP1, CSF1, and IL33. [0007] Methods also include managing or treating non-ICI induced kidney dysfunction in a subject undergoing ICI therapy, the method comprising administering a non-ICI therapeutic agent to a subject that has had the level of 1, 2, 3, 4, 5, 6, 7, 8, 9, 10, 11, 12, 13 ,14, 15, 16, 17, 18, 19, 20, 21, 22, 23, 24, 25, 26, 27, 28, 29, 30, 31, 32, 33, 34, 35, 36, 37, 38, 39, 40, 41, 42, 43, 44, 45, 46, 47, 48, 49, 50, 51, 52, 53, 54, 55, or 56 biomarkers (or any range derivable therein) measured in one or more biological sample(s) from the subject, wherein the biomarker(s) are one or more of IL5, CD274, TNFSF4, FAS, IL20, TSLP, TNFSF15, CCL1, IL6, TNF, CLEC4A, NCR1, FGF19, IL5RA, MUC16, CCL3, VCAM1, EPO, IFNL1, MMP3, IL9, IL16, IL36A, FLT1, IL18, IL12RB1, KITLG, LTF, CCL18, LCN2, CXCL13, S100A8, CXCL9, CD79A, CCR7, CXCL1, C3, TREM1, IL7R, CD19, LTB, MS4A1, SAA1, CXCL10, C1QB, TNFRSF17, CTLA4, CXCL6, CD27, CD38, CXCL11, CD163, FCGR3A, ITGAX,
CD7, C1QA, RUNX3, SLAMF7, IRF4, SELL, ZAP70, CD48, SIGLEC1, PDCD1, IL2RB, JAK3, CTSS, CSF2RB, IL2RG, ISG20, EBI3, C2, ITGAL, CCR5, IDO1, LCP1, CD5, CD6, SH2D1A, CYBB, CCL5, IL10RA, VEGFC, IL13RA2, IL36G, MMP9, EGF, CTF1, CHI3L1, IL1R1, TNFRSF8, SPP1, IL15RA, TNFRSF1B, TNFRSF18, TNFRSF1A, CX3CL1, CD40, IL17A, TNFRSF14, CXADR, TNFRSF9, TNFRSF11A, TNFSF11, IL2RA, MDK, IL18BP, LTBR, SLURP1, CSF1, and IL33. [0008] Methods include a method for treating kidney dysfunction in a subject, the method comprising administering an ICI therapy or administering a non-ICI therapeutic agent to a subject that has had the level of 1, 2, 3, 4, 5, 6, 7, 8, 9, 10, 11, 12, 13 ,14, 15, 16, 17, 18, 19, 20, 21, 22, 23, 24, 25, 26, 27, 28, 29, 30, 31, 32, 33, 34, 35, 36, 37, 38, 39, 40, 41, 42, 43, 44, 45, 46, 47, 48, 49, 50, 51, 52, 53, 54, 55, or 56 biomarkers (or any range derivable therein) measured in one or more biological sample(s) from the subject, wherein the biomarker(s) are one or more of IL5, CD274, TNFSF4, FAS, IL20, TSLP, TNFSF15, CCL1, IL6, TNF, CLEC4A, NCR1, FGF19, IL5RA, MUC16, CCL3, VCAM1, EPO, IFNL1, MMP3, IL9, IL16, IL36A, FLT1, IL18, IL12RB1, KITLG, LTF, CCL18, LCN2, CXCL13, S100A8, CXCL9, CD79A, CCR7, CXCL1, C3, TREM1, IL7R, CD19, LTB, MS4A1, SAA1, CXCL10, C1QB, TNFRSF17, CTLA4, CXCL6, CD27, CD38, CXCL11, CD163, FCGR3A, ITGAX, CD7, C1QA, RUNX3, SLAMF7, IRF4, SELL, ZAP70, CD48, SIGLEC1, PDCD1, IL2RB, JAK3, CTSS, CSF2RB, IL2RG, ISG20, EBI3, C2, ITGAL, CCR5, IDO1, LCP1, CD5, CD6, SH2D1A, CYBB, CCL5, IL10RA, VEGFC, IL13RA2, IL36G, MMP9, EGF, CTF1, CHI3L1, IL1R1, TNFRSF8, SPP1, IL15RA, TNFRSF1B, TNFRSF18, TNFRSF1A, CX3CL1, CD40, IL17A, TNFRSF14, CXADR, TNFRSF9, TNFRSF11A, TNFSF11, IL2RA, MDK, IL18BP, LTBR, SLURP1, CSF1, and IL33. [0009] Also described is a method for diagnosing or prognosing a subject with kidney dysfunction, the method comprising: a) measuring the level of 1, 2, 3, 4, 5, 6, 7, 8, 9, 10, 11, 12, 13 ,14, 15, 16, 17, 18, 19, 20, 21, 22, 23, 24, 25, 26, 27, 28, 29, 30, 31, 32, 33, 34, 35, 36, 37, 38, 39, 40, 41, 42, 43, 44, 45, 46, 47, 48, 49, 50, 51, 52, 53, 54, 55, or 56 biomarkers (or any range derivable therein) in one or more biological sample(s) from the subject; and b) diagnosing or prognosing the subject with ICI induced kidney dysfunction or non-ICI induced kidney dysfunction based on the measured level of the biomarker(s), wherein the biomarker(s) are one or more of IL5, CD274, TNFSF4, FAS, IL20, TSLP, TNFSF15, CCL1, IL6, TNF, CLEC4A, NCR1, FGF19, IL5RA, MUC16, CCL3, VCAM1, EPO, IFNL1, MMP3, IL9, IL16, IL36A, FLT1, IL18, IL12RB1, KITLG, LTF, CCL18, LCN2, CXCL13, S100A8, CXCL9, CD79A, CCR7, CXCL1, C3, TREM1, IL7R, CD19, LTB, MS4A1, SAA1, CXCL10, C1QB,
TNFRSF17, CTLA4, CXCL6, CD27, CD38, CXCL11, CD163, FCGR3A, ITGAX, CD7, C1QA, RUNX3, SLAMF7, IRF4, SELL, ZAP70, CD48, SIGLEC1, PDCD1, IL2RB, JAK3, CTSS, CSF2RB, IL2RG, ISG20, EBI3, C2, ITGAL, CCR5, IDO1, LCP1, CD5, CD6, SH2D1A, CYBB, CCL5, IL10RA, VEGFC, IL13RA2, IL36G, MMP9, EGF, CTF1, CHI3L1, IL1R1, TNFRSF8, SPP1, IL15RA, TNFRSF1B, TNFRSF18, TNFRSF1A, CX3CL1, CD40, IL17A, TNFRSF14, CXADR, TNFRSF9, TNFRSF11A, TNFSF11, IL2RA, MDK, IL18BP, LTBR, SLURP1, CSF1, and IL33. [0010] Also included is a method of monitoring a subject that has been administered ICI therapy, the method comprising: a) measuring the level of 1, 2, 3, 4, 5, 6, 7, 8, 9, 10, 11, 12, 13 ,14, 15, 16, 17, 18, 19, 20, 21, 22, 23, 24, 25, 26, 27, 28, 29, 30, 31, 32, 33, 34, 35, 36, 37, 38, 39, 40, 41, 42, 43, 44, 45, 46, 47, 48, 49, 50, 51, 52, 53, 54, 55, or 56 biomarkers (or any range derivable therein) in one or more biological sample(s) from the subject; and b) administering ICI therapy or an additional therapeutic agent that excludes ICI therapy based on the measured level of the one or more biomarkers, wherein the biomarker(s) are one or more of IL5, CD274, TNFSF4, FAS, IL20, TSLP, TNFSF15, CCL1, IL6, TNF, CLEC4A, NCR1, FGF19, IL5RA, MUC16, CCL3, VCAM1, EPO, IFNL1, MMP3, IL9, IL16, IL36A, FLT1, IL18, IL12RB1, KITLG, LTF, CCL18, LCN2, CXCL13, S100A8, CXCL9, CD79A, CCR7, CXCL1, C3, TREM1, IL7R, CD19, LTB, MS4A1, SAA1, CXCL10, C1QB, TNFRSF17, CTLA4, CXCL6, CD27, CD38, CXCL11, CD163, FCGR3A, ITGAX, CD7, C1QA, RUNX3, SLAMF7, IRF4, SELL, ZAP70, CD48, SIGLEC1, PDCD1, IL2RB, JAK3, CTSS, CSF2RB, IL2RG, ISG20, EBI3, C2, ITGAL, CCR5, IDO1, LCP1, CD5, CD6, SH2D1A, CYBB, CCL5, IL10RA, VEGFC, IL13RA2, IL36G, MMP9, EGF, CTF1, CHI3L1, IL1R1, TNFRSF8, SPP1, IL15RA, TNFRSF1B, TNFRSF18, TNFRSF1A, CX3CL1, CD40, IL17A, TNFRSF14, CXADR, TNFRSF9, TNFRSF11A, TNFSF11, IL2RA, MDK, IL18BP, LTBR, SLURP1, CSF1, and IL33. [0011] The disclosure also describes kits comprising agents for detecting one or more biomarker(s), wherein the biomarker(s) are one or more of IL5, CD274, TNFSF4, FAS, IL20, TSLP, TNFSF15, CCL1, IL6, TNF, CLEC4A, NCR1, FGF19, IL5RA, MUC16, CCL3, VCAM1, EPO, IFNL1, MMP3, IL9, IL16, IL36A, FLT1, IL18, IL12RB1, KITLG, LTF, CCL18, LCN2, CXCL13, S100A8, CXCL9, CD79A, CCR7, CXCL1, C3, TREM1, IL7R, CD19, LTB, MS4A1, SAA1, CXCL10, C1QB, TNFRSF17, CTLA4, CXCL6, CD27, CD38, CXCL11, CD163, FCGR3A, ITGAX, CD7, C1QA, RUNX3, SLAMF7, IRF4, SELL, ZAP70, CD48, SIGLEC1, PDCD1, IL2RB, JAK3, CTSS, CSF2RB, IL2RG, ISG20, EBI3, C2, ITGAL, CCR5, IDO1, LCP1, CD5, CD6, SH2D1A, CYBB, CCL5, IL10RA, VEGFC, IL13RA2,
IL36G, MMP9, EGF, CTF1, CHI3L1, IL1R1, TNFRSF8, SPP1, IL15RA, TNFRSF1B, TNFRSF18, TNFRSF1A, CX3CL1, CD40, IL17A, TNFRSF14, CXADR, TNFRSF9, TNFRSF11A, TNFSF11, IL2RA, MDK, IL18BP, LTBR, SLURP1, CSF1, and IL33. [0012] The biological sample may comprise or exclude urine, serum, plasma, tissue, and/or any other body fluid sample. The biological sample may comprise a urine sample. The biological sample may comprise a plasma sample. The biological sample may comprise a urine and plasma sample. The methods may include measuring, evaluating, and/or determining the protein level of the biomarker(s). The methods may include measuring, evaluating, and/or determining the mRNA level of the biomarker(s). The level of the biomarker(s) may be measured, determined, and/or evaluated using any protein or RNA detection assays that may include or exclude ELISA, NULISA, electromagnetic or electrochemical immunosensor and/or lateral flow or Luminex assay. [0013] At least the level of IL33 may be measured, and/or a biomarker may comprise at least IL33. At least the level of CSF1 may be measured, and/or a biomarker may comprise at least CSF1. At least the level of SLURP1 may be measured, and/or a biomarker may comprise at least SLURP1. At least the level of LTBR may be measured, and/or a biomarker may comprise at least LTBR. At least the level of IL18BP may be measured, and/or a biomarker may comprise at least IL18BP. At least the level of VEGFC may be measured, and/or a biomarker may comprise at least VEGFC. At least the level of IL13RA2 may be measured, and/or a biomarker may comprise at least IL13RA2. At least the level of MDK may be measured, and/or a biomarker may comprise at least MDK. At least the level of IL2RA may be measured, and/or a biomarker may comprise at least IL2RA. At least the level of TNFRSF11A may be measured, and/or a biomarker may comprise at least TNFRSF11A. At least the level of TNFRSF9 may be measured, and/or a biomarker may comprise at least TNFRSF9. At least the level of CXADR may be measured, and/or a biomarker may comprise at least CXADR. At least the level of IL36G may be measured, and/or a biomarker may comprise at least IL36G. At least the level of MMP9 may be measured, and/or a biomarker may comprise at least MMP9. At least the level of TNFRSF14 may be measured, and/or a biomarker may comprise at least TNFRSF14. At least the level of IL17A may be measured, and/or a biomarker may comprise at least IL17A. At least the level of CD40 may be measured, and/or a biomarker may comprise at least CD40. At least the level of CX3CL1 may be measured, and/or a biomarker may comprise at least CX3CL1. At least the level of TNFRSF1A may be measured, and/or a biomarker may comprise at least TNFRSF1A. At least the level of TREM1 may be measured, and/or a biomarker may comprise at least TREM1. At least the level
of EGF may be measured, and/or a biomarker may comprise at least EGF. At least the level of CTF1 may be measured, and/or a biomarker may comprise at least CTF1. At least the level of CHI3L1 may be measured, and/or a biomarker may comprise at least CHI3L1. At least the level of IL1R1 may be measured, and/or a biomarker may comprise at least IL1R1. At least the level of TNFRSF8 may be measured, and/or a biomarker may comprise at least TNFRSF8. At least the level of SPP1 may be measured, and/or a biomarker may comprise at least SPP1. At least the level of IL15RA may be measured, and/or a biomarker may comprise at least IL15RA. At least the level of TNFRSF1B may be measured, and/or a biomarker may comprise at least TNFRSF1B. At least the level of TNFRSF18 may be measured, and/or a biomarker may comprise at least TNFRSF18. At least the level of IL5 may be measured, and/or a biomarker may comprise at least IL5. At least the level of CD274 may be measured, and/or a biomarker may comprise at least CD274. At least the level of TNFSF4 may be measured, and/or a biomarker may comprise at least TNFSF4. At least the level of FAS may be measured, and/or a biomarker may comprise at least FAS. At least the level of IL20 may be measured, and/or a biomarker may comprise at least IL20. At least the level of TSLP may be measured, and/or a biomarker may comprise at least TSLP. At least the level of TNFSF15 may be measured, and/or a biomarker may comprise at least TNFSF15. At least the level of CCL1 may be measured, and/or a biomarker may comprise at least CCL1. At least the level of IL6 may be measured, and/or a biomarker may comprise at least IL6. At least the level of TNF may be measured, and/or a biomarker may comprise at least TNF. At least the level of CLEC4A may be measured, and/or a biomarker may comprise at least CLEC4A. At least the level of NCR1 may be measured, and/or a biomarker may comprise at least NCR1. At least the level of FGF19 may be measured, and/or a biomarker may comprise at least FGF19. At least the level of IL5RA may be measured, and/or a biomarker may comprise at least IL5RA. At least the level of MUC16 may be measured, and/or a biomarker may comprise at least MUC16. At least the level of CCL3 may be measured, and/or a biomarker may comprise at least CCL3. At least the level of VCAM1 may be measured, and/or a biomarker may comprise at least VCAM1. At least the level of EPO may be measured, and/or a biomarker may comprise at least EPO. At least the level of IFNL1 may be measured, and/or a biomarker may comprise at least IFNL1. At least the level of MMP3 may be measured, and/or a biomarker may comprise at least MMP3. At least the level of IL9 may be measured, and/or a biomarker may comprise at least IL9. At least the level of IL16 may be measured, and/or a biomarker may comprise at least IL16. At least the level of IL36A may be measured, and/or a biomarker may comprise at least IL36A. At least the level of FLT1 may be measured, and/or a biomarker may comprise at least FLT1. At least
the level of IL18 may be measured, and/or a biomarker may comprise at least IL18. At least the level of IL12RB1 may be measured, and/or a biomarker may comprise at least IL12RB1. At least the level of KITLG may be measured, and/or a biomarker may comprise at least KITLG. At least the level of LTF may be measured, and/or a biomarker may comprise at least LTF. At least the level of CCL18 may be measured, and/or a biomarker may comprise at least CCL18. At least the level of LCN2 may be measured, and/or a biomarker may comprise at least LCN2. At least the level of CXCL13 may be measured, and/or a biomarker may comprise at least CXCL13. At least the level of S100A8 may be measured, and/or a biomarker may comprise at least S100A8. At least the level of CXCL9 may be measured, and/or a biomarker may comprise at least CXCL9. At least the level of CD79A may be measured, and/or a biomarker may comprise at least CD79A. At least the level of CCR7 may be measured, and/or a biomarker may comprise at least CCR7. At least the level of CXCL1 may be measured, and/or a biomarker may comprise at least CXCL1. At least the level of CTLA4 may be measured, and/or a biomarker may comprise at least CTLA4. At least the level of C3 may be measured, and/or a biomarker may comprise at least C3. At least the level of TREM1 may be measured, and/or a biomarker may comprise at least TREM1. At least the level of IL7R may be measured, and/or a biomarker may comprise at least IL7R. At least the level of CD19 may be measured, and/or a biomarker may comprise at least CD19. At least the level of LTB may be measured, and/or a biomarker may comprise at least LTB. At least the level of MS4A1 may be measured, and/or a biomarker may comprise at least MS4A1. At least the level of SAA1 may be measured, and/or a biomarker may comprise at least SAA1. At least the level of CXCL10 may be measured, and/or a biomarker may comprise at least CXCL10. At least the level of C1QB may be measured, and/or a biomarker may comprise at least C1QB. At least the level of TNFRSF17 may be measured, and/or a biomarker may comprise at least TNFRSF17. At least the level of CXCL6 may be measured, and/or a biomarker may comprise at least CXCL6. At least the level of CD27 may be measured, and/or a biomarker may comprise at least CD27. At least the level of CD38 may be measured, and/or a biomarker may comprise at least CD38. At least the level of CXCL11 may be measured, and/or a biomarker may comprise at least CXCL11. At least the level of CD163 may be measured, and/or a biomarker may comprise at least CD163. At least the level of FCGR3A may be measured, and/or a biomarker may comprise at least FCGR3A. At least the level of ITGAX may be measured, and/or a biomarker may comprise at least ITGAX. At least the level of CD7 may be measured, and/or a biomarker may comprise at least CD7. At least the level of C1QA may be measured, and/or a biomarker may comprise at least C1QA. At least the level of RUNX3 may be measured, and/or a biomarker may comprise at
least RUNX3. At least the level of SLAMF7 may be measured, and/or a biomarker may comprise at least SLAMF7. At least the level of IRF4 may be measured, and/or a biomarker may comprise at least IRF4. At least the level of SELL may be measured, and/or a biomarker may comprise at least SELL. At least the level of ZAP70 may be measured, and/or a biomarker may comprise at least ZAP70. At least the level of CD48 may be measured, and/or a biomarker may comprise at least CD48. At least the level of SIGLEC1 may be measured, and/or a biomarker may comprise at least SIGLEC1. At least the level of PDCD1 may be measured, and/or a biomarker may comprise at least PDCD1. At least the level of IL2RB may be measured, and/or a biomarker may comprise at least IL2RB. At least the level of JAK3 may be measured, and/or a biomarker may comprise at least JAK3. At least the level of CTSS may be measured, and/or a biomarker may comprise at least CTSS. At least the level of CSF2RB may be measured, and/or a biomarker may comprise at least CSF2RB. At least the level of IL2RG may be measured, and/or a biomarker may comprise at least IL2RG. At least the level of ISG20 may be measured, and/or a biomarker may comprise at least ISG20. At least the level of EBI3 may be measured, and/or a biomarker may comprise at least EBI3. At least the level of C2 may be measured, and/or a biomarker may comprise at least C2. At least the level of ITGAL may be measured, and/or a biomarker may comprise at least ITGAL. At least the level of CCR5 may be measured, and/or a biomarker may comprise at least CCR5. At least the level of IDO1 may be measured, and/or a biomarker may comprise at least IDO1. At least the level of LCP1 may be measured, and/or a biomarker may comprise at least LCP1. At least the level of CD5 may be measured, and/or a biomarker may comprise at least CD5. At least the level of CD6 may be measured, and/or a biomarker may comprise at least CD6. At least the level of SH2D1A may be measured, and/or a biomarker may comprise at least SH2D1A. At least the level of CYBB may be measured, and/or a biomarker may comprise at least CYBB. At least the level of CCL5 may be measured, and/or a biomarker may comprise at least CCL5. At least the level of IL10RA8 may be measured, and/or a biomarker may comprise at least IL10RA8. [0014] At least the levels of IL5 and FAS may be measured, and/or biomarkers may comprise at least or consist of IL5 and FAS. At least the levels of IL36A and TNFRSF8 may be measured, and/or biomarkers may comprise at least or consist of IL36A and TNFRSF8. At least the levels of IL5 and CXCL9 are measured and/or the biomarker(s) may comprise at least or consist of IL5 and CXCL9. At least the levels of FAS and TNFSF15 are measured and/or the biomarker(s) may comprise at least or consist of FAS and TNFSF15. At least the levels of FAS and TNFSF4 are measured and/or the biomarker(s) may comprise at least or consist of FAS and TNFSF4. At least the levels of FAS and IL20 are measured and/or the biomarker(s)
may comprise at least or consist of FAS and IL20. At least the levels of FAS and TNF are measured and/or the biomarker(s) may comprise at least or consist of FAS and TNF. At least the levels of FAS and TSLP are measured and/or the biomarker(s) may comprise at least or consist of FAS and TSLP. At least the levels of IL5 and TSLP are measured and/or the biomarker(s) may comprise at least or consist of IL5 and TSLP. At least the levels of IL5 and CCL1 are measured and/or the biomarker(s) may comprise at least or consist of IL5 and CCL1. At least the levels of FAS and CCL1 are measured and/or the biomarker(s) may comprise at least or consist of FAS and CCL1. At least the levels of TNFSF4 and CXCL9 are measured and/or the biomarker(s) may comprise at least or consist of TNFSF4 and CXCL9. At least the levels of IL5 and IL20 are measured and/or the biomarker(s) may comprise at least or consist of IL5 and IL20. At least the levels of IL5 and TNFSF15 are measured and/or the biomarker(s) may comprise at least or consist of IL5 and TNFSF15. At least the levels of IL5 and TNF are measured and/or the biomarker(s) may comprise at least or consist of IL5 and TNF. At least the levels of IL5 and TNFSF4 are measured and/or the biomarker(s) may comprise at least or consist of IL5 and TNFSF4. At least the levels of IL5 and IL9 are measured and/or the biomarker(s) may comprise at least or consist of IL5 and IL9. At least the levels of FAS and CXCL9 are measured and/or the biomarker(s) may comprise at least or consist of FAS and CXCL9. At least the levels of CXCL9 and IL20 are measured and/or the biomarker(s) may comprise at least or consist of CXCL9 and IL20. At least the levels of FAS and IL9 are measured and/or the biomarker(s) may comprise at least or consist of FAS and IL9. At least the levels of CXCL9 and TNFSF15 are measured and/or the biomarker(s) may comprise at least or consist of CXCL9 and TNFSF15. At least the levels of TNF and TNFSF4 are measured and/or the biomarker(s) may comprise at least or consist of TNF and TNFSF4. At least the levels of wherein CXCL9 and CCL1 are measured and/or the biomarker(s) may comprise at least or consist of CXCL9 and CCL1. At least the levels of wherein TNFSF4 and TSLP are measured and/or the biomarker(s) may comprise at least or consist of TNFSF4 and TSLP. At least the levels of TNF and TNFSF15 are measured and/or the biomarker(s) may comprise at least or consist of TNF and TNFSF15. At least the levels of IL20 and CCL1 are measured and/or the biomarker(s) may comprise at least or consist of IL20 and CCL1. At least the levels of wherein TNF and IL20 are measured and/or the biomarker(s) may comprise at least or consist of TNF and IL20. At least the levels of wherein IL20 and TNFSF15 are measured and/or the biomarker(s) may comprise at least or consist of IL20 and TNFSF15. At least the levels of TNFSF4 and IL20 are measured and/or the biomarker(s) may comprise at least or consist of TNFSF4 and IL20. At least the levels of TNFSF4 and CCL1 are measured and/or the
biomarker(s) may comprise at least or consist of TNFSF4 and CCL1. At least the levels of TNF and CXCL9 are measured and/or the biomarker(s) may comprise at least or consist of TNF and CXCL9. At least the levels of CXCL9 and TSLP are measured and/or the biomarker(s) may comprise at least or consist of CXCL9 and TSLP. At least the levels of IL20 and IL9 are measured and/or the biomarker(s) may comprise at least or consist of IL20 and IL9. At least the levels of TNFSF4 and TNFSF15 are measured and/or the biomarker(s) may comprise at least or consist of TNFSF4 and TNFSF15. At least the levels of CXCL9 and IL9 are measured and/or the biomarker(s) may comprise at least or consist of CXCL9 and IL9. At least the levels of TNFSF4 and IL9 are measured and/or the biomarker(s) may comprise at least or consist of TNFSF4 and IL9. At least the levels of IL20 and TSLP are measured and/or the biomarker(s) may comprise at least or consist of IL20 and TSLP. At least the levels of TNFSF15 and CCL1 are measured and/or the biomarker(s) may comprise at least or consist of TNFSF15 and CCL1. At least the levels of TNFSF15 and TSLP are measured and/or the biomarker(s) may comprise at least or consist of TNFSF15 and TSLP. At least the levels of TNFSF15 and IL9 are measured and/or the biomarker(s) may comprise at least or consist of TNFSF15 and IL9. At least the levels of TNF and TSLP are measured and/or the biomarker(s) may comprise at least or consist of TNF and TSLP. At least the levels of TNF and CCL1 are measured and/or the biomarker(s) may comprise at least or consist of TNF and CCL1. At least the levels of TNF and IL9 are measured and/or the biomarker(s) may comprise at least or consist of TNF and IL9. At least the levels of TSLP and CCL1 are measured and/or the biomarker(s) may comprise at least or consist of TSLP and CCL1. At least the levels of TSLP and IL9 are measured and/or the biomarker(s) may comprise at least or consist of TSLP and IL9. At least the levels of CCL1 and IL9 are measured and/or the biomarker(s) may comprise at least or consist of CCL1 and IL9. At least the levels of CCL1 and IL27 are measured and/or the biomarker(s) may comprise at least or consist of CCL1 and IL27. At least the levels of TNFRSF8 and TNFSF11 are measured and/or the biomarker(s) may comprise at least or consist of TNFRSF8 and TNFSF11. At least the levels of TNFSF11 and IL36A are measured and/or the biomarker(s) may comprise at least or consist of TNFSF11 and IL36A. [0015] At least the levels of FAS and IL36A may be measured, and/or biomarkers may comprise at least or consist of FAS and IL36A. At least the levels of FAS may be measured from a urine sample, and/or a urine biomarker may comprise FAS. At least the levels of IL36A may be measured from a plasma sample, and/or a plasma biomarker may comprise IL36A. At least the levels of FAS may be measured from a urine sample and the levels of IL36A may be measured from a plasma sample, and/or a urine biomarker may comprise FAS and a plasma
biomarker may comprise IL36A. At least the levels of CXCL9 and TNFRSF8 are measured and/or biomarkers may comprise at least or consist of CXCL9 and TNFRSF8. At least the levels of CXCL9 may be measured from a urine sample, and/or a urine biomarker may comprise FAS. At least the levels of TNFRSF8 may be measured from a plasma sample, and/or a plasma biomarker may comprise TNFRSF8. At least the levels of IL5 and IL36A may be measured, and/or biomarkers may comprise at least or consist of IL5 and IL36A. At least the levels of IL5 may be measured from a urine sample, and/or a urine biomarker may comprise IL5. At least the levels of IL5 may be measured from a urine sample and the levels of IL36A may be measured from a plasma sample, and/or a urine biomarker may comprise IL5 and a plasma biomarker may comprise IL36A. At least the levels of CXCL9 and IL36A may be measured, and/or biomarkers may comprise at least or consist of CXCL9 and IL36A. At least the levels of CXCL9 may be measured from a urine sample, and/or a urine biomarker may comprise CXCL9. At least the levels of CXCL9 may be measured from a urine sample and the levels of IL36A may be measured from a plasma sample, and/or a urine biomarker may comprise CXCL9 and a plasma biomarker may comprise IL36A. At least the levels of FAS and TNFRSF8 may be measured, and/or biomarkers may comprise at least or consist of FAS and TNFRSF8. At least the levels of FAS may be measured from a urine sample and the levels of TNFRSF8 may be measured from a plasma sample, and/or a urine biomarker may comprise FAS and a plasma biomarker may comprise TNFRSF8. [0016] The biomarker may consist of one of IL5, CD274, TNFSF4, FAS, IL20, TSLP, TNFSF15, CCL1, IL6, TNF, CLEC4A, NCR1, FGF19, IL5RA, MUC16, CCL3, VCAM1, EPO, IFNL1, MMP3, IL9, IL16, IL36A, FLT1, IL18, IL12RB1, KITLG, LTF, CCL18, LCN2, CXCL13, S100A8, CXCL9, CD79A, CCR7, CXCL1, C3, TREM1, IL7R, CD19, LTB, MS4A1, SAA1, CXCL10, C1QB, TNFRSF17, CTLA4, CXCL6, CD27, CD38, CXCL11, CD163, FCGR3A, ITGAX, CD7, C1QA, RUNX3, SLAMF7, IRF4, SELL, ZAP70, CD48, SIGLEC1, PDCD1, IL2RB, JAK3, CTSS, CSF2RB, IL2RG, ISG20, EBI3, C2, ITGAL, CCR5, IDO1, LCP1, CD5, CD6, SH2D1A, CYBB, CCL5, IL10RA, VEGFC, IL13RA2, IL36G, MMP9, EGF, CTF1, CHI3L1, IL1R1, TNFRSF8, SPP1, IL15RA, TNFRSF1B, TNFRSF18, TNFRSF1A, CX3CL1, CD40, IL17A, TNFRSF14, CXADR, TNFRSF9, TNFRSF11A, TNFSF11, IL2RA, MDK, IL18BP, LTBR, SLURP1, CSF1, and IL33. The biomarker(s) may comprise or consist of 1, 2, 3, 4, 5, 6, 7, 8, 9, 10, 11, 12, 13 ,14, 15, 16, 17, 18, 19, 20, 21, 22, 23, 24, 25, 26, 27, 28, 29, 30, 31, 32, 33, 34, 35, 36, 37, 38, 39, 40, 41, 42, 43, 44, 45, 46, 47, 48, 49, 50, 51, 52, 53, 54, 55, or 56 of IL5, CD274, TNFSF4, FAS, IL20, TSLP, TNFSF15, CCL1, IL6, TNF, CLEC4A, NCR1, FGF19, IL5RA, MUC16, CCL3, VCAM1, EPO, IFNL1,
MMP3, IL9, IL16, IL36A, FLT1, IL18, IL12RB1, KITLG, LTF, CCL18, LCN2, CXCL13, S100A8, CXCL9, CD79A, CCR7, CXCL1, C3, TREM1, IL7R, CD19, LTB, MS4A1, SAA1, CXCL10, C1QB, TNFRSF17, CTLA4, CXCL6, CD27, CD38, CXCL11, CD163, FCGR3A, ITGAX, CD7, C1QA, RUNX3, SLAMF7, IRF4, SELL, ZAP70, CD48, SIGLEC1, PDCD1, IL2RB, JAK3, CTSS, CSF2RB, IL2RG, ISG20, EBI3, C2, ITGAL, CCR5, IDO1, LCP1, CD5, CD6, SH2D1A, CYBB, CCL5, IL10RA, VEGFC, IL13RA2, IL36G, MMP9, EGF, CTF1, CHI3L1, IL1R1, TNFRSF8, SPP1, IL15RA, TNFRSF1B, TNFRSF18, TNFRSF1A, CX3CL1, CD40, IL17A, TNFRSF14, CXADR, TNFRSF9, TNFRSF11A, TNFSF11, IL2RA, MDK, IL18BP, LTBR, SLURP1, CSF1, and IL33, or any combination or derivable range therein. [0017] The one or more biological sample(s) may be from a subject who has been administered immune checkpoint inhibitor (ICI) therapy. The one or more biological sample(s) may be from a subject who has been administered at least one dose of ICI therapy. The subject may have been administered or administered at least 1, 2, 3, 4, 5, or 6 doses of ICI therapy within a time period of at least or at most 1, 2, 3, 4, 5, 6, 7 days or 1, 2, 3, 4, 5, 6, 7, 8, 9, 10, 11, 12 weeks or 1, 2, 3, 4, 5, 6, 7, 8, 9, 10, 11, 12, 13, 14, 15, 16, 17, 18, 19, 20, 21, 22, 23, 24, 25, 26, 27, 28, 29, or 30 months, or any derivable range therein. The ICI therapy may comprise a monotherapy or a combination ICI therapy. The ICI therapy may comprise an inhibitor of PD-1, PDL1, PDL2, CTLA-4, B7-1, B7-2, LAG3, and/or TIGIT. The ICI therapy may comprise an anti-PD-1 monoclonal antibody and/or an anti-CTLA-4 monoclonal antibody. The ICI therapy may comprise one or more of nivolumab, atezolizumab, avelumab, durvalumab, cemiplimab, pembrolizumab, pidilizumab, ipilimumab, tremelimumab, relatimab, opdualag, tebotelimab, favezelimab, eftilagimod, ieramilimab, fianlimab, tiragolumab, vibostolimab, domvanalimab and/or etigilimab. The ICI therapy may exclude a monotherapy, combination ICI therapy, and/or an inhibitor of PD-1, PDL1, PDL2, CTLA-4, B7-1, B7-2, LAG3, and/or TIGIT. The ICI therapy may exclude an anti-PD-1 monoclonal antibody and/or an anti-CTLA- 4 monoclonal antibody. The ICI therapy may exclude one or more of nivolumab, atezolizumab, avelumab, durvalumab, cemiplimab, pembrolizumab, pidilizumab, ipilimumab, tremelimumab, relatimab, opdualag, tebotelimab, favezelimab, eftilagimod, ieramilimab, fianlimab, tiragolumab, vibostolimab, domvanalimab and/or etigilimab. [0018] The one or more biological sample(s) may be from a subject with an immune-related adverse event (irAE). The one or more biological sample(s) may be from a subject that is suspected to have an irAE. The irAE may comprise acute interstitial nephritis (AIN) or another inflammatory lesion. The one or more biological sample(s) may be from a subject that has symptoms of kidney dysfunction. The one or more biological sample(s) may be from a subject
that does not have symptoms of kidney dysfunction. Symptoms include, for example, hematuria, proteinuria, pyuria, hypertension, edema, oliguria, reduced kidney function, pulmonary edema, and/or heart failure. The biological sample may be from a subject that has cancer. Kidney dysfunction may include acute kidney injury. The subject may be one that has been determined to have an increase in serum creatinine. The subject may be one that has been determined to have a ≥ 1.5-fold increase in serum creatinine. The subject may be one that has been determined to have greater than and/or equal increase in serum creatinine of or of at least 0.5, 1, 1.5, 2, 2.5, or 3-fold compared to the normal level. [0019] The biomarker may be further defined as a biomarker for AIN vs. non-AIN with an area under the curve (AUC) value of greater than 0.5. The biomarker may be further defined as a biomarker for AIN vs. non-AIN with an AUC value of greater than 0.85. The biomarker may be further defined as a biomarker for AIN vs. non-AIN with an AUC value of greater than 0.8. The biomarker may be defined as a biomarker for AIN vs. non-AIN with an area under the curve (AUC) value of or of greater than 0.5, 0.51, 0.52, 0.53, 0.54, 0.55, 0.56, 0.57, 0.58, 0.59, 0.6, 0.61, 0.62, 0.63, 0.64, 0.65, 0.66, 0.67, 0.68, 0.69, 0.7, 0.71, 0.72, 0.73, 0.74, 0.75, 0.76, 0.77, 0.78, 0.79, 0.8, 0.81, 0.82, 0.83, 0.84, 0.85, 0.86, 0.87, 0.88, 0.89, 0.9, 0.91, 0.92, 0.93, 0.94, 0.95, 0.96, 0.97, 0.98, 0.99, or any derivable range therein. The methods may comprise measuring, evaluating, and/or determining the level of at least 5 biomarkers described herein. The method may comprise measuring, evaluating, and/or determining the level of, of at least, or of at most 1, 2, 3, 4, 5, 6, 7, 8, 9, 10, 11, 12, 13, 14, 15, 16, 17, 18, 19, 20, 21, 22, 23, 24, 25, 26, 27, 28, 29, 30, 31, 32, 33, 34, 35, 36, 37, 38, 39, 40, 41, 42, 43, 44, 45, 46, 47, 48, 49, 50, 51, 52, 53, 54, 55, 56, or 57 biomarkers, or any range derivable therein. Measuring the biomarker may comprise measuring or determining the concentration of the protein or nucleic acid of the biomarker in a biological sample. [0020] The methods may comprise or further comprise comparing the measured, evaluated, and/or determined level of the biomarker(s) to a control. The level of the biomarker(s) may be determined to be increased relative to a control. The level of the biomarker(s) may be determined to be decreased relative to a control. The level of the biomarker(s) may be determined to be the same or not significantly different than a control. The control may comprise the level of the biomarker(s) in a biological sample from a subject determined to have non-ICI induced kidney dysfunction, a biological sample from a subject determined to not have kidney dysfunction, or a biological sample from a subject that has been administered ICI therapy and has been determined to have non-ICI induced kidney dysfunction. The control may comprise the level of the biomarker(s) in a biological sample from a subject determined to have
ICI induced kidney dysfunction, a biological sample from a subject determined to have kidney dysfunction, or a biological sample from a subject that has been administered ICI therapy and has been determined to have ICI induced kidney dysfunction. The control may comprise a biological sample from a subject that is on ICI therapy. The control may comprise the level of biomarker in a biological sample from a subject previously treated for ICI induced kidney dysfunction. The methods may comprise or further comprise measuring the level of a control gene or protein. The control may be a protein level normalized by level of urine creatinine. The measured level of the biomarker may be a normalized level of the control gene or protein. For example, the measured level of a biomarker may be divided by the level of a control to achieve normalization. [0021] The methods may comprise or further comprise diagnosing the subject based on the evaluated, measured, and/or determined level of the biomarker(s). The subject may be one that has been diagnosed with ICI induced AIN. The subject may be one that has been diagnosed with ICI induced AIN based on the measured level of the biomarkers. The methods may comprise or further comprise or exclude administration of an additional therapeutic agent. The additional therapeutic agent may comprise or exclude a steroid, a TNF-alpha inhibitor, glucocorticoid therapy, an IFN-gamma inhibitor, an IL-6 inhibitor, mycophenolate mofetil, cyclosporine, cyclophosphamide, Rituximab, JAK inhibitor, STAT inhibitor, and combinations thereof. The steroid may be a corticosteroid. Corticosteroids include cortisone, hydrocortisone, methylprednisolone, and prednisone. The TNF-alpha inhibitor may comprise or exclude infliximab or an anti-TNF-alpha antibody. The method may comprise or further comprise or exclude discontinuing a prescribed ICI administration after the level of the biomarker(s) has been measured, determined, or evaluated. The subject may be diagnosed with non-ICI kidney dysfunction based on the measured, determined, or evaluated level of the biomarker(s). The method may comprise or further comprise or exclude administering ICI therapy after the subject has been diagnosed with non-ICI kidney dysfunction. The method may comprise a subject restarting ICI therapy after previous discontinuation. [0022] The methods and kits of the disclosure may exclude evaluating, determining, measuring, or reagents for evaluating, measuring, or determining one or more of IL5, CD274, TNFSF4, FAS, IL20, TSLP, TNFSF15, CCL1, IL6, TNF, CLEC4A, NCR1, FGF19, IL5RA, MUC16, CCL3, VCAM1, EPO, IFNL1, MMP3, IL9, IL16, IL36A, FLT1, IL18, IL12RB1, KITLG, LTF, CCL18, LCN2, CXCL13, S100A8, CXCL9, CD79A, CCR7, CXCL1, C3, TREM1, IL7R, CD19, LTB, MS4A1, SAA1, CXCL10, C1QB, TNFRSF17, CTLA4, CXCL6, CD27, CD38, CXCL11, CD163, FCGR3A, ITGAX, CD7, C1QA, RUNX3, SLAMF7, IRF4,
SELL, ZAP70, CD48, SIGLEC1, PDCD1, IL2RB, JAK3, CTSS, CSF2RB, IL2RG, ISG20, EBI3, C2, ITGAL, CCR5, IDO1, LCP1, CD5, CD6, SH2D1A, CYBB, CCL5, IL10RA, VEGFC, IL13RA2, IL36G, MMP9, EGF, CTF1, CHI3L1, IL1R1, TNFRSF8, SPP1, IL15RA, TNFRSF1B, TNFRSF18, TNFRSF1A, CX3CL1, CD40, IL17A, TNFRSF14, CXADR, TNFRSF9, TNFRSF11A, TNFSF11, IL2RA, MDK, IL18BP, LTBR, SLURP1, CSF1, and IL33. [0023] The subject may be diagnosed based on the measured level(s) of biomarker(s). The subject may be diagnosed with ICI induced kidney dysfunction when the level of the biomarker(s) is determined to be increased relative to a control. ICI induced kidney dysfunction may include ICI-AIN or an inflammatory kidney lesion. The subject may be diagnosed non- ICI kidney dysfunction. Non-ICI kidney dysfunction may comprise acute tubular necrosis, acute tubular injury, normal kidney, diabetic kidney disease, and/or hypertensive nephrosclerosis. The methods may comprise or further comprise administering ICI therapy after the subject has been diagnosed with non-ICI kidney dysfunction. [0024] The kits of the disclosure may comprise one or more negative or positive controls. The agents in the kits may comprise antibodies and or reagents that allow detection of one or more biomarker(s). Kits may also include reagents for collecting one or more biological sample(s). Kits may include instructions for use. [0025] The term “subject” and “patient” may be used interchangeably and may refer to a human subject. The subject may be defined as a mammalian subject. The subject may also be a mouse, rat, pig, horse, non-human primate, cat, dog, cow, and the like. The subject may be a human subject. [0026] Throughout this application, the term “about” is used according to its plain and ordinary meaning in the area of cell and molecular biology to indicate that a value includes the standard deviation of error for the device or method being employed to determine the value. [0027] The use of the word “a” or “an” when used in conjunction with the term “comprising” may mean “one,” but it is also consistent with the meaning of “one or more,” “at least one,” and “one or more than one.” [0028] As used herein, the terms “or” and “and/or” are utilized to describe multiple components in combination or exclusive of one another. For example, “x, y, and/or z” can refer to “x” alone, “y” alone, “z” alone, “x, y, and z,” “(x and y) or z,” “x or (y and z),” or “x or y or z.” It is specifically contemplated that x, y, or z may be specifically excluded from an embodiment or aspect.
[0029] The words “comprising” (and any form of comprising, such as “comprise” and “comprises”), “having” (and any form of having, such as “have” and “has”), “including” (and any form of including, such as “includes” and “include”), “characterized by” (and any form of including, such as “characterized as”), or “containing” (and any form of containing, such as “contains” and “contain”) are inclusive or open-ended and do not exclude additional, unrecited elements or method steps. [0030] The compositions and methods for their use can “comprise,” “consist essentially of,” or “consist of” any of the ingredients or steps disclosed throughout the specification. The phrase “consisting of” excludes any element, step, or ingredient not specified. The phrase “consisting essentially of” limits the scope of described subject matter to the specified materials or steps and those that do not materially affect its basic and novel characteristics. It is contemplated that embodiments and aspects described in the context of the term “comprising” may also be implemented in the context of the term “consisting of” or “consisting essentially of.” [0031] It is specifically contemplated that any limitation discussed with respect to one embodiment or aspect of the invention may apply to any other embodiment or aspect of the invention. Furthermore, any composition of the invention may be used in any method of the invention, and any method of the invention may be used to produce or to utilize any composition of the invention. Aspects of an embodiment set forth in the Examples are also embodiments that may be implemented in the context of embodiments or aspects discussed elsewhere in a different Example or elsewhere in the application, such as in the Summary of Invention, Detailed Description of the Embodiments, Claims, and description of Figure Legends. [0032] Any method in the context of a therapeutic, diagnostic, or physiologic purpose or effect may also be described in “use” claim language such as “Use of” any compound, composition, or agent discussed herein for achieving or implementing a described therapeutic, diagnostic, or physiologic purpose or effect. [0033] Use of the one or more sequences or compositions may be employed based on any of the methods described herein. Other embodiments are discussed throughout this application. Any embodiment or aspect discussed with respect to one aspect of the disclosure applies to other aspects and embodiments of the disclosure as well and vice versa. [0034] Other objects, features and advantages of the present invention will become apparent from the following detailed description. It should be understood, however, that the detailed description and the specific examples, while indicating specific embodiments of the invention,
are given by way of illustration only, since various changes and modifications within the spirit and scope of the invention will become apparent to those skilled in the art from this detailed description. BRIEF DESCRIPTION OF THE DRAWINGS [0035] The following drawings form part of the present specification and are included to further demonstrate certain aspects of the present invention. The invention may be better understood by reference to one or more of these drawings in combination with the detailed description of specific embodiments presented herein. [0036] FIG.1. Flow diagram of kidney injury subgroups and samples analyzed. [0037] FIG. 2. Representative hematoxylin and eosin (H&E) staining of kidney biopsy sections from two different patients in each subgroup. Scale bar = 50 µm. [0038] FIG.3A-3B. Identification of differentially expressed genes and relative abundance of immune cells in kidney injury. FIG. 3A. Volcano plots for differentially expressed genes between AIN vs ATN and AIN vs HTN. Each dot represents a single gene, x-axis shows log2 fold change and y-axis shows log 10 change in statistical significance (p-adj value). Genes upregulated (log 2-fold or 4-fold linear) in AIN group are highlighted. Purple dots represent genes upregulated in AIN group compared to ATN group and green dots represent genes upregulated in AIN group compared to HTN group. FIG. 3B. Expression of specific gene signature was used to determine immune cell score for infiltrating T cells, B cells, macrophages, neutrophils, dendritic cells and NK cells in different groups. Data represents cell score (log2 fold change) geometric mean ± SEM for different groups. P value represents statistical analysis by Tukey’s multiple comparison test, *p<0.05, **p<0.01, ***p<0.0005, **** p<0.0001, (adj p value). [0039] FIG.4A-4E. Identification, abundance and function of the different T cell subsets in kidney biopsies of patients with ICI-AIN, ATN and HTN. Specific gene signatures were used to determine cell score. Abundance of T helper subsets, Th1, Th2 and Th17(FIG. 4A) Treg (FIG.4B) and cytotoxic T cells (FIG.4C) score was determined and compared between three groups. Data represents cell score (log2 fold change) geometric mean ± SEM for different groups. The p values were determined using Tukey’s multiple comparisons test *p<0.05, **p<0.01, ***p<0.0005, **** p<0.0001 (adj p value). Gene signature score for T cell effector function mediated by IFN-γ (IFNG, STAT1, CCR5, CXCL9, CXCL10, CXCL11, IDO1, PRF1, GZMA, HLA-DRA; FIG. 4D) and TNF superfamily (TNFSF) and TNF expression (FIG.4E) was calculated and compared for the three groups. Data represents the gene signature
score (log2 fold change) ± SEM for different groups and Tukey’s multiple comparison test was used for statistical analysis, *p<0.05, **p<0.01, ***p<0.0005, (adj p value). [0040] FIG.5A-5E. Transcriptional and histopathological analysis of TLS in kidney biopsy of AIN, ATN, and HTN. FIG. 5A. Gene expression of 12 chemokines along with genes associated with melanoma, urothelial cancer and breast cancer TLS signatures was used to determine the transcription gene score. FIG. 5B. Gene scores for CXCL13, CCL19, CCL21 compared among AIN, ATN, and HTN groups. Data represents geometric mean (log 2-fold change) ± SEM and p value were determined using Tukey’s multiple comparisons test, *p<0.05, **p<0.01, ***p<0.0005, ****p<0.0001 (adj p value). FIG.5C. Representative H&E staining of kidney biopsy showing organized lymphocyte aggregates with CD20+ B cells adjacent to a CD3+ T cell zone (scale bar 100um). FIG.5D. Density of TLS per mm of biopsied renal cortex per case. Data are presented as mean ± SEM for different groups and p value was determined using Tukey’s multiple comparisons test, *p<0.05. FIG.5E. Heatmap of supervised clustering of differentially expressed genes for 12 chemokines, immune cells types, and B cell activation and differentiation in AIN group is shown. [0041] FIG. 6A-6C. TLS detection based on chemokines present in urine and plasma of patients with ICI-AIN, ATN, or HTN. Chemokines associated with TLS gene signature were measured in urine and plasma using Luminex based multiplex chemokine assay. FIG. 6A. Urine chemokine levels were adjusted for urine creatinine levels and the urine chemokine to urine creatinine ratio (UCCR) was log 2 transformed. Urine TLS score was determined as the arthrimetic mean of the 12 UCCR. Plasma TLS scores were assessed for each of the 12 chemokines. Data represents protein concentration (log2 fold change) arthrimetic mean ± SEM for different groups. The p values were determined using Tukey’s multiple comparisons test, *p<0.05 (adj p value). FIG.6B. Correlation between tissue TLS signature score and urine TLS signature score and tissue TLS signature score and plasma TLS signature score. FIG. 6C. Correlation between gene expression in tissue and cytokine in urine for CXCL9 and CXCL10. R represents Spearman’s rho, a non- parametric measure of correlation. Spearman’s test used to assess whether correlations were non-zero (H0: rho=0). Abbreviation: SS, signature score. [0042] FIG.7A-7B. Identification of differentially expressed immune genes between ATN and HTN groups. FIG.7A. Volcano plot for differentially expressed genes between ATN and HTN. Each dot represents a single gene, x-axis shows log2 fold change and y-axis shows log 10 change in statistical significance (p-adj value). Brown dots represent genes upregulated or downregulated in ATN group compared to HTN group. FIG. 7B. Top 10 differentially
expressed genes between ATN vs HTN are listed along with the log2 fold change in expression and statistical significance. [0043] FIG.8A-8B. FIG.8A. Kaplan-Meier curves for overall survival (OS) and FIG.8B. progression-free survival grouped by renal biopsy diagnosis (time 0 = start of ICI therapy). [0044] FIG. 9. LTB and IL7R as diagnostic markers for distinguishing ATN, AIN, and controls in tissue samples. [0045] FIG.10. CXCL9 as diagnostic marker for distinguishing non-AIN and AIN in urine samples. [0046] FIG. 11. Schematic of the NULISA workflow. 1) Immunocomplex formation; 2) first capture of immunocomplexes to dT beads; 3) bead washing to remove unbound antibodies and sample matrix components; 4) release of immunocomplexes into solution; 5) recapture of immunocomplexes onto streptavidin beads; 6) bead washing and DNA strand ligation to generate reporter DNA; 7a) detection and quantification of reporter DNA levels by qPCR (for Singleplex assays); 7b) quantification of reporter DNA levels by NGS (for 200plex panel). See for further information, Feng W, Beer JC, Hao Q, Ariyapala IS, Sahajan A, Komarov A, Cha K, Moua M, Qiu X, Xu X, Iyengar S, Yoshimura T, Nagaraj R, Wang L, Yu M, Engel K, Zhen L, Xue W, Lee CJ, Park CH, Peng C, Zhang K, Grzybowski A, Hahm J, Schmidt SV, Odainic A, Spitzer J, Buddika K, Kuo D, Fang L, Zhang B, Chen S, Latz E, Yin Y, Luo Y, Ma XJ. NULISA: a proteomic liquid biopsy platform with attomolar sensitivity and high multiplexing. Nat Commun.2023 Nov 9;14(1):7238; and Feng et al., bioRxiv 2023.04.09.536130, which is incorporated by reference. [0047] FIG. 12. Volcano plot of urine proteins identified by NULISAseq in ICI-AIN vs non-AIN cases. Urine proteomic analysis applying NULISAseq was conducted on 25 ICI-AIN and 30 non-AIN cases (non-AIN cases include patients with biopsy proven ATN and HTN). Differential expression analysis on urine samples is shown. p-values were computed using Wilcoxon tests and corrected for multiple comparisons using the False Discovery Rate (FDR). All differentially expressed markers (blue dots, select targets labeled) were upregulated in ICI- AIN relative to non-AIN. Analysis identified previously discovered markers such as CXCL9 and new candidates such as IL5, CD274, IL20, and FAS. [0048] FIG.13. Boxplots of selected top protein targets show candidates that separate AIN from non-AIN. *p< 0.05, **p< 0.01, ***p< 0.0005, **** p< 0.0001. [0049] FIG.14. Heatmap of inflammatory protein targets. Criteria AUC > 0.75. [0050] FIG. 15. ROC curves for IL5, FAS, CXCL9, and an AIN Signature constructed using logistic regression which features IL5 and FAS with an AUC 0.941.
[0051] FIG. 16. Role of Protein Targets (in urine) for AKI Patient Management on ICI Therapy: protein targets optimize patient management and treatment, enabling ICI therapy re- challenge in patients with cancer with continued immune monitoring. [0052] FIG. 17. Number of detectable proteins with p-adj < 0.05 in urine (73 markers), plasma (36 markers), and their intersection (14 markers). Five overlapping markers had AUC > 0.75 and p-adj < 0.05. [0053] FIG. 18A-18B. Heatmaps (FIG. 18A) and PCA plot (FIG. 18B) showed that samples cluster strongly by tissue of origin. [0054] FIG. 19. Top 10 differentially expressed pathways identified by Enrichr using KEGG 2021 pathway database from urine analysis (FIG.19A) and plasma analysis (FIG.19B). All markers with FDR < 0.05 and absolute log 2-fold changes greater than 1 were considered differentially expressed for pathway analysis. [0055] FIG. 20. Differential expression analysis on urine samples, comparing ICI-AIN (n=22) with Non-AIN (n=27). p-values were computed using Wilcoxon tests and corrected for multiple comparisons using the False Discovery Rate (FDR). Top proteins (FDR < 0.01 and Fold Change > 8). The analysis identified markers such as, but not limited to, CXCL9, IL5, and FAS. [0056] FIG. 21. Plots showing expression of top candidates from ICI-AIN and Non-AIN urine samples. [0057] FIG. 22A-22B. Heatmap (FIG. 22A) and PCA plot (FIG. 22B) for urine samples showed strong separation between AIN and non-AIN. [0058] FIG.23A-23C. Results from logistics regression models used to create a urine ICI- AIN signature. FIG.23A shows results from a bootstrap logistic regression analysis in which IL5 and FAS were selected in greater than 80% of models. FIG. 23B shows results from forward stepwise selection, including IL5, FAS, and IL34. Figure 23C shows a classification and regression tree (CART) with partition rules for FAS and IL5. [0059] FIG. 24A-24B. ROC (FIG. 24A) and scatterplot (FIG. 24B) of urine ICI-AIN signature using expression of IL5, FAS, CXCL9, or FAS+IL5. Urine ICI-AIN Signature using IL5 and FAS expression obtained an AUC of 0.94, higher than FAS, IL5, or CXCL9 alone. [0060] FIG. 25A-25C. Results from logistics regression models used to create a plasma immune activation/irAE signature. FIG.25A shows results from a bootstrap logistic regression analysis; top markers included IL36A, SPP1, TNFRSF8, and CCL1. FIG. 25B shows results from forward stepwise selection, including TNFRSF8, TNFSF11, and IL36A. Figure 25C shows a CART with partition rules for CCL1 and IL27.
[0061] FIG.26A-26B. Plasma immune activation/irAE Signature. FIG.26A shows a ROC plot of ICI-AIN signatures using IL36A, TNFRSF8, CXCL9, or IL36A+TNFRSF8. ICI-AIN Signature using IL36A and TNFRSF8 obtained an AUC value of 0.914. FIG. 26B shows a scatterplot of TNFRSF8 versus IL36A showing separation of ICI-AIN and non-AIN groups. [0062] FIG.27A-27C. Results from logistics regression models used to create a plasma + urine ICI-AIN signature. FIG.27A shows results from a bootstrap logistic regression analysis; top markers include IL5_Urine, and IL36A_plasma. FIG. 27B shows results from forward stepwise selection, including IL5_Urine, CXCL9_Urine, and CEACAM5_Urine. Figure 27C shows a CART with partition rules for FAS_urine and IL36A_plasma. [0063] FIG. 28A-28B. Urine+Plasma AIN Signature. FIG. 28A shows a ROC plot of an AIN Signature using FAS urine, IL36A plasma, IL5 urine, CXCL9 urine, or FAS urine+IL36 plasma. AIN Signature using FAS urine and IL36A plasma expression obtained an AUC value of 0.936, higher than FAS urine, IL5 urine, IL36A plasma, or CXCL9 urine alone. FIG.28B shows a scatterplot of FAS urine versus IL36A plasma showing a line (estimated with logistic regression) separating AIN and non-AIN groups. [0064] FIG. 29. Differential expression analysis of plasma samples, comparing ICI-AIN (n=20) with Non-AIN (n=22). p-values were computed using Wilcoxon tests and corrected for multiple comparisons using the False Discovery Rate (FDR). Top proteins (FDR <0.01 and Fold Change > 2) from plasma analysis are highlighted. [0065] FIG.30. Plots showing that top plasma candidates separated AIN and Non-AIN. [0066] FIG.31A-31B. ROC (FIG.31A) and ROC (FIG.31B) of urine ICI-AIN signature using expression of IL5, FAS, CXCL9, or IL5+CXCL9. Urine ICI-AIN Signature using IL5 and CXCL9 expression obtained an AUC of 0.934, higher than FAS, IL5, or CXCL9 alone. Urine ICI-AIN Signature using FAS and CXCL9 expression obtained an AUC of 0.886. [0067] FIG. 32A-32B. Urine+Plasma AIN Signature. FIG. 32A shows a ROC plot of an AIN Signature using FAS urine, IL36A plasma, IL5 urine, CXCL9 urine, or IL5 urine+IL36 plasma. AIN Signature using IL5 urine and IL36A plasma expression obtained an AUC value of 0.96, higher than FAS urine, IL5 urine, IL36A plasma, or CXCL9 urine alone. FIG. 32B shows a scatterplot of IL5 urine versus IL36A plasma showing a line (estimated with logistic regression) separating AIN and non-AIN groups. DETAILED DESCRIPTION OF THE INVENTION [0068] The inventors sought to determine whether differential expression of genes and/or proteins in urine and/or plasma could be uncovered in patients that developed AKI on ICI
therapy that distinguish AIN from other kidney pathologies such as acute tubular necrosis (ATN) or hypertensive (HTN) nephrosclerosis. This would allow for more effective management of AKI while also appropriately managing the ICI therapy. I. Therapeutic Methods [0069] Methods and compositions may be provided for treating subjects based on the levels of one or more biomarker(s). Based on a profile of biomarker expression or activity levels, different treatments may be prescribed or recommended for different patients. In some aspects, the methods are for treating a cancer with ICI therapy, for monitoring a subject being treated with ICI therapy, for treating an irAE, and/or for treating ICI induced AIN. [0070] The cancer may include, but are not limited to, cancers and tumors of all types, locations, sizes, and characteristics. The methods and compositions of the disclosure are suitable for treating, for example, pancreatic cancer, colon cancer, acute myeloid leukemia, adrenocortical carcinoma, AIDS-related cancers, AIDS-related lymphoma, anal cancer, appendix cancer, astrocytoma, childhood cerebellar or cerebral basal cell carcinoma, bile duct cancer, extrahepatic bladder cancer, bone cancer, colorectal cancer, osteosarcoma/malignant fibrous histiocytoma, brainstem glioma, brain tumor, cerebellar astrocytoma brain tumor, cerebral astrocytoma/malignant glioma brain tumor, ependymoma brain tumor, glioma, glioblastoma multiforme, medulloblastoma brain tumor, supratentorial primitive neuroectodermal tumors brain tumor, visual pathway and hypothalamic glioma, breast cancer, lymphoid cancer, bronchial adenomas/carcinoids, tracheal cancer, Burkitt lymphoma, carcinoid tumor, childhood carcinoid tumor, glioblastoma, neuroblastoma, gastrointestinal carcinoma of unknown primary, central nervous system lymphoma, primary cerebellar astrocytoma, childhood cerebral astrocytoma/malignant glioma, childhood cervical cancer, childhood cancers, chronic lymphocytic leukemia, chronic myelogenous leukemia, chronic myeloproliferative disorders, cutaneous T-cell lymphoma, desmoplastic small round cell tumor, endometrial cancer, ependymoma, esophageal cancer, Ewing's, childhood extragonadal Germ cell tumor, extrahepatic bile duct cancer, eye Cancer, intraocular melanoma eye Cancer, retinoblastoma, gallbladder cancer, gastric (stomach) cancer, gastrointestinal carcinoid tumor, gastrointestinal stromal tumor (GIST), germ cell tumor: extracranial, extragonadal, or ovarian, gestational trophoblastic tumor, glioma of the brain stem, glioma, childhood cerebral astrocytoma, childhood visual pathway and hypothalamic glioma, gastric carcinoid, hairy cell leukemia, head and neck cancer, heart cancer, hepatocellular (liver) cancer, Hodgkin lymphoma, hypopharyngeal cancer, hypothalamic and visual pathway glioma, childhood intraocular melanoma, islet cell carcinoma (endocrine pancreas), kaposi sarcoma, kidney
cancer (renal cell cancer), laryngeal cancer , leukemia, acute lymphoblastic (also called acute lymphocytic leukemia) leukemia, acute myeloid (also called acute myelogenous leukemia) leukemia, chronic lymphocytic (also called chronic lymphocytic leukemia) leukemia, chronic myelogenous (also called chronic myeloid leukemia) leukemia, hairy cell lip and oral cavity cancer, liposarcoma, liver cancer (primary), non-small cell lung cancer, small cell lung cancer, lymphomas, AIDS-related lymphoma, Burkitt lymphoma, cutaneous T-cell lymphoma, Hodgkin lymphoma, Non-Hodgkin (an old classification of all lymphomas except Hodgkin's) lymphoma, primary central nervous system lymphoma, Waldenstrom macroglobulinemia, malignant fibrous histiocytoma of bone/osteosarcoma, childhood medulloblastoma, melanoma, intraocular (eye) melanoma, merkel cell carcinoma, adult malignant mesothelioma, childhood mesothelioma, metastatic squamous neck cancer, mouth cancer, multiple endocrine neoplasia syndrome, multiple myeloma/plasma cell neoplasm, mycosis fungoides, myelodysplastic syndromes, myelodysplastic/myeloproliferative diseases, chronic myelogenous leukemia, adult acute myeloid leukemia, childhood acute myeloid leukemia, multiple myeloma, chronic myeloproliferative disorders, nasal cavity and paranasal sinus cancer, nasopharyngeal carcinoma, neuroblastoma, oral cancer, oropharyngeal cancer, osteosarcoma/malignant, fibrous histiocytoma of bone, ovarian cancer, ovarian epithelial cancer (surface epithelial-stromal tumor), ovarian germ cell tumor, ovarian low malignant potential tumor, pancreatic cancer, islet cell paranasal sinus and nasal cavity cancer, parathyroid cancer, penile cancer, pharyngeal cancer, pheochromocytoma, pineal astrocytoma, pineal germinoma, pineoblastoma and supratentorial primitive neuroectodermal tumors, childhood pituitary adenoma, plasma cell neoplasia/multiple myeloma, pleuropulmonary blastoma, primary central nervous system lymphoma, prostate cancer, rectal cancer, renal cell carcinoma (kidney cancer), renal pelvis and ureter transitional cell cancer, retinoblastoma, rhabdomyosarcoma, childhood Salivary gland cancer Sarcoma, Ewing family of tumors, Kaposi sarcoma, soft tissue sarcoma, uterine sezary syndrome sarcoma, skin cancer (nonmelanoma), skin cancer (melanoma), skin carcinoma, Merkel cell small cell lung cancer, small intestine cancer, soft tissue sarcoma, squamous cell carcinoma. squamous neck cancer with occult primary, metastatic stomach cancer, supratentorial primitive neuroectodermal tumor, childhood T-cell lymphoma, testicular cancer, throat cancer, thymoma, childhood thymoma, thymic carcinoma, thyroid cancer, urethral cancer, uterine cancer, endometrial uterine sarcoma, vaginal cancer, visual pathway and hypothalamic glioma, childhood vulvar cancer, and wilms tumor (kidney cancer).
[0071] In some aspects, the cancer is aggressive cancer. In some aspects, the cancer is Stage I cancer. In some aspects, the cancer is Stage II cancer (e.g., IIA, IIB, IIC). In some aspects, the cancer is Stage III cancer (e.g., IIIA, IIIB, IIIC). In some aspects, the cancer is Stage IV cancer (e.g., IVA, IVB). [0072] Methods may involve the determination, administration, or selection of an appropriate cancer “management regimen” and predicting the outcome of the same. As used herein the phrase “management regimen” refers to a management plan that specifies the type of examination, screening, diagnosis, surveillance, care, and treatment (such as dosage, schedule and/or duration of a treatment) provided to a subject in need thereof (e.g., a subject diagnosed with cancer). [0073] Methods may involve the determination, administration, and/or selection of an appropriate irAE management regimen and predicting the outcome of the same. As used herein the phrase “irAE management regimen” refers to a management plan that specifies the type of examination, screening, diagnosis, surveillance, care, and/or treatment (such as dosage, schedule and/or duration of a treatment) provided to a subject in need thereof (e.g., a subject diagnosed with cancer). A. Monitoring [0074] In certain aspects, the biomarker-based method may be combined with one or more other cancer diagnosis or screening tests at increased frequency if the patient is determined to be at high risk for recurrence or have a poor prognosis based on the biomarker as described above. [0075] In some aspects, the methods of the disclosure further include one or more monitoring tests. The monitoring protocol may include any methods known in the art. In particular, the monitoring includes obtaining one or more sample(s) and testing the sample(s) for diagnosis. For example, the monitoring may include endoscopy, biopsy, laparoscopy, colonoscopy, blood test, plasma test, serum test, urine tests, fluid aspiration or drainage, genetic testing, endoscopic ultrasound, X-ray, barium enema x-ray, chest x-ray, barium swallow, a CT scan, a MRI, a PET scan, ultrasound, nuclear medicine (NM) scan, or PET/CT scan. In some aspects, the monitoring test comprises radiographic imaging. Examples of radiographic imaging this is useful in the methods of the disclosure includes renal ultrasound, computed tomographic (CT) scan, magnetic resonance imaging (MRI), body CT scan, NM Mag 3 lasix scan, PET, and body MRI.
B. ROC analysis [0076] In statistics, a receiver operating characteristic (ROC), or ROC curve, is a graphical plot that illustrates the performance of a binary classifier system as its discrimination threshold is varied. ROC analysis may be applied to determine a cut-off value or threshold setting of biomarker expression. For example, patients with one or more biological sample(s) determined to have biomarker expression value(s) above a certain cut-off threshold but below a higher cut- off threshold may be determined to have ICI-acute interstitial nephritis. Patients with one or more biological sample(s) determined to have one or more biomarker expression level(s) that surpasses the cut-off threshold for AIN may be determined to have an immune related adverse event and/or acute interstitial nephritis. The curve is created by plotting the true positive rate against the false positive rate at various threshold settings. (The true-positive rate is also known as sensitivity in biomedical informatics, or recall in machine learning. The false-positive rate is also known as the fall-out and can be calculated as 1 - specificity). The ROC curve is thus the sensitivity as a function of fall-out. In general, if the probability distributions for both detection and false alarm are known, the ROC curve can be generated by plotting the cumulative distribution function (area under the probability distribution from –infinity to + infinity) of the detection probability in the y-axis versus the cumulative distribution function of the false-alarm probability in x-axis. [0077] ROC analysis provides tools to select possibly optimal models and to discard suboptimal ones independently from (and prior to specifying) the cost context or the class distribution. ROC analysis is related in a direct and natural way to cost/benefit analysis of diagnostic decision making. [0078] The ROC curve was first developed by electrical engineers and radar engineers during World War II for detecting enemy objects in battlefields and was soon introduced to psychology to account for perceptual detection of stimuli. ROC analysis since then has been used in medicine, radiology, biometrics, and other areas for many decades and is increasingly used in machine learning and data mining research. [0079] The ROC is also known as a relative operating characteristic curve, because it is a comparison of two operating characteristics (TPR and FPR) as the criterion changes. ROC analysis curves are known in the art and described in Metz CE (1978) Basic principles of ROC analysis. Seminars in Nuclear Medicine 8:283-298; Youden WJ (1950) An index for rating diagnostic tests. Cancer 3:32-35; Zweig MH, Campbell G (1993) Receiver-operating characteristic (ROC) plots: a fundamental evaluation tool in clinical medicine. Clinical Chemistry 39:561-577; and Greiner M, Pfeiffer D, Smith RD (2000) Principles and practical
application of the receiver-operating characteristic analysis for diagnostic tests. Preventive Veterinary Medicine 45:23-41, which are herein incorporated by reference in their entirety. A ROC analysis may be used to create cut-off values for prognosis and/or diagnosis purposes. II. Therapeutic Agents [0080] Methods of the disclosure relate to treating subjects and patients with a cancer therapy and/or an additional therapeutic agent. The cancer therapy or additional therapeutic agent may be one described below and may be given with respect to a patient having been determined to have a certain biomarker profile. For example, the therapy described below is given to a patient determined to have an irAE, such as ICI induced AIN. The therapy described below may be given to a patient determined to have non-ICI induced kidney dysfunction. The methods may exclude administration of a therapy below to a subject determined to have an irAE, such as ICI induced AIN. The methods may exclude administration of a therapy below to a subject determined to have non-ICI induced kidney dysfunction. Also contemplated are combinations of the therapies described below. A. Immune Checkpoint Inhibitor (ICI) Therapy [0081] The methods of the disclosure relate to combination therapies with ICI therapy and/or subjects being treated with ICI therapies. Specific ICI therapies are described below. 1. PD-1, PDL1, and PDL2 inhibitors [0082] PD-1 can act in the tumor microenvironment where T cells encounter an infection or tumor. Activated T cells upregulate PD-1 and continue to express it in the peripheral tissues. Cytokines such as IFN-gamma induce the expression of PDL1 on epithelial cells and tumor cells. PDL2 is expressed on macrophages and dendritic cells. The main role of PD-1 is to limit the activity of effector T cells in the periphery and prevent excessive damage to the tissues during an immune response. Inhibitors of the disclosure may block one or more functions of PD-1 and/or PDL1 activity. [0083] Alternative names for “PD-1” include CD279 and SLEB2. Alternative names for “PDL1” include B7-H1, B7-4, CD274, and B7-H. Alternative names for “PDL2” include B7- DC, Btdc, and CD273. In some embodiments, PD-1, PDL1, and PDL2 are human PD-1, PDL1 and PDL2. [0084] In some embodiments, the PD-1 inhibitor is a molecule that inhibits the binding of PD-1 to its ligand binding partners. In a specific aspect, the PD-1 ligand binding partners are PDL1 and/or PDL2. In another embodiment, a PDL1 inhibitor is a molecule that inhibits the binding of PDL1 to its binding partners. In a specific aspect, PDL1 binding partners are PD-1 and/or B7-1. In another embodiment, the PDL2 inhibitor is a molecule that inhibits the binding
of PDL2 to its binding partners. In a specific aspect, a PDL2 binding partner is PD-1. The inhibitor may be an antibody, an antigen binding fragment thereof, an immunoadhesin, a fusion protein, or oligopeptide. Exemplary antibodies are described in U.S. Patent Nos. 8,735,553, 8,354,509, and 8,008,449, all incorporated herein by reference. Other PD-1 inhibitors for use in the methods and compositions provided herein are known in the art such as described in U.S. Patent Application Nos. US2014/0294898, US2014/022021, and US2011/0008369, all incorporated herein by reference. [0085] In some embodiments, the PD-1 inhibitor is an anti-PD-1 antibody (e.g., a human antibody, a humanized antibody, or a chimeric antibody). In some embodiments, the anti-PD- 1 antibody is selected from the group consisting of nivolumab, pembrolizumab, and pidilizumab. In some embodiments, the PD-1 inhibitor is an immunoadhesin (e.g., an immunoadhesin comprising an extracellular or PD-1 binding portion of PDL1 or PDL2 fused to a constant region (e.g., an Fc region of an immunoglobulin sequence). In some embodiments, the PDL1 inhibitor comprises AMP- 224. Nivolumab, also known as MDX-1106-04, MDX- 1106, ONO-4538, BMS-936558, and OPDIVO®, is an anti-PD-1 antibody described in WO2006/121168. Pembrolizumab, also known as MK-3475, Merck 3475, lambrolizumab, KEYTRUDA®, and SCH-900475, is an anti-PD-1 antibody described in WO2009/114335. Pidilizumab, also known as CT-011, hBAT, or hBAT-1, is an anti-PD-1 antibody described in WO2009/101611. AMP-224, also known as B7-DCIg, is a PDL2-Fc fusion soluble receptor described in WO2010/027827 and WO2011/066342. Additional PD-1 inhibitors include MEDI0680, also known as AMP-514, and REGN2810. [0086] In some embodiments, the immune checkpoint inhibitor is a PDL1 inhibitor such as Durvalumab, also known as MEDI4736, atezolizumab, also known as MPDL3280A, avelumab, also known as MSB00010118C, MDX-1105, BMS-936559, or combinations thereof. In certain aspects, the immune checkpoint inhibitor is a PDL2 inhibitor such as rHIgM12B7. [0087] In some embodiments, the inhibitor comprises the heavy and light chain CDRs or VRs of nivolumab, pembrolizumab, or pidilizumab. Accordingly, in one embodiment, the inhibitor comprises the CDR1, CDR2, and CDR3 domains of the VH region of nivolumab, pembrolizumab, or pidilizumab, and the CDR1, CDR2 and CDR3 domains of the VL region of nivolumab, pembrolizumab, or pidilizumab. In another embodiment, the antibody competes for binding with and/or binds to the same epitope on PD-1, PDL1, or PDL2 as the above- mentioned antibodies. In another embodiment, the antibody has at least about 70, 75, 80, 85,
90, 95, 97, or 99% (or any derivable range therein) variable region amino acid sequence identity with the above-mentioned antibodies. 2. CTLA-4, B7-1, and B7-2 [0088] Another immune checkpoint that can be targeted in the methods provided herein is the cytotoxic T-lymphocyte-associated protein 4 (CTLA-4), also known as CD152. The complete cDNA sequence of human CTLA-4 has the Genbank accession number L15006. CTLA-4 is found on the surface of T cells and acts as an “off” switch when bound to B7-1 (CD80) or B7-2 (CD86) on the surface of antigen-presenting cells. CTLA4 is a member of the immunoglobulin superfamily that is expressed on the surface of Helper T cells and transmits an inhibitory signal to T cells. CTLA4 is similar to the T-cell co-stimulatory protein, CD28, and both molecules bind to B7-1 and B7-2 on antigen-presenting cells. CTLA-4 transmits an inhibitory signal to T cells, whereas CD28 transmits a stimulatory signal. Intracellular CTLA- 4 is also found in regulatory T cells and may be important to their function. T cell activation through the T cell receptor and CD28 leads to increased expression of CTLA-4, an inhibitory receptor for B7 molecules. Inhibitors of the disclosure may block one or more functions of CTLA-4, B7-1, and/or B7-2 activity. In some embodiments, the inhibitor blocks the CTLA-4 and B7-1 interaction. In some embodiments, the inhibitor blocks the CTLA-4 and B7-2 interaction. [0089] In some embodiments, the immune checkpoint inhibitor is an anti-CTLA-4 antibody (e.g., a human antibody, a humanized antibody, or a chimeric antibody), an antigen binding fragment thereof, an immunoadhesin, a fusion protein, or oligopeptide. [0090] Anti-human-CTLA-4 antibodies (or VH and/or VL domains derived therefrom) suitable for use in the present methods can be generated using methods well known in the art. Alternatively, art recognized anti-CTLA-4 antibodies can be used. For example, the anti- CTLA-4 antibodies disclosed in: US 8,119,129, WO 01/14424, WO 98/42752; WO 00/37504 (CP675,206, also known as tremelimumab; formerly ticilimumab), U.S. Patent No.6,207,156; Hurwitz et al., 1998; can be used in the methods disclosed herein. The teachings of each of the aforementioned publications are hereby incorporated by reference. Antibodies that compete with any of these art-recognized antibodies for binding to CTLA-4 also can be used. For example, a humanized CTLA-4 antibody is described in International Patent Application No. WO2001/014424, WO2000/037504, and U.S. Patent No.8,017,114; all incorporated herein by reference.
[0091] A further anti-CTLA-4 antibody useful as a checkpoint inhibitor in the methods and compositions of the disclosure is ipilimumab (also known as 10D1, MDX- 010, MDX- 101, and Yervoy®) or antigen binding fragments and variants thereof (see, e.g., WO01/14424). [0092] In some embodiments, the inhibitor comprises the heavy and light chain CDRs or VRs of tremelimumab or ipilimumab. Accordingly, in one embodiment, the inhibitor comprises the CDR1, CDR2, and CDR3 domains of the VH region of tremelimumab or ipilimumab, and the CDR1, CDR2 and CDR3 domains of the VL region of tremelimumab or ipilimumab. In another embodiment, the antibody competes for binding with and/or binds to the same epitope on PD-1, B7-1, or B7-2 as the above- mentioned antibodies. In another embodiment, the antibody has at least about 70, 75, 80, 85, 90, 95, 97, or 99% (or any derivable range therein) variable region amino acid sequence identity with the above-mentioned antibodies. 3. Other ICI therapies [0093] The ICI therapy may include or exclude a LAG-3 inhibitor such as relatimab or combinations of ICI therapies, such as opdualag. Further LAG-3 inhibitors may include or exclude tebotelimab, chlorogenic acid, RO-7247669, favezelimab, INCAGN-2385, IBI-110, eftilagimod alpha, sym-022, LBL-007, ABL-501, anti-LAG3 antibody, HLX26, IBI-323, ieramilimab, FS 118, EMB-02, fianlimab, and combinations thereof. The ICI therapy may include or exclude a TIGIT inhibitor such as tiragolumab or combinations of ICI therapies, such as atezolizumab. The ICI therapy may include or exclude vibostolimab, domvanalimab, EOS884448 (EOS-448), HLX53, SEA-TGT, etigilimab, BMS-986207, COM701, and combinations thereof. B. Immunostimulators [0094] The method may comprise or further comprise administration of an additional agent. The additional agent may be an immunostimulator. The term “immunostimulator” as used herein refers to a compound that can stimulate an immune response in a subject, and may include an adjuvant. In some embodiments, an immunostimulator is an agent that does not constitute a specific antigen, but can boost the strength and longevity of an immune response to an antigen. Such immunostimulators may include, but are not limited to stimulators of pattern recognition receptors, such as Toll-like receptors, RIG-1 and NOD-like receptors (NLR), mineral salts, such as alum, alum combined with monphosphoryl lipid (MPL) A of Enterobacteria, such as Escherihia coli, Salmonella minnesota, Salmonella typhimurium, or Shigella flexneri or specifically with MPL (ASO4), MPL A of above-mentioned bacteria separately, saponins, such as QS-21, Quil-A, ISCOMs, ISCOMATRIX, emulsions such as
MF59, Montanide, ISA 51 and ISA 720, AS02 (QS21+squalene+MPL.), liposomes and liposomal formulations such as AS01, synthesized or specifically prepared microparticles and microcarriers such as bacteria-derived outer membrane vesicles (OMV) of N. gonorrheae, Chlamydia trachomatis and others, or chitosan particles, depot-forming agents, such as Pluronic block co-polymers, specifically modified or prepared peptides, such as muramyl dipeptide, aminoalkyl glucosaminide 4-phosphates, such as RC529, or proteins, such as bacterial toxoids or toxin fragments. Other immunostimulators include agonists to OX40, CD28, and/or CD40. [0095] In some embodiments, the additional agent comprises an agonist for pattern recognition receptors (PRR), including, but not limited to Toll-Like Receptors (TLRs), specifically TLRs 2, 3, 4, 5, 7, 8, 9 and/or combinations thereof. In some embodiments, additional agents comprise agonists for Toll-Like Receptors 3, agonists for Toll-Like Receptors 7 and 8, or agonists for Toll-Like Receptor 9; preferably the recited immunostimulators comprise imidazoquinolines; such as R848; adenine derivatives, such as those disclosed in U.S. Pat. No. 6,329,381, U.S. Published Patent Application 2010/0075995, or WO 2010/018132; immunostimulatory DNA; or immunostimulatory RNA. In some embodiments, the additional agents also may comprise immunostimulatory RNA molecules, such as but not limited to dsRNA, poly I:C or poly I:poly C12U (available as Ampligen.RTM., both poly I:C and poly I:polyC12U being known as TLR3 stimulants), and/or those disclosed in F. Heil et al., "Species-Specific Recognition of Single-Stranded RNA via Toll-like Receptor 7 and 8" Science 303(5663), 1526-1529 (2004); J. Vollmer et al., "Immune modulation by chemically modified ribonucleosides and oligoribonucleotides" WO 2008033432 A2; A. Forsbach et al., "Immunostimulatory oligoribonucleotides containing specific sequence motif(s) and targeting the Toll-like receptor 8 pathway" WO 2007062107 A2; E. Uhlmann et al., "Modified oligoribonucleotide analogs with enhanced immunostimulatory activity" U.S. Pat. Appl. Publ. US 2006241076; G. Lipford et al., "Immunostimulatory viral RNA oligonucleotides and use for treating cancer and infections" WO 2005097993 A2; G. Lipford et al., "Immunostimulatory G,U-containing oligoribonucleotides, compositions, and screening methods" WO 2003086280 A2. In some embodiments, an additional agent may be a TLR-4 agonist, such as bacterial lipopolysaccharide (LPS), VSV-G, and/or HMGB-1. In some embodiments, additional agents may comprise TLR-5 agonists, such as flagellin, or portions or derivatives thereof, including but not limited to those disclosed in U.S. Pat. Nos.6,130,082, 6,585,980, and 7,192,725. [0096] In some embodiments, additional agents may be proinflammatory stimuli released from necrotic cells (e.g., urate crystals). In some embodiments, additional agents may be
activated components of the complement cascade (e.g., CD21, CD35, etc.). In some embodiments, additional agents may be activated components of immune complexes. Additional agents also include complement receptor agonists, such as a molecule that binds to CD21 or CD35. In some embodiments, the complement receptor agonist induces endogenous complement opsonization of the synthetic nanocarrier. In some embodiments, immunostimulators are cytokines, which are small proteins or biological factors (in the range of 5 kD-20 kD) that are released by cells and have specific effects on cell-cell interaction, communication and behavior of other cells. In some embodiments, the cytokine receptor agonist is a small molecule, antibody, fusion protein, or aptamer. C. Immunotherapies [0097] In some embodiments, the additional therapy comprises a cancer immunotherapy. Cancer immunotherapy (sometimes called immuno-oncology, abbreviated IO) is the use of the immune system to treat cancer. Immunotherapies can be categorized as active, passive or hybrid (active and passive). These approaches exploit the fact that cancer cells often have molecules on their surface that can be detected by the immune system, known as tumour- associated antigens (TAAs); they are often proteins or other macromolecules (e.g. carbohydrates). Active immunotherapy directs the immune system to attack tumor cells by targeting TAAs. Passive immunotherapies enhance existing anti-tumor responses and include the use of monoclonal antibodies, lymphocytes and cytokines. Immumotherapies are known in the art, and some are described below. 1. Inhibition of co-stimulatory molecules [0098] In some embodiments, the immunotherapy comprises an inhibitor of a co- stimulatory molecule. In some embodiments, the inhibitor comprises an inhibitor of B7-1 (CD80), B7-2 (CD86), CD28, ICOS, OX40 (TNFRSF4), 4-1BB (CD137; TNFRSF9), CD40L (CD40LG), GITR (TNFRSF18), and combinations thereof. Inhibitors include inhibitory antibodies, polypeptides, compounds, and nucleic acids. 2. Dendritic cell therapy [0099] Dendritic cell therapy provokes anti-tumor responses by causing dendritic cells to present tumor antigens to lymphocytes, which activates them, priming them to kill other cells that present the antigen. Dendritic cells are antigen presenting cells (APCs) in the mammalian immune system. In cancer treatment they aid cancer antigen targeting. One example of cellular cancer therapy based on dendritic cells is sipuleucel-T. [00100] One method of inducing dendritic cells to present tumor antigens is by vaccination with autologous tumor lysates or short peptides (small parts of protein that correspond to the
protein antigens on cancer cells). These peptides are often given in combination with adjuvants (highly immunogenic substances) to increase the immune and anti-tumor responses. Other adjuvants include proteins or other chemicals that attract and/or activate dendritic cells, such as granulocyte macrophage colony-stimulating factor (GM-CSF). [00101] Dendritic cells can also be activated in vivo by making tumor cells express GM- CSF. This can be achieved by either genetically engineering tumor cells to produce GM-CSF or by infecting tumor cells with an oncolytic virus that expresses GM-CSF. [00102] Another strategy is to remove dendritic cells from the blood of a patient and activate them outside the body. The dendritic cells are activated in the presence of tumor antigens, which may be a single tumor-specific peptide/protein or a tumor cell lysate (a solution of broken down tumor cells). These cells (with optional adjuvants) are infused and provoke an immune response. [00103] Dendritic cell therapies include the use of antibodies that bind to receptors on the surface of dendritic cells. Antigens can be added to the antibody and can induce the dendritic cells to mature and provide immunity to the tumor. Dendritic cell receptors such as TLR3, TLR7, TLR8 or CD40 have been used as antibody targets. 3. CAR-T cell therapy [00104] Chimeric antigen receptors (CARs, also known as chimeric immunoreceptors, chimeric T cell receptors or artificial T cell receptors) are engineered receptors that combine a new specificity with an immune cell to target cancer cells. Typically, these receptors graft the specificity of a monoclonal antibody onto a T cell. The receptors are called chimeric because they are fused of parts from different sources. CAR-T cell therapy refers to a treatment that uses such transformed cells for cancer therapy. [00105] The basic principle of CAR-T cell design involves recombinant receptors that combine antigen-binding and T-cell activating functions. The general premise of CAR-T cells is to artificially generate T-cells targeted to markers found on cancer cells. Scientists can remove T-cells from a person, genetically alter them, and put them back into the patient for them to attack the cancer cells. Once the T cell has been engineered to become a CAR-T cell, it acts as a “living drug”. CAR-T cells create a link between an extracellular ligand recognition domain to an intracellular signaling molecule which in turn activates T cells. The extracellular ligand recognition domain is usually a single-chain variable fragment (scFv). An important aspect of the safety of CAR-T cell therapy is how to ensure that only cancerous tumor cells are targeted, and not normal cells. The specificity of CAR-T cells is determined by the choice of molecule that is targeted.
[00106] Exemplary CAR-T therapies include Tisagenlecleucel (Kymriah) and Axicabtagene ciloleucel (Yescarta). In some embodiments, the CAR-T therapy targets CD19. 4. Cytokine therapy [00107] Cytokines are proteins produced by many types of cells present within a tumor. They can modulate immune responses. The tumor often employs them to allow it to grow and reduce the immune response. These immune-modulating effects allow them to be used as drugs to provoke an immune response. Two commonly used cytokines are interferons and interleukins. [00108] Interferons are produced by the immune system. They are usually involved in anti- viral response, but also have use for cancer. They fall in three groups: type I (IFNα and IFNβ), type II (IFNγ) and type III (IFNλ). [00109] Interleukins have an array of immune system effects. IL-2 is an exemplary interleukin cytokine therapy. 5. Adoptive T-cell therapy [00110] Adoptive T cell therapy is a form of passive immunization by the transfusion of T- cells (adoptive cell transfer). They are found in blood and tissue and usually activate when they find foreign pathogens. Specifically, they activate when the T-cell's surface receptors encounter cells that display parts of foreign proteins on their surface antigens. These can be either infected cells, or antigen presenting cells (APCs). They are found in normal tissue and in tumor tissue, where they are known as tumor infiltrating lymphocytes (TILs). They are activated by the presence of APCs such as dendritic cells that present tumor antigens. Although these cells can attack the tumor, the environment within the tumor is highly immunosuppressive, preventing immune-mediated tumor death. [00111] Multiple ways of producing and obtaining tumor targeted T-cells have been developed. T-cells specific to a tumor antigen can be removed from a tumor sample (TILs) or filtered from blood. Subsequent activation and culturing is performed ex vivo, with the results reinfused. Activation can take place through gene therapy, or by exposing the T cells to tumor antigens. D. Oncolytic virus [00112] In some embodiments, the additional therapy comprises an oncolytic virus. An oncolytic virus is a virus that preferentially infects and kills cancer cells. As the infected cancer cells are destroyed by oncolysis, they release new infectious virus particles or virions to help destroy the remaining tumour. Oncolytic viruses are thought not only to cause direct destruction of the tumour cells, but also to stimulate host anti-tumour immune responses for long-term immunotherapy
E. Polysaccharides [00113] In some embodiments, the additional therapy comprises polysaccharides. Certain compounds found in mushrooms, primarily polysaccharides, can up-regulate the immune system and may have anti-cancer properties. For example, beta-glucans such as lentinan have been shown in laboratory studies to stimulate macrophage, NK cells, T cells and immune system cytokines and have been investigated in clinical trials as immunologic adjuvants. F. Neoantigens [00114] In some embodiments, the additional therapy comprises neoantigen administration. Many tumors express mutations. These mutations potentially create new targetable antigens (neoantigens) for use in T cell immunotherapy. The presence of CD8+ T cells in cancer lesions, as identified using RNA sequencing data, is higher in tumors with a high mutational burden. The level of transcripts associated with cytolytic activity of natural killer cells and T cells positively correlates with mutational load in many human tumors. G. Chemotherapies [00115] In some embodiments, the additional therapy comprises a chemotherapy. Suitable classes of chemotherapeutic agents include (a) Alkylating Agents, such as nitrogen mustards (e.g., mechlorethamine, cylophosphamide, ifosfamide, melphalan, chlorambucil), ethylenimines and methylmelamines (e.g., hexamethylmelamine, thiotepa), alkyl sulfonates (e.g., busulfan), nitrosoureas (e.g., carmustine, lomustine, chlorozoticin, streptozocin) and triazines (e.g., dicarbazine), (b) Antimetabolites, such as folic acid analogs (e.g., methotrexate), pyrimidine analogs (e.g., 5-fluorouracil, floxuridine, cytarabine, azauridine) and purine analogs and related materials (e.g., 6-mercaptopurine, 6-thioguanine, pentostatin), (c) Natural Products, such as vinca alkaloids (e.g., vinblastine, vincristine), epipodophylotoxins (e.g., etoposide, teniposide), antibiotics (e.g., dactinomycin, daunorubicin, doxorubicin, bleomycin, plicamycin and mitoxanthrone), enzymes (e.g., L-asparaginase), and biological response modifiers (e.g., Interferon-α), and (d) Miscellaneous Agents, such as platinum coordination complexes (e.g., cisplatin, carboplatin), substituted ureas (e.g., hydroxyurea), methylhydiazine derivatives (e.g., procarbazine), and adreocortical suppressants (e.g., taxol and mitotane). In some embodiments, cisplatin is a particularly suitable chemotherapeutic agent. [00116] Cisplatin has been widely used to treat cancers such as, for example, metastatic testicular or ovarian carcinoma, advanced bladder cancer, head or neck cancer, cervical cancer, lung cancer or other tumors. Cisplatin is not absorbed orally and must therefore be delivered via other routes such as, for example, intravenous, subcutaneous, intratumoral or intraperitoneal injection. Cisplatin can be used alone or in combination with other agents, with
efficacious doses used in clinical applications including about 15 mg/m2 to about 20 mg/m2 for 5 days every three weeks for a total of three courses being contemplated in certain embodiments. In some embodiments, the amount of cisplatin delivered to the cell and/or subject in conjunction with the construct comprising an Egr-1 promoter operably linked to a polynucleotide encoding the therapeutic polypeptide is less than the amount that would be delivered when using cisplatin alone. [00117] Other suitable chemotherapeutic agents include antimicrotubule agents, e.g., Paclitaxel (“Taxol”) and doxorubicin hydrochloride (“doxorubicin”). The combination of an Egr-1 promoter/TNFα construct delivered via an adenoviral vector and doxorubicin was determined to be effective in overcoming resistance to chemotherapy and/or TNF-α, which suggests that combination treatment with the construct and doxorubicin overcomes resistance to both doxorubicin and TNF-α. [00118] Doxorubicin is absorbed poorly and is preferably administered intravenously. In certain embodiments, appropriate intravenous doses for an adult include about 60 mg/m2 to about 75 mg/m2 at about 21-day intervals or about 25 mg/m2 to about 30 mg/m2 on each of 2 or 3 successive days repeated at about 3 week to about 4 week intervals or about 20 mg/m2 once a week. The lowest dose should be used in elderly patients, when there is prior bone- marrow depression caused by prior chemotherapy or neoplastic marrow invasion, or when the drug is combined with other myelopoietic suppressant drugs. [00119] Nitrogen mustards are another suitable chemotherapeutic agent useful in the methods of the disclosure. A nitrogen mustard may include, but is not limited to, mechlorethamine (HN2), cyclophosphamide and/or ifosfamide, melphalan (L-sarcolysin), and chlorambucil. Cyclophosphamide (CYTOXAN®) is available from Mead Johnson and NEOSTAR® is available from Adria), is another suitable chemotherapeutic agent. Suitable oral doses for adults include, for example, about 1 mg/kg/day to about 5 mg/kg/day, intravenous doses include, for example, initially about 40 mg/kg to about 50 mg/kg in divided doses over a period of about 2 days to about 5 days or about 10 mg/kg to about 15 mg/kg about every 7 days to about 10 days or about 3 mg/kg to about 5 mg/kg twice a week or about 1.5 mg/kg/day to about 3 mg/kg/day. Because of adverse gastrointestinal effects, the intravenous route is preferred. The drug also sometimes is administered intramuscularly, by infiltration or into body cavities. [00120] Additional suitable chemotherapeutic agents include pyrimidine analogs, such as cytarabine (cytosine arabinoside), 5-fluorouracil (fluouracil; 5-FU) and floxuridine (fluorode- oxyuridine; FudR).5-FU may be administered to a subject in a dosage of anywhere between
about 7.5 to about 1000 mg/m2. Further, 5-FU dosing schedules may be for a variety of time periods, for example up to six weeks, or as determined by one of ordinary skill in the art to which this disclosure pertains. [00121] Gemcitabine diphosphate (GEMZAR®, Eli Lilly & Co., “gemcitabine”), another suitable chemotherapeutic agent, is recommended for treatment of advanced and metastatic pancreatic cancer, and will therefore be useful in the present disclosure for these cancers as well. [00122] The amount of the chemotherapeutic agent delivered to the patient may be variable. In one suitable embodiment, the chemotherapeutic agent may be administered in an amount effective to cause arrest or regression of the cancer in a host, when the chemotherapy is administered with the construct. In other embodiments, the chemotherapeutic agent may be administered in an amount that is anywhere between 2 to 10,000 fold less than the chemotherapeutic effective dose of the chemotherapeutic agent. For example, the chemotherapeutic agent may be administered in an amount that is about 20 fold less, about 500 fold less or even about 5000 fold less than the chemotherapeutic effective dose of the chemotherapeutic agent. The chemotherapeutics of the disclosure can be tested in vivo for the desired therapeutic activity in combination with the construct, as well as for determination of effective dosages. For example, such compounds can be tested in suitable animal model systems prior to testing in humans, including, but not limited to, rats, mice, chicken, cows, monkeys, rabbits, etc. In vitro testing may also be used to determine suitable combinations and dosages, as described in the examples. H. Radiotherapy [00123] In some embodiments, the additional therapy or prior therapy comprises radiation, such as ionizing radiation. As used herein, “ionizing radiation” means radiation comprising particles or photons that have sufficient energy or can produce sufficient energy via nuclear interactions to produce ionization (gain or loss of electrons). An exemplary and preferred ionizing radiation is an x-radiation. Means for delivering x-radiation to a target tissue or cell are well known in the art. I. Surgery [00124] Approximately 60% of persons with cancer will undergo surgery of some type, which includes preventative, diagnostic or staging, curative, and palliative surgery. Curative surgery includes resection in which all or part of cancerous tissue is physically removed, excised, and/or destroyed and may be used in conjunction with other therapies, such as the treatment of the present embodiments, chemotherapy, radiotherapy, hormonal therapy, gene
therapy, immunotherapy, and/or alternative therapies. Tumor resection refers to physical removal of at least part of a tumor. In addition to tumor resection, treatment by surgery includes laser surgery, cryosurgery, electrosurgery, and microscopically-controlled surgery (Mohs’ surgery). [00125] Upon excision of part or all of cancerous cells, tissue, or tumor, a cavity may be formed in the body. Treatment may be accomplished by perfusion, direct injection, or local application of the area with an additional anti-cancer therapy. Such treatment may be repeated, for example, every 1, 2, 3, 4, 5, 6, or 7 days, or every 1, 2, 3, 4, and 5 weeks or every 1, 2, 3, 4, 5, 6, 7, 8, 9, 10, 11, or 12 months. These treatments may be of varying dosages as well. J. Biologic Therapies [00126] It is contemplated that targeted therapies may be used in combination with the methods of the disclosure. The biologic therapy may include or exclude a tyrosine kinase inhibitor. The tyrosine kinase inhibitor may include or exclude axitinib, dasatinib, erlotinib, imatinib, nilotinib, pazopanib, sunitinib, and combinations thereof. The biologic therapy may include or exclude a proteasome inhibitor. The proteasome inhibitor may include or exclude bortezomib, carfilzomib, ixazomib, and combinations thereof. The biologic therapy may include or exclude a mTOR inhibitor. The mTOR inhibitor may include or exclude temsirolimus, and/or everolimus. The biologic therapy may include or exclude a PI3K inhibitor. The PI3K inhibitor may include or exclude idelalisib. The biologic therapy may include or exclude a histone deacetylase inhibitor. The histone deacetylase inhibitor may include or exclude vorinostat and/or romidepsin. The biologic therapy may include or exclude vismodegib. The biologic therapy may include or exclude a BRAF or MEK inhibitor. The BRAF or MEK inhibitor may include or exclude vemurafenib, dabrafenib, encorafenib, trametinib, binimetinib, and combinations thereof. K. Other Agents [00127] It is contemplated that other agents may be used in combination with certain aspects of the present embodiments to improve the therapeutic efficacy of treatment. These additional agents include Glucocorticoid therapy, TNF-alpha inhibitors such as infliximab, IFN-gamma inhibitors, IL-6 inhibitors, Mycophenolate mofetil, Cyclosporine, Cyclophosphamide, JAK inhibitor, STAT inhibitor, and Rituximab, and/or other inhibitors of B cell or plasma cell activity and proliferation. III. Protein Assays [00128] A variety of techniques can be employed to measure expression levels of polypeptides and proteins in a biological sample to determine biomarker expression levels.
Examples of such formats include, but are not limited to, enzyme immunoassay (EIA), radioimmunoassay (RIA), Western blot analysis, electrothermal or electrochemical magneto- immunosensors, lateral flow tests strip, Luminex, Nucleic acid Linked Immuno-Sandwich Assay (NULISA), and enzyme linked immunosorbent assay (ELISA). A skilled artisan can readily adapt known protein/antibody detection methods for use in determining protein expression levels of biomarkers. [00129] In one aspect, antibodies, or antibody fragments or derivatives, can be used in methods such as Western blots, ELISA, or immunofluorescence techniques to detect biomarker expression. In some aspects, either the antibodies or proteins are immobilized on a solid support. Suitable solid phase supports or carriers include any support capable of binding an antigen or an antibody. Well-known supports or carriers include glass, polystyrene, polypropylene, polyethylene, dextran, nylon, amylases, natural and modified celluloses, polyacrylamides, gabbros, and magnetite. [00130] One skilled in the art will know many other suitable carriers for binding antibody or antigen, and will be able to adapt such support for use with the present disclosure. The support can then be washed with suitable buffers followed by treatment with the detectably labeled antibody. The solid phase support can then be washed with the buffer a second time to remove unbound antibody. The amount of bound label on the solid support can then be detected by conventional means. [00131] Immunohistochemistry methods are also suitable for detecting the expression levels of biomarkers. In some aspects, antibodies or antisera, including polyclonal antisera, and monoclonal antibodies specific for each marker may be used to detect expression. The antibodies can be detected by direct labeling of the antibodies themselves, for example, with radioactive labels, fluorescent labels, hapten labels such as, biotin, or an enzyme such as horseradish peroxidase or alkaline phosphatase. Alternatively, unlabeled primary antibody is used in conjunction with a labeled secondary antibody, comprising antisera, polyclonal antisera or a monoclonal antibody specific for the primary antibody. Immunohistochemistry protocols and kits are well known in the art and are commercially available. [00132] Immunological methods for detecting and measuring complex formation as a measure of protein expression using either specific polyclonal or monoclonal antibodies are known in the art. Examples of such techniques include enzyme-linked immunosorbent assays (ELISAs), radioimmunoassays (RIAs), fluorescence-activated cell sorting (FACS) and antibody arrays. Such immunoassays typically involve the measurement of complex formation between the protein and its specific antibody. These assays and their quantitation against
purified, labeled standards are well known in the art. A two-site, monoclonal-based immunoassay utilizing antibodies reactive to two non-interfering epitopes or a competitive binding assay may be employed. [00133] Numerous labels are available and commonly known in the art. Radioisotope labels include, for example, 36S, 14C, 125I, 3H, and 131I. The antibody can be labeled with the radioisotope using the techniques known in the art. Fluorescent labels include, for example, labels such as rare earth chelates (europium chelates) or fluorescein and its derivatives, rhodamine and its derivatives, dansyl, Lissamine, phycoerythrin and Texas Red are available. The fluorescent labels can be conjugated to the antibody variant using the techniques known in the art. Fluorescence can be quantified using a fluorimeter. Various enzyme-substrate labels are available and U.S. Pat. Nos.4,275,149, 4,318,980 provides a review of some of these. The enzyme generally catalyzes a chemical alteration of the chromogenic substrate which can be measured using various techniques. For example, the enzyme may catalyze a color change in a substrate, which can be measured spectrophotometrically. Alternatively, the enzyme may alter the fluorescence or chemiluminescence of the substrate. Techniques for quantifying a change in fluorescence are described above. The chemiluminescent substrate becomes electronically excited by a chemical reaction and may then emit light which can be measured (using a chemiluminometer, for example) or donates energy to a fluorescent acceptor. Examples of enzymatic labels include luciferases (e.g., firefly luciferase and bacterial luciferase; U.S. Pat. No. 4,737,456), luciferin, 2,3-dihydrophthalazinediones, malate dehydrogenase, urease, peroxidase such as horseradish peroxidase (HRPO), alkaline phosphatase, beta-galactosidase, glucoamylase, lysozyme, saccharide oxidases (e.g., glucose oxidase, galactose oxidase, and glucose-6-phosphate dehydrogenase), heterocyclic oxidases (such as uricase and xanthine oxidase), lactoperoxidase, microperoxidase, and the like. Techniques for conjugating enzymes to antibodies are described in O'Sullivan et al., Methods for the Preparation of Enzyme-Antibody Conjugates for Use in Enzyme Immunoassay, in Methods in Enzymology (Ed. J. Langone & H. Van Vunakis), Academic press, New York, 73: 147-166 (1981). [00134] In some aspects, a detection label is indirectly conjugated with an antibody. The skilled artisan will be aware of various techniques for achieving this. For example, the antibody can be conjugated with biotin and any of the three broad categories of labels mentioned above can be conjugated with avidin, or vice versa. Biotin binds selectively to avidin and thus, the label can be conjugated with the antibody in this indirect manner. Alternatively, to achieve indirect conjugation of the label with the antibody, the antibody is conjugated with a small
hapten (e.g., digoxin) and one of the different types of labels mentioned above is conjugated with an anti-hapten antibody (e.g., anti-digoxin antibody). In some aspects, the antibody need not be labeled, and the presence thereof can be detected using a labeled antibody, which binds to the antibody. IV. Gene and RNA Expression Levels [00135] Methods disclosed herein include measuring expression of genes and/or RNAs (RNAs) such as messenger RNAs (mRNAs) and noncoding RNAs (ncRNAs). Measurement of expression can be done by a number of processes known in the art. The process of measuring expression may begin by extracting RNA from a biological sample. Extracted mRNA and/or ncRNA can be detected by hybridization (for example by means of Northern blot analysis or DNA or RNA arrays (microarrays) after converting RNA into labeled cDNA) and/or amplification by means of a enzymatic chain reaction. Quantitative or semi-quantitative enzymatic amplification methods such as polymerase chain reaction (PCR) or quantitative real- time RT-PCR or semi-quantitative RT-PCR techniques or NULISA or bulk RNA sequencing can be used. Suitable primers for amplification methods encompassed herein can be readily designed by a person skilled in the art. Other amplification methods include ligase chain reaction (LCR), transcription-mediated amplification (TMA), strand displacement amplification (SDA), isothermal amplification of nucleic acids, and nucleic acid sequence- based amplification (NASBA). Expression levels of mRNAs and/or ncRNAs may also be measured by RNA sequencing methods known in the art. RNA sequencing methods may include mRNA-seq, total RNA-seq, targeted RNA-seq, small RNA-seq, single-cell RNA-seq, ultra-low-input RNA-seq, RNA exome capture sequencing, and ribosome profiling. Sequencing data may be processed an aligned using methods known in the art. [00136] To normalize the expression values of one gene among different samples, comparing the mRNA and/or ncRNA level of interest in the samples from the subject object of study with a control RNA level is possible. As it is used herein, a "control RNA" is an RNA of a gene for which the expression level does not differ among different non-diseased individuals. In some aspects, the gene may be constitutively expressed in all types of cells. A control RNA is preferably an mRNA derived from a housekeeping gene encoding a protein that is constitutively expressed and carrying out essential cell functions. A known amount of a control RNA may be added to the sample(s) and the value measured for the level of the RNA of interest may be normalized to the value measured for the known amount of the control RNA. Normalization for some methods, such as for sequencing, may comprise calculating the reads per kilobase of transcript per million mapped reads (RPKM) for a gene of interest, or may
comprise calculating the fragments per kilobase of transcript per million mapped reads (FPKM) for a gene of interest. Normalization methods may comprise calculating the log2-transformed count per million (log-CPM). It can be appreciated to one skilled in the art that any method of normalization that accurately calculates the expression value of an RNA for comparison between samples may be used. [00137] Methods disclosed herein may include comparing a measured expression level to a reference expression level. The term "reference expression level" refers to a value used as a reference for the values/data obtained from samples obtained from patients. The reference level can be an absolute value, a relative value, a value which has an upper and/or lower limit, a series of values, an average value, a median, a mean value, or a value expressed by reference to a control or reference value. A reference level can be based on the value obtained from an individual sample, such as, for example, a value obtained from a sample from the subject object of study but obtained at a previous point in time. The reference level can be based on a high number of samples, such as the levels obtained in a cohort of subjects having a particular characteristic. The reference level may be defined as the mean level of the patients in the cohort. The reference may be from subjects that are healthy, subjects without one or more neurological disorder(s), subjects that are age-matched, subjects that are gender-matched, and/or subjects that are race-matched. A reference level can be based on the expression levels of the markers to be compared obtained from samples from subjects who do not have a disease state or a particular phenotype. The person skilled in the art will see that the particular reference expression level can vary depending on the specific method to be performed. [00138] Some embodiments include determining that a measured expression level is higher than, lower than, increased relative to, decreased relative to, equal to, or within a predetermined amount of a reference expression level. In some embodiments, a higher, lower, increased, or decreased expression level is at least 1, 1.5, 2, 2.5, 3, 3.5, 4, 4.5, 5, 5.5, 6, 7, 8, 9, 10, 12, 14, 16, 18, 20, 50, 100, 150, 200, 250, 500, or 1000 fold (or any derivable range therein) or at least 10, 20, 30, 40, 50, 60, 70, 80, 90, 100, 200, 300, 400, 500, 600, 700, 800, or 900% different than the reference level, or any derivable range therein. These values may represent a predetermined threshold level, and some embodiments include determining that the measured expression level is higher by a predetermined amount or lower by a predetermined amount than a reference level. In some embodiments, a level of expression may be qualified as “low” or “high,” which indicates the patient expresses a certain gene or RNA at a level relative to a reference level or a level with a range of reference levels that are determined from multiple samples meeting particular criteria. The level or range of levels in multiple control samples is
an example of this. In some embodiments, that certain level or a predetermined threshold value is at, below, or above 1, 2, 3, 4, 5, 6, 7, 8, 9, 10, 11, 12, 13, 14, 15, 16, 17, 18, 19, 20, 21, 22, 23, 24, 25, 26, 27, 28, 29, 30, 31, 32, 33, 34, 35, 36, 37, 38, 39, 40, 41, 42, 43, 44, 45, 46, 47, 48, 49, 50, 51, 52, 53, 54, 55, 56, 57, 58, 59, 60, 61, 62, 63, 64, 65, 66, 67, 68, 69, 70, 71, 72, 73, 74, 75, 76, 77, 78, 79, 80, 81, 82, 83, 84, 85, 86, 87, 88, 89, 90, 91, 92, 93, 94, 95, 96, 97, 98, 99, 100 percentile, or any range derivable therein. Moreover, a threshold level may be derived from a cohort of individuals meeting a particular criterion or set of criteria. The number in the cohort may be, be at least, or be at most 10, 20, 30, 40, 50, 60, 70, 80, 90, 100, 110, 120, 130, 140, 150, 160, 170, 180, 190, 200, 210, 220, 230, 240, 250, 260, 270, 280, 290, 300, 310, 320, 330, 340, 350, 360, 370, 380, 390, 400, 410, 420, 430, 440, 441, 450, 460, 470, 480, 490, 500, 510, 520, 530, 540, 550, 560, 570, 580, 590, 600, 700, 800, 900, 1000, 1100, 1200, 1300, 1400, 1500, 1600, 1700, 1800, 1900, 2000 or more (or any range derivable therein). A measured expression level can be considered equal to a reference expression level if it is within a certain amount of the reference expression level, and such amount may be an amount that is predetermined. The predetermined amount may be within 0.1, 0.2, 0.3, 0.4, 0.5, 0.6, 0.7, 0.8, 0.9, 1.0, 2, 3, 4, 5, 6, 7, 8, 9, 10, 11, 12, 13, 14, 15, 16, 17, 18, 19, 20, 21, 22, 23, 24, 25, 30, 35, 40, 45, or 50% of the reference level, or any range derivable therein. [00139] For any comparison of gene and/or RNA expression levels to a mean expression level or a reference expression level, the comparison is to be made on a gene-by-gene and RNA-by-RNA basis. V. Biomarkers [00140] In certain aspects, the methods include a method for evaluating a subject comprising one or more steps for measuring the level of one or more biomarker(s) from one or more biological sample(s) from the subject. [00141] The term “biomarker” refers to a biological molecule, or fragment of a biological molecule, the change and/or detection of which can be correlated with a particular physical condition or state. For example, the biomarker(s) of the present disclosure may be correlated with an irAE, such as ICI-AIN. Such biomarkers include any suitable analyte, but are not limited to, biological molecules comprising nucleotides, nucleic acids, nucleosides, amino acids, sugars, fatty acids, steroids, metabolites, peptides, polypeptides, proteins, carbohydrates, lipids, hormones, antibodies, regions of interest that serve as surrogates for biological macromolecules and combinations thereof (e.g., glycoproteins, ribonucleoproteins, lipoproteins). The term also encompasses portions or fragments of a biological molecule, for example, peptide fragments of a protein or polypeptide.
Table 17. Exemplary Biomarker


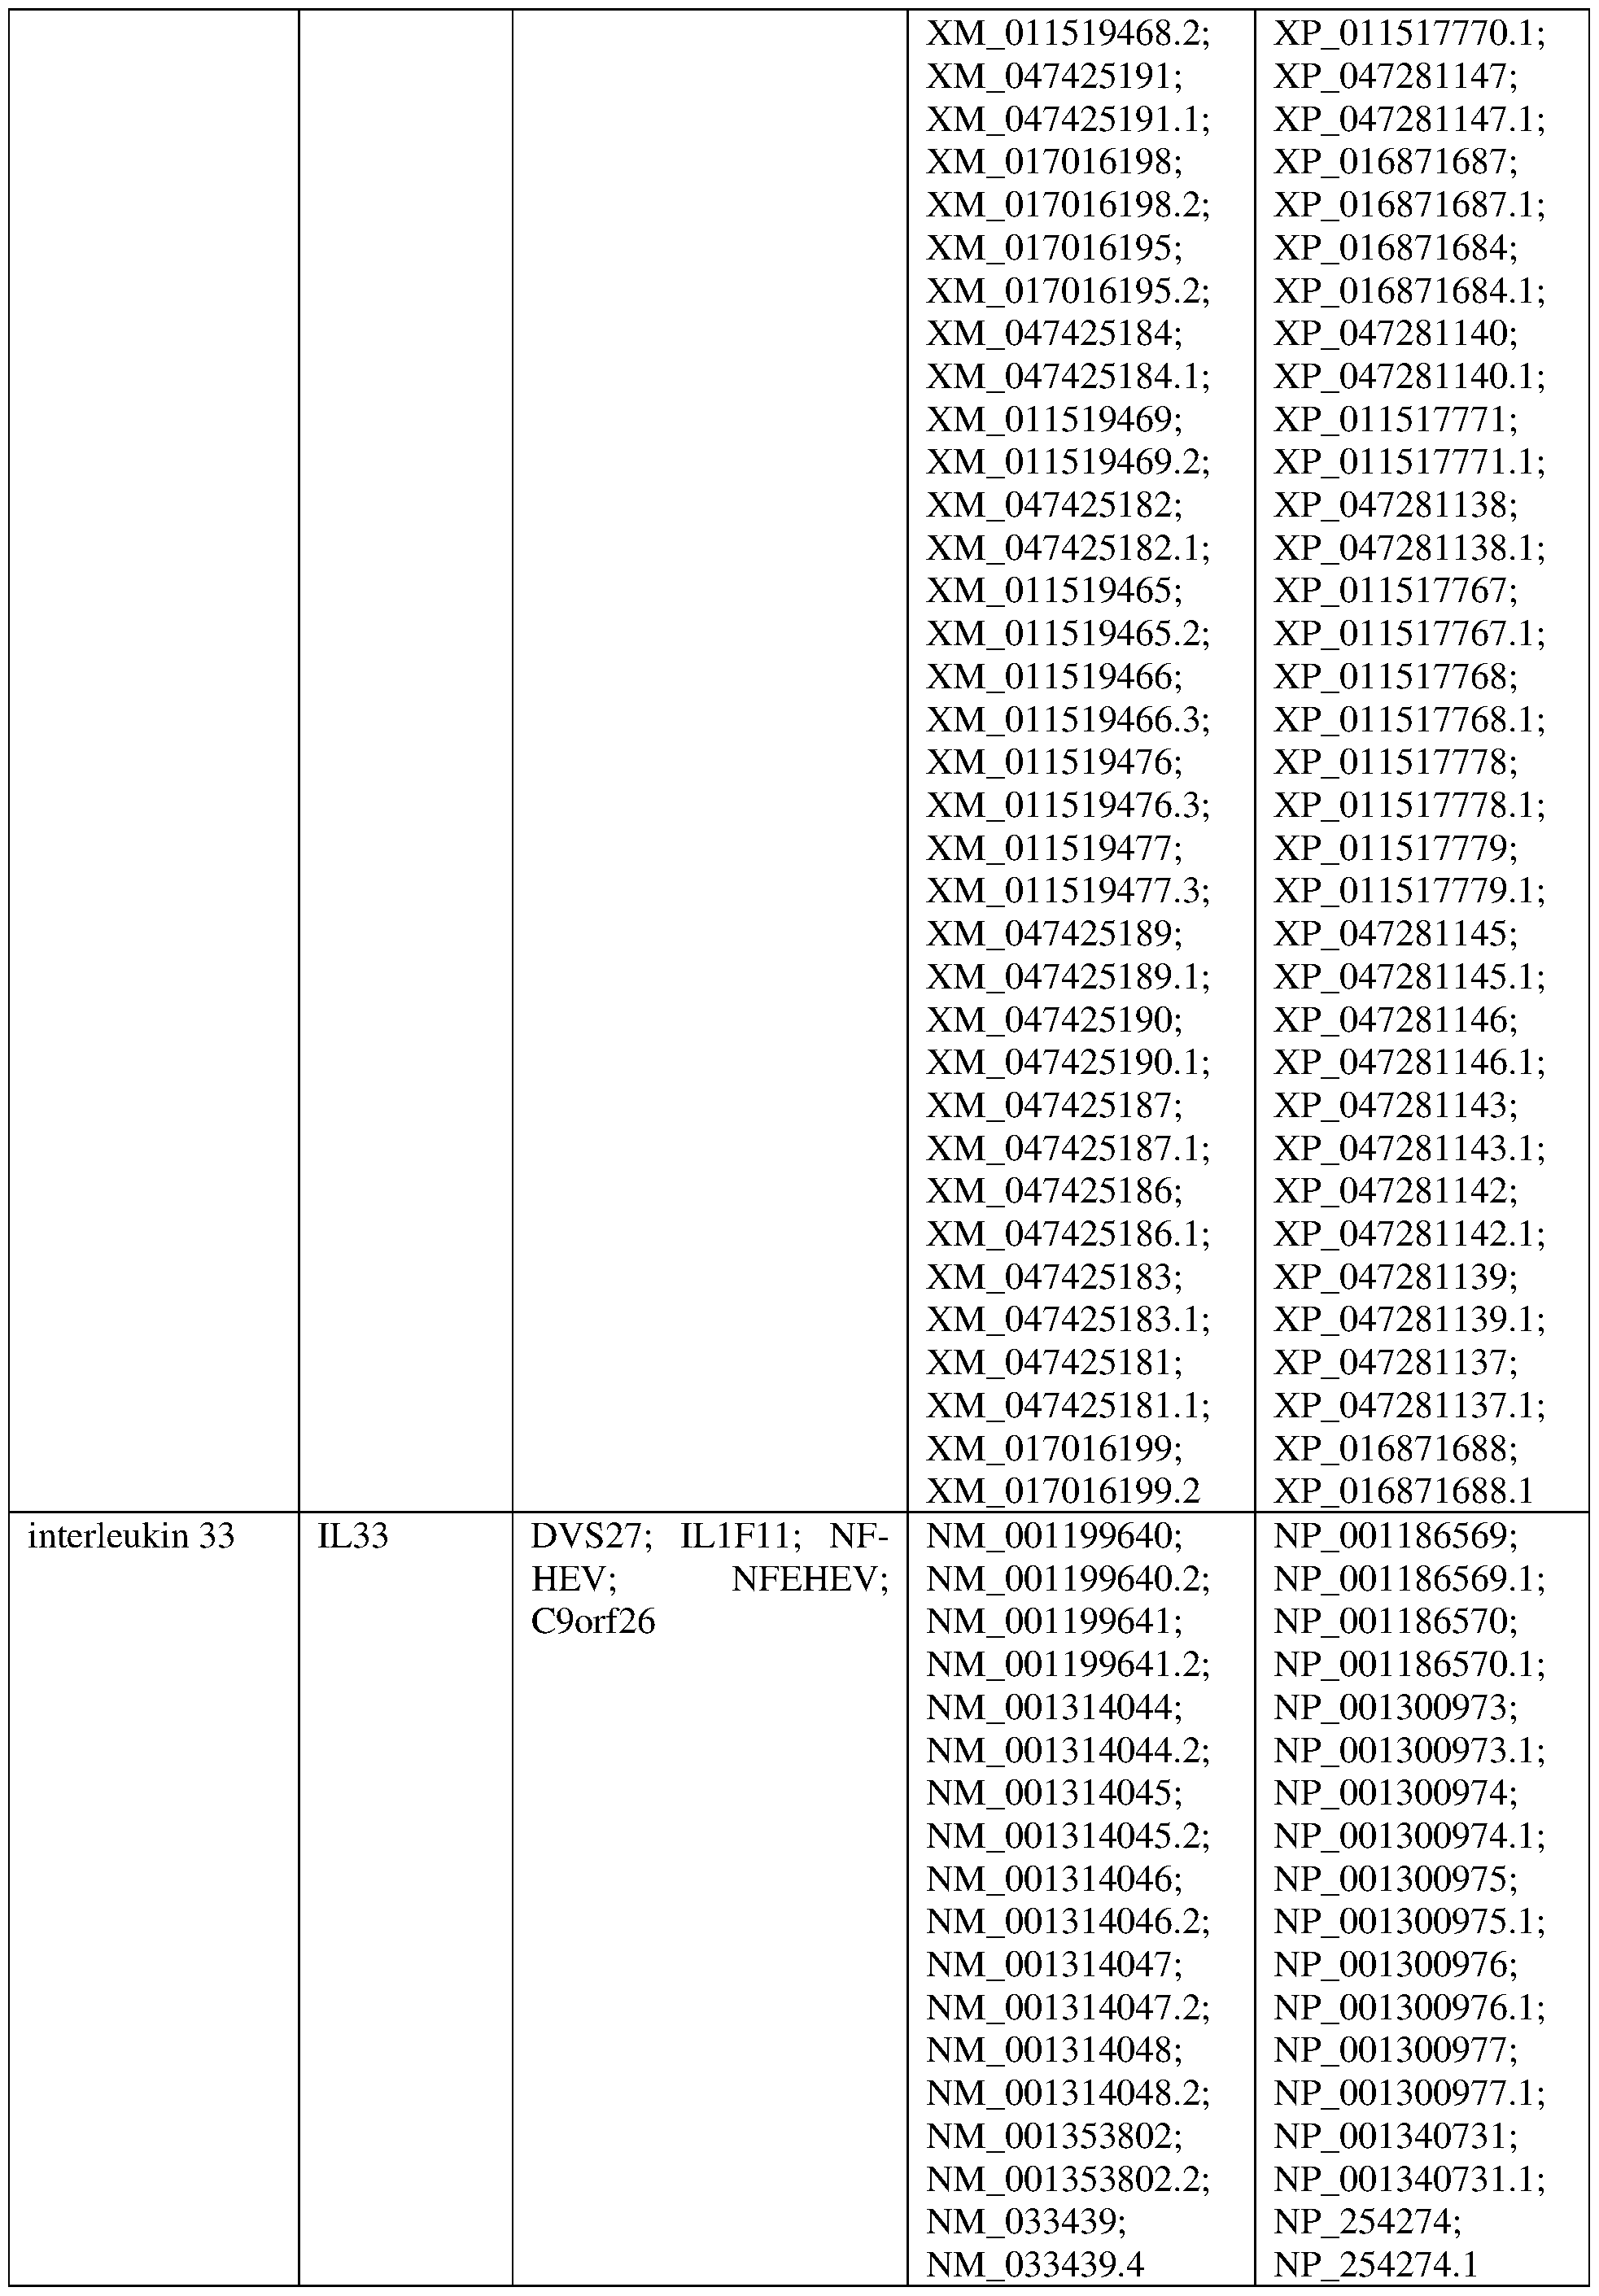


 **The sequences associated with the GenBank accession numbers are herein incorporated by reference for all purposes.
[00142] 49 urine specimens were evaluated, including 22 ICI-AIN and 27 non-AIN. Using NULISA, 203 inflammatory proteins were analyzed in each specimen. The protein markers with an FDR < 0.01 and AUC > 0.75 are listed below and ranked by AUC. Urine Biomarkers
**The sequences associated with the GenBank accession numbers are herein incorporated by reference for all purposes.
[00142] 49 urine specimens were evaluated, including 22 ICI-AIN and 27 non-AIN. Using NULISA, 203 inflammatory proteins were analyzed in each specimen. The protein markers with an FDR < 0.01 and AUC > 0.75 are listed below and ranked by AUC. Urine Biomarkers
 [00143] 42 plasma specimens were evaluated, including 20 ICI-AIN and 22 non-AIN. Using NULISA, 203 inflammatory proteins were analyzed in each specimen. The list below includes the 29 plasma proteins with an FDR < 0.01 and AUC > 0.75 (ranked by AUC). Plasma Biomarkers

 [00144] Marker combinations were also evaluated. The table below provides AUCs for specific combinations of markers in urine samples.

 VI. Sample Preparation [00145] In certain aspects, methods involve obtaining one or more sample(s) from a subject. The methods of obtaining provided herein may include methods of biopsy such as fine needle aspiration, core needle biopsy, vacuum assisted biopsy, incisional biopsy, excisional biopsy, punch biopsy, shave biopsy, nephrectomy, or skin biopsy. Alternatively, the sample may be obtained from any other source including but not limited to blood, serum, plasma, urine, pericardial fluid, joint aspiration, pleural fluid, sweat, hair follicle, buccal tissue, tears, menses, feces, or saliva. In certain aspects of the current methods, any medical professional such as a doctor, nurse or medical technician, clinical coordinator may obtain a biological sample for
testing. Yet further, the biological sample can be obtained without the assistance of a medical professional. [00146] A sample may include but is not limited to, tissue, cells, or biological material from cells or derived from cells of a subject. The biological sample may be a heterogeneous or homogeneous population of cells or tissues. The biological sample may be obtained using any method known to the art that can provide a sample suitable for the analytical methods described herein. The sample may be obtained by non-invasive methods including but not limited to: scraping of the skin or cervix, swabbing of the cheek, saliva collection, urine collection, feces collection, collection of menses, tears, any type of body fluid, blood, plasma, or semen. [00147] The sample may be obtained by methods known in the art. In certain aspects the samples are obtained by biopsy. In other aspects the sample is obtained by swabbing, endoscopy, scraping, phlebotomy, or any other methods known in the art. In some cases, the sample may be obtained, stored, or transported using components of a kit of the present methods. In some cases, multiple samples, such as multiple plasma or serum samples may be obtained for diagnosis by the methods described herein. In other cases, multiple samples, such as one or more samples from one tissue type (for example kidney(s) or related tissues) and one or more samples from another specimen (for example serum, plasma, urine) may be obtained for diagnosis by the methods. Samples may be obtained at different times are stored and/or analyzed by different methods. For example, a sample may be obtained and analyzed by routine staining methods or any other cytological analysis methods. [00148] In some aspects the biological sample may be obtained by a physician, nurse, or other medical professional such as a medical technician, endocrinologist, cytologist, phlebotomist, radiologist, or a pulmonologist. The medical professional may indicate the appropriate test or assay to perform on the sample. In certain aspects a molecular profiling business may consult on which assays or tests are most appropriately indicated. In further aspects of the current methods, the patient or subject may obtain a biological sample for testing without the assistance of a medical professional, such as obtaining a whole blood sample, a urine sample, a fecal sample, a buccal sample, or a saliva sample. [00149] In other cases, the sample is obtained by an invasive procedure including but not limited to: biopsy, needle aspiration, blood draw, endoscopy, or phlebotomy. The method of needle aspiration may further include fine needle aspiration, core needle biopsy, vacuum assisted biopsy, or large core biopsy. In some aspects, multiple samples may be obtained by the methods herein to ensure a sufficient amount of biological material.
[00150] General methods for obtaining biological samples are also known in the art. Publications such as Ramzy, Ibrahim Clinical Cytopathology and Aspiration Biopsy 2001, which is herein incorporated by reference in its entirety, describes general methods for biopsy and cytological methods. [00151] In some aspects of the present methods, the molecular profiling business may obtain the biological sample from a subject directly, from a medical professional, from a third party, or from a kit provided by a molecular profiling business or a third party. In some cases, the biological sample may be obtained by the molecular profiling business after the subject, a medical professional, or a third party acquires and sends the biological sample to the molecular profiling business. In some cases, the molecular profiling business may provide suitable containers, and excipients for storage and transport of the biological sample to the molecular profiling business. [00152] In some aspects of the methods described herein, a medical professional need not be involved in the initial diagnosis or sample acquisition. An individual may alternatively obtain a sample through the use of an over the counter (OTC) kit. An OTC kit may contain a means for obtaining said sample as described herein, a means for storing said sample for inspection, and instructions for proper use of the kit. In some cases, molecular profiling services are included in the price for purchase of the kit. In other cases, the molecular profiling services are billed separately. A sample suitable for use by the molecular profiling business may be any material containing tissues, cells, nucleic acids, genes, gene fragments, expression products, gene expression products, or gene expression product fragments of an individual to be tested. Methods for determining sample suitability and/or adequacy are provided. [00153] In some aspects, the subject may be referred to a specialist such as an oncologist, surgeon, nephrologist, or endocrinologist. The specialist may likewise obtain a biological sample for testing or refer the individual to a testing center or laboratory for submission of the biological sample. In some cases, the medical professional may refer the subject to a testing center or laboratory for submission of the biological sample. In other cases, the subject may provide the sample. In some cases, a molecular profiling business may obtain the sample. VII. Administration of Therapeutic Compositions [00154] The therapy provided herein may comprise administration of a combination of therapeutic agents, such as a first cancer therapy, a second cancer therapy, and/or treatment of an irAE. The therapies may be administered in any suitable manner known in the art. For example, the first and second cancer treatment may be administered sequentially (at different times) or concurrently (at the same time). In some aspects, the first and second cancer
treatments are administered in a separate composition. In some aspects, the first and second cancer treatments are in the same composition. [00155] Aspects of the disclosure relate to compositions and methods comprising therapeutic compositions. The different therapies may be administered in one composition or in more than one composition, such as 2 compositions, 3 compositions, or 4 compositions. Various combinations of the agents may be employed. [00156] The therapeutic agents of the disclosure may be administered by the same route of administration or by different routes of administration. In some aspects, the cancer therapy or treatment of an irAE is administered intravenously, intramuscularly, subcutaneously, topically, orally, transdermally, intraperitoneally, intraorbitally, by implantation, by inhalation, intrathecally, intraventricularly, or intranasally. In some aspects, the composition is administered intravenously, intramuscularly, subcutaneously, topically, orally, transdermally, intraperitoneally, intraorbitally, by implantation, by inhalation, intrathecally, intraventricularly, or intranasally. The appropriate dosage may be determined based on the type of disease to be treated, severity and course of the disease, the clinical condition of the individual, the individual's clinical history and response to the treatment, and the discretion of the attending physician. [00157] The treatments may include various “unit doses.” Unit dose is defined as containing a predetermined-quantity of the therapeutic composition. The quantity to be administered, and the particular route and formulation, is within the skill of determination of those in the clinical arts. A unit dose need not be administered as a single injection but may comprise continuous infusion over a set period of time. In some aspects, a unit dose comprises a single administrable dose. [00158] Precise amounts of the therapeutic composition also depend on the judgment of the practitioner and are peculiar to each individual. Factors affecting dose include physical and clinical state of the patient, the route of administration, the intended goal of treatment (alleviation of symptoms versus cure) and the potency, stability and toxicity of the particular therapeutic substance or other therapies a subject may be undergoing. VIII. Kits [00159] Certain aspects of the present invention also concern kits containing compositions of the invention or compositions to implement methods of the invention. In some aspects, kits can be used to evaluate one or more biomarkers. In certain aspects, a kit contains, contains at least or contains at most 1, 2, 3, 4, 5, 6, 7, 8, 9, 10, 11, 12, 13, 14, 15, 16, 17, 18, 19, 20, 21, 22, 23, 24, 25, 26, 27, 28, 29, 30, 31, 32, 33, 34, 35, 36, 37, 38, 39, 40, 41, 42, 43, 44, 45, 46,
47, 48, 49, 50, 100, 500, 1,000 or more probes, primers or primer sets, synthetic molecules, antibodies, or inhibitors, or any value or range and combination derivable therein. In some aspects, there are kits for evaluating biomarker activity or level in a cell. [00160] Kits may comprise components, which may be individually packaged or placed in a container, such as a tube, bottle, vial, syringe, or other suitable container means. [00161] Individual components may also be provided in a kit in concentrated amounts; in some aspects, a component is provided individually in the same concentration as it would be in a solution with other components. Concentrations of components may be provided as 1x, 2x, 5x, 10x, or 20x or more. [00162] Kits for using probes, antibodies, synthetic nucleic acids, nonsynthetic nucleic acids, and/or inhibitors of the disclosure for prognostic or diagnostic applications are included as part of the disclosure. Specifically contemplated are any such molecules corresponding to any biomarker identified herein, which includes antibodies that bind to such biomarkers as well as nucleic acid primers/primer sets and probes that are identical to or complementary to all or part of a biomarker, which may include noncoding sequences of the biomarker, as well as coding sequences of the biomarker. [00163] In certain aspects, negative and/or positive control nucleic acids, antibodies, probes, and inhibitors are included in some kit aspects. In addition, a kit may include a sample that is a negative or positive control for methylation of one or more biomarkers. [00164] It is contemplated that any method or composition described herein can be implemented with respect to any other method or composition described herein and that different aspects may be combined. The claims originally filed are contemplated to cover claims that are multiply dependent on any filed claim or combination of filed claims. IX. Examples [00165] The following examples are included to demonstrate preferred embodiments of the invention. It should be appreciated by those of skill in the art that the techniques disclosed in the examples which follow represent techniques discovered by the inventor to function well in the practice of the invention, and thus can be considered to constitute preferred modes for its practice. However, those of skill in the art should, in light of the present disclosure, appreciate that many changes can be made in the specific embodiments which are disclosed and still obtain a like or similar result without departing from the spirit and scope of the invention.
Example 1: Tertiary lymphoid structure signatures are associated with immune checkpoint inhibitor related acute interstitial nephritis [00166] Tertiary lymphoid structures (TLSs) are associated with anti-tumor response following immune checkpoint inhibitor (ICI) therapy, but a commensurate observation of TLS is absent for immune related adverse events (irAEs) i.e. acute interstitial nephritis (AIN). The inventors hypothesized that TLS-associated inflammatory gene signatures are present in AIN and performed NanoString-based gene expression and multiplex 12-chemokine profiling on paired kidney tissue, urine and plasma specimens of 36 participants who developed acute kidney injury (AKI) on ICI therapy: AIN (18), acute tubular necrosis (9), or HTN nephrosclerosis (9). Increased T and B cell scores, a Th1-CD8+ T cell axis accompanied by interferon-g and TNF superfamily signatures were detected in the ICI-AIN group. TLS signatures were significantly increased in AIN cases and supported by histopathological identification. Furthermore, urinary TLS signature scores correlated with ICI-AIN diagnosis but not paired plasma. Urinary CXCL9 correlated best to tissue CXCL9 expression (rho 0.75, p < 0.001) and the ability to discriminate AIN vs. non-AIN (AUC 0.781, p-value 0.003). For the first time, the inventors report the presence of TLS signatures in irAEs, define distinctive immune signatures, identify chemokine markers distinguishing ICI-AIN from common AKI etiologies and demonstrate that urine chemokine markers may be used as a surrogate for ICI- AIN or renal irAE diagnoses. A. INTRODUCTION [00167] ICI therapy can be a highly effective cancer treatment option but increasing T-cell activity can also increase T cell autoreactivity leading to the development of immune related adverse events (irAEs). Over 60% of patients treated with immune checkpoint blockade will develop at least one irAE (4, 5). Since the development of irAEs is associated with increased immune activity, studies among more common irAEs, such as dermatitis, colitis and various endocrinopathies, are linked with increased ICI efficacy. Less is known, however, in patient outcomes for uncommon irAEs such as renal irAEs, which usually manifest as acute interstitial nephritis (AIN) (6). Although 15-20% of patients on immune checkpoint blockade will develop acute kidney injury (AKI), only 2-5% of cases will be AIN (6-8). Timely and accurate diagnosis of AIN is complicated due to the lack of non-invasive diagnostic tests; as such, kidney biopsy remains the gold standard. In patients with cancer, a kidney biopsy may not always be feasible and when performed may carry a significant risk of morbidity such as major bleeding complications in 1.6-5% of cases; consequently, steroid therapy is often initiated empirically for presumed ICI-AIN (9-13). Difficulties in diagnosing AIN, the low frequency of ICI-AIN
occurrence, and delays in AKI management contribute to the development of permanent functional kidney loss in over 50% of ICI-AIN patients despite glucocorticoid therapy (14). A greater understanding of the pathophysiology of ICI-AIN will improve one’s ability to accurately diagnose AIN and enable prompt implementation of therapeutic strategies. [00168] To address this knowledge gap, the inventors asked whether differential expression of genes could be uncovered in kidney tissue biopsies of patients who developed AKI on ICI therapy that distinguishes AIN from other kidney pathologies such as acute tubular necrosis (ATN) or hypertensive (HTN) nephrosclerosis. The inventors report significant increases in genes associated with pro-inflammatory cytokines and immune cells in the ICI-AIN group compared to the ATN or HTN nephrosclerosis groups which led us to inquire if TLS signatures could be detected. Finally, the inventors asked whether these kidney biopsy results correlated with paired urine and plasma specimens providing a less invasive means of detecting ICI-AIN in patients receiving immune checkpoint therapy. This study is, to the inventors’ knowledge, the first to demonstrate the presence of distinguishing TLS features in ICI-AIN and in fact, any ICI-associated toxicity, that is detectable in both tissue and urine and identifies urine markers that can differentiate ICI-AIN from non-AIN. B. RESULTS 1. Cohort characteristics and kidney injury assignment [00169] The inventors enrolled 36 patients who had received ICI therapy and underwent a clinically indicated kidney biopsy for AKI evaluation at The University of Texas MD Anderson Cancer Center (FIG. 1). Relevant clinical and pathological characteristics are presented in Table 1. The participants were grouped according to their major pathological biopsy diagnosis of AIN, ATN or HTN nephrosclerosis and comparisons were made for different demographic and pathological parameters. A greater proportion of patients were males in the ICI-AIN group. Only two participants received anti-PD-L1 therapy. While baseline levels of creatinine were higher in the HTN group (Cr 1.30 mg/dl) compared to both AIN (1.00 mg/dl) and ATN (0.90 mg/dl) groups, average peak serum creatinine was identified to be higher in ICI-AIN compared to ATN and HTN. Ten out of the 18 ICI-AIN cases had stage 3 AKI (4 stage 2, and 4 stage 1) by KDIGO criteria (15). In the ATN group, each AKI stage was equally represented (3 stage 1, 3 stage 2 and 3 stage 3). For the HTN group, almost all patients were AKI stage 1 (3 stage 1, 0 stage 2, 1 stage 3). Percent of inflammation in the renal cortex was significantly higher in ICI-AIN compared to ATN and HTN groups (16). Median time from first ICI infusion to AKI for AIN was 145 days, 67 days ATN group and 197 days in the HTN group. Almost all ICI- AIN patients received corticosteroid therapy with 7 patients achieving complete renal recovery,
8 partial renal recovery and 3 with no renal recovery. In the ATN group, 2 patients achieved complete renal recovery and 7 had partial renal recovery. For the HTN group, 5 of the 9 patients had complete renal recovery while 3 had partial and 1 had no renal recovery. Only 2 of the ICI- AIN patients were re-challenged on ICI therapy while 6 of the 9 ATN and all HTN group participants resumed ICI therapy. 2. Renal pathology and cellular characterization of immune cell infiltrates [00170] The clinical diagnosis of AKI was made by histological examination of the biopsied kidney tissue by the renal pathologist. Representative images are shown in FIG. 2. Histopathological analysis of the kidney biopsy showed that AIN was characterized by dense lymphocytic infiltrates along with varying numbers of neutrophils, plasma cells and eosinophils. Often lymphocytic tubulitis was present, which in some cases was severe with associated tubular basement membrane disruption. By comparison, cases of ATN showed tubular epithelial injury that manifested as ectatic, flattened epithelium and loss of brush borders. Interstitial inflammation associated with ATN was minimal to mild consisting predominantly of lymphocytes and plasma cells and tubulitis was minimal, if present, but was typically absent. Cases of HTN nephrosclerosis showed absent to minimal interstitial infiltration by lymphocytes and plasma cells and tubulitis was not present. 3. Identification of differentially expressed genes and infiltrating immune cells in AIN [00171] AIN and ATN are the most frequently reported kidney pathologies from biopsied cancer patients on ICI therapy. Although both are acute conditions of kidney injury with similar clinical presentation, only AIN can be treated with glucocorticoids and ATN is generally considered to be a toxic ischemic injury without any specific therapy. This divergent response to anti-inflammatory therapy combined with distinct lymphocyte infiltration patterns observed in renal pathology strongly suggests a difference in the immune gene expression profile in AIN and ATN. To identify the genes that are differentially expressed in these two pathologies, the inventors performed a comprehensive gene expression analysis using NanoString nCounter PanCancer Immune Profiling Panel. Out of 770 genes evaluated, in AIN vs ATN, a total of 23 differentially expressed genes (DEGs) with a fold change ± 4 (p-Adj < 0.01) was detected. These genes were upregulated in AIN compared to ATN. Among the DEGs eight of the top ten most differentially expressed genes were inflammatory chemokines and immune associated genes (CCL18, CXCL11, CXCL10, CXCL9, CXCL8, CXCL7, TREM1) and (SLAMF1) a gene associated with activated T and B lymphocytes (FIG.3A and Table 2). Between AIN and HTN, a total of 159 differentially expressed genes with a fold change ± 4 were detected (p-Adj
< 0.01). Similar to AIN vs ATN, the top ten DEGs were inflammatory chemokines (CCL18, CCR7, CXCL10, LTF, CXCL9, CXCL6, CCL13) and genes associated with AKI (SAA1, LCN2, C3) (FIG.3A and Table 3). In contrast, comparison of gene expression profile of ATN and HTN groups revealed differentially expressed genes that are different from the AIN group (FIG.7) suggesting an unrelated etiology for ATN. [00172] To determine if the elevated chemokine profile was associated with increased immune cell infiltration in the kidney tissue, the inventors used immune cell gene signatures to compare cell scores among AIN, ATN and HTN groups. These scores are indicative of the relative abundance of cells in the tissue (17, 18). Consistent with the pathology findings, AIN cases had significantly higher immune cell scores for T and B lymphocytes, macrophages, neutrophils and dendritic cells compared to both the ATN and HTN group (FIG. 3B). The inventors did not detect a difference in the natural killer (NK) cell score among the three groups (FIG.3B). 4. Deconvolution of T cell composition and their function [00173] Different T cell subtypes, namely CD8+ T cells and Th17, have been identified for commonly occurring irAEs such as colitis and rheumatoid arthritis (19-22). However, the specific immune cell subsets and mechanism of pathogenesis associated with ICI-AIN are underexplored. The inventors used NanoString analysis to deconvolute immune cell gene expressions to identify and determine the abundance of T cell subsets infiltrating the kidneys. Our analysis showed an increase in Th1 cell score in the ICI-AIN group compared to HTN group but no differences in Th2 or Th17 cell scores amongst the three groups (FIG. 4A). A statistically significant increase in cytotoxic CD8+ T cell score was also detected in the AIN group compared to the ATN and HTN groups (FIG. 4C). No difference in the abundance of infiltrating T regulatory (T reg) cells was detected in the three groups (FIG.4B). [00174] Since interferon (IFN)-γ inducible chemokines CXCL9, -10 and -11 were observed to be differentially expressed in AIN vs ATN and an increase in the Th1 cell subset score was also observed, the inventors interrogated the three groups for genes associated with an IFN-γ signature. Our data revealed a significant upregulation in the IFN-γ signature in the AIN group (compared to ATN and HTN groups) suggesting that IFN-γ is the likely mediator of the Th1 immune response in ICI-AIN (FIG.4D). [00175] The TNF superfamily (TNFSF) plays a pivotal role in the modulation of inflammation and autoimmunity and elevated levels of TNF-α have been reported in several irAEs. Inhibition of the TNF axis has been successful in treating inflammatory conditions such as ICI-mediated nephritis, colitis and arthritis (23-25). Several TNFSF members are also
associated with TLS development (26). To evaluate for the possible involvement of TNF modulation in ICI-AIN the inventors investigated the TNFSF gene expression signature. Our results showed significant upregulation of the TNFSF signature and TNF expression (FIG.4E) in the ICI-AIN group compared to ATN and HTN groups (Table 4 and Table 5). Studies have shown that both Th1 and Th17 cells can secrete TNF-α. Unlike several other irAEs such as colitis and rheumatoid arthritis that are associated with a Th17 profile, the inventors’ observations, based on cell subtype score, IFN-γ and TNFSF expression profile, suggest that ICI-AIN is Th1 mediated. 5. Tertiary Lymphoid Structure (TLS) signatures are observed in ICI- AIN [00176] ICIs can induce pro-inflammatory cytokines and TNF superfamily members promote localized interactions between inflammatory immune cells and resident stromal cells leading to the formation of TLS in tumor (2). ICI-triggered TLS development in tumor has been associated with clinical response in various cancer types; however, irAEs which are unique ICI side effects that resemble autoimmune responses have not been evaluated for the presence of TLS. Based on the histologic and gene expression findings above, the inventors investigated whether TLS development is associated with ICI-AIN. The inventors used an established, well-validated 12-chemokine TLS gene signature (CCL2, CCL3, CCL4, CCL5, CCL8, CCL18, CCL19, CCL21, CXCL9, CXCL10, CXCL11, CXCL13) that is correlated with improved survival among patients with colorectal cancer, melanoma and breast cancer (27-29). Gene expression analysis of kidney biopsies demonstrated a statistically significant upregulation in the TLS signature in the AIN group compared to the ATN and HTN groups (p<0.05) (FIG.5A). Amongst the 12 chemokines, CXCL13, CCL19 and CCl21, in particular, have been shown to regulate lymphocyte homing and lymphoid neogenesis where ectopically expressed CXCL13 is sufficient to induce lymphoid neogenesis (30-32). Expression levels of CXCL13 and CCL19 were significantly increased in ICI-AIN compared to ATN or HTN groups while CCL21 in ICI-AIN was significantly increased when compared to HTN group (FIG.5B and 5E). [00177] To further validate the TLS signature found in ICI-AIN, the inventors find a strong association of the ICI-AIN gene signature with TLS signatures for melanoma (CCL19, CCL21, CXCL13, CCR7, SELL, LAMP3, CXCR4, CD86, BCL6) and urothelial cancer (CD79A, MS4A1, LAMP3, POU2AF1), where several B cell genes associated with improved antigen presentation, and increased cytokine-mediated signaling were found to be significantly enhanced (33, 34). A significant upregulation in the expression of genes associated with
melanoma TLS and urothelial TLS signatures was observed in the AIN group compared to the ATN and HTN groups (FIG.5A, p <0.01). [00178] The TLS signature for breast cancer also includes genes associated with T follicular helper (Tfh) cells which play a major role in the humoral immune response by facilitating B- cell activation, function and differentiation to memory B cells and plasmablasts leading to germinal center formation and mature TLS. Since the inventors observed an increased B cell score in the earlier analysis, they investigated the TLS signature in breast carcinoma (CD200, PDCD1, CXCL13, CXCL9, CD38, ICOS, IFNG, CXCL13 alone) that includes Tfh (CD200, PDCD1 plus CXCL13) and Th1 genes (CD38, CXCL9, INFG) in ICI-AIN. In fact, the TLS signature that predicts breast cancer survival was found to be significantly elevated in ICI-AIN but not in the ATN or HTN groups (FIG. 5A, p <0.01) supporting the presence of TLS development in ICI-AIN (35). [00179] To evaluate for the morphologic presence of TLS in the ICI-AIN group, microscopic examination of hematoxylin and eosin (H&E) stained sections of the kidney biopsy was performed by a renal pathologist blinded to the biopsy diagnosis (1). TLS was defined as organized, dense lymphoid aggregates composed of a large cluster of lymphocytes (≥50) with expansion of the involved interstitium. Histological assessment of the ICI-AIN biopsies revealed tertiary lymphoid-like structures and the presence of CD20 positive B cells adjacent to a CD3 positive T cell zone (FIG.5C) (1, 36-38). To account for the variations in the amount of renal cortex obtained on kidney biopsy, the inventors calculated the abundance or density of TLS per case. TLS density was determined by dividing the total number of tertiary lymphoid- like structures by the total biopsied kidney cortex area [mm2]. A significantly greater TLS density was observed in the ICI- AIN group compared to HTN (FIG. 5D). Supervised clustering of chemokines revealed an association of almost all chemokines with TLS formation in the AIN group. Based on immune cell gene scores, in cases of ICI-AIN an association was also observed with infiltration of DCs, T cells, macrophages, B cells and neutrophils (FIG.5E). Clustering of B cell genes expressed in the ICI-AIN cohort suggests that B cells (REL, LTB, CD20, CXCR5, PAX5, IRF8) were activated and differentiating into plasmablasts (CD62L, IRF4) and progressing towards organization of germinal centers (VCAM1, ITGA2B, TNFRSF17/BCMA, FIG.5E) (39, 40). 6. Elevated levels of urinary chemokines associated TLS in urine from ICI-AIN patients [00180] Kidney biopsies, especially in cancer patients, poses an increased risk of bleeding, and thus is not always a feasible option (9-12). With the incidence of post-renal biopsy
hematomas ranging up to 11%, a non- invasive approach that uses urine or plasma sampling represents an attractive solution for facilitating detection and monitoring of patients on ICI therapy (13). Based on the transcriptomic profiling data, the inventors developed a customized multiplex panel of 12 chemokines associated with the TLS signature and measured the levels of the selected chemokines in paired urine and plasma specimens. Using Luminex based assay, the inventors were unable to detect a difference in plasma TLS scores among the AIN, ATN or HTN groups (FIG. 6A). However, in urine an overall greater 12 chemokine TLS score was observed with ICI- AIN compared to the HTN group (FIG. 6A). To test the utility of these various methods, the inventors sought to determine whether ICI-AIN vs non-AIN (ATN or HTN) can be predicted by either tissue TLS gene expression score, TLS density or urine or plasma TLS scores. Our analysis showed that the tissue TLS gene expression signature can perfectly separate AIN from non-AIN (AUC 1.00 p <0.001) followed by TLS density (0.841, p <0.001) and urine TLS score (0.735, p = 0.016, Table 6). Analysis comparing TLS gene expression in tissue to urine TLS score confirmed a greater correlation (R = 0.64, p = 0.0017) compared to tissue vs plasma TLS score (R = 0.35, p = 0.15) which failed to significantly correlate with the TLS gene expression in tissue (FIG.6B). [00181] The inventors then used the 12 chemokine TLS signature shown to be associated with improved clinical outcomes in melanoma, breast and colorectal carcinoma to evaluate the correlation of the individual urinary chemokines to the overall tissue TLS gene signature (28- 30). Analysis comparing the individual urine chemokine vs tissue TLS gene signature or individual tissue chemokine gene expression vs urine chemokine level determined a higher correlation in the expression of CXCL9, CXCL10 and CCL19 (Table 7 and Table 8) between tissue and urine. Taken together, the close alignment with tissue levels suggests that urine may be well-suited for non-invasive diagnosis and monitoring of acute kidney injury, and in fact superior to plasma (FIG.6B). CXCL9 and CXCL10 in urine demonstrated a greater correlation with kidney tissue samples (R > 0.6, p < 0.005) and strong ability to discriminate AIN from ATN or HTN (AUC > 0.75, p < 0.005) suggesting the utility of this chemokine signature in the urine for diagnosing AIN without an invasive biopsy (FIG.6C and Table 9). Logistic regression was used to determine if several chemokines combined in a single score could improve this discrimination ability. These models achieved marginal improvement over individual chemokines (AUC of 0.82 for logistic regression combination rule vs AUC of 0.80 for CXCL10 alone) which were not statistically significant. This is likely due to the presence of redundant information in the chemokines (CXCL9 and CXCL10 are highly correlated) and a small sample size. These data and analysis show that while gene expression profile of kidney
tissue is a superior approach, CXCL9 and CXCL10 expression in urine can be used as biomarkers for diagnosis of AIN. C. DISCUSSION [00182] In this study the inventors sought to understand if specific gene signatures could be identified in biopsied cases of ICI-associated AKI caused by AIN compared to ATN or HTN nephrosclerosis. Here they report significantly increased accumulation of immune cells, upregulation of pro-inflammatory cytokines CXCL9 and CXCL10, and IFN-γ and TNFSF signatures in cases of ICI-AIN compared to those with ATN or HTN nephrosclerosis. For the first time, TLS gene signatures have been observed in renal irAEs specifically, ICI-AIN, by histologic examination, and present in paired urine specimens by protein ELISA, providing an opportunity for non-invasive monitoring of ICI-AIN. This study represents the first demonstration of TLS signatures in ICI-associated nephritis and, in fact, any irAE-affected tissue. [00183] AKI is a common manifestation in patients with cancer receiving ICI therapy, etiologies include ischemic nephrotoxic tubular injury which can be manifested by ATN lesions, hemodynamic fluctuations in patients with underlying HTN nephrosclerosis, or AIN (41, 42). Since patients with ICI-AIN respond to glucocorticoid therapy unlike ATN or HTN, the inventors investigated the underlying mechanisms leading to the development of this condition (43). Our gene expression profile analysis confirmed the morphologic characteristics seen microscopically on kidney biopsy which suggests that ICI-AIN is distinct from both ATN and HTN nephrosclerosis. AIN is characterized by lymphocytic infiltration of the renal cortex and by gene expression analysis, ICI-AIN displayed an upregulation in genes associated with chemokine signaling and significant increases in immune cell scores compared to ATN and HTN nephrosclerosis. [00184] Of particular interest in this study is the identification of TLS signatures as a distinguishing feature of ICI- AIN. TLS have been identified within a wide range of human cancers and at all stages of disease (48- 51). In primary and metastatic lesions, TLS have the same characteristics as in their primary sites but TLS in irAEs have not previously been identified. While further histological confirmation of TLS would be desirable, the inventors believe that the results presented, both by histopathological analysis and gene expression profiles are highly suggestive of TLS and would be confirmatory for a TLS signature in cases of irAEs (32, 37, 38). Increased levels of CXCL 9, -10 and -11 have been strongly associated with irAEs and are a major focus in antitumor immunity where they have been implicated in
the formation of TLS (28, 52, 53). Since CXCL 9 and 10 were amongst the top differentially upregulated genes and an increase in IFN- [00185] g and TNFSF along with an abundance of T and B cells were detected in the ICI- AIN cohort, the inventors hypothesized that TLS signatures may be present in ICI-AIN. The inventors used a well-established 12 chemokine TLS signature to confirm an increase in ICI- AIN vs non-AIN cases and further validated the results with three additional TLS gene expression signatures (34, 35, 48). Gene analysis for cellular components of TLS showed expression of B cells (REL, LTB, CD20, CXCR5, BCL6) and plasmablast associated genes (IRF4, CD62L) in the ICI-AIN cohort which likely reflects the TLS stage in which biopsies were obtained. Since TLS are also present in autoimmune conditions such as lupus nephritis and renal allograft rejection and is associated with end organ damage (40, 54-56), the inventors suspect that mature TLS with GC if observed in ICI-AIN would be functional and involved in active kidney disease. [00186] Since the development of TLS and more frequently occurring irAEs such as dermatitis, colitis and various endocrinopathies have been associated with increased ICI anti- tumor efficacy, the inventors investigated whether there was any difference in overall survival or progression free survival in AIN, ATN or HTN group and found no statistical difference (FIG.8). Diagnosis of the more common irAEs are readily made by the presentation of clinical symptoms and specific laboratory tests. These irAEs can be quickly treated enabling patients to continue ICI therapy without significant delays; however, the diagnosis of ICI- AIN is complicated and re-challenge of ICI therapy is infrequent (only 2 patients with ICI-AIN were re- challenged) (57). The inventors postulate whether discontinuation of ICI therapy in the AIN group curtailed the anti-tumor benefits that would be more apparent with ICI therapy continuation. [00187] While corticosteroids are first line therapy in ICI-AIN treatment, not all patients respond to steroid therapy and some will experience ICI-AIN relapse after therapy completion. The inventors have previously shown that short- term use of infliximab, a monoclonal antibody blocking TNF-α, is able to induce durable renal response in ICI-AIN patients who had failed first-line glucocorticoid therapy without compromising overall survival (25). Our data confirmed increased TNF expression in ICI-AIN and the top TNF superfamily members differentially expressed in ICI-AIN are not only associated with T and B cell activation, proliferation and differentiation (TNFRSF4/OX40 and TNFRSF13C/BAFFR), but have fundamental roles in TLS formation (LTB, TNFSF14/LIGHT) and are associated with maintaining the survival of plasma cells and autoantibody secretion (BCMA/TNFRSF17) (58-
60). These data suggest that TNF superfamily members are involved in the pathogenesis of ICI-AIN and TLS, and likely, the clinical response observed is a result of targeting TNF-α for the treatment of ICI-AIN. Furthermore, in non-ICI associated AIN, increased urinary TNF levels have been reported (60). [00188] The nonlymphoid and tissue specific location of TLS makes it challenging to diagnose or investigate their formation through systemic serum chemokine assays and most diagnoses rely on the classical approach of histopathological examination of biopsy. Further, dilution of locally secreted chemokines in systemic circulation will limit the ability to detect low levels of chemokines that are relevant for differential diagnosis. Since urine can closely reflect the local immune landscape of the kidney, urinalysis is a commonly used noninvasive approach for differential diagnosis and monitoring of several acute and chronic renal diseases (61-64). Our analysis of the 12 chemokine TLS signature between kidney tissue vs urine and kidney tissue vs blood showed that urine had a closer correlation to tissue than plasma suggesting that the differential diagnosis of AIN from ATN and HTN nephrosclerosis is possible using urine and will be superior to a plasma source. Similar differences in the ability to detect AIN associated cytokines in urine and not blood has recently been reported (60). In the current study the magnitude of the urine TLS score is greater for AIN compared to ATN or HTN; however, the small sample size of patients could explain the lack of statistical significance between the different groups. The inventors postulated that individual urine chemokines may have a stronger association to the overall TLS signature score and identified CXCL9 as the best individual marker correlating with the overall tissue TLS signature and individual gene expression. Out of the 12 individual chemokines, urinary CXCL9 and 10 exhibited the greatest ability to discriminate AIN vs non-AIN. [00189] This study had several strengths including the use of three different approaches; histopathology, gene expression profile and multiplex chemokine assay, to differentiate ICI- AIN from ATN and HTN nephrosclerosis. The inventors validated the findings by using alternatively defined gene expression signatures and histopathological adjudication by the pathologist blinded to the diagnosis. This work is the first to demonstrate the presence of TLS signatures in irAEs and to identify several distinct immune signatures in ICI-AIN compared to ATN and HTN nephrosclerosis associated AKI in patients receiving ICI therapy. This work is also the first to demonstrate that urine may be a better biological fluid for non-invasive diagnosis and monitoring of acute kidney injury. Since the development or detection of TLS appears to be of paramount importance in positive anti-tumor response, additional investigation with larger numbers of cases will be necessary to determine if TLS development or
characteristics of TLS in normal tissue (i.e. irAE organ sites) correlates with anti-tumor immune activity, and to investigate chemokine protein expression at tissue level to determine whether these inflammatory chemokines localize to TLS. Additionally, longitudinal analysis of urine specimens and clinical information would help clarify the utility of CXCL9 as a marker to monitor treatment response. With greater application of ICI therapy for treating patients with a broader range of cancer types, understanding the significance of TLS in irAEs is imperative for balancing the need for continued anti-tumor therapy with optimal clinical irAE management. [00190] In conclusion, this study is the first to demonstrate the presence of several TLS signatures in renal irAEs and to define gene expression and chemokine signatures associated with ICI-AIN. Together these findings represent an important advancement in the understanding of irAE pathogenesis. This study also highlights the need to further investigate the clinical significance of TLS in irAEs for optimal patient outcomes. D. METHODS 1. Patients and collection of tissue samples [00191] All patients provided informed consents for collection of peripheral blood and urine and access to residual formalin fixed paraffin embedded (FFPE) kidney biopsy tissue. The inventors enrolled adult participants (over the age of 18) with cancer receiving ICI therapy who were scheduled to undergo a clinically indicated kidney biopsy. All patients received either programmed cell death protein 1 (PD-1) inhibitors: pembrolizumab or nivolumab, programmed death-ligand 1 (PD-L1) inhibitors: durvalumab, atezolizumab, or avelumab or combined PD-1 with cytotoxic T-lymphocyte-associated protein 4 (CTLA-4) inhibitors: ipilimumab or tremelimumab. Cases were grouped according to their pathological diagnosis and clinical history. This is a retrospective investigation that included a total of 36 cases (FIG.1). [00192] Data on patient demographics, comorbidities, medications, cancer type and stage, and laboratory test results were obtained through the electronic health record system. The inventors defined AKI using Kidney Disease: Improving Global Outcomes (KDIGO) classification guidelines (15). Progression-free survival (PFS) was defined as the time interval from ICI initiation to progression or death, whichever occurred first. Overall survival (OS) was defined as the time interval from ICI initiation to death. For events that had not occurred by the time of data analysis, times were censored at the last contact at which the patient was known to be alive or free of progression.
2. Histochemistry [00193] FFPE kidney biopsy tissue (4 μm sections) were deparaffinized in xylene and rehydrated through a graded alcohol series. Sections were then stained with Mayer’s Hematoxylin, rinsed with water and counterstained with Eosin. For CD3 (Agilent, GA503) and CD20 (Agilent, GA604) staining, following deparaffinization and rehydration, slides were blocked with peroxidase and incubated with primary antibody followed by DAB enhancer and hematoxylin counterstain. Slides were then dehydrated through a graded alcohol series, cleared with xylene and mounted with coverslips. 3. Histological scoring [00194] Pathological scoring for TLS for all cases were blinded and reviewed by a renal pathologist (16). TLS were quantified using Hematoxylin and Eosin (H&E) immunohistochemistry staining. Organized, dense lymphocytic aggregates (>50 lymphocytes) and expansion of involved interstitium were identified as tertiary lymphoid like structures having histological features analogous to that of lymphoid tissue with or without germinal centers representing stages of TLS development (1, 32, 36-38). The total number of TLS detected per case was normalized to the total amount of biopsied renal cortex (mm2) per case (34, 48). 4. Protein measurement [00195] Urine and plasma samples were collected within a 2-hour window from time of laboratory arrival and aliquots were stored at -80ºC. Customized Luminex multiplex bead array assay (ProcartaPlex, ThermoFisher Scientific, Vienna, Austria) was used to determine the concentration of CCL2 (MCP1), CCL3 (macrophage inflammatory protein 1-alpha (MIP-1- alpha)), CCL4, CCL5 (RANTES), CCL8 (monocyte chemoattractant protein 2 (MCP2)), CCL18, CCL19, CCL21, CXCL9 (monokine induced by gamma interferon (MIG)), CXCL10, CXCL11 and CXCL13 in plasma and urine according to the manufacturer’s protocol. Luminex MAGPIX multiplexing system was used to acquire data and xPONENT software (version 4.2) was used to analyze the data. All standards and samples were analyzed in duplicate. Urine specimens were normalized to urine creatinine measured using QuantiChromTM Creatinine Assay Kit - DICT-500 (BioAssay Systems, Hayward, CA). 5. RNA isolation and gene expression profiling [00196] Total RNA was extracted and purified using the RNeasy Mini Kit (Qiagen GmbH, Hilden, Germany) according to manufacture instructions. Quantity and quality of RNA was assayed using Qubit RNA HS Assay Kit (ThermoFisher Scientific). RNA profiling was
performed on 100 ng of RNA extracted from FFPE human kidney samples for the expression of 770 immune oncology-related genes and housekeeping genes using the NanoString nCounter Human V.1.1 PanCancer Immune Profiling Panel (NanoString Technologies Inc, Seattle, WA). Raw data were normalized using the nSolver™ Analysis Software (Version 4.0) with the Advanced Analysis 2.0 plugin. Counts for target genes were normalized to internal synthetic positive controls and housekeeping genes. Data from the NanoString gene expression profiles have been submitted to the European Genome-phenome Archive (EGA) under accession no. EGAS00001006781. 6. Statistics [00197] Expression profiling of RNA samples was evaluated by log2 normalized count data. Log2 normalized counts were used for individual gene analyses, scores for immune signatures were calculated by the geometric mean of signature genes. Urine chemokine to urine creatinine ratios and plasma chemokine levels were transformed to log2 counts. For all specimens, differences in the means of log2 count data were evaluated using one-way ANOVA and Tukey’s multiple comparisons test. Statistical significance was considered at *P<0.05 and **P<0.01. For the volcano plots, ROSALIND cloud platform for nCounter data using Benjamini-Hochberg method was applied to calculate adjusted P-values with FDR threshold of 0.01 or 0.05 as specified. Statistical analyses were performed with GraphPad Prism 5.0 (GraphPad Software, Inc., San Diego, CA) and R version 4.1.1. Spearman’s rho method was used to correlate chemokine expression between tissue vs plasma and tissue vs urine with Spearman’s test used to compute exact p-values. Wilcoxon tests were used to determine p- values for the AUC (H0: AUC=0.5). E. Tables Table 1. Demographic and Clinical characteristics of the cases
VI. Sample Preparation [00145] In certain aspects, methods involve obtaining one or more sample(s) from a subject. The methods of obtaining provided herein may include methods of biopsy such as fine needle aspiration, core needle biopsy, vacuum assisted biopsy, incisional biopsy, excisional biopsy, punch biopsy, shave biopsy, nephrectomy, or skin biopsy. Alternatively, the sample may be obtained from any other source including but not limited to blood, serum, plasma, urine, pericardial fluid, joint aspiration, pleural fluid, sweat, hair follicle, buccal tissue, tears, menses, feces, or saliva. In certain aspects of the current methods, any medical professional such as a doctor, nurse or medical technician, clinical coordinator may obtain a biological sample for
testing. Yet further, the biological sample can be obtained without the assistance of a medical professional. [00146] A sample may include but is not limited to, tissue, cells, or biological material from cells or derived from cells of a subject. The biological sample may be a heterogeneous or homogeneous population of cells or tissues. The biological sample may be obtained using any method known to the art that can provide a sample suitable for the analytical methods described herein. The sample may be obtained by non-invasive methods including but not limited to: scraping of the skin or cervix, swabbing of the cheek, saliva collection, urine collection, feces collection, collection of menses, tears, any type of body fluid, blood, plasma, or semen. [00147] The sample may be obtained by methods known in the art. In certain aspects the samples are obtained by biopsy. In other aspects the sample is obtained by swabbing, endoscopy, scraping, phlebotomy, or any other methods known in the art. In some cases, the sample may be obtained, stored, or transported using components of a kit of the present methods. In some cases, multiple samples, such as multiple plasma or serum samples may be obtained for diagnosis by the methods described herein. In other cases, multiple samples, such as one or more samples from one tissue type (for example kidney(s) or related tissues) and one or more samples from another specimen (for example serum, plasma, urine) may be obtained for diagnosis by the methods. Samples may be obtained at different times are stored and/or analyzed by different methods. For example, a sample may be obtained and analyzed by routine staining methods or any other cytological analysis methods. [00148] In some aspects the biological sample may be obtained by a physician, nurse, or other medical professional such as a medical technician, endocrinologist, cytologist, phlebotomist, radiologist, or a pulmonologist. The medical professional may indicate the appropriate test or assay to perform on the sample. In certain aspects a molecular profiling business may consult on which assays or tests are most appropriately indicated. In further aspects of the current methods, the patient or subject may obtain a biological sample for testing without the assistance of a medical professional, such as obtaining a whole blood sample, a urine sample, a fecal sample, a buccal sample, or a saliva sample. [00149] In other cases, the sample is obtained by an invasive procedure including but not limited to: biopsy, needle aspiration, blood draw, endoscopy, or phlebotomy. The method of needle aspiration may further include fine needle aspiration, core needle biopsy, vacuum assisted biopsy, or large core biopsy. In some aspects, multiple samples may be obtained by the methods herein to ensure a sufficient amount of biological material.
[00150] General methods for obtaining biological samples are also known in the art. Publications such as Ramzy, Ibrahim Clinical Cytopathology and Aspiration Biopsy 2001, which is herein incorporated by reference in its entirety, describes general methods for biopsy and cytological methods. [00151] In some aspects of the present methods, the molecular profiling business may obtain the biological sample from a subject directly, from a medical professional, from a third party, or from a kit provided by a molecular profiling business or a third party. In some cases, the biological sample may be obtained by the molecular profiling business after the subject, a medical professional, or a third party acquires and sends the biological sample to the molecular profiling business. In some cases, the molecular profiling business may provide suitable containers, and excipients for storage and transport of the biological sample to the molecular profiling business. [00152] In some aspects of the methods described herein, a medical professional need not be involved in the initial diagnosis or sample acquisition. An individual may alternatively obtain a sample through the use of an over the counter (OTC) kit. An OTC kit may contain a means for obtaining said sample as described herein, a means for storing said sample for inspection, and instructions for proper use of the kit. In some cases, molecular profiling services are included in the price for purchase of the kit. In other cases, the molecular profiling services are billed separately. A sample suitable for use by the molecular profiling business may be any material containing tissues, cells, nucleic acids, genes, gene fragments, expression products, gene expression products, or gene expression product fragments of an individual to be tested. Methods for determining sample suitability and/or adequacy are provided. [00153] In some aspects, the subject may be referred to a specialist such as an oncologist, surgeon, nephrologist, or endocrinologist. The specialist may likewise obtain a biological sample for testing or refer the individual to a testing center or laboratory for submission of the biological sample. In some cases, the medical professional may refer the subject to a testing center or laboratory for submission of the biological sample. In other cases, the subject may provide the sample. In some cases, a molecular profiling business may obtain the sample. VII. Administration of Therapeutic Compositions [00154] The therapy provided herein may comprise administration of a combination of therapeutic agents, such as a first cancer therapy, a second cancer therapy, and/or treatment of an irAE. The therapies may be administered in any suitable manner known in the art. For example, the first and second cancer treatment may be administered sequentially (at different times) or concurrently (at the same time). In some aspects, the first and second cancer
treatments are administered in a separate composition. In some aspects, the first and second cancer treatments are in the same composition. [00155] Aspects of the disclosure relate to compositions and methods comprising therapeutic compositions. The different therapies may be administered in one composition or in more than one composition, such as 2 compositions, 3 compositions, or 4 compositions. Various combinations of the agents may be employed. [00156] The therapeutic agents of the disclosure may be administered by the same route of administration or by different routes of administration. In some aspects, the cancer therapy or treatment of an irAE is administered intravenously, intramuscularly, subcutaneously, topically, orally, transdermally, intraperitoneally, intraorbitally, by implantation, by inhalation, intrathecally, intraventricularly, or intranasally. In some aspects, the composition is administered intravenously, intramuscularly, subcutaneously, topically, orally, transdermally, intraperitoneally, intraorbitally, by implantation, by inhalation, intrathecally, intraventricularly, or intranasally. The appropriate dosage may be determined based on the type of disease to be treated, severity and course of the disease, the clinical condition of the individual, the individual's clinical history and response to the treatment, and the discretion of the attending physician. [00157] The treatments may include various “unit doses.” Unit dose is defined as containing a predetermined-quantity of the therapeutic composition. The quantity to be administered, and the particular route and formulation, is within the skill of determination of those in the clinical arts. A unit dose need not be administered as a single injection but may comprise continuous infusion over a set period of time. In some aspects, a unit dose comprises a single administrable dose. [00158] Precise amounts of the therapeutic composition also depend on the judgment of the practitioner and are peculiar to each individual. Factors affecting dose include physical and clinical state of the patient, the route of administration, the intended goal of treatment (alleviation of symptoms versus cure) and the potency, stability and toxicity of the particular therapeutic substance or other therapies a subject may be undergoing. VIII. Kits [00159] Certain aspects of the present invention also concern kits containing compositions of the invention or compositions to implement methods of the invention. In some aspects, kits can be used to evaluate one or more biomarkers. In certain aspects, a kit contains, contains at least or contains at most 1, 2, 3, 4, 5, 6, 7, 8, 9, 10, 11, 12, 13, 14, 15, 16, 17, 18, 19, 20, 21, 22, 23, 24, 25, 26, 27, 28, 29, 30, 31, 32, 33, 34, 35, 36, 37, 38, 39, 40, 41, 42, 43, 44, 45, 46,
47, 48, 49, 50, 100, 500, 1,000 or more probes, primers or primer sets, synthetic molecules, antibodies, or inhibitors, or any value or range and combination derivable therein. In some aspects, there are kits for evaluating biomarker activity or level in a cell. [00160] Kits may comprise components, which may be individually packaged or placed in a container, such as a tube, bottle, vial, syringe, or other suitable container means. [00161] Individual components may also be provided in a kit in concentrated amounts; in some aspects, a component is provided individually in the same concentration as it would be in a solution with other components. Concentrations of components may be provided as 1x, 2x, 5x, 10x, or 20x or more. [00162] Kits for using probes, antibodies, synthetic nucleic acids, nonsynthetic nucleic acids, and/or inhibitors of the disclosure for prognostic or diagnostic applications are included as part of the disclosure. Specifically contemplated are any such molecules corresponding to any biomarker identified herein, which includes antibodies that bind to such biomarkers as well as nucleic acid primers/primer sets and probes that are identical to or complementary to all or part of a biomarker, which may include noncoding sequences of the biomarker, as well as coding sequences of the biomarker. [00163] In certain aspects, negative and/or positive control nucleic acids, antibodies, probes, and inhibitors are included in some kit aspects. In addition, a kit may include a sample that is a negative or positive control for methylation of one or more biomarkers. [00164] It is contemplated that any method or composition described herein can be implemented with respect to any other method or composition described herein and that different aspects may be combined. The claims originally filed are contemplated to cover claims that are multiply dependent on any filed claim or combination of filed claims. IX. Examples [00165] The following examples are included to demonstrate preferred embodiments of the invention. It should be appreciated by those of skill in the art that the techniques disclosed in the examples which follow represent techniques discovered by the inventor to function well in the practice of the invention, and thus can be considered to constitute preferred modes for its practice. However, those of skill in the art should, in light of the present disclosure, appreciate that many changes can be made in the specific embodiments which are disclosed and still obtain a like or similar result without departing from the spirit and scope of the invention.
Example 1: Tertiary lymphoid structure signatures are associated with immune checkpoint inhibitor related acute interstitial nephritis [00166] Tertiary lymphoid structures (TLSs) are associated with anti-tumor response following immune checkpoint inhibitor (ICI) therapy, but a commensurate observation of TLS is absent for immune related adverse events (irAEs) i.e. acute interstitial nephritis (AIN). The inventors hypothesized that TLS-associated inflammatory gene signatures are present in AIN and performed NanoString-based gene expression and multiplex 12-chemokine profiling on paired kidney tissue, urine and plasma specimens of 36 participants who developed acute kidney injury (AKI) on ICI therapy: AIN (18), acute tubular necrosis (9), or HTN nephrosclerosis (9). Increased T and B cell scores, a Th1-CD8+ T cell axis accompanied by interferon-g and TNF superfamily signatures were detected in the ICI-AIN group. TLS signatures were significantly increased in AIN cases and supported by histopathological identification. Furthermore, urinary TLS signature scores correlated with ICI-AIN diagnosis but not paired plasma. Urinary CXCL9 correlated best to tissue CXCL9 expression (rho 0.75, p < 0.001) and the ability to discriminate AIN vs. non-AIN (AUC 0.781, p-value 0.003). For the first time, the inventors report the presence of TLS signatures in irAEs, define distinctive immune signatures, identify chemokine markers distinguishing ICI-AIN from common AKI etiologies and demonstrate that urine chemokine markers may be used as a surrogate for ICI- AIN or renal irAE diagnoses. A. INTRODUCTION [00167] ICI therapy can be a highly effective cancer treatment option but increasing T-cell activity can also increase T cell autoreactivity leading to the development of immune related adverse events (irAEs). Over 60% of patients treated with immune checkpoint blockade will develop at least one irAE (4, 5). Since the development of irAEs is associated with increased immune activity, studies among more common irAEs, such as dermatitis, colitis and various endocrinopathies, are linked with increased ICI efficacy. Less is known, however, in patient outcomes for uncommon irAEs such as renal irAEs, which usually manifest as acute interstitial nephritis (AIN) (6). Although 15-20% of patients on immune checkpoint blockade will develop acute kidney injury (AKI), only 2-5% of cases will be AIN (6-8). Timely and accurate diagnosis of AIN is complicated due to the lack of non-invasive diagnostic tests; as such, kidney biopsy remains the gold standard. In patients with cancer, a kidney biopsy may not always be feasible and when performed may carry a significant risk of morbidity such as major bleeding complications in 1.6-5% of cases; consequently, steroid therapy is often initiated empirically for presumed ICI-AIN (9-13). Difficulties in diagnosing AIN, the low frequency of ICI-AIN
occurrence, and delays in AKI management contribute to the development of permanent functional kidney loss in over 50% of ICI-AIN patients despite glucocorticoid therapy (14). A greater understanding of the pathophysiology of ICI-AIN will improve one’s ability to accurately diagnose AIN and enable prompt implementation of therapeutic strategies. [00168] To address this knowledge gap, the inventors asked whether differential expression of genes could be uncovered in kidney tissue biopsies of patients who developed AKI on ICI therapy that distinguishes AIN from other kidney pathologies such as acute tubular necrosis (ATN) or hypertensive (HTN) nephrosclerosis. The inventors report significant increases in genes associated with pro-inflammatory cytokines and immune cells in the ICI-AIN group compared to the ATN or HTN nephrosclerosis groups which led us to inquire if TLS signatures could be detected. Finally, the inventors asked whether these kidney biopsy results correlated with paired urine and plasma specimens providing a less invasive means of detecting ICI-AIN in patients receiving immune checkpoint therapy. This study is, to the inventors’ knowledge, the first to demonstrate the presence of distinguishing TLS features in ICI-AIN and in fact, any ICI-associated toxicity, that is detectable in both tissue and urine and identifies urine markers that can differentiate ICI-AIN from non-AIN. B. RESULTS 1. Cohort characteristics and kidney injury assignment [00169] The inventors enrolled 36 patients who had received ICI therapy and underwent a clinically indicated kidney biopsy for AKI evaluation at The University of Texas MD Anderson Cancer Center (FIG. 1). Relevant clinical and pathological characteristics are presented in Table 1. The participants were grouped according to their major pathological biopsy diagnosis of AIN, ATN or HTN nephrosclerosis and comparisons were made for different demographic and pathological parameters. A greater proportion of patients were males in the ICI-AIN group. Only two participants received anti-PD-L1 therapy. While baseline levels of creatinine were higher in the HTN group (Cr 1.30 mg/dl) compared to both AIN (1.00 mg/dl) and ATN (0.90 mg/dl) groups, average peak serum creatinine was identified to be higher in ICI-AIN compared to ATN and HTN. Ten out of the 18 ICI-AIN cases had stage 3 AKI (4 stage 2, and 4 stage 1) by KDIGO criteria (15). In the ATN group, each AKI stage was equally represented (3 stage 1, 3 stage 2 and 3 stage 3). For the HTN group, almost all patients were AKI stage 1 (3 stage 1, 0 stage 2, 1 stage 3). Percent of inflammation in the renal cortex was significantly higher in ICI-AIN compared to ATN and HTN groups (16). Median time from first ICI infusion to AKI for AIN was 145 days, 67 days ATN group and 197 days in the HTN group. Almost all ICI- AIN patients received corticosteroid therapy with 7 patients achieving complete renal recovery,
8 partial renal recovery and 3 with no renal recovery. In the ATN group, 2 patients achieved complete renal recovery and 7 had partial renal recovery. For the HTN group, 5 of the 9 patients had complete renal recovery while 3 had partial and 1 had no renal recovery. Only 2 of the ICI- AIN patients were re-challenged on ICI therapy while 6 of the 9 ATN and all HTN group participants resumed ICI therapy. 2. Renal pathology and cellular characterization of immune cell infiltrates [00170] The clinical diagnosis of AKI was made by histological examination of the biopsied kidney tissue by the renal pathologist. Representative images are shown in FIG. 2. Histopathological analysis of the kidney biopsy showed that AIN was characterized by dense lymphocytic infiltrates along with varying numbers of neutrophils, plasma cells and eosinophils. Often lymphocytic tubulitis was present, which in some cases was severe with associated tubular basement membrane disruption. By comparison, cases of ATN showed tubular epithelial injury that manifested as ectatic, flattened epithelium and loss of brush borders. Interstitial inflammation associated with ATN was minimal to mild consisting predominantly of lymphocytes and plasma cells and tubulitis was minimal, if present, but was typically absent. Cases of HTN nephrosclerosis showed absent to minimal interstitial infiltration by lymphocytes and plasma cells and tubulitis was not present. 3. Identification of differentially expressed genes and infiltrating immune cells in AIN [00171] AIN and ATN are the most frequently reported kidney pathologies from biopsied cancer patients on ICI therapy. Although both are acute conditions of kidney injury with similar clinical presentation, only AIN can be treated with glucocorticoids and ATN is generally considered to be a toxic ischemic injury without any specific therapy. This divergent response to anti-inflammatory therapy combined with distinct lymphocyte infiltration patterns observed in renal pathology strongly suggests a difference in the immune gene expression profile in AIN and ATN. To identify the genes that are differentially expressed in these two pathologies, the inventors performed a comprehensive gene expression analysis using NanoString nCounter PanCancer Immune Profiling Panel. Out of 770 genes evaluated, in AIN vs ATN, a total of 23 differentially expressed genes (DEGs) with a fold change ± 4 (p-Adj < 0.01) was detected. These genes were upregulated in AIN compared to ATN. Among the DEGs eight of the top ten most differentially expressed genes were inflammatory chemokines and immune associated genes (CCL18, CXCL11, CXCL10, CXCL9, CXCL8, CXCL7, TREM1) and (SLAMF1) a gene associated with activated T and B lymphocytes (FIG.3A and Table 2). Between AIN and HTN, a total of 159 differentially expressed genes with a fold change ± 4 were detected (p-Adj
< 0.01). Similar to AIN vs ATN, the top ten DEGs were inflammatory chemokines (CCL18, CCR7, CXCL10, LTF, CXCL9, CXCL6, CCL13) and genes associated with AKI (SAA1, LCN2, C3) (FIG.3A and Table 3). In contrast, comparison of gene expression profile of ATN and HTN groups revealed differentially expressed genes that are different from the AIN group (FIG.7) suggesting an unrelated etiology for ATN. [00172] To determine if the elevated chemokine profile was associated with increased immune cell infiltration in the kidney tissue, the inventors used immune cell gene signatures to compare cell scores among AIN, ATN and HTN groups. These scores are indicative of the relative abundance of cells in the tissue (17, 18). Consistent with the pathology findings, AIN cases had significantly higher immune cell scores for T and B lymphocytes, macrophages, neutrophils and dendritic cells compared to both the ATN and HTN group (FIG. 3B). The inventors did not detect a difference in the natural killer (NK) cell score among the three groups (FIG.3B). 4. Deconvolution of T cell composition and their function [00173] Different T cell subtypes, namely CD8+ T cells and Th17, have been identified for commonly occurring irAEs such as colitis and rheumatoid arthritis (19-22). However, the specific immune cell subsets and mechanism of pathogenesis associated with ICI-AIN are underexplored. The inventors used NanoString analysis to deconvolute immune cell gene expressions to identify and determine the abundance of T cell subsets infiltrating the kidneys. Our analysis showed an increase in Th1 cell score in the ICI-AIN group compared to HTN group but no differences in Th2 or Th17 cell scores amongst the three groups (FIG. 4A). A statistically significant increase in cytotoxic CD8+ T cell score was also detected in the AIN group compared to the ATN and HTN groups (FIG. 4C). No difference in the abundance of infiltrating T regulatory (T reg) cells was detected in the three groups (FIG.4B). [00174] Since interferon (IFN)-γ inducible chemokines CXCL9, -10 and -11 were observed to be differentially expressed in AIN vs ATN and an increase in the Th1 cell subset score was also observed, the inventors interrogated the three groups for genes associated with an IFN-γ signature. Our data revealed a significant upregulation in the IFN-γ signature in the AIN group (compared to ATN and HTN groups) suggesting that IFN-γ is the likely mediator of the Th1 immune response in ICI-AIN (FIG.4D). [00175] The TNF superfamily (TNFSF) plays a pivotal role in the modulation of inflammation and autoimmunity and elevated levels of TNF-α have been reported in several irAEs. Inhibition of the TNF axis has been successful in treating inflammatory conditions such as ICI-mediated nephritis, colitis and arthritis (23-25). Several TNFSF members are also
associated with TLS development (26). To evaluate for the possible involvement of TNF modulation in ICI-AIN the inventors investigated the TNFSF gene expression signature. Our results showed significant upregulation of the TNFSF signature and TNF expression (FIG.4E) in the ICI-AIN group compared to ATN and HTN groups (Table 4 and Table 5). Studies have shown that both Th1 and Th17 cells can secrete TNF-α. Unlike several other irAEs such as colitis and rheumatoid arthritis that are associated with a Th17 profile, the inventors’ observations, based on cell subtype score, IFN-γ and TNFSF expression profile, suggest that ICI-AIN is Th1 mediated. 5. Tertiary Lymphoid Structure (TLS) signatures are observed in ICI- AIN [00176] ICIs can induce pro-inflammatory cytokines and TNF superfamily members promote localized interactions between inflammatory immune cells and resident stromal cells leading to the formation of TLS in tumor (2). ICI-triggered TLS development in tumor has been associated with clinical response in various cancer types; however, irAEs which are unique ICI side effects that resemble autoimmune responses have not been evaluated for the presence of TLS. Based on the histologic and gene expression findings above, the inventors investigated whether TLS development is associated with ICI-AIN. The inventors used an established, well-validated 12-chemokine TLS gene signature (CCL2, CCL3, CCL4, CCL5, CCL8, CCL18, CCL19, CCL21, CXCL9, CXCL10, CXCL11, CXCL13) that is correlated with improved survival among patients with colorectal cancer, melanoma and breast cancer (27-29). Gene expression analysis of kidney biopsies demonstrated a statistically significant upregulation in the TLS signature in the AIN group compared to the ATN and HTN groups (p<0.05) (FIG.5A). Amongst the 12 chemokines, CXCL13, CCL19 and CCl21, in particular, have been shown to regulate lymphocyte homing and lymphoid neogenesis where ectopically expressed CXCL13 is sufficient to induce lymphoid neogenesis (30-32). Expression levels of CXCL13 and CCL19 were significantly increased in ICI-AIN compared to ATN or HTN groups while CCL21 in ICI-AIN was significantly increased when compared to HTN group (FIG.5B and 5E). [00177] To further validate the TLS signature found in ICI-AIN, the inventors find a strong association of the ICI-AIN gene signature with TLS signatures for melanoma (CCL19, CCL21, CXCL13, CCR7, SELL, LAMP3, CXCR4, CD86, BCL6) and urothelial cancer (CD79A, MS4A1, LAMP3, POU2AF1), where several B cell genes associated with improved antigen presentation, and increased cytokine-mediated signaling were found to be significantly enhanced (33, 34). A significant upregulation in the expression of genes associated with
melanoma TLS and urothelial TLS signatures was observed in the AIN group compared to the ATN and HTN groups (FIG.5A, p <0.01). [00178] The TLS signature for breast cancer also includes genes associated with T follicular helper (Tfh) cells which play a major role in the humoral immune response by facilitating B- cell activation, function and differentiation to memory B cells and plasmablasts leading to germinal center formation and mature TLS. Since the inventors observed an increased B cell score in the earlier analysis, they investigated the TLS signature in breast carcinoma (CD200, PDCD1, CXCL13, CXCL9, CD38, ICOS, IFNG, CXCL13 alone) that includes Tfh (CD200, PDCD1 plus CXCL13) and Th1 genes (CD38, CXCL9, INFG) in ICI-AIN. In fact, the TLS signature that predicts breast cancer survival was found to be significantly elevated in ICI-AIN but not in the ATN or HTN groups (FIG. 5A, p <0.01) supporting the presence of TLS development in ICI-AIN (35). [00179] To evaluate for the morphologic presence of TLS in the ICI-AIN group, microscopic examination of hematoxylin and eosin (H&E) stained sections of the kidney biopsy was performed by a renal pathologist blinded to the biopsy diagnosis (1). TLS was defined as organized, dense lymphoid aggregates composed of a large cluster of lymphocytes (≥50) with expansion of the involved interstitium. Histological assessment of the ICI-AIN biopsies revealed tertiary lymphoid-like structures and the presence of CD20 positive B cells adjacent to a CD3 positive T cell zone (FIG.5C) (1, 36-38). To account for the variations in the amount of renal cortex obtained on kidney biopsy, the inventors calculated the abundance or density of TLS per case. TLS density was determined by dividing the total number of tertiary lymphoid- like structures by the total biopsied kidney cortex area [mm2]. A significantly greater TLS density was observed in the ICI- AIN group compared to HTN (FIG. 5D). Supervised clustering of chemokines revealed an association of almost all chemokines with TLS formation in the AIN group. Based on immune cell gene scores, in cases of ICI-AIN an association was also observed with infiltration of DCs, T cells, macrophages, B cells and neutrophils (FIG.5E). Clustering of B cell genes expressed in the ICI-AIN cohort suggests that B cells (REL, LTB, CD20, CXCR5, PAX5, IRF8) were activated and differentiating into plasmablasts (CD62L, IRF4) and progressing towards organization of germinal centers (VCAM1, ITGA2B, TNFRSF17/BCMA, FIG.5E) (39, 40). 6. Elevated levels of urinary chemokines associated TLS in urine from ICI-AIN patients [00180] Kidney biopsies, especially in cancer patients, poses an increased risk of bleeding, and thus is not always a feasible option (9-12). With the incidence of post-renal biopsy
hematomas ranging up to 11%, a non- invasive approach that uses urine or plasma sampling represents an attractive solution for facilitating detection and monitoring of patients on ICI therapy (13). Based on the transcriptomic profiling data, the inventors developed a customized multiplex panel of 12 chemokines associated with the TLS signature and measured the levels of the selected chemokines in paired urine and plasma specimens. Using Luminex based assay, the inventors were unable to detect a difference in plasma TLS scores among the AIN, ATN or HTN groups (FIG. 6A). However, in urine an overall greater 12 chemokine TLS score was observed with ICI- AIN compared to the HTN group (FIG. 6A). To test the utility of these various methods, the inventors sought to determine whether ICI-AIN vs non-AIN (ATN or HTN) can be predicted by either tissue TLS gene expression score, TLS density or urine or plasma TLS scores. Our analysis showed that the tissue TLS gene expression signature can perfectly separate AIN from non-AIN (AUC 1.00 p <0.001) followed by TLS density (0.841, p <0.001) and urine TLS score (0.735, p = 0.016, Table 6). Analysis comparing TLS gene expression in tissue to urine TLS score confirmed a greater correlation (R = 0.64, p = 0.0017) compared to tissue vs plasma TLS score (R = 0.35, p = 0.15) which failed to significantly correlate with the TLS gene expression in tissue (FIG.6B). [00181] The inventors then used the 12 chemokine TLS signature shown to be associated with improved clinical outcomes in melanoma, breast and colorectal carcinoma to evaluate the correlation of the individual urinary chemokines to the overall tissue TLS gene signature (28- 30). Analysis comparing the individual urine chemokine vs tissue TLS gene signature or individual tissue chemokine gene expression vs urine chemokine level determined a higher correlation in the expression of CXCL9, CXCL10 and CCL19 (Table 7 and Table 8) between tissue and urine. Taken together, the close alignment with tissue levels suggests that urine may be well-suited for non-invasive diagnosis and monitoring of acute kidney injury, and in fact superior to plasma (FIG.6B). CXCL9 and CXCL10 in urine demonstrated a greater correlation with kidney tissue samples (R > 0.6, p < 0.005) and strong ability to discriminate AIN from ATN or HTN (AUC > 0.75, p < 0.005) suggesting the utility of this chemokine signature in the urine for diagnosing AIN without an invasive biopsy (FIG.6C and Table 9). Logistic regression was used to determine if several chemokines combined in a single score could improve this discrimination ability. These models achieved marginal improvement over individual chemokines (AUC of 0.82 for logistic regression combination rule vs AUC of 0.80 for CXCL10 alone) which were not statistically significant. This is likely due to the presence of redundant information in the chemokines (CXCL9 and CXCL10 are highly correlated) and a small sample size. These data and analysis show that while gene expression profile of kidney
tissue is a superior approach, CXCL9 and CXCL10 expression in urine can be used as biomarkers for diagnosis of AIN. C. DISCUSSION [00182] In this study the inventors sought to understand if specific gene signatures could be identified in biopsied cases of ICI-associated AKI caused by AIN compared to ATN or HTN nephrosclerosis. Here they report significantly increased accumulation of immune cells, upregulation of pro-inflammatory cytokines CXCL9 and CXCL10, and IFN-γ and TNFSF signatures in cases of ICI-AIN compared to those with ATN or HTN nephrosclerosis. For the first time, TLS gene signatures have been observed in renal irAEs specifically, ICI-AIN, by histologic examination, and present in paired urine specimens by protein ELISA, providing an opportunity for non-invasive monitoring of ICI-AIN. This study represents the first demonstration of TLS signatures in ICI-associated nephritis and, in fact, any irAE-affected tissue. [00183] AKI is a common manifestation in patients with cancer receiving ICI therapy, etiologies include ischemic nephrotoxic tubular injury which can be manifested by ATN lesions, hemodynamic fluctuations in patients with underlying HTN nephrosclerosis, or AIN (41, 42). Since patients with ICI-AIN respond to glucocorticoid therapy unlike ATN or HTN, the inventors investigated the underlying mechanisms leading to the development of this condition (43). Our gene expression profile analysis confirmed the morphologic characteristics seen microscopically on kidney biopsy which suggests that ICI-AIN is distinct from both ATN and HTN nephrosclerosis. AIN is characterized by lymphocytic infiltration of the renal cortex and by gene expression analysis, ICI-AIN displayed an upregulation in genes associated with chemokine signaling and significant increases in immune cell scores compared to ATN and HTN nephrosclerosis. [00184] Of particular interest in this study is the identification of TLS signatures as a distinguishing feature of ICI- AIN. TLS have been identified within a wide range of human cancers and at all stages of disease (48- 51). In primary and metastatic lesions, TLS have the same characteristics as in their primary sites but TLS in irAEs have not previously been identified. While further histological confirmation of TLS would be desirable, the inventors believe that the results presented, both by histopathological analysis and gene expression profiles are highly suggestive of TLS and would be confirmatory for a TLS signature in cases of irAEs (32, 37, 38). Increased levels of CXCL 9, -10 and -11 have been strongly associated with irAEs and are a major focus in antitumor immunity where they have been implicated in
the formation of TLS (28, 52, 53). Since CXCL 9 and 10 were amongst the top differentially upregulated genes and an increase in IFN- [00185] g and TNFSF along with an abundance of T and B cells were detected in the ICI- AIN cohort, the inventors hypothesized that TLS signatures may be present in ICI-AIN. The inventors used a well-established 12 chemokine TLS signature to confirm an increase in ICI- AIN vs non-AIN cases and further validated the results with three additional TLS gene expression signatures (34, 35, 48). Gene analysis for cellular components of TLS showed expression of B cells (REL, LTB, CD20, CXCR5, BCL6) and plasmablast associated genes (IRF4, CD62L) in the ICI-AIN cohort which likely reflects the TLS stage in which biopsies were obtained. Since TLS are also present in autoimmune conditions such as lupus nephritis and renal allograft rejection and is associated with end organ damage (40, 54-56), the inventors suspect that mature TLS with GC if observed in ICI-AIN would be functional and involved in active kidney disease. [00186] Since the development of TLS and more frequently occurring irAEs such as dermatitis, colitis and various endocrinopathies have been associated with increased ICI anti- tumor efficacy, the inventors investigated whether there was any difference in overall survival or progression free survival in AIN, ATN or HTN group and found no statistical difference (FIG.8). Diagnosis of the more common irAEs are readily made by the presentation of clinical symptoms and specific laboratory tests. These irAEs can be quickly treated enabling patients to continue ICI therapy without significant delays; however, the diagnosis of ICI- AIN is complicated and re-challenge of ICI therapy is infrequent (only 2 patients with ICI-AIN were re- challenged) (57). The inventors postulate whether discontinuation of ICI therapy in the AIN group curtailed the anti-tumor benefits that would be more apparent with ICI therapy continuation. [00187] While corticosteroids are first line therapy in ICI-AIN treatment, not all patients respond to steroid therapy and some will experience ICI-AIN relapse after therapy completion. The inventors have previously shown that short- term use of infliximab, a monoclonal antibody blocking TNF-α, is able to induce durable renal response in ICI-AIN patients who had failed first-line glucocorticoid therapy without compromising overall survival (25). Our data confirmed increased TNF expression in ICI-AIN and the top TNF superfamily members differentially expressed in ICI-AIN are not only associated with T and B cell activation, proliferation and differentiation (TNFRSF4/OX40 and TNFRSF13C/BAFFR), but have fundamental roles in TLS formation (LTB, TNFSF14/LIGHT) and are associated with maintaining the survival of plasma cells and autoantibody secretion (BCMA/TNFRSF17) (58-
60). These data suggest that TNF superfamily members are involved in the pathogenesis of ICI-AIN and TLS, and likely, the clinical response observed is a result of targeting TNF-α for the treatment of ICI-AIN. Furthermore, in non-ICI associated AIN, increased urinary TNF levels have been reported (60). [00188] The nonlymphoid and tissue specific location of TLS makes it challenging to diagnose or investigate their formation through systemic serum chemokine assays and most diagnoses rely on the classical approach of histopathological examination of biopsy. Further, dilution of locally secreted chemokines in systemic circulation will limit the ability to detect low levels of chemokines that are relevant for differential diagnosis. Since urine can closely reflect the local immune landscape of the kidney, urinalysis is a commonly used noninvasive approach for differential diagnosis and monitoring of several acute and chronic renal diseases (61-64). Our analysis of the 12 chemokine TLS signature between kidney tissue vs urine and kidney tissue vs blood showed that urine had a closer correlation to tissue than plasma suggesting that the differential diagnosis of AIN from ATN and HTN nephrosclerosis is possible using urine and will be superior to a plasma source. Similar differences in the ability to detect AIN associated cytokines in urine and not blood has recently been reported (60). In the current study the magnitude of the urine TLS score is greater for AIN compared to ATN or HTN; however, the small sample size of patients could explain the lack of statistical significance between the different groups. The inventors postulated that individual urine chemokines may have a stronger association to the overall TLS signature score and identified CXCL9 as the best individual marker correlating with the overall tissue TLS signature and individual gene expression. Out of the 12 individual chemokines, urinary CXCL9 and 10 exhibited the greatest ability to discriminate AIN vs non-AIN. [00189] This study had several strengths including the use of three different approaches; histopathology, gene expression profile and multiplex chemokine assay, to differentiate ICI- AIN from ATN and HTN nephrosclerosis. The inventors validated the findings by using alternatively defined gene expression signatures and histopathological adjudication by the pathologist blinded to the diagnosis. This work is the first to demonstrate the presence of TLS signatures in irAEs and to identify several distinct immune signatures in ICI-AIN compared to ATN and HTN nephrosclerosis associated AKI in patients receiving ICI therapy. This work is also the first to demonstrate that urine may be a better biological fluid for non-invasive diagnosis and monitoring of acute kidney injury. Since the development or detection of TLS appears to be of paramount importance in positive anti-tumor response, additional investigation with larger numbers of cases will be necessary to determine if TLS development or
characteristics of TLS in normal tissue (i.e. irAE organ sites) correlates with anti-tumor immune activity, and to investigate chemokine protein expression at tissue level to determine whether these inflammatory chemokines localize to TLS. Additionally, longitudinal analysis of urine specimens and clinical information would help clarify the utility of CXCL9 as a marker to monitor treatment response. With greater application of ICI therapy for treating patients with a broader range of cancer types, understanding the significance of TLS in irAEs is imperative for balancing the need for continued anti-tumor therapy with optimal clinical irAE management. [00190] In conclusion, this study is the first to demonstrate the presence of several TLS signatures in renal irAEs and to define gene expression and chemokine signatures associated with ICI-AIN. Together these findings represent an important advancement in the understanding of irAE pathogenesis. This study also highlights the need to further investigate the clinical significance of TLS in irAEs for optimal patient outcomes. D. METHODS 1. Patients and collection of tissue samples [00191] All patients provided informed consents for collection of peripheral blood and urine and access to residual formalin fixed paraffin embedded (FFPE) kidney biopsy tissue. The inventors enrolled adult participants (over the age of 18) with cancer receiving ICI therapy who were scheduled to undergo a clinically indicated kidney biopsy. All patients received either programmed cell death protein 1 (PD-1) inhibitors: pembrolizumab or nivolumab, programmed death-ligand 1 (PD-L1) inhibitors: durvalumab, atezolizumab, or avelumab or combined PD-1 with cytotoxic T-lymphocyte-associated protein 4 (CTLA-4) inhibitors: ipilimumab or tremelimumab. Cases were grouped according to their pathological diagnosis and clinical history. This is a retrospective investigation that included a total of 36 cases (FIG.1). [00192] Data on patient demographics, comorbidities, medications, cancer type and stage, and laboratory test results were obtained through the electronic health record system. The inventors defined AKI using Kidney Disease: Improving Global Outcomes (KDIGO) classification guidelines (15). Progression-free survival (PFS) was defined as the time interval from ICI initiation to progression or death, whichever occurred first. Overall survival (OS) was defined as the time interval from ICI initiation to death. For events that had not occurred by the time of data analysis, times were censored at the last contact at which the patient was known to be alive or free of progression.
2. Histochemistry [00193] FFPE kidney biopsy tissue (4 μm sections) were deparaffinized in xylene and rehydrated through a graded alcohol series. Sections were then stained with Mayer’s Hematoxylin, rinsed with water and counterstained with Eosin. For CD3 (Agilent, GA503) and CD20 (Agilent, GA604) staining, following deparaffinization and rehydration, slides were blocked with peroxidase and incubated with primary antibody followed by DAB enhancer and hematoxylin counterstain. Slides were then dehydrated through a graded alcohol series, cleared with xylene and mounted with coverslips. 3. Histological scoring [00194] Pathological scoring for TLS for all cases were blinded and reviewed by a renal pathologist (16). TLS were quantified using Hematoxylin and Eosin (H&E) immunohistochemistry staining. Organized, dense lymphocytic aggregates (>50 lymphocytes) and expansion of involved interstitium were identified as tertiary lymphoid like structures having histological features analogous to that of lymphoid tissue with or without germinal centers representing stages of TLS development (1, 32, 36-38). The total number of TLS detected per case was normalized to the total amount of biopsied renal cortex (mm2) per case (34, 48). 4. Protein measurement [00195] Urine and plasma samples were collected within a 2-hour window from time of laboratory arrival and aliquots were stored at -80ºC. Customized Luminex multiplex bead array assay (ProcartaPlex, ThermoFisher Scientific, Vienna, Austria) was used to determine the concentration of CCL2 (MCP1), CCL3 (macrophage inflammatory protein 1-alpha (MIP-1- alpha)), CCL4, CCL5 (RANTES), CCL8 (monocyte chemoattractant protein 2 (MCP2)), CCL18, CCL19, CCL21, CXCL9 (monokine induced by gamma interferon (MIG)), CXCL10, CXCL11 and CXCL13 in plasma and urine according to the manufacturer’s protocol. Luminex MAGPIX multiplexing system was used to acquire data and xPONENT software (version 4.2) was used to analyze the data. All standards and samples were analyzed in duplicate. Urine specimens were normalized to urine creatinine measured using QuantiChromTM Creatinine Assay Kit - DICT-500 (BioAssay Systems, Hayward, CA). 5. RNA isolation and gene expression profiling [00196] Total RNA was extracted and purified using the RNeasy Mini Kit (Qiagen GmbH, Hilden, Germany) according to manufacture instructions. Quantity and quality of RNA was assayed using Qubit RNA HS Assay Kit (ThermoFisher Scientific). RNA profiling was
performed on 100 ng of RNA extracted from FFPE human kidney samples for the expression of 770 immune oncology-related genes and housekeeping genes using the NanoString nCounter Human V.1.1 PanCancer Immune Profiling Panel (NanoString Technologies Inc, Seattle, WA). Raw data were normalized using the nSolver™ Analysis Software (Version 4.0) with the Advanced Analysis 2.0 plugin. Counts for target genes were normalized to internal synthetic positive controls and housekeeping genes. Data from the NanoString gene expression profiles have been submitted to the European Genome-phenome Archive (EGA) under accession no. EGAS00001006781. 6. Statistics [00197] Expression profiling of RNA samples was evaluated by log2 normalized count data. Log2 normalized counts were used for individual gene analyses, scores for immune signatures were calculated by the geometric mean of signature genes. Urine chemokine to urine creatinine ratios and plasma chemokine levels were transformed to log2 counts. For all specimens, differences in the means of log2 count data were evaluated using one-way ANOVA and Tukey’s multiple comparisons test. Statistical significance was considered at *P<0.05 and **P<0.01. For the volcano plots, ROSALIND cloud platform for nCounter data using Benjamini-Hochberg method was applied to calculate adjusted P-values with FDR threshold of 0.01 or 0.05 as specified. Statistical analyses were performed with GraphPad Prism 5.0 (GraphPad Software, Inc., San Diego, CA) and R version 4.1.1. Spearman’s rho method was used to correlate chemokine expression between tissue vs plasma and tissue vs urine with Spearman’s test used to compute exact p-values. Wilcoxon tests were used to determine p- values for the AUC (H0: AUC=0.5). E. Tables Table 1. Demographic and Clinical characteristics of the cases

 1n (%); Median (IQR) 2Fisher's exact test; Kruskal-Wallis rank sum test Abbreviations: AIN, acute interstitial nephritis; ATN, acute tubular necrosis; HTN, hypertensive nephrosclerosis; ICI, immune checkpoint inhibitor; F, female; M, male; RCC, renal cell carcinoma; Sq cell, squamous cell carcinoma; PD1, programmed cell death protein 1; PD-L1, programmed death- ligand 1; KDIGO, Kidney Disease: Improving Global Outcomes; AKI, acute kidney injury; UA, urinalysis, IFTA, interstitial fibrosis tubular atrophy; GS, glomerulosclerosis; CR, complete recovery; PR, partial recovery; NR, no recovery. Table 2. Top 10 differentially expressed genes between AIN vs ATN

 Benjamini-Hochberg method was applied to calculate adjusted P-values with FDR threshold of 0.01. Table 3. Top 10 differentially expressed genes between AIN vs HTN.
 Benjamini-Hochberg method was applied to calculate adjusted P-values with FDR threshold of 0.01. Table 4. Top 5 TNF superfamily (TNFSF) genes upregulated in AIN vs ATN
 Benjamini-Hochberg method was applied to calculate adjusted P-values with FDR threshold
of 0.01. Table 5. Top 5 TNF superfamily (TNFSF) genes upregulated in AIN vs HTN
Benjamini-Hochberg method was applied to calculate adjusted P-values with FDR threshold
of 0.01. Table 5. Top 5 TNF superfamily (TNFSF) genes upregulated in AIN vs HTN
 Benjamini-Hochberg method was applied to calculate adjusted P-values with FDR threshold of 0.01. Table 6. Predictive AUC for ICI-AIN
 AUC=1 indicates that the given marker can perfectly separate AIN from non-AIN and AUC ≤0.5 indicates the marker has no ability to separate the two groups. Wilcoxon tests were used to determine p-values for the AUC (H0: AUC=0.5), with a low p- value indicating that it is unlikely that the true AUC is 0.5 (i.e. unlikely the marker has no ability to distinguish AIN from non-AIN). Table 7. TLS signature vs individual urine marker

 Spearman’s test used to assess whether correlations were non-zero (H0: rho=0). Table 8. Correlation tissue vs urine marker Tissue- Urine
 Spearman’s test used to assess whether correlations were non-zero (H0: rho=0). Table 9. Marker ability to discriminate AIN vs non-AIN Tissue Urine

 AUC=1 indicates that the given marker can perfectly separate AIN from non-AIN and AUC ≤0.5 indicates the marker has no ability to separate the two groups. Wilcoxon tests were used to determine p-values for the AUC (H0: AUC=0.5), with a low p- value indicating that it is unlikely that the true AUC is 0.5 (i.e. unlikely the marker has no ability to distinguish AIN from non-AIN). Example 2: Application of the markers for detecting ICI-AIN [00198] The inventors enrolled adult patients who developed acute kidney injury (AKI) after receiving immune checkpoint inhibitor (ICI) therapy. They collected urine, blood, and/or kidney/tissue specimen from consented patients. All kidney biopsies were clinically indicated and evaluated by a renal pathologist to establish a pathological diagnosis. They used the pathological diagnosis to determine the different study cohorts. [00199] Extracted RNA from fixed formalin embedded paraffin (FFPE) kidney tissue was quantified and quality assayed using Qubit RNA assay. RNA was used to analyze for the expression of immune oncology-related genes using the NanoString nCounter Human PanCancer Immune Profiling Panel (NanoString Technologies Inc, Seattle, WA). Raw data were normalized using the nSolver™ Analysis Software with Advanced Analysis. Counts for target genes were normalized to internal controls and housekeeping genes. Log2 normalized count data was used for expression profiling of RNA samples. Log2 normalized counts were used for individual gene analyses. [00200] In the analysis, the inventors included three groups/cohort of patients who developed AKI while on ICI therapy. AIN (acute interstitial nephritis) is the most common pathology associated with ICI therapy associated immune related adverse event (irAE) in the kidney. The other two groups were ATN (acute tubular necrosis) and HTN (hypertensive nephrosclerosis). ATN is also an acute injury of the kidney where damage is found in the tubular cells, where the etiology may be ischemic related and not associated with ICI therapy. HTN is a hemodynamic mediated kidney injury also not considered to be related to ICI therapy toxicity. Out of these three groups, AIN has specific treatment recommendations whereas ATN and HTN do not require specific therapy. [00201] Example 1 shows the initial findings. They then performed additional investigation using the differential expression analysis of these cohorts. They grouped ATN and HTN together as “non-AIN” for the following analysis. The inventors performed unbiased computation of our data to identify genes that ideally separate ICI-AIN from non-AIN. Of the 770 genes, the inventors first identified statistically significant gene candidates that had a p-adj
< 0.01. Using this shortened list, the inventors then calculated the AUC (area under the curve) to identify genes that ideally separate AIN vs non-AIN. For reference, an AUC = 1 indicates that the given marker can perfectly separate AIN from non-AIN and AUC ≤ 0.5 indicates the marker has no ability to separate the two groups. The inventors applied Wilcoxon tests to determine p-values for the AUC (H0: AUC = 0.5), a low p-value would indicate that it is unlikely that the true AUC is 0.5 (i.e. unlikely the marker has no ability to distinguish AIN from non-AIN). Using this statistical method, the inventors filtered for only those genes with an AUC > 0.85. Next, they ranked the genes based on log2 fold change from largest to smallest value to identify the top genes with the largest fold change difference between ICI-AIN vs non- AIN. Out of the 770 genes that were analyzed, this table, represents the top 15 genes that ideally separate ICI-AIN vs non-AIN. [00202] The inventors hypothesize that these genes and/or transcribed proteins of these genes, and or combinations, can be used to diagnose irAEs in tissue or body fluids; and can be used for the prognosis, diagnosis, and/or monitoring of irAEs, response to irAE treatment, cancer treatment outcome, patient survival, and/or lead to improved anti-tumor and irAE management. Table 10: ICI-AIN vs non-AIN: Genes with AUC greater than 0.85, absolute log2 fold change greater than 2.5, and q-value (p-adj) smaller than 0.01. Genes are ordered by log2 fold change.
AUC=1 indicates that the given marker can perfectly separate AIN from non-AIN and AUC ≤0.5 indicates the marker has no ability to separate the two groups. Wilcoxon tests were used to determine p-values for the AUC (H0: AUC=0.5), with a low p- value indicating that it is unlikely that the true AUC is 0.5 (i.e. unlikely the marker has no ability to distinguish AIN from non-AIN). Example 2: Application of the markers for detecting ICI-AIN [00198] The inventors enrolled adult patients who developed acute kidney injury (AKI) after receiving immune checkpoint inhibitor (ICI) therapy. They collected urine, blood, and/or kidney/tissue specimen from consented patients. All kidney biopsies were clinically indicated and evaluated by a renal pathologist to establish a pathological diagnosis. They used the pathological diagnosis to determine the different study cohorts. [00199] Extracted RNA from fixed formalin embedded paraffin (FFPE) kidney tissue was quantified and quality assayed using Qubit RNA assay. RNA was used to analyze for the expression of immune oncology-related genes using the NanoString nCounter Human PanCancer Immune Profiling Panel (NanoString Technologies Inc, Seattle, WA). Raw data were normalized using the nSolver™ Analysis Software with Advanced Analysis. Counts for target genes were normalized to internal controls and housekeeping genes. Log2 normalized count data was used for expression profiling of RNA samples. Log2 normalized counts were used for individual gene analyses. [00200] In the analysis, the inventors included three groups/cohort of patients who developed AKI while on ICI therapy. AIN (acute interstitial nephritis) is the most common pathology associated with ICI therapy associated immune related adverse event (irAE) in the kidney. The other two groups were ATN (acute tubular necrosis) and HTN (hypertensive nephrosclerosis). ATN is also an acute injury of the kidney where damage is found in the tubular cells, where the etiology may be ischemic related and not associated with ICI therapy. HTN is a hemodynamic mediated kidney injury also not considered to be related to ICI therapy toxicity. Out of these three groups, AIN has specific treatment recommendations whereas ATN and HTN do not require specific therapy. [00201] Example 1 shows the initial findings. They then performed additional investigation using the differential expression analysis of these cohorts. They grouped ATN and HTN together as “non-AIN” for the following analysis. The inventors performed unbiased computation of our data to identify genes that ideally separate ICI-AIN from non-AIN. Of the 770 genes, the inventors first identified statistically significant gene candidates that had a p-adj
< 0.01. Using this shortened list, the inventors then calculated the AUC (area under the curve) to identify genes that ideally separate AIN vs non-AIN. For reference, an AUC = 1 indicates that the given marker can perfectly separate AIN from non-AIN and AUC ≤ 0.5 indicates the marker has no ability to separate the two groups. The inventors applied Wilcoxon tests to determine p-values for the AUC (H0: AUC = 0.5), a low p-value would indicate that it is unlikely that the true AUC is 0.5 (i.e. unlikely the marker has no ability to distinguish AIN from non-AIN). Using this statistical method, the inventors filtered for only those genes with an AUC > 0.85. Next, they ranked the genes based on log2 fold change from largest to smallest value to identify the top genes with the largest fold change difference between ICI-AIN vs non- AIN. Out of the 770 genes that were analyzed, this table, represents the top 15 genes that ideally separate ICI-AIN vs non-AIN. [00202] The inventors hypothesize that these genes and/or transcribed proteins of these genes, and or combinations, can be used to diagnose irAEs in tissue or body fluids; and can be used for the prognosis, diagnosis, and/or monitoring of irAEs, response to irAE treatment, cancer treatment outcome, patient survival, and/or lead to improved anti-tumor and irAE management. Table 10: ICI-AIN vs non-AIN: Genes with AUC greater than 0.85, absolute log2 fold change greater than 2.5, and q-value (p-adj) smaller than 0.01. Genes are ordered by log2 fold change.


Claims
CLAIMS 1. A method for evaluating a subject comprising measuring the level of one or more biomarkers in one or more biological sample(s) from the subject, wherein the biomarker(s) are one or more of IL5, CD274, TNFSF4, FAS, IL20, TSLP, TNFSF15, CCL1, IL6, TNF, CLEC4A, NCR1, FGF19, IL5RA, MUC16, CCL3, VCAM1, EPO, IFNL1, MMP3, IL9, IL16, IL36A, FLT1, IL18, IL12RB1, KITLG, LTF, CCL18, LCN2, CXCL13, S100A8, CXCL9, CD79A, CCR7, CXCL1, C3, TREM1, IL7R, CD19, LTB, MS4A1, SAA1, CXCL10, C1QB, TNFRSF17, CTLA4, CXCL6, CD27, CD38, CXCL11, CD163, FCGR3A, ITGAX, CD7, C1QA, RUNX3, SLAMF7, IRF4, SELL, ZAP70, CD48, SIGLEC1, PDCD1, IL2RB, JAK3, CTSS, CSF2RB, IL2RG, ISG20, EBI3, C2, ITGAL, CCR5, IDO1, LCP1, CD5, CD6, SH2D1A, CYBB, CCL5, IL10RA, VEGFC, IL13RA2, IL36G, MMP9, EGF, CTF1, CHI3L1, IL1R1, TNFRSF8, SPP1, IL15RA, TNFRSF1B, TNFRSF18, TNFRSF1A, CX3CL1, CD40, IL17A, TNFRSF14, CXADR, TNFRSF9, TNFRSF11A, TNFSF11, IL2RA, MDK, IL18BP, LTBR, SLURP1, CSF1, and/or IL33.
2. A method for making an antibody-protein complex comprising contacting a biological sample from a subject with one or more antibodies that bind to one or more biomarkers, wherein the one or more biomarker(s) are IL5, CD274, TNFSF4, FAS, IL20, TSLP, TNFSF15, CCL1, IL6, TNF, CLEC4A, NCR1, FGF19, IL5RA, MUC16, CCL3, VCAM1, EPO, IFNL1, MMP3, IL9, IL16, IL36A, FLT1, IL18, IL12RB1, KITLG, LTF, CCL18, LCN2, CXCL13, S100A8, CXCL9, CD79A, CCR7, CXCL1, C3, TREM1, IL7R, CD19, LTB, MS4A1, SAA1, CXCL10, C1QB, TNFRSF17, CTLA4, CXCL6, CD27, CD38, CXCL11, CD163, FCGR3A, ITGAX, CD7, C1QA, RUNX3, SLAMF7, IRF4, SELL, ZAP70, CD48, SIGLEC1, PDCD1, IL2RB, JAK3, CTSS, CSF2RB, IL2RG, ISG20, EBI3, C2, ITGAL, CCR5, IDO1, LCP1, CD5, CD6, SH2D1A, CYBB, CCL5, IL10RA, VEGFC, IL13RA2, IL36G, MMP9, EGF, CTF1, CHI3L1, IL1R1, TNFRSF8, SPP1, IL15RA, TNFRSF1B, TNFRSF18, TNFRSF1A, CX3CL1, CD40, IL17A, TNFRSF14, CXADR, TNFRSF9, TNFRSF11A, TNFSF11, IL2RA, MDK, IL18BP, LTBR, SLURP1, CSF1, and/or IL33.
3. A method of diagnosing or prognosing a subject with kidney dysfunction, the method comprising: a) measuring the level of one or more biomarkers in one or more biological sample(s) from the subject; and b) diagnosing or prognosing the subject with ICI induced kidney dysfunction or non-ICI induced kidney dysfunction based on the measured level of the biomarker(s), wherein the biomarker(s) are one or more of IL5, CD274, TNFSF4, FAS, IL20, TSLP, TNFSF15,
CCL1, IL6, TNF, CLEC4A, NCR1, FGF19, IL5RA, MUC16, CCL3, VCAM1, EPO, IFNL1, MMP3, IL9, IL16, IL36A, FLT1, IL18, IL12RB1, KITLG, LTF, CCL18, LCN2, CXCL13, S100A8, CXCL9, CD79A, CCR7, CXCL1, C3, TREM1, IL7R, CD19, LTB, MS4A1, SAA1, CXCL10, C1QB, TNFRSF17, CTLA4, CXCL6, CD27, CD38, CXCL11, CD163, FCGR3A, ITGAX, CD7, C1QA, RUNX3, SLAMF7, IRF4, SELL, ZAP70, CD48, SIGLEC1, PDCD1, IL2RB, JAK3, CTSS, CSF2RB, IL2RG, ISG20, EBI3, C2, ITGAL, CCR5, IDO1, LCP1, CD5, CD6, SH2D1A, CYBB, CCL5, IL10RA, VEGFC, IL13RA2, IL36G, MMP9, EGF, CTF1, CHI3L1, IL1R1, TNFRSF8, SPP1, IL15RA, TNFRSF1B, TNFRSF18, TNFRSF1A, CX3CL1, CD40, IL17A, TNFRSF14, CXADR, TNFRSF9, TNFRSF11A, TNFSF11, IL2RA, MDK, IL18BP, LTBR, SLURP1, CSF1, and/or IL33.
4. A method of monitoring a subject that has been administered ICI therapy, the method comprising: a) measuring the level of one or more biomarkers in one or more biological sample(s) from the subject; and b) administering ICI therapy or an additional therapeutic agent that excludes ICI therapy based on the measured level of the one or more biomarkers, wherein the biomarker(s) are one or more of IL5, CD274, TNFSF4, FAS, IL20, TSLP, TNFSF15, CCL1, IL6, TNF, CLEC4A, NCR1, FGF19, IL5RA, MUC16, CCL3, VCAM1, EPO, IFNL1, MMP3, IL9, IL16, IL36A, FLT1, IL18, IL12RB1, KITLG, LTF, CCL18, LCN2, CXCL13, S100A8, CXCL9, CD79A, CCR7, CXCL1, C3, TREM1, IL7R, CD19, LTB, MS4A1, SAA1, CXCL10, C1QB, TNFRSF17, CTLA4, CXCL6, CD27, CD38, CXCL11, CD163, FCGR3A, ITGAX, CD7, C1QA, RUNX3, SLAMF7, IRF4, SELL, ZAP70, CD48, SIGLEC1, PDCD1, IL2RB, JAK3, CTSS, CSF2RB, IL2RG, ISG20, EBI3, C2, ITGAL, CCR5, IDO1, LCP1, CD5, CD6, SH2D1A, CYBB, CCL5, IL10RA, VEGFC, IL13RA2, IL36G, MMP9, EGF, CTF1, CHI3L1, IL1R1, TNFRSF8, SPP1, IL15RA, TNFRSF1B, TNFRSF18, TNFRSF1A, CX3CL1, CD40, IL17A, TNFRSF14, CXADR, TNFRSF9, TNFRSF11A, TNFSF11, IL2RA, MDK, IL18BP, LTBR, SLURP1, CSF1, and/or IL33.
5. The method of claim 3 or 4, wherein the method further comprises comparing the measured level of the biomarker(s) to a control.
6. The method of any one of claims 3-5, wherein at least 5 of the biomarkers are measured in the subject.
7. The method of any one of claims 3-6, wherein the level of the biomarker(s) are determined to be increased relative to a control.
8. The method of any one of claims 3-7, wherein the subject is diagnosed with ICI induced kidney dysfunction when the level of the biomarker(s) are determined to be increased relative to a control.
9. The method of any one of claims 3-8, wherein the control comprises the level of the biomarker(s) in a biological sample from a subject determined to have non-ICI induced kidney dysfunction, a biological sample from a subject determined to not have kidney dysfunction, a biological sample from a subject that has been administered ICI therapy and has been determined to have non-ICI induced kidney dysfunction, or a biological sample from a subject not on ICI therapy.
10. The method of any one of claims 3-9, wherein the subject is diagnosed with an irAE.
11. The method of claim 10, wherein the irAE comprises ICI induced AIN.
12. The method of any one of claims 3-11, wherein the method further comprises administration of an additional therapeutic agent.
13. The method of claim 12, wherein the additional therapeutic agent comprises a steroid, a TNF-alpha inhibitor, glucocorticoid therapy, an IFN-gamma inhibitor, an IL-6 inhibitor, mycophenolate mofetil, cyclosporine, cyclophosphamide, Rituximab, JAK inhibitor, STAT inhibitor, or combinations thereof.
14. The method of any one of claims 3-13, wherein the method further comprises discontinuing a prescribed ICI administration after the level of the biomarker(s) has been measured.
15. The method of any one of claims 3-14, wherein the level of the biomarker(s) are determined to be decreased relative to a control.
16. The method of any one of claims 3-15, wherein the level of the biomarker(s) are determined to be the same or not significantly different than a control.
17. The method of any one of claims 3-16, wherein the control comprises the level of the biomarker(s) in a biological sample from a subject determined to have non-ICI induced kidney dysfunction, a biological sample from a subject determined to not have kidney dysfunction, a biological sample from a subject that has been administered ICI therapy and has been determined to have non-ICI induced kidney dysfunction, or a biological sample from a subject not on ICI therapy.
18. The method of any one of claims 3-17, wherein the control comprises the level of the biomarker(s) in a biological sample from a subject determined to have ICI induced kidney dysfunction, a biological sample from a subject determined to have kidney dysfunction, or a
biological sample from a subject that has been administered ICI therapy and has been determined to have ICI induced kidney dysfunction.
19. The method of any one of claims 3-18, wherein the subject is diagnosed with non-ICI kidney dysfunction.
20. The method of any one of claims 3-19, wherein the non-ICI induced kidney dysfunction comprises ATN and/or HTN.
21. The method of claim 19 or 20, wherein the method further comprises administering ICI therapy after the subject has been diagnosed with non-ICI kidney dysfunction.
22. A method for treating kidney disfunction in a subject with cancer, the method comprising administering a non-ICI therapeutic agent to a subject that has had the level of one or more biomarker(s) measured in one or more biological sample(s) from the subject, wherein the biomarker(s) are one or more of IL5, CD274, TNFSF4, FAS, IL20, TSLP, TNFSF15, CCL1, IL6, TNF, CLEC4A, NCR1, FGF19, IL5RA, MUC16, CCL3, VCAM1, EPO, IFNL1, MMP3, IL9, IL16, IL36A, FLT1, IL18, IL12RB1, KITLG, LTF, CCL18, LCN2, CXCL13, S100A8, CXCL9, CD79A, CCR7, CXCL1, C3, TREM1, IL7R, CD19, LTB, MS4A1, SAA1, CXCL10, C1QB, TNFRSF17, CTLA4, CXCL6, CD27, CD38, CXCL11, CD163, FCGR3A, ITGAX, CD7, C1QA, RUNX3, SLAMF7, IRF4, SELL, ZAP70, CD48, SIGLEC1, PDCD1, IL2RB, JAK3, CTSS, CSF2RB, IL2RG, ISG20, EBI3, C2, ITGAL, CCR5, IDO1, LCP1, CD5, CD6, SH2D1A, CYBB, CCL5, IL10RA, VEGFC, IL13RA2, IL36G, MMP9, EGF, CTF1, CHI3L1, IL1R1, TNFRSF8, SPP1, IL15RA, TNFRSF1B, TNFRSF18, TNFRSF1A, CX3CL1, CD40, IL17A, TNFRSF14, CXADR, TNFRSF9, TNFRSF11A, TNFSF11, IL2RA, MDK, IL18BP, LTBR, SLURP1, CSF1, and/or IL33.
23. The method of claim 22, wherein the subject has received ICI therapy.
24. The method of claim 22 or.23, wherein the method further comprises administering an ICI therapy prior to the administration of the non-ICI therapeutic agent.
25. The method of any one of claims 22-24, wherein the non-ICI induced kidney dysfunction comprises ATN and/or HTN.
26. The method of any one of claims 22-25, wherein the non-ICI therapy comprises a steroid, a TNF-alpha inhibitor, glucocorticoid therapy, an IFN-gamma inhibitor, an IL-6 inhibitor, mycophenolate mofetil, cyclosporine, cyclophosphamide, Rituximab, JAK inhibitor, STAT inhibitor, and combinations thereof.
27. The method of claim 26, wherein the TNF-alpha inhibitor comprises infliximab or an anti-TNF-alpha antibody.
28. The method of any one of claims 22-27, wherein the method further comprises discontinuing a prescribed ICI administration after the level of the biomarker(s) has been measured.
29. The method of any one of claims 1-28, wherein the biological sample comprises urine, serum, plasma, body fluid, and/or tissue sample.
30. The method of claim 29, wherein the biological sample comprises a urine sample.
31. The method of claim 29 or 30, wherein the biological sample comprises a plasma sample.
32. The method of any one of claims 29-31, wherein the biological sample comprises a urine and plasma sample.
33. The method of any one of claims 1-32, wherein a protein level of the biomarker is measured.
34. The method of any one of claims 1-32, wherein a mRNA level of the biomarker is measured.
35. The method of any one of claims 1-34, wherein the level is measured by ELISA or a protein detection assay.
36. The method of any one of claims 1-35, wherein IL5 is measured and/or the biomarker(s) comprise IL5.
37. The method of any one of claims 1-36, wherein FAS is measured and/or the biomarker(s) comprise FAS.
38. The method of any one of claims 1-37, wherein TNF is measured and/or the biomarker(s) comprise TNF.
39. The method of any one of claims 1-38, wherein CXCL9 is measured and/or the biomarker(s) comprise CXCL9.
40. The method of any one of claims 1-39, wherein CD274 is measured and/or the biomarker(s) comprise CD274
41. The method of any one of claims 1-40, wherein TNFSF4 is measured and/or the biomarker(s) comprise TNFSF4.
42. The method of any one of claims 1-41, wherein IL6 is measured and/or the biomarker(s) comprise IL6.
43. The method of any one of claims 1-42, wherein TSLP is measured and/or the biomarker(s) comprise TSLP.
44. The method of any one of claims 1-43, wherein IFNL1 is measured and/or the biomarker(s) comprise IFNL1.
45. The method of any one of claims 1-44, wherein IL20 is measured and/or the biomarker(s) comprise IL20.
46. The method of any one of claims 1-45, wherein TNFSF15 is measured and/or the biomarker(s) comprise TNFSF15.
47. The method of any one of claims 1-46, wherein TREM1 is measured and/or the biomarker(s) comprise TREM1.
48. The method of any one of claims 1-47, wherein CCL1 is measured and/or the biomarker(s) comprise CCL1.
49. The method of any one of claims 1-48, wherein CCL3 is measured and/or the biomarker(s) comprise CCL3.
50. The method of any one of claims 1-49, wherein MUC16is measured and/or the biomarker(s) comprise MUC16.
51. The method of any one of claims 1-50, wherein CLEC4A is measured and/or the biomarker(s) comprise CLEC4A.
52. The method of any one of claims 1-51, wherein FGF19 is measured and/or the biomarker(s) comprise FGF19.
53. The method of any one of claims 1-52, wherein VEGFC is measured and/or the biomarker(s) comprise VEGFC.
54. The method of any one of claims 1-53, wherein KITLG is measured and/or the biomarker(s) comprise KITLG.
55. The method of any one of claims 1-54, wherein IL13RA2 is measured and/or the biomarker(s) comprise IL13RA2.
56. The method of any one of claims 1-55, wherein IL16 is measured and/or the biomarker(s) comprise IL16.
57. The method of any one of claims 1-56, wherein IL36G is measured and/or the biomarker(s) comprise IL36G.
58. The method of any one of claims 1-57, wherein NCR1 is measured and/or the biomarker(s) comprise NCR1.
59. The method of any one of claims 1-58, wherein MMP9is measured and/or the biomarker(s) comprise MMP9.
60. The method of any one of claims 1-59, wherein EGF is measured and/or the biomarker(s) comprise EGF.
61. The method of any one of claims 1-60, wherein CXCL10 is measured and/or the biomarker(s) comprise CXCL10.
62. The method of any one of claims 1-61, wherein CTF1 is measured and/or the biomarker(s) comprise CTF1.
63. The method of any one of claims 1-62, wherein MMP3 is measured and/or the biomarker(s) comprise MMP3.
64. The method of any one of claims 1-63, wherein CHI3L1 is measured and/or the biomarker(s) comprise CHI3L1.
65. The method of any one of claims 1-64, wherein IL1R1 is measured and/or the biomarker(s) comprise IL1R1.
66. The method of any one of claims 1-65, wherein TNFRSF8 is measured and/or the biomarker(s) comprise TNFRSF8.
67. The method of any one of claims 1-66, wherein SPP1 is measured and/or the biomarker(s) comprise SPP1.
68. The method of any one of claims 1-67, wherein IL36A is measured and/or the biomarker(s) comprise IL36A.
69. The method of any one of claims 1-68, wherein IL15RA is measured and/or the biomarker(s) comprise IL15RA.
70. The method of any one of claims 1-69, wherein CCL1 is measured and/or the biomarker(s) comprise CCL1.
71. The method of any one of claims 1-70, wherein TNFRSF1B is measured and/or the biomarker(s) comprise TNFRSF1B.
72. The method of any one of claims 1-71, wherein TNFRSF18 is measured and/or the biomarker(s) comprise TNFRSF18.
73. The method of any one of claims 1-72, wherein TREM1 is measured and/or the biomarker(s) comprise TREM1.
74. The method of any one of claims 1-73, wherein TNFRSF1A is measured and/or the biomarker(s) comprise TNFRSF1A.
75. The method of any one of claims 1-74, wherein CX3CL1 is measured and/or the biomarker(s) comprise CX3CL1.
76. The method of any one of claims 1-75, wherein CD40 is measured and/or the biomarker(s) comprise CD40.
77. The method of any one of claims 1-76, wherein IL17A is measured and/or the biomarker(s) comprise IL17A.
78. The method of any one of claims 1-77, wherein TNFRSF14 is measured and/or the biomarker(s) comprise TNFRSF14.
79. The method of any one of claims 1-78, wherein CXADR is measured and/or the biomarker(s) comprise CXADR.
80. The method of any one of claims 1-79, wherein TNFRSF9 is measured and/or the biomarker(s) comprise TNFRSF9.
81. The method of any one of claims 1-80, wherein TNFRSF11A is measured and/or the biomarker(s) comprise TNFRSF11A.
82. The method of any one of claims 1-81, wherein CXCL13 is measured and/or the biomarker(s) comprise CXCL13.
83. The method of any one of claims 1-82, wherein IL2RA is measured and/or the biomarker(s) comprise IL2RA.
84. The method of any one of claims 1-83, wherein MDK is measured and/or the biomarker(s) comprise MDK.
85. The method of any one of claims 1-84, wherein IL18BP is measured and/or the biomarker(s) comprise IL18BP.
86. The method of any one of claims 1-85, wherein CXCL1 is measured and/or the biomarker(s) comprise CXCL1.
87. The method of any one of claims 1-86, wherein LTBR is measured and/or the biomarker(s) comprise LTBR.
88. The method of any one of claims 1-87, wherein SLURP1 is measured and/or the biomarker(s) comprise SLURP1.
89. The method of any one of claims 1-88, wherein CXCL9 is measured and/or the biomarker(s) comprise CXCL9.
90. The method of any one of claims 1-89, wherein CSF1 is measured and/or the biomarker(s) comprise CSF1.
91. The method of any one of claims 1-90, wherein IL33 is measured and/or the biomarker(s) comprise IL33.
92. The method of any one of claims 1-91, wherein IL5 and FAS are measured and/or the biomarker(s) comprise or consist of IL5 and FAS.
93. The method of any one of claims 1-92, wherein IL5 and CXCL9 are measured and/or the biomarker(s) comprise or consist of IL5 and CXCL9.
94. The method of any one of claims 1-93, wherein FAS and TNFSF15 are measured and/or the biomarker(s) comprise or consist of FAS and TNFSF15.
95. The method of any one of claims 1-94, wherein FAS and TNFSF4 are measured and/or the biomarker(s) comprise or consist of FAS and TNFSF4.
96. The method of any one of claims 1-95, wherein FAS and IL20 are measured and/or the biomarker(s) comprise or consist of FAS and IL20.
97. The method of any one of claims 1-96, wherein FAS and TNF are measured and/or the biomarker(s) comprise or consist of FAS and TNF.
98. The method of any one of claims 1-97, wherein FAS and TSLP are measured and/or the biomarker(s) comprise or consist of FAS and TSLP.
99. The method of any one of claims 1-98, wherein IL5 and TSLP are measured and/or the biomarker(s) comprise or consist of IL5 and TSLP.
100. The method of any one of claims 1-99, wherein IL5 and CCL1 are measured and/or the biomarker(s) comprise or consist of IL5 and CCL1.
101. The method of any one of claims 1-100, wherein FAS and CCL1 are measured and/or the biomarker(s) comprise or consist of FAS and CCL1.
102. The method of any one of claims 1-101, wherein TNFSF4 and CXCL9 are measured and/or the biomarker(s) comprise or consist of TNFSF4 and CXCL9.
103. The method of any one of claims 1-102, wherein IL5 and IL20 are measured and/or the biomarker(s) comprise or consist of IL5 and IL20.
104. The method of any one of claims 1-103, wherein IL5 and TNFSF15 are measured and/or the biomarker(s) comprise or consist of IL5 and TNFSF15.
105. The method of any one of claims 1-104, wherein IL5 and TNF are measured and/or the biomarker(s) comprise or consist of IL5 and TNF.
106. The method of any one of claims 1-105, wherein IL5 and TNFSF4 are measured and/or the biomarker(s) comprise or consist of IL5 and TNFSF4.
107. The method of any one of claims 1-106, wherein IL5 and IL9 are measured and/or the biomarker(s) comprise or consist of IL5 and IL9.
108. The method of any one of claims 1-107, wherein FAS and CXCL9 are measured and/or the biomarker(s) comprise or consist of FAS and CXCL9.
109. The method of any one of claims 1-108, wherein CXCL9 and IL20 are measured and/or the biomarker(s) comprise or consist of CXCL9 and IL20.
110. The method of any one of claims 1-109, wherein FAS and IL9 are measured and/or the biomarker(s) comprise or consist of FAS and IL9.
111. The method of any one of claims 1-110, wherein CXCL9 and TNFSF15 are measured and/or the biomarker(s) comprise or consist of CXCL9 and TNFSF15.
112. The method of any one of claims 1-111, wherein TNF and TNFSF4 are measured and/or the biomarker(s) comprise or consist of TNF and TNFSF4.
113. The method of any one of claims 1-112, wherein CXCL9 and CCL1 are measured and/or the biomarker(s) comprise or consist of CXCL9 and CCL1.
114. The method of any one of claims 1-113, wherein TNFSF4 and TSLP are measured and/or the biomarker(s) comprise or consist of TNFSF4 and TSLP.
115. The method of any one of claims 1-114, wherein TNF and TNFSF15 are measured and/or the biomarker(s) comprise or consist of TNF and TNFSF15.
116. The method of any one of claims 1-115, wherein IL20 and CCL1 are measured and/or the biomarker(s) comprise or consist of IL20 and CCL1.
117. The method of any one of claims 1-116, wherein TNF and IL20 are measured and/or the biomarker(s) comprise or consist of TNF and IL20.
118. The method of any one of claims 1-117, wherein IL20 and TNFSF15 are measured and/or the biomarker(s) comprise or consist of IL20 and TNFSF15.
119. The method of any one of claims 1-118, wherein TNFSF4 and IL20 are measured and/or the biomarker(s) comprise or consist of TNFSF4 and IL20.
120. The method of any one of claims 1-119, wherein TNFSF4 and CCL1 are measured and/or the biomarker(s) comprise or consist of TNFSF4 and CCL1.
121. The method of any one of claims 1-120, wherein TNF and CXCL9 are measured and/or the biomarker(s) comprise or consist of TNF and CXCL9.
122. The method of any one of claims 1-121, wherein CXCL9 and TSLP are measured and/or the biomarker(s) comprise or consist of CXCL9 and TSLP.
123. The method of any one of claims 1-122, wherein IL20 and IL9 are measured and/or the biomarker(s) comprise or consist of IL20 and IL9.
124. The method of any one of claims 1-123, wherein TNFSF4 and TNFSF15 are measured and/or the biomarker(s) comprise or consist of TNFSF4 and TNFSF15.
125. The method of any one of claims 1-124, wherein CXCL9 and IL9 are measured and/or the biomarker(s) comprise or consist of CXCL9 and IL9.
126. The method of any one of claims 1-125, wherein TNFSF4 and IL9 are measured and/or the biomarker(s) comprise or consist of TNFSF4 and IL9.
127. The method of any one of claims 1-126, wherein IL20 and TSLP are measured and/or the biomarker(s) comprise or consist of IL20 and TSLP.
128. The method of any one of claims 1-127, wherein TNFSF15 and CCL1 are measured and/or the biomarker(s) comprise or consist of TNFSF15 and CCL1.
129. The method of any one of claims 1-128, wherein TNFSF15 and TSLP are measured and/or the biomarker(s) comprise or consist of TNFSF15 and TSLP.
130. The method of any one of claims 1-129, wherein TNFSF15 and IL9 are measured and/or the biomarker(s) comprise or consist of TNFSF15 and IL9.
131. The method of any one of claims 1-130, wherein TNF and TSLP are measured and/or the biomarker(s) comprise or consist of TNF and TSLP.
132. The method of any one of claims 1-131, wherein TNF and CCL1 are measured and/or the biomarker(s) comprise or consist of TNF and CCL1.
133. The method of any one of claims 1-132, wherein TNF and IL9 are measured and/or the biomarker(s) comprise or consist of TNF and IL9.
134. The method of any one of claims 1-133, wherein TSLP and CCL1 are measured and/or the biomarker(s) comprise or consist of TSLP and CCL1.
135. The method of any one of claims 1-134, wherein TSLP and IL9 are measured and/or the biomarker(s) comprise or consist of TSLP and IL9.
136. The method of any one of claims 1-135, wherein CCL1 and IL9 are measured and/or the biomarker(s) comprise or consist of CCL1 and IL9.
137. The method of any one of claims 1-136, wherein CCL1 and IL27 are measured and/or the biomarker(s) comprise or consist of CCL1 and IL27.
138. The method of any one of claims 1-137, wherein TNFRSF8 and TNFSF11 are measured and/or the biomarker(s) comprise or consist of TNFRSF8 and TNFSF11.
139. The method of any one of claims 1-138, wherein TNFSF11 and IL36A are measured and/or the biomarker(s) comprise or consist of TNFSF11 and IL36A.
140. The method of any one of claims 1-139, wherein IL36A and TNFRSF8 are measured and/or the biomarker(s) comprise or consist of IL36A and TNFRSF8.
141. The method of any one of claims 1-140, wherein FAS and IL36A are measured and/or the biomarker(s) comprise or consist of FAS and IL36A.
142. The method of claim 141, wherein FAS is measured from a urine sample and IL36A is measured from a plasma sample.
143. The method of any one of claims 1-142, wherein IL5 and IL36A are measured and/or the biomarker(s) comprise or consist of IL5 and IL36A.
144. The method of claim 143, wherein IL5 is measured from a urine sample and IL36A is measured from a plasma sample.
145. The method of any one of claims 1-144, wherein CXCL9 and IL36A are measured and/or the biomarker(s) comprise or consist of CXCL9 and IL36A.
146. The method of claim 145, wherein CXCL9 is measured from a urine sample and IL36A is measured from a plasma sample.
147. The method of any one of claims 1-146, wherein IL5 and TNFRSF8 are measured and/or the biomarker(s) comprise or consist of IL5 and TNFRSF8.
148. The method of claim 147, wherein IL5 is measured from a urine sample and TNFRSF8 is measured from a plasma sample.
149. The method of any one of claims 1-148, wherein FAS and TNFRSF8 are measured and/or the biomarker(s) comprise or consist of FAS and TNFRSF8.
150. The method of claim 149, wherein FAS is measured from a urine sample and TNFRSF8 is measured from a plasma sample.
151. The method of any one of claims 1-150, wherein CXCL9 and TNFRSF8 are measured and/or the biomarker(s) comprise or consist of CXCL9 and TNFRSF8.
152. The method of claim 151, wherein CXCL9 is measured from a urine sample and TNFRSF8 is measured from a plasma sample.
153. The method of any one of claims 1-152, wherein the method further comprises measuring the level of a control gene or protein.
154. The method of claim 153, wherein the control gene or protein comprises urine creatinine.
155. The method of any one of claims 1-154, wherein the measured level of the biomarker is normalized to the level of the control gene or protein.
156. The method of claim 155, wherein the level, measured level, or normalized level of the biomarker is greater than or less than 6.
157. The method of claim 155, wherein the level or normalized level or biomarker level is greater than or less than 7.
158. The method of claim 155, wherein the level, measured level, or normalized level of the biomarker is greater than or less than 8.
159. The method of claim 155, wherein the level, measured level, or normalized level of the biomarker is greater than or less than 9.
160. The method of claim 155, wherein the level, measured level, or normalized level of the biomarker is greater than or less than 10.
161. The method of claim 155, wherein the level, measured level, or normalized level of the biomarker is greater than or less than 11.
162. The method of claim 155, wherein the level, measured level, or normalized level of the biomarker is greater than or less than 12.
163. The method of claim 155, wherein the level, measured level, or normalized level of the biomarker is greater than or less than 13.
164. The method of any one of claims 1-163, wherein the biological sample is from a subject who has been administered immune checkpoint inhibitor (ICI) therapy.
165. The method of claim 164, wherein the ICI therapy comprises a monotherapy or a combination ICI therapy.
166. The method of claim 164 or 165, wherein the ICI therapy comprises an inhibitor of PD- 1, PDL1, PDL2, CTLA-4, B7-1, B7-2, LAG3, and/or TIGIT.
167. The method of any one of claims 164-166, wherein the ICI therapy comprises an anti- PD-1 monoclonal antibody and/or an anti-CTLA-4 monoclonal antibody.
168. The method of any one of claims 164-167, wherein the ICI therapy comprises one or more of nivolumab, atezolizumab, avelumab, durvalumab, cemiplimab, pembrolizumab, pidilizumab, ipilimumab, tremelimumab, relatimab, opdualag, tebotelimab, favezelimab, eftilagimod, ieramilimab, fianlimab, tiragolumab, vibostolimab, domvanalimab and/or etigilimab.
169. The method of any one of claims 1-168, wherein the biological sample is from a subject with an immune-related adverse event (irAE).
170. The method of any one of claims 1-168, wherein the subject is suspected to have an immune related adverse event.
171. The method of claims 169 or 170, wherein the irAE comprises acute interstitial nephritis (AIN) or an inflammatory lesion.
172. The method of any one of claims 1-171, wherein the biological sample is from a subject that has symptoms of kidney dysfunction.
173. The method of any one of claims 1-171, wherein the biological sample is from a subject that does not have symptoms of kidney dysfunction.
174. The method of any one of claims 1-173, wherein the biological sample is from a subject that has cancer.
175. The method of any one of claims 1-174, wherein the biomarker is further defined as a biomarker for AIN vs. non-AIN with an area under the curve (AUC) value of greater than 0.5.
176. The method of any one of claims 1-175, wherein the biomarker is further defined as a biomarker for AIN vs. non-AIN with an AUC value of greater than 0.8.
177. The method of any one of claims 1-176, wherein at least 2 of the biomarkers are measured in the subject.
178. The method of any one of claims 1-177, wherein the level of the biomarker(s) are determined to be increased relative to a control.
179. The method of any one of claims 1-177, wherein the level of the biomarker(s) are determined to be decreased relative to a control.
180. The method of any one of claims 1-177, wherein the level of the biomarker(s) are determined to be the same or not significantly different than a control.
181. The method of any one of claims 178-180, wherein the control comprises the level of the biomarker(s) in a biological sample from a subject determined to have non-ICI induced kidney dysfunction, a biological sample from a subject determined to not have kidney dysfunction, a biological sample from a subject that has been administered ICI therapy and has been determined to have non-ICI induced kidney dysfunction, or a biological sample from a subject not on ICI therapy.
182. The method of any one of claims 178-180, wherein the control comprises the level of the biomarker(s) in a biological sample from a subject determined to have ICI induced kidney dysfunction, a biological sample from a subject determined to have kidney dysfunction, or a biological sample from a subject that has been administered ICI therapy and has been determined to have ICI induced kidney dysfunction.
183. The method of any one of claims 1-182, wherein the method further comprises diagnosing the subject.
184. The method of claim 183, wherein the subject is diagnosed with ICI induced AIN based on the level of the one or more biomarkers.
185. The method of claim 184, wherein the method further comprises administration of an additional therapeutic agent.
186. The method of claim 185, wherein the additional therapeutic agent comprises one or more of a steroid, a TNF-alpha inhibitor, glucocorticoid therapy, an IFN-gamma inhibitor, an IL-6 inhibitor, mycophenolate mofetil, cyclosporine, cyclophosphamide, Rituximab, JAK inhibitor, STAT inhibitor, and combinations thereof.
187. The method of claim 186, wherein the TNF-alpha inhibitor comprises infliximab or an anti-TNF-alpha antibody.
188. The method of any one of claims 184-187, wherein the method further comprises discontinuing a prescribed ICI administration after the level of the biomarker(s) has been measured.
189. The method of claim 183, wherein the subject is diagnosed with non-ICI kidney dysfunction based on the level of the one or more biomarkers.
190. The method of any on one of claims 181-189, wherein non-ICI kidney dysfunction comprises acute tubular necrosis (ATN), acute tubular injury, and/or hypertensive (HTN) nephrosclerosis.
191. The method of claim 189 or 190, wherein the method further comprises administering ICI therapy after the subject has been diagnosed with non-ICI kidney dysfunction. 191.1 The method of any one of claims 1-191, wherein the subject is a human subject.
192. A kit comprising agents for detecting one or more biomarker(s), wherein the biomarker(s) are one or more of IL5, CD274, TNFSF4, FAS, IL20, TSLP, TNFSF15, CCL1, IL6, TNF, CLEC4A, NCR1, FGF19, IL5RA, MUC16, CCL3, VCAM1, EPO, IFNL1, MMP3, IL9, IL16, IL36A, FLT1, IL18, IL12RB1, KITLG, LTF, CCL18, LCN2, CXCL13, S100A8, CXCL9, CD79A, CCR7, CXCL1, C3, TREM1, IL7R, CD19, LTB, MS4A1, SAA1, CXCL10, C1QB, TNFRSF17, CTLA4, CXCL6, CD27, CD38, CXCL11, CD163, FCGR3A, ITGAX, CD7, C1QA, RUNX3, SLAMF7, IRF4, SELL, ZAP70, CD48, SIGLEC1, PDCD1, IL2RB, JAK3, CTSS, CSF2RB, IL2RG, ISG20, EBI3, C2, ITGAL, CCR5, IDO1, LCP1, CD5, CD6, SH2D1A, CYBB, CCL5, IL10RA, VEGFC, IL13RA2, IL36G, MMP9, EGF, CTF1, CHI3L1, IL1R1, TNFRSF8, SPP1, IL15RA, TNFRSF1B, TNFRSF18, TNFRSF1A, CX3CL1, CD40, IL17A, TNFRSF14, CXADR, TNFRSF9, TNFRSF11A, TNFSF11, IL2RA, MDK, IL18BP, LTBR, SLURP1, CSF1, and IL33.
193. The kit of claim 192, wherein the kit further comprises one or more negative or positive controls.
194. The kit of claim 192 or 193, wherein the agents comprise antibodies that specifically bind to the biomarker.
195. A method for treating immune checkpoint inhibitor (ICI) induced AIN in a human subject that has cancer and that is being treated or has been treated with an ICI, the method comprising: i) administering a non-ICI therapeutic agent to a subject and/or ii) discontinuing the ICI therapy in the subject; wherein the subject has been determined to have increased levels of FAS in a urine sample from the subject and increased levels of IL36A in a plasma sample from the subject, wherein the levels of FAS and IL36A are increased relative to the levels of FAS and IL36A in a subject having kidney dysfunction not induced by ICI or in a subject without kidney dysfunction.
196. A method of diagnosing or prognosing a human subject with kidney dysfunction, the method comprising
a) measuring the level of FAS in a urine sample from the subject and IL36A in a plasma sample from the subject; and b) diagnosing or prognosing the subject with ICI induced kidney dysfunction when the level of FAS and IL36A is increased compared to a control, wherein the control comprises the level of the FAS in a urine sample and IL36A in a plasma sample from a human subject determined to have non-ICI induced kidney dysfunction.
Applications Claiming Priority (4)
| Application Number | Priority Date | Filing Date | Title |
|---|---|---|---|
| US202363524033P | 2023-06-29 | 2023-06-29 | |
| US63/524,033 | 2023-06-29 | ||
| US202363545807P | 2023-10-26 | 2023-10-26 | |
| US63/545,807 | 2023-10-26 |
Publications (2)
| Publication Number | Publication Date |
|---|---|
| WO2025006973A2 true WO2025006973A2 (en) | 2025-01-02 |
| WO2025006973A3 WO2025006973A3 (en) | 2025-05-08 |
Family
ID=93940001
Family Applications (1)
| Application Number | Title | Priority Date | Filing Date |
|---|---|---|---|
| PCT/US2024/036139 Ceased WO2025006973A2 (en) | 2023-06-29 | 2024-06-28 | Methods for treating immune related adverse events |
Country Status (1)
| Country | Link |
|---|---|
| WO (1) | WO2025006973A2 (en) |
Family Cites Families (3)
| Publication number | Priority date | Publication date | Assignee | Title |
|---|---|---|---|---|
| JP2010526087A (en) * | 2007-04-30 | 2010-07-29 | グラクソスミスクライン・リミテッド・ライアビリティ・カンパニー | Methods for administering anti-IL-5 antibodies |
| WO2012018538A2 (en) * | 2010-07-26 | 2012-02-09 | Schering Corporation | Bioassays for determining pd-1 modulation |
| JP7461741B2 (en) * | 2016-06-20 | 2024-04-04 | カイマブ・リミテッド | Anti-PD-L1 and IL-2 Cytokines |
-
2024
- 2024-06-28 WO PCT/US2024/036139 patent/WO2025006973A2/en not_active Ceased
Also Published As
| Publication number | Publication date |
|---|---|
| WO2025006973A3 (en) | 2025-05-08 |
Similar Documents
| Publication | Publication Date | Title |
|---|---|---|
| US10706954B2 (en) | Systems and methods for identifying responders and non-responders to immune checkpoint blockade therapy | |
| CN107206064B (en) | Determinants of cancer response to immunotherapy by PD-1 blockade | |
| ES2808004T3 (en) | Methods for Classifying Patients with Solid Cancer | |
| JP2023500054A (en) | Classification of the tumor microenvironment | |
| US20250382368A1 (en) | Methods of treating a non-small cell lung cancer using an anti-pd-1 antibody | |
| WO2019070755A1 (en) | Methods and compositions for detecting and modulating an immunotherapy resistance gene signature in cancer | |
| EP3606518A1 (en) | Methods and compositions for detecting and modulating an immunotherapy resistance gene signature in cancer | |
| WO2014022826A2 (en) | Biomarker associated with risk of melanoma reoccurrence | |
| JP2020523022A (en) | Methods of detecting and treating a class of hepatocellular carcinoma responsive to immunotherapy | |
| JP2018506528A (en) | Therapeutic targets and biomarkers in IBD | |
| US20260038698A1 (en) | Pan-cancer tumor microenvironment classification based on immune escape mechanisms and immune infiltration | |
| WO2020082037A1 (en) | Methods for treating a subtype of small cell lung cancer | |
| EP4423301A1 (en) | Tumor microenvironment types in breast cancer | |
| JP7772700B2 (en) | Methods for treating glioblastoma | |
| US20260112450A1 (en) | Methods for selection of cancer patients for anti-angiogenic and immune checkpoint blockage therapies and combinations thereof | |
| Ding et al. | Inhibition of PNCK inflames tumor microenvironment and sensitizes head and neck squamous cell carcinoma to immune checkpoint inhibitors | |
| Jha et al. | Myeloid cell influx into the colonic epithelium is associated with disease severity and non-response to anti-Tumor Necrosis Factor Therapy in patients with Ulcerative Colitis | |
| US20230184771A1 (en) | Methods for treating bladder cancer | |
| WO2023019129A1 (en) | Biomarkers for cd40 agonist therapy | |
| US20240229144A1 (en) | Methods for detecting or treating glioblastoma multiforme | |
| Verheijden et al. | Balancing efficacy and toxicity of immune checkpoint inhibitors | |
| US11674951B2 (en) | Methods for identifying a treatment for rheumatoid arthritis | |
| McClure | B cell therapy in ANCA-associated vasculitis | |
| WO2024227553A1 (en) | Biomarkers for use in cancer treatment and predicting responsiveness to a cancer therapy | |
| Forconi et al. | Not so cold after all: tumor infiltrating CD8+ T cells in EBV-positive Burkitt lymphoma are quiescent, not exhausted |
Legal Events
| Date | Code | Title | Description |
|---|---|---|---|
| NENP | Non-entry into the national phase |
Ref country code: DE |