WO2024257970A1 - 비침습적으로 심박출량을 계산하는 장치 및 이의 동작 방법 - Google Patents
비침습적으로 심박출량을 계산하는 장치 및 이의 동작 방법 Download PDFInfo
- Publication number
- WO2024257970A1 WO2024257970A1 PCT/KR2023/019829 KR2023019829W WO2024257970A1 WO 2024257970 A1 WO2024257970 A1 WO 2024257970A1 KR 2023019829 W KR2023019829 W KR 2023019829W WO 2024257970 A1 WO2024257970 A1 WO 2024257970A1
- Authority
- WO
- WIPO (PCT)
- Prior art keywords
- data
- cardiac output
- waveform
- bio
- signal data
- Prior art date
- Legal status (The legal status is an assumption and is not a legal conclusion. Google has not performed a legal analysis and makes no representation as to the accuracy of the status listed.)
- Ceased
Links
Images



Classifications
-
- A—HUMAN NECESSITIES
- A61—MEDICAL OR VETERINARY SCIENCE; HYGIENE
- A61B—DIAGNOSIS; SURGERY; IDENTIFICATION
- A61B5/00—Measuring for diagnostic purposes; Identification of persons
- A61B5/02—Detecting, measuring or recording for evaluating the cardiovascular system, e.g. pulse, heart rate, blood pressure or blood flow
- A61B5/026—Measuring blood flow
- A61B5/029—Measuring blood output from the heart, e.g. minute volume
-
- A—HUMAN NECESSITIES
- A61—MEDICAL OR VETERINARY SCIENCE; HYGIENE
- A61B—DIAGNOSIS; SURGERY; IDENTIFICATION
- A61B5/00—Measuring for diagnostic purposes; Identification of persons
-
- A—HUMAN NECESSITIES
- A61—MEDICAL OR VETERINARY SCIENCE; HYGIENE
- A61B—DIAGNOSIS; SURGERY; IDENTIFICATION
- A61B5/00—Measuring for diagnostic purposes; Identification of persons
- A61B5/02—Detecting, measuring or recording for evaluating the cardiovascular system, e.g. pulse, heart rate, blood pressure or blood flow
- A61B5/021—Measuring pressure in heart or blood vessels
-
- A—HUMAN NECESSITIES
- A61—MEDICAL OR VETERINARY SCIENCE; HYGIENE
- A61B—DIAGNOSIS; SURGERY; IDENTIFICATION
- A61B5/00—Measuring for diagnostic purposes; Identification of persons
- A61B5/02—Detecting, measuring or recording for evaluating the cardiovascular system, e.g. pulse, heart rate, blood pressure or blood flow
- A61B5/021—Measuring pressure in heart or blood vessels
- A61B5/02108—Measuring pressure in heart or blood vessels from analysis of pulse wave characteristics
-
- A—HUMAN NECESSITIES
- A61—MEDICAL OR VETERINARY SCIENCE; HYGIENE
- A61B—DIAGNOSIS; SURGERY; IDENTIFICATION
- A61B5/00—Measuring for diagnostic purposes; Identification of persons
- A61B5/02—Detecting, measuring or recording for evaluating the cardiovascular system, e.g. pulse, heart rate, blood pressure or blood flow
- A61B5/024—Measuring pulse rate or heart rate
- A61B5/02416—Measuring pulse rate or heart rate using photoplethysmograph signals, e.g. generated by infrared radiation
-
- A—HUMAN NECESSITIES
- A61—MEDICAL OR VETERINARY SCIENCE; HYGIENE
- A61B—DIAGNOSIS; SURGERY; IDENTIFICATION
- A61B5/00—Measuring for diagnostic purposes; Identification of persons
- A61B5/24—Detecting, measuring or recording bioelectric or biomagnetic signals of the body or parts thereof
- A61B5/316—Modalities, i.e. specific diagnostic methods
- A61B5/318—Heart-related electrical modalities, e.g. electrocardiography [ECG]
- A61B5/346—Analysis of electrocardiograms
- A61B5/349—Detecting specific parameters of the electrocardiograph cycle
-
- A—HUMAN NECESSITIES
- A61—MEDICAL OR VETERINARY SCIENCE; HYGIENE
- A61B—DIAGNOSIS; SURGERY; IDENTIFICATION
- A61B5/00—Measuring for diagnostic purposes; Identification of persons
- A61B5/24—Detecting, measuring or recording bioelectric or biomagnetic signals of the body or parts thereof
- A61B5/316—Modalities, i.e. specific diagnostic methods
- A61B5/318—Heart-related electrical modalities, e.g. electrocardiography [ECG]
- A61B5/346—Analysis of electrocardiograms
- A61B5/349—Detecting specific parameters of the electrocardiograph cycle
- A61B5/358—Detecting ST segments
-
- A—HUMAN NECESSITIES
- A61—MEDICAL OR VETERINARY SCIENCE; HYGIENE
- A61B—DIAGNOSIS; SURGERY; IDENTIFICATION
- A61B5/00—Measuring for diagnostic purposes; Identification of persons
- A61B5/24—Detecting, measuring or recording bioelectric or biomagnetic signals of the body or parts thereof
- A61B5/316—Modalities, i.e. specific diagnostic methods
- A61B5/318—Heart-related electrical modalities, e.g. electrocardiography [ECG]
- A61B5/346—Analysis of electrocardiograms
- A61B5/349—Detecting specific parameters of the electrocardiograph cycle
- A61B5/36—Detecting PQ interval, PR interval or QT interval
-
- A—HUMAN NECESSITIES
- A61—MEDICAL OR VETERINARY SCIENCE; HYGIENE
- A61B—DIAGNOSIS; SURGERY; IDENTIFICATION
- A61B5/00—Measuring for diagnostic purposes; Identification of persons
- A61B5/72—Signal processing specially adapted for physiological signals or for diagnostic purposes
- A61B5/7235—Details of waveform analysis
- A61B5/7264—Classification of physiological signals or data, e.g. using neural networks, statistical classifiers, expert systems or fuzzy systems
-
- A—HUMAN NECESSITIES
- A61—MEDICAL OR VETERINARY SCIENCE; HYGIENE
- A61B—DIAGNOSIS; SURGERY; IDENTIFICATION
- A61B5/00—Measuring for diagnostic purposes; Identification of persons
- A61B5/72—Signal processing specially adapted for physiological signals or for diagnostic purposes
- A61B5/7235—Details of waveform analysis
- A61B5/7264—Classification of physiological signals or data, e.g. using neural networks, statistical classifiers, expert systems or fuzzy systems
- A61B5/7267—Classification of physiological signals or data, e.g. using neural networks, statistical classifiers, expert systems or fuzzy systems involving training the classification device
-
- G—PHYSICS
- G06—COMPUTING OR CALCULATING; COUNTING
- G06N—COMPUTING ARRANGEMENTS BASED ON SPECIFIC COMPUTATIONAL MODELS
- G06N3/00—Computing arrangements based on biological models
- G06N3/02—Neural networks
- G06N3/04—Architecture, e.g. interconnection topology
- G06N3/044—Recurrent networks, e.g. Hopfield networks
-
- G—PHYSICS
- G06—COMPUTING OR CALCULATING; COUNTING
- G06N—COMPUTING ARRANGEMENTS BASED ON SPECIFIC COMPUTATIONAL MODELS
- G06N3/00—Computing arrangements based on biological models
- G06N3/02—Neural networks
- G06N3/04—Architecture, e.g. interconnection topology
- G06N3/045—Combinations of networks
-
- G—PHYSICS
- G06—COMPUTING OR CALCULATING; COUNTING
- G06N—COMPUTING ARRANGEMENTS BASED ON SPECIFIC COMPUTATIONAL MODELS
- G06N3/00—Computing arrangements based on biological models
- G06N3/02—Neural networks
- G06N3/04—Architecture, e.g. interconnection topology
- G06N3/0464—Convolutional networks [CNN, ConvNet]
-
- G—PHYSICS
- G06—COMPUTING OR CALCULATING; COUNTING
- G06N—COMPUTING ARRANGEMENTS BASED ON SPECIFIC COMPUTATIONAL MODELS
- G06N3/00—Computing arrangements based on biological models
- G06N3/02—Neural networks
- G06N3/04—Architecture, e.g. interconnection topology
- G06N3/048—Activation functions
-
- G—PHYSICS
- G06—COMPUTING OR CALCULATING; COUNTING
- G06N—COMPUTING ARRANGEMENTS BASED ON SPECIFIC COMPUTATIONAL MODELS
- G06N3/00—Computing arrangements based on biological models
- G06N3/02—Neural networks
- G06N3/08—Learning methods
-
- G—PHYSICS
- G06—COMPUTING OR CALCULATING; COUNTING
- G06N—COMPUTING ARRANGEMENTS BASED ON SPECIFIC COMPUTATIONAL MODELS
- G06N3/00—Computing arrangements based on biological models
- G06N3/02—Neural networks
- G06N3/08—Learning methods
- G06N3/084—Backpropagation, e.g. using gradient descent
-
- G—PHYSICS
- G06—COMPUTING OR CALCULATING; COUNTING
- G06N—COMPUTING ARRANGEMENTS BASED ON SPECIFIC COMPUTATIONAL MODELS
- G06N3/00—Computing arrangements based on biological models
- G06N3/02—Neural networks
- G06N3/08—Learning methods
- G06N3/09—Supervised learning
-
- G—PHYSICS
- G16—INFORMATION AND COMMUNICATION TECHNOLOGY [ICT] SPECIALLY ADAPTED FOR SPECIFIC APPLICATION FIELDS
- G16H—HEALTHCARE INFORMATICS, i.e. INFORMATION AND COMMUNICATION TECHNOLOGY [ICT] SPECIALLY ADAPTED FOR THE HANDLING OR PROCESSING OF MEDICAL OR HEALTHCARE DATA
- G16H10/00—ICT specially adapted for the handling or processing of patient-related medical or healthcare data
- G16H10/60—ICT specially adapted for the handling or processing of patient-related medical or healthcare data for patient-specific data, e.g. for electronic patient records
-
- G—PHYSICS
- G16—INFORMATION AND COMMUNICATION TECHNOLOGY [ICT] SPECIALLY ADAPTED FOR SPECIFIC APPLICATION FIELDS
- G16H—HEALTHCARE INFORMATICS, i.e. INFORMATION AND COMMUNICATION TECHNOLOGY [ICT] SPECIALLY ADAPTED FOR THE HANDLING OR PROCESSING OF MEDICAL OR HEALTHCARE DATA
- G16H50/00—ICT specially adapted for medical diagnosis, medical simulation or medical data mining; ICT specially adapted for detecting, monitoring or modelling epidemics or pandemics
- G16H50/20—ICT specially adapted for medical diagnosis, medical simulation or medical data mining; ICT specially adapted for detecting, monitoring or modelling epidemics or pandemics for computer-aided diagnosis, e.g. based on medical expert systems
-
- G—PHYSICS
- G16—INFORMATION AND COMMUNICATION TECHNOLOGY [ICT] SPECIALLY ADAPTED FOR SPECIFIC APPLICATION FIELDS
- G16H—HEALTHCARE INFORMATICS, i.e. INFORMATION AND COMMUNICATION TECHNOLOGY [ICT] SPECIALLY ADAPTED FOR THE HANDLING OR PROCESSING OF MEDICAL OR HEALTHCARE DATA
- G16H50/00—ICT specially adapted for medical diagnosis, medical simulation or medical data mining; ICT specially adapted for detecting, monitoring or modelling epidemics or pandemics
- G16H50/30—ICT specially adapted for medical diagnosis, medical simulation or medical data mining; ICT specially adapted for detecting, monitoring or modelling epidemics or pandemics for calculating health indices; for individual health risk assessment
-
- G—PHYSICS
- G16—INFORMATION AND COMMUNICATION TECHNOLOGY [ICT] SPECIALLY ADAPTED FOR SPECIFIC APPLICATION FIELDS
- G16H—HEALTHCARE INFORMATICS, i.e. INFORMATION AND COMMUNICATION TECHNOLOGY [ICT] SPECIALLY ADAPTED FOR THE HANDLING OR PROCESSING OF MEDICAL OR HEALTHCARE DATA
- G16H50/00—ICT specially adapted for medical diagnosis, medical simulation or medical data mining; ICT specially adapted for detecting, monitoring or modelling epidemics or pandemics
- G16H50/70—ICT specially adapted for medical diagnosis, medical simulation or medical data mining; ICT specially adapted for detecting, monitoring or modelling epidemics or pandemics for mining of medical data, e.g. analysing previous cases of other patients
Definitions
- the present invention relates to a device for calculating cardiac output noninvasively and a method of operating the same.
- Cardiac output (CO) monitoring is used for hemodynamic diagnosis in high-risk patients.
- Cardiac output is the product of heart rate (HR) and stroke volume (SV), and is the amount of blood pumped by the two ventricles of the heart per unit of time (usually 'minutes'), and is an indicator that reflects not only the function of the heart but also the state of the entire circulatory system.
- Predicting cardiac output is important because it is used to monitor and optimize systemic oxygen and drug delivery in high-risk surgical patients.
- thermodilution-based method involves inserting a pulmonary artery catheter to calculate cardiac output, which is invasive and carries the risk of complications such as infection.
- the minimally invasive cardiac output calculation method (arterial pressure-based method) proposed after the thermodilution method is a method to calculate cardiac output using minimally invasive arterial blood pressure waveforms.
- this method has limitations in its usability because it is not a technology used for all patients in intensive care units and operating rooms in hospitals.
- the deep learning model is trained by training data for a plurality of patients
- the training data for the plurality of patients may include a VPG (first derivative PPG) waveform, which is a first differential waveform of the photoplethysmogram, and an APG (second derivative PPG) waveform, which is a second differential waveform of the photoplethysmogram.
- VPG first derivative PPG
- APG second derivative PPG
- the learning data for the plurality of patients may include a PR interval, QRS duration, QRS amplitude, and ST segment extracted from the electrocardiogram of each of the plurality of patients.
- the method may further include a step of receiving demographic information data of the user.
- the deep learning model is configured to determine stroke volume of the user by using the first bio-signal data, the second bio-signal data and the demographic information data of the user as inputs, and the demographic information data includes at least one of the age, gender, height, and weight of the user, and the second bio-signal data may further include the VPG waveform, the APG waveform, the PR interval, the QRS duration, the QRS amplitude, the ST segment, and the PTT.
- a device for noninvasively calculating cardiac output according to one embodiment of the present invention is provided.
- the device comprises a memory, a transceiver for receiving at least one of first bio-signal data including an electrocardiogram and a photoplethysmogram, and demographic information data, and a processor including a deep learning model, wherein the processor is configured to preprocess the first bio-signal data, extract second bio-signal data from the preprocessed bio-signal data, and infer stroke volume using a deep learning model configured to input the first bio-signal data and the second bio-signal data and output stroke volume.
- first bio-signal data including an electrocardiogram and a photoplethysmogram, and demographic information data
- a processor including a deep learning model, wherein the processor is configured to preprocess the first bio-signal data, extract second bio-signal data from the preprocessed bio-signal data, and infer stroke volume using a deep learning model configured to input the first bio-signal data and the second bio-signal data and output stroke volume.
- the second bio-signal data may include at least one of a VPG (first derivative PPG) waveform which is a first derivative waveform of the photoplethysmogram, an APG (second derivative PPG) waveform which is a second derivative waveform of the photoplethysmogram, a PR interval, a QRS duration, a QRS amplitude, and an ST segment extracted from the electrocardiogram, and a PTT (Pulse Transit Time) extracted from the electrocardiogram and the photoplethysmogram.
- VPG first derivative PPG
- APG second derivative PPG waveform which is a second derivative waveform of the photoplethysmogram
- PR interval a PR interval
- QRS duration a QRS amplitude
- ST segment extracted from the electrocardiogram
- PTT Pulse Transit Time
- the processor is further configured to perform min-max normalization of the photoplethysmogram and extract the VPG waveform and the APG waveform of the photoplethysmogram, wherein the VPG waveform and the APG waveform can be input to the deep learning model in the form of time series data having the predetermined length.
- the PR interval, the QRS duration, the QRS amplitude, the ST segment, and the PTT can be input to the deep learning model as an average of respective values measured multiple times during a time corresponding to the predetermined length.
- the memory may be configured to store a set of the learning data matched for each of the plurality of patients.
- the deep learning model may have a CNN (convolution Neural Network) structure including at least one SE (Squeeze and Excitation) block and at least one Residual block.
- CNN convolution Neural Network
- the transceiver may further be configured to receive the first bio-signal data and the second bio-signal data of the user corresponding to a period from t (where t is a positive integer) seconds to (t+n) seconds, and the processor may further be configured to calculate the stroke volume of the user in the (t+n) seconds using the deep learning model.
- the present invention can calculate a patient's cardiac output using biosignal data collected by a non-invasive method.
- the present invention can calculate a patient's cardiac output using only electrocardiogram and photoplethysmogram, which are completely non-invasive biosignals in which the limitations of invasive or minimally invasive measurement methods are eliminated.
- the present invention analyzes high-resolution input data and learns the same using deep learning technology of a deep neural network structure, thereby quickly predicting and outputting a result value for new input data, that is, cardiac output.
- FIG. 1 is a schematic diagram of a device for noninvasively calculating cardiac output according to an embodiment of the present invention.
- FIG. 2 is a block diagram showing the configuration of a cardiac output calculation device according to one embodiment of the present invention.
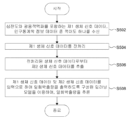
- Figure 3 is a flowchart schematically illustrating a method for calculating cardiac output according to one embodiment of the present invention.
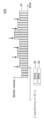
- FIG. 4 is a graph showing input data and output data of a cardiac output calculation device according to one embodiment of the present invention.
- Figure 5 is a flowchart illustrating a method for calculating cardiac output according to one embodiment of the present invention.
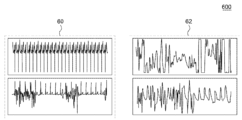
- Figure 6 is a graph showing an example of noise in an electrocardiogram waveform and a photoplethysmogram waveform.
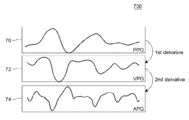
- Figure 7 is a graph showing photoplethysmographic waveforms, VPG waveforms, and PPG waveforms.
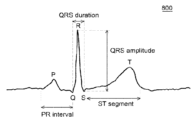
- Figure 8 is a graph showing an electrocardiogram waveform and secondary indices extracted from the electrocardiogram waveform.
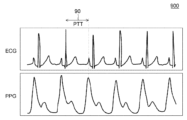
- Figure 9 is a graph showing secondary indices extracted from electrocardiogram waveforms and photoplethysmogram waveforms.
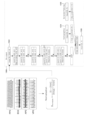
- FIG. 10 is a block diagram showing the architecture of a cardiac output calculation model according to one embodiment of the present invention.
- the expressions "have,” “can have,” “include,” or “may include” indicate the presence of a given feature (e.g., a numerical value, function, operation, or component such as a part), but do not exclude the presence of additional features.
- the expressions "A or B,” “at least one of A and/or B,” or “one or more of A or/and B” can include all possible combinations of the listed items.
- “A or B,” “at least one of A and B,” or “at least one of A or B” can all refer to (1) including at least one A, (2) including at least one B, or (3) including both at least one A and at least one B.
- first,” “second,” “first,” or “second,” etc. used in this document can describe various components, regardless of order and/or priority, and are only used to distinguish one component from another, but do not limit the components.
- a first user device and a second user device can represent different user devices, regardless of order or priority.
- a first component can be referred to as a second component, and similarly, a second component can also be referred to as a first component.
- a component e.g., a first component
- another component e.g., a second component
- the component can be directly coupled to the other component, or can be connected via another component (e.g., a third component).
- a component e.g., a first component
- another component e.g., a second component
- no other component e.g., a third component
- a processor configured (or set) to perform A, B, and C can mean a dedicated processor (e.g., an embedded processor) to perform those operations, or a generic-purpose processor (e.g., a CPU or an application processor) that can perform those operations by executing one or more software programs stored in a memory device.
- a dedicated processor e.g., an embedded processor
- a generic-purpose processor e.g., a CPU or an application processor
- Figure 1 is a schematic diagram of a cardiac output calculation device according to an embodiment of the present invention.
- a cardiac output calculation device (100) may include a transceiver (10), a memory (12), and a processor (14).
- a cardiac output calculation device (100) may calculate cardiac output using an electrocardiogram and/or a photoplethysmogram received through the transceiver (10).
- the memory (12) may store data on the received electrocardiogram and/or photoplethysmogram.
- the cardiac output calculation device (100) can receive an electrocardiogram (ECG) of a user (102) obtained through electrocardiogram (ECG) monitoring.
- ECG electrocardiogram
- An electrocardiogram is an analysis of electrical activity or electrical activity of the heart and recorded in the form of waves, and electrocardiogram monitoring can be performed by attaching electrodes to the skin of a user (102) and monitoring changes in an electrocardiogram displayed in time series through an electrocardiogram measuring device (104).
- the cardiac output calculation device (100) can receive the user's photoplethysmogram obtained through photoplethysmogram (PPG) monitoring.
- the measurement method using the photoplethysmogram is a method of measuring a pulse using light, and by detecting changes in optical characteristics such as reflection, absorption, and transmittance of biological tissue that appear when the volume of a blood vessel changes, an optical sensor can measure the speed of blood flow, oxygen saturation in the blood, etc.
- the photoplethysmogram monitoring can be performed by attaching a photoplethysmogram measuring device (106) to the user's finger and monitoring changes in the photoplethysmogram displayed in time series through the photoplethysmogram measuring device (106).
- a cardiac output calculation device (100) may be implemented in a personal computer (PC), a data server, or a portable device.
- the portable device may be implemented as a laptop computer, a mobile phone, a smart phone, a tablet PC, a mobile internet device (MID), a personal digital assistant (PDA), an enterprise digital assistant (EDA), a digital still camera, a digital video camera, a portable multimedia player (PMP), a personal navigation device (PND), a handheld game console, an e-book, or a smart device.
- the smart device may be implemented as a smart watch, a smart band, or a smart ring, which are merely examples and do not limit the implementation examples of the cardiac output calculation device (100).
- the electrocardiogram measuring device (104) and/or the photoplethysmography measuring device (106) are electronic devices capable of measuring and outputting biosignals, and like the cardiac output calculation device (100), can be implemented in a personal computer (PC), a data server, or a portable device.
- the processor (14) of the cardiac output calculation device (100) may include a deep learning model.
- the processor (14) of the cardiac output calculation device (100) may include a cardiac output calculation model (16).
- the cardiac output calculation model (16) may include a neural network (or artificial neural network).
- the neural network includes a statistical learning algorithm that imitates the nerves of biology in machine learning and cognitive science.
- the neural network may mean a model in general in which artificial neurons (nodes) that form a network by combining synapses change the binding strength of synapses through learning and have problem-solving capabilities.
- the cardiac output calculation model (16) may be expressed as a type of neural network and may include a cardiac output calculation algorithm.
- Neurons in a neural network can include a combination of weights or biases.
- a neural network can include one or more layers consisting of one or more neurons or nodes.
- a neural network can infer a desired outcome from an arbitrary input by changing the weights of neurons through learning.
- Neural networks may include Convolutional Neural Networks (CNNs).
- Neural networks include Deep Neural Network (DNN), Recurrent Neural Network (RNN), perceptron, multilayer perceptron, Feed Forward (FF), Radial Basis Network (RBF), Deep Feed Forward (DFF), Long Short Term Memory (LSTM), Gated Recurrent Unit (GRU), Auto Encoder (AE), and Variational Auto (VAE).
- DNN Deep Neural Network
- RNN Recurrent Neural Network
- RNN Recurrent Neural Network
- FF Feed Forward
- RBF Radial Basis Network
- DFF Deep Feed Forward
- LSTM Long Short Term Memory
- GRU Gated Recurrent Unit
- AE Auto Encoder
- VAE Variational Auto
- any neural network may be included, including but not limited to an ESN (Echo State Network), a DRN (Deep Residual Network), a DNC (Differentiable Neural Computer), an NTM (Neural Turning Machine), a CN (Capsule Network), a KN (Kohonen Network), and/or an AN (Attention Network).
- a cardiac output calculation model (16) according to an embodiment of the present invention may include a deep learning model including a cardiac output calculation algorithm, and details of the cardiac output calculation model (16) according to an embodiment of the present invention are described later in FIG. 10.
- FIG. 2 is a block diagram showing the configuration of a cardiac output calculation device according to one embodiment of the present invention.
- the cardiac output calculation device (200) may include a memory interface (210), one or more processors (220), and a peripheral interface (230).
- the cardiac output calculation device (200) of FIG. 2 may be applied to the cardiac output calculation device (100) of FIG. 1.
- Various components within the cardiac output calculation device (200) may be connected by one or more communication buses or signal lines.
- the memory interface (210) is connected to the memory (250) and can transmit various data to one or more processors (220).
- the memory (250) can include at least one type of storage medium among a flash memory type, a hard disk type, a multimedia card micro type, a card type memory (for example, an SD or XD memory, etc.), a RAM, an SRAM, a ROM, an EEPROM, a PROM, a network storage, a cloud, and a blockchain database.
- the memory (250) may store at least one of an operating system (251), a communication module (252), a graphical user interface module (GUI) (253), a sensor processing module (254), a telephone module (255), and an application module (256).
- the operating system (251) may include instructions for processing basic system services and instructions for performing hardware operations.
- the communication module (252) may communicate with at least one of other devices, computers, and servers.
- the graphical user interface module (GUI) (253) may process a graphical user interface.
- the sensor processing module (254) may process sensor-related functions (e.g., processing voice input received using one or more microphones (292).
- the telephone module (255) may process telephone-related functions.
- the application module (256) may perform various functions of a user application, such as electronic messaging, web browsing, media processing, navigation, imaging, and other processing functions. Additionally, the cardiac output calculation device (200) can store one or more software applications (256-1, 256-2) associated with one type of service in the memory (250).
- the memory (250) may store a digital assistant client module (257) (hereinafter, DA client module), and accordingly, may store commands for performing client-side functions of the digital assistant and various user data (258).
- DA client module digital assistant client module
- the DA client module (257) can obtain the user's voice input, text input, touch input, and/or gesture input through various user interfaces (e.g., I/O subsystem (240)) provided in the cardiac output calculation device (200).
- various user interfaces e.g., I/O subsystem (240)
- the DA client module (257) can output data in audiovisual and tactile forms.
- the DA client module (257) can output data consisting of a combination of at least two or more of voice, sound, notification, text message, menu, graphic, video, animation, and vibration.
- the DA client module (257) can communicate with a digital assistant server (not shown) using a communication subsystem (280).
- the DA client module (257) may collect additional information about the surroundings of the stroke output calculation device (200) from various sensors, subsystems, and peripheral devices to construct a context associated with the user input.
- the DA client module (257) may provide context information along with the user input to a digital assistant server to infer the user's intent.
- the context information that may accompany the user input may include sensor information, such as lighting, ambient noise, ambient temperature, images of the surrounding environment, video, etc.
- the context information may include the physical state of the stroke output calculation device (200) (e.g., device orientation, device position, device temperature, power level, speed, acceleration, motion pattern, cellular signal strength, etc.).
- context information may include information related to the software state of the stroke output calculation device (200) (e.g., processes running on the stroke output calculation device (200), installed programs, past and current network activity, background services, error logs, resource usage, etc.).
- the memory (250) may include additional or deleted instructions, and further, the cardiac output calculation device (200) may include additional configurations other than those illustrated in FIG. 2, or may exclude some configurations.
- the processor (220) can control the overall operation of the cardiac output calculation device (200) and can execute various commands to calculate and/or output the user's cardiac output by running an application or program stored in the memory (250).
- the processor (220) may correspond to a computational device such as a CPU (Central Processing Unit) or an AP (Application Processor).
- the processor (220) may be implemented in the form of an integrated chip (IC) such as a SoC (System on Chip) in which various computational devices such as an NPU (Neural Processing Unit) are integrated.
- IC integrated chip
- SoC System on Chip
- the processor (220) may receive at least one of first biosignal data including an electrocardiogram and a photoplethysmogram, and demographic information data.
- the first bio-signal data may include electrocardiogram waveform data, photoplethysmogram waveform data, and stroke volume data calculated based on arterial blood pressure calculated using APCO (Arterial Pressure Based Cardiac Output) equipment.
- the demographic information data may include at least one of the user's age, gender, height, and weight.
- the processor (220) may preprocess the first bio-signal data.
- the processor (220) may extract second bio-signal data from the preprocessed bio-signal data.
- the processor (220) may infer stroke volume using a deep learning model configured to input the first bio-signal data and the second bio-signal data and output stroke volume. The detailed description of the operation of the processor (220) is described below with reference to FIG. 3.
- the peripheral interface (230) can be connected to various sensors, subsystems, and peripheral devices to provide data so that the cardiac output calculation device (200) can perform various functions.
- the function performed by the cardiac output calculation device (200) is performed by the processor (220).
- the peripheral interface (230) can receive data from a motion sensor (260), a light sensor (light sensor) (261), and a proximity sensor (262), through which the cardiac output calculation device (200) can perform orientation, light, and proximity detection functions, etc.
- the peripheral interface (230) can receive data from other sensors (263) (positioning system-GPS receiver, temperature sensor, biometric sensor), through which the cardiac output calculation device (200) can perform functions related to the other sensors (263).
- the cardiac output calculation device (200) may include a camera subsystem (270) connected to a peripheral interface (230) and an optical sensor (271) connected thereto, which enables the cardiac output calculation device (200) to perform various photographing functions, such as taking pictures and recording video clips.
- the cardiac output calculation device (200) may include a communication subsystem (280) connected to a peripheral interface (230).
- the communication subsystem (280) may be comprised of one or more wired/wireless networks and may include various communication ports, radio frequency transceivers, and optical transceivers.
- the stroke output calculation device (200) includes an audio subsystem (290) coupled to the peripheral interface (230), the audio subsystem (290) including one or more speakers (291) and one or more microphones (292), such that the stroke output calculation device (200) can perform voice-activated functions, such as voice recognition, voice duplication, digital recording, and telephony functions.
- voice-activated functions such as voice recognition, voice duplication, digital recording, and telephony functions.
- the stroke output calculation device (200) may include an I/O subsystem (240) coupled to the peripheral interface (230).
- the I/O subsystem (240) may control a touch screen (243) included in the stroke output calculation device (200) via a touch screen controller (241).
- the touch screen controller (241) may detect a user's contact and movement or cessation of contact and movement using any one of a plurality of touch sensing technologies, such as capacitive, resistive, infrared, surface acoustic wave technology, proximity sensor array, etc.
- the I/O subsystem (240) may control other input/control devices (244) included in the stroke output calculation device (200) via other input controller(s) (242).
- the other input controller(s) (242) may control one or more buttons, rocker switches, thumb-wheels, infrared ports, USB ports, and pointer devices such as a stylus.
- Figure 3 is a flowchart schematically illustrating a method for calculating cardiac output according to one embodiment of the present invention.
- a cardiac output calculation device (100, FIG. 1) (or, a transceiver (10, FIG. 1)) according to one embodiment of the present invention can receive first bio-signal data including an electrocardiogram and photoplethysmogram of a user (S302).
- the first bio-signal data may include electrocardiogram waveforms, photoplethysmogram waveforms, and stroke volume calculated based on arterial blood pressure calculated using APCO (Arterial Pressure Based Cardiac Output) equipment.
- APCO Arterial Pressure Based Cardiac Output
- electrocardiogram waveforms and photoplethysmogram waveforms measured at a sample rate of 100 Hz, and stroke volume measured at 2-second intervals may be collected from VitalDB, a public dataset.
- a cardiac output calculation device (100, FIG. 1) (or processor (14, FIG. 1)) according to one embodiment of the present invention can determine a stroke volume of a user based on the user's first bio-signal data by using a deep learning model configured to output stroke volume by taking electrocardiogram and photoplethysmogram as inputs (S304).
- the deep learning model may be a deep learning model trained by training data for multiple patients.
- the learning data for the plurality of patients may include a VPG (first derivative PPG) waveform, which is a first derivative waveform of the photoplethysmogram, and an APG (second derivative PPG) waveform, which is a second derivative waveform of the photoplethysmogram.
- the learning data for the plurality of patients may include a PR interval, a QRS duration, a QRS amplitude, and a ST segment extracted from the electrocardiogram of each of the plurality of patients.
- the learning data for the plurality of patients may include a PTT (Pulse Transit Time) extracted from the electrocardiogram and the photoplethysmogram of each of the plurality of patients.
- the learning data for the plurality of patients may be referred to as second biosignal data.
- the deep learning model can determine the stroke volume of the user by using the first bio-signal data, the second bio-signal data, and the demographic information data as inputs.
- the second bio-signal data can include the VPG waveform, the APG waveform, the PR interval, the QRS duration, the QRS amplitude, the ST segment, and the PTT.
- FIG. 4 is a graph showing input data and output data of a cardiac output calculation device according to one embodiment of the present invention.
- a graph (400) showing input data and output data of a cardiac output calculation device is illustrated.
- the horizontal axis of the graph (400) is time (t), and the vertical axis of the graph (400) is stroke volume.
- the input data may be electrocardiogram (ECG) data (30) and/or photoplethysmogram (PPG) data (32) of the patient.
- ECG data (30) and/or PPG data (32) of the patient may be part of the patient's biosignals collected during surgery.
- the ECG data (30) and/or PPG data (32) of the patient may be waveform data for a predetermined period of time.
- the patient's electrocardiogram (ECG) data (30) and/or photoplethysmogram (PPG) data (32) may be waveform data for 20 seconds.
- the patient's electrocardiogram (ECG) data (30) and/or photoplethysmogram (PPG) data (32) for a predetermined period immediately prior to an arbitrary time t may be used to calculate and output cardiac output at an arbitrary time t.
- the predetermined period may be 20 seconds.
- the patient's electrocardiogram (ECG) data (30) and/or photoplethysmogram (PPG) data (32) may be waveform data for 60 seconds.
- the patient's electrocardiogram (ECG) data (30) and/or photoplethysmogram (PPG) data (32) for a predetermined period immediately prior to an arbitrary time t may be used to calculate and output cardiac output at an arbitrary time t.
- the predetermined period may be 60 seconds.
- the output data may be stroke volume data (34).
- the output data may be a value at a time point when the stroke volume changes, such as the timing indicated by the arrow in Fig. 4.
- Cardiac output can be calculated as the product of stroke volume and heart rate.
- the output data of the cardiac output calculation device according to one embodiment of the present invention can be cardiac output.
- the output data of the cardiac output calculation device according to another embodiment of the present invention can be stroke volume.
- Figure 5 is a flowchart illustrating a method for calculating cardiac output according to one embodiment of the present invention.
- a cardiac output calculation device (100, FIG. 1) (or, a transceiver (10, FIG. 1)) according to an embodiment of the present invention may receive at least one of first bio-signal data including an electrocardiogram and a photoplethysmogram, and demographic information data (S502).
- the first bio-signal data may include electrocardiogram waveform data, photoplethysmogram waveform data, and stroke volume data calculated based on arterial blood pressure calculated using APCO (Arterial Pressure Based Cardiac Output) equipment.
- the demographic information data may include at least one of the user's age, gender, height, and weight.
- a cardiac output calculation device (100, FIG. 1) (or a processor (14, FIG. 1)) can slice first bio-signal data into a predetermined length, extract sampling data from the sliced first bio-signal data, and remove noise data from the first bio-signal data.
- the cardiac output calculation device (100, FIG. 1) (or processor (14, FIG. 1)) can select a sample data set to be used for the collected electrocardiogram waveform data within predetermined criteria.
- the cardiac output calculation device (100, FIG. 1) (or the processor (14, FIG. 1)) can extract a candidate data set of a first reference sample from the collected electrocardiogram waveform data, and the candidate data set of the first reference sample can be used as learning data.
- the first criterion can be 2 or more and 4.5 or less.
- abnormal ECG waveforms can be selected only if the standard deviation of the RR interval is less than 30, so as not to be selected as a data set to be used.
- the RR interval refers to the interval between R-peaks of a heartbeat.
- the cardiac output calculation device (100, FIG. 1) (or processor (14, FIG. 1)) can select a sample data set to be used for the collected photoplethysmography data within predetermined criteria.
- the cardiac output calculation device (100, FIG. 1) (or the processor (14, FIG. 1)) can extract a candidate data set of the second reference sample from the collected photoplethysmography waveform data, and the candidate data set of the second reference sample can be used as learning data.
- the second criterion can be 0 or more and 100 or less.
- the frequency of the photoplethysmogram waveform is below a predetermined standard or if the photoplethysmogram waveform is judged to be irregular, it may be excluded from the sample data set.
- samples with intra-beat correlation of plethysmography greater than 0.9 can be selected as candidate data sets, and samples with standard deviation of 0 can be excluded.
- the cardiac output calculation device (100, FIG. 1) (or processor (14, FIG. 1)) can perform min-max normalization of the photoplethysmogram.
- the cardiac output calculation device (100, FIG. 1) (or processor (14, FIG. 1)) can remove noise from signals appearing in electrocardiogram waveforms and/or photoplethysmogram waveforms.
- the cardiac output calculation device (100, FIG. 1) (or the processor (14, FIG. 1)) can remove frequency components below 0.5 Hz from the electrocardiogram waveform and/or the photoplethysmogram waveform.
- frequency components below 0.5 Hz and above 8 Hz with a cutoff frequency can be blocked from the photoplethysmogram waveform.
- Fig. 6 is a graph showing an example of noise in an electrocardiogram waveform and a photoplethysmogram waveform.
- FIG. 6 a graph (600) showing an electrocardiogram waveform and a photoplethysmogram waveform received by a cardiac output calculation device (100, FIG. 1) is illustrated.
- the cardiac output calculation device (100, FIG. 1) can receive first bio-signal data including electrocardiograms and photoplethysmograms of multiple patients measured during surgery in an operating room. Due to motion artifact, electrocautery, wall power, etc., the waveform (60) of the electrocardiogram collected in the operating room may include noise data. Due to motion artifact, nerve stimulation, respiration, etc., the waveform (62) of the photoplethysmogram collected in the operating room may include noise data such as baseline drift.
- the step of preprocessing the first biosignal data may include a step of removing noise in a signal appearing in an electrocardiogram waveform and/or a photoplethysmogram waveform that interferes with learning of a cardiac output calculation model (16, FIG. 1).
- the stroke volume calculation device (100, FIG. 1) (or processor (14, FIG. 1)) can select a sample data set to be used for the collected stroke volume data within predetermined criteria.
- the stroke volume calculation device (100, FIG. 1) (or the processor (14, FIG. 1)) can extract a candidate data set of a third reference sample from the collected stroke volume data, and the candidate data set of the third reference sample can be used as training data.
- the third reference can be 20 mmHg or more and 200 mmHg or less.
- stroke volume calculated using APCO equipment is information calculated based on arterial blood pressure
- the recorded arterial blood pressure value may have been recorded without being deposited in the artery or may have been a value due to artifact caused by flushing of the arterial lumen. Therefore, selection according to the third criterion is intended to prevent this.
- a cardiac output calculation device (100, FIG. 1) (or processor (14, FIG. 1)) according to one embodiment of the present invention can extract second biosignal data from preprocessed biosignal data (S506).
- a cardiac output calculation device (100, FIG. 1) (or processor (14, FIG. 1)) according to one embodiment of the present invention extracts a VPG (first derivative PPG) waveform, which is a first-differentiated waveform of a photovolume pulse wave, and an APG (second derivative PPG) waveform, which is a second-differentiated waveform of a photovolume pulse wave, from a waveform of a preprocessed photovolume pulse wave, and can utilize them as secondary indices when calculating cardiac output.
- the VPG waveform and/or the APG waveform may be referred to as 'second biosignal data'.
- Fig. 7 is a graph showing a photoplethysmogram waveform and a secondary index extracted from the photoplethysmogram waveform.
- FIG. 7 a graph showing a photoplethysmographic (PPG) waveform (70), a VPG waveform (72), and an APG waveform (74) is illustrated.
- PPG photoplethysmographic
- the cardiac output calculation device (100, FIG. 1) (or, processor (14, FIG. 1)) according to one embodiment of the present invention may additionally utilize the VPG waveform (72) and/or the APG waveform (74) in addition to the photoplethysmogram (PPG) waveform (70) when calculating cardiac output.
- the cardiac output calculation device (100, FIG. 1) (or processor (14, FIG. 1)) according to one embodiment of the present invention can extract PR interval, QRS duration, QRS amplitude, and ST segment from a preprocessed electrocardiogram waveform and use them as secondary indices when calculating cardiac output.
- Fig. 7 is a graph showing an electrocardiogram waveform and a secondary index extracted from the electrocardiogram waveform.
- FIG. 7 a graph showing an electrocardiogram waveform (800), PR interval, QRS duration, QRS amplitude, and ST segment is illustrated.
- the PR interval can be defined as the time interval from the beginning of the P wave to the beginning of the QRS complex on the electrocardiogram, and it means the time for nerve transmission in the heart.
- the QRS duration can be defined as the time it takes for the QRS complex to appear on the electrocardiogram, and it means the time for the heart to contract.
- the QRS amplitude represents the maximum polarity difference of the QRS complex, and it can be used to diagnose the condition of the heart by the intensity of electrical activity occurring in the heart.
- the ST segment can be defined as the time interval from the end of the QRS complex to the start of the T wave, and it can be used to diagnose the condition of the heart by the polarity changes that occur between contraction and relaxation of the heart.
- a cardiac output calculation device (100, FIG. 1) (or a processor (14, FIG. 1)) may additionally utilize not only an electrocardiogram waveform (800) but also a PR interval, QRS duration, QRS amplitude, and ST segment when calculating cardiac output.
- a cardiac output calculation model (16, FIG. 1) may learn the characteristics of cardiac contraction using a secondary index extracted from an ECG.
- the cardiac output calculation device (100, FIG. 1) (or processor (14, FIG. 1)) according to one embodiment of the present invention can extract PTT (Pulse Transit Time) from the preprocessed electrocardiogram waveform and photoplethysmogram and utilize it as a secondary index when calculating cardiac output.
- PTT Pulse Transit Time
- Fig. 9 is a graph showing secondary indices extracted from electrocardiogram waveforms and photoplethysmogram waveforms.
- ECG electrocardiogram
- PPG photoplethysmogram
- PTT 90
- PTT Pulse Transit Time
- PTT can be defined as the time between the peak of the QRS complex and a certain reference point of the PPG waveform measured at the fingertip.
- PTT can be interpreted as the time from the occurrence of the pulse, that is, the time from the heart to the blood contraction from the heart and to the peripheral blood vessel measurement part.
- PTT is an index used to analyze and evaluate blood pressure more efficiently, and can be used as an index representing the elasticity of blood vessels.
- a cardiac output calculation device (100, FIG. 1) (or processor (14, FIG. 1)) according to one embodiment of the present invention can additionally utilize PTT (90) as well as an electrocardiogram (ECG) and a photoplethysmogram (PPG) waveform when calculating cardiac output.
- PTT 90
- ECG electrocardiogram
- PPG photoplethysmogram
- the cardiac output calculation device (100, FIG. 1) (or processor (14, FIG. 1)) according to one embodiment of the present invention can infer stroke volume using a deep learning model configured to input first bio-signal data and second bio-signal data and output stroke volume (S508).
- the processor (14, FIG. 1) of the cardiac output calculation device (100, FIG. 1) can match and store electrocardiogram waveforms, photoplethysmogram waveforms, secondary indices extracted from electrocardiogram waveforms and/or photoplethysmogram waveforms, stroke volume information, and demographic information including age, gender, height, and weight for a specific patient.
- the stored data described above can be used as learning data.
- the processor (14, FIG. 1) of the cardiac output calculation device (100, FIG. 1) can learn a cardiac output calculation model (16, FIG. 1).
- the cardiac output calculation model (16, FIG. 1) can be a deep learning model having weight values obtained by extracting and combining various features.
- the processor (14, FIG. 1) of the cardiac output calculation device (100, FIG. 1) can smooth the learning data.
- the smoothed learning data can be input into the cardiac output calculation model (16, FIG. 1), and the cardiac output calculation model (16, FIG. 1) can be learned by extracting and combining various features and updating the weights.
- a cardiac output calculation device (100, FIG. 1) (or processor (14, FIG. 1)) can infer stroke volume of a specific patient by using biometric data including electrocardiogram and photoplethysmogram, stroke volume information, demographic information including age, gender, height and weight, and a cardiac output calculation model (16, FIG. 1).
- FIG. 10 is a block diagram showing the architecture of a cardiac output calculation model according to one embodiment of the present invention.
- the cardiac output calculation model (1000) can be applied to the cardiac output calculation model (16) of FIG. 1.
- input data of the cardiac output calculation model (1000) may include bio signal data (1002) including an electrocardiogram waveform, a photoplethysmogram waveform, a VPG waveform, and an APG waveform, and demographic data (Demographics) (1004) including age, gender, height, and weight.
- bio signal data 1002 including an electrocardiogram waveform, a photoplethysmogram waveform, a VPG waveform, and an APG waveform
- Demographics (Demographics) including age, gender, height, and weight.
- the bio signal data (1002) input to the cardiac output calculation model (1000) may be continuous data sliced by a predetermined period.
- the predetermined period may be referred to as a 'sliding window'.
- the patient's electrocardiogram waveform and/or photoplethysmogram waveform may be input to the cardiac output calculation model (1000) while sliding by a predetermined sliding window (e.g., 20 seconds).
- the input data of the cardiac output calculation model (1000) may include data (Extracted Features) (1006) extracted from the waveform of an electrocardiogram and/or the waveform of a photoplethysmogram.
- Data (1006) extracted from the waveform of the electrocardiogram and/or the waveform of the photoplethysmogram may include a PR interval, a QRS duration, a QRS amplitude, a ST segment extracted from the electrocardiogram waveform, and a PTT extracted from the electrocardiogram waveform and the photoplethysmogram waveform.
- Data (1006) extracted from the waveform of the electrocardiogram and/or the waveform of the photoplethysmogram input to the cardiac output calculation model (1000) may be an average of values calculated for a predetermined period. For example, an average value of each of the PR interval, QRS duration, QRS amplitude, ST segment, and PTT values calculated for 20 seconds or 60 seconds may be input to the cardiac output calculation model (1000).
- Bio signal data (1002) including an electrocardiogram waveform, a photoplethysmogram waveform, a VPG waveform, and an APG waveform can be normalized for learning a cardiac output calculation model (1000).
- demographic data (Demographics) (1004), data (1006) extracted from an electrocardiogram waveform and/or a photoplethysmogram waveform can be normalized for learning a cardiac output calculation model (1000).
- bio signal data (1002), demographic data (Demographics) (1004), data (1006) extracted from an electrocardiogram waveform and/or a photoplethysmogram waveform can be normalized and input to the cardiac output calculation model (1000).
- the cardiac output calculation model (1000) can be trained to enable more accurate prediction of cardiac output using high-resolution bio-signal data (1002).
- high-resolution bio-signal data 1002
- secondary indices related to cardiac output from high-resolution electrocardiogram waveforms and photoplethysmogram waveforms (e.g., APG waveform, VPG waveform, PR interval, QRS duration, QRS amplitude, ST segment, PTT)
- secondary indices related to cardiac output from high-resolution electrocardiogram waveforms and photoplethysmogram waveforms (e.g., APG waveform, VPG waveform, PR interval, QRS duration, QRS amplitude, ST segment, PTT)
- the performance of the cardiac output calculation model (1000) can be improved.
- a cardiac output calculation model (1000) may have a CNN (Convolution Neural Network) structure including at least one SE (Squeeze and Excitation) block and at least one Residual block.
- CNN Convolution Neural Network
- the cardiac output calculation model (1000) may include a convolutional neural network of the SE-ResNet structure.
- ResNet can be defined as an algorithm that solves the vanishing gradient problem that can occur as layers become deeper by learning the residual, which is the difference between the input and output of each layer.
- SE can be defined as a module that performs operations that squeeze and excite information. SE calculates the importance of each channel by considering the interdependence between the channels of the feature map that results from passing through each layer, and recalibrates by assigning weights to important channels.
- the cardiac output calculation model (1000) can perform convolution using convolution filters of various sizes while passing through multiple layers, and can perform residual learning at the same time.
- the cardiac output calculation model (1000) can use Max pooling and/or GAP (Global Average Pooling) as a squeeze operation.
- the cardiac output calculation model (1000) can infer stroke volume of a specific patient by using the input data (1002, 1004, 1006) described above and the learned CNN structure including the SE block and the Residual block.
- the output data (1008) of the cardiac output calculation model (1000) can be stroke volume.
- the cardiac output calculation model (1000) can output stroke volume once every 8 seconds.
- the cardiac output calculation model (1000) may correspond to any algorithm having a structure including a convolutional neural network, and the technical scope of the present invention is not limited or restricted by the embodiment of the cardiac output calculation model (1000) described above.
- a data set used for development and training of a cardiac output calculation model includes biometric data including electrocardiograms and photoplethysmograms collected during 3,970 surgeries in a specific hospital, stroke volume information, and demographic information including age, gender, height, and weight.
- the data set collected by the Time series hold out method during 3,970 surgeries in a specific hospital was divided into a training data set, a validation data set, and a test data set.
- the training data set, validation data set, and test data set were composed in a ratio of 6:2:2.
- the training data set includes 741,150 samples collected during 2,777 surgeries, and the test data set includes 196,686 samples collected during 694 surgeries.
- the cardiac output calculation model In order to evaluate the validity of the stroke volume (i.e., predicted value) output from the cardiac output calculation model and the stroke volume (i.e., actual value) calculated based on arterial blood pressure, the cardiac output calculation model according to one embodiment of the present invention used Percentage Error, MAPE (mean absolute percentage error), and MAE (mean absolute error).
- Percentage error can be interpreted as an indicator to evaluate whether the variation in the difference between the actual value and the predicted value is at an acceptable level.
- MAPE mean absolute percentage error
- MAPE is the average of the errors between the actual and predicted values, calculated as a percentage, and is a value that expresses MAE as a ratio. For example, if the MAE value of a cardiac output calculation model is 12 ml/beat, it means that the model incorrectly predicted 12 ml/beat on average.
- MAE mean absolute error
- FIG. 11 shows graphs comparing the predicted values and actual values of the cardiac output calculation model according to an embodiment of the present invention.
- graphs for continuous cardiac output (1101, 1102, 1103) and graphs for cardiac output measured at 10-minute intervals (1104, 1105, 1106) are shown.
- a Bland-Altman plot is a scatter plot that calculates the mean of and difference between each pair of measurements from two sets of measurements (stroke volume derived from arterial blood pressure and stroke volume output from a cardiac output calculation model) of the same subject.
- the x-axis of the Bland-Altman plot represents the mean (Average of Differences(mL)) and the y-axis represents the difference (Diff.of Differences(mL)).
- a Bland-Altman plot can display three horizontal dashed lines parallel to the x-axis, which can be interpreted as values summarizing the degree of discrepancy.
- the upper line of the three horizontal dashed lines represents the upper limit of 95% agreement
- the center line represents the difference from the mean
- the lower line represents the lower limit of 95% agreement.
- the Percentage Error can be calculated as shown in the following mathematical expression 1.
Landscapes
- Health & Medical Sciences (AREA)
- Engineering & Computer Science (AREA)
- Life Sciences & Earth Sciences (AREA)
- Physics & Mathematics (AREA)
- Cardiology (AREA)
- Biomedical Technology (AREA)
- General Health & Medical Sciences (AREA)
- Public Health (AREA)
- Medical Informatics (AREA)
- Biophysics (AREA)
- Molecular Biology (AREA)
- Pathology (AREA)
- Veterinary Medicine (AREA)
- Animal Behavior & Ethology (AREA)
- Heart & Thoracic Surgery (AREA)
- Surgery (AREA)
- Data Mining & Analysis (AREA)
- Theoretical Computer Science (AREA)
- Artificial Intelligence (AREA)
- Mathematical Physics (AREA)
- Evolutionary Computation (AREA)
- Physiology (AREA)
- General Physics & Mathematics (AREA)
- General Engineering & Computer Science (AREA)
- Computing Systems (AREA)
- Software Systems (AREA)
- Computational Linguistics (AREA)
- Epidemiology (AREA)
- Primary Health Care (AREA)
- Databases & Information Systems (AREA)
- Hematology (AREA)
- Vascular Medicine (AREA)
- Signal Processing (AREA)
- Psychiatry (AREA)
- Computer Vision & Pattern Recognition (AREA)
- Fuzzy Systems (AREA)
- Measurement And Recording Of Electrical Phenomena And Electrical Characteristics Of The Living Body (AREA)
- Measuring Pulse, Heart Rate, Blood Pressure Or Blood Flow (AREA)
Abstract
Description
| Percentage error of 10min median (%) (10min interval) |
Percentage Error (%) | MAPE (%) | MAE (ml/beat) | |
| Result | 37.6 | 41.5 | 16.1 | 12.2 |
Claims (14)
- 비침습적으로 심박출량을 계산하는 장치의 동작 방법으로서,사용자의 심전도 및 광용적맥파를 포함하는 제1 생체 신호 데이터를 수신하는 단계;심전도 및 광용적맥파를 입력으로 하여 일회박출량을 출력하도록 구성된 딥러닝 모델을 이용하여, 상기 사용자의 상기 제1 생체 신호 데이터를 기초로 상기 사용자의 일회박출량을 결정하는 단계;를 포함하는,비침습적으로 심박출량을 계산하는 장치의 동작 방법.
- 제1항에 있어서,상기 딥러닝 모델은 복수의 환자들에 대한 학습 데이터에 의해 학습되고,상기 복수의 환자들에 대한 상기 학습 데이터는,상기 광용적맥파의 1차 미분 파형인 VPG(first derivative PPG) 파형, 상기 광용적맥파의 2차 미분 파형인 APG(second derivative PPG) 파형을 포함하는,비침습적으로 심박출량을 계산하는 장치의 동작 방법.
- 제2항에 있어서,상기 복수의 환자들에 대한 상기 학습 데이터는,상기 복수의 환자들 각각의 상기 심전도로부터 추출된 PR interval, QRS duration, QRS amplitude, ST segment를 포함하는,비침습적으로 심박출량을 계산하는 장치의 동작 방법.
- 제3항에 있어서,상기 복수의 환자들에 대한 상기 학습 데이터는,상기 복수의 환자들 각각의 상기 심전도 및 상기 광용적맥파로부터 추출된 PTT(Pulse Transit Time)를 포함하는,비침습적으로 심박출량을 계산하는 장치의 동작 방법.
- 제4항에 있어서,상기 사용자의 인구통계학 정보 데이터를 수신하는 단계를 더 포함하고,상기 딥러닝 모델은, 상기 사용자의 상기 제1 생체 신호 데이터, 제2 생체 신호 데이터 및 상기 인구통계학 정보 데이터를 입력으로 하여 상기 사용자의 일회박출량을 결정하도록 구성되고,상기 인구통계학 정보 데이터는 상기 사용자의 나이, 성별, 키, 몸무게 중 적어도 하나를 포함하고,상기 제2 생체 신호 데이터는 상기 VPG 파형, 상기 APG 파형, 상기 PR interval, 상기 QRS duration, 상기 QRS amplitude, 상기 ST segment, 상기 PTT를 포함하는,비침습적으로 심박출량을 계산하는 장치의 동작 방법.
- 비침습적으로 심박출량을 계산하는 장치로서,메모리;심전도와 광용적맥파를 포함하는 제1 생체 신호 데이터, 인구통계학 정보 데이터 중 적어도 하나를 수신하는 트랜시버; 및딥러닝 모델을 포함하는 프로세서;를 포함하고,상기 프로세서는,상기 제1 생체 신호 데이터를 전처리하고, 전처리된 상기 생체 신호 데이터로부터 제2 생체 신호 데이터를 추출하고, 상기 제1 생체 신호 데이터 및 상기 제2 생체 신호 데이터를 입력으로 하여 일회박출량을 출력하도록 구성된 딥러닝 모델을 이용하여 일회박출량을 추론하도록 구성되는,비침습적으로 심박출량을 계산하는 장치.
- 제6항에 있어서,상기 프로세서는,상기 제1 생체 신호 데이터를 소정의 길이로 슬라이싱하고, 슬라이싱된 상기 제1 생체 신호 데이터로부터 샘플링 데이터를 추출하고, 상기 제1 생체 신호 데이터의 노이즈 데이터를 제거하도록 추가로 구성되는,비침습적으로 심박출량을 계산하는 장치.
- 제7항에 있어서,상기 제2 생체 신호 데이터는,상기 광용적맥파의 1차 미분 파형인 VPG(first derivative PPG) 파형, 상기 광용적맥파의 2차 미분 파형인 APG(second derivative PPG) 파형과,상기 심전도로부터 추출된 PR interval, QRS duration, QRS amplitude, ST segment와,상기 심전도 및 상기 광용적맥파로부터 추출된 PTT(Pulse Transit Time) 중 적어도 하나를 포함하는,비침습적으로 심박출량을 계산하는 장치.
- 제8항에 있어서,상기 프로세서는,상기 광용적맥파의 최소-최대 정규화를 수행하고,상기 광용적맥파의 상기 VPG 파형 및 상기 APG 파형을 추출하도록 추가로 구성되며,상기 VPG 파형 및 상기 APG 파형은 상기 소정의 길이를 갖는 시계열 데이터의 형태로 상기 딥러닝 모델에 입력되는,비침습적으로 심박출량을 계산하는 장치.
- 제8항에 있어서,상기 PR interval, 상기 QRS duration, 상기 QRS amplitude, 상기 ST segment 및 상기 PTT는,상기 소정의 길이에 대응하는 시간 동안, 복수 회 측정된 각각의 값의 평균으로 상기 딥러닝 모델에 입력되는,비침습적으로 심박출량을 계산하는 장치.
- 제6항에 있어서,상기 학습 데이터는,복수의 환자들의 상기 제1 생체 신호 데이터, 상기 제2 생체 신호 데이터, 일회박출량 데이터, 상기 인구통계학 정보 데이터를 포함하고,상기 인구통계학 정보 데이터는 나이, 성별, 키, 몸무게 중 적어도 하나를 포함하는,비침습적으로 심박출량을 계산하는 장치.
- 제11항에 있어서,상기 메모리는,상기 복수의 환자들 각각에 대해 매칭된 상기 학습 데이터의 세트를 저장하도록 구성되는,비침습적으로 심박출량을 계산하는 장치.
- 제6항에 있어서,상기 딥러닝 모델은,적어도 하나의 SE(Squeeze and Excitation) block 및 적어도 하나의 Residual block이 포함된 CNN(convolution Neural Network) 구조를 갖는,비침습적으로 심박출량을 계산하는 장치.
- 제6항에 있어서,t초 (t는 양의 정수)에서부터 (t+n)초 (n은 양의 정수)까지의 기간에 대응되는 사용자의 상기 제1 생체 신호 데이터 및 상기 제2 생체 신호 데이터를 수신하도록 추가로 구성되는 상기 트랜시버; 및상기 딥러닝 모델을 이용하여 상기 (t+n)초에서의 상기 사용자의 상기 일회박출량을 계산하도록 추가로 구성되는 상기 프로세서;를 포함하는,비침습적으로 심박출량을 계산하는 장치.
Priority Applications (1)
| Application Number | Priority Date | Filing Date | Title |
|---|---|---|---|
| EP23941751.2A EP4728980A1 (en) | 2023-06-14 | 2023-12-04 | Device for non-invasively calculating cardiac output and operating method therefor |
Applications Claiming Priority (2)
| Application Number | Priority Date | Filing Date | Title |
|---|---|---|---|
| KR1020230076053A KR102893266B1 (ko) | 2023-06-14 | 2023-06-14 | 비침습적으로 심박출량을 계산하는 장치 및 이의 동작 방법 |
| KR10-2023-0076053 | 2023-06-14 |
Publications (1)
| Publication Number | Publication Date |
|---|---|
| WO2024257970A1 true WO2024257970A1 (ko) | 2024-12-19 |
Family
ID=93852053
Family Applications (1)
| Application Number | Title | Priority Date | Filing Date |
|---|---|---|---|
| PCT/KR2023/019829 Ceased WO2024257970A1 (ko) | 2023-06-14 | 2023-12-04 | 비침습적으로 심박출량을 계산하는 장치 및 이의 동작 방법 |
Country Status (3)
| Country | Link |
|---|---|
| EP (1) | EP4728980A1 (ko) |
| KR (1) | KR102893266B1 (ko) |
| WO (1) | WO2024257970A1 (ko) |
Cited By (1)
| Publication number | Priority date | Publication date | Assignee | Title |
|---|---|---|---|---|
| CN119700065A (zh) * | 2025-02-25 | 2025-03-28 | 北京航空航天大学 | 一种动态无创心输出量监测系统和方法 |
Citations (5)
| Publication number | Priority date | Publication date | Assignee | Title |
|---|---|---|---|---|
| KR20130107066A (ko) * | 2012-03-21 | 2013-10-01 | 주식회사 누가의료기 | 양손을 이용한 혈관 및 심폐기능 평가를 위한 생체 계측 시스템 |
| US20170049391A1 (en) * | 2005-04-25 | 2017-02-23 | University Of Florida Research Foundation, Inc. | Monitoring Asthma And Other Respiratory Disorders With Calibrated Photoplethysmography Devices And Methods Of Using The Same |
| WO2017032873A2 (en) * | 2015-08-26 | 2017-03-02 | Resmed Sensor Technologies Limited | Systems and methods for monitoring and management of chronic desease |
| KR20180040400A (ko) * | 2016-10-12 | 2018-04-20 | 삼성전자주식회사 | 생체정보 추정 장치 및 방법 |
| KR20210003606A (ko) * | 2019-07-02 | 2021-01-12 | 울산대학교 산학협력단 | 심박출량 추정 방법 및 장치 |
Family Cites Families (3)
| Publication number | Priority date | Publication date | Assignee | Title |
|---|---|---|---|---|
| KR100820159B1 (ko) * | 2005-11-29 | 2008-04-10 | 엘지전자 주식회사 | 혈압측정 방법 및 장치 |
| KR102608633B1 (ko) * | 2018-02-08 | 2023-12-04 | 삼성전자주식회사 | 전자 장치 및 그 제어 방법 |
| KR102362454B1 (ko) * | 2020-06-12 | 2022-02-15 | (주)이튜 | 다중 생체신호를 이용한 혈압 측정 장치 및 이를 이용한 헬스케어 시스템 |
-
2023
- 2023-06-14 KR KR1020230076053A patent/KR102893266B1/ko active Active
- 2023-12-04 EP EP23941751.2A patent/EP4728980A1/en active Pending
- 2023-12-04 WO PCT/KR2023/019829 patent/WO2024257970A1/ko not_active Ceased
Patent Citations (5)
| Publication number | Priority date | Publication date | Assignee | Title |
|---|---|---|---|---|
| US20170049391A1 (en) * | 2005-04-25 | 2017-02-23 | University Of Florida Research Foundation, Inc. | Monitoring Asthma And Other Respiratory Disorders With Calibrated Photoplethysmography Devices And Methods Of Using The Same |
| KR20130107066A (ko) * | 2012-03-21 | 2013-10-01 | 주식회사 누가의료기 | 양손을 이용한 혈관 및 심폐기능 평가를 위한 생체 계측 시스템 |
| WO2017032873A2 (en) * | 2015-08-26 | 2017-03-02 | Resmed Sensor Technologies Limited | Systems and methods for monitoring and management of chronic desease |
| KR20180040400A (ko) * | 2016-10-12 | 2018-04-20 | 삼성전자주식회사 | 생체정보 추정 장치 및 방법 |
| KR20210003606A (ko) * | 2019-07-02 | 2021-01-12 | 울산대학교 산학협력단 | 심박출량 추정 방법 및 장치 |
Non-Patent Citations (1)
| Title |
|---|
| NUS-NUH-MIT DATATHON SG: "SHADE'22 - Datathon [First Runner-Up] [Non-Invasive Prediction of Cardiac Output]", XP093254702, Retrieved from the Internet <URL:https://www.youtube.com/watch?v=quzvUkVAxBM> * |
Cited By (1)
| Publication number | Priority date | Publication date | Assignee | Title |
|---|---|---|---|---|
| CN119700065A (zh) * | 2025-02-25 | 2025-03-28 | 北京航空航天大学 | 一种动态无创心输出量监测系统和方法 |
Also Published As
| Publication number | Publication date |
|---|---|
| EP4728980A1 (en) | 2026-04-22 |
| KR102893266B1 (ko) | 2025-12-01 |
| KR20240175849A (ko) | 2024-12-23 |
Similar Documents
| Publication | Publication Date | Title |
|---|---|---|
| JP6121177B2 (ja) | ソースビデオ画像から動脈拍動経過時間を導出すること | |
| WO2022146057A1 (ko) | 전기적 바이오 시그널 데이터를 수치 벡터로 변환하는 방법 및 장치, 이를 이용하여 질병을 분석하는 방법 및 장치 | |
| EP2698112B1 (en) | Real-time stress determination of an individual | |
| WO2022019402A1 (ko) | 시계열 생체 신호 기반의 인공신경망 모델 학습 컴퓨터 프로그램 및 방법 | |
| US20230027982A1 (en) | Regularized multiple-input pain assessment and trend | |
| Yang et al. | Non-invasive cuff-less blood pressure machine learning algorithm using photoplethysmography and prior physiological data | |
| Dasari et al. | Video-based estimation of blood pressure | |
| KR102893266B1 (ko) | 비침습적으로 심박출량을 계산하는 장치 및 이의 동작 방법 | |
| WO2014112824A1 (ko) | 생체 정보 측정 장치 및 생체 정보 측정 방법 | |
| Alam et al. | UbiHeart: A novel approach for non-invasive blood pressure monitoring through real-time facial video | |
| US11432779B2 (en) | Method and device for capacitive touch panel based biosignal measurement | |
| US12591969B2 (en) | Medical information processing apparatus, method and non-transitory computer-readable storage medium to acquire biometric data regarding skin image and to continuously monitor internal body component without using special equipment | |
| Wuerich et al. | Cuffless Beat-to-Beat Blood Pressure Estimation from Photoplethysmogram Signals | |
| Mansourinezhad et al. | Blood pressure estimation using a PPG signal recorded from the fingertip of a hand moving in the sagittal plane | |
| WO2024191111A1 (ko) | Ai 로봇 메디컬 핸드 장치 및 이를 이용한 자가 검사 방법 | |
| WO2023080697A1 (ko) | 심장 신호 분할 방법 및 이를 이용한 심장 신호 분할용 디바이스 | |
| WO2024191190A1 (ko) | 신경망 모델에 기반하여 노이즈를 포함한 심전도 신호를 선별하는 방법, 프로그램 및 장치 | |
| WO2023199839A1 (ja) | 内面状態推定装置、内面状態推定方法及び記憶媒体 | |
| WO2018168804A1 (ja) | 血圧関連情報表示装置および方法 | |
| KR101861741B1 (ko) | 맥파를 이용한 환자 병명 진단장치 및 방법 | |
| Ismail | Internet of medical things (IoMT) for patient healthcare monitoring system | |
| KR20220129283A (ko) | 인공지능 알고리즘 기반의 생체신호 비정상 측정상태 알림 시스템 및 방법 | |
| Koshimizu et al. | Artificial Intelligence and Hypertension Management | |
| JP7864018B2 (ja) | 医用情報処理装置、医用情報処理方法、およびプログラム | |
| KR20180128159A (ko) | 고감도 다중 생체신호 취득 장치 및 이를 이용한 건강관리 방법 |
Legal Events
| Date | Code | Title | Description |
|---|---|---|---|
| 121 | Ep: the epo has been informed by wipo that ep was designated in this application |
Ref document number: 23941751 Country of ref document: EP Kind code of ref document: A1 |
|
| WWE | Wipo information: entry into national phase |
Ref document number: 2023941751 Country of ref document: EP |
|
| NENP | Non-entry into the national phase |
Ref country code: DE |
|
| ENP | Entry into the national phase |
Ref document number: 2023941751 Country of ref document: EP Effective date: 20260114 |
|
| ENP | Entry into the national phase |
Ref document number: 2023941751 Country of ref document: EP Effective date: 20260114 |
|
| ENP | Entry into the national phase |
Ref document number: 2023941751 Country of ref document: EP Effective date: 20260114 |
|
| ENP | Entry into the national phase |
Ref document number: 2023941751 Country of ref document: EP Effective date: 20260114 |
|
| WWP | Wipo information: published in national office |
Ref document number: 2023941751 Country of ref document: EP |