WO2024257507A1 - 診断装置および診断方法 - Google Patents
診断装置および診断方法 Download PDFInfo
- Publication number
- WO2024257507A1 WO2024257507A1 PCT/JP2024/017050 JP2024017050W WO2024257507A1 WO 2024257507 A1 WO2024257507 A1 WO 2024257507A1 JP 2024017050 W JP2024017050 W JP 2024017050W WO 2024257507 A1 WO2024257507 A1 WO 2024257507A1
- Authority
- WO
- WIPO (PCT)
- Prior art keywords
- probability
- instantaneous
- attack
- diagnosed
- diagnostic
- Prior art date
- Legal status (The legal status is an assumption and is not a legal conclusion. Google has not performed a legal analysis and makes no representation as to the accuracy of the status listed.)
- Ceased
Links
Images





Classifications
-
- G—PHYSICS
- G05—CONTROLLING; REGULATING
- G05B—CONTROL OR REGULATING SYSTEMS IN GENERAL; FUNCTIONAL ELEMENTS OF SUCH SYSTEMS; MONITORING OR TESTING ARRANGEMENTS FOR SUCH SYSTEMS OR ELEMENTS
- G05B23/00—Testing or monitoring of control systems or parts thereof
- G05B23/02—Electric testing or monitoring
-
- G—PHYSICS
- G06—COMPUTING OR CALCULATING; COUNTING
- G06F—ELECTRIC DIGITAL DATA PROCESSING
- G06F21/00—Security arrangements for protecting computers, components thereof, programs or data against unauthorised activity
- G06F21/50—Monitoring users, programs or devices to maintain the integrity of platforms, e.g. of processors, firmware or operating systems
- G06F21/55—Detecting local intrusion or implementing counter-measures
Definitions
- the present invention relates to a diagnostic device and a diagnostic method.
- Patent Document 1 describes a diagnostic method for diagnosing the state of equipment using a method other than binary diagnosis.
- a diagnostic device includes a calculation device that calculates an instantaneous attack probability, which is the probability that a cyber-attack has been carried out on a device to be diagnosed at a specified time, calculates an instantaneous failure probability, which is the probability that a failure has occurred in the device to be diagnosed at the specified time, and determines whether or not a cyber-attack has been carried out on the device to be diagnosed and whether or not a failure has occurred in the device to be diagnosed at the specified time based on the instantaneous attack probability and the instantaneous failure probability.
- the present invention makes it possible to properly determine whether or not a cyber attack has occurred and whether or not equipment is malfunctioning.
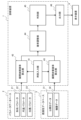
- FIG. 1 is a block diagram showing a schematic hardware configuration of a diagnostic device according to the first embodiment.
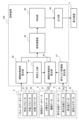
- FIG. 2 is a block diagram showing the functional configuration of the diagnostic device according to the first embodiment.
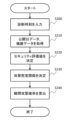
- FIG. 3 is a flowchart of the instantaneous failure probability calculation process executed by the instantaneous failure probability calculation unit.
- FIG. 4 is a flowchart of the instantaneous attack probability calculation process executed by the instantaneous attack probability calculation unit.
- FIG. 5 is a flowchart of the probability adjustment process executed by the probability adjustment unit.
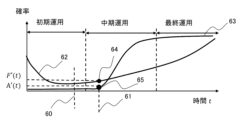
- FIG. 6 is a graph illustrating the adjusted instantaneous failure probability and the adjusted instantaneous attack probability.
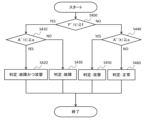
- FIG. 7 is a flowchart of the discrimination process executed by the discriminating unit.
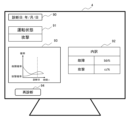
- FIG. 8 is a schematic diagram illustrating a display screen of the display device.
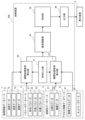
- FIG. 9 is a block diagram showing the functional configuration of a diagnostic device according to the second embodiment.
- FIG. 10 is a flowchart of the instantaneous attack probability calculation process executed by the instantaneous attack probability calculation unit.
- FIG. 11 is a graph illustrating the adjusted instantaneous failure probability and the adjusted instantaneous attack probability.
- FIG. 12 is a block diagram showing the functional configuration of a diagnostic device according to the third embodiment.
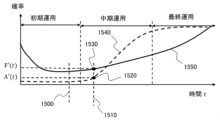
- FIG. 13 is a graph illustrating the adjusted instantaneous failure probability and the adjusted instantaneous attack probability.
- First Embodiment 1 is a block diagram showing a schematic hardware configuration of a diagnostic device 1 according to the first embodiment.
- the diagnostic device 1 is a device that diagnoses the health of a device to be diagnosed (e.g., a control device included in a control system) (not shown) and notifies a user of the diagnosis result.
- the user can diagnose the device to be diagnosed using the diagnostic device 1 at any time (e.g., a specific time every day) and take necessary measures for the device to be diagnosed by referring to the diagnosis result.
- the diagnostic device 1 is composed of a computer equipped with an arithmetic device 11 such as a CPU (Central Processing Unit), MPU (Micro Processing Unit), and DSP (Digital Signal Processor), non-volatile memory 12 such as ROM (Read Only Memory), flash memory, and a hard disk drive, volatile memory 13 known as RAM (Random Access Memory), an input/output interface 14, and other peripheral circuits. These pieces of hardware work together to operate software and realize multiple functions.
- the diagnostic device 1 may be composed of one computer or multiple computers.
- the arithmetic device 11 may be an ASIC (application specific integrated circuit), FPGA (Field Programmable Gate Array), etc.
- the non-volatile memory 12 stores programs capable of executing various calculations.
- the non-volatile memory 12 is a storage medium (storage device) capable of reading programs that realize the functions of this embodiment.
- the volatile memory 13 is a storage medium (storage device) that temporarily stores the results of calculations performed by the calculation device 11 and signals input from the input interface 14.
- the calculation device 11 is a device that expands the programs stored in the non-volatile memory 12 into volatile memory and executes calculations, and performs predetermined calculation processing on data taken from the input/output interface 14, the non-volatile memory 12, and the volatile memory 13 in accordance with the programs.
- the diagnostic device 1 is connected to a parameter database 2, a vulnerability database 3, and a display device 4 via an input/output interface 14.
- the parameter database 2 and the vulnerability database 3 are storage devices in which predetermined data is stored. The data stored in the parameter database 2 and the vulnerability database 3 will be described in detail later.
- the display device 4 is a device having a display screen, such as an LCD monitor.
- the input section of the input/output interface 14 converts the signals input from the parameter database 2 and the vulnerability database 3 into data that can be calculated by the calculation device 11.
- the output section of the input/output interface 14 generates an output signal according to the calculation result in the calculation device 11, and outputs the signal to the display device 4.
- the diagnostic device 1 includes a time input unit 41, an instantaneous failure probability calculation unit 42, an instantaneous attack probability calculation unit 43, a probability adjustment unit 44, a discrimination unit 45, and an output unit 46.
- the time input unit 41 inputs the diagnosis time to the instantaneous failure probability calculation unit 42 and the instantaneous attack probability calculation unit 43.
- the instantaneous failure probability calculation unit 42 calculates the instantaneous failure probability of the device to be diagnosed at the diagnosis time.
- the instantaneous attack probability calculation unit 43 calculates the instantaneous attack probability of the device to be diagnosed at the diagnosis time.
- the probability adjustment unit 44 adjusts the instantaneous failure probability and the instantaneous attack probability to have the same dimension.
- the discrimination unit 45 uses the instantaneous failure probability and the instantaneous attack probability adjusted by the probability adjustment unit 44 to discriminate whether or not there is a possibility of a cyber attack on the device to be diagnosed and whether or not there is a possibility of a failure of the device to be diagnosed.
- the output unit 46 outputs the result of the discrimination by the discrimination unit 45 to the display device 4 and notifies the user of the content.
- the parameter database 2 stores shape parameters 21, scale parameters 22, and position parameters 23.
- the vulnerability database 3 stores publication date data 31 and device data 32. These data will be explained together with the processes that use the data.
- the diagnosis of the target device by the diagnostic device 1 is realized by an instantaneous failure probability calculation process, an instantaneous attack probability calculation process, a probability adjustment process, and a discrimination process. Each of these processes will be explained in turn below.
- [Instantaneous failure probability calculation process] 3 is a flowchart of the instantaneous failure probability calculation process executed by the instantaneous failure probability calculation unit 42.
- the time input unit 41 inputs the diagnosis time to the instantaneous failure probability calculation unit 42.
- the instantaneous failure probability calculation unit 42 acquires the shape parameter 21, the scale parameter 22, and the position parameter 23 from the parameter database 2. Each of these parameters is set to a predetermined value according to the number of past failures of the device to be diagnosed and the time until the failure.
- the instantaneous failure probability calculation unit 42 substitutes the shape parameter 21, the scale parameter 22, and the position parameter 23 into the failure density function f(t).
- the failure density function f(t) is a function that represents the failure probability of the diagnosed device over time.
- the failure density function f(t) is a function that represents a probability distribution that changes over time.
- the failure density function f(t) is expressed as the product of a hazard function h(t) and a reliability function R(t).
- the hazard function h(t) is a function that represents the probability that a failure occurs in the diagnosed device at time t, regardless of whether the diagnosed device has actually failed by time t.
- the hazard function h(t) is a conditional probability density that the diagnosed device will fail at that time under the condition that the diagnosed device has not failed until time t.
- the shape parameter 21 is represented by the symbol m
- the scale parameter 22 is represented by the symbol n
- the location parameter 23 is represented by the symbol ⁇
- the hazard function h(t) is expressed by the following equation (1).
- h(t) m/n ⁇ (t- ⁇ )/n ⁇ (m-1)...(1)
- the reliability function R(t) is a function that indicates the probability that no failure will occur in the device to be diagnosed until time t, and is expressed by the following equation (2).
- the failure density function f(t) is a function that indicates the probability that a failure will first occur in the device to be diagnosed at time t, and is expressed by the following equation (3).
- f(t) h(t) ⁇ R(t)...(3)
- the failure density function f(t) is generally a downwardly convex function over time, such as a Weibull distribution.
- the scale parameter 22, represented by the letter n is a parameter that determines the magnitude of the failure density function f(t), that is, the scale of the probability distribution represented by the failure density function f(t).
- the position parameter 23, represented by the letter ⁇ , is a parameter that determines the phase of the failure density function f(t), that is, the position of the probability distribution represented by the failure density function f(t).
- the instantaneous failure probability calculation unit 42 substitutes the shape parameter 21, the scale parameter 22, and the position parameter 23 into the failure density function f(t) of the above formula (3).
- the instantaneous failure probability calculation unit 42 calculates the instantaneous failure probability using the failure density function f(t) after the substitution of each parameter and the diagnosis time.
- [Instant attack probability calculation process] 4 is a flowchart of the instantaneous attack probability calculation process executed by the instantaneous attack probability calculation unit 43.
- the time input unit 41 inputs a diagnosis time to the instantaneous attack probability calculation unit 43.
- the instantaneous attack probability calculation unit 43 acquires the publication date data 31 and the device data 32 from the vulnerability database 3.
- the vulnerability database 3 holds vulnerability information for the software and hardware that constitute the equipment to be diagnosed.
- the publication date data 31 indicates the date on which vulnerability information for the software and hardware related to the equipment to be diagnosed was published.
- the equipment data 32 indicates network connection information for the equipment to be diagnosed and program information held and used inside the equipment to be diagnosed. These data are set by collecting vulnerability information published by security-related organizations in each country in advance, for example, via the Internet.
- the publication date data 31 is generated from vulnerability information published based on the CVSS (Common Vulnerability Scoring System), known as the Common Vulnerability Scoring System, and stored in the vulnerability database 3. Furthermore, by comparing such vulnerability information with the equipment data 32, vulnerabilities that affect the equipment to be diagnosed can be identified.
- CVSS Common Vulnerability Scoring System
- the instantaneous attack probability calculation unit 43 calculates a security evaluation value for the device to be diagnosed.
- the security evaluation value is a numerical value that indicates the level of risk of the device to be diagnosed to a cyber attack, and is set to a larger value, for example, the higher the resistance of the device to be diagnosed to cyber attacks and the greater the damage that would occur if the device to be diagnosed were to be subjected to a cyber attack.
- the instantaneous attack probability calculation unit 43 in the first embodiment calculates the security evaluation value Risk by the following equation (5).
- Risk Impact ⁇ Likelihood...(5)
- Impact represents the degree of influence (magnitude of influence) on the diagnosis target device
- Likelihood represents the ease of attacking the diagnosis target device.
- the aforementioned CVSS determines the security assessment score on the date of vulnerability disclosure as follows, based on the basic characteristics of the vulnerability itself.
- the basic characteristics of the vulnerability itself include attack source category X, which is an index of from where the vulnerable component can be attacked, Y, which is an index of the complexity of the conditions necessary to attack the vulnerable component, privilege level Z required to attack the vulnerable component, and user involvement level W required to attack the vulnerable component, all of which measure the ease of attack.
- attack level C on confidentiality, impact I on integrity, and impact A on availability, all of which measure the degree of impact on the device being diagnosed.
- the instantaneous attack probability calculation unit 43 calculates the security evaluation value Risk using equation (8).
- the instantaneous attack probability calculation unit 43 assumes a probability distribution that has the above-mentioned security evaluation value as a parameter, and determines the attack density function a(t) that represents that probability distribution.
- the attack density function a(t) is a function that is upwardly convex with respect to time or a function that monotonically decreases, and an example of such a function is a Gaussian distribution.
- the instantaneous attack probability calculation unit 43 in the first embodiment uses an attack density function a(t) expressed by the following equation (9).
- a(t) 1/ ⁇ (2 ⁇ exp ⁇ -(t- ⁇ ) ⁇ 2/2 ⁇ 2 ⁇ ) ...(9)
- ⁇ represents the mean
- ⁇ represents the standard deviation
- 2 ⁇ 2 represents the variance
- step S240 the instantaneous attack probability calculation unit 43 calculates the instantaneous attack probability using the diagnosis time input in step S200 and the attack density function a(t) determined in step S230.
- [Probability adjustment process] 5 is a flowchart of the probability adjustment process executed by the probability adjustment unit 44.
- the probability adjustment unit 44 makes the probability distributions of failures and cyber attacks at the time of diagnosis comparable by making them into the same dimension.
- a method using a probability distance measure is adopted as a method of making different probability distributions into the same dimension.
- step S300 the probability adjustment unit 44 obtains the cumulative failure distribution function F(t) derived by the instantaneous failure probability calculation unit 42 in the instantaneous failure probability calculation process, and the cumulative attack distribution function A(t) derived by the instantaneous attack probability calculation unit 43 in the instantaneous attack probability calculation process.
- step S310 the probability adjustment unit 44 calculates a probability distance measure between the cumulative failure distribution function F(t) and the cumulative attack distribution function A(t).
- the probability distance measure means the distance between different probability distributions (for example, a Weibull distribution and a Gaussian distribution), such as the Kullback-Leibler divergence.
- the probability distance measure DKL is calculated by the following formula (11). DKL(F(t)
- A(t)) ⁇ F(t)log ⁇ A(t)/F(t) ⁇ dt...(11) In this manner, in the first embodiment, the Kullback-Leibler divergence is adopted as the probabilistic distance measure.
- step S320 the probability adjustment unit 44 calculates the adjusted instantaneous failure probability and adjusted instantaneous attack probability at the diagnosis time.
- the probability adjustment unit 44 multiplies the instantaneous failure probability at the diagnosis time (the value calculated in step S130 of FIG. 3) by the probability distance measure calculated in step S310 to obtain the adjusted instantaneous failure probability.
- the probability adjustment unit 44 multiplies the instantaneous attack probability at the diagnosis time (the value calculated in step S240 of FIG. 4) by the probability distance measure calculated in step S310 to obtain the adjusted instantaneous attack probability.
- the adjusted instantaneous failure probability and the adjusted instantaneous attack probability can be calculated by the following equations (12) and (13).
- F'(t) DKL(F(t)
- A'(t) DKL(F(t)
- step S330 the probability adjustment unit 44 outputs the adjusted instantaneous failure probability F'(t) and the adjusted instantaneous attack probability A'(t) at the diagnosis time t1 calculated in step S320 to the discrimination unit 45.
- FIG. 6 is a graph illustrating the adjusted instantaneous failure probability F'(t) and the adjusted instantaneous attack probability A'(t).
- reference numeral 62 denotes the adjusted instantaneous failure probability F'(t)
- reference numeral 63 denotes the adjusted instantaneous attack probability A'(t).
- the horizontal axis denotes the elapsed time t
- the vertical axis denotes the respective probabilities at the elapsed time.
- the elapsed time t on the horizontal axis is divided into three phases: initial operation, mid-term operation, and final operation. These phases refer to the phases after the equipment to be diagnosed is introduced and operation begins.
- the initial operation phase represents the period immediately after the equipment to be diagnosed is put into operation
- the mid-term operation phase represents the period after operation is on track
- the final operation phase represents the final stage of operation.
- Reference numeral 60 represents the date and time when a vulnerability was discovered in the equipment to be diagnosed
- reference numeral 61 represents the time when the diagnosis was performed by the diagnosis device 1 (diagnosis time t1).
- Reference numeral 64 denotes the adjusted instantaneous failure probability F'(t) at the diagnosis time
- [Discrimination process] 7 is a flowchart of the discrimination process executed by the discrimination unit 45.
- the discrimination unit 45 outputs the presence or absence of a breakdown and a cyber attack by comparing the adjusted instantaneous failure probability F'(t) and the adjusted instantaneous attack probability A'(t) output by the probability adjustment unit 44 with predetermined thresholds f and a, respectively.
- the predetermined threshold f is a value based on the failure density function f(t)
- the predetermined threshold a is a value based on the attack density function a(t).
- These thresholds f and a may be statistical values such as the mode, average, and median of the failure density function f(t) and the attack density function a(t), or may be values designated by the designer of the diagnostic device 1 separately from these statistical values.
- step S400 the discrimination unit 45 compares the value of the adjusted instantaneous failure probability F'(t) with a threshold value f. If the value of the adjusted instantaneous failure probability F'(t) is equal to or greater than the threshold value f, the process proceeds to step S410. In step S410, the discrimination unit 45 compares the value of the adjusted instantaneous attack probability A'(t) with a threshold value a. If the value of the adjusted instantaneous attack probability A'(t) is equal to or greater than the threshold value a, the process proceeds to step S420. In step S420, the discrimination unit 45 determines that it is highly likely that both a failure and a cyber attack have occurred simultaneously.
- step S410 If the value of the adjusted instantaneous attack probability A'(t) is less than the threshold value a in step S410, the process proceeds to step S430.
- step S430 the discrimination unit 45 determines that it is highly likely that a failure has occurred. If the value of the adjusted instantaneous failure probability F'(t) is less than the threshold value f in step S400, the process proceeds to step S440.
- step S440 the discrimination unit 45 compares the value of the adjusted instantaneous attack probability A'(t) with the threshold value a. If the value of the adjusted instantaneous attack probability A'(t) is equal to or greater than the threshold value a, the process proceeds to step S450.
- step S450 the discrimination unit 45 determines that there is a high possibility that a cyber-attack has occurred. If the value of the adjusted instantaneous attack probability A'(t) is less than the threshold value a in step S440, the process proceeds to step S460. In step S460, the discrimination unit 45 determines that there is a low possibility that a malfunction has occurred and that a cyber-attack has occurred, i.e., the diagnosis target device is in a normal state.
- the process proceeds to step S440, and since the adjusted instantaneous attack probability A'(t) is less than the threshold value a, the process proceeds to step S460.
- the discrimination unit 45 determines that the device to be diagnosed is in a normal state (no failure has occurred and no cyber attack has been performed).
- FIG. 8 is a schematic diagram illustrating an example of a display screen of the display device 4.
- the output unit 46 outputs the result of the determination by the determination unit 45, i.e., the diagnosis result, to the display device 4. Based on this diagnosis result, the display device 4 displays a screen such as the example shown in FIG. 8.
- the diagnosis graph display area 93 displays the failure probability distribution and attack probability distribution up to the diagnosis time, and for example, the probability distribution is displayed as in the graph illustrated in FIG. 6.
- the re-diagnosis button 94 is a button for executing a re-diagnosis. By pressing the re-diagnosis button 94, the diagnosis of the device to be diagnosed at the time the button was pressed is executed again, and the result of the re-diagnosis can be displayed on the display screen of the display device 4.
- the instantaneous attack probability calculation unit 43 calculates the instantaneous attack probability, which is the probability that a cyber-attack was carried out on the equipment to be diagnosed at the diagnosis time (predetermined time), and the instantaneous failure probability calculation unit 42 (arithmetic device) calculates the instantaneous failure probability, which is the probability that a failure occurred in the equipment to be diagnosed at the diagnosis time (predetermined time).
- the discrimination unit 45 determines whether or not there has been a cyber-attack on the equipment to be diagnosed and whether or not there is a failure in the equipment to be diagnosed at the diagnosis time (predetermined time) based on the instantaneous attack probability and the instantaneous failure probability.
- the instantaneous attack probability calculation unit 43 calculates the instantaneous attack probability using an attack density function a(t) (first probability distribution) that represents a time-varying probability distribution.
- the instantaneous failure probability calculation unit 42 calculates the instantaneous failure probability using a failure density function f(t) (second probability distribution) that represents a time-varying probability distribution and is different from the attack density function a(t) (first probability distribution). In this way, it is possible to independently determine whether or not a cyber attack has occurred and whether or not a failure has occurred, without one being affected by the other.
- the instantaneous failure probability calculation unit 42 calculates the instantaneous failure probability using at least one of the shape parameter 21, scale parameter 22, and position parameter 21, which represent the shape, scale, and position characteristics of the probability distribution of the probability that the diagnosed device will fail. This makes it possible to accurately determine whether or not the diagnosed device is failing.
- the probability adjustment unit 44 (calculation device) adjusts the instantaneous attack probability and instantaneous failure probability to have the same dimension. This makes it possible to determine the threshold values for comparing the instantaneous attack probability and instantaneous failure probability on a common scale, making it easy to set the threshold values.
- the output unit 46 causes the display device 4 to display the presence or absence of a cyber attack on the device to be diagnosed as determined by the discrimination unit 45 (computing device), and the presence or absence of a malfunction in the device to be diagnosed as determined by the discrimination unit 45 (computing device). This allows the user of the diagnostic device 1 to accurately understand the diagnosis results.
- FIG. 9 is a block diagram similar to FIG. 2, showing the functional configuration of a diagnostic device 100 according to the second embodiment.
- the diagnostic device 100 includes a maintenance risk assessment value calculation unit 47.
- the maintenance risk assessment value calculation unit 47 calculates a maintenance risk assessment value, which is a numerical value that quantifies the risk associated with the maintenance of the device to be diagnosed.
- a maintenance inspection database 5 is connected to the diagnostic device 100.
- the maintenance and inspection database 5 stores maintenance and inspection data 51, maintenance worker data 52, and operation log data 53.
- Maintenance and inspection data 51 is, for example, information regarding the date and location of a maintenance worker's maintenance and inspection of the equipment to be diagnosed.
- Maintenance worker data 52 is information regarding the maintenance worker himself, such as the maintenance worker's age and years of service.
- Operation log data 53 is, for example, information regarding maintenance time and the number of operation commands.
- the maintenance risk assessment value L is expressed by the following formula (14).
- L T ⁇ C...(14)
- T represents the ratio of the actual operation time to the specified operation time
- C represents the ratio of the number of actual operation commands to the specified number of operation commands.
- the maintenance personnel's degree of familiarity with the operations can be quantitatively measured. For example, if C is greater than 1, it can be determined that the maintenance personnel is not familiar with maintenance operations, and if C is less than 1, it can be determined that the maintenance personnel is familiar with maintenance operations. Similarly, for T, if T is greater than 1, it can be determined that the maintenance personnel is not familiar with maintenance operations, and if T is less than 1, it can be determined that the maintenance personnel is familiar with maintenance operations.
- FIG. 10 is a diagram similar to FIG. 4, and is a flowchart of the instantaneous attack probability calculation process executed by the instantaneous attack probability calculation unit 43.
- the process of step S225 is added between steps S220 and S230 of the flowchart of FIG. 4.
- the instantaneous attack probability calculation unit 43 adds the maintenance risk assessment value calculated by the maintenance risk assessment value calculation unit 47 to the security assessment value determined in step S220. As a result, subsequent processes targeting the security assessment value take into account the maintenance risk assessment value.
- the security evaluation value is determined by the degree of impact (magnitude of impact) on the diagnosed device, Impact, and the likelihood of attack on the diagnosed device.
- the maintenance risk evaluation value is reflected in the likelihood of attack among these values.
- Likelihood is a value based on the attack source category X, the complexity of the attack conditions Y, the required privilege level Z, and the required user involvement level W.
- the instantaneous attack probability calculation unit 43 adds (reflects) the maintenance risk evaluation value to the security evaluation value by varying the values of the attack source category X and the required privilege level Z according to the maintenance risk evaluation value. For example, the larger the maintenance risk evaluation value, the higher the values of the attack source category X and the required privilege level Z, and the smaller the maintenance risk evaluation value, the lower the values of the attack source category X and the required privilege level Z.
- the method of adding the maintenance risk assessment value to the security assessment value is not limited to the above method.
- the maintenance risk assessment value may be evaluated on the same 10-point scale as the security risk assessment value, and added to the security risk assessment value.
- FIG. 11 is a graph similar to FIG. 6, illustrating the adjusted instantaneous failure probability F'(t) and the adjusted instantaneous attack probability A'(t).
- Reference numeral 1360 represents the adjusted instantaneous failure probability F'(t)
- reference numeral 1370 represents the adjusted instantaneous attack probability A'(t).
- the horizontal axis represents the elapsed time t
- the vertical axis represents the respective probabilities at the elapsed time.
- Reference numeral 1300 represents the date and time when a vulnerability was discovered in the device to be diagnosed
- reference numeral 1310 represents the time when the diagnosis was performed by the diagnosis device 1 (diagnosis time t1).
- Reference numeral 1330 represents the adjusted instantaneous attack probability A'(t) without taking into account the maintenance risk evaluation value at the diagnosis time
- reference numeral 1340 represents the adjusted instantaneous attack probability A'(t) with the maintenance risk evaluation value at the diagnosis time taken into account
- Reference numeral 1350 represents the adjusted instantaneous failure probability F'(t) at the diagnosis time.
- the discrimination unit 45 first determines that the possibility of failure is low because F'(t) is smaller than f. Then, the discrimination unit 45 determines that the possibility of a cyber attack is high because A'(t) is equal to or greater than a. As a result, the diagnosis result is that the possibility of a cyber attack is high. In this way, the adjusted instantaneous attack probability A'(t) becomes larger by taking into account the maintenance risk assessment value, and as a result, the diagnosis result changes from the content described in Figure 6.
- the instantaneous attack probability calculation unit 43 calculates the instantaneous attack probability using a maintenance risk assessment value based on at least one of the following: maintenance inspection data 51, which is information related to the maintenance inspection of the device to be diagnosed; maintenance staff data 52, which is information related to the maintenance staff who perform the maintenance inspection of the device to be diagnosed; and operation log data 53, which is information related to the operation log of operations performed during the maintenance inspection of the device to be diagnosed. In this way, it becomes possible to perform a diagnosis that takes into account the life cycle of the device to be diagnosed.
- FIG. 12 is a block diagram similar to FIG. 2, showing the functional configuration of a diagnostic device 200 according to the third embodiment.
- a physical information database 7 and an access information database 8 are connected to the diagnostic device 200.
- the physical information database 7 stores temperature data 71, humidity data 72, and vibration data 73.
- the temperature data 71 is data relating to the temperature of the environment of the device to be diagnosed, for example, whether the device to be diagnosed is operating at high temperature or under cooling.
- the humidity data 72 is data relating to the humidity of the environment of the device to be diagnosed, for example, whether the environment in which the device to be diagnosed is installed is humid or low.
- the vibration data 73 is data relating to the magnitude of vibration in the environment in which the device to be diagnosed is installed.
- the physical information database 7 may also store data relating to the wind (air volume and wind speed), radioactivity, dust, etc. in the environment of the device to be diagnosed.
- the access information database 8 stores physical access data 81 and network data 82.
- the physical access data 81 is data on the security status of the installation location of the diagnosis target device, i.e., data indicating the physical safety of the environment in which the diagnosis target device is installed, such as data that the room in which the diagnosis target device is installed is locked, or that physical security has been established such that only specific people can enter, or that the diagnosis target device is secured with a wire lock or the like.
- the network data 82 is data on the security status of the path to access the diagnosis target device from the outside via the network, i.e., data indicating the ease of intrusion into the diagnosis target device from the outside, such as debug port information and shell information of the diagnosis target device, and port information used for network communication.
- the instantaneous failure probability calculation unit 42 of the third embodiment calculates the instantaneous failure probability using not only the various parameters in the parameter database 2 but also the various data in the physical information database 7.
- the instantaneous attack probability calculation unit 43 of the third embodiment calculates the instantaneous attack probability using not only the various data in the vulnerability database 3 but also the various data in the access information database 8.
- Reference numeral 13 is a graph similar to FIG. 6, illustrating the adjusted instantaneous failure probability F'(t) and the adjusted instantaneous attack probability A'(t).
- Reference numeral 1550 denotes the adjusted instantaneous failure probability F'(t)
- reference numeral 1540 denotes the adjusted instantaneous attack probability A'(t).
- the horizontal axis denotes the elapsed time t
- the vertical axis denotes the respective probabilities at the elapsed time.
- Reference numeral 1500 denotes the date and time when a vulnerability was discovered in the device to be diagnosed
- reference numeral 1510 denotes the time when the diagnosis was performed by the diagnosis device 200 (diagnosis time t1).
- Reference numeral 1530 denotes the adjusted instantaneous failure probability F'(t) taking into account various data in the physical information database 7 at the diagnosis time
- reference numeral 1520 denotes the adjusted instantaneous attack probability A'(t) taking into account various data in the access information database 8 at the diagnosis time.
- the discrimination unit 45 first determines that there is a high possibility of a malfunction because F'(t) is greater than or equal to f. Then, the discrimination unit 45 determines that there is a low possibility of a cyber attack because A'(t) is less than a. This results in the diagnosis being that there is a high possibility of a malfunction. In this way, the diagnosis result has changed from the content described in Figure 6 due to the addition of physical factors and security factors due to external access.
- the instantaneous failure probability calculation unit 42 calculates the instantaneous failure probability using the physical information database 7, which contains information about at least one of the following physical environment in which the device to be diagnosed operates: temperature, humidity, vibration, wind, radioactivity, and dust. This improves the accuracy of the instantaneous failure probability, making it possible to more accurately diagnose the presence or absence of a failure.
- the instantaneous attack probability calculation unit 43 calculates the instantaneous attack probability using physical access data 81, which is information about the security status of the installation location of the diagnosis target device, and network data 82, which is information about the security status of the path for accessing the diagnosis target device from the outside via a network.
- physical access data 81 which is information about the security status of the installation location of the diagnosis target device
- network data 82 which is information about the security status of the path for accessing the diagnosis target device from the outside via a network.
- the cumulative failure distribution function F(t) may be different from that described in formula (4).
- the cumulative failure distribution function F(t) may be calculated using a reliability function R(t) instead of the failure density function f(t).
- the cumulative failure distribution function F(t) may be defined as 1-R(t), and the instantaneous failure probability may be calculated in the form of 1-R(t1) using the diagnosis time t1.
- a function having various parameters in the parameter database 2 and time as variables may be calculated in advance from the characteristics of the device to be diagnosed, and the diagnosis time t1 may be substituted into the function to calculate the probability.
- the security evaluation value Risk may be different from that described in formula (8).
- the security evaluation value Risk may be calculated by taking into account the current severity of the vulnerability in addition to the basic characteristics of the vulnerability itself, or by using the final vulnerability including the user's usage environment.
- ⁇ Modification 3> the Weibull distribution is used as an example of the failure density function f(t) and the Gaussian distribution is used as an example of the attack density function a(t), but the types of probability distributions are not limited to these. Other probability distributions may be used as the failure density function f(t) and the attack density function a(t).
- the calculation method of the adjusted instantaneous failure probability F'(t) and the adjusted instantaneous attack probability A'(t) may be different from that exemplified in the formula (12) and the formula (13).
- the adjusted instantaneous failure probability F'(t) and the adjusted instantaneous attack probability A'(t) may be calculated by multiplying the calculated distance scale by the failure density function f(t) and the attack density function a(t) and integrating the result from time 0 to the diagnosis time t1.
- the instantaneous failure probability and the instantaneous attack probability are made to have the same dimension using the probability distance scale shown in the formula (11), but the instantaneous failure probability and the instantaneous attack probability may be made comparable by other methods.
- ⁇ Modification 5> The data stored in the various databases described above (parameter database 2, vulnerability database 3, maintenance and inspection database 5, physical information database 7, and access information database 8) may be different from the data described above. In addition, the method of using the data may also be different from that of each of the above-mentioned embodiments.
Landscapes
- Engineering & Computer Science (AREA)
- Physics & Mathematics (AREA)
- General Physics & Mathematics (AREA)
- Computer Security & Cryptography (AREA)
- Software Systems (AREA)
- Theoretical Computer Science (AREA)
- Automation & Control Theory (AREA)
- Computer Hardware Design (AREA)
- General Engineering & Computer Science (AREA)
- Data Exchanges In Wide-Area Networks (AREA)
- Testing And Monitoring For Control Systems (AREA)
Abstract
診断装置が備える演算装置は、診断対象機器に対して所定の時刻にサイバー攻撃が実施された確率である瞬間攻撃確率を算出し、診断対象機器において所定の時刻に故障が生じた確率である瞬間故障確率を算出し、瞬間攻撃確率と瞬間故障確率とに基づき、所定の時刻における、診断対象機器に対するサイバー攻撃の有無および診断対象機器における故障の有無を判定する。
Description
本発明は、診断装置および診断方法に関する。
安定した稼働が求められる制御システムは、機器の故障とサイバー攻撃の両方に対処を行う必要がある。機器の状態を正常と異常の二値で診断する、いわゆる二値診断には、異常をサイバー攻撃と機器の故障に判別することができない、正常と思われるサイバー攻撃を判別できない、等の問題がある。特許文献1には、機器の状態を二値診断以外で診断する診断方法が記載されている。
特許文献1に記載の技術では、サイバー攻撃を受けている確率と機器が故障した確率の相互に依存関係があるため、正確な診断ができないという問題があった。
本発明は、サイバー攻撃の有無および機器の故障の有無を適切に判別可能な診断装置および診断方法の提供を目的とする。
本発明の一態様による診断装置は、演算装置を備え、前記演算装置は、診断対象機器に対して所定の時刻にサイバー攻撃が実施された確率である瞬間攻撃確率を算出し、前記診断対象機器において前記所定の時刻に故障が生じた確率である瞬間故障確率を算出し、前記瞬間攻撃確率と前記瞬間故障確率とに基づき、前記所定の時刻における、前記診断対象機器に対するサイバー攻撃の有無および前記診断対象機器における故障の有無を判定する。
本発明によれば、サイバー攻撃の有無および機器の故障の有無を適切に判別できる。
図1~図8を参照して、本発明の実施形態に係る診断装置について説明する。
<第1実施形態>
図1は、第1実施形態に係る診断装置1のハードウェア構成を模式的に示すブロック図である。診断装置1は、不図示の診断対象機器(例えば制御システムに含まれる制御装置等)の健全性を診断し、診断結果をユーザに報知する装置である。ユーザは任意のタイミング(例えば毎日の特定の時刻等)で診断装置1を用いて診断対象機器の診断を行い、診断結果を参照して診断対象機器に必要な処置を施すことができる。
図1は、第1実施形態に係る診断装置1のハードウェア構成を模式的に示すブロック図である。診断装置1は、不図示の診断対象機器(例えば制御システムに含まれる制御装置等)の健全性を診断し、診断結果をユーザに報知する装置である。ユーザは任意のタイミング(例えば毎日の特定の時刻等)で診断装置1を用いて診断対象機器の診断を行い、診断結果を参照して診断対象機器に必要な処置を施すことができる。
診断装置1は、CPU(Central Processing Unit)、MPU(Micro Processing Unit)、DSP(Digital Signal Processor)等の演算装置11、ROM(Read Only Memory)、フラッシュメモリ、ハードディスクドライブ等の不揮発性メモリ12、所謂RAM(Random Access Memory)と呼ばれる揮発性メモリ13、入出力インタフェース14、および、その他の周辺回路を備えたコンピュータで構成される。これらのハードウェアは、協働してソフトウェアを動作させ、複数の機能を実現する。なお、診断装置1は、1つのコンピュータで構成してもよいし、複数のコンピュータで構成してもよい。また、演算装置11としては、ASIC(application specific integrated circuit)、FPGA(Field Programmable Gate Array)などを用いることができる。
不揮発性メモリ12には、各種演算が実行可能なプログラムが格納されている。すなわち、不揮発性メモリ12は、本実施形態の機能を実現するプログラムを読み取り可能な記憶媒体(記憶装置)である。揮発性メモリ13は、演算装置11による演算結果および入力インタフェース14から入力された信号を一時的に記憶する記憶媒体(記憶装置)である。演算装置11は、不揮発性メモリ12に記憶されたプログラムを揮発性メモリに展開して演算実行する装置であって、プログラムに従って入出力インタフェース14、不揮発性メモリ12および揮発性メモリ13から取り入れたデータに対して所定の演算処理を行う。
診断装置1は、入出力インタフェース14を介して、パラメータデータベース2、脆弱性データベース3、および表示装置4に接続される。パラメータデータベース2および脆弱性データベース3は、所定のデータが格納された記憶装置である。パラメータデータベース2および脆弱性データベース3に格納されるデータについては後に詳述する。表示装置4は、例えば液晶モニタ等の表示画面を有する装置である。
入出力インタフェース14の入力部は、パラメータデータベース2および脆弱性データベース3から入力された信号を演算装置11で演算可能なデータに変換する。また、入出力インタフェース14の出力部は、演算装置11での演算結果に応じた出力用の信号を生成し、その信号を表示装置4に出力する。
図2は、第1実施形態に係る診断装置1の機能構成を示すブロック図である。診断装置1は、時刻入力部41、瞬間故障確率算出部42、瞬間攻撃確率算出部43、確率調整部44、判別部45、および出力部46を備える。時刻入力部41は、瞬間故障確率算出部42および瞬間攻撃確率算出部43に診断時刻を入力する。瞬間故障確率算出部42は、診断時刻における診断対象機器の瞬間故障確率を算出する。瞬間攻撃確率算出部43は、診断時刻における診断対象機器の瞬間攻撃確率を算出する。確率調整部44は、瞬間故障確率および瞬間攻撃確率を同次元化する調整を実施する。判別部45は、確率調整部44により調整された瞬間故障確率および瞬間攻撃確率を用いて、診断対象機器へのサイバー攻撃の可能性の有無、および、診断対象機器の故障の可能性の有無を判別する。出力部46は、判別部45による判別の結果を表示装置4に出力し、その内容をユーザに報知する。
パラメータデータベース2には、形状パラメータ21、尺度パラメータ22、および位置パラメータ23が格納される。また、脆弱性データベース3には、公開日データ31、および機器データ32が格納される。これらのデータについては当該データを使用する処理と合わせて説明する。
診断装置1による診断対象機器の診断は、瞬間故障確率算出処理、瞬間攻撃確率算出処理、確率調整処理、および判別処理により実現される。以下、これらの処理について順に説明する。
[瞬間故障確率算出処理]
図3は、瞬間故障確率算出部42が実行する瞬間故障確率算出処理のフローチャートである。ステップS100において、時刻入力部41が瞬間故障確率算出部42に診断時刻を入力する。ステップS110において、瞬間故障確率算出部42がパラメータデータベース2から形状パラメータ21、尺度パラメータ22、および位置パラメータ23を取得する。これらの各パラメータは、診断対象機器の過去の故障回数や故障に至るまでの時間に応じて、あらかじめ決まった値が設定される。ステップS120において、瞬間故障確率算出部42が故障密度関数f(t)に形状パラメータ21、尺度パラメータ22、および位置パラメータ23を代入する。
図3は、瞬間故障確率算出部42が実行する瞬間故障確率算出処理のフローチャートである。ステップS100において、時刻入力部41が瞬間故障確率算出部42に診断時刻を入力する。ステップS110において、瞬間故障確率算出部42がパラメータデータベース2から形状パラメータ21、尺度パラメータ22、および位置パラメータ23を取得する。これらの各パラメータは、診断対象機器の過去の故障回数や故障に至るまでの時間に応じて、あらかじめ決まった値が設定される。ステップS120において、瞬間故障確率算出部42が故障密度関数f(t)に形状パラメータ21、尺度パラメータ22、および位置パラメータ23を代入する。
故障密度関数f(t)は、時間の経過に対する診断対象機器の故障確率を表す関数である。すなわち故障密度関数f(t)は、時間変化する確率分布を表す関数である。故障密度関数f(t)は、ハザード関数h(t)と信頼度関数R(t)の積で表現される。ここで変数tは診断対象機器の稼働時間を表し、t=0は診断対象機器が稼働を開始した時刻に対応する。ハザード関数h(t)は、診断対象機器が時刻tまでに実際に故障したことがあるか否かに関係なく、時刻tの時点で診断対象機器に故障が発生する確率を表す関数である。換言すると、ハザード関数h(t)は、診断対象機器が時刻tまで故障しなかったという条件のもとで、その時刻に診断対象機器が故障する条件付き確率密度である。形状パラメータ21をm、尺度パラメータ22をn、位置パラメータ23をΓという記号でそれぞれ表すと、ハザード関数h(t)は次式(1)で表される。
h(t)=m/n・{(t-Γ)/n}^(m-1) ・・・(1)
信頼度関数R(t)は、診断対象機器に時刻tまで故障が起こらない確率を表す関数であり、次式(2)で表される。
R(t)=Exp{-(t-Γ/n)^m} ・・・(2)
故障密度関数f(t)は、診断対象機器に時刻tで最初に故障が起こる確率を表す関数であり、次式(3)で表される。
f(t)=h(t)・R(t) ・・・(3)
故障密度関数f(t)は、例えばワイブル分布のように、一般に時間経過に伴い下に凸の関数となる。
h(t)=m/n・{(t-Γ)/n}^(m-1) ・・・(1)
信頼度関数R(t)は、診断対象機器に時刻tまで故障が起こらない確率を表す関数であり、次式(2)で表される。
R(t)=Exp{-(t-Γ/n)^m} ・・・(2)
故障密度関数f(t)は、診断対象機器に時刻tで最初に故障が起こる確率を表す関数であり、次式(3)で表される。
f(t)=h(t)・R(t) ・・・(3)
故障密度関数f(t)は、例えばワイブル分布のように、一般に時間経過に伴い下に凸の関数となる。
文字mで表した形状パラメータ21は、故障密度関数f(t)の時間経過に伴う増減、すなわち故障密度関数f(t)が表す確率分布の形状を定めるパラメータである。例えばm<1のとき、故障密度関数f(t)は時間経過に従って減少する形状となる。またm>1のとき、故障密度関数f(t)は時間経過に従って増加する形状となる。またm=0のとき、故障確率は時間経過によらず一定になる。文字nで表した尺度パラメータ22は、故障密度関数f(t)の大小、すなわち故障密度関数f(t)が表す確率分布の尺度を定めるパラメータである。例えばn=1の時の故障密度関数f(t)の最大値は、n=2の時の故障密度関数f(t)の最大値の2倍となる。文字Γで表した位置パラメータ23は、故障密度関数f(t)の位相、すなわち故障密度関数f(t)が表す確率分布の位置を定めるパラメータである。例えばΓ=2の時の故障密度関数f(t)の横軸上の初期位置は、Γ=0の時の故障密度関数f(t)の初期位置と比べ2だけ平行移動している。
図3のステップS120において、瞬間故障確率算出部42が上式(3)の故障密度関数f(t)に形状パラメータ21、尺度パラメータ22、および位置パラメータ23を代入する。続くステップS130において瞬間故障確率算出部42は、各パラメータを代入した後の故障密度関数f(t)と診断時刻とを用いて、瞬間故障確率を算出する。次式(4)のように定義される累積故障分布関数F(t)を導入する。
F(t)=∫f(t)dt ・・・(4)
診断時刻をt1とすると、瞬間故障確率算出部42は累積故障分布関数F(t)をt=0からt=t1まで時間積分することにより瞬間故障確率を算出する。
F(t)=∫f(t)dt ・・・(4)
診断時刻をt1とすると、瞬間故障確率算出部42は累積故障分布関数F(t)をt=0からt=t1まで時間積分することにより瞬間故障確率を算出する。
[瞬間攻撃確率算出処理]
図4は、瞬間攻撃確率算出部43が実行する瞬間攻撃確率算出処理のフローチャートである。ステップS200において、時刻入力部41が瞬間攻撃確率算出部43に診断時刻を入力する。ステップS210において、瞬間攻撃確率算出部43が脆弱性データベース3から公開日データ31および機器データ32を取得する。
図4は、瞬間攻撃確率算出部43が実行する瞬間攻撃確率算出処理のフローチャートである。ステップS200において、時刻入力部41が瞬間攻撃確率算出部43に診断時刻を入力する。ステップS210において、瞬間攻撃確率算出部43が脆弱性データベース3から公開日データ31および機器データ32を取得する。
脆弱性データベース3は、診断対象機器を構成するソフトウェアやハードウェアの脆弱性情報を保持する。公開日データ31は、診断対象機器に関連するソフトウェアやハードウェアの脆弱性情報が公開された日付を示す。機器データ32は、診断対象機器のネットワーク接続情報や診断対象機器の内部で保持および使用しているプログラム情報を示す。これらのデータは、例えば各国のセキュリティ関連団体が公開している脆弱性情報をインターネットなどを用いて予め収集して設定される。例えば、共通脆弱性評価システムとして知られるCVSS(Common Vulnerability Scoring System)に基づき公表されている脆弱性情報から公開日データ31を生成して脆弱性データベース3に格納する。また、そのような脆弱性情報を機器データ32と比較することで、診断対象機器に影響のある脆弱性を特定することができる。
ステップS220において、瞬間攻撃確率算出部43が診断対象機器のセキュリティ評価値を算出する。セキュリティ評価値は、診断対象機器のサイバー攻撃に対するリスクの高さを表す数値であり、例えば診断対象機器のサイバー攻撃への耐性が高いほど、診断対象機器がサイバー攻撃を受けたときの被害が大きいほど、その値は大きくなるように設定する。
第1実施形態の瞬間攻撃確率算出部43は、セキュリティ評価値Riskを次式(5)により算出する。
Risk=Impact・Likelihood ・・・(5)
ここで、Impactは、診断対象機器への影響度合い(影響の大きさ)を表し、Likelihoodは、診断対象機器への攻撃容易性を表している。
Risk=Impact・Likelihood ・・・(5)
ここで、Impactは、診断対象機器への影響度合い(影響の大きさ)を表し、Likelihoodは、診断対象機器への攻撃容易性を表している。
例えば、前述したCVSSでは脆弱性公開日におけるセキュリティ評価値を脆弱性そのものの基本特性から以下のように定めている。脆弱性そのものの基本特性には、攻撃容易性を測るものとして、脆弱性のあるコンポーネントをどこから攻撃可能であるかの指標である攻撃元区分X、脆弱性のあるコンポーネントを攻撃する際に必要な条件の複雑さの指標であるY、脆弱性のあるコンポーネントを攻撃する際に必要な特権レベルZ、脆弱性のあるコンポーネントを攻撃する際に必要なユーザ関与レベルWがある。また、診断対象機器への影響度合を測るものとして、機密性への影響レベルCや完全性への影響I、可用性への影響Aがある。
ここでImpactは可用性A、完全性I、機密性Cを用いて次式(6)のように表すことができる。
Impact=1-(1-A)×(1-I)×(1-C) ・・・(6)
またLikelihoodは、攻撃元区分X、攻撃条件の複雑さY、必要な特権レベルZ、必要なユーザ関与レベルWを用いて、次式(7)のように表すことができる。
Likelihood=8.22×X×Y×Z×W ・・・(7)
式(5)に式(6)と式(7)を代入し、セキュリティ評価値Riskを算出する次式(8)を得る。
Risk=(1-(1-A)×(1-I)×(1-C))×8.22×X×Y×Z×W ・・・(8)
図4のステップS220において、瞬間攻撃確率算出部43は、式(8)を用いてセキュリティ評価値Riskを算出する。
Impact=1-(1-A)×(1-I)×(1-C) ・・・(6)
またLikelihoodは、攻撃元区分X、攻撃条件の複雑さY、必要な特権レベルZ、必要なユーザ関与レベルWを用いて、次式(7)のように表すことができる。
Likelihood=8.22×X×Y×Z×W ・・・(7)
式(5)に式(6)と式(7)を代入し、セキュリティ評価値Riskを算出する次式(8)を得る。
Risk=(1-(1-A)×(1-I)×(1-C))×8.22×X×Y×Z×W ・・・(8)
図4のステップS220において、瞬間攻撃確率算出部43は、式(8)を用いてセキュリティ評価値Riskを算出する。
ステップS230において、瞬間攻撃確率算出部43が攻撃密度関数a(t)を決定する。攻撃密度関数a(t)は、時刻tで最初にサイバー攻撃を受ける確率を表す関数である。すなわち攻撃密度関数a(t)は、時間変化する確率分布を表す関数である。攻撃密度関数a(t)は、故障密度関数f(t)とは個別に(独立に)設定されるので、通常、両者には相関がない。換言すると、攻撃密度関数a(t)および故障密度関数f(t)は、それぞれ異なる確率分布を表す関数である。瞬間攻撃確率算出部43は、前述したセキュリティ評価値をパラメータとして持つ確率分布を想定し、その確率分布を表す攻撃密度関数a(t)を決定する。例えば攻撃密度関数a(t)は、時間に対して上に凸の関数や単調に減少する関数などであり、そのような関数としてはガウス分布などが挙げられる。
第1実施形態の瞬間攻撃確率算出部43は、次式(9)で表現される攻撃密度関数a(t)を用いる。
a(t)=1/√(2πσexp{-(t-μ)^2/2σ^2}) ・・・(9)
ここでμは平均を、σは標準偏差を、2σ^2は分散を表す。
a(t)=1/√(2πσexp{-(t-μ)^2/2σ^2}) ・・・(9)
ここでμは平均を、σは標準偏差を、2σ^2は分散を表す。
ステップS240において瞬間攻撃確率算出部43は、ステップS200で入力された診断時刻とステップS230で決定した攻撃密度関数a(t)とを用いて、瞬間攻撃確率を算出する。次式(10)のように定義される累積攻撃分布関数A(t)を導入する。
A(t)=∫a(t)dt ・・・(10)
診断時刻をt1とすると、瞬間攻撃確率算出部43は累積攻撃分布関数A(t)をt=0からt=t1まで時間積分することにより瞬間攻撃確率を算出する。
A(t)=∫a(t)dt ・・・(10)
診断時刻をt1とすると、瞬間攻撃確率算出部43は累積攻撃分布関数A(t)をt=0からt=t1まで時間積分することにより瞬間攻撃確率を算出する。
[確率調整処理]
図5は、確率調整部44が実行する確率調整処理のフローチャートである。確率調整処理において確率調整部44は、診断時刻における故障とサイバー攻撃それぞれの確率分布を同次元化して比較可能にする。第1実施形態では、異なる確率分布を同次元化する方法として、確率距離尺度を用いる方法を採用している。
図5は、確率調整部44が実行する確率調整処理のフローチャートである。確率調整処理において確率調整部44は、診断時刻における故障とサイバー攻撃それぞれの確率分布を同次元化して比較可能にする。第1実施形態では、異なる確率分布を同次元化する方法として、確率距離尺度を用いる方法を採用している。
ステップS300において確率調整部44は、瞬間故障確率算出部42が瞬間故障確率算出処理で導出した累積故障分布関数F(t)と、瞬間攻撃確率算出部43が瞬間攻撃確率算出処理で導出した累積攻撃分布関数A(t)と、を取得する。ステップS310において確率調整部44は、累積故障分布関数F(t)と累積攻撃分布関数A(t)との間の確率距離尺度を算出する。
確率距離尺度は、例えばカルバック&ライブラー情報量など、異なる確率分布(例えばワイブル分布とガウス分布)間の距離を意味する。確率距離尺度DKLは次式(11)により算出される。
DKL(F(t)||A(t))=∫F(t)log{A(t)/F(t)}dt ・・・(11)
このように、第1実施形態では確率距離尺度としてカルバック&ライブラー情報量を採用する。
DKL(F(t)||A(t))=∫F(t)log{A(t)/F(t)}dt ・・・(11)
このように、第1実施形態では確率距離尺度としてカルバック&ライブラー情報量を採用する。
ステップS320において確率調整部44は、診断時刻における調整後瞬間故障確率および調整後瞬間攻撃確率を算出する。確率調整部44は、診断時刻における瞬間故障確率(図3のステップS130で算出した値)にステップS310で算出した確率距離尺度を乗算し、調整後瞬間故障確率とする。同様に確率調整部44は、診断時刻における瞬間攻撃確率(図4のステップS240で算出した値)にステップS310で算出した確率距離尺度を乗算し、調整後瞬間攻撃確率とする。
例えば、調整後瞬間故障確率をF’(t)、調整後瞬間攻撃確率をA’(t)とすると、調整後瞬間故障確率および調整後瞬間攻撃確率は次式(12)、(13)により算出できる。
F’(t)=DKL(F(t)||A(t))・F(t) ・・・(12)
A’(t)=DKL(F(t)||A(t))・A(t) ・・・(13)
ステップS320で調整後瞬間故障確率F’(t)、および調整後瞬間攻撃確率A’(t)が算出されると、処理がステップS330に進む。
F’(t)=DKL(F(t)||A(t))・F(t) ・・・(12)
A’(t)=DKL(F(t)||A(t))・A(t) ・・・(13)
ステップS320で調整後瞬間故障確率F’(t)、および調整後瞬間攻撃確率A’(t)が算出されると、処理がステップS330に進む。
ステップS330において確率調整部44は、ステップS320で算出した診断時刻t1における調整後瞬間故障確率F’(t)および調整後瞬間攻撃確率A’(t)を判別部45に出力する。
図6は、調整後瞬間故障確率F’(t)および調整後瞬間攻撃確率A’(t)を例示するグラフである。図6において、符号62が調整後瞬間故障確率F’(t)を、符号63が調整後瞬間攻撃確率A’(t)を、それぞれ表す。図6において、横軸は経過時間tを表し縦軸は経過時間におけるそれぞれの確率を表す。図6では、横軸の経過時間tを初期運用、中期運用、最終運用の3つのフェイズに区切っている。これは、診断対象機器を導入し運用を開始してからのフェイズをそれぞれ意味している。すなわち、初期運用フェイズは診断対象機器の稼働直後からしばらくの間を、中期運用フェイズは運用が軌道に乗ってからしばらくの間を、最終運用フェイズは運用の終盤をそれぞれ表している。符号60は診断対象機器に脆弱性が発覚した日時を表し、符号61は診断装置1による診断を行った時刻(診断時刻t1)を表す。符号64は診断時刻における調整後瞬間故障確率F’(t)を、符号65は診断時刻における調整後瞬間攻撃確率A’(t)をそれぞれ表す。例えば図6では、診断時刻t1において、調整後瞬間故障確率F’(t)=0.3であり、調整後瞬間攻撃確率A’(t)=0.2である。
[判別処理]
図7は、判別部45が実行する判別処理のフローチャートである。判別部45は、確率調整部44が出力する調整後瞬間故障確率F’(t)および調整後瞬間攻撃確率A’(t)を所定のしきい値f、aとそれぞれ比較することにより、故障およびサイバー攻撃の有無を出力する。所定のしきい値fは故障密度関数f(t)に基づく値であり、所定のしきい値aは攻撃密度関数a(t)に基づく値である。これらのしきい値f、aは、例えば故障密度関数f(t)や攻撃密度関数a(t)の最頻値、平均値、中央値などの統計値であってもよいし、それらの統計値とは別に診断装置1の設計者が指定する値であってもよい。
図7は、判別部45が実行する判別処理のフローチャートである。判別部45は、確率調整部44が出力する調整後瞬間故障確率F’(t)および調整後瞬間攻撃確率A’(t)を所定のしきい値f、aとそれぞれ比較することにより、故障およびサイバー攻撃の有無を出力する。所定のしきい値fは故障密度関数f(t)に基づく値であり、所定のしきい値aは攻撃密度関数a(t)に基づく値である。これらのしきい値f、aは、例えば故障密度関数f(t)や攻撃密度関数a(t)の最頻値、平均値、中央値などの統計値であってもよいし、それらの統計値とは別に診断装置1の設計者が指定する値であってもよい。
ステップS400において判別部45は、調整後瞬間故障確率F’(t)の値をしきい値fと比較する。調整後瞬間故障確率F’(t)の値がしきい値f以上である場合、処理はステップS410に進む。ステップS410において判別部45は、調整後瞬間攻撃確率A’(t)の値をしきい値aと比較する。調整後瞬間攻撃確率A’(t)の値がしきい値a以上である場合、処理はステップS420に進む。ステップS420において判別部45は、故障およびサイバー攻撃の両方が同時に生じた可能性が高いと判別する。ステップS410において調整後瞬間攻撃確率A’(t)の値がしきい値a未満である場合、処理はステップS430に進む。ステップS430において判別部45は、故障が生じた可能性が高いと判別する。ステップS400において調整後瞬間故障確率F’(t)の値がしきい値f未満である場合、処理はステップS440に進む。ステップS440において判別部45は、調整後瞬間攻撃確率A’(t)の値をしきい値aと比較する。調整後瞬間攻撃確率A’(t)の値がしきい値a以上である場合、処理はステップS450に進む。ステップS450において判別部45は、サイバー攻撃が生じた可能性が高いと判別する。ステップS440において調整後瞬間攻撃確率A’(t)の値がしきい値a未満である場合、処理はステップS460に進む。ステップS460において判別部45は、故障が生じた可能性もサイバー攻撃が生じた可能性もいずれも低い、すなわち診断対象機器は正常な状態であると判別する。
例えば、設計者によりf=0.4、a=0.3というしきい値が与えられており、図6に示すように調整後瞬間故障確率F’(t)=0.3、調整後瞬間攻撃確率A’(t)=0.2である場合を考える。この場合、ステップS400で調整後瞬間故障確率F’(t)がしきい値f未満であるためステップS440に進み、調整後瞬間攻撃確率A’(t)がしきい値a未満であるためステップS460に進む。その結果、判別部45は診断対象機器が正常な状態である(故障も生じていないしサイバー攻撃も受けていない)と判別する。
図8は、表示装置4の表示画面を例示する模式図である。出力部46は、判別部45による判別の結果、すなわち診断結果を表示装置4に出力する。表示装置4は、この診断結果に基づき、図8に例示するような画面を表示する。
表示装置4の表示画面には、診断日時表示領域90、診断結果表示領域91、診断結果詳細表示領域92、診断グラフ表示領域93、および再診断ボタン94が設けられる。診断日時表示領域90は、診断を実施した日時(診断時刻t1)を表示する。診断結果表示領域91は、診断対象機器の診断結果を表示する領域である。診断結果表示領域91には、診断結果が正常、故障、攻撃(サイバー攻撃)、故障&攻撃、のいずれかの形で表示される。診断結果詳細表示領域92は、診断結果表示領域91に表示される結果の内訳(詳細)を表示する領域である。診断グラフ表示領域93は、診断時刻までの故障確率分布および攻撃確率分布を表示するものであり、例えば図6に例示したグラフのように確率分布が表示されるものとする。再診断ボタン94は、再診断を実行するためのボタンである。再診断ボタン94を押すことで、ボタンが押された時刻における診断対象機器の診断が再度実行され、再診断の結果を表示装置4の表示画面に表示することができる。
上述した第1実施形態によれば、次の作用効果を奏する。
(1)瞬間攻撃確率算出部43(演算装置)が診断対象機器に対して診断時刻(所定の時刻)にサイバー攻撃が実施された確率である瞬間攻撃確率を算出し、瞬間故障確率算出部42(演算装置)が診断対象機器において診断時刻(所定の時刻)に故障が生じた確率である瞬間故障確率を算出する。その後、判別部45(演算装置)が、瞬間攻撃確率と瞬間故障確率とに基づき、診断時刻(所定の時刻)における、診断対象機器に対するサイバー攻撃の有無および診断対象機器における故障の有無を判定する。このようにしたので、サイバー攻撃の有無および機器の故障の有無を適切に判別できる。また、瞬間攻撃確率と瞬間故障確率は別々に算出され、お互いに相関がないので、一方が他方に影響されることがなく、サイバー攻撃の確率と故障の確率とを独立に判断することができる。
(2)判別部45(演算装置)は、瞬間攻撃確率および瞬間故障確率をそれぞれ所定の閾値と比較することにより、診断対象機器に対するサイバー攻撃の有無および診断対象機器における故障の有無を判定する。このようにしたので、サイバー攻撃の有無と故障の有無とを、一方が他方に影響されることなく独立に判断することができる。
(3)瞬間攻撃確率算出部43(演算装置)は、時間変化する確率分布を表した攻撃密度関数a(t)(第1の確率分布)を用いて瞬間攻撃確率を算出する。また、瞬間故障確率算出部42(演算装置)は、時間変化する確率分布を表し攻撃密度関数a(t)(第1の確率分布)とは異なる故障密度関数f(t)(第2の確率分布)を用いて瞬間故障確率を算出する。このようにしたので、サイバー攻撃の有無と故障の有無とを、一方が他方に影響されることなく独立に判断することができる。
(4)瞬間故障確率算出部42(演算装置)は、診断対象機器が故障する確率の確率分布の形状、尺度、および位置の特徴を表す形状パラメータ21、尺度パラメータ22、および位置パラメータ21の少なくとも一つを用いて瞬間故障確率を算出する。このようにしたので、診断対象機器の故障の有無を精度よく判別することが可能になる。
(5)瞬間攻撃確率算出部43(演算装置)は、診断対象機器を構成するハードウェアまたはソフトウェアに関連する脆弱性データベース3(脆弱性情報)を用いて瞬間攻撃確率を算出する。このようにしたので、診断対象機器へのサイバー攻撃の有無を精度よく判別することが可能になる。
(6)確率調整部44(演算装置)は、瞬間攻撃確率および瞬間故障確率を同次元化する調整を行う。このようにしたので、瞬間攻撃確率および瞬間故障確率をそれぞれ比較するしきい値を共通の尺度で決定することができ、しきい値の設定が簡便になる。
(7)出力部46(演算装置)は、判別部45(演算装置)により判定された診断対象機器に対するサイバー攻撃の有無、および、判別部45(演算装置)により判定された診断対象機器における故障の有無を表示装置4に表示させる。このようにしたので、診断装置1の使用者が診断結果を的確に把握することが可能になる。
<第2実施形態>
図9~図11を参照して、本発明の第2実施形態に係る診断装置について説明する。なお、第1実施形態で説明した構成と同一もしくは相当する構成には同一の参照記号を付し、相違点を主に説明する。
図9~図11を参照して、本発明の第2実施形態に係る診断装置について説明する。なお、第1実施形態で説明した構成と同一もしくは相当する構成には同一の参照記号を付し、相違点を主に説明する。
図9は、図2と同様の図であり、第2実施形態に係る診断装置100の機能構成を示すブロック図である。診断装置100は、第1実施形態に係る診断装置1の各部に加えて、保守リスク評価値算出部47を備える。保守リスク評価値算出部47は、診断対象機器の保守に関連するリスクを定量化した数値である保守リスク評価値を算出する。診断装置100には、第1実施形態と同様のパラメータデータベース2および脆弱性データベース3に加えて、保守点検データベース5が接続される。
保守点検データベース5は、保守点検データ51、保守員データ52、および操作ログデータ53を格納する。保守点検データ51は、例えば保守員による診断対象機器の保守点検日や点検場所に関する情報である。保守員データ52は、例えば保守員の年齢、勤務年数といった保守員自身に関する情報である。操作ログデータ53は、例えば保守時間や操作コマンド数に関する情報である。
保守リスク評価値算出部47による保守リスク評価値の算出方法の一例を説明する。保守リスク評価値Lは次式(14)のように表される。
L=T・C ・・・(14)
ここで、Tは規定操作時間に対する実際の操作時間の割合を表し、Cは規定操作コマンド数に対する実際の操作コマンド数の割合を表している。
L=T・C ・・・(14)
ここで、Tは規定操作時間に対する実際の操作時間の割合を表し、Cは規定操作コマンド数に対する実際の操作コマンド数の割合を表している。
操作時間の割合Tや操作コマンド数の割合Cの値を所定の値と比較することで、保守員の操作への精通の度合を定量的に測ることができる。例えば、Cが1より大きい場合、その保守員は保守操作に精通していないと判定したり、Cが1未満であれば保守操作に精通していると判定したりすることができる。また、Tについても同様に、Tが1より大きい場合、その保守員は保守操作に精通していないと判定したり、Tが1未満であれば保守操作に精通していると判定したりすることができる。
なお、保守員が保守操作に精通しているか否かの判別は、上述したルールベースの指標の他に、保守員データ52に含まれる保守員の年齢、勤務年数や、操作ログデータ53に含まれる操作時間などを入力データセットとする機械学習により行うことも可能である。
図10は、図4と同様の図であり、瞬間攻撃確率算出部43が実行する瞬間攻撃確率算出処理のフローチャートである。図10のフローチャートでは、図4のフローチャートのステップS220とステップS230の間に、ステップS225の処理が追加されている。ステップS225において瞬間攻撃確率算出部43は、ステップS220で決定したセキュリティ評価値に対して、保守リスク評価値算出部47が算出した保守リスク評価値を合算する。これにより、これ以降のセキュリティ評価値を対象とする処理は、保守リスク評価値を加味した処理となる。
式(5)に示した通り、セキュリティ評価値は診断対象機器への影響度合い(影響の大きさ)Impact、診断対象機器への攻撃容易性Likelihoodにより決定される。保守リスク評価値はそれらの値のうち攻撃容易性Likelihoodに反映される。式(7)に示した通り、Likelihoodは攻撃元区分X、攻撃条件の複雑さY、必要な特権レベルZ、必要なユーザ関与レベルWに基づく値である。瞬間攻撃確率算出部43は、攻撃元区分Xや必要な特権レベルZの値を保守リスク評価値に応じで変動させることにより、保守リスク評価値をセキュリティ評価値に合算(反映)する。例えば、保守リスク評価値が大きいほど攻撃元区分Xや必要な特権レベルZの値を上げたり、保守リスク評価値が小さいほど攻撃元区分Xや必要な特権レベルZの値を下げたりする。
なお、保守リスク評価値をセキュリティ評価値に合算する方法は上述の方法に限定されない。例えば保守リスク評価値をセキュリティリスク評価値のように同じ10段階で評価し、セキュリティリスク評価値に足し合わせるようにしてもよい。
図11は、図6と同様の図であり、調整後瞬間故障確率F’(t)および調整後瞬間攻撃確率A’(t)を例示するグラフである。符号1360は調整後瞬間故障確率F’(t)を、符号1370は調整後瞬間攻撃確率A’(t)を、それぞれ表す。図11において、横軸は経過時間tを表し縦軸は経過時間におけるそれぞれの確率を表す。符号1300は診断対象機器に脆弱性が発覚した日時を表し、符号1310は診断装置1による診断を行った時刻(診断時刻t1)を表す。符号1330は診断時刻における保守リスク評価値を加味しない調整後瞬間攻撃確率A’(t)を表し、符号1340は診断時刻における保守リスク評価値を加味した調整後瞬間攻撃確率A’(t)を表す。符号1350は診断時刻における調整後瞬間故障確率F’(t)を表す。
調整後瞬間攻撃確率A’(t)は、従来のセキュリティ要素に起因するもの以外に、保守員による保守点検作業にも起因して変動する。例えば図6においては、診断時刻における調整後瞬間攻撃確率A’(t)=0.2であるケースを考えたが、図11においてはA’(t)=0.3となるケースを考える。これは、脆弱性要因に加え、保守要因が調整後瞬間攻撃確率A’(t)に反映されたことを考慮するためである。この保守要因が反映された調整後瞬間攻撃確率A’(t)において、例えば、A’(t)=0.3、しきい値a=0.2の場合の出力結果を考える。ただし、調整後瞬間故障確率F’(t)=0.3およびしきい値f=0.4は図6と同様とする。このとき判別部45は、まずF’(t)がfより小さいことから故障の可能性は低いと判別する。その後、判別部45は、A’(t)がa以上であることからサイバー攻撃の可能性が高いと判別する。これにより診断結果はサイバー攻撃の可能性が高い、ということになる。このように、保守リスク評価値が加味されたことにより調整後瞬間攻撃確率A’(t)の値が大きくなり、その結果、図6で説明した内容から診断結果が変化している。
上述した第2実施形態によれば、次の作用効果を奏する。
(1)瞬間攻撃確率算出部43(演算装置)は、診断対象機器の保守点検に関する情報である保守点検データ51、診断対象機器の保守点検を行う保守員に関する情報である保守員データ52、および診断対象機器の保守点検において成された操作の操作ログに関する情報である操作ログデータ53の少なくとも一つに基づく保守リスク評価値を用いて瞬間攻撃確率を算出する。このようにすることで、診断対象機器のライフサイクルを加味した診断ができるようになる。
<第3実施形態>
図12および図13を参照して、本発明の第3実施形態に係る診断装置について説明する。なお、第1実施形態で説明した構成と同一もしくは相当する構成には同一の参照記号を付し、相違点を主に説明する。
図12および図13を参照して、本発明の第3実施形態に係る診断装置について説明する。なお、第1実施形態で説明した構成と同一もしくは相当する構成には同一の参照記号を付し、相違点を主に説明する。
図12は、図2と同様の図であり、第3実施形態に係る診断装置200の機能構成を示すブロック図である。診断装置200には、第1実施形態と同様のパラメータデータベース2および脆弱性データベース3に加えて、物理情報データベース7およびアクセス情報データベース8が接続される。
物理情報データベース7には、温度データ71、湿度データ72、および振動データ73が格納される。温度データ71は、例えば診断対象機器が高温下で稼働している、あるいは冷却下で稼働している、といった診断対象機器の環境の温度に関するデータである。湿度データ72は、例えば診断対象機器が設置されている環境が多湿あるいは低湿である、といった診断対象機器の環境の湿度に関するデータである。振動データ73は、例えば診断対象機器が設置されている環境の振動の大きさに関するデータである。なお、これら以外にも、例えば、診断対象機器の環境の風(風量および風速)、放射能、塵などに関するデータを物理情報データベース7に格納してもよい。
アクセス情報データベース8には、物理アクセスデータ81およびネットワークデータ82が格納される。物理アクセスデータ81は、診断対象機器の設置場所のセキュリティ状況に関するデータ、すなわち、診断対象機器が設置されている環境の物理的な安全性を示すデータであり、例えば診断対象機器の設置されている部屋が施錠されている、あるいは特定の人物しか入室できないような物理的セキュリティが構築されている、診断対象機器がワイヤーロック等で固定されている、といったデータである。ネットワークデータ82は、診断対象機器に外部からネットワーク経由でアクセスする経路のセキュリティ状況に関するデータ、すなわち、外部から診断対象機器への侵入のしやすさを示すデータであり、例えば診断対象機器のデバックポートの情報やシェル情報、ネットワーク通信に用いるポート情報などである。
第3実施形態の瞬間故障確率算出部42は、パラメータデータベース2内の各種パラメータだけではなく、物理情報データベース7内の各種データをも用いて瞬間故障確率を算出する。第3実施形態の瞬間攻撃確率算出部43は、脆弱性データベース3内の各種データだけではなく、アクセス情報データベース8内の各種データをも用いて瞬間攻撃確率を算出する。
図13は、図6と同様の図であり、調整後瞬間故障確率F’(t)および調整後瞬間攻撃確率A’(t)を例示するグラフである。符号1550は調整後瞬間故障確率F’(t)を、符号1540は調整後瞬間攻撃確率A’(t)を、それぞれ表す。図13において、横軸は経過時間tを表し縦軸は経過時間におけるそれぞれの確率を表す。符号1500は診断対象機器に脆弱性が発覚した日時を表し、符号1510は診断装置200による診断を行った時刻(診断時刻t1)を表す。符号1530は診断時刻における物理情報データベース7内の各種データを加味した調整後瞬間故障確率F’(t)を表し、符号1520は診断時刻におけるアクセス情報データベース8内の各種データを加味した調整後瞬間攻撃確率A’(t)を表す。
例えば図6においては、診断時刻における調整後瞬間故障確率F’(t)=0.3であるケースを考えたが、図13においては調整後瞬間故障確率F’(t)=0.45となるケースを考える。また図6においては、診断時刻における調整後瞬間攻撃確率A’(t)=0.2であるケースを考えたが、図13においてはA’(t)=0.25となるケースを考える。これらは、診断対象機器に対する物理的要因(物理情報データベース7内の各種データ)の影響が大きい一方、診断対象機器に対する外部アクセスによるセキュリティ要因(アクセス情報データベース8内の各種データ)が少ないことを意味する。このように、確率分布自体に物理的要因および外部アクセスによるセキュリティ要因に基づくバイアスをかけることで、より正確な診断を実施できる。
例えば、F’(t)=0.45、しきい値f=0.4、A’(t)=0.25、しきい値a=0.35の場合の出力結果を考える。このとき判別部45は、まずF’(t)がf以上であることから故障の可能性が高いと判別する。その後、判別部45は、A’(t)がa未満であることからサイバー攻撃の可能性は低いと判別する。これにより診断結果は故障の可能性が高い、ということになる。このように、物理的要因や外部アクセスによるセキュリティ要因が加味されたことにより、図6で説明した内容から診断結果が変化している。
上述した第3実施形態によれば、次の作用効果を奏する。
(1)瞬間故障確率算出部42(演算装置)は、診断対象機器が稼働する物理環境の温度、湿度、振動、風、放射能、塵のうち少なくとも一つに関する情報である物理情報データベース7を用いて瞬間故障確率を算出する。このようにしたので、瞬間故障確率の精度が向上し、故障の有無をより正確に診断することができる。
(2)瞬間攻撃確率算出部43(演算装置)は、診断対象機器の設置場所のセキュリティ状況に関する情報である物理アクセスデータ81、および診断対象機器に外部からネットワーク経由でアクセスする経路のセキュリティ状況に関する情報であるネットワークデータ82を用いて瞬間攻撃確率を算出する。物理アクセスデータ81およびネットワークデータ82のうち少なくとも一つの情報を用いて瞬間攻撃確率を算出ことで、算出される瞬間攻撃確率の精度が向上し、サイバー攻撃の有無をより正確に診断することができる。
次のような変形例も本発明の範囲内であり、変形例に示す構成と上述の実施形態で説明した構成を組み合わせたり、上述の異なる実施形態で説明した構成同士を組み合わせたり、以下の異なる変形例で説明する構成同士を組み合わせることも可能である。
<変形例1>
累積故障分布関数F(t)は、式(4)で説明したものと異なっていてもよい。例えば故障密度関数f(t)ではなく、信頼度関数R(t)を用いて累積故障分布関数F(t)をしてもよい。この場合、累積故障分布関数F(t)は1-R(t)と定義し、瞬間故障確率は診断時刻t1を用いて1-R(t1)という形で算出すればよい。他にも、例えば、パラメータデータベース2内の各種パラメータと時間を変数として持つ関数を診断対象機器の特性から事前に算出しておき、診断時刻t1をその関数に代入し確率を算出するようにしてもよい。
累積故障分布関数F(t)は、式(4)で説明したものと異なっていてもよい。例えば故障密度関数f(t)ではなく、信頼度関数R(t)を用いて累積故障分布関数F(t)をしてもよい。この場合、累積故障分布関数F(t)は1-R(t)と定義し、瞬間故障確率は診断時刻t1を用いて1-R(t1)という形で算出すればよい。他にも、例えば、パラメータデータベース2内の各種パラメータと時間を変数として持つ関数を診断対象機器の特性から事前に算出しておき、診断時刻t1をその関数に代入し確率を算出するようにしてもよい。
<変形例2>
セキュリティ評価値Riskは、式(8)で説明したものと異なっていてもよい。例えば脆弱性そのものの基本特性以外に、現在の脆弱性の深刻度を加味したり、ユーザの利用環境を含めた最終的な脆弱性を用いてセキュリティ評価値Riskを算出してもよい。
セキュリティ評価値Riskは、式(8)で説明したものと異なっていてもよい。例えば脆弱性そのものの基本特性以外に、現在の脆弱性の深刻度を加味したり、ユーザの利用環境を含めた最終的な脆弱性を用いてセキュリティ評価値Riskを算出してもよい。
<変形例3>
上述の説明では、故障密度関数f(t)の例としてワイブル分布を、攻撃密度関数a(t)の例としてガウス分布を挙げたが、確率分布の種類はこれに限るものではない。他の確率分布を故障密度関数f(t)や攻撃密度関数a(t)として用いてもよい。
上述の説明では、故障密度関数f(t)の例としてワイブル分布を、攻撃密度関数a(t)の例としてガウス分布を挙げたが、確率分布の種類はこれに限るものではない。他の確率分布を故障密度関数f(t)や攻撃密度関数a(t)として用いてもよい。
<変形例4>
調整後瞬間故障確率F’(t)および調整後瞬間攻撃確率A’(t)の算出方法は、式(12)および式(13)で例示したものと異なっていてもよい。例えば、距離尺度を演算後、故障密度関数f(t)および攻撃密度関数a(t)に算出した距離尺度を乗算したものを時刻0から診断時刻t1までそれぞれ積分することにより、調整後瞬間故障確率F’(t)および調整後瞬間攻撃確率A’(t)を算出するようにしてもよい。また、上述の各実施形態では、式(11)に示した確率距離尺度を用いて瞬間故障確率と瞬間攻撃確率とを同次元化していたが、それ以外の方法で、瞬間故障確率と瞬間攻撃確率とを比較可能にしてもよい。
調整後瞬間故障確率F’(t)および調整後瞬間攻撃確率A’(t)の算出方法は、式(12)および式(13)で例示したものと異なっていてもよい。例えば、距離尺度を演算後、故障密度関数f(t)および攻撃密度関数a(t)に算出した距離尺度を乗算したものを時刻0から診断時刻t1までそれぞれ積分することにより、調整後瞬間故障確率F’(t)および調整後瞬間攻撃確率A’(t)を算出するようにしてもよい。また、上述の各実施形態では、式(11)に示した確率距離尺度を用いて瞬間故障確率と瞬間攻撃確率とを同次元化していたが、それ以外の方法で、瞬間故障確率と瞬間攻撃確率とを比較可能にしてもよい。
<変形例5>
上述した各種のデータベース(パラメータデータベース2、脆弱性データベース3、保守点検データベース5、物理情報データベース7、およびアクセス情報データベース8)に格納するデータは、上述したデータと異なっていてもよい。また、その利用方法についても、上述した各実施形態と異なっていてもよい。
上述した各種のデータベース(パラメータデータベース2、脆弱性データベース3、保守点検データベース5、物理情報データベース7、およびアクセス情報データベース8)に格納するデータは、上述したデータと異なっていてもよい。また、その利用方法についても、上述した各実施形態と異なっていてもよい。
以上、本発明の実施形態について説明したが、上記実施形態は本発明の適用例の一部を示したに過ぎず、本発明の技術的範囲を上記実施形態の具体的構成に限定する趣旨ではない。
1、100、200…診断装置、2…パラメータデータベース、3…脆弱性データベース、4…表示装置、5…保守点検データベース、7…物理情報データベース、8…アクセス情報データベース、11…演算装置、12…不揮発性メモリ、13…揮発性メモリ、14…入出力インタフェース、21…形状パラメータ、22…尺度パラメータ、23…位置パラメータ、31…公開日データ、32…機器データ、41…時刻入力部、42…瞬間故障確率算出部、43…瞬間攻撃確率算出部、44…確率調整部、45…判別部、46…出力部、47…保守リスク評価値算出部、51…保守点検データ、52…保守員データ、53…操作ログデータ、71…温度データ、72…湿度データ、73…振動データ、81…物理アクセスデータ、82…ネットワークデータ
Claims (11)
- 演算装置を備えた診断装置であって、
前記演算装置は、
診断対象機器に対して所定の時刻にサイバー攻撃が実施された確率である瞬間攻撃確率を算出し、
前記診断対象機器において前記所定の時刻に故障が生じた確率である瞬間故障確率を算出し、
前記瞬間攻撃確率と前記瞬間故障確率とに基づき、前記所定の時刻における、前記診断対象機器に対するサイバー攻撃の有無および前記診断対象機器における故障の有無を判定する、
診断装置。 - 請求項1に記載の診断装置において、
前記演算装置は、
前記瞬間攻撃確率および前記瞬間故障確率をそれぞれ所定の閾値と比較することにより、前記診断対象機器に対するサイバー攻撃の有無および前記診断対象機器における故障の有無を判定する診断装置。 - 請求項1に記載の診断装置において、
前記演算装置は、
時間変化する第1の確率分布を用いて前記瞬間攻撃確率を算出し、時間変化し前記第1の確率分布とは異なる第2の確率分布を用いて前記瞬間故障確率を算出する診断装置。 - 請求項1に記載の診断装置において、
前記演算装置は、
前記診断対象機器が故障する確率の確率分布の形状、尺度、および位置の特徴を表すパラメータの少なくとも一つを用いて前記瞬間故障確率を算出する診断装置。 - 請求項1に記載の診断装置において、
前記演算装置は、
前記診断対象機器を構成するハードウェアまたはソフトウェアに関連する脆弱性情報を用いて前記瞬間攻撃確率を算出する診断装置。 - 請求項1に記載の診断装置において、
前記演算装置は、
前記瞬間攻撃確率および前記瞬間故障確率を同次元化する調整を行う診断装置。 - 請求項1に記載の診断装置において、
前記演算装置は、
前記演算装置により判定された前記診断対象機器に対するサイバー攻撃の有無、および、前記演算装置により判定された前記診断対象機器における故障の有無を表示装置に表示させる診断装置。 - 請求項1に記載の診断装置において、
前記演算装置は、
前記診断対象機器の保守点検に関する情報、前記診断対象機器の保守点検を行う保守員に関する情報、および前記診断対象機器の保守点検において成された操作の操作ログに関する情報の少なくとも一つを用いて前記瞬間攻撃確率を算出する診断装置。 - 請求項1に記載の診断装置において、
前記演算装置は、
前記診断対象機器が稼働する物理環境の温度、湿度、振動、風、放射能、塵のうち少なくとも一つに関する情報を用いて前記瞬間故障確率を算出する診断装置。 - 請求項1に記載の診断装置において、
前記演算装置は、
前記診断対象機器の設置場所のセキュリティ状況に関する情報、および前記診断対象機器に外部からネットワーク経由でアクセスする経路のセキュリティ状況に関する情報のうち少なくとも一つの情報を用いて前記瞬間攻撃確率を算出する診断装置。 - 診断対象機器に対して所定の時刻にサイバー攻撃が実施された確率である瞬間攻撃確率を算出し、
前記診断対象機器において前記所定の時刻に故障が生じた確率である瞬間故障確率を算出し、
前記瞬間攻撃確率と前記瞬間故障確率とに基づき、前記所定の時刻における、前記診断対象機器に対するサイバー攻撃の有無および前記診断対象機器における故障の有無を判定する、
診断方法。
Applications Claiming Priority (2)
| Application Number | Priority Date | Filing Date | Title |
|---|---|---|---|
| JP2023096396A JP2024177952A (ja) | 2023-06-12 | 2023-06-12 | 診断装置および診断方法 |
| JP2023-096396 | 2023-06-12 |
Publications (1)
| Publication Number | Publication Date |
|---|---|
| WO2024257507A1 true WO2024257507A1 (ja) | 2024-12-19 |
Family
ID=93851976
Family Applications (1)
| Application Number | Title | Priority Date | Filing Date |
|---|---|---|---|
| PCT/JP2024/017050 Ceased WO2024257507A1 (ja) | 2023-06-12 | 2024-05-08 | 診断装置および診断方法 |
Country Status (2)
| Country | Link |
|---|---|
| JP (1) | JP2024177952A (ja) |
| WO (1) | WO2024257507A1 (ja) |
Citations (3)
| Publication number | Priority date | Publication date | Assignee | Title |
|---|---|---|---|---|
| JP2019061565A (ja) * | 2017-09-27 | 2019-04-18 | パナソニック インテレクチュアル プロパティ コーポレーション オブ アメリカPanasonic Intellectual Property Corporation of America | 異常診断方法および異常診断装置 |
| JP2019212143A (ja) * | 2018-06-07 | 2019-12-12 | 株式会社日立製作所 | 損害予測方法、損害予測システム及びプログラム |
| JP2020061717A (ja) * | 2018-10-12 | 2020-04-16 | 株式会社東芝 | 異常要因判定装置、制御システム、および異常要因判定方法 |
-
2023
- 2023-06-12 JP JP2023096396A patent/JP2024177952A/ja active Pending
-
2024
- 2024-05-08 WO PCT/JP2024/017050 patent/WO2024257507A1/ja not_active Ceased
Patent Citations (3)
| Publication number | Priority date | Publication date | Assignee | Title |
|---|---|---|---|---|
| JP2019061565A (ja) * | 2017-09-27 | 2019-04-18 | パナソニック インテレクチュアル プロパティ コーポレーション オブ アメリカPanasonic Intellectual Property Corporation of America | 異常診断方法および異常診断装置 |
| JP2019212143A (ja) * | 2018-06-07 | 2019-12-12 | 株式会社日立製作所 | 損害予測方法、損害予測システム及びプログラム |
| JP2020061717A (ja) * | 2018-10-12 | 2020-04-16 | 株式会社東芝 | 異常要因判定装置、制御システム、および異常要因判定方法 |
Also Published As
| Publication number | Publication date |
|---|---|
| JP2024177952A (ja) | 2024-12-24 |
Similar Documents
| Publication | Publication Date | Title |
|---|---|---|
| US11042647B1 (en) | Software assurance system for runtime environments | |
| Bodik et al. | Combining visualization and statistical analysis to improve operator confidence and efficiency for failure detection and localization | |
| CN116747528B (zh) | 一种游戏后台用户监管方法及系统 | |
| CN113544486A (zh) | 故障诊断系统、预测规则生成方法及预测规则生成程序 | |
| CN110489260A (zh) | 故障识别方法、装置及bmc | |
| CN118540144A (zh) | 一种基于区块链技术的网络信息安全预警方法及系统 | |
| CN114490829A (zh) | 一种故障识别方法、装置、设备及存储介质 | |
| TW202206955A (zh) | 廠房管理方法、廠房設計裝置以及廠房管理裝置 | |
| CN112769615A (zh) | 一种异常分析方法及装置 | |
| JP2024177952A (ja) | 診断装置および診断方法 | |
| JP7347953B2 (ja) | 機器予兆監視装置、および、機器予兆監視方法 | |
| CN110457349B (zh) | 信息流出的监控方法及监控装置 | |
| US20220342992A1 (en) | Authorising component updates | |
| KR102867874B1 (ko) | 화면 출력 기반 이상 상태 감지 방법 및 장치 | |
| CN116644484B (zh) | 一种计算机存储安全评估方法及系统 | |
| CN108014500B (zh) | 属性异常发现方法及装置 | |
| CN117493128A (zh) | 基于物联网的投影仪交互式管控方法及系统 | |
| US20240403159A1 (en) | Monitoring apparatus, monitoring method, and computer-readable storage medium | |
| JP7437163B2 (ja) | 診断装置、診断方法およびプログラム | |
| US20200081758A1 (en) | Probabilistic Metric for Random Hardware Failure | |
| WO2021034317A1 (en) | Authenticity verification | |
| CN114610560B (zh) | 系统异常监控方法、装置和存储介质 | |
| JP7840107B2 (ja) | 情報出力装置、情報出力方法、及び、プログラム | |
| JP7595823B1 (ja) | 情報処理装置、情報処理方法及び情報処理プログラム | |
| US9054995B2 (en) | Method of detecting measurements in service level agreement based systems |
Legal Events
| Date | Code | Title | Description |
|---|---|---|---|
| 121 | Ep: the epo has been informed by wipo that ep was designated in this application |
Ref document number: 24823129 Country of ref document: EP Kind code of ref document: A1 |
|
| NENP | Non-entry into the national phase |
Ref country code: DE |