WO2024257301A1 - 設備効率低下診断装置、学習装置、監視装置及び省エネルギー活動支援システム - Google Patents
設備効率低下診断装置、学習装置、監視装置及び省エネルギー活動支援システム Download PDFInfo
- Publication number
- WO2024257301A1 WO2024257301A1 PCT/JP2023/022228 JP2023022228W WO2024257301A1 WO 2024257301 A1 WO2024257301 A1 WO 2024257301A1 JP 2023022228 W JP2023022228 W JP 2023022228W WO 2024257301 A1 WO2024257301 A1 WO 2024257301A1
- Authority
- WO
- WIPO (PCT)
- Prior art keywords
- equipment
- unit
- efficiency
- equipment efficiency
- representative value
- Prior art date
- Legal status (The legal status is an assumption and is not a legal conclusion. Google has not performed a legal analysis and makes no representation as to the accuracy of the status listed.)
- Ceased
Links
Images



Classifications
-
- G—PHYSICS
- G05—CONTROLLING; REGULATING
- G05B—CONTROL OR REGULATING SYSTEMS IN GENERAL; FUNCTIONAL ELEMENTS OF SUCH SYSTEMS; MONITORING OR TESTING ARRANGEMENTS FOR SUCH SYSTEMS OR ELEMENTS
- G05B23/00—Testing or monitoring of control systems or parts thereof
- G05B23/02—Electric testing or monitoring
Definitions
- This disclosure relates to an equipment efficiency decline diagnostic device, a learning device, a monitoring device, and an energy-saving activity support system that are used to present information on the trend of efficiency decline in equipment such as production equipment or related equipment.
- Patent Document 1 makes it possible to detect whether an abnormality has occurred in equipment from data collected during a target period.
- abnormality determination is performed based on correlation coefficients within a certain target period, so it is not possible to make time series comparisons for each target period, and it is not possible to determine trends over time, such as a tendency for equipment efficiency to deteriorate.
- the present disclosure has been made in consideration of the above, and aims to provide an equipment efficiency decline diagnostic device that can contribute to the presentation of information indicating a trend in equipment efficiency decline when the equipment efficiency declines.
- the equipment efficiency degradation diagnosis device disclosed herein has an acquisition unit that acquires in advance the power amount of the target equipment and multiple information data related to the target equipment, an estimation unit that estimates information data that has a strong correlation with the power amount from the multiple information data acquired by the acquisition unit, and a reference calculation unit that calculates in advance an approximation curve that serves as a reference for an equipment efficiency index for determining whether the efficiency of the target equipment has decreased based on a scatter plot of the power amount and the information data estimated by the estimation unit.
- the equipment efficiency degradation diagnostic device further includes an equipment efficiency calculation unit that acquires the power amount of the target equipment and operation data related to the target equipment, that is highly correlated with the power amount, and that is data when the target equipment is in operation, and calculates the deviation of the operation data from the approximation curve calculated by the reference calculation unit as an equipment efficiency index; a representative value recording unit that records one equipment efficiency index as a representative value when one equipment efficiency index is calculated by the equipment efficiency calculation unit, and records representative values obtained from the multiple equipment efficiency indexes when multiple equipment efficiency indexes are calculated by the equipment efficiency calculation unit; and a diagnostic unit that determines whether the efficiency of the target equipment has decreased based on the representative value itself recorded by the representative value recording unit or a change in the representative value.
- the equipment efficiency decline diagnostic device disclosed herein has the effect of contributing to the presentation of information indicating a trend of equipment efficiency decline when the equipment efficiency declines.
- FIG. 1 is a diagram showing a configuration of an energy-saving activity support system according to a first embodiment.
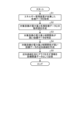
- 1 is a flowchart showing the procedure of an operation performed by a learning device included in the energy-saving activity support system according to the first embodiment.
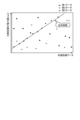
- FIG. 1 is a diagram showing an example of a scatter diagram created by a facility data specification unit included in a learning device of the energy-saving activity support system according to the first embodiment;
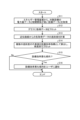
- 1 is a flowchart showing a procedure of an operation performed by a monitoring device included in the energy-saving activity support system according to the first embodiment.
- FIG. 1 is a diagram showing an example of a deviation degree calculated by a deviation degree calculation unit included in a monitoring device of an energy-saving activity support system according to a first embodiment;
- FIG. 1 is a diagram for explaining a determination made by an equipment efficiency deterioration tendency determination unit included in a monitoring device of an energy-saving activity support system according to a first embodiment.
- FIG. 1 is a diagram for explaining calculations performed by a deviation degree calculation unit included in a monitoring device of an energy-saving activity support system according to a first embodiment.
- FIG. 1 is a diagram for explaining operations performed by an equipment efficiency calculation unit and an equipment efficiency deterioration tendency determination unit included in a monitoring device of an energy-saving activity support system according to a first embodiment.
- FIG. 1 is a diagram showing a configuration of an equipment efficiency reduction diagnosis device according to a second embodiment;
- FIG. 1 shows a configuration of an energy-saving activity support system according to a third embodiment.
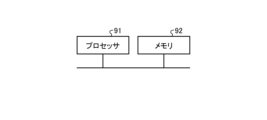
- FIG. 1 is a diagram showing a processor in a case where at least some of the functions of a data acquisition unit and an equipment data specification unit included in a learning unit of a learning device of an energy-saving activity support system according to a first embodiment are realized by the processor.
- FIG. 1 is a diagram showing a processing circuit in the case where at least some of the functions of a data acquisition unit and an equipment data identification unit of a learning unit of a learning device of an energy-saving activity support system according to a first embodiment are realized by the processing circuit.
- Embodiment 1. 1 is a diagram showing a configuration of an energy-saving activity support system 1 according to embodiment 1.
- the energy-saving activity support system 1 includes a production facility 2, a related facility 3, a first power sensor 4, a second power sensor 5, a production volume sensor 6, an environment sensor 7, a production management device 8, an energy management device 9, an information terminal 10, a learning device 11, and a monitoring device 16.
- the energy used by the production facility 2 and the related facility 3 is electric power, but the energy used by the production facility 2 and the related facility 3 may be primary energy such as petroleum, coal, gas, or hydrogen, or a combination of electric power and primary energy.
- the production facility 2 executes a production process to produce multiple items.
- a production line is made up of multiple production devices, but the production facility 2 may have only one production device.
- the items produced by the production facility 2 are, for example, industrial products or work-in-progress of industrial products.
- the items produced by the production facility 2 are referred to as the items to be produced.
- the items to be produced may be liquids or gases.
- the related equipment 3 is equipment used in relation to the production equipment 2.
- the related equipment 3 is equipment such as lighting equipment, air conditioners, compressors, or dust collectors that are turned on by workers when the products produced by the production equipment 2 are produced.
- the related equipment 3 is also called utility equipment.
- the first power sensor 4 is attached to the power transmission line that transmits power to the production equipment 2 or to the production equipment 2, and periodically measures the amount of power consumed by the production equipment 2 and transmits information indicating the measured amount of power consumption to the energy management device 9 via a dedicated line.
- the first power sensor 4 may also transmit information indicating the measured amount of power consumption to the energy management device 9 via a network.
- the second power sensor 5 is attached to the power transmission line that transmits power to the related equipment 3 or to the related equipment 3, and periodically measures the amount of power consumed by the related equipment 3 and transmits information indicating the measured amount of power consumption to the energy management device 9 via a dedicated line.
- the second power sensor 5 may also transmit information indicating the measured amount of power consumption to the energy management device 9 via a network.
- the production volume sensor 6 is provided in the production facility 2, and periodically measures the production volume of the production facility 2, and transmits information indicating the measured production volume to the energy management device 9 via a dedicated line.
- the production volume sensor 6 may transmit information indicating the measured production volume to the energy management device 9 via a network.
- the production volume sensor 6 counts, for example, the number of products to be produced passing through the production line of the production facility 2, and measures the counted value as the production volume.
- the production volume measured by the production volume sensor 6 is the production flow rate when the products to be produced are liquid or gas.
- the production volume measured by the production volume sensor 6 may be expressed in weight or length.
- the environmental sensor 7 periodically measures the production environment, which is the environment in the production process of the production equipment 2, and transmits information indicating the measured production environment to the energy management device 9.
- the production environment measured by the environmental sensor 7 is, for example, the temperature, humidity, carbon dioxide concentration, brightness, noise, or vibration in the room in which the production equipment 2 is located.
- the information indicating the production environment may be input to a terminal device (not shown). In this case, the information indicating the production environment is transmitted from the terminal device to the energy management device 9 via a dedicated line or network.
- the production management device 8 has a memory unit (not shown) that stores production management information.
- the memory unit is realized, for example, by a semiconductor memory.
- the production management information includes information such as the type of product to be produced each day, the person in charge of the production process, error information for the production equipment 2, the lot size of the product to be produced, and the takt time of the production equipment 2.
- the takt time is, for example, the time obtained by dividing the operating time of the production equipment 2 in one day by the production volume for that day.
- the production management device 8 has a processing unit (not shown), which reads out the production management information stored in the memory unit from the memory unit and transmits the read production management information to the energy management device 9 via a dedicated line.
- the processing unit may transmit the read production management information to the energy management device 9 via a network.
- the production management device 8 can obtain a portion of the production management information from the production equipment 2 via a dedicated line (not shown) or a network (not shown).
- the production management device 8 has an image sensor (not shown) and can identify part of the production management information by using the image sensor.
- the production management device 8 can also store information input from an input unit (not shown) in a storage unit as part of the production management information.
- the input unit can accept input from a keyboard or input by voice recognition, and output the accepted information to the energy management device 9.
- the energy management device 9 collects information from each of the first power sensor 4, the second power sensor 5, the production volume sensor 6, the environmental sensor 7, and the production management device 8.
- the information terminal 10 is realized by, for example, a tablet or a personal computer, and displays the equipment efficiency deterioration trend obtained from the equipment efficiency deterioration trend notification unit 22 (described below) of the monitoring device 16.
- the user can visually confirm the displayed equipment efficiency deterioration trend.
- the equipment efficiency deterioration trend means that the efficiency of the equipment being monitored is tending to deteriorate.
- the learning device 11 has a learning unit 12 that creates an approximation curve that serves as a benchmark for equipment efficiency before the monitoring device 16 begins monitoring, and an equipment-related data storage unit 15.
- the equipment-related data storage unit 15 is realized, for example, by a semiconductor memory.
- the learning unit 12 has a data acquisition unit 13 that acquires information collected by the energy management device 9.
- the information collected by the energy management device 9 includes information such as the amount of power and equipment data acquired by the environmental sensor 7.
- the learning unit 12 further has an equipment data identification unit 14 that identifies equipment data that has a high correlation with the amount of power of the equipment to be monitored from the data acquired by the data acquisition unit 13.
- the equipment data identification unit 14 calculates an approximation curve for the equipment data that has a high correlation with the amount of power of the equipment to be monitored.
- the equipment-related data storage unit 15 stores information about the approximation curve generated by the learning unit 12.
- the approximation curve is an approximation curve of equipment-related data that has a high correlation with the amount of power of the equipment being monitored.
- the learning device 11 may also operate while the monitoring device 16 is performing monitoring, and the learning device 11 may identify equipment data that has a high correlation with the amount of power of the equipment being monitored and update the approximation curve.
- the monitoring device 16 has a data acquisition unit 17, a deviation calculation unit 18, an equipment efficiency calculation unit 19, an equipment efficiency storage unit 20, an equipment efficiency deterioration trend determination unit 21, and an equipment efficiency deterioration trend notification unit 22.
- the monitoring device 16 sets the monitoring interval for the equipment efficiency deterioration trend in advance.
- the monitoring interval is, for example, every hour, every day, every month, every season, or every year.
- the data acquisition unit 17 acquires information collected by the energy management device 9.
- the information collected by the energy management device 9 includes information such as the amount of power and equipment data obtained by the environmental sensor 7.
- the deviation calculation unit 18 calculates the deviation from the approximation curve for each of a plurality of measurement points consisting of the power consumption data and equipment data of the equipment to be monitored acquired by the data acquisition unit 17 within the monitoring interval.
- Information on the approximation curve is stored in the equipment-related data storage unit 15 of the learning device 11. For example, if the measurement point is on the approximation curve, the deviation will be small, and the further the measurement point is from the approximation curve, the greater the deviation.
- the equipment efficiency calculation unit 19 calculates a representative value of the multiple deviations calculated by the deviation calculation unit 18 as an equipment efficiency index.
- the representative value is the average, median, weighted average, or moving average of the multiple deviations.
- the equipment efficiency storage unit 20 stores information indicating the equipment efficiency index calculated by the equipment efficiency calculation unit 19.
- the equipment efficiency storage unit 20 is realized by, for example, a semiconductor memory.
- the equipment efficiency deterioration trend determination unit 21 plots the equipment efficiency index calculated by the equipment efficiency calculation unit 19 on a graph in chronological order, and determines that the efficiency of the monitored equipment is deteriorating when, for example, the slope of the line connecting two adjacent plotted points on the graph falls below a certain threshold, or when the equipment efficiency index falls below a certain threshold.
- the equipment efficiency deterioration trend notification unit 22 notifies the information terminal 10 of the equipment efficiency deterioration trend when the equipment efficiency deterioration trend determination unit 21 determines that the efficiency of the monitored equipment is deteriorating.
- FIG. 2 is a flowchart showing the procedure of the operation performed by the learning device 11 possessed by the energy-saving activity support system 1 according to the first embodiment.
- step S1 the data acquisition unit 13 possessed by the learning unit 12 of the learning device 11 acquires information obtained by the first power sensor 4, the second power sensor 5, the production volume sensor 6, the environmental sensor 7 and the production management device 8 from the energy management device 9.
- the operation of step S1 is indicated by the phrase "acquire various data collected by the energy management device.”
- the equipment data identification unit 14 of the learning unit 12 of the learning device 11 creates a scatter plot of the power consumption of the monitored equipment, which is showing a tendency toward a worsening efficiency, and various equipment data consisting of the information obtained in step S1 by the first power sensor 4, the second power sensor 5, the production volume sensor 6, the environmental sensor 7, and the production management device 8.
- FIG. 3 is a diagram showing an example of a scatter diagram created by the equipment data identification unit 14 of the learning device 11 of the energy-saving activity support system 1 relating to embodiment 1.
- the horizontal axis indicates various equipment data
- the vertical axis indicates the amount of power of the equipment to be monitored.
- the equipment data identification unit 14 creates a scatter diagram of various equipment data consisting of first data, second data, and third data, and the amount of power of the equipment to be monitored.
- the equipment data identification unit 14 identifies equipment data that has a high correlation with the power consumption of the equipment to be monitored from the scatter diagram created in step S2.
- the equipment data identification unit 14 identifies the third data as equipment data that has a high correlation with the power consumption of the equipment to be monitored.
- a high correlation may be determined by a correlation coefficient calculated based on the covariance and standard deviation, or may be determined by using AI (Artificial Intelligence) such as machine learning.
- the scatter diagram may be expressed in three dimensions rather than two dimensions.
- an axis of arbitrary data is set in addition to an axis showing the amount of power of the monitored equipment and an axis showing various equipment data.
- a single piece of equipment data with the highest correlation may be selected, or multiple pieces of equipment data may be selected in descending order of correlation.
- each piece of equipment data is weighted based on the magnitude of correlation to calculate the degree of deviation.
- the equipment data identification unit 14 creates an approximation curve of the equipment data identified in step S3 on the scatter plot.
- the equipment data identification unit 14 creates an approximation curve of the equipment data that has a high correlation with the power consumption of the equipment to be monitored on the scatter plot.
- the equipment data identification unit 14 creates an approximation curve of the third data that has been identified as having a high correlation on the scatter plot.
- step S5 the equipment-related data storage unit 15 of the learning device 11 stores information indicating the graph including the approximation curve created in step S4 as equipment-related data.
- FIG. 4 is a flowchart showing the procedure of the operation performed by the monitoring device 16 of the energy-saving activity support system 1 according to the first embodiment.
- the data acquisition unit 17 of the monitoring device 16 acquires, from the energy management device 9, power consumption data of the target equipment being monitored for a deterioration trend in efficiency, and equipment data identified in step S3 of FIG. 2 as having a high correlation with the power consumption of the equipment to be monitored.
- the number of data items acquired by the data acquisition unit 17 is the number of data items obtained within a preset monitoring interval for a deterioration trend in the equipment's efficiency.
- step S12 the data acquisition unit 17 plots points indicating equipment data that has a high correlation with the amount of power of the monitored equipment acquired in step S11 on a graph indicated by the information stored in the equipment-related data storage unit 15 in step S5 of FIG. 2, for the number of pieces of data acquired.
- the operation of step S12 is indicated by the phrase "plot acquired data on graph.”
- step S13 the deviation calculation unit 18 calculates the deviation of each point plotted in step S12 from the approximation curve.
- the operation of step S13 is indicated by the phrase "calculate the deviation of each acquired data from the approximation curve.”
- FIG. 5 is a diagram showing an example of the deviation calculated by the deviation calculation unit 18 possessed by the monitoring device 16 of the energy-saving activity support system 1 relating to embodiment 1. As shown in FIG. 5, for example, the deviation is the vertical distance between each point plotted in step S12 and the approximation curve.
- the equipment efficiency calculation unit 19 first calculates a representative value of the multiple deviations calculated in step S13 as an equipment efficiency index.
- the calculated equipment efficiency index is stored in the equipment efficiency storage unit 20.
- the representative value represents the average value, median value, weighted average value, moving average value, etc. of the multiple deviations.
- the equipment efficiency calculation unit 19 plots the equipment efficiency index stored in the equipment efficiency storage unit 20 on a graph in chronological order.
- the equipment efficiency deterioration trend determination unit 21 determines whether or not the efficiency of the monitored equipment is tending to deteriorate based on the time series graph plotted in step S14. For example, the equipment efficiency deterioration trend determination unit 21 determines that the efficiency of the monitored equipment is tending to deteriorate if the equipment efficiency index is less than a preset threshold and the slope of the line connecting the current equipment efficiency index and the previous equipment efficiency index is less than a preset threshold, if the equipment efficiency index is less than a preset threshold, or if the slope of the line connecting the current equipment efficiency index and the previous equipment efficiency index is less than a preset threshold.
- FIG. 6 is a diagram for explaining the judgment made by the equipment efficiency deterioration trend judgment unit 21 of the monitoring device 16 of the energy-saving activity support system 1 according to the first embodiment.
- the vertical axis indicates the equipment efficiency index, which is a representative value of the deviation described with reference to FIG. 5, and the horizontal axis indicates time, such as days or months.
- the representative value of the deviation calculated in step S13 is plotted on a time-series graph as the equipment efficiency index.
- the equipment efficiency deterioration trend judgment unit 21 judges that the efficiency of the equipment to be monitored is tending to deteriorate.
- the equipment efficiency deterioration trend determination unit 21 determines that the efficiency of the equipment being monitored is deteriorating (Yes in S15)
- the equipment efficiency deterioration trend notification unit 22 notifies the user of the equipment efficiency deterioration trend in step S16. If the equipment efficiency deterioration trend determination unit 21 determines that the efficiency of the equipment being monitored is not deteriorating (No in S15), the operation of the monitoring device 16 ends.
- the learning device 11 identifies the equipment to be monitored as an air conditioner, identifies the equipment data highly correlated with the power consumption of the equipment to be monitored as the outside air temperature, and sets the monitoring interval to one day.
- FIG. 7 is a diagram for explaining the calculations performed by the deviation calculation unit 18 of the monitoring device 16 of the energy-saving activity support system 1 according to the first embodiment.
- a graph including an approximation curve for the amount of power consumed by an air conditioner four points of data for the outside air temperature acquired on March 5th are plotted on the same graph.
- the deviation calculation unit 18 calculates the distance in the vertical direction between each point and the approximation curve as the deviation.
- the air conditioner, March 5th, and four points above are examples.
- FIG. 8 is a diagram for explaining the operations performed by the equipment efficiency calculation unit 19 and the equipment efficiency deterioration trend determination unit 21 of the monitoring device 16 of the energy-saving activity support system 1 according to the first embodiment.
- the equipment efficiency calculation unit 19 calculates a representative value of the multiple deviations calculated by the deviation calculation unit 18 as described with reference to FIG. 7 as the equipment efficiency index.
- the average value of the four data points is taken as the representative value of the deviations and is used as the equipment efficiency index.
- the equipment efficiency calculation unit 19 plots the calculated equipment efficiency index for March 5th as the data for March 5th on a time series graph of the equipment efficiency index.
- the above March 5th is an example.
- the dates from March 1st to March 5th in FIG. 8 are examples.
- An equipment efficiency index threshold is set in advance to determine whether the efficiency of the equipment is deteriorating.
- the equipment efficiency index on March 4th is greater than the equipment efficiency index threshold, but the equipment efficiency index on March 5th is less than the equipment efficiency index threshold, so the equipment efficiency deterioration trend determination unit 21 determines that the efficiency of the equipment being monitored is deteriorating.
- the above dates of March 4th and March 5th are examples.
- the energy-saving activity support system 1 uses a representative value of the deviation from the approximation curve of the equipment data as an equipment efficiency index, and judges whether the efficiency of the monitored equipment is deteriorating based on the equipment efficiency index itself or the trend of the equipment efficiency index, so that when the efficiency of the monitored equipment is deteriorating, it can present information indicating that the efficiency of the monitored equipment is tending to deteriorate. Furthermore, the energy-saving activity support system 1 can present the timing for updating and maintenance of the monitored equipment. The energy-saving activity support system 1 can provide users with an opportunity to take energy-saving measures.
- Embodiment 2. 9 is a diagram showing a configuration of an equipment efficiency degradation diagnosis device 30 according to the second embodiment.
- the equipment efficiency degradation diagnosis device 30 has an acquisition unit 31 that acquires in advance the power amount of a target facility and a plurality of pieces of information data related to the target facility.
- the target facility is the facility to be monitored in the first embodiment.
- the plurality of pieces of information data are the first data, the second data, and the third data shown in FIG. 3 of the first embodiment.
- the equipment efficiency degradation diagnosis device 30 further includes an estimation unit 32 that estimates information data that has a strong correlation with the power consumption of the target equipment from among the multiple pieces of information data acquired by the acquisition unit 31.
- the information data that has a strong correlation with the power consumption of the target equipment is the third data among the first data, second data, and third data described in FIG. 3 of the first embodiment.
- a strong correlation with the power consumption of the target equipment is determined by a predetermined rule.
- a strong correlation with the power consumption of the target equipment may be determined by a correlation coefficient calculated based on the covariance and standard deviation, or may be determined by using AI such as machine learning.
- the equipment efficiency degradation diagnosis device 30 further includes a reference calculation unit 33 that calculates in advance an approximation curve that serves as a reference for an equipment efficiency index for determining whether the efficiency of the target equipment has decreased based on a scatter diagram between the power amount of the target equipment and the information data estimated by the estimation unit 32.
- a reference calculation unit 33 that calculates in advance an approximation curve that serves as a reference for an equipment efficiency index for determining whether the efficiency of the target equipment has decreased based on a scatter diagram between the power amount of the target equipment and the information data estimated by the estimation unit 32.
- An example of the scatter diagram is FIG. 3 in the first embodiment.
- An example of the approximation curve is the approximation curve shown in FIG. 3.
- the equipment efficiency degradation diagnostic device 30 further includes an equipment efficiency calculation unit 34 that acquires the power amount of the target equipment and operation data that is related to the target equipment, has a strong correlation with the power amount, and is data when the target equipment is in operation, and calculates the deviation of the operation data from the approximation curve calculated by the reference calculation unit 33 as an equipment efficiency index.
- the equipment efficiency calculation unit 34 calculates the deviation as calculated by the deviation calculation unit 18 in the first embodiment, for example, and sets the calculated deviation as the equipment efficiency index. For example, as explained in the first embodiment using FIG.
- the equipment efficiency calculation unit 34 calculates the distance in the vertical axis direction between the operation data and the approximation curve as the deviation.
- the equipment efficiency degradation diagnosis device 30 further includes a representative value recording unit 35 that records one equipment efficiency index as a representative value when one equipment efficiency index is calculated by the equipment efficiency calculation unit 34, and records representative values obtained from the multiple equipment efficiency indexes when multiple equipment efficiency indexes are calculated by the equipment efficiency calculation unit 34.
- the representative value recording unit 35 has a memory unit and records the representative value in the memory unit.
- the equipment efficiency degradation diagnosis device 30 has a memory unit not included in the representative value recording unit 35, and the representative value recording unit 35 records the representative value in the memory unit not included in the representative value recording unit 35.
- the memory unit is realized by, for example, a semiconductor memory.
- the representative value is the average value, median value, weighted average value, moving average value, or the like of the multiple equipment efficiency indexes.
- the equipment efficiency degradation diagnostic device 30 further includes a diagnostic unit 36 that determines whether the efficiency of the target equipment has decreased based on the representative value recorded by the representative value recording unit 35 or the transition of the representative value. For example, as described in the first embodiment with reference to FIG. 6 and FIG.
- the diagnostic unit 36 determines that the efficiency of the target equipment has decreased.
- the equipment efficiency degradation diagnosis device 30 has a reference calculation unit 33 that calculates an approximation curve in advance based on a scatter plot of the power consumption of the target equipment and the information data estimated by the estimation unit 32, an equipment efficiency calculation unit 34 that calculates the deviation of the operation data from the approximation curve as an equipment efficiency index, and a diagnosis unit 36 that determines whether the efficiency of the target equipment has decreased based on the representative value itself based on the equipment efficiency index or the trend of the representative value. Therefore, the equipment efficiency degradation diagnosis device 30 can present the fact that the efficiency of the target equipment has decreased when the efficiency of the target equipment has decreased.
- the meaning of "decline" in the second embodiment is substantially the same as the meaning of "deterioration" in the first embodiment.
- Embodiment 3. 10 is a diagram showing a configuration of an energy-saving activity support system 40 according to the third embodiment.
- the energy-saving activity support system 40 includes a learning device 41 and a monitoring device 45.
- the learning device 41 includes an acquisition unit 42, an estimation unit 43, and a reference calculation unit 44.
- the acquisition unit 42 has the same function as the acquisition unit 31 of the second embodiment
- the estimation unit 43 has the same function as the estimation unit 32 of the second embodiment
- the reference calculation unit 44 has the same function as the reference calculation unit 33 of the second embodiment.
- the monitoring device 45 includes an equipment efficiency calculation unit 46, a representative value recording unit 47, and a diagnosis unit 48.
- the equipment efficiency calculation unit 46 has the same function as the equipment efficiency calculation unit 34 of the second embodiment
- the representative value recording unit 47 has the same function as the representative value recording unit 35 of the second embodiment
- the diagnosis unit 48 has the same function as the diagnosis unit 36 of the second embodiment.
- the energy-saving activity support system 40 according to the third embodiment can present the fact that the efficiency of the target equipment has decreased when the efficiency of the target equipment has decreased.
- FIG. 11 is a diagram showing a processor 91 in the case where at least some of the functions of the data acquisition unit 13 and the equipment data identification unit 14 of the learning unit 12 of the learning device 11 of the energy-saving activity support system 1 relating to embodiment 1 are realized by the processor 91.
- the processor 91 executes a program stored in the memory 92.
- the processor 91 is a CPU (Central Processing Unit), a processing system, an arithmetic system, a microprocessor, or a DSP (Digital Signal Processor).
- Memory 92 is also shown in FIG. 11.
- the processor 91 When at least some of the functions of the data acquisition unit 13 and the equipment data identification unit 14 are realized by the processor 91, the at least some of the functions are realized by the processor 91 and software, firmware, or a combination of software and firmware.
- the software or firmware is written as a program and stored in the memory 92.
- the processor 91 realizes at least some of the functions of the data acquisition unit 13 and the equipment data identification unit 14 by reading and executing the program stored in the memory 92.
- the learning unit 12 has a memory 92 for storing a program that results in at least some of the steps executed by the data acquisition unit 13 and the equipment data identification unit 14. It can also be said that the program stored in the memory 92 causes a computer to execute at least some of the procedures or methods executed by the data acquisition unit 13 and the equipment data identification unit 14.
- the memory 92 may be, for example, a non-volatile or volatile semiconductor memory such as a RAM (Random Access Memory), a ROM (Read Only Memory), a flash memory, an EPROM (Erasable Programmable Read Only Memory), an EEPROM (registered trademark) (Electrically Erasable Programmable Read-Only Memory), a magnetic disk, a flexible disk, an optical disk, a compact disk, a mini disk, or a DVD (Digital Versatile Disk).
- RAM Random Access Memory
- ROM Read Only Memory
- flash memory an EPROM (Erasable Programmable Read Only Memory), an EEPROM (registered trademark) (Electrically Erasable Programmable Read-Only Memory)
- a magnetic disk a flexible disk, an optical disk, a compact disk, a mini disk, or a DVD (Digital Versatile Disk).
- FIG. 12 is a diagram showing a processing circuit 93 in a case where at least some of the functions of the data acquisition unit 13 and the equipment data identification unit 14 of the learning unit 12 of the learning device 11 of the energy-saving activity support system 1 relating to embodiment 1 are realized by the processing circuit 93. In other words, at least some of the functions of the data acquisition unit 13 and the equipment data identification unit 14 may be realized by the processing circuit 93.
- the processing circuit 93 is dedicated hardware.
- the processing circuit 93 is a single circuit, a composite circuit, a programmed processor, a parallel programmed processor, an ASIC (Application Specific Integrated Circuit), an FPGA (Field-Programmable Gate Array), or a combination of these.
- ASIC Application Specific Integrated Circuit
- FPGA Field-Programmable Gate Array
- Some of the functions of the data acquisition unit 13 and the equipment data identification unit 14 may be realized by dedicated hardware separate from the hardware that realizes the remaining functions of the data acquisition unit 13 and the equipment data identification unit 14.
- Some of the functions possessed by the data acquisition unit 13 and the equipment data identification unit 14 may be realized by software or firmware, and the remaining functions may be realized by dedicated hardware. In this way, the functions possessed by the data acquisition unit 13 and the equipment data identification unit 14 can be realized by hardware, software, firmware, or a combination of these.
- At least some of the functions of the data acquisition unit 17, deviation calculation unit 18, equipment efficiency calculation unit 19, equipment efficiency deterioration trend determination unit 21, and equipment efficiency deterioration trend notification unit 22 of the monitoring device 16 of the energy-saving activity support system 1 in embodiment 1 may be realized by a processor or a processing circuit.
- the processor is a processor equivalent to processor 91.
- the processing circuit is a processing circuit equivalent to processing circuit 93.
- At least some of the functions of the production equipment 2, related equipment 3, first power sensor 4, second power sensor 5, production volume sensor 6, environmental sensor 7, production management device 8, energy management device 9, and information terminal 10 of the energy-saving activity support system 1 in embodiment 1 may be realized by a processor or a processing circuit.
- the processor is a processor equivalent to processor 91.
- the processing circuit is a processing circuit equivalent to processing circuit 93.
- At least some of the functions of the acquisition unit 31, estimation unit 32, reference calculation unit 33, equipment efficiency calculation unit 34, representative value recording unit 35, and diagnosis unit 36 of the equipment efficiency degradation diagnosis device 30 according to the second embodiment may be realized by a processor or a processing circuit.
- the processor is a processor equivalent to the processor 91.
- the processing circuit is a processing circuit equivalent to the processing circuit 93.
- At least some of the functions of the acquisition unit 42, estimation unit 43, and reference calculation unit 44 of the learning device 41 of the energy-saving activity support system 40 in embodiment 3 may be realized by a processor or a processing circuit. At least some of the functions of the equipment efficiency calculation unit 46, representative value recording unit 47, and diagnosis unit 48 of the monitoring device 45 of the energy-saving activity support system 40 may be realized by a processor or a processing circuit.
- the processor is a processor equivalent to processor 91.
- the processing circuit is a processing circuit equivalent to processing circuit 93.
Landscapes
- Physics & Mathematics (AREA)
- General Physics & Mathematics (AREA)
- Engineering & Computer Science (AREA)
- Automation & Control Theory (AREA)
- Testing And Monitoring For Control Systems (AREA)
Abstract
設備効率低下診断装置(30)は、対象設備の電力量及び対象設備に関連する複数の情報データを事前に取得する取得部(31)と、複数の情報データのなかの当該電力量と相関が強い情報データを推定する推定部(32)と、電力量と情報データとの散布図をもとに近似曲線を事前に算出する基準算出部(33)と、対象設備の電力量と対象設備に関連していて当該電力量と相関が強くかつ対象設備の稼働時のデータである稼働データとを取得し、近似曲線からの稼働データの逸脱度を設備効率指標として算出する設備効率算出部(34)と、ひとつの設備効率指標が算出された場合にひとつの設備効率指標を代表値として記録し、複数の設備効率指標が算出された場合に複数の設備効率指標から得られる代表値を記録する代表値記録部(35)と、代表値そのもの又は代表値の推移をもとに対象設備の効率が低下しているか否かを判断する診断部(36)とを有する。
Description
本開示は、生産設備又は関連設備といった設備の効率の低下傾向の情報を提示するために用いられる設備効率低下診断装置、学習装置、監視装置及び省エネルギー活動支援システムに関する。
従来、設備機器において、機器の通常運用時に収集された計測値を用いて機器の異常を容易に検出する技術が知られている。例えば、判定対象計測値と相関が強い比較計測値を選定し、判定対象計測値と各比較計測値との相関係数を分割した期間毎に算出し、相関係数があらかじめ設定された閾値を下回る場合、その期間に異常が発生したと判定する技術が開示されている(例えば、特許文献1参照)。
特許文献1に記載されている技術によれば、対象期間に収集したデータから機器の異常が発生していたかを検出することはできる。しかしながら、特許文献1に記載されている技術では、ある対象期間内の相関係数をもとに異常判定が行われるため、対象期間毎の時系列による比較ができず、設備の効率の悪化の傾向といった時系列による傾向を判断することができない。
本開示は、上記に鑑みてなされたものであって、設備の効率が低下した場合に設備の効率の低下の傾向を示す情報の提示に寄与することができる設備効率低下診断装置を得ることを目的とする。
上述した課題を解決し、目的を達成するために、本開示に係る設備効率低下診断装置は、対象設備の電力量及び対象設備に関連する複数の情報データを事前に取得する取得部と、取得部によって取得された複数の情報データのなかの当該電力量と相関が強い情報データを推定する推定部と、電力量と推定部によって推定された情報データとの散布図をもとに対象設備の効率が低下しているか否かを判断するための設備効率指標の基準となる近似曲線を事前に算出する基準算出部とを有する。本開示に係る設備効率低下診断装置は、対象設備の電力量と対象設備に関連していて当該電力量と相関が強くかつ対象設備の稼働時のデータである稼働データとを取得し、基準算出部によって算出された近似曲線からの稼働データの逸脱度を設備効率指標として算出する設備効率算出部と、設備効率算出部によってひとつの設備効率指標が算出された場合にひとつの設備効率指標を代表値として記録し、設備効率算出部によって複数の設備効率指標が算出された場合に複数の設備効率指標から得られる代表値を記録する代表値記録部と、代表値記録部によって記録された代表値そのもの又は代表値の推移をもとに対象設備の効率が低下しているか否かを判断する診断部とを更に有する。
本開示に係る設備効率低下診断装置は、設備の効率が低下した場合に設備の効率の低下の傾向を示す情報の提示に寄与することができるという効果を奏する。
以下に、実施の形態に係る設備効率低下診断装置、学習装置、監視装置及び省エネルギー活動支援システムを図面に基づいて詳細に説明する。
実施の形態1.
図1は、実施の形態1に係る省エネルギー活動支援システム1の構成を示す図である。省エネルギー活動支援システム1は、生産設備2と、関連設備3と、第1電力センサ4と、第2電力センサ5と、生産量センサ6と、環境センサ7と、生産管理装置8と、エネルギー管理装置9と、情報端末10と、学習装置11と、監視装置16とを有する。実施の形態1では、生産設備2及び関連設備3によって使用されるエネルギーは電力であるが、生産設備2及び関連設備3によって使用されるエネルギーは、石油、石炭、ガス又は水素等の一次エネルギー等であってもよいし、電力と一次エネルギーとの組み合わせであってもよい。
図1は、実施の形態1に係る省エネルギー活動支援システム1の構成を示す図である。省エネルギー活動支援システム1は、生産設備2と、関連設備3と、第1電力センサ4と、第2電力センサ5と、生産量センサ6と、環境センサ7と、生産管理装置8と、エネルギー管理装置9と、情報端末10と、学習装置11と、監視装置16とを有する。実施の形態1では、生産設備2及び関連設備3によって使用されるエネルギーは電力であるが、生産設備2及び関連設備3によって使用されるエネルギーは、石油、石炭、ガス又は水素等の一次エネルギー等であってもよいし、電力と一次エネルギーとの組み合わせであってもよい。
生産設備2は、複数の物品を生産する生産工程を実行する。生産設備2では例えば複数の生産装置によって生産ラインが構成されるが、生産設備2は一つの生産装置のみを有していてもよい。生産設備2によって生産される物品は、例えば、工業製品又は工業製品の仕掛品である。以下では、生産設備2によって生産される物品は、生産対象品と記載される。生産対象品は、液体又は気体であってもよい。
関連設備3は、生産設備2に関連して用いられる設備である。例えば、関連設備3は、生産設備2によって生産される生産対象品の生産時に作業者等によってオンにされる照明装置、エアーコンディショナー、コンプレッサ又は集塵機等の設備である。関連設備3は、ユーティリティ設備とも呼ばれる。
第1電力センサ4は、生産設備2への送電を行う送電線又は生産設備2等に取り付けられ、生産設備2の消費電力量を定期的に測定し、測定した消費電力量を示す情報を、専用線を介してエネルギー管理装置9に送信する。第1電力センサ4は、測定した消費電力量を示す情報を、ネットワークを介してエネルギー管理装置9に送信してもよい。
第2電力センサ5は、関連設備3への送電を行う送電線又は関連設備3等に取り付けられ、関連設備3の消費電力量を定期的に測定し、測定した消費電力量を示す情報を、専用線を介してエネルギー管理装置9に送信する。第2電力センサ5は、測定した消費電力量を示す情報を、ネットワークを介してエネルギー管理装置9に送信してもよい。
生産量センサ6は、生産設備2に設けられ、生産設備2の生産量を定期的に測定し、測定した生産量を示す情報を、専用線を介してエネルギー管理装置9に送信する。生産量センサ6は、測定した生産量を示す情報を、ネットワークを介してエネルギー管理装置9に送信してもよい。生産量センサ6は、例えば、生産設備2の生産ラインにおける生産対象品の通過数をカウントし、カウントした値を生産量として測定する。生産量センサ6によって測定される生産量は、生産対象品が液体又は気体である場合、生産流量である。生産量センサ6によって測定される生産量は、重さ又は長さで表されてもよい。
環境センサ7は、生産設備2の生産工程における環境である生産環境を定期的に測定し、測定した生産環境を示す情報をエネルギー管理装置9に送信する。環境センサ7によって測定される生産環境は、例えば、生産設備2が配置された室内の温度、湿度、二酸化炭素濃度、明るさ、騒音又は振動等である。生産環境を示す情報は、不図示の端末装置に入力されてもよい。この場合、生産環境を示す情報は、端末装置から専用線又はネットワークを介してエネルギー管理装置9に送信される。
生産管理装置8は、生産管理情報を記憶する不図示の記憶部を有する。記憶部は、例えば半導体メモリによって実現される。生産管理情報は、日毎の、生産対象品の種類、生産工程の担当者、生産設備2のエラー情報、生産対象品のロット数及び生産設備2のタクトタイム等の情報を含む。タクトタイムは、例えば、1日における生産設備2の稼働時間を1日の生産量で除算することによって得られる時間である。
生産管理装置8は不図示の処理部を有しており、処理部は、記憶部に記憶されている生産管理情報を記憶部から読み出し、読み出した生産管理情報を、専用線を介してエネルギー管理装置9に送信する。処理部は、読み出した生産管理情報を、ネットワークを介してエネルギー管理装置9に送信してもよい。生産管理装置8は、生産設備2から不図示の専用線又は不図示のネットワークを介して生産管理情報の一部の情報を取得することができる。
生産管理装置8は、不図示の画像センサを有しており、画像センサによって生産管理情報の一部の情報を特定することができる。生産管理装置8は、不図示の入力部から入力される情報を生産管理情報の一部の情報として記憶部で記憶することもできる。入力部は、キーボードによる入力又は音声認識による入力を受け付け、受け付けた情報をエネルギー管理装置9に出力することができる。
エネルギー管理装置9は、第1電力センサ4、第2電力センサ5、生産量センサ6、環境センサ7及び生産管理装置8の各々から情報を収集する。
情報端末10は、例えばタブレット又はパーソナルコンピュータ等によって実現され、監視装置16の後述される設備効率悪化傾向通知部22から得られた設備効率悪化傾向を表示する。ユーザは、表示された設備効率悪化傾向を視認することができる。設備効率悪化傾向は、監視対象の設備の効率が悪化傾向にあることを意味する。
学習装置11は、監視装置16が監視を行い始める前に設備の効率の基準となる近似曲線を作成する学習部12と、設備関連データ記憶部15とを有する。設備関連データ記憶部15は、例えば半導体メモリによって実現される。学習部12は、エネルギー管理装置9が収集した情報を取得するデータ取得部13を有する。エネルギー管理装置9が収集した情報には、電力量及び環境センサ7によって得られた設備データ等の情報が含まれる。学習部12は、データ取得部13が取得したデータから監視対象の設備の電力量と相関関係が高い設備データを特定する設備データ特定部14を更に有する。設備データ特定部14は、監視対象の設備の電力量と相関関係が高い設備データの近似曲線を算出する。
設備関連データ記憶部15は、学習部12が生成した近似曲線の情報を記憶する。近似曲線は、上述の通り監視対象の設備の電力量と相関関係が高い設備関連データの近似曲線である。監視装置16が監視を実行しているときも学習装置11が動作して学習装置11が監視対象の設備の電力量と相関関係が高い設備データを特定したり近似曲線を更新したりしてもよい。
監視装置16は、データ取得部17と、逸脱度算出部18と、設備効率算出部19と、設備効率記憶部20と、設備効率悪化傾向判定部21と、設備効率悪化傾向通知部22とを有する。監視装置16は、設備効率悪化傾向の監視間隔を事前に設定する。監視間隔は、例えば1時間毎、1日毎、ひと月毎、季節毎又は1年毎等である。
データ取得部17は、エネルギー管理装置9が収集した情報を取得する。エネルギー管理装置9が収集した情報には、電力量及び環境センサ7によって得られた設備データ等の情報が含まれる。
逸脱度算出部18は、監視間隔内においてデータ取得部17によって取得された監視対象の設備の電力量データと設備データとから構成される複数の計測点の各々の近似曲線からの逸脱度を算出する。近似曲線の情報は、学習装置11の設備関連データ記憶部15に記憶されている。例えば、計測点が近似曲線上にある場合、逸脱度は小となり、計測点が近似曲線から離れるほど逸脱度は大きくなる。
設備効率算出部19は、逸脱度算出部18によって算出された複数の逸脱度の代表値を設備効率指標として算出する。代表値は、複数の逸脱度の平均値、中央値、重みつき平均値又は移動平均値等である。設備効率記憶部20は、設備効率算出部19によって算出された設備効率指標を示す情報を記憶する。設備効率記憶部20は、例えば半導体メモリによって実現される。
設備効率悪化傾向判定部21は、設備効率算出部19によって算出された設備効率指標を時系列でグラフにプロットしていき、例えば、グラフにおけるプロットされた隣り合う二つの点を結ぶ線の傾きがある閾値を下回った場合、又は設備効率指標がある閾値を下回った場合、監視対象の設備の効率が悪化傾向にあると判定する。設備効率悪化傾向通知部22は、設備効率悪化傾向判定部21によって監視対象の設備の効率が悪化傾向にあると判定された場合、設備効率悪化傾向を情報端末10に通知する。
次に、学習装置11が行う処理について図2等を用いて説明する。図2は、実施の形態1に係る省エネルギー活動支援システム1が有する学習装置11が行う動作の手順を示すフローチャートである。ステップS1では、学習装置11の学習部12が有するデータ取得部13が、エネルギー管理装置9から、第1電力センサ4、第2電力センサ5、生産量センサ6、環境センサ7及び生産管理装置8によって得られた情報を取得する。図2では、ステップS1の動作は「エネルギー管理装置が収集した各種データを取得」という文言で示されている。
次のステップS2では、学習装置11の学習部12が有する設備データ特定部14が、効率が悪化傾向にある監視対象の設備について、監視対象の設備の電力量と、ステップS1で取得された第1電力センサ4、第2電力センサ5、生産量センサ6、環境センサ7及び生産管理装置8によって得られた情報から構成される各種設備データとの散布図を作成する。
図3は、実施の形態1に係る省エネルギー活動支援システム1の学習装置11が有する設備データ特定部14によって作成される散布図の例を示す図である。図3の散布図において、横軸は各種設備データを示しており、縦軸は監視対象の設備の電力量を示している。図3に示されるように、例えば、設備データ特定部14は、第1データ、第2データ及び第3データから構成される各種設備データと監視対象の設備の電力量との散布図を作成する。
次のステップS3では、設備データ特定部14が、ステップS2で作成した散布図から、監視対象の設備の電力量と相関関係が高い設備データを特定する。図3の例では、設備データ特定部14は、第3データを監視対象の設備の電力量と相関関係が高い設備データと特定する。相関関係が高いということは、共分散と標準偏差とをもとに計算される相関係数によって決定されてもよいし、機械学習等のAI(Artificial Intelligence)を用いることによって決定されてもよい。
散布図は、2次元でなく3次元で表現されてもよい。散布図が3次元で表現される場合、監視対象の設備の電力量を示す軸と各種設備データを示す軸とに加えて、任意のデータの軸が設定される。監視対象の設備の電力量と相関関係が高い設備データについて、相関関係が最も高い単一の設備データが選択されてもよいし、相関関係が高い順に複数の設備データが選択されてもよい。その場合、後述される図4のステップS13において、相関関係の大きさをもとに、各設備データに対して重みづけを行って逸脱度が計算される。
次のステップS4では、設備データ特定部14が、ステップS3で特定した設備データの近似曲線を散布図上に作成する。つまり、設備データ特定部14は、監視対象の設備の電力量と相関関係が高い設備データの近似曲線を散布図上に作成する。図3の例では、設備データ特定部14は、相関関係が高いと特定した第3データの近似曲線を散布図上に作成する。
最後にステップS5では、学習装置11が有する設備関連データ記憶部15が、ステップS4で作成された近似曲線を含むグラフを示す情報を設備関連データとして記憶する。
次に、監視装置16が行う処理について、図4等を用いて説明する。図4は、実施の形態1に係る省エネルギー活動支援システム1が有する監視装置16が行う動作の手順を示すフローチャートである。ステップS11では、監視装置16が有するデータ取得部17が、エネルギー管理装置9から、効率の悪化傾向を監視中の対象設備の電力量データと、図2のステップS3で監視対象の設備の電力量と相関関係が高いと特定された設備データとを取得する。データ取得部17が取得するデータ数は、事前に設定された設備の効率の悪化傾向の監視間隔内で得られるデータ数とする。
次のステップS12では、データ取得部17が、図2のステップS5で設備関連データ記憶部15に格納された情報が示すグラフに、ステップS11で取得した監視対象の設備の電力量と相関関係が高い設備データを示す点を取得したデータの数だけプロットする。図4では、ステップS12の動作は「グラフに取得データをプロット」という文言で示されている。
次のステップS13では、逸脱度算出部18が、ステップS12でプロットされた各点の近似曲線からの逸脱度を計算する。図4では、ステップS13の動作は、「近似曲線からの各取得データの逸脱度を計算」という文言で示されている。図5は、実施の形態1に係る省エネルギー活動支援システム1の監視装置16が有する逸脱度算出部18によって計算される逸脱度の例を示す図である。図5に示されるように、例えば、逸脱度は、ステップS12でプロットされた各点と近似曲線との縦軸方向の距離である。
次のステップS14では、設備効率算出部19が、まず、ステップS13で計算された複数の逸脱度の代表値を設備効率指標として算出する。算出された設備効率指標は、設備効率記憶部20に記憶される。代表値は、複数の逸脱度の平均値、中央値、重みつき平均値又は移動平均値等を表す。次に、設備効率算出部19は、設備効率記憶部20に記憶された設備効率指標を時系列でグラフにプロットする。
次のステップS15では、設備効率悪化傾向判定部21が、ステップS14でプロットされた時系列グラフをもとに、監視対象の設備の効率が悪化傾向にあるか否かを判定する。例えば、設備効率悪化傾向判定部21は、設備効率指標が事前に設定された閾値未満であってかつ今回の設備効率指標と前回の設備効率指標とを結ぶ直線の傾きが事前に設定された閾値未満である場合、設備効率指標が事前に設定された閾値未満である場合、又は今回の設備効率指標と前回の設備効率指標とを結ぶ直線の傾きが事前に設定された閾値未満である場合、監視対象の設備の効率が悪化傾向にあると判定する。
図6は、実施の形態1に係る省エネルギー活動支援システム1の監視装置16が有する設備効率悪化傾向判定部21が行う判定を説明するための図である。縦軸は、図5を用いて説明された逸脱度の代表値である設備効率指標を示し、横軸は、例えば日又は月等の時間を示す。ステップS13で算出された逸脱度の代表値が、設備効率指標として、時系列グラフにプロットされる。例えば、設備効率指標が事前に設定された閾値未満であってかつ今回の設備効率指標と前回の設備効率指標とを結ぶ直線の傾きが事前に設定された閾値未満である場合、設備効率指標が事前に設定された閾値未満である場合、又は今回の設備効率指標と前回の設備効率指標とを結ぶ直線の傾きが事前に設定された閾値未満である場合、設備効率悪化傾向判定部21は、監視対象の設備の効率が悪化傾向にあると判定する。
監視対象の設備の効率が悪化傾向にあると設備効率悪化傾向判定部21によって判定された場合(S15でYes)、ステップS16で、設備効率悪化傾向通知部22が、設備効率悪化傾向をユーザに通知する。監視対象の設備の効率が悪化傾向にないと設備効率悪化傾向判定部21によって判定された場合(S15でNo)、監視装置16の動作は終了する。
図4に示されるフローチャートの処理は、事前に設定された監視間隔毎に繰り返し行われる。
次に、監視装置16が有する逸脱度算出部18の処理についての具体例を、図7を用いて説明し、監視装置16が有する設備効率算出部19及び設備効率悪化傾向判定部21の処理についての具体例を、図8を用いて説明する。
学習装置11によって、監視対象の設備がエアーコンディショナーに特定されるとともに、監視対象の設備の電力量と相関関係が高い設備データが外気温と特定され、監視間隔が1日に設定された場合を想定する。
図7は、実施の形態1に係る省エネルギー活動支援システム1の監視装置16が有する逸脱度算出部18が行う計算を説明するための図である。例えば、エアーコンディショナーの電力量についての近似曲線を含むグラフにおいて、3月5日分の取得された外気温についての4点のデータが同じグラフに記載される。逸脱度算出部18は、各点と近似曲線との縦軸方向の距離を逸脱度として算出する。上記のエアーコンディショナー、3月5日及び4点は、例である。
図8は、実施の形態1に係る省エネルギー活動支援システム1の監視装置16が有する設備効率算出部19及び設備効率悪化傾向判定部21が行う動作を説明するための図である。まず、設備効率算出部19が、図7を用いて説明したように逸脱度算出部18によって算出された複数の逸脱度の代表値を設備効率指標として算出する。図8では、4点のデータの平均値が逸脱度の代表値とされて設備効率指標とされている。次に、設備効率算出部19が、設備効率指標の時系列グラフに、3月5日のデータとして、算出した3月5日の設備効率指標をプロットする。上記の3月5日は、例である。図8の3月1日から3月5日までの日付は、例である。
設備の効率が悪化傾向にあることを判定するための設備効率指標閾値が事前に設定される。3月4日の設備効率指標は設備効率指標閾値より大きい値であるが、3月5日の設備効率指標は設備効率指標閾値より小さい値であるので、設備効率悪化傾向判定部21は、監視対象の設備の効率が悪化傾向にあると判定する。上記の3月4日及び3月5日は、例である。
実施の形態1に係る省エネルギー活動支援システム1は、設備データの近似曲線からの逸脱度の代表値を設備効率指標とし、設備効率指標そのもの又は設備効率指標の推移をもとに監視対象の設備の効率が悪化しているか否かを判断するので、監視対象の設備の効率が悪化している場合に監視対象の設備の効率が悪化傾向にあることを示す情報を提示することができる。ひいては、省エネルギー活動支援システム1は、監視対象の設備の更新のタイミング及びメンテナンスのタイミングを提示することができる。省エネルギー活動支援システム1は、ユーザに省エネルギー対策のきっかけを与えることができる。
実施の形態2.
図9は、実施の形態2に係る設備効率低下診断装置30の構成を示す図である。設備効率低下診断装置30は、対象設備の電力量及び対象設備に関連する複数の情報データを事前に取得する取得部31を有する。例えば、対象設備は実施の形態1の監視対象の設備である。例えば、複数の情報データは実施の形態1の図3に記載されている第1データ、第2データ及び第3データである。
図9は、実施の形態2に係る設備効率低下診断装置30の構成を示す図である。設備効率低下診断装置30は、対象設備の電力量及び対象設備に関連する複数の情報データを事前に取得する取得部31を有する。例えば、対象設備は実施の形態1の監視対象の設備である。例えば、複数の情報データは実施の形態1の図3に記載されている第1データ、第2データ及び第3データである。
設備効率低下診断装置30は、取得部31によって取得された複数の情報データのなかの対象設備の電力量と相関が強い情報データを推定する推定部32を更に有する。例えば、対象設備の電力量と相関が強い情報データは、実施の形態1の図3に記載されている第1データ、第2データ及び第3データのうちの第3データである。対象設備の電力量と相関が強いということは、あらかじめ決められた規則によって決定される。例えば、対象設備の電力量と相関が強いということは、共分散と標準偏差とをもとに計算される相関係数によって決定されてもよいし、機械学習等のAIを用いることによって決定されてもよい。
設備効率低下診断装置30は、対象設備の電力量と推定部32によって推定された情報データとの散布図をもとに対象設備の効率が低下しているか否かを判断するための設備効率指標の基準となる近似曲線を事前に算出する基準算出部33を更に有する。散布図の例は、実施の形態1の図3である。近似曲線の例は、図3に記載されている近似曲線である。
設備効率低下診断装置30は、対象設備の電力量と対象設備に関連していて当該電力量と相関が強くかつ対象設備の稼働時のデータである稼働データとを取得し、基準算出部33によって算出された近似曲線からの稼働データの逸脱度を設備効率指標として算出する設備効率算出部34を更に有する。設備効率算出部34は、例えば実施の形態1の逸脱度算出部18が算出するように逸脱度を算出し、算出した逸脱度を設備効率指標とする。例えば、実施の形態1において図5を用いて説明したように、横軸を稼働データの軸とし、縦軸を対象設備の電力量の軸として、近似曲線を含むグラフに稼働データをプロットした場合、設備効率算出部34は、稼働データと近似曲線との縦軸方向の距離を逸脱度として算出する。
設備効率低下診断装置30は、設備効率算出部34によってひとつの設備効率指標が算出された場合にひとつの設備効率指標を代表値として記録し、設備効率算出部34によって複数の設備効率指標が算出された場合に複数の設備効率指標から得られる代表値を記録する代表値記録部35を更に有する。例えば、代表値記録部35は記憶部を有していて記憶部に代表値を記録する。又は、設備効率低下診断装置30が代表値記録部35に含まれない記憶部を有していて、代表値記録部35が代表値記録部35に含まれない記憶部に代表値を記録する。記憶部は、例えば半導体メモリによって実現される。設備効率算出部34によって複数の設備効率指標が算出された場合、代表値は、複数の設備効率指標の平均値、中央値、重みつき平均値又は移動平均値等である。
設備効率低下診断装置30は、代表値記録部35によって記録された代表値そのもの又は代表値の推移をもとに対象設備の効率が低下しているか否かを判断する診断部36を更に有する。例えば、実施の形態1で図6及び図8を用いて説明したように、設備効率算出部34によって複数の設備効率指標が算出されたときの最新の設備効率指標が事前に設定された閾値未満であってかつ最新の設備効率指標と最新からひとつ前の設備効率指標とを結ぶ直線の傾きが事前に設定された閾値未満である場合、設備効率算出部34によってひとつの設備効率指標が算出されたときの当該設備効率指標が事前に設定された閾値未満である場合、又は設備効率算出部34によって複数の設備効率指標が算出されたときの最新の設備効率指標と最新からひとつ前の設備効率指標とを結ぶ直線の傾きが事前に設定された閾値未満である場合、診断部36は、対象設備の効率が低下していると判定する。
上述の通り、設備効率低下診断装置30は、対象設備の電力量と推定部32によって推定された情報データとの散布図をもとに近似曲線を事前に算出する基準算出部33と、近似曲線からの稼働データの逸脱度を設備効率指標として算出する設備効率算出部34と、設備効率指標をもとにする代表値そのもの又は代表値の推移をもとに対象設備の効率が低下しているか否かを判断する診断部36とを有する。したがって、設備効率低下診断装置30は、対象設備の効率が低下している場合に対象設備の効率が低下していることを提示することができる。実施の形態2における「低下」の意味は、実施の形態1における「悪化」の意味と実質的に同じである。
実施の形態3.
図10は、実施の形態3に係る省エネルギー活動支援システム40の構成を示す図である。省エネルギー活動支援システム40は、学習装置41と監視装置45とを有する。学習装置41は、取得部42と、推定部43と、基準算出部44とを有する。取得部42は実施の形態2の取得部31と同じ機能を有し、推定部43は実施の形態2の推定部32と同じ機能を有し、基準算出部44は実施の形態2の基準算出部33と同じ機能を有する。監視装置45は、設備効率算出部46と、代表値記録部47と、診断部48とを有する。設備効率算出部46は実施の形態2の設備効率算出部34と同じ機能を有し、代表値記録部47は実施の形態2の代表値記録部35と同じ機能を有し、診断部48は実施の形態2の診断部36と同じ機能を有する。
図10は、実施の形態3に係る省エネルギー活動支援システム40の構成を示す図である。省エネルギー活動支援システム40は、学習装置41と監視装置45とを有する。学習装置41は、取得部42と、推定部43と、基準算出部44とを有する。取得部42は実施の形態2の取得部31と同じ機能を有し、推定部43は実施の形態2の推定部32と同じ機能を有し、基準算出部44は実施の形態2の基準算出部33と同じ機能を有する。監視装置45は、設備効率算出部46と、代表値記録部47と、診断部48とを有する。設備効率算出部46は実施の形態2の設備効率算出部34と同じ機能を有し、代表値記録部47は実施の形態2の代表値記録部35と同じ機能を有し、診断部48は実施の形態2の診断部36と同じ機能を有する。
実施の形態3に係る省エネルギー活動支援システム40は、実施の形態2に係る設備効率低下診断装置30と同様に、対象設備の効率が低下している場合に対象設備の効率が低下していることを提示することができる。
図11は、実施の形態1に係る省エネルギー活動支援システム1の学習装置11の学習部12が有するデータ取得部13及び設備データ特定部14の少なくとも一部の機能がプロセッサ91によって実現される場合のプロセッサ91を示す図である。つまり、データ取得部13及び設備データ特定部14の少なくとも一部の機能は、メモリ92に格納されるプログラムを実行するプロセッサ91によって実現されてもよい。プロセッサ91は、CPU(Central Processing Unit)、処理システム、演算システム、マイクロプロセッサ又はDSP(Digital Signal Processor)である。図11には、メモリ92も示されている。
データ取得部13及び設備データ特定部14の少なくとも一部の機能がプロセッサ91によって実現される場合、当該少なくとも一部の機能は、プロセッサ91と、ソフトウェア、ファームウェア、又は、ソフトウェアとファームウェアとの組み合わせとによって実現される。ソフトウェア又はファームウェアは、プログラムとして記述され、メモリ92に格納される。プロセッサ91は、メモリ92に記憶されたプログラムを読み出して実行することにより、データ取得部13及び設備データ特定部14の少なくとも一部の機能を実現する。
データ取得部13及び設備データ特定部14の少なくとも一部の機能がプロセッサ91によって実現される場合、学習部12は、データ取得部13及び設備データ特定部14によって実行されるステップの少なくとも一部が結果的に実行されることになるプログラムを格納するためのメモリ92を有する。メモリ92に格納されるプログラムは、データ取得部13及び設備データ特定部14が実行する手順又は方法の少なくとも一部をコンピュータに実行させるものであるともいえる。
メモリ92は、例えば、RAM(Random Access Memory)、ROM(Read Only Memory)、フラッシュメモリ、EPROM(Erasable Programmable Read Only Memory)、EEPROM(登録商標)(Electrically Erasable Programmable Read-Only Memory)等の不揮発性若しくは揮発性の半導体メモリ、磁気ディスク、フレキシブルディスク、光ディスク、コンパクトディスク、ミニディスク又はDVD(Digital Versatile Disk)等である。
図12は、実施の形態1に係る省エネルギー活動支援システム1の学習装置11の学習部12が有するデータ取得部13及び設備データ特定部14の少なくとも一部の機能が処理回路93によって実現される場合の処理回路93を示す図である。つまり、データ取得部13及び設備データ特定部14の少なくとも一部の機能は、処理回路93によって実現されてもよい。
処理回路93は、専用のハードウェアである。処理回路93は、例えば、単一回路、複合回路、プログラム化されたプロセッサ、並列プログラム化されたプロセッサ、ASIC(Application Specific Integrated Circuit)、FPGA(Field-Programmable Gate Array)又はこれらを組み合わせたものである。
データ取得部13及び設備データ特定部14の一部の機能は、データ取得部13及び設備データ特定部14の残部の機能を実現するハードウェアと別の専用のハードウェアによって実現されてもよい。
データ取得部13及び設備データ特定部14が有する複数の機能について、当該複数の機能の一部がソフトウェア又はファームウェアによって実現され、当該複数の機能の残部が専用のハードウェアによって実現されてもよい。このように、データ取得部13及び設備データ特定部14が有する複数の機能は、ハードウェア、ソフトウェア、ファームウェア、又はこれらの組み合わせによって実現することができる。
実施の形態1に係る省エネルギー活動支援システム1の監視装置16が有するデータ取得部17、逸脱度算出部18、設備効率算出部19、設備効率悪化傾向判定部21及び設備効率悪化傾向通知部22の少なくとも一部の機能は、プロセッサによって実現されてもよいし、処理回路によって実現されてもよい。当該プロセッサは、プロセッサ91と同等のプロセッサである。当該処理回路は、処理回路93と同等の処理回路である。
実施の形態1に係る省エネルギー活動支援システム1が有する生産設備2、関連設備3、第1電力センサ4、第2電力センサ5、生産量センサ6、環境センサ7、生産管理装置8、エネルギー管理装置9及び情報端末10の各々の少なくとも一部の機能は、プロセッサによって実現されてもよいし、処理回路によって実現されてもよい。当該プロセッサは、プロセッサ91と同等のプロセッサである。当該処理回路は、処理回路93と同等の処理回路である。
実施の形態2に係る設備効率低下診断装置30が有する取得部31、推定部32、基準算出部33、設備効率算出部34、代表値記録部35及び診断部36の少なくとも一部の機能は、プロセッサによって実現されてもよいし、処理回路によって実現されてもよい。当該プロセッサは、プロセッサ91と同等のプロセッサである。当該処理回路は、処理回路93と同等の処理回路である。
実施の形態3に係る省エネルギー活動支援システム40の学習装置41が有する取得部42、推定部43及び基準算出部44の少なくとも一部の機能は、プロセッサによって実現されてもよいし、処理回路によって実現されてもよい。省エネルギー活動支援システム40の監視装置45が有する設備効率算出部46、代表値記録部47及び診断部48の少なくとも一部の機能は、プロセッサによって実現されてもよいし、処理回路によって実現されてもよい。当該プロセッサは、プロセッサ91と同等のプロセッサである。当該処理回路は、処理回路93と同等の処理回路である。
以上の実施の形態に示した構成は、一例を示すものであり、別の公知の技術と組み合わせることも可能であるし、実施の形態同士を組み合わせることも可能であるし、要旨を逸脱しない範囲で、構成の一部を省略又は変更することも可能である。
1,40 省エネルギー活動支援システム、2 生産設備、3 関連設備、4 第1電力センサ、5 第2電力センサ、6 生産量センサ、7 環境センサ、8 生産管理装置、9 エネルギー管理装置、10 情報端末、11,41 学習装置、12 学習部、13,17 データ取得部、14 設備データ特定部、15 設備関連データ記憶部、16,45 監視装置、18 逸脱度算出部、19,34,46 設備効率算出部、20 設備効率記憶部、21 設備効率悪化傾向判定部、22 設備効率悪化傾向通知部、30 設備効率低下診断装置、31,42 取得部、32,43 推定部、33,44 基準算出部、35,47 代表値記録部、36,48 診断部、91 プロセッサ、92 メモリ、93 処理回路。
Claims (4)
- 対象設備の電力量及び前記対象設備に関連する複数の情報データを事前に取得する取得部と、
前記取得部によって取得された前記複数の情報データのなかの前記電力量と相関が強い情報データを推定する推定部と、
前記電力量と前記推定部によって推定された前記情報データとの散布図をもとに前記対象設備の効率が低下しているか否かを判断するための設備効率指標の基準となる近似曲線を事前に算出する基準算出部と、
前記対象設備の電力量と前記対象設備に関連していて前記電力量と相関が強くかつ前記対象設備の稼働時のデータである稼働データとを取得し、前記基準算出部によって算出された前記近似曲線からの前記稼働データの逸脱度を前記設備効率指標として算出する設備効率算出部と、
前記設備効率算出部によってひとつの設備効率指標が算出された場合に前記ひとつの設備効率指標を代表値として記録し、前記設備効率算出部によって複数の設備効率指標が算出された場合に前記複数の設備効率指標から得られる代表値を記録する代表値記録部と、
前記代表値記録部によって記録された前記代表値そのもの又は前記代表値の推移をもとに前記対象設備の効率が低下しているか否かを判断する診断部と
を備えることを特徴とする設備効率低下診断装置。 - 対象設備の電力量及び前記対象設備に関連する複数の情報データを事前に取得する取得部と、
前記取得部によって取得された前記複数の情報データのなかの前記電力量と相関が強い情報データを推定する推定部と、
前記電力量と前記推定部によって推定された前記情報データとの散布図をもとに前記対象設備の効率が低下しているか否かを判断するための設備効率指標の基準となる近似曲線を事前に算出する基準算出部と
を備えることを特徴とする学習装置。 - 対象設備の電力量と前記対象設備に関連していて前記電力量と相関が強くかつ前記対象設備の稼働時のデータである稼働データとを取得し、請求項2に記載の学習装置における前記基準算出部によって算出された前記近似曲線からの前記稼働データの逸脱度を前記設備効率指標として算出する設備効率算出部と、
前記設備効率算出部によってひとつの設備効率指標が算出された場合に前記ひとつの設備効率指標を代表値として記録し、前記設備効率算出部によって複数の設備効率指標が算出された場合に前記複数の設備効率指標から得られる代表値を記録する代表値記録部と、
前記代表値記録部によって記録された前記代表値そのもの又は前記代表値の推移をもとに前記対象設備の効率が低下しているか否かを判断する診断部と
を備えることを特徴とする監視装置。 - 請求項2に記載の学習装置と、
請求項3に記載の監視装置と
を備えることを特徴とする省エネルギー活動支援システム。
Priority Applications (3)
| Application Number | Priority Date | Filing Date | Title |
|---|---|---|---|
| PCT/JP2023/022228 WO2024257301A1 (ja) | 2023-06-15 | 2023-06-15 | 設備効率低下診断装置、学習装置、監視装置及び省エネルギー活動支援システム |
| JP2025527153A JPWO2024257301A1 (ja) | 2023-06-15 | 2023-06-15 | |
| CN202380099291.1A CN121311837A (zh) | 2023-06-15 | 2023-06-15 | 设备效率下降诊断装置、学习装置、监视装置及节能活动辅助系统 |
Applications Claiming Priority (1)
| Application Number | Priority Date | Filing Date | Title |
|---|---|---|---|
| PCT/JP2023/022228 WO2024257301A1 (ja) | 2023-06-15 | 2023-06-15 | 設備効率低下診断装置、学習装置、監視装置及び省エネルギー活動支援システム |
Publications (1)
| Publication Number | Publication Date |
|---|---|
| WO2024257301A1 true WO2024257301A1 (ja) | 2024-12-19 |
Family
ID=93851724
Family Applications (1)
| Application Number | Title | Priority Date | Filing Date |
|---|---|---|---|
| PCT/JP2023/022228 Ceased WO2024257301A1 (ja) | 2023-06-15 | 2023-06-15 | 設備効率低下診断装置、学習装置、監視装置及び省エネルギー活動支援システム |
Country Status (3)
| Country | Link |
|---|---|
| JP (1) | JPWO2024257301A1 (ja) |
| CN (1) | CN121311837A (ja) |
| WO (1) | WO2024257301A1 (ja) |
Citations (5)
| Publication number | Priority date | Publication date | Assignee | Title |
|---|---|---|---|---|
| JP2013222256A (ja) * | 2012-04-13 | 2013-10-28 | Mitsubishi Electric Corp | エネルギー使用量可視化装置及び方法 |
| JP2015088079A (ja) * | 2013-11-01 | 2015-05-07 | 株式会社日立パワーソリューションズ | 異常診断システム及び異常診断方法 |
| JP2019211919A (ja) * | 2018-06-01 | 2019-12-12 | 西日本電信電話株式会社 | 監視装置、監視方法、及びコンピュータプログラム |
| WO2019244203A1 (ja) * | 2018-06-18 | 2019-12-26 | 三菱電機株式会社 | 診断装置、診断方法及びプログラム |
| WO2021161957A1 (ja) * | 2020-02-10 | 2021-08-19 | 三菱電機株式会社 | エネルギー管理装置、サーバ、エネルギー管理システム、エネルギー管理方法、およびエネルギー管理プログラム |
-
2023
- 2023-06-15 CN CN202380099291.1A patent/CN121311837A/zh active Pending
- 2023-06-15 WO PCT/JP2023/022228 patent/WO2024257301A1/ja not_active Ceased
- 2023-06-15 JP JP2025527153A patent/JPWO2024257301A1/ja active Pending
Patent Citations (5)
| Publication number | Priority date | Publication date | Assignee | Title |
|---|---|---|---|---|
| JP2013222256A (ja) * | 2012-04-13 | 2013-10-28 | Mitsubishi Electric Corp | エネルギー使用量可視化装置及び方法 |
| JP2015088079A (ja) * | 2013-11-01 | 2015-05-07 | 株式会社日立パワーソリューションズ | 異常診断システム及び異常診断方法 |
| JP2019211919A (ja) * | 2018-06-01 | 2019-12-12 | 西日本電信電話株式会社 | 監視装置、監視方法、及びコンピュータプログラム |
| WO2019244203A1 (ja) * | 2018-06-18 | 2019-12-26 | 三菱電機株式会社 | 診断装置、診断方法及びプログラム |
| WO2021161957A1 (ja) * | 2020-02-10 | 2021-08-19 | 三菱電機株式会社 | エネルギー管理装置、サーバ、エネルギー管理システム、エネルギー管理方法、およびエネルギー管理プログラム |
Also Published As
| Publication number | Publication date |
|---|---|
| CN121311837A (zh) | 2026-01-09 |
| JPWO2024257301A1 (ja) | 2024-12-19 |
Similar Documents
| Publication | Publication Date | Title |
|---|---|---|
| CN119250802B (zh) | 一种基于大数据分析的石油钻采设备管理方法及系统 | |
| CN106873548B (zh) | 具有标准资产健康状况的工厂工艺管理系统 | |
| JP6351862B2 (ja) | 運転状態分類装置 | |
| JP5081999B1 (ja) | 異常予兆診断結果の表示方法 | |
| JP6427357B2 (ja) | 診断支援システム及び診断支援方法 | |
| CN119249674B (zh) | 制冷机房设备性能模型健康度评估方法、系统、介质及终端 | |
| CN119167041B (zh) | 一种智能制冷主机能效监控系统 | |
| CN118211943B (zh) | 一种注塑产品生产管理方法及系统 | |
| CN113934191A (zh) | 一种冷水机组故障诊断系统 | |
| JP5939439B2 (ja) | 異常診断装置 | |
| JP5824959B2 (ja) | 異常診断装置 | |
| CN118211082A (zh) | 基于数据分析的油液滤芯剩余寿命预测方法及系统 | |
| CN120386684A (zh) | 一种基于物联网的硬件设备智能监控方法 | |
| JP4134997B2 (ja) | 余寿命予測プログラム及び余寿命予測システム | |
| WO2022018912A1 (ja) | 予測システム、予測方法、ならびに表示装置 | |
| JP7355108B2 (ja) | 予測方法、予測装置、記録媒体 | |
| WO2024257301A1 (ja) | 設備効率低下診断装置、学習装置、監視装置及び省エネルギー活動支援システム | |
| JP4341779B2 (ja) | 空調機の異常検知装置及び異常検知方法 | |
| JP6024510B2 (ja) | 消費エネルギー分析装置、消費エネルギー分析方法及びコンピュータプログラム | |
| US20240126252A1 (en) | Method for suggesting equipment maintenance, electronic device and computer readable recording medium | |
| JP2024003329A (ja) | 異常検知装置、異常検知方法、及び異常検知プログラム | |
| CN115757073A (zh) | 一种系统风险识别方法及装置、电子设备、存储介质 | |
| WO2021161399A1 (ja) | エネルギー管理装置、エネルギー管理方法、およびエネルギー管理プログラム | |
| JP5817323B2 (ja) | 異常診断装置 | |
| WO2025210704A1 (ja) | エネルギー消費悪化検出装置、省エネルギー運用悪化監視システムおよびエネルギー消費悪化検出方法 |
Legal Events
| Date | Code | Title | Description |
|---|---|---|---|
| 121 | Ep: the epo has been informed by wipo that ep was designated in this application |
Ref document number: 23941605 Country of ref document: EP Kind code of ref document: A1 |
|
| WWE | Wipo information: entry into national phase |
Ref document number: 2025527153 Country of ref document: JP |
|
| WWE | Wipo information: entry into national phase |
Ref document number: 2501008428 Country of ref document: TH |
|
| NENP | Non-entry into the national phase |
Ref country code: DE |