WO2024254291A1 - Matrix bypass event production forecast deration tool - Google Patents
Matrix bypass event production forecast deration tool Download PDFInfo
- Publication number
- WO2024254291A1 WO2024254291A1 PCT/US2024/032784 US2024032784W WO2024254291A1 WO 2024254291 A1 WO2024254291 A1 WO 2024254291A1 US 2024032784 W US2024032784 W US 2024032784W WO 2024254291 A1 WO2024254291 A1 WO 2024254291A1
- Authority
- WO
- WIPO (PCT)
- Prior art keywords
- mbe
- risk
- status
- occurrence
- computer
- Prior art date
- Legal status (The legal status is an assumption and is not a legal conclusion. Google has not performed a legal analysis and makes no representation as to the accuracy of the status listed.)
- Ceased
Links
Classifications
-
- E—FIXED CONSTRUCTIONS
- E21—EARTH OR ROCK DRILLING; MINING
- E21B—EARTH OR ROCK DRILLING; OBTAINING OIL, GAS, WATER, SOLUBLE OR MELTABLE MATERIALS OR A SLURRY OF MINERALS FROM WELLS
- E21B47/00—Survey of boreholes or wells
- E21B47/006—Detection of corrosion or deposition of substances
-
- E—FIXED CONSTRUCTIONS
- E21—EARTH OR ROCK DRILLING; MINING
- E21B—EARTH OR ROCK DRILLING; OBTAINING OIL, GAS, WATER, SOLUBLE OR MELTABLE MATERIALS OR A SLURRY OF MINERALS FROM WELLS
- E21B43/00—Methods or apparatus for obtaining oil, gas, water, soluble or meltable materials or a slurry of minerals from wells
-
- E—FIXED CONSTRUCTIONS
- E21—EARTH OR ROCK DRILLING; MINING
- E21B—EARTH OR ROCK DRILLING; OBTAINING OIL, GAS, WATER, SOLUBLE OR MELTABLE MATERIALS OR A SLURRY OF MINERALS FROM WELLS
- E21B2200/00—Special features related to earth drilling for obtaining oil, gas or water
- E21B2200/20—Computer models or simulations, e.g. for reservoirs under production, drill bits
Definitions
- aspects of the present disclosure generally relate to analyzing and hence predicting effects from Matrix Bypass Events (MBEs) in oil production processes.
- MBEs Matrix Bypass Events
- Example embodiments of the present disclosure provide a new process (tool) to predict the production effects from MBEs.
- This tool can be based on an extensive study which risked the likelihood of MBE occurrence for patterns grouped by sand and completion type.
- the tool is capable of building many possible MBE forecast outcomes based on this risk assessment, evaluating the effects on production by simulating the loss of production allocated to broken or remediated patterns.
- the tool can then output a deration curve for each well to represent the expected outcome.
- a method includes determining a risk of Matrix Bypass Event (MBE) occurrence for a given sand type; assigning an MBE status to the given sand type based on the risk of MBE occurrence; and predicting an effect of the MBE status for the given sand type on production in a target production well.
- determining the risk of MBE occurrence includes generating a random number; comparing the risk of the MBE occurrence to the random number; and assigning the MBE status based on a result of comparing the risk of the MBE occurrence to the random number.
- the method further includes setting the MBE status to no MBE occurred if the random number is greater than the risk of the MBE occurrence; and setting the MBE status to MBE occurred if the random number is less than the risk of the MBE occurrence.
- the method further includes repeating the determining and the assigning for all sand types and all years of interest to yield an MBE risk schedule; and predicting the effect of the MBE status for the given sand type using the MBE risk schedule.
- predicting the effect of the MBE status includes adjusting producer capacity for the target well production based on the MBE status to yield an adjusted producer capacity; and generating a deration curve for the target production well based on the adjusted producer capacity.
- adjusting the producer capacity includes one of reducing the producer capacity by a fixed threshold or based on a multiplier corresponding to a remediation efficiency of the given sand type.
- the method further includes outputting the deration curve on a terminal.
- a system includes one or more memories having computer-readable instructions stored therein and one or more processors.
- the one or more processors configured to execute the computer-readable instructions to determine a risk of Matrix Bypass Event (MBE) occurrence for a given sand type; assign an MBE status to the given sand type based on the risk of MBE occurrence; and predict an effect of the MBE status for the given sand type on production in a target production well.
- MBE Matrix Bypass Event
- the one or more processors are configured to execute the computer- readable instructions to determine the risk of MBE occurrence by generating a random number; comparing the risk of the MBE occurrence to the random number; and assigning the MBE status based on a result of comparing the risk of the MBE occurrence to the random number.
- the one or more processors are further configured to execute the computer-readable instructions to set the MBE status to no MBE occurred if the random number is greater than the risk of the MBE occurrence; and set the MBE status to MBE occurred if the random number is less than the risk of the MBE occurrence.
- the one or more processors are further configured to execute the computer-readable instructions to repeat determining and assigning processes for all sand types and all years of interest to yield an MBE risk schedule; and predict the effect of the MBE status for the given sand type using the MBE risk schedule.
- the one or more processors are configured to execute the computer- readable instructions to predict the effect of the MBE status by adjusting producer capacity for the target well production based on the MBE status to yield an adjusted producer capacity; and generating a deration curve for the target production well based on the adjusted producer capacity.
- the one or more processors are configured to execute the computer- readable instructions to adjust the producer capacity by one of reducing the producer capacity by a fixed threshold or based on a multiplier corresponding to a remediation efficiency of the given sand type.
- the one or more processors are further configured to execute the computer-readable instructions to output the deration curve on a terminal.
- one or more non-transitory computer-readable media comprising computer-readable instructions, which when executed by one or more processors, cause the one or more processors to determine a risk of Matrix Bypass Event (MBE) occurrence for a given sand type assign an MBE status to the given sand type based on the risk of MBE occurrence; and predict an effect of the MBE status for the given sand type on production in a target production well.
- MBE Matrix Bypass Event
- the execution of the computer-readable instructions cause the one or more processors to determine the risk of MBE occurrence by generating a random number; comparing the risk of the MBE occurrence to the random number; and assigning the MBE status based on a result of comparing the risk of the MBE occurrence to the random number.
- the execution of the computer-readable instructions cause the one or more processors to set the MBE status to no MBE occurred if the random number is greater than the risk of the MBE occurrence; and set the MBE status to MBE occurred if the random number is less than the risk of the MBE occurrence.
- the execution of the computer-readable instructions cause the one or more processors to repeat determining and assigning processes for all sand types and all years of interest to yield an MBE risk schedule; and predict the effect of the MBE status for the given sand type using the MBE risk schedule.
- the execution of the computer-readable instructions cause the one or more processors to predict the effect of the MBE status by adjusting producer capacity for the target well production based on the MBE status to yield an adjusted producer capacity; and generating a deration curve for the target production well based on the adjusted producer capacity.
- the execution of the computer-readable instructions cause the one or more processors to adjust the producer capacity by one of reducing the producer capacity by a fixed threshold or based on a multiplier corresponding to a remediation efficiency of the given sand type.
- FIG. 1 illustrates an example on-site setting for performing a fracturing process, according to an aspect of the present disclosure
- FIG. 2 is a visual presentation of different sand types (patterns), according to some aspects of the present disclosure
- FIG. 3 illustrates an example multilateral completion design with individual horizontal laterals, according to some aspects of the present disclosure
- FIG. 4 schematically illustrates an example of a MBE, according to some aspects of the present disclosure
- FIG. 5 illustrates an example of cumulative risk of MBE for two different types of sands, according to some aspects of the present disclosure
- FIG. 6 illustrates change in MBE risk versus sand pattern change, according to some aspects of the present disclosure
- FIG. 7 illustrates the concept of unconfined compressive strength (UCS) of different sands, according to some aspects of the present disclosure
- FIG. 8 is a plot of UCS versus depth from the top of the producing zone for B and D type sands, according to some aspects of the present disclosure
- FIG. 9 illustrates a cumulative risk for B sand patterns targeted with horizontal producing laterals with no sand control supported by horizontal slotted liner injectors, according to some aspects of the present disclsoure;
- FIG. 10 illustrates frequency plot for B sand pattern completion types according to some aspects of the present disclosure
- FIG. 11 illustrates a cumulative risk for D sand patterns targeted with horizontal producing laterals with no sand control supported by horizontal slotted liner injectors, according to some aspects of the present disclosure
- FIG. 12 illustrates frequency plot for D sand pattern completion types according to some aspects of the present disclosure
- FIG. 13 shows the cumulative MBE risk for B sand patterns targeted with horizontal producing laterals with no sand control supported by horizontal slotted liner injectors, according to some aspects of the present disclosure
- FIG. 14 shows the frequency plot for B sand pattern completion types , according to some aspects of the present disclosure
- FIG. 15 shows example final risk curves, extrapolated forward an adequate period for forecasting, according to some aspects of the present disclosure
- FIG. 16 is a flowchart of an example process performed to determine MBE deration, according to some aspects of the present disclosure
- FIG. 17 illustrates an example duration curve for a high risk well, according to some aspects of the present disclosure
- FIG. 18 illustrates an example duration curve for a lower risk well, according to some aspects of the present disclosure
- FIG. 19 illustrates reduced capacity for wells currently carrying remediated patterns, according to some aspects of the present disclosure
- FIG. 20 shows an example of computing system, according to some aspects of the present disclosure.
- references to “one embodiment” or “an embodiment” means that a particular feature, structure, or characteristic described in connection with the example embodiment is included in at least one example embodiment of the disclosure.
- the appearances of the phrase “in one embodiment” in various places in the specification are not necessarily all referring to the same example embodiment, nor are separate or alternative example embodiments mutually exclusive of other example embodiments.
- various features are described which may be exhibited by some example embodiments and not by others.
- the disclosure begins with a description of an example environment, in which the methods and systems of the present disclosure can be applied.
- FIG. 1 illustrates an example on-site setting for performing a fracturing process, according to an aspect of the present disclosure.
- the system diagram is representative of a hydraulic fracture system 100 operably coupled with a well head 102, and set up to hydraulically fracture stages 104 of a horizontal section 106 of a wellbore 108.
- the hydraulic fracturing equipment may include pump trucks, sources of water (e.g., water trucks), and sources of proppant, diverter, and other substances that may be combined with water and injected into the well as part of the hydraulic fracturing process.
- a pump truck is connected to the well head 102 to pump, under controlled pressure and rate, the hydraulic fracturing fluid into the well which flows through a well casing (not shown) to the stage 104 being hydraulic fractured.
- the casing of the stage has been perforated such that fluid pumped into the stage can flow through the perforations to open fractures 112 in the formation 110 surrounding the well.
- a horizontal section typically has numerous stages as a horizontal section of a well may be thousands of feet, and stages are discrete sections around one hundred feet.
- data and interactions with an offset well 116 may further be assessed.
- the offset well 116 may be fitted with various possible sensors for measuring pressure, e.g., tubing pressure in one example, within the well or within some portion or portions of the well.
- the well and the equipment involved in the hydraulic fracturing process may include sensors, gauges, and other devices to monitor and record data associated with the hydraulic fracturing processes.
- the data may then be reported and stored at a processing system 114.
- the processing system 114 may involve one or more computing devices, at the well site.
- the processing system 114 may be in wired or wireless communication with various aspects of the well and/or the fracturing equipment.
- Processing system 114 may be communicatively coupled to an off-site (remote) processing center 118.
- remote processing center 118 may receive streams of data from processing system 114 to perform real-time processing of the received data to determine start and end times of various stages of the fracturing process.
- a zipper fracturing process may involve multiple wells such as well 108, each with multiple fracture stages such as stages 104.
- Various sensors installed in each such well may monitor statistics and data, as described above for each stage of fracturing of each well.
- Such data is then transmitted, using any known or to be developed method, from on-site processing systems such as processing system 114 to remote processing center 118 for analysis, as will be described below.
- Remote processing center 118 may also be referred to as remote processor 118 and/or controller 118.
- example setting of claim 1 is more specific to a fracturing process
- the MBE forecasting tool disclosed herein is not limited to being applicable to a fracturing process but can be used in other settings including, but not limited to, other oil and natural resources extraction processes and settings.
- FIG. 2 is a visual presentation of different sand types (patterns), according to some aspects of the present disclosure. These sands are poorly consolidated, with permeabilities of 20 to 3000 md. Poorly consolidated reservoirs can lead to a significant risk for the development of Matrix Bypass Events (MBEs). MBEs result in pattern breakage and lost production capacity.
- MBEs Matrix Bypass Events
- the present disclosure provides a new tool to predict these production effects from MBEs.
- This example tool is based on an extensive study which risked the likelihood of MBE occurrence for patterns grouped by sand and completion type. Based on this risk assessment, the tool builds many possible MBE forecast outcomes, evaluating the effects on production by simulating the loss of production allocated to broken or remediated patterns. It then outputs a deration curve for each well to represent the expected outcome. While built on several simplifications and assumptions, back-casting exercises indicate that the new tool is useful and more predictive than previous approaches.
- FIG. 3 illustrates an example multilateral completion design 300 with individual horizontal laterals 302, 304, and 306, according to some aspects of the present disclosure.
- the number of individual horizontal laterals is not limited to three but may be more or less.
- MBEs Matrix Bypass Events
- FIG. 4 schematically illustrates an example of a MBE, according to some aspects of the present disclosure.
- multilateral producer 400 as described with reference to FIG. 3, may have horizontal laterals 400-1, 400-2, and 400-3 while multilateral injector 402 may have horizontal laterals 402-1, 402-2, and 402-3.
- MBEs may cause multilateral producer 400 to be ‘connected’ to multilateral injector 402 via conduit 404 at horizontal laterals 400-1 and 402-1 (shows as heel MBE event), and via conduit 406 at horizontal laterals 400-2 and 402-2 (caused by a toe MBE event).
- MBEs result in pattern breakage since all fluid injected into the broken lateral (e.g., lateral 400-1 and/or lateral 402-1) can go through the corresponding one of conduits 404 and 406 instead of sweeping oil from the pattern. Furthermore, any other patterns supported by this broken injecting lateral will also lose injection support and will be effectively broken. These patterns may be ‘indirectly’ affected by any of these MBEs.
- Timing of MBEs may be understood through a risk-assessment informed by applicable risk factors, both within and beyond an operator’s control.
- Geomechanical studies have helped to identify a number of these risk factors. These risk factors can include, but are not limited to, rock strength, flow rate, pressure, etc.
- Cohesiveness or strength of the reservoir rock itself can be indicative of an MBE risk (e.g., the stronger the rock, the more resistant it will be to sand production, and thus a lower risk of an MBE).
- MBE risk e.g., the stronger the rock, the more resistant it will be to sand production, and thus a lower risk of an MBE.
- the three main productive sands in the non-limiting example of West Sak show contrasting MBE risk that can be convincingly tied to differences in rock strength.
- Flow rate is another risk factor, where higher liquid throughput rates result in more rapid sand production and a higher risk of an MBE.
- the flow rate may be influenced by injection conformance. If a single interval sees higher flow rates, then that zone would also see higher rates of sand production and a higher risk of MBE development. Once an MBE forms, regardless of where it is located, the entire pattern is broken. Furthermore, a higher permeability zones also tend to have lower rock strength. As such, injection conformance should be maintained to avoid overflooding a single zone and forming an MBE.
- Pressure is another risk factor.
- the strength of the rock can be influenced by the pressure exerted upon it.
- reservoir pressure by targeting a voidage replacement ratio of about one.
- Drawdown pressure and interwell pressure gradient can be limited to keep sand grains in place. Accordingly, pre-production on the injectors should be limited during development start-up.
- injecting lateral carrying the MBE may be isolated with an iso-sleeve and the remaining injecting laterals are brought back online. If the MBE is deemed treatable, then the appropriate treatment option is selected.
- cement remains the preferred treatment option, being cheap and simple with the reasonable downside of losing injection in the toe of the well. For more proximal MBEs, the downside of cement treatments becomes less palatable, and other treatment options have been developed.
- Example embodiments of tool disclosed herein for MBE deration and the underlying model addresses both the timing and the effects of an MBE.
- the question of timing - when an MBE will occur - is based on a detailed risk assessment, whereas the question of effect - what happens to production after an MBE occurs - is based on simulation of injecting lateral shut- ins and pattern breakage.
- the disclosure first addresses the question of timing and associated risk management.
- FIG. 5 illustrates an example of cumulative risk of MBE for two different types of sands, according to some aspects of the present disclosure.
- pie chart 502 shows MBE risk associated with type B sand while pie chart 504 shows MBE risk associated with type D sand.
- 30% of all B sand patterns considered have been influenced by MBEs, with 18% having directly sustained an MBE.
- about 13% of all D sand patterns have been influenced by an MBE, with only 9% having sustained an MBE directly.
- the A sand has yet to have a confirmed MBE.
- FIG. 6 illustrates change in MBE risk versus sand pattern change, according to some aspects of the present disclosure.
- each bar may represent the percentage of patterns (binned by pattern type) having reached or exceeded a given age that experienced an MBE in that year of their life.
- Risk curves may be developed based on the data grouped by these classifications shown in FIGs. 5 and 6. As will be described, these curves may be extrapolated and used to describe the MBE risk in final deration model (described below).
- FIG. 7 illustrates the concept of unconfined compressive strength (UCS) of different sands, according to some aspects of the present disclosure.
- UCS unconfined compressive strength
- the model can assume the MBE risk for the A sands to be negligible. This is supported practically as the A sands are not the strongest producing zone in West Sak on account of their poor lateral extent and lesser reservoir quality.
- FIG. 8 is a plot of UCS versus depth from the top of the producing zone for B and D type sands, according to some aspects of the present disclosure.
- Plot 800 shows UCS v. depth from top by B sand while plot 802 shows UCS v. depth from top for D sands.
- By sand features a weak interval within its uppermost five feet, which is expected to fail earlier and more frequently.
- This differential MBE risk is compounded by two additional factors.
- One such factor being is that the C shale, a competent rock, unconformably overlies this preferentially weak zone and is believed to form a structural “ceiling” that effectively prevents MBEs from collapsing.
- this uppermost five feet is also the highest permeability zone that results in differentially high throughput rates and thus carries an even greater risk of MBEs. Accordingly, this zone may be directly responsible for the early-time MBE events observed in the B sand while the same are not observed in the D sand.
- FIG. 9 illustrates a cumulative risk for B sand patterns targeted with horizontal producing laterals with no sand control supported by horizontal slotted liner injectors, according to some aspects of the present disclsoure. As can be seen from pie chart 900, one- third of these patterns have had an MBE, with well over half having been impacted by MBEs in some way.
- FIG. 10 illustrates frequency plot for B sand pattern completion types according to some aspects of the present disclosure. Graph 1000 shows both the early-time risk characteristic of the B sand along with the later time risk as the patterns mature.
- FIG. 11 illustrates a cumulative risk for D sand patterns targeted with horizontal producing laterals with no sand control supported by horizontal slotted liner injectors, according to some aspects of the present disclosure. As can be seen from pie chart 1100, About a quarter of these patterns have experienced MBE impacts.
- FIG. 12 illustrates frequency plot for D sand pattern completion types according to some aspects of the present disclosure. Graph 1200 shows, as is typical of the D sand, the risk increases with pattern age, asymptotically flattening in later time.
- ICDs injection control devices
- FIG. 13 shows the cumulative MBE risk for B sand patterns targeted with horizontal producing laterals with no sand control supported by horizontal slotted liner injectors, according to some aspects of the present disclosure.
- MBEs the cumulative MBE risk for B sand patterns targeted with horizontal producing laterals with no sand control supported by horizontal slotted liner injectors, according to some aspects of the present disclosure.
- MBEs the cumulative MBE risk for B sand patterns targeted with horizontal producing laterals with no sand control supported by horizontal slotted liner injectors, according to some aspects of the present disclosure.
- MBEs the cumulative MBE risk for B sand patterns targeted with horizontal producing laterals with no sand control supported by horizontal slotted liner injectors
- FIG. 14 shows the frequency plot for B sand pattern completion types , according to some aspects of the present disclosure. Only the early-time risk is observed for vertical injectors in the B sand compared to FIG. 10.
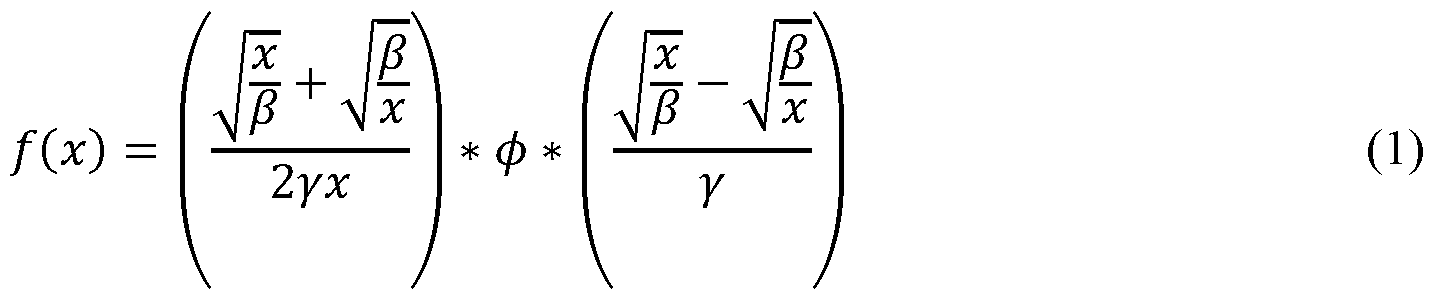
- risk curves are fit to MBE frequency plot and then extrapolated for forecasting MBE risk. Risk curves may then be provided as input into the MBE deration model. These curves are based on the fatigue life distribution family of curves, which describe material failure risk with age.
- PDF probability density function
- CDF cumulative distribution function
- Either the PDF or the hazard function can fit the MBE frequency data by appropriately tuning the scale and shape parameters.
- FIG. 10 shows curve fit 1202 to D sand patterns with uncontrolled horizontal producers and slotted liner injectors. This data displays the asymptotic increasing risk with pattern age and was fit accordingly.
- FIG. 14 stands in contrast.
- Curve fit 1402 is fit with appropriate shape factor to the B sand patterns with vertical injectors display the early-time differential risk.
- the B sand horizontal slotted liner injector patterns shown in FIG. 10 display both an early time and a later time risk. Therefore, no single fatigue life distribution curve could capture both behaviors.
- FIG. 15 shows example final risk curves, extrapolated forward an adequate period for forecasting, according to some aspects of the present disclosure.
- Extrapolated risk curves by pattern sand and completion In graph 1500, curve 1502 represents the patterns with a negligible risk.
- Curve 1504 represents B sand patterns with slotted liner injectors and no sand control on the producers, with the weak B sand zone present.
- Curve 1506 represents the B sand patterns with vertical injectors and no sand control on the producers.
- Curve 1508 represents D sand patterns with slotted liner injectors and no sand control on the producers.
- Curve 1510 represents B sand patterns with slotted liner injectors and no sand control on the producers, without the weak B sand zone present.
- Example embodiments of tool disclosed herein for MBE deration and the underlying model addresses both the timing and the effects of an MBE.
- the question of timing (when an MBE will occur), is based on a detailed risk assessment, whereas the question of effect - what happens to production after an MBE occurs (effect), is based on simulation of injecting lateral shut-ins and pattern breakage.
- FIG. 16 is a flowchart of an example process performed to determine MBE deration, according to some aspects of the present disclosure.
- Process of FIG. 16 may be performed by any processing component (e.g., processing system 114, at remote processing center 118 of FIG. 1, etc.). It should be understood that such processing component can have one or more memories storing computer-readable instructions, which when executed by one or more processors, cause the processing component(s) to implement steps of FIG. 16. For sake of description, processes of FIG. 16 will be described from the perspective of processing system 114 of FIG. 1.
- processing system 114 may determine a risk of MBE occurrence for a particular sand pattern from age and risk curve assigned to the particular sand pattern, ‘p ’ in a given year ‘ ’, as described above with reference to FIGs. 9-15.
- the risk may be represented as a number, ‘A’ for a particular pattern In other words at step 1602 R p is determined.
- processing system 114 starts by resolving the MBE status of each pattern from the previous year. If the particular pattern had an MBE or was carrying a remediation in the previous year, processing system 114 determines a remediation in the given year. If the particular pattern was indirectly affected by an MBE in the previous year or had no MBE effects, then processing center 114 assigns a no MBE effects to the particular pattern in the given year. The tool determines which patterns experience MBEs in a given year. For each pattern that is listed as remediated or unaffected, the risk of an MBE occurring is determined based on the assigned risk curve and the pattern age in the given year, as described above with reference to FIGs. 9-15. [0102] At step 1604, processing system 114 generates a random number and compares R p to the random number ‘ri.
- processing system 114 determines if n is greater than R p or not. If at step 1606, processing system 114 determines that n is greater than R P , then at step 1608, processing center 114 determines no MBE for the particular sand type ‘ ’ in that given year (assigns no MBE to sand type ‘ ’ in year ‘ ’). If n is less than R P , at step 1610, processing system 114 assigns MBE status to the particular sand pattern (assigns MBE to sand type ‘ ’ in year ‘ ’ ). In this case, any other patterns that are supported by the involved injecting lateral (same injector in the same sand) are assigned the “indirect” status.
- processing system 114 determines if there are more active sand patterns for which an MBE status is to be determined (e.g., p being less than ‘P’, with ‘P’ being an upper threshold on the number of different sand patterns). If there are more active sand patterns (No at step 1612), ‘ ’ is incremented by 1 and the process reverts back to step 1602 and processing system 114 repeats steps 1602 to 1610 for all remaining sand patterns.
- processing system 114 determines if all desired years (during which each active sand pattern may or may not have experienced an MBE) have been covered (i.e., whether ‘ ’ is equal to ‘Y’, with ‘Y’ being an upper limit on the number of years for which the analysis is being carried out).
- processing system 114 At step 1616 and based on the iterative processes performed at steps 1602-1614 for all sand types and all desired years, processing system 114 generates a single risk-informed MBE schedule.
- Steps 1602-1616 address the timing aspect of the MBE deration model creation mentioned above.
- the model evaluates the effects of the constructed MBE schedule on production. If an MBE occurs, the tool simulates the shut-in of the involved injecting lateral. This is achieved by removing the production allocation assigned to patterns supported by said injecting lateral (these patterns were identified in the previous steps of 1602-1616 with the MBE and indirect status assignments).
- an assumption is made that produces (operators of wells) start with a 100% capacity that may subsequently be derated based on assigned pattern MBE status described above.
- processing system 114 determines the MBE status for a given sand pattern p from the schedule of step 1616. If the MBE status indicates an MBE assigned (direct and/or indirect) to the sand pattern /?, then at step 1620, processing system 114 reduces capacity of the given sand pattern by a threshold (e.g., fixed threshold (e.g., percentage) such as 15% - from 100% to 85%).
- a threshold e.g., fixed threshold (e.g., percentage) such as 15% - from 100% to 85%.
- sand patterns subject to the determination at step 1618 may be those that are relevant to a particular producer for a particular reservoir location.
- processing system 114 If the MBE status indicates no MBE assigned to the sand pattern /?, then at step 1621, processing system 114 maintains full producer capacity for the given sand pattern. If the MBE status indicates remediated MBE status to the sand pattern /?, at step 1622, processing system 114 multiplies the percent allocated to the sand pattern p by the remediation efficiency, and this reduced percent allocation is returned to the producer.
- processing system 114 generates a deration curve for each well based on the remaining capacity for each producer for each year, averaged across all iterations.
- processing system 114 may output the deration curves on a user interface available to an operator via terminal (e.g., computer device) communicatively coupled to processing system 114.
- terminal e.g., computer device
- An example advantage of the deration process (tool) implemented via the process of FIG. 16, is that it produces unique deration curves for each well, allowing that well’s risk to be appropriately classified. For example, a well with a higher risk for MBEs will have a steeper deration curve.
- FIG. 17 illustrates an example duration curve for a high risk well (see graph 1700), according to some aspects of the present disclosure.
- FIG. 18 illustrates an example duration curve for a lower risk well (see graph 1800), according to some aspects of the present disclosure.
- the tool also acknowledges existing MBE history through a user input, incorporating reduced capacity for wells currently carrying remediated patterns as shown in FIG. 19.
- Example embodiments of the present disclosure provide a new tool to predict the production effects from MBEs.
- This tool can be based on an extensive study which risked the likelihood of MBE occurrence for patterns grouped by sand and completion type. Similar to a Monte Carlo analysis, the tool is capable of building many possible MBE forecast outcomes based on this risk assessment, evaluating the effects on production by simulating the loss of production allocated to broken or remediated patterns. The tool can then output a deration curve for each well to represent the expected outcome.
- FIG. 20 shows an example of computing system, according to some aspects of the present disclosure.
- Computing system 2000 can be for example any computing device can include processing system 114, remote processing center 118. Components of computing system 2000 may be in communication with each other using connection 2005.
- Connection 2005 can be a physical connection via a bus, or a direct connection into processor 2010, such as in a chipset architecture.
- Connection 2005 can also be a virtual connection, networked connection, or logical connection.
- computing system 2000 is a distributed system in which the functions described in this disclosure can be distributed within a datacenter, multiple data centers, a peer network, etc.
- one or more of the described system components represents many such components each performing some or all of the function for which the component is described.
- the components can be physical or virtual devices.
- Example system 2000 includes at least one processing unit (CPU or processor) 2010 and connection 2005 that couples various system components including system memory 2015, such as read-only memory (ROM) 2020 and random access memory (RAM) 2025 to processor 2010.
- system memory 2015 such as read-only memory (ROM) 2020 and random access memory (RAM) 2025
- Computing system 2000 can include a cache of high-speed memory 2012 connected directly with, in close proximity to, or integrated as part of processor 2010.
- Processor 2010 can include any general purpose processor and a hardware service or software service, such as services 2032, 2034, and 2036 stored in storage device 2030, configured to control processor 2010 as well as a special -purpose processor where software instructions are incorporated into the actual processor design.
- Processor 2010 may essentially be a completely self-contained computing system, containing multiple cores or processors, a bus, memory controller, cache, etc.
- a multi-core processor may be symmetric or asymmetric.
- computing system 2000 includes an input device 2045, which can represent any number of input mechanisms, such as a microphone for speech, a touch-sensitive screen for gesture or graphical input, keyboard, mouse, motion input, speech, etc.
- Computing system 2000 can also include output device 2035, which can be one or more of a number of output mechanisms known to those of skill in the art.
- output device 2035 can be one or more of a number of output mechanisms known to those of skill in the art.
- multimodal systems can enable a user to provide multiple types of input/output to communicate with computing system 2000.
- Computing system 2000 can include communications interface 2040, which can generally govern and manage the user input and system output. There is no restriction on operating on any particular hardware arrangement, and therefore the basic features here may easily be substituted for improved hardware or firmware arrangements as they are developed.
- Storage device 2030 can be a non-volatile memory device and can be a hard disk or other types of computer readable media which can store data that are accessible by a computer, such as magnetic cassettes, flash memory cards, solid state memory devices, digital versatile disks, cartridges, random access memories (RAMs), read-only memory (ROM), and/or some combination of these devices.
- a computer such as magnetic cassettes, flash memory cards, solid state memory devices, digital versatile disks, cartridges, random access memories (RAMs), read-only memory (ROM), and/or some combination of these devices.
- the storage device 2030 can include software services, servers, services, etc., that when the code that defines such software is executed by the processor 2010, it causes the system to perform a function.
- a hardware service that performs a particular function can include the software component stored in a computer-readable medium in connection with the necessary hardware components, such as processor 2010, connection 2005, output device 2035, etc., to carry out the function.
- the computer-readable storage devices, media, and memories can include a cable or wireless signal containing a bit stream and the like.
- non-transitory computer-readable storage media expressly exclude media such as energy, carrier signals, electromagnetic waves, and signals per se.
- Methods according to the above-described examples can be implemented using computer-executable instructions that are stored or otherwise available from computer readable media.
- Such instructions can comprise, for example, instructions and data which cause or otherwise configure a general-purpose computer, special purpose computer, or special purpose processing device to perform a certain function or group of functions. Portions of computer resources used can be accessible over a network.
- the computer executable instructions can be, for example, binaries, intermediate format instructions such as assembly language, firmware, or source code. Examples of computer-readable media that can be used to store instructions, information used, and/or information created during methods according to described examples include magnetic or optical disks, flash memory, USB devices provided with non-volatile memory, networked storage devices, and so on.
- Devices implementing methods according to these disclosures can comprise hardware, firmware, and/or software, and can take various form factors. Some examples of such form factors include general-purpose computing devices such as servers, rack mount devices, desktop computers, laptop computers, and so on, or general-purpose mobile computing devices, such as tablet computers, smartphones, personal digital assistants, wearable devices, and so on.
- general-purpose computing devices such as servers, rack mount devices, desktop computers, laptop computers, and so on
- general-purpose mobile computing devices such as tablet computers, smartphones, personal digital assistants, wearable devices, and so on.
- the functionality described herein also can be embodied in peripherals or add-in cards. Such functionality can also be implemented on a circuit board among different chips or different processes executing in a single device, by way of further example.
- the instructions, media for conveying such instructions, computing resources for executing them, and other structures for supporting such computing resources are means for providing the functions described in these disclosures.
- Claim language reciting "at least one of' refers to at least one of a set and indicates that one member of the set or multiple members of the set satisfy the claim.
- claim language reciting “at least one of A and B” means A, B, or A and B.
Landscapes
- Life Sciences & Earth Sciences (AREA)
- Engineering & Computer Science (AREA)
- Geology (AREA)
- Mining & Mineral Resources (AREA)
- Physics & Mathematics (AREA)
- Environmental & Geological Engineering (AREA)
- Fluid Mechanics (AREA)
- General Life Sciences & Earth Sciences (AREA)
- Geochemistry & Mineralogy (AREA)
- Geophysics (AREA)
- Management, Administration, Business Operations System, And Electronic Commerce (AREA)
Abstract
Description


Claims
Priority Applications (2)
| Application Number | Priority Date | Filing Date | Title |
|---|---|---|---|
| EP24820028.9A EP4724933A1 (en) | 2023-06-06 | 2024-06-06 | Matrix bypass event production forecast deration tool |
| AU2024285213A AU2024285213A1 (en) | 2023-06-06 | 2024-06-06 | Matrix bypass event production forecast deration tool |
Applications Claiming Priority (2)
| Application Number | Priority Date | Filing Date | Title |
|---|---|---|---|
| US202363471387P | 2023-06-06 | 2023-06-06 | |
| US63/471,387 | 2023-06-06 |
Publications (1)
| Publication Number | Publication Date |
|---|---|
| WO2024254291A1 true WO2024254291A1 (en) | 2024-12-12 |
Family
ID=93745529
Family Applications (1)
| Application Number | Title | Priority Date | Filing Date |
|---|---|---|---|
| PCT/US2024/032784 Ceased WO2024254291A1 (en) | 2023-06-06 | 2024-06-06 | Matrix bypass event production forecast deration tool |
Country Status (4)
| Country | Link |
|---|---|
| US (1) | US20240410266A1 (en) |
| EP (1) | EP4724933A1 (en) |
| AU (1) | AU2024285213A1 (en) |
| WO (1) | WO2024254291A1 (en) |
Citations (3)
| Publication number | Priority date | Publication date | Assignee | Title |
|---|---|---|---|---|
| US20110010143A1 (en) * | 2009-07-13 | 2011-01-13 | Jianchun Dai | Tar estimation |
| US20120267098A1 (en) * | 2011-04-21 | 2012-10-25 | Conocophillips Company | Process of sealing a breakthrough created during the production of hydrocarbons in a subterranean formation |
| US20130096890A1 (en) * | 2011-10-13 | 2013-04-18 | William Brian Vanderheyden | Material point method modeling in oil and gas reservoirs |
-
2024
- 2024-06-06 WO PCT/US2024/032784 patent/WO2024254291A1/en not_active Ceased
- 2024-06-06 US US18/736,058 patent/US20240410266A1/en active Pending
- 2024-06-06 AU AU2024285213A patent/AU2024285213A1/en active Pending
- 2024-06-06 EP EP24820028.9A patent/EP4724933A1/en active Pending
Patent Citations (3)
| Publication number | Priority date | Publication date | Assignee | Title |
|---|---|---|---|---|
| US20110010143A1 (en) * | 2009-07-13 | 2011-01-13 | Jianchun Dai | Tar estimation |
| US20120267098A1 (en) * | 2011-04-21 | 2012-10-25 | Conocophillips Company | Process of sealing a breakthrough created during the production of hydrocarbons in a subterranean formation |
| US20130096890A1 (en) * | 2011-10-13 | 2013-04-18 | William Brian Vanderheyden | Material point method modeling in oil and gas reservoirs |
Non-Patent Citations (1)
| Title |
|---|
| KEITH CODY D, ABBAS SAYEED, AUTRY SYDNEY: "Data Driven Risk Analysis and Production Forecast Deration for Matrix Bypass Events in the West Sak Oil Pool, Alaska North Slope", SPE WESTERN REGIONAL MEETING, ANCHORAGE, ALASKA, USA, MAY 2023., 15 May 2023 (2023-05-15), pages 1 - 19, XP009559508, DOI: 10.2118/212950-MS * |
Also Published As
| Publication number | Publication date |
|---|---|
| EP4724933A1 (en) | 2026-04-15 |
| US20240410266A1 (en) | 2024-12-12 |
| AU2024285213A1 (en) | 2025-12-04 |
Similar Documents
| Publication | Publication Date | Title |
|---|---|---|
| Weddle et al. | Mining the Bakken II–Pushing the envelope with extreme limited entry perforating | |
| Allison et al. | Restimulation of wells using biodegradable particulates as temporary diverting agents | |
| CA3081744A1 (en) | Systems and methods for real-time hydraulic fracture control | |
| US11939864B2 (en) | Cluster efficiency operation control | |
| Cohen et al. | Optimum Fluid and Proppant Selection for Hydraulic Fracturing in Shale Gas Reservoirs: a Parametric Study Based on Fracturing-to-Production Simulations. | |
| Kayumov et al. | First channel fracturing applied in mature wells increases production from Talinskoe oilfield in western Siberia | |
| Martinez et al. | Horizontal pressure sink mitigation completion design: a case study in the Haynesville Shale | |
| Melcher et al. | Restimulation design considerations and case studies of haynesville shale | |
| Cohen et al. | Analysis on the impact of fracturing treatment design and reservoir properties on production from shale gas reservoirs | |
| US9670753B2 (en) | Optimized acidizing of production and injection wells | |
| Izurieta et al. | Chemical sand consolidation as an effective alternative to conventional sand control methods in Ecuador | |
| El Sgher et al. | The Impact of Stress Shadowing and Geomechanical Effects on Gas Production From Marcellus Shale | |
| Barba et al. | The Economics of Refracturing in the Haynesville | |
| El Sgher et al. | An analysis of effect different fracturing fluids on the productivity of multi-stage fractured Marcellus shale horizontal wells | |
| Dilimulati et al. | Experimental investigation of solids production mechanisms in a hydraulic screen-through fracturing well in a loose reservoir and its control | |
| US20240410266A1 (en) | Matrix bypass event production forecast deration tool | |
| Dahl et al. | An evaluation of completion effectiveness in hydraulically fractured wells and the assessment of refracturing scenarios | |
| Al Samli et al. | Hydraulic Fracturing Design Optimization Guidelines for Heterogeneous Reservoir | |
| US11927080B2 (en) | Sand screen selection | |
| Ajisafe et al. | Understanding and mitigating depletion effects in infill wells for optimized production | |
| WO2016076746A1 (en) | Real-time and post-job design optimization workflows | |
| Safar et al. | First Successful Massive Hydraulic Fracturing Treatment in Mid-Cretaceous Sandstone Formation in West Kuwait | |
| Frick et al. | State-of-the-art in the matrix stimulation of horizontal wells | |
| Xing et al. | Quantitative Characterization of Water Fracturing and Supercritical CO2 Fracturing in Continental Shale: Synergistic Effects of Stress and Fluid Type | |
| Al-Tailji et al. | Optimizing hydraulic fracture performance in the liquids-rich Eagle Ford shale-how much proppant is enough? |
Legal Events
| Date | Code | Title | Description |
|---|---|---|---|
| 121 | Ep: the epo has been informed by wipo that ep was designated in this application |
Ref document number: 24820028 Country of ref document: EP Kind code of ref document: A1 |
|
| WWE | Wipo information: entry into national phase |
Ref document number: AU2024285213 Country of ref document: AU |
|
| ENP | Entry into the national phase |
Ref document number: 2024285213 Country of ref document: AU Date of ref document: 20240606 Kind code of ref document: A |
|
| WWE | Wipo information: entry into national phase |
Ref document number: 2024820028 Country of ref document: EP |
|
| NENP | Non-entry into the national phase |
Ref country code: DE |
|
| ENP | Entry into the national phase |
Ref document number: 2024820028 Country of ref document: EP Effective date: 20260107 |
|
| ENP | Entry into the national phase |
Ref document number: 2024820028 Country of ref document: EP Effective date: 20260107 |
|
| ENP | Entry into the national phase |
Ref document number: 2024820028 Country of ref document: EP Effective date: 20260107 |
|
| ENP | Entry into the national phase |
Ref document number: 2024820028 Country of ref document: EP Effective date: 20260107 |
|
| ENP | Entry into the national phase |
Ref document number: 2024820028 Country of ref document: EP Effective date: 20260107 |
|
| WWP | Wipo information: published in national office |
Ref document number: 2024820028 Country of ref document: EP |