WO2024253963A1 - Data processing method, system, and apparatus for high resolution mass spectrometry - Google Patents
Data processing method, system, and apparatus for high resolution mass spectrometry Download PDFInfo
- Publication number
- WO2024253963A1 WO2024253963A1 PCT/US2024/031937 US2024031937W WO2024253963A1 WO 2024253963 A1 WO2024253963 A1 WO 2024253963A1 US 2024031937 W US2024031937 W US 2024031937W WO 2024253963 A1 WO2024253963 A1 WO 2024253963A1
- Authority
- WO
- WIPO (PCT)
- Prior art keywords
- ions
- peak
- compound
- interest
- analysis
- Prior art date
- Legal status (The legal status is an assumption and is not a legal conclusion. Google has not performed a legal analysis and makes no representation as to the accuracy of the status listed.)
- Ceased
Links
Classifications
-
- H—ELECTRICITY
- H01—ELECTRIC ELEMENTS
- H01J—ELECTRIC DISCHARGE TUBES OR DISCHARGE LAMPS
- H01J49/00—Particle spectrometers or separator tubes
- H01J49/0009—Calibration of the apparatus
Definitions
- the technical field of the present disclosure generally relates to a data processing method, system, and apparatus for mass spectrometry.
- the present disclosure relates to a data processing method, system, and apparatus for improving quantitative analysis of high resolution mass spectrometry data.
- Mass spectrometry generally refers to various techniques for measuring the mass-to-charge ratio (m/z) of a molecule in a compound of interest.
- gaseous or liquidous atoms are turned into charged particles (e.g., positive ions or negative ions), accelerated and introduced into the vacuum chamber of the instrument.
- the ions have their “mass to charge” ratio (m/z) determined based on deflection, filtering, arrival time, frequency of movement, depending on the type of mass analyzer used in the instrument.
- mass spectrometry will generally be used to refer to all such mass spectrometers known in the art or to be developed, such as QqQ or triple quadrupole MS, , sector mass spectrometer, time-of-flight mass spectrometer, quadrupole mass analyzer, and trap based mass spectrometers.
- mass spectrometers as well as their structure, function and operation are well known to those skilled in the art.
- the subject disclosure provides an automated data processing system and method for use in full scan mass spectrometry (MS) and/or tandem mass spectrometry (MSMS) and related mass spectrometry techniques.
- MS mass spectrometry
- MSMS tandem mass spectrometry
- the subject disclosure could be embodied in any industrial application that uses mass spectrometry for quantitative analysis, which includes, but is not limited to, pharmaceuticals, food science, and environmental industries.
- the method for processing MS data includes using the structure of the molecule being analyzed to identify all ions related to a compound. This includes multiply charged ions, adduct ions, isotopes, and fragment ions. It does this e.g., by processing a data file specified by a user or the system that has the compound of interest present. Using a bond breaking algorithm, it automatically assigns fragment ions (if present) of the compound of interest. All signals related to the molecule are then used to select a subset that provides the best overall performance for quantitative assay.
- the method automatically selects optimal parameters (e.g., ion extraction window, ions to sum, etc.) to provide the best overall method to meet acceptance criteria defined by the user or system (e.g., signal to noise, points across the peak, accuracy/precision, etc.).
- the method then conducts a regression analysis for quantitative analysis to select the best overall model (e.g., linear, quadratic, etc.) and weighting (e.g., unweighted, 1/x, 1/x2, etc.).
- the method can provide at least three different parameters: peak quality, reproducibility, and model fit quality. When multiple models are possible with the exact same quality, the simplest model is automatically selected, e.g., the one with the fewest number of combined ions.
- the method then provides method solutions including 1 ) highest dynamic range, 2) best upper limit of quantification and 3) best lower limit of quantification.
- the system for processing MS data includes a processor configured to or memory having computer executable instructions executable by a process to: determine a most suitable extraction window size based on stability of mass accuracy over all the injections, determine most suitable ions to use for quantitation (M+H, fragment ion, adduct ion, isotopes, some combination of these), iterate through all the combinations to provide acceptable accuracy and precision, determine the most suitable calibration range to use based on the spread of unknown values, truncate the top and bottom of the curve as needed, determine the best fit to use for regression analysis using statistical tools (i.e., Akaike information criteria), and do all the calculations and generate a list of concentrations for the unknown samples.
- M+H fragment ion, adduct ion, isotopes, some combination of these
- the subject disclosure provides a system for the automated processing of MS data collected using full scan mass spectrometry (MS) or full scan tandem mass spectrometry (MSMS) for quantitative analysis.
- MS full scan mass spectrometry
- MSMS full scan tandem mass spectrometry
- the automated approach or method agnostically and automatically identifies all ions related to the compound being analyzed in both the MS and MSMS data.
- the system automatically selects optimal parameters (e.g., ion extraction window, ions to sum, etc.) to provide the best overall method to meet the acceptance criteria defined by the user or system (e.g., accuracy/precision).
- the system continues to do regression analysis for quantitative analysis to select the best overall model (e.g., linear, quadratic) and weighting (e.g., unweighted, 1/x, 1/x2, etc.).
- This system provides methods for sample collection for quantitative analysis using high resolution mass spectrometry.
- the system provides data collection and processing that is faster and provides better quality than conventional methods.
- the system determines the most suitable extraction window size based on stability of mass accuracy over all the injections, determines the most suitable ions to use for quantitation (M+H, fragment ion, adduct ion, isotopes, some combination of these), iterates through all the combinations to provide acceptable accuracy and precision, determines the most suitable calibration range to use based on the spread of unknown values, truncate the top and bottom of the curve as needed, determines the best fit to use for regression analysis using statistical tools, and does all the calculations and provides concentrations for the unknown samples.
- M+H fragment ion
- adduct ion isotopes
- the subject disclosure provides a computer-implemented method for quantitative analysis of mass spectrometry data by a computing device comprising: receiving mass spectrometry data for a plurality of reference standards; receiving data indicative of a chemical structure of a compound of interest; identifying a plurality of ions related to the compound of interest based on the chemical structure; determining a chromatographic peak for each identified plurality of ions of the compound of interest; identifying ions for analysis based on the determined chromatographic peaks for each of the identified plurality of ions and the mass spectrometry data of the plurality of reference standards; determining a peak area for each of the identified ions for analysis based on an auto-adjustable extraction mass window; identifying N selected ions based on ions of interest of the plurality of reference standards having a chromatographic peak area to concentration correlation; and combining each of the N selected ions in a plurality of combinations and determining which of the plurality of combinations provides an optimized regression model for overall
- the method further comprising receiving experimental mass spectrometry data for a target compound; determining a peak for each of the ions for analysis for the target compound; determining a peak area for each of the identified ions for analysis based on an auto-adjustable extraction mass window; and determining a concentration of the target compound based on the determined optimized regression model.
- the method further provides wherein the step of identifying a plurality of ions related to the compound of interest based on the chemical structure comprises virtually fragmenting the compound of interest to identify compound related fragments.
- the method further provides wherein the step of virtually fragmenting the compound of interest comprises: identifying a starter atom and associated bond and determining if the bond is inside a cycle; identifying all atoms bonded to the starter atom; identifying a secondary atom bonded to the starter atom; and identifying all atoms bonded to the secondary atom.
- the method further provides wherein the step of determining a chromatographic peak for each identified plurality of ions of the compound of interest comprises determining a change in slope of successive peaks as ions are extracted across a time or scan window. In accordance with an aspect, the method further provides wherein the step of determining a chromatographic peak for each identified plurality of ions of the compound of interest comprises clustering signals within a predetermined m/z range based on a predetermined peak tolerance. In accordance with an aspect, the method further provides wherein in the predetermined peak tolerance is based on a number of points across the peak, a comparison of the area of the peak with the area of the same m/z outside the peak range, and/or a peak shape analysis.
- the method further provides wherein the step of determining a peak for each identified plurality of ions of the compound of interest comprises filtering based on peak shape. In accordance with an aspect, the method further provides wherein the step of identifying ions for analysis comprises determining if a difference between an m/z value of the identified plurality of ions and the mass spectrometry data for the one or more reference standards exceeds a predetermined peak tolerance.
- the method further provides wherein the step of determining a peak area for each of the identified ions for analysis based on an auto-adjustable extraction mass window comprises iteratively reducing an extraction mass window size from a prior step by a predetermined amount until a computed slope between two successive peaks is greater than a predetermined slope criteria.
- the method further provides wherein the step of determining a peak area for each of the identified ions for analysis based on an auto-adjustable extraction mass window comprises determining a slope between successive peaks.
- the method further provides wherein the step of combining each of the N selected ions and determining which of the plurality of combinations provides the optimized regression model comprises evaluating each of the plurality of combinations based on peak quality criteria.
- the method further provides wherein the peak quality criteria include a number of points across a peak, a peak area versus areas of m/z outside a peak range, and/or a peak shape.
- the method further provides wherein the step of combining each of the N selected ions comprises conducting a combinatorial analysis on a subset of the N selected ions predetermined by the user or system. In accordance with an aspect, the method further provides wherein the step of combining each of the N selected ions comprises combining the ion intensities across scans for all signals and forming a new peak. In accordance with an aspect, the method further comprising outputting the optimized regression model via a display.
- the subject disclosure provides a system for quantitative analysis of mass spectrometry data comprising: a mass spectrometer; and one or more processors configured to: receive mass spectrometry data for a plurality of reference standards; receive data indicative of a chemical structure of a compound of interest; identify a plurality of ions related to the compound of interest based on the chemical structure; determine a chromatographic peak for each identified plurality of ions of the compound of interest; identify ions for analysis based on the determined chromatographic peaks for each of the identified plurality of ions and the mass spectrometry data of the plurality of reference standards; determine a peak area for each of the identified ions for analysis based on an auto-adjustable extraction mass window; identify N selected ions based on ions of interest of the plurality of reference standards having a chromatographic peak area to concentration correlation; combine each of the N selected ions in a plurality of combinations and determining which of the plurality of combinations provides an optimized regression model for overall
- the method further provides wherein the processor is further configured to: receive experimental mass spectrometry data for a target compound; determine a peak for each of the ions for analysis for the target compound; determine a peak area for each of the identified ions for analysis based on an auto-adjustable extraction mass window; and determine a concentration of the target compound based on the determined optimized regression model.
- the subject disclosure provides a mass spectrometer having a mass analyzer, comprising: one or more processors configured to: receive mass spectrometry data for a plurality of reference standards; receive data indicative of a chemical structure of a compound of interest; identify a plurality of ions related to the compound of interest based on the chemical structure; determine a chromatographic peak for each identified plurality of ions of the compound of interest; identify ions for analysis based on the determined chromatographic peaks for each of the identified plurality of ions and the mass spectrometry data of the plurality of reference standards; determine a peak area for each of the identified ions for analysis based on an auto-adjustable extraction mass window; identify N selected ions based on ions of interest of the plurality of reference standards having a chromatographic peak area to concentration correlation; combine each of the N selected ions in a plurality of combinations and determining which of the plurality of combinations provides an optimized regression model for overall dynamic range, a lower limit
- the method further provides wherein the processor is further configured to: receive experimental mass spectrometry data for a target compound; determine a peak for each of the ions for analysis for the target compound; determine a peak area for each of the identified ions for analysis based on an auto-adjustable extraction mass window; and determine a concentration of the target compound based on the determined optimized regression model.
- FIG. 1 is a schematic block diagram depicting a system for mass spectrometry in accordance with an exemplary embodiment of the subject disclosure
- FIG. 2 is a flow diagram of a method for quantitative analysis of mass spectrometry data in accordance with an exemplary embodiment of the subject disclosure
- FIG. 3 is a representative illustration of an exemplary common output data structure applicable to the subject disclosure
- FIG. 4 is a calibration curve in connection with Example 1 ;
- FIG. 5 is a regression analysis of Predicted vs. Experimental
- FIGS. 6A-6C are compound structures and SWATH MSMS spectra in connection with Example 2;
- FIG. 7 is a table of a fragment analysis in connection with Example 3.
- FIGS. 8A, 8B are MSE spectra in connection with Example 3 for low and high collision energy traces
- FIG. 8C is a fragmentation tree in connection with Example 3.
- FIGS. 9A-9C are data tables in connection with Example 4.
- FIG. 10 is a data table in connection with Example 4.
- FIG. 11 is a schematic block diagram depicting a mass spectrometry in accordance with another exemplary embodiment of the subject disclosure.
- Ranges throughout this disclosure, various aspects of the invention can be presented in a range format. It should be understood that the description in range format is merely for convenience and brevity and should not be construed as an inflexible limitation on the scope of the invention. Accordingly, the description of a range should be considered to have specifically disclosed all the possible subranges as well as individual numerical values within that range. For example, description of a range such as from 1 to 6 should be considered to have specifically disclosed subranges such as from 1 to 3, from 1 to 4, from 1 to 5, from 2 to 4, from 2 to 6, from 3 to 6 etc., as well as individual numbers within that range, for example, 1 , 2, 2.7, 3, 4, 5, 5.3, and 6. This applies regardless of the breadth of the range.
- the subject disclosure provides a system 100 (also known as a computing device) for the quantitative analysis of mass spectrometry data.
- the system 100 can include and/or communicate with one or more components.
- system 100 may include a mass spectrometer 102 and one or more components connected (e.g., communicatively or operatively connected) to mass spectrometer 102.
- the system 100 can include any conventional mass spectrometer known in the art or to be developed capable of detecting the mass-to-charge ratio of a compound of interest and generating MS data.
- the mass spectrometer 102 can include an ion source 104, a mass analyzer 106 and an ion detector 108.
- System 100 can include a data processing system 110 configured to perform quantitative analysis of MS data in accordance with the method further described herein.
- the data processing system 110 can include a processor, or one or more processors 112.
- the data processing system 110 e.g., processor 112
- the data processing system 110 can be configured as a unitary component of the mass spectrometer or a component operatively connected to or in communication with the mass spectrometer 102. That is, the data processing system 110 and the mass spectrometry 102 can each represent a type of computing device although both may be run on a single computing device or be configured as a single computing device.
- the processor 112 can be, or can comprise, any suitable microprocessor or microcontroller, for example, a low-power application-specific controller (ASIC) and/or a field programmable gate array (FPGA) designed or programmed for the task of controlling a device, or a general purpose central processing unit (CPU), for example, one based on an architecture as designed by IntelTM or AMDTM, or a system-on-a-chip as designed by ARMTM.
- the processor 112 can be coupled (e.g., communicatively coupled and/or operatively coupled) to auxiliary devices or modules of the mass spectrometer 102 using bus 114 or other coupling.
- System 100 can comprise a power supply 116 for providing power to mass spectrometer 102 and/or one or more devices coupled to mass spectrometer 102.
- the power supply 116 can include one or more batteries and/or other power storage device and/or a port for connecting to an external power supply.
- an external power supply can supply power to the mass spectrometer 102 and a battery can store at least a portion of the supplied power.
- the system 100 can comprise a memory device 1 18.
- the memory device 118 can be internal to mass spectrometer 102 and/or external to mass spectrometer 102.
- Memory device 118 can be coupled to the processor 112.
- Memory device 118 can comprise a random access memory (RAM) configured for storing program instructions and data for execution or processing by the processor 112 during control of the mass spectrometer 102.
- RAM random access memory
- program instructions and data can be stored in a long-term memory, for example, a non-volatile magnetic optical, or electronic memory storage device.
- the RAM and/or the long-term memory can comprise a non-transitory computer-readable medium storing program instructions that, when executed by the processor 112, cause the mass spectrometer 102 to perform all or part of one or more methods and/or operations described herein.
- System 100 can comprise a network access device 120 allowing the mass spectrometer 102 to be coupled to one or more external devices.
- Mass spectrometer 102 can communicate to one or more external devices via an access point of a wireless telephone network, local area network, or other coupling to a wide area network, for example, via the Internet.
- the processor 112 can be configured to share data with the one or more external devices (e.g., external network devices) via the network access device 120.
- the shared data can include, for example, usage data and/or operational data of the mass spectrometer 102, a status of the mass spectrometer 102, a status and/or operating condition of one or more the components of the mass spectrometer 102, text to be used in a message, and/or any other data.
- the processor 112 can be configured to receive control instructions from the one or more external devices via the network access device 120.
- a configuration of the mass spectrometer 102, an operation of the mass spectrometer 102, and/or other settings of the mass spectrometer 102 can be controlled by the one or more external devices via the network access device 120.
- An external device can include a server that can provide various services and another external device.
- the external device can include a smartphone for controlling operation of the mass spectrometer 102.
- the smartphone or another external device can be used as a primary input/output of the mass spectrometer 102, such that data is received by the mass spectrometer 102 from the server, transmitted to the smartphone, and output on a display of the smartphone.
- the mass spectrometer 102 can comprise an input/output device 124 coupled to one or more of the processor 112, the network access device 120, and/or any other electronic component of the mass spectrometer 102.
- Input can be received from a user or another device and/or output can be provided to a user or another device via the input/output device 124.
- the input/output device 124 can include any combinations of input and/or output devices such as buttons, knobs, keyboards, touchscreens, display or displays, light-emitting elements, microphones, speakers, and/or the like.
- the input/output device 124 can include an interface port, such as a wired interface (e.g., a serial port, a Universal Serial Bus (USB) port, an Ethernet port, or other suitable wired connection).
- USB Universal Serial Bus
- the input/output device 124 can include a wireless interface, for example a transceiver using any suitable wireless protocol, for example WIFI (IEEE 802.11 ), Bluetooth®, infrared, or other wireless standard.
- a wireless interface for example a transceiver using any suitable wireless protocol, for example WIFI (IEEE 802.11 ), Bluetooth®, infrared, or other wireless standard.
- the input/output device 124 can communicate with a smartphone via Bluetooth® such that the inputs and outputs of the smartphone can be used by the user to interface with the mass spectrometer 102.
- the input/output device 124 can comprise a user interface.
- the user interface can include at least one of lighted signal lights, gauges, boxes, forms, check marks, avatars, visual images, graphic designs, lists, active calibrations or calculations, microphones, speakers, 2D and/or 3D representations of mass spectrometers 102 and other interface system functions.
- the input/output device 124 can comprise a touchscreen interface and/or a biometric interface.
- the input/output device 124 can include controls that allow the user to interact with and input information and commands to the mass spectrometer 102.
- the input/output device 124 can comprise a touch screen display and/or can be configured to provide screen shots.
- User inputs to the touch screen display are processed by, for example, the input/output device 124 and/or the processor 102.
- the touch screen display can provide controls and menu selections, and process commands and requests.
- Application and content objects can be provided by the touch screen display.
- the input/output device 124 and/or the processor 112 can receive and interpret commands and other inputs, and interface with the other components of the mass spectrometer 102 as required.
- the input/output device 124 can include an audio user interface.
- a microphone can be configured to receive audio signals and relay the audio signals to the input/output device 124.
- the audio user interface can be any interface that is responsive to voice or other audio commands.
- the audio user interface can be configured to cause an action, activate a function, etc., by the mass spectrometer 102 (or another device) based on a received voice (or other audio) command.
- the audio user interface can be deployed directly on the mass spectrometer 102 and/or via other electronic devices (e.g., electronic communication devices such as a smartphone, a smart watch, a tablet, a laptop, a dedicated audio user interface device, and the like).
- the audio user interface can be used to control the functionality of the mass spectrometer 102.
- FIG. 1 provides an example of the components and communications described herein.
- the components and communications between components provided in FIG. 1 are for illustrative purposes only.
- Other examples may include one or more of the components shown in FIG. 1 having one or more communications with one or more other components.
- processor 112 may communicate with one or more components
- network device 120 may communicate with one or more components
- input/output device 124 may communicate with one or more components, etc.
- mass spectrometer 102 may communicate with processor 112, and processor 112 may thereafter communicate with network device 120 and/or processor 112 may communicate with input/output device 124.
- the mass spectrometer generates MS data upon analysis of a sample of a compound of interest.
- the MS data may be transferred to one or more of the components of system 100.
- the MS data may be transferred to one or more of the components of system 100 prior to, during, and/or after a sample for a compound of interest is analyzed via the mass spectrometer.
- the MS data may be transferred to the data processing system 110 and/or may be provided to one or more users via input/output device 124.
- the MS data can include “mass to charge” ratio (m/z) values and relative intensity. This MS data can be used for a mass spectrum plot which portrays the different ions in order of their m/z value and facilitates a detailed quantitative analysis of component molecular weights.
- the subject disclosure provides a mass spectrometry 1102 having a data processing system 11 10 and/or processor 1112, a bus 1114, a power supply 1 116, a memory 1 118, and an input/output 1124.
- the components are similarly configured as described above for system 100 thereby providing a mass spectrometry configured to perform the methods of the subject disclosure (see FIG. 3).
- the subject disclosure provides a method for processing MS data collected from mass spectrometry for quantification analysis.
- the method optimizes the selection of data processing parameters to identify a best or optimized overall method for identifying a compound of interest.
- the method achieves high sensitivity and high selectivity of the compound of interest based on utilization of the subject method of processing MS data applied to the MS data of compound of interest.
- the method is a computer- implemented method for quantitative analysis of mass spectrometry data.
- the method of processing MS data is a method of quantitatively processing MS data utilizing optimized data processing parameters.
- the method includes four main stages (FIG. 2), Stage 1 ) Selection of Potential Ions for Analysis, Stage 2) Signal Calculations, Stage 3) Selection of Ions and Regression Analysis, and Stage 4) Determination of Compound Concentration Calculation.
- the mass spectrometer or system receives, obtains, or acquires data or is transmitted data thereto regarding one or more reference samples, such as a plurality of reference samples, from a set of compound standards selected by a user in view of the compound of interest in which the user is looking to perform mass spectrometry on.
- the mass spectrometer or system receives, obtains, or acquires data or is transmitted data thereto regarding one or more reference samples, such as a plurality of reference samples, from a set of compound standards identified by the system based on the compound of interest in which a mass spectrometry is to be performed on e.g., from a database of compound standards stored in memory or received by the system.
- reference samples are of a nominal concentration that is high enough to positively identify the reference compound.
- the reference samples are processed by the MS and the system receives MS data on the reference samples.
- the MS data can include a set of m/z values that can be used to identify each reference standard within a retention time window.
- the MS data on the reference standards can include all potential compound related signals for the reference compound, such as fragment ions.
- the mass spectrometer can acquire MS data from the mass spectrometer or via the mass spectrometer for said reference samples using one or more of the following data acquisition techniques: Data Dependent Acquisition (DDA), Data Independent Acquisition (DIA) or any other acquisition method.
- DDA Data Dependent Acquisition
- DIA Data Independent Acquisition
- the mass spectrometer can process all acquisition methodologies commonly used in the art or may be developed in the future. Additionally, in the event the user or system utilizes internal standards, the mass spectrometer can receive m/z data provided by the user or the system accesses m/z data from a database or memory.
- Such MS data is then transformed to a common output data structure for further processing.
- the common output data structure is a predefined data structure utilized by the system for storing MS data of the reference standards and any MS data for a compound of interest on a memory or other database in communication with the system.
- the common output data structure can be any data structure suitable for the intended purpose, such as linear data structures, tree data structures, hash tables, graph data structures and combinations thereof.
- the transformation of the MS data to the common output data structure can include one or more optional steps to perform, such as a mass correction, a data centroiding step if the data is collected in profile mode, and/or a scan filtering step.
- the scan filtering step is performed if the user selects to proceed with an automatic noise reduction analysis, or if the system determines to proceed with an automatic noise reduction analysis.
- the system computes an intensity value that will be considered the noise level and any signal below that intensity level will be removed from the data set.
- the user can also select, or the system determines, an intensity threshold that will be used to remove any data point that has an intensity lower than a user specified value. In the case that the user specified value or system determined value is 0, no data will be removed from the MS data set, and all the MS data will be used in the quantitative processing of the MS data.
- the system also receives, obtains, or acquires the chemical structure of the compound of interest.
- the system can receive the chemical structure of the compound of interest e.g., from a data file or database, or the chemical structure is inputted into the system by the user. That is, the system receives data indicative of a chemical structure of the compound of interest.
- the chemical structure(s) of the compound of interest is then virtually fragmented via a “virtual fragmentation” to produce compound related fragments by disconnecting bonds between atoms in the molecule. Hydrogen atoms are ignored for the bond disconnection step. All atoms of the compound of interest are considered in the virtual fragmentation algorithm.
- the virtual fragmentation can be conducted via an algorithmic approach or via an automated intelligence (Al) driven fragmentation selection process, e.g., where only a subset of fragments is selected for further analysis.
- Virtual fragmentation is performed by the system via a virtual fragmentation algorithm stored in memory and executable by the processor to perform virtual fragmentation of the compound of interest to identify all possible fragment ions of the compound of interest.
- the virtual fragmentation algorithm comprises identifying a target bond in the chemical structure of the compound of interest, and determining if the target bond is not inside a structural cycle.
- Starting from one of the atoms associated with the target bond e.g., a starter atom, identify all atoms bonded to it until no more atoms are selectable.
- the identified atoms define an atom set identified as a fragment.
- This process is then repeated for other atoms e.g., a secondary atom, bonded to the starter atom (i.e. , the process of identifying all atoms bonded to the secondary atom is repeated), thereby obtaining additional compound atom sets identified as additional fragments.
- This process is repeated inside of the compound atom sets for every bond, obtaining a collection of atoms (i.e., fragments) each time.
- the process is repeated for a predetermined number of steps specified by the user, such as 2, 3, 4, 5, 10, 15, 20, 30, 50, 100, 150 or more steps, or for a predetermined number of steps identified or determined by the system e.g., predetermined system settings stored in memory.
- the fragments (atoms sets) are defined, the m/z for each fragment is determined.
- the defined fragments may be amended to include hydrogen atoms that can be lost or gained during the fragmentation process.
- the bond is in a structural cycle when the atom is fragmented, they will yield the same groups of atoms starting from the starter atoms in the bond than from the other atom. In this case the molecule has a new starting point for another cycle of the bond breaking process.
- virtual fragmentation occurs by disconnection of bonds in a sequential manner breaking as many consecutive bonds as defined by the user as a user defined parameter of the system or as set or determined by the virtual fragmentation algorithm.
- the mass spectrometer then identifies the atoms in the fragments, and the potential m/z is computed for all the fragments of the compound of interest considering the resulting ion could be an even or odd electron fragment, as well as the possibility of chemical reorganizations like gaining or losing hydrogen atoms from the fragment(s).
- the ions selected can include charge species ions, isotopic signals, adducts, dimers or neutral losses of the compound.
- each ion identified from the virtual fragmentation i.e., identified ions
- each peak represents an area of the ion i.e., (m/z) in the sample. That is, each peak is representative of the m/z, a retention time range (peak starts and end), the intensity of the m/z in each of the scans, and the area under the curve computed from the scans.
- the system determines if it forms a peak by detecting a change in the slope relative to the noise as the ions are extracted across a time window or scan window for the detection of the compound of interest.
- the initial spectral data filtering is method of filtering the spectral data to identify peaks based on predetermined criteria.
- ions that are co-eluting with the m/z of interest, but the ions (m/z) that may come from the ions of interest (fragments, isotope, charge species, adducts, etc.) have characteristics that meet the predetermined criteria, such as peak shape, accuracy, right spectral ions, number of points across the peak, signal/noise ratio, etc.
- all ions that are co-eluted are passed through the initial spectral data filtering to identify which ions have the same or substantially similar peak shape as the ions of the compound of interest.
- signals that are within a certain m/z range are clustered together using a peak tolerance set by the user, i.e., a predetermined peak tolerance, or as determined or set by the system.
- a peak tolerance set by the user i.e., a predetermined peak tolerance
- the predetermined peak tolerance can be based on multiple peak quality criteria, such as the number of points across the peak, comparison of the area of the peak with the area of the same m/z outside the peak range, peak shape analysis, etc.
- All identified peaks are clustered if they have a similar peak shape.
- a similar peak shape is a peak shape having certain similarity in the curve produced e.g., having a similar intensity of the m/z in the Y axis and the scan or similar retention time in the X axis.
- the criteria to select the peak is based on a Hocking similarity index where the index is optimized against the retention time. If the index is above a certain number both peaks are considered to be in the same cluster.
- Said peaks are clustered based on the m/z values for said ions having similar peak shape and meet predetermined criteria for quality control, such as peak quality, regression quality, and replica quality.
- the m/z values of the virtual fragments are then compared to the spectral ions identified in the MS data of the reference standards. If the difference between the observed ions in the spectra (i.e., a plot of m/z to intensity) of the reference standard and the theoretical m/z is within a peak tolerance, said fragment ions are selected for further analysis i.e., ions for analysis. That is, the system determines if the difference between the observed ions in a mass spectrum of the reference standard and the theoretical m/z of the identified fragment ions are within a predetermined peak tolerance; if so the observed ions are selected for further processing, and also referred to as ions for analysis. At this point, the mass spectrometer or system has identified all ions applicable for analysis of the compound of interest.
- Stage 2 all peaks are identified, and peak areas determined for each of the ions for analysis applying an auto-adjustable extraction mass window to every standard reference sample MS data including all concentrations and all replicates. This allows the system to determine the best area and accuracy for each identified peak thereby providing a system with high selectivity.
- the system identifies the peaks for each of the ions for analysis utilizing the initial spectral data filtering.
- the system extracts all signals in a mass extraction window set by the user or system, and computes the signal’s peak area.
- the mass extraction window is typically set in units of parts per million (ppm) or milli-daltons (mDa).
- the mass extraction window set by the user or system is the mass range containing the calculated m/z for the ion of interest plus or minus a window or range defined by the user or system. Experimentally measured ions by the MS are assumed to fall within this mass extraction window.
- the system automatically identifies the fragments (including combinations of fragments, also referred to as a plurality of fragments) applicable to the reference standards’ spectra.
- the fragments that are selected have to fulfil a number of criteria: first of all, the m/z value in the spectra has to match the m/z computed (considering hydrogen atom reorganizations), the m/z for the fragment generated within a certain tolerance window defined by the user or system. This operation is done with the user or system selected reference standard samples, typically those of high nominal concentration to have a spectrum for the compound. Once the fragment has been assigned, a peak finding is performed on each of the standard samples using the m/z in the MS spectra (MS, MSMS, SWATH, MSe, low/high energy of collision, etc.) to obtain the retention time range for the peak; this retention time is within the retention time tolerance set by the user or system. In case that the m/z passed the previous filters, then an automatic extraction window is applied on every standard sample that maximize the area and minimize the difference between the observed and the calculated m/z.
- the system automatically identifies the fragment ions (including combinations of fragments) applicable to the reference standards in an iterative manner, where the system reduces the mass extraction window size from its previous step in e.g., 1 ppm or mDa increments, and repeats the process to extract the ions and compute its peak area. This process is repeated until the computed slope (A area/A window size) between two successive peak areas is greater than a predetermined value. Once the computed slope criteria are achieved, the process is stopped and the mass extraction window used before triggering the change in slope is selected to be used for the peak area determination. This process is completed for all identified fragment ions (including combinations of fragments) i.e., the plurality of ions, of the reference samples.
- the user can set a fixed or predetermined extraction window, if preferred. In the case when the user sets up a fixed value for the extraction window, no optimization will be done.
- the best combination of ions related to the peak, predicted concentration, and replicate quality criteria are selected to provide the best or optimized regression model between the experimentally determined peak areas and the nominal concentrations of the reference standards.
- peak areas are computed for ions of interest to see if there is a correlation between the peak area and the nominal concentration using a statistical regression analysis.
- the area for the ion of interest divided by the internal standard area computed to see if there is a correlation between the peak area ratio and the nominal concentration using a statistical regression analysis.
- the degree of correlation meets acceptance criteria or predetermined correlation criteria to provide acceptable accuracy and coefficient of variation, the ion is selected for further analysis.
- the ions selected for further analysis are designated “N selected ions.” [0085] “N” can be a number selected by the user, a predetermined number, or a number identified based on the reference sample, or a number determined or set by the system.
- a combinatorial analysis is conducted based on a subset of the N selected ions predetermined by the user or system. For each combination of ions, all the signals are extracted, and a new peak is formed by combining the ion intensities across their scans. This process is done for each of the calibration standard reference samples. For each combination of ions the peak area is computed and in case internal standard(s) are provided the peak area ratio i.e., area of ion/area of internal standard, is computed.
- the number of combinations of ions produced in this step is based on the number of compound related ions detected that meet the criteria for selection e.g., ions for analysis, as well as the number of ions the user or system sets to combine, e.g., N combination of ions.
- Each combination of ions, or plurality of combinations, is evaluated by using user or system defined settings that control the peak quality, including the number of points across the peak, signal-to-noise ratio, accuracy, precision and coefficient of variation for each sample.
- each combination of ions is evaluated with rules that consider the overall regression, such as the minimum number of concentration levels, the difference in nominal concentration between two selected consecutive levels, etc. Said rules are predetermined criteria for quality control of the regression models.
- regression models can be used for each condition using simple linear fit, weighted linear fit, quadratic, an Al- based regression model e.g., that selects a peak attending to a model based on data already generated by a user or stored in memory, etc.
- the system evaluates three different potential outputs: (1 ) a combination of ions that provide the best overall dynamic range, (2) a combination of ions that provide the best lower limit of quantification, and/or (3) a combination of ions that enables the highest upper limit of quantification.
- a regression model that provides the best fit based on predefined user or system criteria is selected. That is the system determines which of the plurality of combinations provides the best or optimized regression model for overall dynamic range, a lower limit of quantification, and/or a highest upper limit of quantification.
- the system selects the simplest one as the one using the fewest number of ions.
- the peak quality (number of points across the pick, signal-to-noise ratio, etc.), accuracy, precision and coefficient of variation for each sample as well as for the nominal concentration replica, if applicable, is outputted to the user as output data.
- the output data can be displayed on a display or output in other means via an input/output device.
- the system acquires the mass spectrometry data for all additional applicable samples e.g., quality controls, blanks, unknowns, target compounds, etc.
- the system can receive the additional samples and conduct mass spectrometry on the additional samples to acquire the MS data.
- the system then identifies the peaks for each of the ions for analysis utilizing the initial spectral data filtering for each of the additional applicable samples following the same peak determination process as described above in Stage 1 . That is, the system extracts all signals for the additional applicable samples in a mass extraction window set by the user or system and computes the signal’s peak area.
- the concentration is predicted for all the additional applicable samples, such as the target compound.
- the subject disclosure provides a system and method that includes the development of a set of algorithms to achieve high sensitivity and high selectivity regression models based on High Resolution Mass Spectrometry for compound quantification analysis.
- the user or system may provide multiple samples with different nominal concentration that cover the concentration range intended for the quantification analysis. There could be multiple replicates for the nominal concentration samples.
- the user or system can also provide blank samples of any type, Quality Control Samples with a nominal concentration and/or unknown samples to evaluate their potential concentration based on the Mass Spectrometry data.
- High sensitivity is achieved by studying the nominal concentration samples and analysis the regression model parameters that is obtained between the nominal concentration and the Chromatographic peak area.
- the regression model obtained will have to pass different business rules like a limit in the Pearson coefficient value, minimum levels of nominal concentration, maximum spacing between the concentration and the maximum number of levels that can be dropped between two consecutive levels.
- the invented methodology achieves high sensitivity by accumulating the area of multiple ions that can be obtained from the MS full scan or for the different acquisitions methods to obtain a MS2 trace.
- the first step in the algorithm is to select which are the m/z values that are eligible to be summed.
- the ions selected include all the identified charge species ions, the isotopic signals, the adducts, dimers or neutral losses of the compound as well as all the ions (m/z) that can be assigned to a chemical fragment virtually generated from the compound’s structure.
- the fragment assignment is performed based on one or more than one sample that has been identified by the user or system as reference. Each ion from this list is used to extract a peak from the mass spectral data for each of the samples under consideration. All peaks are evaluated based on multiple peak quality criteria such as but not limited to the number of points across the peak, comparison of the area of the peak with the area of the same m/z outside the peak range, peak shape analysis, etc.
- ions that pass the multiple peak quality criteria are then evaluated also on the regression capacity.
- Multiple regression models (direct or weighted on the X, and on the Y) are tested for chromatographic peaks obtained from each individual ion (m/z). If the regression model derives an acceptable line based on regression quality check terms like Pearson coefficient value.
- the ions that produce the top N are then selected for the next step.
- the combination of the N selected ions is performed first starting from the simplest model, that is the combination of the N ions taken by 2, to the most complex situation of taking the N ions combined to the X, X being a parameter set by the user or system.
- the intensity of the selected ions is added scan by scan and point by point.
- the time lack between full scan and the MS2 scan is considered for building the new peak.
- the quality of the peak is again checked as it was done with the single ion chromatographic peak.
- the peak for the internal standard is also computed starting from the m/z and expected retention time of the compounds, the peak for the internal standard has to pass the same quality criteria as the peaks for the compound of interest ions. Considering the peaks that passed the peak quality criteria, the area of the compound derived peak divided by the area of the internal standard peak is computed for each sample.
- the first option is to look for the regression model that has the Lower possible Limit of quantification, in this case if the regression model cannot be used for the entire nominal concentration range (it does not meet the business rules criteria) the system evaluates the impact in the regression model by removing the upper part concentration levels, in every step only one level is removed and the entire regression model is built again until an acceptable model (meet the business rules criteria) or the combination is removed, in the second case the entire process start with another ion combination.
- the second option is to look for the regression model that has the Upper Limit of Quantification possible, in this case if the regression model cannot be used for the entire nominal concentration range (it does not meet the business rules criteria) the system evaluates the impact in the regression model by removing the lower part of the concentration levels, in every step only one level is removed and the entire regression model is built again until an acceptable model (meet the business rules criteria) or the combination is removed, in the second case the entire process start with another ion combination.
- the third option is to look for the regression model with the highest dynamic range, in this case if the regression model cannot be used for the entire nominal concentration range (it does not meet the business rules criteria) the system evaluates the impact in the regression model by removing alternatively one sample from the upper part of the concentration levels and later from the lower part of the concentration level, in every step only one level is removed and the entire regression model is built again until an acceptable model (meet the business rules criteria) or the combination is removed, in the second case the entire process start with another ion combination.
- the adjustable extraction window that is the m/z range in ppm or amu that is allowed when comparing the computed m/z based on the compound structure or formula and the observed m/z in the spectra.
- the adjustable extraction window does an optimization of the extraction window value to have the lowest possible value (the lower the value, the better is the selectivity for the ion m/z), but keeping the maximum possible area computed for the ion of interest.
- the user or system sets up the maximum value possible for the extraction window and the system computes the area under the curve for the selected range by accepting the MS scans that are inside the selected window, then the system modifies the extraction window value and computes the area again. The operation is repeated until there is a statistically significant change in the area value.
- the extraction window selected is the one before the changes in the area value are produced.
- Claim 1 A computer-implemented method for quantitative analysis of mass spectrometry data comprising:
- Claim 2 The computer-implemented method of claim 1 , further comprising
- Claim 3 The computer-implemented method of claim 1 or 2, wherein the step of identifying a plurality of ions related to the compound of interest based on the chemical structure comprises virtually fragmenting the compound of interest to identify compound related fragments.
- Claim 4 The computer-implemented method of claim 3, wherein the step of virtually fragmenting the compound of interest comprises: identifying a starter atom and associated bond and determining if the bond is inside a cycle; identifying all atoms bonded to the starter atom; identifying a secondary atom bonded to the starter atom; and identifying all atoms bonded to the secondary atom.
- Claim 5 The computer-implemented method of any of the preceding claims, wherein the step of determining a chromatographic peak for each identified plurality of ions of the compound of interest comprises determining a change in slope of successive peaks as ions are extracted across a time or scan window.
- Claim 6 The computer-implemented method of any of the preceding claims, wherein the step of determining a chromatographic peak for each identified plurality of ions of the compound of interest comprises clustering signals within a predetermined m/z range based on a predetermined peak tolerance.
- Claim 7 The computer-implemented method of claim 5, wherein in the predetermined peak tolerance is based on a number of points across the peak, a comparison of the area of the peak with the area of the same m/z outside the peak range, and/or a peak shape analysis.
- Claim 8 The computer-implemented method of any of the preceding claims, wherein the step of determining a peak for each identified plurality of ions of the compound of interest comprises filtering based on peak shape.
- Claim 9 The computer-implemented method of any of the preceding claims, wherein the step of identifying ions for analysis comprises determining if a difference between an m/z value of the identified plurality of ions and the mass spectrometry data for the one or more reference standards exceeds a predetermined peak tolerance.
- Claim 10 The computer-implemented method of any of the preceding claims, wherein the step of determining a peak area for each of the identified ions for analysis based on an auto-adjustable extraction mass window comprises iteratively reducing an extraction mass window size from a prior step by a predetermined amount until a computed slope between two successive peaks is greater than a predetermined slope criteria.
- Claim 1 1 The computer-implemented method of any of the preceding claims, wherein the step of determining a peak area for each of the identified ions for analysis based on an auto-adjustable extraction mass window comprises determining a slope between successive peaks.
- Claim 12 The computer-implemented method of any of the preceding claims, wherein the step of combining each of the N selected ions and determining which of the plurality of combinations provides the optimized regression model comprises evaluating each of the plurality of combinations based on peak quality criteria.
- Claim 13 The computer-implemented method of claim 12, wherein the peak quality criteria include a number of points across a peak, a peak area versus areas of m/z outside a peak range, and/or a peak shape.
- Claim 14 The computer-implemented method of any of the preceding claims, wherein the step of combining each of the N selected ions comprises conducting a combinatorial analysis on a subset of the N selected ions predetermined by the user.
- Claim 15 The computer-implemented method of any of the preceding claims, wherein the step of combining each of the N selected ions comprises combining the ion intensities across scans for all signals and forming a new peak.
- Claim 16 The computer-implemented method of any of the preceding claims, further comprising outputting the optimized regression model via a display.
- Claim 17 The computer-implemented method of any of the preceding claims, further comprising conducting mass spectrometry on a target compound to obtain experimental mass spectrometry data for the target compound.
- Claim 18 The computer-implemented method of claim 2, further comprising outputting a concentration of the target compound.
- Claim 19 A system for quantitative analysis of mass spectrometry data comprising: a mass spectrometer; and one or more processors configured to:
- Claim 20 The system of claim 19, wherein the processor is further configured to: receive experimental mass spectrometry data for a target compound; determine a peak for each of the ions for analysis for the target compound; determine a peak area for each of the identified ions for analysis based on an auto-adjustable extraction mass window; and determine a concentration of the target compound based on the determined optimized regression model.
- Claim 21 A mass spectrometer having a mass analyzer, comprising: one or more processors configured to:
- Claim 22 The mass spectrometer of claim 21 , wherein the processor is further configured to: receive experimental mass spectrometry data for a target compound; determine a peak for each of the ions for analysis for the target compound; determine a peak area for each of the identified ions for analysis based on an auto-adjustable extraction mass window; and determine a concentration of the target compound based on the determined optimized regression model.
- Claim 23 The mass spectrometer of any of the preceding claims, wherein the mass spectrometer is configured to conduct mass spectrometry on a target compound to obtain experimental mass spectrometry data for the target compound.
- Claim 24 A system for quantitative analysis of mass spectrometry data characterized by the mass spectrometer of claim 21 .
- Claim 25 A method of performing mass spectrometry comprising: conducting mass spectrometry on a target compound to obtain experimental mass spectrometry data for the target compound; and determining a concentration of the target compound using any of the computer-implemented methods for quantitative analysis of mass spectrometry data disclosed here.
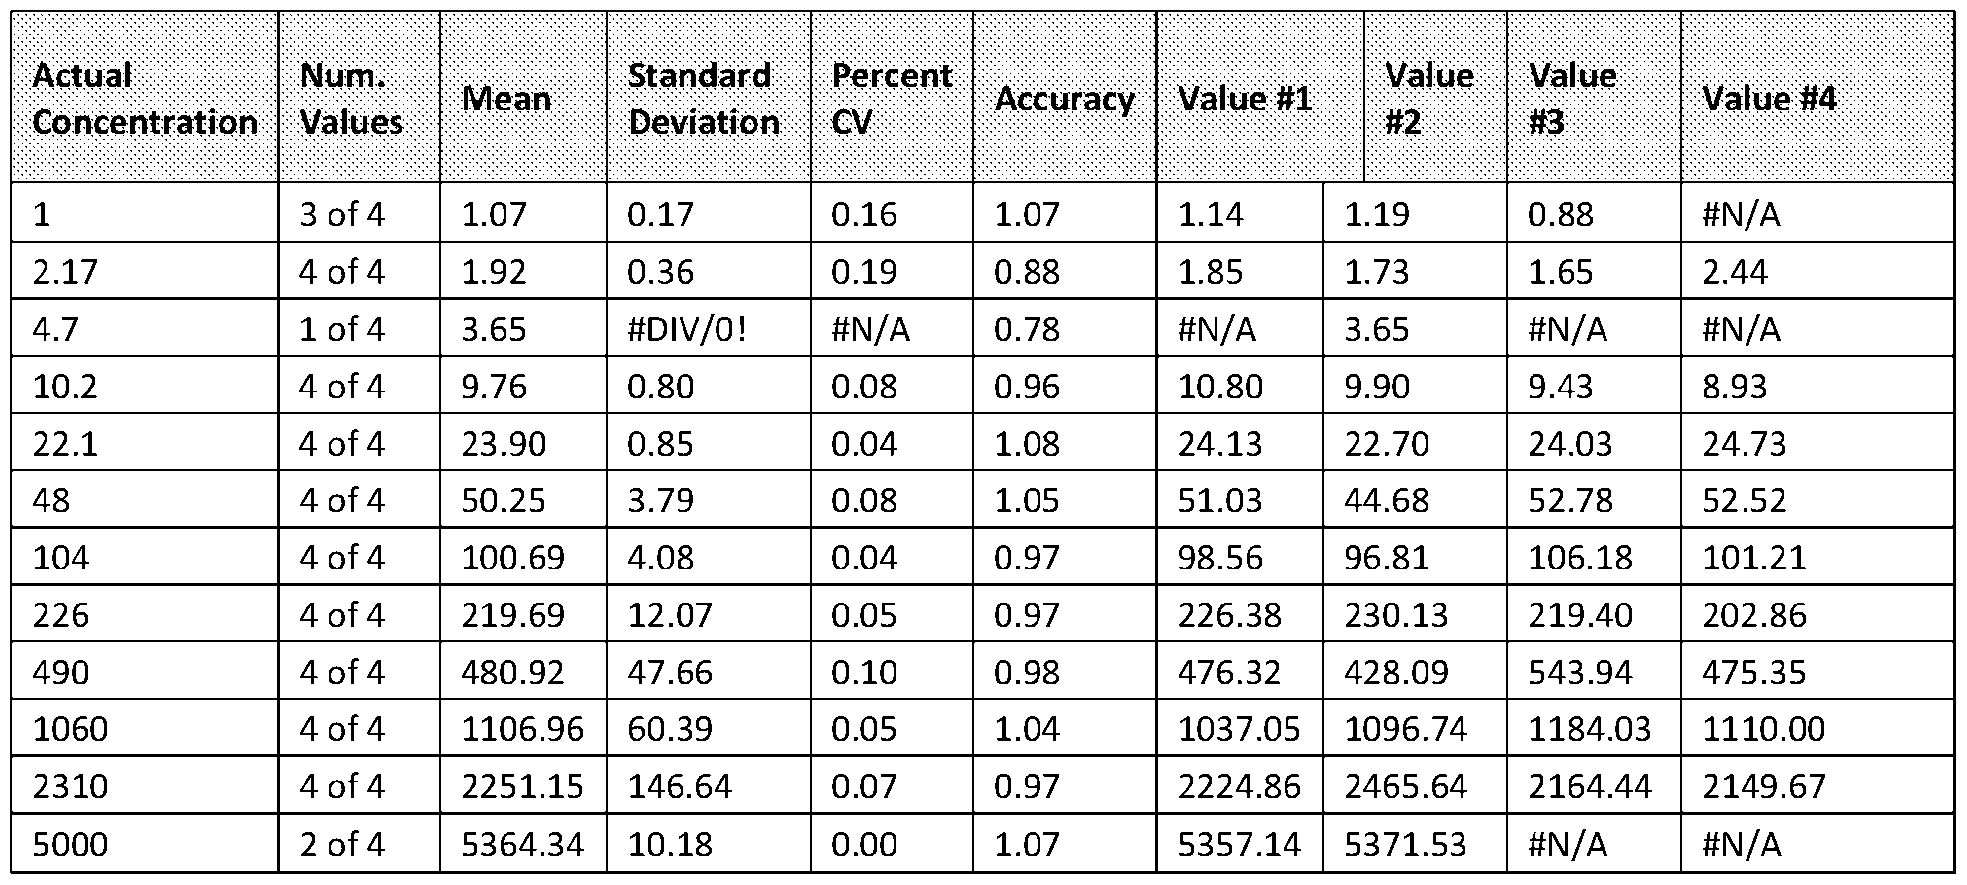
- Acceptance criteria for quantitative data were based on accuracy and precision of the values calculated from the regression model used for the calibration curve(s). The required accuracy and precision of the replicates will depend on how the data is being used and/or regulatory guidance. In early drug discovery studies 100 ⁇ 25% for accuracy with a Coefficient of Variance (CoV) ⁇ 25% is typically used. Other criteria can be applied such as signal-to-noise ratio >20, points across the chromatographic peak >8, minimum number of accepted replicates, and mass accuracy ⁇ 15 ppm with the automatic adjustment of the signal extraction window. [00106] Results. The results of the analysis conducted using conventional methodology are provided in Table 1 for compound 1 ; and results of the analysis conducted using the methodology of the instant invention are provided in Table 2 for compound 1 .
- the statistical parameters used in the existing methodology include:
- FIG. 4 A calibration for Compound 5 is shown in FIG. 4.
- FIG. 5 A regression analysis of Predicted vs. Experimental Concentration is shown in FIG. 5.
- Imipramine, Verapamil, Buspirone and Nefazodone as well as HPLC grade acetonitrile (ACN), dimethyl sulfoxide (DMSO), methanol (MeOH) and formic acid (HCOOH, 98 - 100%) were purchased from Sigma-Aldrich (St Louis, MO, USA).
- An ACQUITY ultra-performance liquid chromatograph (Waters Corporation, Milford, MA) consisting of a binary pump, autosampler, degasser, and column oven was used for gradient elution for triple quadrupole data acquisition.
- a Sciex API 6500+ triple quadrupole mass spectrometer with a OptiFlow Turbo V Electrospray ionizationTM (TIS) source (Concord, ONT, Canada) was used as the detector for SRM based analysis. Processing of SRM data was done with SCIEX MultiQuant® (MQ) software (Toronto, Canada).
- An Agilent 1290 liquid chromatograph (Agilent, Santa Barbara, CA) consisting of a binary pump, autosampler, degasser, and column oven was used for gradient elution on HRMS data acquisition.
- a Sciex API 7600 Zeno quadrupole time of flight mass spectrometer was used for full scan MS and MSMS data collection.
- HRMS data was processed using AI-QUANTTM software developed by Mass Analytica (Sant Gugat, Spain) as part of this work.
- the chromatographic separation was accomplished using a Waters BEH Shield RP18 column (2.1 x 50-mm, 1 .7 pm) maintained at 40 °C.
- a solution of 0.1% FA in H2O and a solution of 0.1% FA in ACN were used as mobile phase A and B, respectively.
- a linear gradient with a flow rate of 0.75 mL/min was selected, starting at 10% B, and raising to 90% B in 1 .5 minute and then held at 90% B for 0.5 minute.
- the total run time was 3 minutes.
- Fragment ion spectra were collected from m/z 50 to 500.
- the total cycle time was 0.56 seconds for the SWATH based acquisition.
- the source temperature was 550 and gas settings were GS1 60 and GS2 50, the DP voltage was 120.
- the source temperature was 550 and gas settings were GS1 40 and GS2 50, the DP voltage was 80.
- FIGS. 6A-6C Three drug molecules were used to compare the traditional triple quadruple quantitative workflow to the HRMS Al-Quant workflow.
- the structures and SWATH MSMS spectra are shown in FIGS. 6A-6C.
- MSMS data processing a compound related ion, typically the [M+H] + , is selected and a user or system defined extraction window is used to generate chromatographic peaks for integration of peak area to be used in quantitative analysis. Defining the optimal extraction window is a manual process that can have significant impact on the overall quality of the results.
- targeted MSMS data a compound specific acquisition method is developed to collect the data that provides enhanced selectivity and sensitivity relative to an MS only approach. The advantage of a targeted MSMS approach is also its limitation, in that effort is required to develop compound specific methods just like for triple quadrupole workflows. Once the data is collected, a processing method similar to MS data is generated that extracts the fragment ion of interest for peak generation.
- Targeted MSMS (not done in this study) can be more sensitive than a QQQ method but may have a narrower dynamic range. It also requires the development of a specific acquisition method and more complex data processing relative to the QQQ data.
- This method starts by using the structure of the molecule being analyzed to identify all ions related to that compound. This includes multiply charged ion, adduct ions, isotopes, and fragment ions. It does this by processing a data file specified by the user or system that has the compound of interest present, for example a standard. Using a bond breaking algorithm, it automatically assigns fragment ions (if present) of the compound of interest. All signals related to the molecule are then used to select a subset of ions that provide the best overall performance for the quantitative assay.
- the algorithm automatically selects optimal parameters (mass extraction window, ions to sum, etc.) to provide the best overall method to meet the acceptance criteria defined by the user or system (signal to noise, points across the peak, accuracy/precision, etc.).
- the processing continues to do regression analysis to select the best or optimized overall model (linear, quadratic, etc.) and weighting (unweighted, 1/x, 1/x2, etc.).
- the results are checked for acceptance criteria parameters including peak quality, reproducibility, and model fit quality.
- the simplest model is automatically selected; the one with the fewer number of combined ions.
- the user is presented with different method solutions including 1 ) highest dynamic range, 2) optimal upper limit of quantification and 3) the best lower limit of quantification.
- the processing algorithm automatically selects the ions that provide the best fit to the acceptance criteria and iterates through ever decreasing extraction windows to maintain signal whilst reducing noise. Selected ions using the optimal extraction windows are summed in all possible combinations to identify the final set of ions for the method based on the overall acceptance criteria. This includes selecting the regression model with weighting factor.
- the dynamic range focused processing was able to find a method that spanned the entire standard curve range from 1 to 5000 nM by summing three ions in the MS scan function. The variability was higher at the lowest concentrations relative to the triple quadrupole data, but still within the acceptance criteria.
- the ULOQ focused method only used two ions from the MS scan, resulting in a curve spanning 5 to 5000 nM.
- the method was able to reach a higher ULOQ than the triple quadrupole method while providing much better precision.
- the LLOQ method summed two ions from the MS scan and two ions from the MSMS scan. The result was a curve from 2 to 1000 nM with better precision than the QQQ method.
- the processing continues to do regression analysis for quantitative analysis to select the best overall model (linear, quadratic) and weighting (unweighted, 1/x, 1/x2, etc.).
- This new methodology enables generic methods for data collection for quantitative analysis using mass spectrometry. With this approach, data collection is faster, and the processing algorithm provides quality better than conventional methodologies.
- Methodology The methodology has been developed using MSE data acquired on a Waters Xevo G2XS Q-tof and SWATH data acquired on a Sciex API 7600 Q-tof, but could be used for HRMS datasets from other vendors.
- a peak analysis is done in the high and low collision energy traces.
- the m/z of each of the identified peaks in both scan functions are then compared to the m/z values obtained for the parent [M+H]n+ ions, adducts ions, isotopes, and/or the theoretically generated fragments.
- the m/z extraction windows of chromatograms for defining the peaks that will be used to quantify the regression area are automictically adjusted.
- An initial maximum extraction window is defined by the user (e.g. 15 ppm).
- a peak extraction is performed at that value.
- the value is incrementally decreased by 1 ppm (or 0.01 amu) until there is a drop of peak area of 1 % or more.
- the regression lines will be evaluated to cover the Lower Limit of Quantification (LLoQ), the Upper Limit of Quantification (ULoQ) or the maximum dynamic range of concentrations. Also, the different regression models will consider different weights on the X or Y variables. In all cases, all combination of points is evaluated in the same way: use all concentration ranges and, for each one, evaluate if a regression can be obtained considering the constraints provided by the users. If more than one regression has the same LLOQ or ULOQ or dynamic range, the algorithm will take the one with the highest number of regression levels. In the case of having several lines with the same levels, the algorithm will take the one with highest correlation coefficient.
- the data for the working example is obtained for a compound at 10 different concentration levels: 1 , 2, 5, 10, 20, 50,1 00, 200, 500, 1000, 2000, 5000, 10000 ng/mL measured in triplicate.
- the molecular ion m/z is only detected with a very low concentration (area ⁇ 1000) in the highest concentrated samples due to insource fragmentation. Therefore, the only possibility to generate a calibration line and a reliable concentration estimation is based on the analysis of ions obtained from the in-source or high energy trace fragmentation.
- a fragment analysis is performed using a single bond breaking of the precursor to generate fragments to select the m/z spectral values that will be used to compute the calibration line (FIGS. 8A, 8B, and 8C).
- the peak quality criteria were based on a minimum of 6 to 8 scan points per peak, a difference in Retention Time between samples lower than 0.05 min, and the ions with a difference between the observed and the computed m/z lower than 15 ppm.
- the extraction window was evaluated using the auto-adjust option at 15, 10 and 5 ppm and also a fixed value of 15 ppm, the noise evaluation time range (peak units) was set to 6, and the minimum signal/noise ratio to 3.
- the maximum variation of the nominal concentrations of each sample and the average concentration, as well as the maximum CV was set to 25% for a point to be accepted for regression.
- the regression line with the widest dynamic range is obtained using 15ppm in auto-adjust or fixed mode and with 6 to 8 scan points per peak respectively.
- FIGS. 9A-9C illustrate conventional results of LLOQ.
- FIG. 9A illustrates QQQ 6500+ MRM Results: m/z 351 175.
- LLOQ is 10 ng/ml based on 25% accuracy and precision.
- FIG. 9B illustrates TOF 7600 HRMS Results: m/z 351 .
- LLOQ is 20 ng/ml based on 25% accuracy and precision, uses only [M+H] + ion.
- FIG. 9B illustrates TOF 7600 HRMS Results: m/z 175.
- LLOQ is 5 ng/ml based on 25% accuracy and precision, used only the m/z 175 fragment ion.
Landscapes
- Chemical & Material Sciences (AREA)
- Analytical Chemistry (AREA)
- Other Investigation Or Analysis Of Materials By Electrical Means (AREA)
Abstract
Description



Claims
Priority Applications (1)
| Application Number | Priority Date | Filing Date | Title |
|---|---|---|---|
| EP24736580.2A EP4721125A1 (en) | 2023-06-05 | 2024-05-31 | Data processing method, system, and apparatus for high resolution mass spectrometry |
Applications Claiming Priority (2)
| Application Number | Priority Date | Filing Date | Title |
|---|---|---|---|
| US202363506254P | 2023-06-05 | 2023-06-05 | |
| US63/506,254 | 2023-06-05 |
Publications (1)
| Publication Number | Publication Date |
|---|---|
| WO2024253963A1 true WO2024253963A1 (en) | 2024-12-12 |
Family
ID=91670237
Family Applications (1)
| Application Number | Title | Priority Date | Filing Date |
|---|---|---|---|
| PCT/US2024/031937 Ceased WO2024253963A1 (en) | 2023-06-05 | 2024-05-31 | Data processing method, system, and apparatus for high resolution mass spectrometry |
Country Status (2)
| Country | Link |
|---|---|
| EP (1) | EP4721125A1 (en) |
| WO (1) | WO2024253963A1 (en) |
Citations (1)
| Publication number | Priority date | Publication date | Assignee | Title |
|---|---|---|---|---|
| US20180342381A1 (en) * | 2013-05-21 | 2018-11-29 | University Of Utah Research Foundation | Mass spectrometry analyte detection and related methods |
-
2024
- 2024-05-31 WO PCT/US2024/031937 patent/WO2024253963A1/en not_active Ceased
- 2024-05-31 EP EP24736580.2A patent/EP4721125A1/en active Pending
Patent Citations (1)
| Publication number | Priority date | Publication date | Assignee | Title |
|---|---|---|---|---|
| US20180342381A1 (en) * | 2013-05-21 | 2018-11-29 | University Of Utah Research Foundation | Mass spectrometry analyte detection and related methods |
Non-Patent Citations (2)
| Title |
|---|
| KIMANANI EBI KALAHI: "Bioanalytical calibration curves: proposal for statistical criteria - ScienceDirect", JOURNAL OF PHARMACEUTICAL AND BIOMEDICAL ANALYSIS, vol. 16, no. 6, 1 February 1998 (1998-02-01), AMSTERDAM, NL, pages 1117 - 1124, XP093205360, ISSN: 0731-7085, Retrieved from the Internet <URL:https://www.sciencedirect.com/science/article/pii/S0731708597000642?via=ihub> DOI: 10.1016/S0731-7085(97)00064-2 * |
| NILSSON ET AL: "Direct quantification in bioanalytical LC-MS/MS using internal calibration via analyte/stable isotope ratio", JOURNAL OF PHARMACEUTICAL AND BIOMEDICAL ANALYSIS, ELSEVIER B.V, AMSTERDAM, NL, vol. 43, no. 3, 2 February 2007 (2007-02-02), pages 1094 - 1099, XP005870917, ISSN: 0731-7085, DOI: 10.1016/J.JPBA.2006.09.030 * |
Also Published As
| Publication number | Publication date |
|---|---|
| EP4721125A1 (en) | 2026-04-08 |
Similar Documents
| Publication | Publication Date | Title |
|---|---|---|
| US12210020B2 (en) | Method for evaluating data from mass spectrometry, mass spectrometry method, and MALDI-TOF mass spectrometer | |
| JP6737396B2 (en) | Mass spectrometer and chromatograph mass spectrometer | |
| US9269558B2 (en) | MS/MS type mass spectrometer and program therefor | |
| US7451052B2 (en) | Application of comprehensive calibration to mass spectral peak analysis and molecular screening | |
| JP6341295B2 (en) | Multidimensional mass spectrometry data processor | |
| US20070136017A1 (en) | Method for calibrating mass spectrometry (ms) and other instrument systems and for processing ms and other data | |
| US10381207B2 (en) | Data processing system for chromatographic mass spectrometry | |
| US20130338935A1 (en) | Mass spectrometry data processing device | |
| US10249480B2 (en) | Tandem mass spectrometry data processing system | |
| US11423331B2 (en) | Analytical data analysis method and analytical data analyzer | |
| US10041915B2 (en) | Mass spectrometry (MS) identification algorithm | |
| JPWO2018109895A1 (en) | Mass spectrometer | |
| WO2014128912A1 (en) | Data processing device, and data processing method | |
| US10788469B2 (en) | Mass spectrometry data processor, mass spectrometry data processing method, and mass spectrometry data processing program | |
| CN108982729A (en) | System and method for extracting mass traces | |
| JP7359302B2 (en) | Chromatograph mass spectrometry data processing method, chromatograph mass spectrometer, and program for chromatograph mass spectrometry data processing | |
| EP4280254A2 (en) | Improvements for quadrupole mass spectrometer data to enable new hardware operating regimes | |
| JP2020115117A (en) | Mass spectrum processing apparatus and method | |
| JP2005083952A (en) | Liquid chromatograph mass spectrometer | |
| WO2018163926A1 (en) | Tandem mass spectrometry device and program for same device | |
| CN117242527A (en) | Iteratively improve peak integration through integration parameters | |
| EP4721125A1 (en) | Data processing method, system, and apparatus for high resolution mass spectrometry | |
| US10416130B2 (en) | Mass spectrometry data processing apparatus, mass spectrometry system, and method for processing mass spectrometry data | |
| JP6649642B2 (en) | Mass spectrometer and program for mass spectrometer | |
| Fontaine et al. | Molecular Structure and Mass Spectral Data Quality–Driven Processing of High‐Resolution Mass Spectrometry for Quantitative Analysis |
Legal Events
| Date | Code | Title | Description |
|---|---|---|---|
| 121 | Ep: the epo has been informed by wipo that ep was designated in this application |
Ref document number: 24736580 Country of ref document: EP Kind code of ref document: A1 |
|
| WWE | Wipo information: entry into national phase |
Ref document number: 2024736580 Country of ref document: EP |
|
| NENP | Non-entry into the national phase |
Ref country code: DE |
|
| ENP | Entry into the national phase |
Ref document number: 2024736580 Country of ref document: EP Effective date: 20260105 |
|
| ENP | Entry into the national phase |
Ref document number: 2024736580 Country of ref document: EP Effective date: 20260105 |
|
| ENP | Entry into the national phase |
Ref document number: 2024736580 Country of ref document: EP Effective date: 20260105 |
|
| ENP | Entry into the national phase |
Ref document number: 2024736580 Country of ref document: EP Effective date: 20260105 |
|
| WWP | Wipo information: published in national office |
Ref document number: 2024736580 Country of ref document: EP |