WO2024252458A1 - 評価プログラム、評価方法および情報処理装置 - Google Patents
評価プログラム、評価方法および情報処理装置 Download PDFInfo
- Publication number
- WO2024252458A1 WO2024252458A1 PCT/JP2023/020790 JP2023020790W WO2024252458A1 WO 2024252458 A1 WO2024252458 A1 WO 2024252458A1 JP 2023020790 W JP2023020790 W JP 2023020790W WO 2024252458 A1 WO2024252458 A1 WO 2024252458A1
- Authority
- WO
- WIPO (PCT)
- Prior art keywords
- data
- evaluation
- fairness
- value
- group
- Prior art date
- Legal status (The legal status is an assumption and is not a legal conclusion. Google has not performed a legal analysis and makes no representation as to the accuracy of the status listed.)
- Ceased
Links
Images






Classifications
-
- G—PHYSICS
- G06—COMPUTING OR CALCULATING; COUNTING
- G06N—COMPUTING ARRANGEMENTS BASED ON SPECIFIC COMPUTATIONAL MODELS
- G06N20/00—Machine learning
Definitions
- Embodiments of the present invention relate to an evaluation program, an evaluation method, and an information processing device.
- AI Artificial Intelligence
- a known conventional technique for detecting fairness risks contained in training data used in such machine learning is to detect fairness values for segmented subgroups.
- the fairness value may be unreliable depending on the number of data in the segmented subgroups, and false positives or missed detections are likely to occur.
- creating all possible combinations of subgroups increases the burden on the user (designer) and the amount of calculations, making it difficult to efficiently perform a reliable fairness evaluation.
- the objective is to provide an evaluation program, an evaluation method, and an information processing device that enable efficient and reliable evaluation of fairness in data.
- the evaluation program causes a computer to execute a selection process, an execution process, and an output process.
- the selection process selects a first plurality of data and a second plurality of data from the plurality of data based on a first evaluation value of fairness of a first plurality of data among the plurality of data, the first attribute of which is a first value, a second evaluation value of fairness of a second plurality of data among the plurality of data, the first attribute of which is a second value, and a third evaluation value of fairness of a third plurality of data among the plurality of data, the first attribute of which is a third value.
- the execution process executes a test of population ratios between a first group including the first plurality of data and the second plurality of data among the plurality of data, and a second group including the third plurality of data.
- the output process outputs the evaluation result of fairness between the first group and the second group as an evaluation of fairness of the plurality of data according to the result of the test.
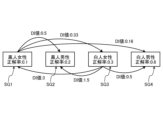
- FIG. 1 is an explanatory diagram illustrating an example of DI values between subgroups.
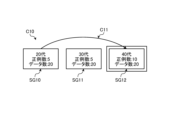
- FIG. 2 is an explanatory diagram illustrating an example of erroneous detection due to an insufficient amount of data.
- FIG. 3 is an explanatory diagram illustrating an example of a detection failure.
- FIG. 4 is an explanatory diagram for explaining the creation of all patterns of combinations of sub-loops.
- FIG. 5 is an explanatory diagram illustrating an overview of fairness evaluation according to the embodiment.
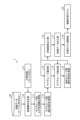
- FIG. 6 is a block diagram illustrating an example of a functional configuration of the information processing device according to the embodiment.
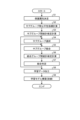
- FIG. 7 is a flowchart illustrating an example of the operation of the information processing device according to the embodiment.
- FIG. 1 is an explanatory diagram illustrating an example of DI values between subgroups.
- FIG. 2 is an explanatory diagram illustrating an example of erroneous detection due to an insufficient amount of data.
- FIG. 3 is an explanatory diagram illustrating an example of a detection
- FIG. 8 is an explanatory diagram illustrating an example of a fairness index and a statistical test between subgroups.
- FIG. 9 is an explanatory diagram showing an example of the calculation result.
- FIG. 10 is an explanatory diagram for explaining the combination of subgroups.
- FIG. 11 is an explanatory diagram illustrating an example of a process of combining subgroups and repeating a statistical test.
- FIG. 12 is an explanatory diagram illustrating a comparison between the evaluation result of the fairness evaluation according to the embodiment and the conventional evaluation result.
- FIG. 13 is an explanatory diagram illustrating an example of a computer configuration.
- This DI value is the ratio of positive examples of data with non-protected attributes (non-privileged users) to data with protected attributes (privileged users) contained in the training data, and can be calculated using the following formula (1).
- the protected attribute is gender, and it indicates a state (fairness index) in which men receive some benefit more than women.
- a DI value of less than 0.8 is considered problematic as an fairness risk.
- FIG. 1 is an explanatory diagram explaining an example of DI values between subgroups.
- the training data is divided into four subgroups (segments) SG1 to SG4 based on attributes (black women, black men, white women, white men).
- the DI values between these subgroups SG1 to SG4 black women: accuracy rate 0.1, black men: accuracy rate 0.2, white women: accuracy rate 0.3, white men: accuracy rate 0.6
- black women subgroup SG1 and the white men subgroup SG4 have the lowest DI value of 0.16, and it can be evaluated that black women pose a particularly high fairness risk compared to white men.
- Figure 2 is an explanatory diagram that explains an example of a false positive due to an insufficient amount of data.
- the training data is divided into subgroups SG10 to SG12 for each generation: 20s, 30s, and 40s.
- the subgroup SG10 for the 20s has 5 positive examples and 20 pieces of data.
- the subgroup SG11 for the 30s has 5 positive examples and 20 pieces of data.
- the subgroup SG12 for the 40s has 10 positive examples and 20 pieces of data.
- Figure 3 is an explanatory diagram that explains an example of a detection miss.
- the training data is divided into subgroups SG10 to SG13 for each generation: 20s, 30s, 40s, and 50s.
- comparisons C21 to C23 are performed between the subgroup SG10 of people in their 20s and the other subgroups SG11 to SG13 by testing the difference in population proportions (5% test with a significance level of 0.05).
- Figure 4 is an explanatory diagram that explains the case where all combinations of subgroups are created.
- FIG. 5 is an explanatory diagram outlining the fairness evaluation according to the embodiment.
- the information processing device calculates a fairness risk evaluation value (e.g., DI value) between subgroups SG10 to SG14, which are the smallest discretization units based on the values of a specified attribute, for training data consisting of multiple data, for example for each sample case.
- a fairness risk evaluation value e.g., DI value
- the information processing device selects and groups subgroups having similar risks on the fairness index based on the fairness risk evaluation value between subgroups SG10 to SG14.
- the information processing device selects and groups subgroups with similar risks in terms of the fairness index, thereby increasing the amount of data in the group and eliminating the possibility of coincidences due to a lack of data.
- the information processing device divides groups into subgroup SG20, which combines groups with no fairness risk (subgroups SG10, SG14), and subgroup SG21, which combines the other groups (subgroups SG11, SG12, SG13), based on an evaluation such as a DI value of ⁇ 0.8.
- the information processing device executes a test of the population ratio between the combined subgroups SG20 and SG21, and outputs an evaluation result of the fairness between subgroups SG20 and SG21 (e.g., a DI value) according to the result of this test.
- the information processing device can obtain a highly reliable evaluation of fairness that eliminates the possibility of chance.
- the information processing device does not verify the fairness of all combination patterns of subgroups SG10 to SG14, which are the smallest discretization units, it is possible to prevent an increase in the burden on the user and the amount of calculations, and to obtain an efficient evaluation of fairness.
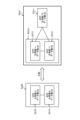
- FIG. 6 is a block diagram showing an example of the functional configuration of an information processing device according to an embodiment.
- FIG. 7 is a flowchart showing an example of the operation of an information processing device according to an embodiment.
- the information processing device 1 has a protection attribute determination unit 10, an inter-subgroup fairness index calculation unit 11, an inter-subgroup statistical test calculation unit 12, a subgroup selection unit 13, a subgroup combination unit 14, an inter-combined group statistical test calculation unit 15, an evaluation result output unit 16, a training data processing unit 17, and a learning model construction unit 18.
- the protection attribute determination unit 10 is a processing unit that determines the protection attributes to be used in the evaluation of fairness risk in the training data 20 based on external knowledge 21 (such as knowledge) input by a user's operational input, etc.
- the training data 20 is a plurality of data in which, for each sample case, the content of the case and a correct answer label indicating whether the case is a positive example or a negative example are assigned.
- the training data 20 is stored, for example, in a table format with each case and the correct answer label.
- the inter-subgroup fairness index calculation unit 11 is a processing unit that calculates a fairness index (fairness risk evaluation value) between subgroups SG10 to S14, which are the smallest discretization units, for the training data 20 based on the values of the protection attributes. Specifically, as shown in FIG. 7, the inter-subgroup fairness index calculation unit 11 divides the training data 20 into subgroups SG10 to SG14, which are the smallest discretization units, based on the values of the protection attributes determined in S1. Next, the inter-subgroup fairness index calculation unit 11 calculates a fairness index, for example a DI value, between the subgroups SG10 to SG14 (S2).
- a fairness index for example a DI value
- the inter-subgroup statistical test calculation unit 12 is a processing unit that calculates statistical tests such as population ratios between subgroups SG10 to S14 of the smallest discretization units based on the values of the protected attributes for the training data 20. Specifically, as shown in FIG. 7, the inter-subgroup statistical test calculation unit 12 performs statistical tests on the subgroups SG10 to SG14 divided based on the values of the protected attributes determined in S1 by known statistical calculations (S3).
- FIG. 8 is an explanatory diagram showing an example of inter-subgroup fairness indices and statistical tests.
- training data 20 is divided into subgroups SG10, SG11, SG12, SG13, and SG14 in the 20s, 30s, 40s, 50s, and 60s based on the value of the protected attribute (generation).
- the inter-subgroup fairness index calculation unit 11 calculates a DI value indicating the fairness index between these subgroups SG10, SG11, SG12, SG13, and SG14.
- the inter-subgroup statistical test calculation unit 12 calculates statistical tests such as population ratios for subgroups SG10 to SG14.
- FIG. 9 is an explanatory diagram showing an example of the calculation result.
- the information processing device 1 obtains the inter-subgroup fairness index and the statistical test result in the smallest discretized unit based on the value of the protection attribute, from the calculation result 30 of the inter-subgroup fairness index calculation unit 11 and the inter-subgroup statistical test calculation unit 12.
- the fairness index if the DI value is less than 0.8, it is considered to be a risk (present), and if it is 0.8 or more, it is considered to be no risk. Also, for statistics, if it is not rejected by a test of the difference in the population proportions (for example, a 5% test with a significance level of 0.05), it is considered to be no risk, and if it is rejected, it is considered to be a risk.
- the subgroup selection unit 13 is a processing unit that selects and groups subgroups that have similar risks on the fairness index based on the fairness index between the subgroups SG10 to SG14. Specifically, as shown in FIG. 7, after S3, the subgroup selection unit 13 selects subgroups that have similar fairness risks from among the subgroups SG10 to SG14 based on the fairness index (S4).
- the combination of subgroups SG10 and SG14 of people in their teens and sixties has a fairness index: no risk, so the subgroup selection unit 13 selects this as a subgroup with a similar fairness risk, and sets it as subgroup SG20.
- the subgroup selection unit 13 also sets another combination of subgroups with a fairness index: risk (present) as subgroup SG21. In this way, the subgroup selection unit 13 groups subgroups that have a similar fairness risk to other subgroups, even though the hypothesis that the population ratios are the same is not rejected.
- the subgroup combining unit 14 is a processing unit that combines subgroups within the grouped subgroups. Specifically, as shown in FIG. 7, after S4, the subgroup combining unit 14 combines the subgroups that have the highest fairness risk (lowest DI value) in the grouping unit (S5).
- FIG. 10 is an explanatory diagram explaining the merging of subgroups.
- subgroup SG20 which is made up of subgroups SG10 and SG14 in their 20s and 60s
- all subgroups have already been integrated, so there is no need to merge the subgroups.
- subgroup SG21 which is made up of subgroups SG11 to SG13 in their 30s, 40s, and 50s
- subgroup merging there are several possible combinations (subgroup merging) of subgroups SG11 to SG13.
- the subgroup combining unit 14 therefore combines the subgroups SG11 to SG13 contained in the subgroup SG21 so that the hypothesis that the population ratios are the same is more likely to be rejected. Specifically, the subgroup combining unit 14 combines the subgroups based on the number of data and the number of positive cases so that the proportion of positive cases when combined is higher.
- the inter-joined group statistical test calculation unit 15 is a processing unit that calculates statistical tests such as population ratios between the subgroups SG20 and SG21a joined by the subgroup joining unit 14. Specifically, as shown in FIG. 7, following S5, the inter-joined group statistical test calculation unit 15 performs statistical tests between the subgroups SG20 and SG21a joined by the subgroup joining unit 14 using known statistical calculations (S6).
- the evaluation result output unit 16 is a processing unit that outputs the evaluation result of the fairness between the subgroups SG20 and SG21a (e.g., DI value) as an evaluation of the fairness of the training data 20 according to the result of the statistical test by the combined group statistical test calculation unit 15, i.e., the test of the population proportion. Specifically, as shown in FIG. 7, after S6, the evaluation result output unit 16 performs an integrated judgment of whether or not the hypothesis that the population proportions are the same is rejected based on the test result of the difference in the population proportions between the combined subgroups SG20 and SG21a (e.g., a 5% test with a significance level of 0.05) (S7).
- DI value the evaluation result of the fairness between the subgroups SG20 and SG21a
- the evaluation result output unit 16 returns to S4 and repeats the process of subgroup selection (S4), integration (S5), and statistical test calculation between the integrated groups (S6).
- the evaluation result output unit 16 outputs the evaluation result (e.g., DI value) of the fairness of the state at that time (combination of combined subgroups) as an evaluation of the fairness of the training data 20.
- the evaluation result e.g., DI value
- FIG. 11 is an explanatory diagram for explaining an example of a process of repeating statistical testing by combining subgroups.
- the evaluation result output unit 16 judges whether or not the hypothesis that the population ratios are the same is rejected according to the results of the statistical test between combined groups statistical test calculation unit 15, i.e., the test of the population ratio. If the hypothesis is rejected, the evaluation result output unit 16 further judges whether or not the hypothesis that the population ratios are the same is rejected for the combination of subgroup SG21b, which is the combination of the subgroups in their 30s, and subgroup SG20 (S12).
- the evaluation result output unit 16 outputs the evaluation result of the fairness (e.g., DI value) for the combination of subgroup SG21b and subgroup SG20 as the evaluation of the fairness of the training data 20.
- the evaluation result of the fairness e.g., DI value
- FIG. 12 is an explanatory diagram illustrating a comparison between the evaluation result of the fairness evaluation according to the embodiment and the conventional evaluation result.
- evaluation result 40 in FIG. 12 indicates the conventional evaluation result
- evaluation result 50 indicates the evaluation result according to the embodiment.
- the conventional evaluation result 40 the result of all subgroup combinations based on the protected attributes is output.
- the evaluation result 50 according to the embodiment a combination that has been narrowed down from the combinations of subgroups based on the protected attributes as a highly reliable fairness evaluation that eliminates the possibility of coincidence is output.
- the training data processing unit 17 is a processing unit that processes the training data 20 based on the evaluation result of the evaluation result output unit 16, i.e., processes the correct labels (positive examples/negative examples) contained in the training data 20. Specifically, as shown in FIG. 7, the training data processing unit 17 processes the training data by changing the label of at least one of the subgroups SG20 and SG21a based on the evaluation result of the fairness of the training data 20, i.e., the evaluation result (e.g., DI value) of the fairness between the subgroups SG20 and SG21b, so as to improve the evaluation result (fairness index) (S8).
- the evaluation result e.g. DI value
- the training data processing unit 17 uses a known method called massaging processing to change the labels to improve the fairness index.
- massaging processing based on the evaluation results (e.g., DI value) of fairness between the subgroup SG20 of 20s + 60s and the subgroup SG21b of 30s + 40s + 50s, the labels of M pieces of data in subgroup SG20 are converted to positive, and the labels of N pieces of data in subgroup SG21b are converted to negative.
- the learning model construction unit 18 is a processing unit that performs known machine learning based on the training data 20 after the label change by the training data processing unit 17. Specifically, as shown in FIG. 7, following S8, when the training data 20 after the label change is input, the learning model construction unit 18 adjusts the parameters of the machine learning model 22 so that the machine learning model 22 outputs the assigned correct label, and constructs (trains) the machine learning model 22 (S9).
- the information processing device 1 selects the first plurality of data and the second plurality of data from the training data 20 based on a first evaluation value of fairness of a first plurality of data in the training data 20 having a first attribute with a first value, a second evaluation value of fairness of a second plurality of data in the training data 20 having a second value for the first attribute, and a third evaluation value of fairness of a third plurality of data in the training data 20 having a third value for the first attribute.
- the information processing device 1 performs a test of population ratios between a first group including the first plurality of data and the second plurality of data in the training data 20, and a second group including the third plurality of data.
- the information processing device 1 outputs the evaluation result of fairness between the first group and the second group as an evaluation of the fairness of the plurality of data according to the result of the test of population ratios.
- the information processing device 1 can obtain a highly reliable evaluation of fairness that eliminates the possibility of chance. Furthermore, in the information processing device 1, since the information processing device according to the embodiment does not verify the fairness of all combination patterns in the smallest discretized unit based on attribute values, it is possible to prevent an increase in the burden on the user and the amount of calculations, and to efficiently obtain an evaluation of fairness.
- the information processing device 1 changes at least one of the labels assigned to the data included in the first group of the training data 20 and the labels assigned to the data included in the second group of the training data 20. In this way, the information processing device 1 can correct the training data 20 by changing the labels based on the fairness evaluation result so that, for example, fairness is not compromised.
- the information processing device 1 trains the machine learning model 22 based on the training data 20 including data whose labels have been changed. In this way, the information processing device 1 can obtain a machine learning model 22 that has been trained without compromising fairness by training based on the machine learning model 22 whose labels have been changed based on the fairness evaluation results.
- the information processing device 1 outputs evaluation results obtained by repeating the process of selecting a first plurality of data and a second plurality of data from the training data 20 until the test of the population proportions satisfies a predetermined condition, and the process of performing a test of the population proportions between the first group and the second group. This allows the information processing device 1 to obtain evaluation results between groups that have been narrowed down until the test of the population proportions satisfies a predetermined condition, and, for example, can reduce the number of evaluation results that the user needs to verify.
- each component of each device shown in the figure does not necessarily have to be physically configured as shown in the figure.
- the specific form of distribution and integration of each device is not limited to that shown in the figure, and all or part of the devices can be functionally or physically distributed and integrated in any unit depending on various loads, usage conditions, etc.
- the various processing functions of the protection attribute determination unit 10, the inter-subgroup fairness index calculation unit 11, the inter-subgroup statistical test calculation unit 12, the subgroup selection unit 13, the subgroup combination unit 14, the inter-combined group statistical test calculation unit 15, the evaluation result output unit 16, the training data processing unit 17, and the learning model construction unit 18 of the information processing device 1 may be executed in whole or in part on a CPU (or a microcomputer such as an MPU or an MCU (Micro Controller Unit)). Needless to say, the various processing functions may be executed in whole or in part on a program analyzed and executed by the CPU (or a microcomputer such as an MPU or an MCU), or on hardware using wired logic. Furthermore, the various processing functions performed by the information processing device 1 may be executed by multiple computers working together using cloud computing.
- FIG. 9 is an explanatory diagram that explains an example of a computer configuration.
- the computer 200 has a CPU 201 that executes various types of arithmetic processing, an input device 202 that accepts data input, a monitor 203, and a speaker 204.
- the computer 200 also has a medium reading device 205 that reads programs and the like from a storage medium, an interface device 206 for connecting to various devices, and a communication device 207 for connecting to external devices via wired or wireless communication.
- the information processing device 1 also has a RAM 208 that temporarily stores various types of information, and a hard disk device 209. Each section (201 to 209) in the computer 200 is connected to a bus 210.
- the hard disk drive 209 stores a program 211 for executing various processes in the functional configuration described in the above embodiment (e.g., the protection attribute determination unit 10, the inter-subgroup fairness index calculation unit 11, the inter-subgroup statistical test calculation unit 12, the subgroup selection unit 13, the subgroup combination unit 14, the inter-combined group statistical test calculation unit 15, the evaluation result output unit 16, the training data processing unit 17, and the learning model construction unit 18).
- the hard disk drive 209 also stores various data 212 referenced by the program 211.
- the input device 202 for example, accepts input of operation information from an operator.
- the monitor 203 for example, displays various screens operated by the operator.
- the interface device 206 is connected to, for example, a printing device.
- the communication device 207 is connected to a communication network such as a LAN (Local Area Network) and exchanges various information with external devices via the communication network.
- LAN Local Area Network
- the CPU 201 reads out the program 211 stored in the hard disk drive 209, expands it in the RAM 208, and executes it to perform various processes related to the above-mentioned functional configuration (e.g., the protection attribute determination unit 10, the inter-subgroup fairness index calculation unit 11, the inter-subgroup statistical test calculation unit 12, the subgroup selection unit 13, the subgroup combination unit 14, the inter-combined group statistical test calculation unit 15, the evaluation result output unit 16, the training data processing unit 17, and the learning model construction unit 18).
- the program 211 does not have to be stored in the hard disk drive 209.
- the program 211 stored in a storage medium readable by the computer 200 may be read out and executed.
- Examples of storage media readable by the computer 200 include portable storage media such as CD-ROMs, DVD disks, USB (Universal Serial Bus) memories, semiconductor memories such as flash memories, hard disk drives, etc.
- the program 211 may also be stored in a device connected to a public line, the Internet, a LAN, etc., and the computer 200 may read and execute the program 211 from the device.
- CPU 202 input device 203: monitor 204: speaker 205: medium reading device 206: interface device 207: communication device 208: RAM 209...Hard disk drive 210...Bus 211...Program 212...Various data C10, C20...Cases C11, C21 to C23...Comparison C30...Combination results SG1 to SG21b...Subgroup
Landscapes
- Engineering & Computer Science (AREA)
- Theoretical Computer Science (AREA)
- Software Systems (AREA)
- Data Mining & Analysis (AREA)
- Evolutionary Computation (AREA)
- Medical Informatics (AREA)
- Computer Vision & Pattern Recognition (AREA)
- Physics & Mathematics (AREA)
- Computing Systems (AREA)
- General Engineering & Computer Science (AREA)
- General Physics & Mathematics (AREA)
- Mathematical Physics (AREA)
- Artificial Intelligence (AREA)
- Debugging And Monitoring (AREA)
Abstract
実施形態の評価プログラムは、選択する処理と、実行する処理と、出力する処理とをコンピュータに実行させる。選択する処理は、複数のデータのうち第1の属性が第1の値である第1の複数のデータの公平性の第1の評価値と、複数のデータのうち第1の属性が第2の値である第2の複数のデータの公平性の第2の評価値と、複数のデータのうち第1の属性が第3の値である第3の複数のデータの公平性の第3の評価値とに基づいて、複数のデータから第1の複数のデータと第2の複数のデータを選択する。実行する処理は、複数のデータのうち第1の複数のデータと第2の複数のデータとを含む第1のグループと、第3の複数のデータを含む第2のグループ間で母比率の検定を実行する。出力する処理は、検定の結果に応じて、第1のグループと第2のグループとの間の公平性の評価結果を複数のデータの公平性の評価として出力する。
Description
本発明の実施形態は、評価プログラム、評価方法および情報処理装置に関する。
近年、AI(Artificial Intelligence)システムにおいては、AIシステムを用いたローン審査において性別が判定の有無に影響しないようにするなどの、倫理的な公平性を考慮した設計が重要視されている。このような公平性リスクは、AIシステムの機械学習に用いるデータセット(以降、訓練データと呼ぶ)に内包されている。したがって、AIシステムの設計者は、訓練データの内容を検証し、公平性が損なわれないように予め訓練データを是正する。
このような機械学習に用いる訓練データに内包された公平性リスクを検出する従来技術としては、セグメント化されたサブグループに関する公平性値を検出するものが知られている。
しかしながら、上記の従来技術では、セグメント化されたサブグループのデータ数によって公平性値が信頼できない場合があり、誤検出あるいは検出漏れが生じやすいという問題がある。また、サブグループの組み合わせの全パターンを作成しようとすると、ユーザ(設計者)に対する負担や計算量が増大するという問題もあり、信頼性の高い公平性の評価を効率よく行うことは困難であった。
1つの側面では、データにおける信頼性の高い公平性の評価を効率よく行うことを可能とする評価プログラム、評価方法および情報処理装置を提供することを目的とする。
1実施形態では、評価プログラムは、選択する処理と、実行する処理と、出力する処理とをコンピュータに実行させる。選択する処理は、複数のデータのうち第1の属性が第1の値である第1の複数のデータの公平性の第1の評価値と、複数のデータのうち第1の属性が第2の値である第2の複数のデータの公平性の第2の評価値と、複数のデータのうち第1の属性が第3の値である第3の複数のデータの公平性の第3の評価値とに基づいて、複数のデータから第1の複数のデータと第2の複数のデータを選択する。実行する処理は、複数のデータのうち第1の複数のデータと第2の複数のデータとを含む第1のグループと、第3の複数のデータを含む第2のグループ間で母比率の検定を実行する。出力する処理は、検定の結果に応じて、第1のグループと第2のグループとの間の公平性の評価結果を複数のデータの公平性の評価として出力する。
1実施態様によれば、データにおける信頼性の高い公平性の評価を効率よく行うことができる。
以下、図面を参照して、実施形態にかかる評価プログラム、評価方法および情報処理装置を説明する。実施形態において同一の機能を有する構成には同一の符号を付し、重複する説明は省略する。なお、以下の実施形態で説明する評価プログラム、評価方法および情報処理装置は、一例を示すに過ぎず、実施形態を限定するものではない。また、以下の各実施形態は、矛盾しない範囲内で適宜組みあわせてもよい。
訓練データに内包された公平性リスクの評価を示す公平性指標としては、次の文献(1)に記載されているDI(Disparate Impact)値がある。
文献(1):Feldman, M., Friedler, S. A., Moeller, J., Scheidegger, C. and Venkatasubramanian, S.: Certifying and removing disparate impact, Proc. 21st ACM SIGKDD Int. Conf. on Knowledge Discovery and Data Mining, pp. 259-268(2015)
文献(1):Feldman, M., Friedler, S. A., Moeller, J., Scheidegger, C. and Venkatasubramanian, S.: Certifying and removing disparate impact, Proc. 21st ACM SIGKDD Int. Conf. on Knowledge Discovery and Data Mining, pp. 259-268(2015)
このDI値は、訓練データに含まれる、保護属性(特権者)のデータに対する、非保護属性(非特権者)のデータの正例比率であり、次の式(1)のとおりに算出できる。

例えば、式(1)のDI値では、unprivileged(非特権)を女性、privileged(特権)を男性とし、目的関数Y(Y=1の時Good(正例))とすると、保護属性を性別として、男性が女性より何かしらの利益を得るような状態(公平性指標)を示している。このようなDI値が示す公平性リスクにおいては、例えば、アメリカでは慣習的(一部法的)にDI値が0.8未満の場合に公平性リスクがあるものとして問題視される。
DI値に基づく公平性リスクの評価については、次の文献(2)に記載されているように、格差が最大となるサブグループ間のDI値を比較して公平性リスクを評価する従来手法(Worst case Disparity)がある。
文献(2):GHOSH, Avijit; GENUIT, Lea; REAGAN, Mary. Characterizing intersectional group fairness with worst-case comparisons. In: Artificial Intelligence Diversity, Belonging, Equity, and Inclusion. PMLR, (2021)
文献(2):GHOSH, Avijit; GENUIT, Lea; REAGAN, Mary. Characterizing intersectional group fairness with worst-case comparisons. In: Artificial Intelligence Diversity, Belonging, Equity, and Inclusion. PMLR, (2021)
図1は、サブグループ間のDI値の一例を説明する説明図である。図1に示すように、訓練データについて、属性(黒人女性、黒人男性、白人女性、白人男性)をもとに4つのサブグループSG1~SG4(セグメント)に分けられているものとする。このようなサブグループSG1~SG4間(黒人女性:正解率0.1、黒人男性:正解率0.2、白人女性:正解率0.3、白人男性:正解率0.6)のDI値により、公平性リスクの格差が最大となるグループが得られる。図示例では、DI値が0.16と最も低くなる黒人女性のサブグループSG1と、白人男子のサブグループSG4が得られ、白人男性に対する黒人女性が特に公平性リスクが大きいと評価できる。
ここで、従来手法(Worst case Disparity)を単純に適用した場合、データ数が少ないと本来は公平性リスクがないものが、公平性リスクありとして語検出される場合がある。
図2は、データ数の不足による誤検出の一例を説明する説明図である。図2に示すように、訓練データについて、20代、30代、40代の世代ごとにサブグループSG10~S12が分けられているものとする。ここで、20代のサブグループSG10は、正例数:5、データ数:20とする。30代のサブグループSG11は、正例数:5、データ数:20とする。40代のサブグループSG12は、正例数:10、データ数:20とする。
サブグループSG10、S12の比較C11については、DI(20代)値はDI=(5/20)/(10/20)=0.5であり、DI<0.8なので公平性リスクありとされる。しかしながら、サブグループSG10、S12のデータ数は20しかないので、サンプル不足により偶然、正例割合が高くなった可能性がある。すなわち、比較C11については、本来は公平性リスクがないものが、データ数が少ないがために公平性リスクありとして誤検出された可能性がある。
このような誤検出がされないように、DI値が信頼できるか否かを検定する方法としては、母比率の差の検定がある。しかしながら、母比率の差の検定を従来手法(Worst case Disparity)に対して単純に適用すると、本来は公平性リスクがあるものを見落とすおそれがある。
図3は、検出漏れの一例を説明する説明図である。図3に示すように、訓練データについて、20代、30代、40代、50代の世代ごとにサブグループSG10~S13が分けられているものとする。ここで、20代のサブグループSG10と、それ以外のサブグループSG11~SG13とについて、母比率の差の検定(有意水準を0.05とする5%検定)による比較C21~C23を行ったものとする。
例えば、20代×50代(サブグループSG10、SG13)の比較C23では、p(20代×50代)=0.053であり、50代のような(正例数11以上)データのゆらぎは5.3%の確率で発生する。したがって、比較C23において、母比率が同じであるという仮説は、5%検定で棄却されない。同様に、比較C21~C22についても、母比率が同じであるという仮説がデータ数が少ないから5%検定で棄却されないとすると、20代はそれ以外と比較して冷遇されているという公平性リスクが、検出できないこととなる。
また、属性に基づいて分割されたサブグループの組み合わせの全パターンを検証すると、ユーザに対する負担や計算量が増大する。図4は、サブルループの組み合わせの全パターンを作成する場合を説明する説明図である。
図4の組み合わせ結果C30に示すように、20代、30代…のサブグループSG10、SG11…の組み合わせを全パターン求めてDI値等の公平性指標よりリスク(公平性リスクあり)を評価すると、ユーザが確認すべき情報量(組み合わせ数)は膨大なものなる。また、組み合わせ結果C30のように、全パターンの公平性指標を求めてリスクを判定するとなると、計算量は膨大なものとなる。
図5は、実施形態にかかる公平性評価の概要を説明する説明図である。図5に示すように、実施形態にかかる情報処理装置は、例えばサンプル事例ごとの、複数のデータより構成される訓練データについて、所定の属性の値をもとにした最小の離散化単位のサブグループSG10~SG14間で公平性リスクの評価値(例えばDI値)を求める。ついで、実施形態にかかる情報処理装置は、サブグループSG10~SG14間の公平性リスクの評価値に基づき、公平性指標上で同様のリスクを持つサブグループを選択してグルーピングする。
所定の属性の値をもとにした最小の離散化単位のサブグループSG10~SG14については、個々の公平性リスクは検知されているが、データ数によっては、統計的には偶然性も示唆されている状態である。そこで、実施形態にかかる情報処理装置は、公平性指標上で同様のリスクを持つサブグループを選択してグルーピングすることで、グループ内のデータ数を増やし、データ数不足による偶然性の可能性を排除できる。
具体的には、実施形態にかかる情報処理装置は、DI値<0.8などの評価をもとに、公平性リスクなしのグループ同士(サブグループSG10、SG14)を結合したサブグループSG20と、それ以外のグループ同士(サブグループSG11、SG12、SG13)を結合したサブグループSG21とに分ける。
ついで、実施形態にかかる情報処理装置は、結合したサブグループSG20、サブグループSG21間で母比率の検定を実行し、この検定の結果に応じて、サブグループSG20、サブグループSG21の間の公平性の評価結果(例えばDI値)を出力する。これにより、実施形態にかかる情報処理装置では、偶然性の可能性を排除した信頼性の高い公平性の評価を得ることができる。また、実施形態にかかる情報処理装置は、最小の離散化単位のサブグループSG10~SG14の全組み合わせパターンの公平性を検証するものではないので、ユーザに対する負担や計算量が増大することを抑止でき、効率的に公平性の評価を得ることができる。
図6は、実施形態にかかる情報処理装置の機能構成例を示すブロック図である。図7は、実施形態にかかる情報処理装置の動作例を示すフローチャートである。
図6に示すように、情報処理装置1は、保護属性決定部10、サブグループ間公平性指標計算部11、サブグループ間統計検定計算部12、サブグループ選択部13、サブグループ結合部14、結合グループ間統計検定計算部15、評価結果出力部16、訓練データ加工部17および学習モデル構築部18を有する。
保護属性決定部10は、ユーザの操作入力などにより入力された外部知識21(ナレッジなど)をもとに、訓練データ20における公平性リスクの評価対象とする保護属性を決定する処理部である。
訓練データ20は、サンプル事例ごとに、事例の内容と、その事例における正例/負例を示す正解ラベルが付与された、複数のデータである。訓練データ20は、例えば、各事例と正解ラベルとがテーブル形式で格納されている。
図7に示すように、処理が開始されると、保護属性決定部10は、入力された外部知識21に基づき、訓練データ20に含まれる属性の中から保護属性を決定する(S1)。具体的には、保護属性決定部10は、外部知識21として指示されている属性(性別、世代など)を保護属性とする。なお、本実施形態では、一例として、図5に例示したような世代(10代、20代、30代…)を保護属性とする。
サブグループ間公平性指標計算部11は、訓練データ20について、保護属性の値に基づいた最小の離散化単位のサブグループSG10~S14間における公平性指標(公平性リスクの評価値)を計算する処理部である。具体的には、図7に示すように、サブグループ間公平性指標計算部11は、S1において決定された保護属性の値をもとに、訓練データ20を最小の離散化単位のサブグループSG10~SG14に分ける。ついで、サブグループ間公平性指標計算部11は、サブグループSG10~SG14間の公平性指標、例えばDI値を計算する(S2)。
サブグループ間統計検定計算部12は、訓練データ20について、保護属性の値に基づいた最小の離散化単位のサブグループSG10~S14間における母比率などの統計検定を計算する処理部である。具体的には、図7に示すように、サブグループ間統計検定計算部12は、S1において決定された保護属性の値に基づいて分けられたサブグループSG10~SG14の統計検定を公知の統計計算により行う(S3)。
図8は、サブグループ間の公平性指標および統計的検定の一例を示す説明図である。図8に示すように、訓練データ20については、保護属性(世代)の値をもとに、20代、30代、40代、50代、60代のサブグループSG10、SG11、SG12、SG13、SG14に分けられるものとする。サブグループ間公平性指標計算部11は、これらサブグループSG10、SG11、SG12、SG13、SG14間の公平性指標を示すDI値を計算する。また、サブグループ間統計検定計算部12は、サブグループSG10~SG14における母比率などの統計検定を計算する。
図9は、演算結果の一例を示す説明図である。図9に示すように、情報処理装置1は、サブグループ間公平性指標計算部11およびサブグループ間統計検定計算部12の演算結果30により、保護属性の値に基づいた最小の離散化単位におけるサブグループ間の公平性指標および統計検定の結果を得る。
ここで、公平性指標については、DI値が0.8未満の場合にリスク(あり)とし、0.8以上の場合にリスク無しとしている。また、統計は、母比率の差の検定(例えば有意水準を0.05とする5%検定)により棄却されない場合をリスク無し、棄却される場合をリスク有りとしている。
図示例では、20代と60代のサブグループSG10、SG14の組み合わせにおいて公平性指標がリスク無しであり、他のサブグループの組み合わせではリスク(あり)となっている。
サブグループ選択部13は、サブグループSG10~S14間における公平性指標に基づき、公平性指標上で同様のリスクを持つサブグループを選択してグループ化する処理部である。具体的には、図7に示すように、S3についで、サブグループ選択部13は、サブグループSG10~SG14の中から、公平性指標に基づいて、同様の公平性リスクを有するサブグループを選択する(S4)。
一例として、図9に示す演算結果30について、10代と60代のサブグループSG10、SG14の組み合わせが公平性指標:リスク無しであることから、サブグループ選択部13は、同様の公平性リスクを有するサブグループとして選択してサブグループSG20とする。また、サブグループ選択部13は、公平性指標:リスク(あり)の他のサブグループの組み合わせはサブグループSG21とする。このように、サブグループ選択部13は、母比率が同じであるという仮説が棄却されないながらも他のサブグループに対して同様の公平性リスクを有するサブグループをグループ化する。
サブグループ結合部14は、グループ化したサブグループ内でのサブグループの結合を行う処理部である。具体的には、図7に示すように、S4についで、サブグループ結合部14は、グルーピング単位で最も公平性リスクが高く(DI値が低く)なるようなサブグループの結合を行う(S5)。
図10は、サブグループの結合を説明する説明図である。図10に示すように、20代、60代のサブグループSG10、SG14をグループ化したサブグループSG20については、全てのサブグループが統合済であるので、サブグループの結合を行う必要はない。これに対し、30代、40代、50代のサブグループSG11~SG13をグループ化したサブグループSG21については、サブグループSG11~SG13の組み合わせ(サブグループの結合)が幾つか考えられる。
そこで、サブグループ結合部14は、母比率が同じであるという仮説が棄却されやすくなるように、サブグループSG21に含まれるサブグループSG11~SG13の結合を行う。具体的には、サブグループ結合部14は、データ数と正例数とをもとに、結合した場合の正例割合がより高くなるようにサブグループを結合する。
図示例では、サブグループSG13、SG12の組み合わせでは正例割合が11/20、サブグループSG13、SG11の組み合わせと、サブグループSG12、SG11の組み合わせとでは正例割合が21/40である。したがって、サブグループSG13、SG12を組み合わせたサブグループSG21aが得られる。
図6に戻り、結合グループ間統計検定計算部15は、サブグループ結合部14が結合したサブグループSG20、SG21a間における母比率などの統計検定を計算する処理部である。具体的には、図7に示すように、S5についで、結合グループ間統計検定計算部15は、サブグループ結合部14が結合したサブグループSG20、SG21a間の統計検定を公知の統計計算により行う(S6)。
評価結果出力部16は、結合グループ間統計検定計算部15の統計検定、すなわち母比率の検定の結果に応じて、サブグループSG20、SG21a間の公平性の評価結果(例えばDI値)を訓練データ20の公平性の評価として出力する処理部である。具体的には、図7に示すように、S6についで、評価結果出力部16は、結合したサブグループSG20、SG21a間の母比率の差の検定結果(例えば有意水準を0.05とする5%検定)に基づき、母比率が同じであるという仮説が棄却されるか否かの統合判定を行う(S7)。
母比率が同じであるという仮説が棄却された場合、評価結果出力部16は、S4へ処理を戻してサブグループの選択(S4)、統合(S5)、統合グループ間の統計検定計算(S6)の処理を繰り返す。
母比率が同じであるという仮説が棄却されなかった場合、評価結果出力部16は、その時点の状態(結合したサブグループの組み合わせ)の公平性の評価結果(例えばDI値)を訓練データ20の公平性の評価として出力する。
図11は、サブルループを結合して統計検定を繰り返す処理の一例を説明する説明図である。図11に示すように、結合したサブグループSG20、サブグループSG21aの組み合わせについて(S11)、評価結果出力部16は、結合グループ間統計検定計算部15の統計検定、すなわち母比率の検定の結果に応じて母比率が同じであるという仮説が棄却されたか否かを判定する。ここで、仮説が棄却されたか場合には、さらに30代のサブグループを結合したサブグループSG21bとサブグループSG20との組み合わせについて(S12)、評価結果出力部16は、母比率が同じであるという仮説が棄却されたか否かを判定する。ここで、母比率が同じであるという仮説が棄却されなかった場合、評価結果出力部16は、サブグループSG21b、サブグループSG20の組み合わせにおける公平性の評価結果(例えばDI値)を訓練データ20の公平性の評価として出力する。
図12は、実施形態にかかる公平性評価の評価結果と、従来の評価結果との比較を説明する説明図である。具体的には、図12における評価結果40は従来の評価結果を、評価結果50は実施形態にかかる評価結果を示している。図12に示すように、従来の評価結果40では、保護属性に基づく全サブグループの組み合わせの結果が出力される。これに対し、実施形態にかかる評価結果50では、保護属性に基づくサブグループの組み合わせの中で、偶然性の可能性を排除した信頼性の高い公平性の評価として絞り込まれた組み合わせが出力される。
図6に戻り、訓練データ加工部17は、評価結果出力部16の評価結果に基づいて訓練データ20の加工、すなわち、訓練データ20に含まれる正解ラベル(正例/負例)の加工を行う処理部である。具体的には、図7に示すように、訓練データ加工部17は、訓練データ20の公平性の評価、すなわち、サブグループSG20、SG21b間の公平性の評価結果(例えばDI値)をもとに、その評価結果(公平性指標)が改善されるように、サブグループSG20、SG21aの少なくとも一方のラベルを変更する訓練データ加工を行う(S8)。
訓練データ加工部17は、公平性指標を改善するようなラベル変更については、マッサージング処理と呼ばれる公知の手法を用いるものとする。一例として、20代+60代のサブグループSG20と、30代+40代+50代のサブグループSG21b間との公平性の評価結果(例えばDI値)をもとにマッサージング処理を行う場合、サブグループSG20の中でM個のデータのラベルを正に変換し、サブグループSG21bの中でN個のデータのラベルを負に変換するものとする。
ここで、M=10、N=10とすると、サブグループSG20の正例割合は(11+10)/60=21/60となる。また、サブグループSG21bの正例割合は(32-10)/60=22/60となる。よって、DI値は(21/60)/(22/60)=0.95となる(0.8より大きいため公平性リスクなし)。
学習モデル構築部18は、訓練データ加工部17によるラベル変更後の訓練データ20をもとに、公知の機械学習を行う処理部である。具体的には、図7に示すように、S8についで、学習モデル構築部18は、ラベル変更後の訓練データ20を入力した場合に、付与された正解ラベルを出力するように機械学習モデル22のパラメータ調整を行い、機械学習モデル22を構築(訓練)する(S9)。
以上のように、情報処理装置1は、訓練データ20のうち第1の属性が第1の値である第1の複数のデータの公平性の第1の評価値と、訓練データ20のうち第1の属性が第2の値である第2の複数のデータの公平性の第2の評価値と、訓練データ20のうち第1の属性が第3の値である第3の複数のデータの公平性の第3の評価値とに基づいて、訓練データ20から第1の複数のデータと第2の複数のデータを選択する。情報処理装置1は、訓練データ20のうち第1の複数のデータと第2の複数のデータとを含む第1のグループと、第3の複数のデータを含む第2のグループ間で母比率の検定を実行する。情報処理装置1は、母比率の検定の結果に応じて、第1のグループと第2のグループとの間の公平性の評価結果を複数のデータの公平性の評価として出力する。
これにより、情報処理装置1では、偶然性の可能性を排除した信頼性の高い公平性の評価を得ることができる。また、情報処理装置1では、実施形態にかかる情報処理装置は、属性の値による最小の離散化単位での全組み合わせパターンの公平性を検証するものではないので、ユーザに対する負担や計算量が増大することを抑止でき、効率的に公平性の評価を得ることができる。
また、情報処理装置1は、公平性の評価結果に基づいて、訓練データ20のうちの第1のグループに含まれるデータに付与されたラベル、および、訓練データ20のうちの第2のグループに含まれるデータに付与されたラベルの少なくとも一方を変更する。これにより、情報処理装置1は、公平性の評価結果に基づくラベル変更によって、例えば公平性が損なわれないように訓練データ20を是正することができる。
また、情報処理装置1は、ラベルが変更されたデータを含む訓練データ20に基づいて機械学習モデル22を訓練する。このように、情報処理装置1は、公平性の評価結果に基づいてラベル変更された機械学習モデル22に基づく訓練により、公平性が損なわれないように機械学習した機械学習モデル22を得ることができる。
また、情報処理装置1は、母比率の検定が所定の条件を満たすまで訓練データ20から第1の複数のデータと第2の複数のデータを選択する処理と、第1のグループと第2のグループ間で母比率の検定を実行する処理とを繰り返して得られた評価結果を出力する。これにより、情報処理装置1は、母比率の検定が所定の条件を満たすまで絞り込んだグループ間の評価結果を得ることができ、例えばユーザが検証すべき評価結果を少なくすることができる。
なお、図示した各装置の各構成要素は、必ずしも物理的に図示の如く構成されていることを要しない。すなわち、各装置の分散・統合の具体的形態は図示のものに限られず、その全部または一部を、各種の負荷や使用状況などに応じて、任意の単位で機能的または物理的に分散・統合して構成することができる。
また、情報処理装置1の保護属性決定部10、サブグループ間公平性指標計算部11、サブグループ間統計検定計算部12、サブグループ選択部13、サブグループ結合部14、結合グループ間統計検定計算部15、評価結果出力部16、訓練データ加工部17および学習モデル構築部18の各種処理機能は、CPU(またはMPU、MCU(Micro Controller Unit)等のマイクロ・コンピュータ)上で、その全部または任意の一部を実行するようにしてもよい。また、各種処理機能は、CPU(またはMPU、MCU等のマイクロ・コンピュータ)で解析実行されるプログラム上、またはワイヤードロジックによるハードウエア上で、その全部または任意の一部を実行するようにしてもよいことは言うまでもない。また、情報処理装置1で行われる各種処理機能は、クラウドコンピューティングにより、複数のコンピュータが協働して実行してもよい。
ところで、上記の実施形態で説明した各種の処理は、予め用意されたプログラムをコンピュータで実行することで実現できる。そこで、以下では、上記の実施形態と同様の機能を有するプログラムを実行するコンピュータ構成(ハードウエア)の一例を説明する。図9は、コンピュータ構成の一例を説明する説明図である。
図13に示すように、コンピュータ200は、各種演算処理を実行するCPU201と、データ入力を受け付ける入力装置202と、モニタ203と、スピーカ204とを有する。また、コンピュータ200は、記憶媒体からプログラム等を読み取る媒体読取装置205と、各種装置と接続するためのインタフェース装置206と、有線または無線により外部機器と通信接続するための通信装置207とを有する。また、情報処理装置1は、各種情報を一時記憶するRAM208と、ハードディスク装置209とを有する。また、コンピュータ200内の各部(201~209)は、バス210に接続される。
ハードディスク装置209には、上記の実施形態で説明した機能構成(例えば保護属性決定部10、サブグループ間公平性指標計算部11、サブグループ間統計検定計算部12、サブグループ選択部13、サブグループ結合部14、結合グループ間統計検定計算部15、評価結果出力部16、訓練データ加工部17および学習モデル構築部18)における各種の処理を実行するためのプログラム211が記憶される。また、ハードディスク装置209には、プログラム211が参照する各種データ212が記憶される。入力装置202は、例えば、操作者から操作情報の入力を受け付ける。モニタ203は、例えば、操作者が操作する各種画面を表示する。インタフェース装置206は、例えば印刷装置等が接続される。通信装置207は、LAN(Local Area Network)等の通信ネットワークと接続され、通信ネットワークを介した外部機器との間で各種情報をやりとりする。
CPU201は、ハードディスク装置209に記憶されたプログラム211を読み出して、RAM208に展開して実行することで、上記の機能構成(例えば保護属性決定部10、サブグループ間公平性指標計算部11、サブグループ間統計検定計算部12、サブグループ選択部13、サブグループ結合部14、結合グループ間統計検定計算部15、評価結果出力部16、訓練データ加工部17および学習モデル構築部18)に関する各種の処理を行う。なお、プログラム211は、ハードディスク装置209に記憶されていなくてもよい。例えば、コンピュータ200が読み取り可能な記憶媒体に記憶されたプログラム211を読み出して実行するようにしてもよい。コンピュータ200が読み取り可能な記憶媒体は、例えば、CD-ROMやDVDディスク、USB(Universal Serial Bus)メモリ等の可搬型記録媒体、フラッシュメモリ等の半導体メモリ、ハードディスクドライブ等が対応する。また、公衆回線、インターネット、LAN等に接続された装置にこのプログラム211を記憶させておき、コンピュータ200がこれらからプログラム211を読み出して実行するようにしてもよい。
1…情報処理装置
10…保護属性決定部
11…サブグループ間公平性指標計算部
12…サブグループ間統計検定計算部
13…サブグループ選択部
14…サブグループ結合部
15…結合グループ間統計検定計算部
16…評価結果出力部
17…訓練データ加工部
18…学習モデル構築部
20…訓練データ
21…外部知識
22…機械学習モデル
30…演算結果
40、50…評価結果
200…コンピュータ
201…CPU
202…入力装置
203…モニタ
204…スピーカ
205…媒体読取装置
206…インタフェース装置
207…通信装置
208…RAM
209…ハードディスク装置
210…バス
211…プログラム
212…各種データ
C10、C20…ケース
C11、C21~C23…比較
C30…組み合わせ結果
SG1~SG21b…サブグループ
10…保護属性決定部
11…サブグループ間公平性指標計算部
12…サブグループ間統計検定計算部
13…サブグループ選択部
14…サブグループ結合部
15…結合グループ間統計検定計算部
16…評価結果出力部
17…訓練データ加工部
18…学習モデル構築部
20…訓練データ
21…外部知識
22…機械学習モデル
30…演算結果
40、50…評価結果
200…コンピュータ
201…CPU
202…入力装置
203…モニタ
204…スピーカ
205…媒体読取装置
206…インタフェース装置
207…通信装置
208…RAM
209…ハードディスク装置
210…バス
211…プログラム
212…各種データ
C10、C20…ケース
C11、C21~C23…比較
C30…組み合わせ結果
SG1~SG21b…サブグループ
Claims (12)
- 複数のデータのうち第1の属性が第1の値である第1の複数のデータの公平性の第1の評価値と、前記複数のデータのうち前記第1の属性が第2の値である第2の複数のデータの公平性の第2の評価値と、前記複数のデータのうち前記第1の属性が第3の値である第3の複数のデータの公平性の第3の評価値とに基づいて、前記複数のデータから前記第1の複数のデータと前記第2の複数のデータを選択し、
前記複数のデータのうち前記第1の複数のデータと前記第2の複数のデータとを含む第1のグループと、前記第3の複数のデータを含む第2のグループ間で母比率の検定を実行し、
前記検定の結果に応じて、前記第1のグループと前記第2のグループとの間の公平性の評価結果を前記複数のデータの公平性の評価として出力する、
処理をコンピュータに実行させることを特徴とする評価プログラム。 - 前記評価結果に基づいて、前記複数のデータのうちの前記第1のグループに含まれるデータに付与されたラベル、および、前記複数のデータのうちの前記第2のグループに含まれるデータに付与されたラベルの少なくとも一方を変更する、
処理をさらに前記コンピュータに実行させることを特徴とする請求項1に記載の評価プログラム。 - 前記ラベルが変更されたデータを含む前記複数のデータに基づいて機械学習モデルを訓練する、
処理をさらに前記コンピュータに実行させることを特徴とする請求項2に記載の評価プログラム。 - 前記出力する処理は、前記母比率の検定が所定の条件を満たすまで前記選択する処理と、前記実行する処理とを繰り返して得られた前記評価結果を出力する、
ことを特徴とする請求項1に記載の評価プログラム。 - 複数のデータのうち第1の属性が第1の値である第1の複数のデータの公平性の第1の評価値と、前記複数のデータのうち前記第1の属性が第2の値である第2の複数のデータの公平性の第2の評価値と、前記複数のデータのうち前記第1の属性が第3の値である第3の複数のデータの公平性の第3の評価値とに基づいて、前記複数のデータから前記第1の複数のデータと前記第2の複数のデータを選択し、
前記複数のデータのうち前記第1の複数のデータと前記第2の複数のデータとを含む第1のグループと、前記第3の複数のデータを含む第2のグループ間で母比率の検定を実行し、
前記検定の結果に応じて、前記第1のグループと前記第2のグループとの間の公平性の評価結果を前記複数のデータの公平性の評価として出力する、
処理をコンピュータが実行することを特徴とする評価方法。 - 前記評価結果に基づいて、前記複数のデータのうちの前記第1のグループに含まれるデータに付与されたラベル、および、前記複数のデータのうちの前記第2のグループに含まれるデータに付与されたラベルの少なくとも一方を変更する、
処理をさらに前記コンピュータが実行することを特徴とする請求項5に記載の評価方法。 - 前記ラベルが変更されたデータを含む前記複数のデータに基づいて機械学習モデルを訓練する、
処理をさらに前記コンピュータが実行することを特徴とする請求項6に記載の評価方法。 - 前記出力する処理は、前記母比率の検定が所定の条件を満たすまで前記選択する処理と、前記実行する処理とを繰り返して得られた前記評価結果を出力する、
ことを特徴とする請求項5に記載の評価方法。 - 複数のデータのうち第1の属性が第1の値である第1の複数のデータの公平性の第1の評価値と、前記複数のデータのうち前記第1の属性が第2の値である第2の複数のデータの公平性の第2の評価値と、前記複数のデータのうち前記第1の属性が第3の値である第3の複数のデータの公平性の第3の評価値とに基づいて、前記複数のデータから前記第1の複数のデータと前記第2の複数のデータを選択し、
前記複数のデータのうち前記第1の複数のデータと前記第2の複数のデータとを含む第1のグループと、前記第3の複数のデータを含む第2のグループ間で母比率の検定を実行し、
前記検定の結果に応じて、前記第1のグループと前記第2のグループとの間の公平性の評価結果を前記複数のデータの公平性の評価として出力する、
処理を実行する制御部を含むことを特徴とする情報処理装置。 - 前記評価結果に基づいて、前記複数のデータのうちの前記第1のグループに含まれるデータに付与されたラベル、および、前記複数のデータのうちの前記第2のグループに含まれるデータに付与されたラベルの少なくとも一方を変更する、
処理をさらに前記制御部が実行することを特徴とする請求項9に記載の情報処理装置。 - 前記ラベルが変更されたデータを含む前記複数のデータに基づいて機械学習モデルを訓練する、
処理をさらに前記制御部が実行することを特徴とする請求項10に記載の情報処理装置。 - 前記出力する処理は、前記母比率の検定が所定の条件を満たすまで前記選択する処理と、前記実行する処理とを繰り返して得られた前記評価結果を出力する、
ことを特徴とする請求項9に記載の情報処理装置。
Priority Applications (1)
| Application Number | Priority Date | Filing Date | Title |
|---|---|---|---|
| PCT/JP2023/020790 WO2024252458A1 (ja) | 2023-06-05 | 2023-06-05 | 評価プログラム、評価方法および情報処理装置 |
Applications Claiming Priority (1)
| Application Number | Priority Date | Filing Date | Title |
|---|---|---|---|
| PCT/JP2023/020790 WO2024252458A1 (ja) | 2023-06-05 | 2023-06-05 | 評価プログラム、評価方法および情報処理装置 |
Publications (1)
| Publication Number | Publication Date |
|---|---|
| WO2024252458A1 true WO2024252458A1 (ja) | 2024-12-12 |
Family
ID=93795181
Family Applications (1)
| Application Number | Title | Priority Date | Filing Date |
|---|---|---|---|
| PCT/JP2023/020790 Ceased WO2024252458A1 (ja) | 2023-06-05 | 2023-06-05 | 評価プログラム、評価方法および情報処理装置 |
Country Status (1)
| Country | Link |
|---|---|
| WO (1) | WO2024252458A1 (ja) |
Citations (2)
| Publication number | Priority date | Publication date | Assignee | Title |
|---|---|---|---|---|
| US20210241033A1 (en) * | 2020-01-31 | 2021-08-05 | Salesforce.Com, Inc. | Test suite for different kinds of biases in data |
| CN115796303A (zh) * | 2022-11-24 | 2023-03-14 | 浙江工业大学 | 针对多维敏感属性的去偏方法 |
-
2023
- 2023-06-05 WO PCT/JP2023/020790 patent/WO2024252458A1/ja not_active Ceased
Patent Citations (2)
| Publication number | Priority date | Publication date | Assignee | Title |
|---|---|---|---|---|
| US20210241033A1 (en) * | 2020-01-31 | 2021-08-05 | Salesforce.Com, Inc. | Test suite for different kinds of biases in data |
| CN115796303A (zh) * | 2022-11-24 | 2023-03-14 | 浙江工业大学 | 针对多维敏感属性的去偏方法 |
Similar Documents
| Publication | Publication Date | Title |
|---|---|---|
| US10452525B2 (en) | Utilizing semantic clusters to predict software defects | |
| US20200293313A1 (en) | Methods and Apparatus for Finding Long Methods in Code | |
| US8549478B2 (en) | Graphical user interface input element identification | |
| CN102402479B (zh) | 用于静态分析的中间表示结构 | |
| WO2007109726A2 (en) | Social network aware pattern detection | |
| EP4071641A1 (en) | Evaluation method, evaluation program, and information processing device | |
| US20080126878A1 (en) | Highlighting anomalies when displaying trace results | |
| Cabanillas Silva et al. | Longitudinal model shifts of machine learning–based clinical risk prediction models: Evaluation study of multiple use cases across different hospitals | |
| Mu et al. | Examining the limitations of computational rumor detection models trained on static datasets | |
| US10372849B2 (en) | Performing and communicating sheet metal simulations employing a combination of factors | |
| JP6648511B2 (ja) | 支援装置、支援方法およびプログラム | |
| CN104751059B (zh) | 基于函数模板的软件行为分析方法 | |
| JP2019133470A (ja) | 挙動判別方法、挙動判別装置及びプログラム | |
| US20240095559A1 (en) | Steady range determination system, steady range determination method, and computer readable medium | |
| US20070130491A1 (en) | Error detection of digital logic circuits using hierarchical neural networks | |
| CN116226673B (zh) | 缓冲区漏洞识别模型的训练方法、漏洞检测方法及装置 | |
| CN119088671A (zh) | 代码故障预警方法、装置、终端设备及存储介质 | |
| JP2020144592A (ja) | 推定プログラム、装置、および方法 | |
| Ramzan et al. | Unlocking better bladder cancer care with AMAZON: adaptive quantile monitoring under progressive censoring | |
| Meiseles et al. | Vulnerability of pangolin SARS-CoV-2 lineage assignment to adversarial attack | |
| CN114566266B (zh) | 对象检测方法、装置、设备、存储介质以及程序产品 | |
| Nguyen et al. | MODULAR FAIRNESS CHECKER FOR MACHINE LEARNING PIPELINE | |
| CN116383834B (zh) | 针对源码漏洞检测工具异常的检测方法以及相关设备 | |
| JP7748776B2 (ja) | コンピュータ実装方法、情報処理システム及びコンピュータプログラム(推論不可能なデータの検出) | |
| CN120029898A (zh) | 一种白盒测试方法、装置、程序产品以及介质 |
Legal Events
| Date | Code | Title | Description |
|---|---|---|---|
| 121 | Ep: the epo has been informed by wipo that ep was designated in this application |
Ref document number: 23940566 Country of ref document: EP Kind code of ref document: A1 |
|
| NENP | Non-entry into the national phase |
Ref country code: DE |