WO2024249366A1 - Treatment of cancer with drq polypeptides - Google Patents
Treatment of cancer with drq polypeptides Download PDFInfo
- Publication number
- WO2024249366A1 WO2024249366A1 PCT/US2024/031149 US2024031149W WO2024249366A1 WO 2024249366 A1 WO2024249366 A1 WO 2024249366A1 US 2024031149 W US2024031149 W US 2024031149W WO 2024249366 A1 WO2024249366 A1 WO 2024249366A1
- Authority
- WO
- WIPO (PCT)
- Prior art keywords
- cells
- dcs
- cancer
- tumor
- total
- Prior art date
- Legal status (The legal status is an assumption and is not a legal conclusion. Google has not performed a legal analysis and makes no representation as to the accuracy of the status listed.)
- Ceased
Links
Classifications
-
- A—HUMAN NECESSITIES
- A61—MEDICAL OR VETERINARY SCIENCE; HYGIENE
- A61P—SPECIFIC THERAPEUTIC ACTIVITY OF CHEMICAL COMPOUNDS OR MEDICINAL PREPARATIONS
- A61P35/00—Antineoplastic agents
-
- A—HUMAN NECESSITIES
- A61—MEDICAL OR VETERINARY SCIENCE; HYGIENE
- A61K—PREPARATIONS FOR MEDICAL, DENTAL OR TOILETRY PURPOSES
- A61K39/00—Medicinal preparations containing antigens or antibodies
- A61K39/0005—Vertebrate antigens
- A61K39/0008—Antigens related to auto-immune diseases; Preparations to induce self-tolerance
-
- A—HUMAN NECESSITIES
- A61—MEDICAL OR VETERINARY SCIENCE; HYGIENE
- A61K—PREPARATIONS FOR MEDICAL, DENTAL OR TOILETRY PURPOSES
- A61K39/00—Medicinal preparations containing antigens or antibodies
- A61K2039/58—Medicinal preparations containing antigens or antibodies raising an immune response against a target which is not the antigen used for immunisation
- A61K2039/585—Medicinal preparations containing antigens or antibodies raising an immune response against a target which is not the antigen used for immunisation wherein the target is cancer
-
- A—HUMAN NECESSITIES
- A61—MEDICAL OR VETERINARY SCIENCE; HYGIENE
- A61K—PREPARATIONS FOR MEDICAL, DENTAL OR TOILETRY PURPOSES
- A61K39/00—Medicinal preparations containing antigens or antibodies
- A61K2039/60—Medicinal preparations containing antigens or antibodies characteristics by the carrier linked to the antigen
- A61K2039/6031—Proteins
-
- A—HUMAN NECESSITIES
- A61—MEDICAL OR VETERINARY SCIENCE; HYGIENE
- A61K—PREPARATIONS FOR MEDICAL, DENTAL OR TOILETRY PURPOSES
- A61K39/00—Medicinal preparations containing antigens or antibodies
- A61K2039/80—Vaccine for a specifically defined cancer
- A61K2039/812—Breast
-
- A—HUMAN NECESSITIES
- A61—MEDICAL OR VETERINARY SCIENCE; HYGIENE
- A61K—PREPARATIONS FOR MEDICAL, DENTAL OR TOILETRY PURPOSES
- A61K39/00—Medicinal preparations containing antigens or antibodies
- A61K2039/80—Vaccine for a specifically defined cancer
- A61K2039/876—Skin, melanoma
Definitions
- GBM Glioblastoma
- BC Breast cancer
- ERs estrogen receptors
- PRs progesterone receptors
- HER2 human epidermal growth factor receptor 2
- TNBC triple-negative breast cancer
- DCs Dendritic cells
- APCs antigen- presenting cells
- TAAs tumor-associated antigens
- the tumor can also empower immune-regulatory transcriptional programs that limit the DC-mediated production of pro-inflammatory cytokines and increase the release of IL-10 and indoleamine dioxygenase-1 (IDO1), which facilitate immunosuppression.
- DCs that produce IL-10 enforce T-cell anergy and are termed tol-DCs.
- IL-10 expression in DCs is considered a tolerogenic signature resulting in the induction of Tregs [8].
- B cells also play an Applicant’s Ref.: 3232-2 important role in the tumor ME.
- some B cell populations known as Bregs, have regulatory properties that are crucial for the maintenance of immune tolerance [9].
- CD74 (Ii chain) is a non-polymorphic type II transmembrane protein expressed mostly on the surface of APCs, and was initially thought to function solely as an MHC class II chaperone [11]. A small portion of the CD74 molecules undergo post- translational modifications that enable their cell surface expression [12].
- Cell surface CD74 serves as a receptor for ligands of the Macrophage Migration Inhibitory Factor (MIF) family that includes the cytokines MIF-1 (MIF) and MIF-2 / D-dopachrome tautomerase (DDT) [13].
- MIF Macrophage Migration Inhibitory Factor
- CD74 forms a cell surface complex with CD44, which is essential for the MIF-induced signaling cascade.
- the signaling pathway involves Syk tyrosine kinase and PI3K/Akt activation, which leads to CD74 intramembrane cleavage and the release of the CD74 intracellular domain (CD74-ICD).
- CD74-ICD translocates to the nucleus, where it induces cell proliferation and survival of B cells [14-20].
- MIF and CD74 have been associated with tumor progression and metastasis. It was reported that MIF mRNA is over-expressed in various tumors [21, 22] and MIF has also been associated with the growth of malignant cells [23]. Many studies have demonstrated that CD74 expression is upregulated in various cancers [24-29] including chronic lymphocytic leukemia (CLL) [30, 31] and correlates with poor prognosis. In particular, CD74 expression is upregulated in patients with TNBC compared to other breast cancer subtypes, and is associated with lymph node metastasis, leading to a worsening of the overall survival [32, 33].
- CLL chronic lymphocytic leukemia
- CD74 expression has also been suggested to serve as a prognostic factor in many of these cancers, with higher relative expression of CD74 behaving as a marker of tumor progression [34].
- CD74 plays a crucial role in Applicant’s Ref.: 3232-2 hematological malignancies such as CLL [35] and that its expression correlates with a poor prognosis, its function and mechanism in TNBC are incompletely understood.
- the methods include administering to a subject with cancer a therapeutically effective amount of a recombinant polypeptide including an antigenic peptide covalently linked to a DR ⁇ 1 domain or portion thereof including a glutamine residue at a position corresponding to amino acid 50 of SEQ ID NO: 1 or SEQ ID NO: 2, or a nucleic acid encoding the recombinant polypeptide.
- the recombinant polypeptide further includes a linker or spacer between the antigenic peptide and the DR ⁇ 1 domain.
- the linker includes a first glycine-serine spacer, a thrombin cleavage site, and a second glycine-serine spacer.
- the antigenic peptide is myelin oligodendrocyte glycoprotein (MOG)-35-55, for example, human or mouse MOG-35-55.
- the recombinant polypeptide includes or consists of the amino acid sequence of SEQ ID NO: 1 or SEQ ID NO: 2.
- the subject is administered about 0.1 mg/kg to about 10 mg/kg of the recombinant polypeptide.
- the cancer is a solid tumor, for example, melanoma, glioblastoma, or breast cancer.
- the cancer of the subject does not express a BRAF V600 mutation, the subject with cancer is resistant to immune checkpoint blockade therapy, or both.
- the disclosed methods may further include administering one or more additional therapies to the subject.
- the one or more additional therapies include one or more of surgery, radiation, chemotherapy, and immunotherapy.
- the immunotherapy includes immune checkpoint blockade therapy. Applicant’s Ref.: 3232-2
- FIGURE 1 is a Kaplan-Meier plot showing decreased overall survival in advanced melanoma patient samples that exhibit higher MIF expression.
- FIGURE 2 presents a graph showing decreased MIF production in B16F10 cells grown with DRmQ compared to vehicle control.
- FIGURE 3 shows growth curves of an intradermal B16F10 mouse melanoma model treated with vehicle control or DRmQ (P ⁇ 0.05 with unpaired two-tailed t-test).
- FIGURE 4 presents a photomicrograph showing the effects of DRQ treatment on immune infiltrates in B16F10 melanoma tumors.
- FIGURE 5 presents a plot illustrating that DRQ (top) increases infiltration of TRP2-reactive CD8+ cells, compared to vehicle control (bottom) as measured by TRP2- PE tetramer.
- FIGURE 6 presents a Western blot showing pSTAT3, pAKT, and pERK in B16F10 cells incubated with nothing (no tx), vehicle, or 50 ⁇ g DRQ for 1 hour.
- FIGURE 7A presents line and bar graphs 5-day measurements of tumor progression regulated by CD74.
- FIGURE 7B presents a photograph of tumors removed and measured from euthanized mice after 21 days of growth.
- FIGURE 7C presents a bar graph plotting tumor volume, with each dot representing an excised tumor.
- FIGURE 7F presents a bar graph plotting tolerogenic DCs that were analyzed for IL-10 among total DCs. Applicant’s Ref.: 3232-2
- FIGURE 7J presents a photograph of tumors measured after 21 days of growth.
- FIGURE 7K presents a graph of tumor volumes measured after 21 days of growth.
- FIGURE 8A presents a graph representing MIF-CD74 axis regulation of tol-DC and Breg expansion.
- FIGURE 10A provides a line graph of tumor size recorded from female 6- weeks-old CD11c-Cre x CD74flox x CD74 flox mice every five days following injection of 5*10 5 E0771 cells into each of the 4 th mammary pads.
- FIGURE 10C presents a graph of the tumor volumes with each dot representing an individual tumor.
- FIGURE 12A presents a graph representing the fold change in mRNA levels of SP1 following injections of 5*10 5 E0771 cells into each of the 4 th mammary pads of 6 weeks old female C57BL/6 mice.
- FIGURE 12B presents a graph representing the fold change in mRNA levels of IL1 ⁇ following injections of 5*10 5 E0771 cells into each of the 4 th mammary pads of 6 weeks old female C57BL/6 mice.
- FIGURE 15A presents a box plot analysis depicting the relative expression level of CD74 in several immune cell populations.
- FIGURE 16A represents analysis of DC cells for CD11c expression after excluding LY6-C+, F4/80+ and CD19. B cells were analyzed for CD19 after excluding LY6-C+, F4/80+ and CD11c.
- FIGURE 16B provides a plot representing analysis of IL-10+ expression on DCs was measured by comparing the non-activated for DCs (mono WT) 1,24 with the ones activated with PIM.
- FIGURE 16C provides a plot representing analysis of IL-10+ expression on DCs was measured by comparing the non-activated for DCs (WT) 52,6 with the ones activated with PIM. Applicant’s Ref.: 3232-2
- FIGURE 16D provides a plot representing analysis of IL-10+ expression on DCs was measured by comparing the non-activated for DCs (mono cKO) 1,22 with the ones activated with PIM.
- FIGURE 16E provides a plot representing analysis of IL-10+ expression on DCs was measured by comparing the non-activated for DCs (CKO) 3,13 with the ones activated with PIM.
- FIGURE 16F provides a plot representing IL-12+ expression on DCs measured by comparing the non-activated for sample subset (mono WT) 6,89 with the ones activated with PIM.
- FIGURE 16G provides a plot representing IL-12+ expression on DCs measured by comparing the non-activated for sample subset (WT) 7,95 with the ones activated with PIM.
- FIGURE 16H provides a plot representing IL-12+ expression on DCs measured by comparing the non-activated for sample subset (mono KO) 7,33 with the ones activated with PIM.
- FIGURE 16I provides a plot representing IL-12+ expression on DCs measured by comparing the non-activated for sample subset (KO) 13, 9 with the ones activated with PIM.
- FIGURE 16J provides a plot representing IL-10+ expression on B cells measured by comparing the nonactivated for either WT and CD74 -/- samples with the ones activated with PIM.
- FIGURE 16K provides a plot representing IL-10+ expression on B cells measured by comparing the nonactivated for either WT and CD74 -/- samples with the ones activated with PIM.
- FIGURE 16L provides a plot representing IL-10+ expression on B cells measured by comparing the nonactivated for either WT and CD74 -/- samples with the ones activated with PIM.
- FIGURE 16M provides a plot representing IL-10+ expression on B cells measured by comparing the nonactivated for either WT and CD74 -/- samples with the ones activated with PIM. Applicant’s Ref.: 3232-2
- FIGURE 19D presents a graph representing the percentage of DCs/live cells.
- FIGURE 19E presents a graph representing the mean and SD percentage of CD74 expression on monocytes.
- FIGURE 19F presents a graph representing the mean and SD percentage of CD74 expression on macrophages.
- FIGURE 19G presents a graph representing the mean and SD percentage of CD74 expression on B cells.
- FIGURE 19H presents a graph representing the mean and SD percentage of CD74 expression on DCs.
- FIGURE 19N presents a graph representing the expression of CD74 in the CD4+ populations.
- FIGURE 19O presents a graph representing the expression of CD74 in the C84+ populations. Applicant’s Ref.: 3232-2
- FIGURE 20A presents a plot representing the dead cells excluded from analysis by Zombie Live/Dead staining.
- FIGURE 20B presents a plot representing that macrophages and monocytes were gated for F4/80 and LY-6c, respectively.
- FIGURE 20C presents a plot representing that the double negative population was analyzed for CD19 and CD11c to detect DC and B cells.
- FIGURE 20D presents a plot representing the analysis of DCs obtained in FIG. 20C for CD26.
- FIGURE 20E presents a plot representing that the CD45+ population was gated for CD26 as a dendritic cell marker.
- FIGURE 20F presents a plot representing that the CD45+ population was gated for CD26 as a dendritic cell marker.
- FIGURE 20F presents a plot representing that CD26+ DCs were analyzed for F4/80.
- FIGURE 20G presents a plot representing that CD26+ DCs were analyzed for LY-6c.
- FIGURE 20H presents a plot representing that CD26+ DCs were analyzed for CD19.
- FIGURE 20I presents a plot representing that the CD45+ population was gated for CD64 as a macrophage marker.
- FIGURE 20J presents a plot representing that CD64+ macrophages were analyzed for CD19 and LY-6c expression.
- FIGURE 23A represents a visualization of the Ingenuity Pathway Analysis (IPA) where the relevant pathways are shown ordered by significance (p-value), calculated in IPA by right-tailed Fischer's exact t-test.
- IPA Ingenuity Pathway Analysis
- FIGURE 23B represents an IPA Upstream Regulator Analysis used to predict the upstream regulators responsible for the gene expression changes observed.
- FIGURE 23C presents a depiction of gene interactions, where some genes are upregulated, and some are suppressed.
- Applicant’s Ref.: 3232-2 SEQUENCES Any nucleic acid and amino acid sequences listed herein are shown using standard single letter abbreviations for nucleotide bases and amino acids, as defined in 37 C.F.R. ⁇ 1.822. In at least some cases, only one strand of each nucleic acid sequence is shown, but the complementary strand is understood as included by any reference to the displayed strand.
- SEQ ID NO: 1 is the amino acid sequence of an exemplary DRhQ polypeptide.
- DRhQ includes the antigenic peptide human MOG-35-55 (bold), a spacer (underlined), and a modified DR ⁇ 1 domain (italics).
- the L50Q mutation in the DR ⁇ 1 portion is shown in bold italic: MEVGWYRPPFSRVVHLYRNGKGGGGSLVPRGSGGGGIKEEHVIIQAEF YQNPDQSGEFMFDFDGDEIFHVDMAKKETVWRLEEFGRFASFEAQGALAN IAVDKANLEIMTKRSNYTPITN
- SEQ ID NO: 2 is the amino acid sequence of an exemplary DRmQ polypeptide.
- DRmQ includes the antigenic peptide mouse MOG-35-55 (bold), a spacer (underlined), and a modified DR ⁇ 1 domain.
- the L50Q mutation in the DR ⁇ 1 portion is shown in bold italic: MEVGWYRSPFSRVVHLYRNGKGGGGSLVPRGSGGGGIKEEHVIIQAEF YQNPDQSGEFMDFDGDEIFHVDMAKKETVWRLEEFGRFASFEAQGALANI AVDKANLEIMTKRSNYTPITN
- SEQ ID NO: 3 is an exemplary nucleic acid encoding a DRhQ polypeptide: ATGGAAGTTGGTTGGTACCGTCCCCCGTTCTCCCGTGTTGTTCACCTG TACCGTAACGGTAAAGGAGGTGGAGGCTCACTAGTGCCCCGAGGCTC TGGAGGTGGAGGCATCAAAGAAGAACATGTGATCATCCAGGCCGAG TTCTATCAGAATCCTGACCAATCAGGCGAGTTTATGTT
- the CD74 “CLIP” peptide plays a key intracellular role in loading antigenic peptides onto class II MHC molecules.
- the macrophage migration inhibitory factor (MIF) binding region for CD74 is extracellular, does not overlap with CLIP and can be expressed by multiple cell types independently of its role within the MHC II complex, including in melanoma.
- MIF macrophage migration inhibitory factor
- CD74 Upon binding MIF, CD74 undergoes phosphorylation of its cytosolic domain to initiate downstream signal transduction, through activation of the Lck protein tyrosine kinase, followed by activation of MAPK kinase (MEK), leading to phosphorylation of ERK1/2.
- AKT and PI3K pathways can be upregulated by MIF.
- CD74 is significantly upregulated in different cell types in various cancers [24-29], and is correlated with tumor progression.
- MIF a pro-inflammatory cytokine that serves as the ligand of CD74
- MIF a pro-inflammatory cytokine that serves as the ligand of CD74
- TNBC cells secrete MIF, which binds CD74 expressed on DCs and B cells, inducing a phenotypic switch from immunogenic to tolerogenic.
- Blocking CD74 leads to a reduced tumor load due to the elevated activity of the tumor-infiltrating immune cells.
- This anti-tumor phenotype is mainly caused by decreased IL-10 secretion, which results in a global decrease of the suppressive Bregs, Tregs, and tol-DCs in the TME.
- Bregs and tol-DCs in the TNBC ME can affect each other, enhancing IL-10 release via a positive feedback loop [54].
- a feedback loop between tol-DCs and Bregs was previously demonstrated in several processes such as T cell clonal anergy and Treg expansion, highlighting the complexity of the mediators involved in the generation and maintenance of tolerance. This crosstalk can be a double-edged sword, beneficial for example in the case of autoimmunity, but harmful in the case of cancer [55-57].
- the present disclosure shows that DCs significantly govern Breg expansion via CD74-induced pathways. However, Bregs are not able to control DC differentiation, supporting the hypothesis that DCs are the major players among tumor-infiltrating immune cells.
- the present disclosure also demonstrates that DCs control B cells and induce their immunosuppressive phenotype by regulating the expression of several genes involved in the immune response, resulting in an upregulation of IL-10 expression.
- the activation of CD74 results in the binding of CD74-ICD, which serves as a transcription regulator [20, 47] to the SP1 and the IL-1 ⁇ promotors in DCs and elevates their mRNA expression, suggesting that besides its role in B cells, CD74-ICD serves as a transcription regulator in DCs.
- the effect of DCs-mediated IL- 1 ⁇ secretion appears to be dominant compared to its direct effect on the B cells themselves, suggesting that IL-1 ⁇ releasing DCs hamper the expansion of the Breg population.
- Studies on the role of IL-1 ⁇ in regulatory B cells were performed mainly in autoimmune diseases, in which the environment and cytokines are completely different from those in the TME [60]. It is known that cytokines have different functions in different contexts and cells, and therefore it is suggested that IL-1 ⁇ might function differently in immune cells in the context of autoimmunity or cancer.
- CD74 downregulates SP1 expression in DCs, resulting in an upregulated IL-1 ⁇ secretion, which strongly reduces Breg expansion, leading to the activation of the immune response.
- the higher IL-1 ⁇ secretion from DCs is determined by both the direct effect of CD74 on its promotor, and the indirect effect of the MIF-CD74-SP1 axis.
- CD74 might serve as a novel therapeutic target in melanoma as well as in triple-negative breast cancer.
- DRQ The agent, termed DRQ, is a partial MHC class II protein construct linked to myelin oligodendrocyte glycoprotein peptide (MOG-35-55).
- DRQ binds CD74 and competitively inhibits MIF signaling (Meza-Romero et al., Metab Brain Dis.34:153- 164, 2019).
- MIF tumor microenvironment
- Preliminary data suggest that DRQ at the doses tested can selectively modulate the tumor microenvironment (TME) to promote anti-tumor activity while not Applicant’s Ref.: 3232-2 materially affecting other functions. While blocking the CD74/MIF axis has been proposed in cancer (Kang et al., Nat. Rev.
- DRQ Rheumatol.15:427-437, 2019
- a main advantage of DRQ is its lack of dose-limiting toxicity up to maximum feasible dose.
- DRQ has a potent anti-tumor effect and although there are other activities of MIF beyond binding to CD74, the main effect of DRQ is on CD74/MIF signaling.
- DRQ could thus provide an alternative treatment for individuals that fail currently approved treatments, particularly those who are BRAF wild type.
- a polypeptide includes singular or plural polypeptides and can be considered equivalent to the phrase “at least one polypeptide.”
- the term “comprises” means “includes.” It is further to be understood that any and all base sizes or amino acid sizes, and all molecular weight or molecular mass values, given for nucleic acids or polypeptides are approximate, and are provided for descriptive purposes, unless otherwise indicated. Although many methods and materials similar or equivalent to those described herein can be used, particular suitable methods and materials are described herein. In case of conflict, the present specification, including explanations of terms, will control.
- Antigen A compound, composition, or substance that can stimulate the production of antibodies or a T cell response in an animal, including compositions that are injected or absorbed into an animal.
- An antigen reacts with the products of specific Applicant’s Ref.: 3232-2 humoral or cellular immunity, including those induced by heterologous immunogens.
- the term “antigen” includes all related antigenic epitopes. “Epitope” or “antigenic determinant” or “antigenic peptide” refers to a site on an antigen to which B and/or T cells respond.
- T cells respond to the epitope, when the epitope is presented in conjunction with an MHC molecule.
- Epitopes can be formed both from contiguous amino acids or noncontiguous amino acids juxtaposed by tertiary folding of a protein. Epitopes formed from contiguous amino acids are typically retained on exposure to denaturing solvents whereas epitopes formed by tertiary folding are typically lost on treatment with denaturing solvents.
- An epitope typically includes at least 3, and more usually, at least 8 amino acids (such as about 8-50 or 8-23 amino acids) in a unique spatial conformation. Methods of determining spatial conformation of epitopes include, for example, x-ray crystallography and two-dimensional nuclear magnetic resonance.
- An antigen can be a tissue-specific antigen, or a disease-specific antigen. These terms are not exclusive, as a tissue-specific antigen can also be a disease-specific antigen.
- a tissue-specific antigen is expressed in a limited number of tissues, such as a single tissue.
- a tissue-specific antigen may be expressed by more than one tissue, such as, but not limited to, an antigen that is expressed in the central or peripheral nervous system.
- BRAF Also known as B-Raf proto-oncogene, serine/threonine kinase. A member of the RAF family of serine/threonine kinases involved in regulating MAP kinase/ERK signaling pathway.
- BRAF BRAF
- V600E or V600K BRAF
- Nucleic acid and protein sequences for BRAF are publicly available.
- GenBank Accession Nos. NM_004333 and NM_001374258 disclose exemplary human BRAF nucleic acid sequences
- GenBank Accession Nos. NP_004324 and NP_001361187 disclose exemplary human BRAF amino acid sequences. Each of these sequences is incorporated herein by reference as present in GenBank on May 26, 2023.
- CD74 Also known as CD74 molecule, Major Histocompatibility Complex class II invariant chain or MHC Class II gamma chain, or Ii.
- CD74 is a chaperone regulating antigen presentation. It is also a cell surface receptor for macrophage migration inhibitory factor (MIF).
- MIF macrophage migration inhibitory factor
- Nucleic acid and protein sequences for CD74 are publicly available. For example, GenBank Accession Nos. NM_001025158, NM_004355, and NM_001025159 disclose exemplary human CD74 nucleic acid sequences, and GenBank Accession Nos. NP_001020329, NP_004346, and NP_001020330 disclose exemplary human CD74 amino acid sequences.
- GenBank Accession Nos. NM_001042605 and NM_010545 disclose exemplary mouse CD74 nucleic acid sequences
- GenBank Accession Nos. NP_001036070 and NP_034675 disclose exemplary mouse CD74 amino acid sequences. Each of these sequences is incorporated herein by reference as present in GenBank on May 26, 2023.
- Control refers to a sample or standard used for comparison with an experimental sample. In some aspects, the control is a sample obtained from a healthy subject or population of healthy subjects. In other aspects, the control is a historical control or standard reference value or range of values (such as a previously tested control sample, such as a group of samples that represent baseline or normal values).
- control is from a subject prior to treatment (such as prior to treatment with a DRQ polypeptide).
- Domain A discrete part of an amino acid sequence of a polypeptide or protein that can be equated with a particular function.
- the ⁇ and ⁇ polypeptides that constitute a MHC class II molecule are each recognized as having two domains, ⁇ 1, ⁇ 2 and ⁇ 1, ⁇ 2, respectively.
- the various domains are typically joined by linking amino acid sequences.
- the entire domain sequence is included in a recombinant molecule by extending the sequence to include all or part of the linker or the adjacent domain.
- the selected sequence when selecting the ⁇ 1 domain of an MHC class II molecule, may extend from amino acid residue number 1 of the ⁇ chain, through the entire ⁇ 1 domain to amino acid 84 at the carboxy terminus of the ⁇ 1 domain.
- the precise number of amino acids in the various MHC molecule domains varies depending on the species of mammal, as well as between classes of genes within Applicant’s Ref.: 3232-2 a species.
- the selection of a sequence for use in a recombinant molecule requires maintenance of the domain function rather than a precise structural definition based on the number of amino acids.
- domain function may be maintained even if somewhat less than the entire amino acid sequence of the selected domain is utilized.
- a number of amino acids at either the amino or carboxy termini of the ⁇ 1 domain may be omitted without affecting domain function.
- substitution of amino acids within a domain may increase or decrease the binding affinity of the domain.
- the substitution of glutamine for leucine at position 50 of the DRhQ construct can increase its binding affinity for CD74.
- Immune checkpoint blockade A cancer immunotherapy that targets regulators of the immune system that dampen the immune response. Examples of checkpoint proteins found on T cells or cancer cells include PD-1, PD-L1, CTLA-4, BTLA, and TIM-3. These proteins inhibit T cells from killing cancer cells.
- Checkpoint inhibitors include agents that target molecules such as lymphocyte activation gene 3 (LAG3), T-cell immunoglobulin and mucin-domain containing-3 (TIM-3), CTLA-4 (e.g., ipilimumab, YERVOY®), PD-1 (e.g., nivolumab, OPDIVO® and pembrolizumab, KETRUDA®), and PD-L1.
- LAG3 lymphocyte activation gene 3
- TIM-3 T-cell immunoglobulin and mucin-domain containing-3
- CTLA-4 e.g., ipilimumab, YERVOY®
- PD-1 e.g., nivolumab, OPDIVO® and pembrolizumab, KETRUDA®
- PD-L1 e.g., nivolumab, OPDIVO® and pembrolizumab, KETRUDA®
- Inhibition of a disease can span the spectrum from partial inhibition to substantially complete inhibition of the disease, for example in a subject who has a disease or disorder or is at risk of developing a disease or disorder.
- the term “inhibiting” refers to reducing or delaying the onset or progression of a disease.
- “Treating” a disease refers to a therapeutic intervention that ameliorates a sign or symptom of a disease or pathological condition, such as a sign or symptom of cancer.
- a subject to be administered an effective amount of the pharmaceutical compound to inhibit or treat the disease or disorder can be identified by standard diagnosing techniques for such a disorder, for example, symptoms, basis of family history, or risk factor to develop the disease or disorder.
- Linker A molecule that covalently links two molecules (such as two polypeptides).
- Linkers such as a peptide linker or a chemical linker
- Peptide linker sequences which are generally between 2 and 25 amino acids in length (such as 5-10, 10-15, 15-20, or 20-25 amino acids), include, but are not limited to, the glycine(4)-serine spacer described by Chaudhary et al. (Nature 339:394-397, 1989).
- MHC Class II MHC Class II molecules are formed from two noncovalently associated proteins, the ⁇ chain and the ⁇ chain.
- the ⁇ chain comprises ⁇ 1 and ⁇ 2 domains, and the ⁇ chain comprises ⁇ 1 and ⁇ 2 domains.
- the cleft into which the antigen fits is formed by the interaction of the ⁇ 1 and ⁇ 1 domains.
- the ⁇ 2 and ⁇ 2 domains are transmembrane Ig-fold like domains that anchor the ⁇ and ⁇ chains into the cell membrane of the APC.
- MHC Class II complexes, when associated with antigen (and in the presence of appropriate co-stimulatory signals) stimulate CD4 T-cells.
- CD4 T-cells The primary functions of CD4 T-cells are to initiate the inflammatory response, to regulate other cells in the immune system, and to provide help to B cells for antibody synthesis.
- Pharmaceutically acceptable carriers Remington: The Science and Practice of Pharmacy, Adejare (Ed.), Academic Press, London, United Kingdom, 23 rd Edition (2021) describes compositions and formulations suitable for pharmaceutical delivery of the polypeptides and nucleic acids herein disclosed. In general, the nature of the carrier will depend on the particular mode of administration being employed. For instance, parenteral formulations usually comprise injectable fluids that include pharmaceutically and physiologically acceptable fluids such as water, physiological saline, balanced salt solutions, aqueous dextrose, trehalose, glycerol or the like as a vehicle.
- non-toxic solid carriers can include, for example, pharmaceutical grades of mannitol, trehalose, lactose, starch, or magnesium stearate.
- pharmaceutical compositions to be administered can contain minor amounts of non- Applicant’s Ref.: 3232-2 toxic auxiliary substances, such as wetting or emulsifying agents, preservatives, and pH buffering agents and the like, for example sodium acetate or sorbitan monolaurate.
- Recombinant A recombinant nucleic acid or polypeptide is one that has a sequence that is not naturally occurring or has a sequence that is made by an artificial combination of two or more otherwise separated segments of sequence.
- Sequence identity The similarity between two nucleic acid sequences, or two amino acid sequences, is expressed in terms of the similarity between the sequences, otherwise referred to as sequence identity. Sequence identity is frequently measured in terms of percentage identity (or similarity or homology); the higher the percentage, the more similar the two sequences are. Polypeptides or domains thereof that have a significant amount of sequence identity and function the same or similarly to one another – for example, the same protein in different species – can be called ‘homologs.’ Methods of alignment of sequences for comparison are well known in the art.
- NCBI Basic Local Alignment Search Tool is available from several sources, including the National Center for Biotechnology Information (NCBI, Bethesda, MD) and on the Internet, for use in connection with the sequence analysis programs blastp, blastn, blastx, tblastn and tblastx. Nucleic acid sequences that do not show a high degree of sequence identity may nevertheless encode similar amino acid sequences, due to the degeneracy of the genetic code.
- nucleic acid sequence can be made using this Applicant’s Ref.: 3232-2 degeneracy to produce multiple nucleic acid molecules that all encode substantially the same protein.
- Subject Living multi-cellular vertebrate organisms, a category that includes both human and non-human mammals.
- Therapeutically effective amount A quantity of a specific substance sufficient to achieve a desired effect in a subject being treated. For instance, this can be the amount necessary to inhibit or suppress growth of a tumor. In one aspect, a therapeutically effective amount is the amount necessary to eliminate, reduce the size, or prevent metastasis of a tumor, or to increase progression-free survival and/or overall survival of the subject.
- a dosage When administered to a subject, a dosage will generally be used that will achieve target tissue concentrations (for example, in tumors) that has been shown to achieve a desired in vitro or in vivo effect (for example, in an animal model or a clinical trial).
- II. Overview Clause 1 A method of treating a subject with cancer comprising administering to the subject a therapeutically effective amount of a recombinant polypeptide comprising an antigenic peptide covalently linked to a DR ⁇ 1 domain or portion thereof comprising a glutamine residue at a position corresponding to amino acid 50 of SEQ ID NO: 1 or SEQ ID NO: 2; or a nucleic acid encoding the recombinant polypeptide.
- Clause 2 The method of clause 1, wherein the recombinant polypeptide further comprises a linker between the antigenic peptide and the DR ⁇ 1 domain.
- Clause 3 The method of clause 2, wherein the linker comprises a first glycine- serine spacer, a thrombin cleavage site, and a second glycine-serine spacer.
- Clause 4 The method of any one of clauses 1 to 3, wherein the antigenic peptide is myelin oligodendrocyte glycoprotein (MOG)-35-55 or myelin basic protein (MBP)- 85-99.
- Clause 5 The method of clause 4, wherein the MOG-35-55 is human or mouse MOG-35-55.
- Clause 6 The method of any one of clauses 1 to 5, wherein the recombinant polypeptide comprises or consists of the amino acid sequence of SEQ ID NO: 1 or SEQ ID NO: 2.
- Clause 7 The method of any one of clauses 1 to 6, wherein the subject is administered about 0.1 mg/kg to about 10 mg/kg of the recombinant polypeptide.
- Clause 8 The method of any one of clauses 1 to 7, wherein the cancer is a solid tumor or a hematological malignancy.
- Clause 9 The method of clause 8, wherein the solid tumor is melanoma, glioblastoma, or breast cancer.
- Clause 10 The method of any one of clauses 1 to 9, wherein the cancer of the subject does not express a BRAF mutation.
- Clause 11 The method of clause 10, wherein the cancer of the subject does not express a BRAF V600 mutation.
- Clause 12 The method of any one of clauses 1 to 11, wherein the subject with cancer is resistant to immune checkpoint blockade therapy.
- Clause 13 The method of any one of clauses 1 to 12, further comprising administering one or more additional therapies to the subject.
- Clause 14 The method of clause 13, wherein the one or more additional therapies comprise one or more of surgery, radiation, chemotherapy, and immunotherapy.
- Clause 15 The method of clause 14, wherein the immunotherapy comprises immune checkpoint blockade therapy. III.
- the DRQ polypeptides include an antigenic peptide covalently linked to an MHC class II DR ⁇ 1 domain or fragment thereof and do not include MHC class II ⁇ 2, ⁇ 1, or ⁇ 2 domains, and include a substitution of glutamine (Q) for the leucine (L) present at the amino acid position corresponding to amino acid 50 of SEQ ID NO: 1 or SEQ ID NO: 2.
- the antigenic peptide included in the Applicant’s Ref.: 3232-2 DRQ polypeptide is MOG-35-55.
- the MOG-35-55 is human MOG-35-55, and the DRQ polypeptide is referred to as DRhQ, or the MOG-35-55 is mouse MOG-35-55, and the DRQ polypeptide is referred to as DRmQ.
- the antigenic peptide included in the DRQ polypeptide is myelin basic protein (MBP) 85-99 (e.g., SEQ ID NO: 5).
- MBP myelin basic protein
- the MOG-35-55 peptide e.g., amino acids 1-21 of SEQ ID NO: 1 or SEQ ID NO: 2 is replaced with the MBP-85-99 peptide of SEQ ID NO: 5.
- the DRQ polypeptide has at least 95% identity (such as at least 95%, 96%, 97%, 98%, 99%, or more identity) to the amino acid sequence of SEQ ID NO: 1 or SEQ ID NO: 2.
- the DRQ polypeptide includes or consists of the amino acid sequence of SEQ ID NO: 1 or SEQ ID NO: 2.
- the DRQ polypeptide is encoded by a nucleic acid having at least 90% identity (such as at least 90%, 91%, 92%, 93%, 94%, 95%, 96%, 97%, 98%, 99%, or more identity) to the nucleic acid sequence of SEQ ID NO: 3 or SEQ ID NO: 4.
- the DRQ polypeptide is encoded by a nucleic acid including or consisting of the nucleic acid sequence of SEQ ID NO: 3 or SEQ ID NO: 4.
- the recombinant polypeptide e.g., SEQ ID NO: 1 or SEQ ID NO: 2
- Nucleic acid constructs (such as expression constructs) encoding the recombinant polypeptides may also include regulatory elements such as promoters, enhancers, and/or 3′ regulatory regions, the selection of which will be determined based upon the type of cell in which the protein is to be expressed.
- the constructs are introduced into a vector suitable for expressing the recombinant polypeptide in the selected cell type.
- Numerous prokaryotic and eukaryotic systems are known for the expression and purification of polypeptides.
- heterologous polypeptides can be produced in prokaryotic cells by placing a strong, regulated promoter and an efficient ribosome binding site upstream of the polypeptide-encoding construct.
- Suitable promoter sequences include the beta-lactamase, tryptophan (trp), phage T7, and lambda PL Applicant’s Ref.: 3232-2 promoters.
- Methods and plasmid vectors for producing heterologous proteins in bacteria or mammalian cells are known to one of ordinary skill in the art.
- Suitable prokaryotic cells for expression of large amounts of proteins include Escherichia coli and Bacillus subtilis. Often, proteins expressed at high levels are found in insoluble inclusion bodies; methods for extracting proteins from these aggregates are known to one of ordinary skill in the art.
- Recombinant expression of recombinant polypeptides in prokaryotic cells may alternatively be conveniently obtained using commercial systems designed for optimal expression and purification of fusion proteins.
- fusion proteins typically include a tag that facilitates purification. Examples of such systems include: the pMAL protein fusion and purification system (New England Biolabs, Inc., Beverly, MA); the GST gene fusion system (Amersham Pharmacia Biotech, Inc., Piscataway, NJ); and the pTrcHis expression vector system (Invitrogen, Carlsbad, CA). Additional systems include the His6-tag (e.g., Roche Applied Science, Mannheim, Germany) or streptavidin binding peptide (e.g., Sigma- Aldrich, St. Louis, MO).
- His6-tag e.g., Roche Applied Science, Mannheim, Germany
- streptavidin binding peptide e.g., Sigma- Aldrich, St. Louis, MO.
- the pMAL expression system utilizes a vector that adds a maltose binding protein to the expressed protein.
- the fusion protein is expressed in E. coli. and the fusion protein is purified from a crude cell extract using an amylose column.
- the maltose binding protein domain can be cleaved from the fusion protein by treatment with a suitable protease, such as Factor Xa.
- the maltose binding fragment can then be removed from the preparation by passage over a second amylose column.
- the recombinant polypeptides can also be expressed in eukaryotic expression systems, including Pichia pastoris, Drosophila, Baculovirus and/or Sindbis expression systems produced by Invitrogen (Carlsbad, CA).
- Eukaryotic cells such as Chinese Hamster ovary (CHO), monkey kidney (COS), HeLa cells, 293 cells, Spodoptera frugiperda, and Saccharomyces cerevisiae may also be used to express recombinant polypeptides.
- Regulatory regions suitable for use in these cells include, for mammalian cells, viral promoters such as those from CMV, adenovirus or SV40, and for yeast cells, the promoter for 3-phosphoglycerate kinase or alcohol dehydrogenase.
- the vectors can be introduced into recipient cells (such as eukaryotic cells) as pure DNA (transfection) by, for example, precipitation with calcium phosphate or strontium phosphate, electroporation, lipofection, DEAE dextran, microinjection, protoplast fusion, or microprojectile guns.
- the nucleic acid molecules can be introduced by infection with virus vectors. Systems are developed that use, for example, retroviruses, adenoviruses, or Herpes virus.
- compositions that include a recombinant polypeptide or nucleic acid disclosed herein can be formulated with an appropriate solid or liquid carrier, depending upon the particular mode of administration chosen.
- suitable solid or liquid carrier such as an effective amount of a disclosed recombinant polypeptide or nucleic acid
- the pharmaceutically acceptable carriers and excipients useful in this disclosure include those known to one of ordinary skill in the art. See, e.g., Remington: The Science and Practice of Pharmacy, Adejare (Ed.), Academic Press, London, United Kingdom, 23 rd Edition (2021).
- parenteral formulations usually include injectable fluids that are pharmaceutically and physiologically acceptable fluid vehicles such as water, physiological saline, other balanced salt solutions, aqueous dextrose, glycerol or the like.
- injectable fluids that are pharmaceutically and physiologically acceptable fluid vehicles such as water, physiological saline, other balanced salt solutions, aqueous dextrose, glycerol or the like.
- physiologically acceptable fluid vehicles such as water, physiological saline, other balanced salt solutions, aqueous dextrose, glycerol or the like.
- conventional non-toxic solid carriers can include, for example, pharmaceutical grades of mannitol, lactose, starch, or magnesium stearate.
- compositions to be administered can contain minor amounts of non-toxic auxiliary substances, such as wetting or emulsifying agents, preservatives, pH buffering agents, cyclodextrins, cryo- protectant sugars, or the like, for example trehalose, sodium acetate or sorbitan monolaurate.
- auxiliary substances such as wetting or emulsifying agents, preservatives, pH buffering agents, cyclodextrins, cryo- protectant sugars, or the like, for example trehalose, sodium acetate or sorbitan monolaurate.
- Excipients that can be included are, for instance, other proteins, such as human serum albumin or plasma preparations.
- the dosage form of the pharmaceutical composition will be determined by the mode of administration chosen. For instance, in addition to injectable fluids, topical, inhalation, oral and suppository formulations can be employed. Topical preparations can include eye drops, ointments, sprays, patches and the like.
- Inhalation preparations can be liquid (e.g., solutions or suspensions) and include mists, sprays and the like.
- Oral formulations can be liquid (e.g., syrups, Applicant’s Ref.: 3232-2 solutions or suspensions), or solid (e.g., powders, pills, tablets, or capsules).
- Suppository preparations can also be solid, gel, or in a suspension form. Actual methods of preparing such dosage forms are known, or will be apparent, to one of ordinary skill in the art.
- the pharmaceutical composition may be administered by any mode that achieves its intended purpose.
- Amounts and regimens for the administration of the recombinant polypeptides or portion thereof (or a nucleic acid encoding such polypeptides) can be determined by the attending clinician. Effective doses for therapeutic application will vary depending on the nature and severity of the condition to be treated, the age and condition of the patient, and other clinical factors. Typically, the dose range will be from about 0.1 mg/kg body weight to about 10 mg/kg body weight.
- compositions that include a DRQ polypeptide or nucleic acid can be formulated in unit dosage form, suitable for individual administration of precise dosages.
- a unit dosage can contain from about 10 mg to about 1 g of the recombinant polypeptide (such as about 10 mg to about 50 mg, about 25 mg to about 250 mg, about 50 mg to about 500 mg, or about 100 mg to about 1 g).
- the amount of active compound(s) administered will be dependent on the subject being treated, the severity of the disorder being treated, and the manner of administration. Within these bounds, the formulation to be administered will contain a quantity of the active component(s) in amounts effective to achieve the desired effect in the subject being treated.
- the dosing schedule may vary from daily to once every other month, depending on a number of clinical factors, such as the subject’s condition and sensitivity to the administered composition.
- dosing schedules daily, every other day, three times/week, bi-weekly, weekly, two times/month (e.g., every two weeks), monthly (e.g., Applicant’s Ref.: 3232-2 every 4 weeks), every 6 weeks, or every 8 weeks.
- the treatment period is about 6 months, about 1 year, about 18 months, about 2 years, or more. In other examples, the treatment period continues until the subject no longer responds to the treatment, for example, the subject exhibits disease progression.
- the recombinant DRQ polypeptides or nucleic acids can be administered to humans or other animals on whose tissues they are effective in various manners such as topically, orally, intravenously, intramuscularly, intraperitoneally, intranasally, intradermally, intrathecally, subcutaneously, via inhalation, or via suppository.
- the compounds are administered to the subject intravenously.
- a composition including a DRQ polypeptide or nucleic acid is administered to a subject with cancer; for example, a subject with a solid tumor.
- solid tumors examples include sarcomas (e.g., fibrosarcoma, myxosarcoma, liposarcoma, chondrosarcoma, osteogenic sarcoma, and other sarcomas), synovioma, mesothelioma, Ewing sarcoma, leiomyosarcoma, rhabdomyosarcoma, colon cancer, colorectal cancer, peritoneal cancer, esophageal cancer, pancreatic cancer, breast cancer (e.g., basal breast carcinoma, ductal carcinoma, lobular breast carcinoma, or triple- negative breast cancer), lung cancer, ovarian cancer, prostate cancer, liver cancer (e.g., hepatocellular carcinoma), gastric cancer, squamous cell carcinoma (e.g., head and neck squamous cell carcinoma), basal cell carcinoma, adenocarcinoma, sweat gland carcinoma, medullary thyroid carcinoma, papillary thyroid carcinoma, p
- Solid tumors also include tumor metastases (e.g., metastases to the lung, liver, brain, or bone).
- tumor metastases e.g., metastases to the lung, liver, brain, or bone.
- the subject has melanoma, glioblastoma, breast cancer, colon cancer, or lung cancer.
- Applicant’s Ref.: 3232-2 In other aspects a composition including a DRQ polypeptide or nucleic acid is administered to a subject with a hematological malignancy.
- leukemias examples include leukemias, including acute leukemias (such as 11q23-positive acute leukemia, acute lymphocytic leukemia, acute myelocytic leukemia, acute myelogenous leukemia and myeloblastic, promyelocytic, myelomonocytic, monocytic and erythroleukemia), chronic leukemias (such as chronic myelocytic (granulocytic) leukemia, chronic myelogenous leukemia, and chronic lymphocytic leukemia), polycythemia vera, lymphoma, Hodgkin's disease, non-Hodgkin's lymphoma (indolent and high grade forms), multiple myeloma, Waldenstrom's macroglobulinemia, heavy chain disease, myelodysplastic syndrome, hairy cell leukemia and myelodysplasia.
- acute leukemias such as 11q23-positive acute leukemia, acute lymphoc
- the subject with cancer is a subject that has not responded to or no longer responds to (e.g., has or has developed resistance to) one or more cancer therapies.
- the subject has or has developed resistance to immune checkpoint blockade treatment (such as treatment with one or more of ipilimumab, nivolumab, and pembrolizumab), such as has disease progression following treatment with one or more immune checkpoint blockade therapies.
- the resistance may be primary resistance (e.g., the subject does not respond) or secondary resistance (the subject initially responded, but then progressed).
- the immune checkpoint blockade treatment was the first-line treatment.
- the subject does not have a mutation in the BRAF gene (e.g., is BRAF wild type).
- BRAF mutations are most frequently found in melanoma, and are also found in colon cancers, rectal cancers, lung cancers, thyroid cancers, ovarian cancers, and brain cancers. BRAF mutations are known in the art and are described in Smiech et al., (Genes (Basel) 11:1342, 2020).
- BRAF mutations include Class I mutations (V600 mutations, for example V600E, V600K, V600D, V600R, or V600M) which account for about 90% of all mutations.
- BRAF mutations include Class II or Class III mutations, which account for the remaining mutations.
- the subject does not have a BRAF V600 mutation (for example, their tumor does not express a BRAF V600 mutation).
- the subject does not have a Class Applicant’s Ref.: 3232-2 II or Class III BRAF mutation (for example, their tumor does not express a BRAF Class II or Class III mutation).
- the methods include selecting a subject that has primary or secondary resistance to immune checkpoint blockade treatment, does not have a BRAF mutation, or both.
- the methods further include determining whether a tumor sample from the subject expresses a BRAF V600 mutation.
- a subject whose tumor does not express a BRAF V600 mutation may be selected for treatment.
- treatment with DRQ results in an increase in progression-free survival, an increase in overall survival, or both, for example as compared with a subject not treated with DRQ.
- the progression-free survival is at least 2 months, at least 4 months, at least 6 months, at least 9 months, at least 12 months, at least 15 months, at least 18 months, at least 2 years, or more.
- the overall survival is at least 6 months, at least 9 months, at least 12 months, at least 15 months, at least 18 months, at least 2 years, or more.
- treatment with DRQ results in decreased tumor size, decreased number of tumors, or decreased metastasis, for example as compared with a subject not treated with DRQ.
- the DRQ polypeptide or nucleic acid is administered to the subject as a cancer monotherapy.
- additional agents can be administered to the subject, such as a chemotherapeutic agent or immune checkpoint blockade therapy. These can be included in the disclosed pharmaceutical compositions or administered separately.
- surgical treatment and/or radiation can be administered to the subject. Administration of additional therapies may be sequential or simultaneous. A skilled clinician can select additional therapies to be administered, for example, based on the cancer being treated, the subject’s response to prior therapies, the subject’s condition, and other factors.
- chemotherapeutic agents of use in the disclosed methods include alkylating agents, antimetabolites, natural products, or hormones and their antagonists.
- alkylating agents include nitrogen mustards (such as mechlorethamine, cyclophosphamide, melphalan, uracil mustard or chlorambucil), alkyl sulfonates (such as busulfan), nitrosoureas (such as carmustine, lomustine, semustine, streptozocin, or Applicant’s Ref.: 3232-2 dacarbazine).
- antimetabolites include folic acid analogs (such as methotrexate), pyrimidine analogs (such as 5-FU or cytarabine), and purine analogs, such as mercaptopurine or thioguanine.
- natural products include vinca alkaloids (such as vinblastine, vincristine, or vindesine), epipodophyllotoxins (such as etoposide or teniposide), antibiotics (such as dactinomycin, daunorubicin, doxorubicin, bleomycin, plicamycin, or mitocycin C), and enzymes (such as L-asparaginase).
- miscellaneous agents include platinum coordination complexes (such as cis-diamine-dichloroplatinum II also known as cisplatin), substituted ureas (such as hydroxyurea), methyl hydrazine derivatives (such as procarbazine), and adrenocrotical suppressants (such as mitotane and aminoglutethimide).
- platinum coordination complexes such as cis-diamine-dichloroplatinum II also known as cisplatin
- substituted ureas such as hydroxyurea
- methyl hydrazine derivatives such as procarbazine
- adrenocrotical suppressants such as mitotane and aminoglutethimide
- hormones and antagonists include adrenocorticosteroids (such as prednisone), progestins (such as hydroxyprogesterone caproate, medroxyprogesterone acetate, and magestrol acetate), estrogens (such as diethylstilbestrol and ethinyl estradiol), antiestrogens (such as tamoxifen), and androgens (such as testosterone proprionate and fluoxymesterone).
- adrenocorticosteroids such as prednisone
- progestins such as hydroxyprogesterone caproate, medroxyprogesterone acetate, and magestrol acetate
- estrogens such as diethylstilbestrol and ethinyl estradiol
- antiestrogens such as tamoxifen
- androgens such as testosterone proprionate and fluoxymesterone
- Examples of the most commonly used chemotherapy drugs include Adriamycin, Alkeran, Ara-C, BiCNU, Busulfan, CCNU, Carboplatinum, Cisplatinum, Cytoxan, Daunorubicin, DTIC, 5-FU, Fludarabine, Hydrea, Idarubicin, Ifosfamide, Methotrexate, Mithramycin, Mitomycin, Mitoxantrone, Nitrogen Mustard, Taxol (or other taxanes, such as docetaxel), Velban, Vincristine, VP-16, Gemcitabine, Herceptin, Irinotecan, Leustatin, Navelbine, Rituxan STI-571, Taxotere, Topotecan, Capecitabine), Zevelin and calcitriol.
- Non-limiting examples of immunomodulators that can be used include AS-101, bropirimine, gamma interferon, GM-CSF (granulocyte macrophage colony stimulating factor), IL-2, human immune globulin, IMREG, SK&F 106528, and TNF (tumor necrosis factor).
- the additional chemotherapeutic agent can be an antibody.
- Exemplary monoclonal antibody therapies includes trastuzumab, alemtuzumab, atezolizumab, avelumab, bevacizumab, blinatumomab, cetuximab, daratumumab, ipilimumab, nivolumab, ofatumumab, panitumumab, pembrolizumab, pertuzumab, and rituximab.
- the antibody can be an immune checkpoint inhibitor, for example an antibody specifically binds PD-1, PD-L1, TIM-3, or CTLA-4.
- Treatment regimens may also include combination with surgery, chemotherapy, radiation, or other immunoablative agents such as CAMPATH, anti-CD3 antibodies or other antibody therapies, cytoxin, fludarabine, cyclosporin, FK506, rapamycin, mycophenolic acid, steroids, FR901228, cytokines, and irradiation.
- chemotherapeutic agents include an anthracycline (e.g., doxorubicin (e.g., liposomal doxorubicin)).
- a vinca alkaloid e.g., vinblastine, vincristine, vindesine, vinorelbine
- an alkylating agent e.g., cyclophosphamide, decarbazine, melphalan, ifosfamide, temozolomide
- an immune cell antibody e.g., alemtuzamab, gemtuzumab, rituximab, tositumomab
- an antimetabolite including, e.g., folic acid antagonists, pyrimidine analogs, purine analogs and adenosine deaminase inhibitors (e.g., fludarabine)
- an mTOR inhibitor e.g., TNFR glucocorticoid induced TNFR related protein (GITR) agonist
- a proteasome inhibitor e.g., aclacinomycin A, gliotoxin or bortezomib
- FIG.2 is a graph showing decreased MIF production in B16F10 cells grown with DRmQ compared to vehicle control.
- FIG.3 shows growth curves of an intradermal B16F10 mouse melanoma model treated with vehicle control or DRmQ (P ⁇ 0.05 with unpaired two-tailed t-test).
- FIGS.4 show the effects of DRQ treatment on immune infiltrates in B16F10 melanoma tumors.
- FIG.5 illustrates that DRQ (top) increases infiltration of TRP2-reactive CD8+ cells, compared to vehicle control (bottom) as measured by TRP2-PE tetramer.
- FIG.6 is a Western blot showing pSTAT3, pAKT, and pERK in B16F10 cells incubated with nothing (no tx), vehicle, or 50 ⁇ g DRQ for 1 hour.
- FIGS.7A-7O illustrate that CD74 regulates tumor progression.
- FIGS.7D-7I show total PBMCs from the tumor site were activated with (PMA (phorbol 12-myristate 13-acetate), ionomycin, monensin) PIM and then analyzed by flow cytometry. Dead cells were excluded from analysis by Zombie Live/Dead staining. DC cells were analyzed for CD45, CD11c, and CD80 expression after excluding LY6-C + , F4/80 + and CD19 + cells.
- FIG.7F Tolerogenic DCs were analyzed for IL-10 among total DCs.
- FIGS.8A-8G illustrate that MIF-CD74 axis regulates tol-DC and Breg expansion.
- B cells and DCs were isolated from spleens of na ⁇ ve C57BL/6 and CD74 -/- mice and cultured either alone or in co-culture with E0771 cells at a 1:5 (B cells:E0771) or 1:3 (DCs:E0771) ratio. After 24 hours, B cells or DCs were collected and analyzed for CD19 and IL-10 expression or for CD11c and IL-10 expression, respectively, after excluding LY6-C + , F4/80 +, and CD19 + cells, by flow cytometry. Cells were activated with PIM prior to FACS staining. Dead cells were excluded from analysis by Zombie Live/Dead staining.
- FIGS.8C-8D splenic B cells and DCs were purified from IL-10 vert-x mice and cultured with E0771 cells at a 1:5 ratio, in presence of absence of mrMIF for 24h.
- E0771 cells were transfected with siRNA MIF or siCtrl. Splenic B cells and DCs were purified from IL-10 vert-x mice and added to the transfected E0771 at a 1:5 or 1:3 ratio for 24 h.
- MIF mRNA levels were analyzed by qRT-PCR.
- FIGS.9A-9F illustrate that deficiency of CD74 in mature B cells does not affect tumor proliferation.
- FIGS.9E-9F splenic B cells and DCs were cultured with E0771 cells at a 1:5 ratio for 24h.
- the histograms represent the expression of CD74 in the DC and B cell populations. ns p>0.05, * p ⁇ 0.05, **P ⁇ 0.005, ***p ⁇ 0.0005.
- FIGS.10A-10K illustrate that CD74 deficiency in dendritic cells reduces tumor proliferation by activation of the immune response.
- FIGS. 10J-10K splenic B cells and DCs were cultured with E0771 cells at a 1:5 ratio.
- the histograms represent the expression of CD74 in the DC and B cells populations. ns p>0.05, * p ⁇ 0.05, ***P ⁇ 0.0005, ****p ⁇ 0.00005.
- FIGS.11A-11G illustrate that CD74 mediates the crosstalk between DC and B cells enhancing immunosuppression in the tumor ME.
- B cells and DCs were isolated from spleens of na ⁇ ve C57BL/6 and CD74 -/- mice and cultured at a 1:1 ratio; E0771 cells were added at a 1:5 ratio. After 24 hours, B cells or DCs were collected and analyzed by flow-cytometry. PIM activation was conducted prior to FACS staining. Dead cells were excluded from analysis by Zombie Live/Dead staining.
- splenic DCs were purified from CD11c-Cre x CD74flox x CD74 flox mice and activated with E0771 for 24h.
- Naive splenic B cells were purified from C57BL/6 mice and activated with the WT or CD74 -/- DC for 24 h with fresh medium.
- splenic B cells were purified from C57BL/6 mice, activated with the E0771, and incubated with an anti-CD74 blocking antibody (LN-2) or isotype control antibody for 24h.
- Naive splenic DCs were purified from C57BL/6 mice and cultured together with the treated B cells with a fresh medium.
- splenic DCs were purified using magnetic beads from C57BL/6 and CD74 -/- mice and co-cultured with E0771 at a 1:3 ratio for 24h.
- Naive Splenic CD3 + T cells were purified from C57BL/6 mice and stained with the Cell Proliferation Dye (CPD) to determine their ability to proliferate.
- CPD Cell Proliferation Dye
- FIGS.12A-12D illustrate that CD74 deficiency in dendritic cells induces pro- inflammatory pathways boosting the anti-tumor immune response.
- Female 6 weeks old C57BL/6 mice were injected with 5*10 5 E0771 cells into each of the 4 th mammary pads.
- DRQ was injected intravenously on days 10 ,11, 12, 13, and 14, after tumor onset. After 21 days, tumor sizes were measured, and mice were euthanized. Tumors were processed into a single-cell suspension, and DCs were sorted from the tumor microenvironment of mice treated either with PBS or DRQ.
- FIGS.12A-12B mRNA levels of SP1 and IL1 ⁇ , were validated by qRT-PCR.
- FIGS.13A-13D illustrate that CD74-ICD binds IL-1 ⁇ promotor in DC, promoting their tolerogenic phenotype.
- FIGS.13A-13C splenic dendritic cells were isolated from vert-x mice and cultured in presence of the E0771 at a 1:3 ratio. IL-1 ⁇ agonist or vehicle was added to the cells for 48h.
- splenic DCs were purified from C57BL/6 mice and activated with the E0771 for 24h in presence of IL-1 ⁇ agonist or PBS control.
- Naive splenic B cells were purified from C57BL/6 mice and added to the DCs for 24 h with a fresh medium.
- FIG.13D shows female 6-weeks-old C57BL/6 mice were injected with 5*10 5 E0771 cells into each of the 4 th mammary pads. After 21 days, mice were euthanized.
- FIGS.14A-14G illustrate that SP1 binds the IL-1 ⁇ promotor on DC via the MIF- CD74 axis, inducing their tolerogenic phenotype.
- FIGS.14A-14C splenic dendritic cells were isolated from vert-x mice and cultured in presence of E0771 cells at a 1:3 ratio. SP1 blocker (MIT) or DMSO were added to the cells for 48h.
- FIG.14B splenic DCs were purified from C57BL/6 mice and activated with the E0771 for 24h in the presence Applicant’s Ref.: 3232-2 of DMSO or MIT.
- splenic B cells were purified from C57BL/6 mice and activated with either E0771 cells alone or with purified DCs for 24h in presence of MIT or DMSO.
- FIGS.14D-14E show female 6-week-old C57BL/6 mice were injected with 5*10 5 E0771 cells into each of the 4 th mammary pads. After 21 days, tumor sizes were measured, and mice euthanized. Tumors were processed into single cell suspension and DCs were sorted from the tumor microenvironment. Sorted DCs were activated for 1h with either mrMIF or vehicle, and a chip-qPCR for the SP1 promotor was performed.
- FIG.14F shows female 6- weeks-old C57BL/6 mice were injected with 5*10 5 E0771 cells into each of the 4 th mammary pads. After 21 days, tumor sizes were measured, and mice euthanized. Tumors were processed into single cell suspension and DCs were sorted from the tumor microenvironment.
- Sorted DCs were activated for 1h with either mrMIF, DRQ or vehicle, and a ChIP-qPCR for IL-1 ⁇ promoter was performed.
- DCs were purified from C57BL/6 mice and seeded together with E077 in the presence or absence of MIT.
- FIGS.15A-15C illustrate that CD74 expression is upregulated in tolerogenic DCs and B cells.6 weeks old C57BL/6 female mice were injected with 5*105 E0771 cells into each of the 4th mammary pads (total of two mammary pads per mouse). Mice were euthanized, and total PBMCs from the tumor site and spleen were activated with PIM and then analyzed by flow cytometry. Dead cells were excluded from analysis by Zombie Live/Dead staining.
- FIG.15A shows box plot analysis depicting the relative expression level of CD74 in several immune cell populations.
- FIGS.16A-16M illustrate a gating strategy for IL-10+ DCs and B cells and for IL-12+ DCs. PBMCs from the tumor site were activated with PIM and then analyzed by flow cytometry.
- FIG.16A DC cells were analyzed for CD11c expression after excluding LY6-C+, F4/80+ and CD19.
- B cells were analyzed for CD19 after excluding LY6-C+, F4/80+ and CD11c.
- FIGS.16B-16E IL-10+ expression on DCs was measured by comparing the non-activated for either WT and CD74 -/- samples with the ones activated with PIM.
- FIGS.16F-16I IL-12+ expression on DCs was measured by comparing the non-activated for either WT and CD74 -/- samples with the ones activated with PIM.
- FIGS.16J-16M IL-10+ expression on B cells was measured by comparing the nonactivated for either WT and CD74 -/- samples with the ones activated with PIM.
- FIGS.17A-17I illustrate that CD74 regulates the accumulation of tolerogenic immune cells in the TME.6 weeks old C57BL/6 and CD74-/- female mice were injected with 5*105 E0771 cells into each of the 4th mammary pads (total of two mammary pads per mouse).
- FIG.17B DC cells were analyzed for CD45, CD11c, and IL-10 expression after excluding LY6-C+, F4/80+ and CD19+ cells.
- FIGS.18A-18E illustrate that the CD74 blocker DRQ restores the immunogenicity of the TME.6 weeks old C57BL/6 female mice were injected with 5*105 E0771 cells into each of the 4th mammary pads (total of two mammary pads per mouse). On days 10, 11, 12, 13, 14, after tumor implantation, DRQ was intravenously injected.
- FIG.18B DC cells were analyzed for CD45, CD11c, and IL-10 expression after excluding LY6-C+, F4/80+ and CD19+ cells.
- FIGS.19A-19O illustrate that CD74 deficiency in DC specifically affects the dendritic cells population.
- Female 6-week-old CD11c-Cre x CD74flox x CD74 flox mice were sacrificed, spleens were harvested, processed to a single cell suspension, and total PBMCs were isolated.
- FIGS.19N-19O show expression of CD74 in the CD4+ (FIG.19N) and CD8+ (FIG.19O) populations. ns p>0.05, **P ⁇ 0.005, ***p ⁇ 0.0005.
- FIGS.20A-20J illustrate that CD26 and CD68 are not specific markers for DCs or macrophages. PBMCs from the spleen of na ⁇ ve mice were analyzed by flow cytometry.
- FIG.20A shows that Dead cells were excluded from analysis by Zombie Live/Dead staining.
- FIG.20B shows that macrophages and monocytes were gated for F4/80 and LY-6c, respectively.
- FIG.20C shows that the double negative population was analyzed for CD19 and CD11c to detect DC and B cells.
- DCs obtained in FIG.20C were analyzed for CD26.
- FIGS.20E-20F shows that the CD45+ population was gated for CD26 as a dendritic cell marker.
- FIGS.20G-20H shows that CD26+ DCs were analyzed for F4/80, LY-6c and CD19.
- FIG.20I shows that CD45+ population was gated for CD64 as a macrophage marker.
- FIG.20J CD64+ macrophages were analyzed for CD19 and LY-6c expression.
- FIGS.21A-21D illustrate that conditional KO of CD74 in mature B cells impacts the IL-10 release from monocytes and macrophages.
- Female 6-week-old CD23- Cre x CD74flox x CD74 flox mice were injected with 5*105 E0771 cells into each of the 4th mammary pads. After 21 days, mice were euthanized, and tumors were harvested, processed to a single cell suspension, and total PBMCs from the tumor site were isolated. Cells were then activated with PIM and analyzed by flow cytometry.
- FIGS.22A-22I illustrate that CD74 conditional KO in mature B cells reduces the frequency of tumor-infiltrating immunosuppressive cells.
- FIGS.23A-23C illustrate that CD74 downregulation in DC induces pro- inflammatory pathways and depicts RNA-seq analysis. Female 6 weeks old C57BL/6 mice were injected with 5*105 E0771 cells into each of the 4th mammary pads (total of two mammary pads per mouse).
- FIG.23A depicts visualization of the Ingenuity Pathway Analysis (IPA) where the relevant pathways are shown ordered by significance (p-value), calculated in IPA by right-tailed Fischer's exact t-test. The pro-inflammatory pathways show a positive z-score indicating that pathway activity is increased in DRQ versus PBS treated-mice.
- IPA Ingenuity Pathway Analysis
- FIG.23B shows IPA Upstream Regulator Analysis was used Applicant’s Ref.: 3232-2 to predict the upstream regulators responsible for the gene expression changes observed.
- IL-10 receptor is shown to be downregulated in DCs treated with DRQ.
- FIG.23C depicts the gene interactions, where some genes are upregulated, while some genes are suppressed. Genes related to immunogenic response of DCs are increased in DRQ versus PBS treated mice.
- Analysis of the publicly available The Cancer Genome Atlas (TCGA) datasets revealed that high MIF expression was correlated with reduced overall survival in the skin cancer melanoma (SKCM) patient cohort (FIG.1).
- MIF is expressed by tumor cells and downregulated by DRQ.
- B16F10 cells were incubated for 48 hours with either vehicle control (Tris-HCl pH 8.5 + 8.5% sucrose) or DRQ at 25 ⁇ g and 50 ⁇ g and supernatants were collected.
- DRQ controls tumor growth in a localized intradermal tumor model.
- Eight- week-old C57BL/6 mice were injected with 5 x10 5 B16F10 mouse melanoma cells intradermally on day 1. Mice were then treated three times per week for two weeks with DRQ (at a dose of 100 ⁇ g) or vehicle control starting when the tumor was first visible (day 5). Per IACUC requirement, tumors were harvested at 2 cm diameter. DRQ provided a statistically significant survival benefit compared to vehicle control in these localized tumors (FIG.3).
- DRQ increases immune infiltration into the tumor microenvironment.
- Photomicrographs of an intradermal B16F10 melanoma tumor from a mouse treated with DRQ demonstrated a brisk immune infiltrate within the tumor (FIG.4) compared with vehicle control.
- the tumors were disaggregated and then analyzed with flow cytometry.
- Flow data demonstrated a notable infiltrating immune population, and ⁇ 11% of the immune population consisted of CD8+ T lymphocytes; while similar tumor samples with vehicle control had significantly fewer identifiable immune cells by flow cytometry.
- DRQ increases the fraction of TRP2-reactive CD8+ cells in B16F10 tumors.
- RNA-Seq data demonstrates DRQ decreases expression of ERK in B16F10 cells.
- Bulk RNA-sequencing was performed on DRQ-treated B16F10 cells versus control to confirm that DRQ functions through reduction of ERK expression and to identify other genes differentially expressed. Read counts were analyzed to assess differences in gene expression between populations using DEseq2.
- Count data was fitted to a negative binomial general linear model; to control for multiple comparisons a Benjamini-Hochberg correction was performed. Notably, the DRQ samples had significantly reduced levels of MAPK1 (ERK2) expression compared to control (p ⁇ 0.05). DRQ also downregulates TLR-2 and TLR-4 and other proinflammatory messengers, that play a key role in the inflammatory reaction. DRQ downregulates pERK and pSTAT3 expression. B16F10 cells were grown in culture and then incubated with either vehicle or 50 ⁇ g of DRQ for 1 hour. Half a million cells from each condition were spun and lysed. Lysates were collected and subjected to SDS-PAGE in 10-20% gradient gels under reducing conditions.
- Example 3 Determining Minimum Effective and Optimal Doses of DRQ Studies to determine minimum effective and optimal dose of DRQ (DRhQ or DRmQ) in BRAF wt mouse melanoma models B16F10 and YUMM4.1 are performed.
- the minimum effective dose is the dose at which this the dose that shows least tumor growth with acceptable toxicity. Animals are thoroughly assessed for signs of toxicity in this model. The mice are observed for status, weight, and food intake at least daily. On death of the animal or endpoint of the study, a full necropsy with organ weights, histopathology, hematology, and clinical chemistry is conducted.
- two mouse melanoma models are utilized (B16F10 and YUMM4.1).
- mice Male and female C57BL/6 mice at 8-9 weeks of age are injected intradermally with 1 x 10 5 mouse melanoma cells on the flank. Upon engraftment and detection of visible tumor, the mice begin treatment with either DRQ i.v. (at doses of 1 ⁇ g, 10 ⁇ g, 25 ⁇ g, 50 ⁇ g, 100 ⁇ g, 250 ⁇ g, and 500 ⁇ g (500 ⁇ g is the MFD) or vehicle control, three times per week for two weeks. Tumor growth is monitored by conventional caliper daily and mice are euthanized when the tumor diameters reach 2 cm.
- DRQ i.v. at doses of 1 ⁇ g, 10 ⁇ g, 25 ⁇ g, 50 ⁇ g, 100 ⁇ g, 250 ⁇ g, and 500 ⁇ g (500 ⁇ g is the MFD) or vehicle control, three times per week for two weeks. Tumor growth is monitored by conventional caliper daily and mice are euthanized when the tumor diameters reach 2 cm.
- Tumors are harvested to generate FFPE slides for cyclic multiplexed immunofluorescence (cycIF) and for flow cytometry and protein and transcriptional interrogation.
- Cells are sorted into CD45+ fraction (immune cells) and tumor fraction (CD45- cells). Each fraction is then analyzed for expression of CD74, CD44, PD-L1, PD-L2, HIF1a, MIF and pERK1/2 by Western blot. Soluble CD74 (sCD74) in plasma at time of sacrifice is also measured.
- TRP1, TRP2, and gp100 are melanoma-specific antigens that have tetramers available (Immudex). Additionally, number of infiltrating CD8+ T cells, CD4+ T cells, MDSCs, NK cells and Tregs is assessed using flow cytometry. Cell surface expression of CD74, CD44, PD-L1, and PD-L2 is assessed by flow cytometry. pERK1/2, MIF, and total CD74 is analyzed by Western blot. Single cell RNA-seq (scRNA-seq) is performed on representative mice from each group.
- scRNA-seq Single cell RNA-seq
- Cyclic multiplexed Immunofluorescence exploits in situ hybridization of complementary oligonucleotides for labeling and to facilitate signal removal for sequential rounds of tagging and imaging. CycIF is therefore able to visualize endogenous protein expression while maintaining spatial context in situ. This can allow for imaging of >20 unique epitopes simultaneously (see Table 1 for targets). Table 1.
- scRNA-seq profiling assigns high-resolution molecular identities by generating high-confidence gene expression levels. Each single cell is also assessed for 32 proteins by epitope (Table 1), matching them to canonical immune classes.
- BD Rhapsody single cell platform is used, followed by standard Illumina sequencing. The BD Rhapsody pipeline is used for initial quality control and filtering, batch correction, read alignment, and to generate gene and protein epitope count matrices. Seurat R bioinformatics package is used for more detailed analyses including clustering/identification of subpopulations.
- Single cell preparation Tumor tissues are dissociated with collagenase IV and hyaluronidase for one hour.
- the resulting cells are stained with anti-CD45 antibody and a cocktail of AbSeq antibodies (BD AbSeq; BD Bioscience, Table 1). Cells are stained with 7-AAD viability marker and sorted for CD45+ and tumor fractions. ⁇ 10,000 total cells are then be loaded from each flow sorted sample onto a BD Rhapsody Cartridge for single cell capture: 5000 CD45+ immune cells and 5000 tumor cells.
- cDNA library preparation and sequencing The BD Rhapsody System is used for single-cell capture and cDNA preparation and amplification.
- Final pooled libraries Applicant’s Ref.: 3232-2 are sequenced (100 bp paired-end) on a NovaSeq 6000 sequencer to a sequencing depth of 100,000 reads per cell for the WTA mRNA library and 32,000 reads per cell for the AbSeq library (1000 reads per cell per antibody with 32 antibodies).
- Data Analysis and QC The raw single cell RNA-seq FASTQ files are processed following the BD Biosciences Rhapsody pipeline where reads are aligned to a reference genome using Bowtie2, and gene and protein epitope count matrices are generated. The distribution-based error correction (DBEC)-adjusted molecule counts are used for all analyses using the R package Seurat 3.0.
- DBEC distribution-based error correction
- Expression matrices are log- normalized. Uniform Manifold Approximation and Projection (UMAP) are used for dimensionality reduction. A negative binomial generalized linear model is implemented using the Seurat R package sc transform. Detection of transcriptional markers: Once immune populations are determined, differential gene expression (DE) is performed for subpopulations applied to average gene expression value, appropriately weighted for number of cells, using R package Seurat. Genes that are co-regulated are identified by building gene co-expression networks based on the Mutual Information (MI) criteria.
- MI Mutual Information
- Example 5 Materials and Methods for Assessment of CD74 as a Therapeutic Target in Triple- Negative Breast Cancer Mice: C57BL/6, CD74 -/- , Vert-x, CD23-cre x CD74-flox, CD11c x CD74-flox mice were used in this study. Vert-x mice were provided by C. Mauri, UCL. All animals were used at 6-8 weeks of age. In the breast cancer model, only females were used, and the groups were age and sex-matched in each experiment. All animal procedures were approved by the Animal Research Committee at the Weizmann Institute of Science.
- Cre-CD23 x flox-CD74 mice were crossed, and screened by PCR for CD74 and CD23 genotypes.
- Cre-CD11c x flox-CD74 mice were crossed, and screened for CD74 and CD11c genotypes by PCR.
- Applicant’s Ref.: 3232-2 Breast cancer induction: E0771 cell-line cells were grown in a complete RPMI medium with 10% fetal bovine serum. For tumor models, 5*10 5 cells in PBS were injected s.c.
- Tumor tissues were harvested 21 days following tumor implantation, cut into small pieces, and incubated in digestion buffer (1mg/ml collagenase A, 0.15mg/ml Hyaluronidase, 10% FBS, 1% P/S) for 45 minutes in a 37°C incubator with gentle shaking. Tumor tissue was then passed through a 100 ⁇ m cell strainer and washed 3 times with PBS. Dissociated tumors were then suspended in 8ml 44% Percoll solution and loaded onto 5ml 67% Percoll cushions. Samples were centrifuged for 20 minutes at 1000 RCF with no brake at room temperature.
- B cell isolation from spleen and bone-marrow Murine spleens were dissected post-mortem and collected in PBS. Organs were processed through a 100- ⁇ m-cell strainer, and treated with Red Blood Lysis buffer to lyse erythrocytes for 5 minutes. Next, cells were washed with PBS, and processed through a 40- ⁇ m-cell strainer. Finally, B cells were purified by positive B cell selection with B220 magnetic beads.
- Immune cell isolation from spleen Murine spleens were dissected post-mortem and collected in PBS.
- B cells were processed through a 100- ⁇ m-cell strainer, and treated with Red Blood Lysis buffer for 3 minutes. Cells were then washed with PBS and processed through a 40- ⁇ m-cell strainer. Regulatory B cell activation: For detection of IL-10 on B cells, B cells at 2.5 ⁇ 10 6 cells/ml in complete ISCOVE medium were cultured for 5 hours with PMA (100 ng/ml), Ionomycin (1 ⁇ g/ml), Monensin (1 ⁇ g/ml), and LPS (10 ⁇ g/ml).
- DC cells at 2.5 ⁇ 10 6 cells/ml in complete ISCOVE's medium were cultured for 5 hours with PMA (100 ng/ml), Ionomycin (1 ⁇ g/ml), Monensin (1 ⁇ g/ml), and LPS (10 ⁇ g/ml).
- Co-cultures E0771 cancer cells were seeded in 12-well plates. The next day, B cells were purified from splenocytes by positive B cell selection with B220 magnetic beads.
- B cells were then cultured either alone, or co-cultured in 12 well plates in complete ISCOVE's medium with 10% FBS for 24 hours at ratios of 1:5 of B cells/ E0771 cells.
- DC were purified from splenocytes by positive Mojosort mouse Pan Dendritic cell isolation kit and added to the E0771, or cultured alone in 12 well plates with 10% FBS complete RPMI medium for 24 hours at a ratio of 1:3. The total number of cells in each well was 2.5*10 6 under all conditions. For the last 5 hours of culture, cells were activated PMA, Ionomycin, Monensin and LPS.
- Flow cytometry staining FACS analysis was performed using FACS Canto.
- FACS data analysis was performed using FlowJo software.
- CD74 blocking with DRQ-2 in-vivo Blocking of CD74 in vivo was performed using DRQ and 20mM TRIS buffer, pH8.5 in saline as a control. Treatment with DRQ or PBS was started at day 10 after tumor cell administration and continued for 5 consecutive days. The inhibitor or control were injected into the tail vein (100 ⁇ g/100 ⁇ l per mouse).
- CD74 blocking with LN-2 antibody in-vitro B cells were treated with LN-2 blocking antibody or IgG isotype control (150 ⁇ g/ml) for 24 hours. The total number of cells in each well was 5*10 6 under all conditions.
- MIF activation Cultures of 5x10 6 cells were activated with 150ng/ml of MIF activator in 1 ml medium in a 24 well plate for 24h.
- In vitro DC suppression assay DCs were isolated from the spleen of WT and CD74 -/- mice through the positive Mojosort mouse pan dendritic cell isolation kit. Applicant’s Ref.: 3232-2 Isolated DCs were cocultured for 24h with E0771 cancer cells at a 1:3 ratio.
- Splenic CD3 + T cells were isolated using the CD3 + mouse positive selection kit. T cells were labeled with Carboxy Fluorescein Succinimidyl Ester (CFSE) and seeded at ratios of 1:1 with DCs, in the presence of anti-CD3 coupled beads for 72h. Cells were then collected, and T cells analyzed for proliferation by FACS. SP1 blocking in-vitro: E0771 cancer cells were seeded in 12-well plates. The next day, DCs were purified from splenocytes and then co-cultured with the tumor cells, at an E0771/ DC cell ratio of 1:3.
- CFSE Carboxy Fluorescein Succinimidyl Ester
- IL-1 ⁇ activation in-vitro E0771 cancer cells were seeded in 12-well plates. The next day, DCs were purified from splenocytes and then co-cultured with the cancer cells, at an E0771/ DC cell ratio of 1:3. Cells were cultured in complete RPMI medium + 10% FBS, in the presence of 20 nM of IL-1 ⁇ recombinant antibody or PBS as negative control for 48 hours. Total number of cells in each well was 2.5*10 6 under all conditions.
- RNA extraction for high throughput experiments and RNA-sequencing Tumor infiltrating DCs were sorted from dissociated TME. mRNA was extracted from these cells using the Dynabead mRNA purification kit, and Illumina libraries were constructed from total mRNA using the bulk adaptation of the MARS-Seq protocol [61] for Illumina TruSeq RNA Sample Preparation v2 (Cat. no.RS-122–2002, Illumina) according to the manufacturer’s instructions. Indexed samples were sequenced in an Illumina NextSeq High output HiSEq 2500 machine in single-read mode.
- TopHat (v2.0.10) was used to align the reads to the Mus_musculus genome (GRCm39) and human genome (hg19).
- Counting reads based on annotations downloaded from Ensembl (release 106) on hg19 RefSeq genes was done with HTSeq- count (version 0.11.2) (v0.6.1p1).
- Differentially expressed genes were identified using DESeq2 with the betaPrior, cooksCutoff, and independent filtering parameters set to False.
- Raw P values were adjusted for multiple testing using the procedure of Benjamini Applicant’s Ref.: 3232-2 and Hochberg.
- RNA extraction and cDNA synthesis for RT-qPCR Total RNA was isolated from cells using the TRI Reagent® RNA Isolation Reagent, according to the manufacturer's instructions. For cDNA synthesis, 500 ng or 1 ⁇ g mRNA was used with the qScriptTM cDNA Synthesis Kit, according to the manufacturer’s instructions.
- qRT-PCR qRT-PCR was performed on the Lightcycler 480.
- siRNA transfection siRNA was introduced by electroporation using a Nepagene (Ichikawa, Chiba, Japan) Super Electroporator NEPA21 Type II, using 2 mm gap cuvettes, with 20 ⁇ g of siRNA at 225mv, 5msec in 100 ⁇ l of OptiMem medium. After the transfection, the cells were resuspended in RPMI 1% FCS medium, and incubated for 24 hours.
- ChIP qPCR ChIP-seq was performed as previously described [20]. For each sample, 5 ⁇ 10 5 tumor-infiltrating DC cells were sorted and activated with rmMIF or with vehicle for 1 h, then cross-linked with DSG (disuccinimidyl glutarate) and fixed. Chromatin was immunoprecipitated with anti CD74 or anti-SP1 antibodies and ChIP- DNA was processed. The samples were analyzed by qPCR for SP1 or IL-1 ⁇ promotor.
- Statistical analysis Data analysis was performed using Graphpad Prism (Version 7.0 f, GraphPad Software, Inc., La Jolla, CA, USA). For most experiments, the mean is provided together with SEM or SD.
- CD74 Regulates Tumor Load by the Control of Immune-suppressive Populations in the TNBC Murine Model
- E0771 murine TNBC cells were orthotopically injected into C57BL/6 or CD74 deficient (CD74 -/- ) mice.
- Figs 7A-7C Tumor size was monitored every 5 days from the day of injection, and mice were sacrificed on day 21. As shown in Figs 7A-7C, the absence of CD74 significantly reduced tumor development and growth. Next, the expression of CD74 on cells in the TME were analyzed. CD74 was widely expressed on immune cells, but its expression was upregulated on the tolerogenic populations of DCs and B cells (Fig.15A). Furthermore, CD74 expression on tumor- infiltrating B cells and DCs was significantly higher compared to its levels on the peripheral splenic populations (Figs.15B-15C), suggesting a role for CD74 in the TNBC microenvironment. Next, the role of CD74 in cells derived from the tumor microenvironment were determined.
- TNBC cells reprogram their microenvironment towards an immunosuppressive phenotype by inducing the secretion of IL-10 in the various immune cell populations [5]. Therefore, the antigen-presenting cells (APCs) and T cells in the TME derived from WT and CD74-deficient mice were analyzed. DCs positively or negatively regulate the anti-tumor immune response according to the cytokines released and the expression of costimulatory molecules able to bind their T cell counterparts in order to induce their priming [36]. Thus, DCs in the tumor microenvironment in WT and CD74-deficient mice were analyzed for their numbers and functionality by FACS analysis. As shown in Fig 7D, a significantly higher percentage of CD74 deficient DCs were observed in the TME.
- mice were intravenously treated for 5 consecutive days (10- 14), with either a partial MHC class II construct, which inhibits ligand binding to CD74 (DRQ) [38] or vehicle (saline) control.
- Blocking CD74 reduced tumor growth and tumor volume (Figs.7J-7K).
- Analysis of immune cells in the TME showed that this treatment elevated the percentage of immunogenic DC, resulting in a downregulation of tolerogenic IL-10 + DC cells (tol-DCs; Fig 7L; Fig.18B) and upregulation of the IL-12 expressing DC (Fig.7M) in the TME.
- MIF induced a modest expansion of IL-10 positive tol-DCs (Fig.8C) and Bregs (Fig. 8D). Since cancerous cells endogenously produce and release MIF, it was directly determined whether MIF derived from the malignant cells regulates immunosuppressive cell expansion. To this end, MIF expression in the E0771 cells was knocked down by MIF siRNA (Fig.8E). Cancer cells expressing low or high levels of MIF were then cultured with DC or B cells, and their phenotype was analyzed. Downregulation of MIF expression resulted in a significantly reduced expansion of tol-DCs (Fig.8F) and B-regs (Fig.8G).
- Example 8 The Effect of CD74 on Tumor Growth is Intrinsic to Dendritic Cells
- B or DCs antigen-presenting cells
- CD74 was exclusively downregulated in mature B cells and DCs using conditionally CD74 -/- Cre-flox mice (cKO).
- WT mice lacking CD74 uniquely in CD23 + mature B cells and mice lacking CD74 in the CD11c + dendritic cell population were injected with E0771 tumor cells, tumor size was monitored weekly, and mice were sacrificed on day 21.
- CD74 expression was downregulated in CD11C+ cells.
- the specificity of CD74 deletion to DCs was first validated by analyzing the accumulation of CD11c expressing population and their CD74 expression (Figs. 19A-19H), and by evaluating the effect of the cKO on the T cell population (Figs.19I- 19O) in the na ⁇ ve mice.
- the downregulation of CD74 expression was specific to the DC population (Fig.19H and gating strategy in Figs.20A-20K).
- deficiency of CD74 in DCs remarkably reduced tumor growth.
- Mice deficient in CD74 in the CD11c population developed significantly smaller tumors compared to their size in WT mice (Figs.10A- 10C).
- DCs lacking CD74 in the TME displayed a decrease in their IL-10 levels (Fig. 10D, Fig.22B), demonstrating a direct role for CD74 in the regulation of the tolerogenic DC phenotype.
- mice showed a reduced accumulation of IL-10 + monocytes and macrophages and no difference in their IL-12 release, (Figs. 21A-21D) Bregs (Fig.10E, Fig.22A) and T-regs (Fig.10F, Fig.22D) and an increase of CD8 + T cells in the TME (Fig.10G, Fig.22E) characterized by a more cytotoxic and a less exhausted phenotype (Figs.10H-10I, Figs.22F-22G). No differences were detected in the frequency of CD4 + T cells (Fig.22C) and in the frequency of CD8+ CD103+or CD8+ CD62L+ cells (Figs.22H-22I).
- WT, CD74 deficient DCs and B cells were cultured together in vitro in the presence of E0771 cells.
- CD74 deficiency in both cell types reduced the expansion of tol-DCs (Fig. 11A) and Bregs (Fig.11B) in a synergistic manner.
- DCs lacking CD74 reduced not only the expansion of the tol-DCs (Fig.11A) but of the Bregs as well (Fig.
- CD74 inhibition did not regulate the expansion of tol-DC (Fig.11D).
- Fig.11D To further confirm the immunosuppressive role of CD74 in DC activity, their function in T cell proliferation and suppression was analyzed.
- WT naive splenic CD3 + T cells were stained with the Cell Proliferation Dye (CPD), and then co-cultured with WT or CD74 KO splenic DCs, previously activated with E0771 cells. Downregulation of CPD expression in T cells correlates with the proportion of cells that undergo division. Induced CD8 + T cell proliferation was detected in the cells incubated with CD74 KO DCs (Fig.11E).
- CPD Cell Proliferation Dye
- CD74 Binds the IL-1 ⁇ and SP1 Promotors, which in turn Regulate tol-DCs and Breg Expansion
- TNBC cells were injected to the mice. Starting from day 10, mice were intravenously treated for 5 consecutive days (10-14), with either PBS or DRQ. DCs were sorted from the TME and purified RNA was then analyzed by RNA-seq.
- IL-1 ⁇ is responsible for the activation of a pro-inflammatory pathway.
- TME tumor necrosis factor
- DCs expressing IL-1 ⁇ are more immunogenic and reduce the expansion of immune- suppressive cells [46].
- WT DCs were cultured in presence of E0771 cells and incubated with either IL-1 ⁇ or PBS.
- IL-1 ⁇ inhibited IL-10 + DC expansion (Fig.13A).
- IL-1 ⁇ -stimulated DCs regulate Breg expansion B cells were cultured together with the DCs previously activated with E0771 and treated with either IL-1 ⁇ or vehicle. As shown in Fig.13B, IL-1 ⁇ treatment of DCs, diminished Breg expansion, confirming that IL-1 ⁇ treatment rendered DCs more immunogenic, and consequently less capable of inducing Bregs. Thus, DCs have a direct effect on Breg expansion, a process that is attenuated by IL-1 ⁇ release. Furthermore, to assess whether B cells are directly affected by IL-1 ⁇ , B cells were cultured in the presence of E0771, and treated with either IL-1 ⁇ or vehicle.
- IL-1 ⁇ only slightly reduced Breg expansion.
- DCs were added to the B cell culture with E0771 cells.
- the presence of DCs together with B cells strongly upregulated IL-10 release, suggesting that DCs powerfully control the Breg expansion in the presence of cancer cells, and that IL-1 ⁇ plays a key role in reducing IL-10 release (Fig.13C).
- CD74-ICD is a regulator of transcription in health and disease [20, 47].
- MIT treatment abrogated IL-10 + DC expansion, suggesting a direct correlation between SP1 and IL-10 release (Fig.14A).
- B cells were cultured together with DCs previously activated with E0771, and treated with either MIT or DMSO control (Fig.14B).
- MIT-treated DCs negatively affected Breg expansion, indicating that DCs control the Breg expansion, a process that is augmented by SP1.
- MIT-treated DCs were cultured in presence of E0771 and treated with either MIT or DMSO. Blocking SP1 on B cells alone did not Applicant’s Ref.: 3232-2 affect Breg expansion.
- Invariant Chain Induces B Cell Maturation by Activating TAFII105-NF-kB Dependent Transcription Program. J Biol Chem.2001;276:27203-6. 15. Matza D, Kerem A, Lantner F, Shachar I. Invariant chain induced B cell differentiation requires intramembrane - proteolytic release of the cytosolic domain. Immunity.2002;17:549-60. 16. Becker-Herman S, Arie G, Medvedovsky H, Kerem A, Shachar I. CD74 is a member of the regulated intramembrane proteolysis (RIP) processed protein family. Mol Biol Cell.2005;16:5061-9. 17.
- Macrophage migration inhibitory factor induces B cell survival by activation of a CD74/CD44 receptor complex. J Biol Chem.2008;283:2784-92. PubMed PMID: 18056708.
- 21. Meyer-Siegler K Hudson PB. Enhanced expression of macrophage migration inhibitory factor in prostatic adenocarcinoma metastases.
- LN-2 (CD74). A marker to distinguish atypical fibroxanthoma from malignant fibrous histiocytoma. Cancer.1997;79:2115-24.
- Narni F Kudo J, Mars W, Calabretta B, Florine DL, Barlogie B, et al. HLA-DR- associated invariant chain is highly expressed in chronic lymphocytic leukemia. Blood. 1986;68:372-7.
- Veenstra H Jacobs P, Dowdle EB. Abnormal association between invariant chain and HLA class II alpha and beta chains in chronic lymphocytic leukemia. Cell Immunol.1996;171:68-73.
- Hasby EA Khalifa RA.
- PubMed PMID 17686984.
- Bucala R Shachar I. The integral role of CD74 in antigen presentation, MIF signal transduction, and B cell survival and homeostasis. Mini Rev Med Chem. 2014;14(14):1132-8. PubMed PMID: 25643611.
- PPARgamma peroxisome proliferator-activated receptor gamma
- VDR vitamin D receptor
- PPARgamma binds to VDR and inhibits 1alpha,25-dihydroxyvitamin D3 mediated transactivation.
- the interaction between the soluble programmed death ligand-1 (sPD-L1) and PD-1(+) regulator B cells mediates immunosuppression in triple-negative breast cancer.
Landscapes
- Health & Medical Sciences (AREA)
- Life Sciences & Earth Sciences (AREA)
- Animal Behavior & Ethology (AREA)
- General Health & Medical Sciences (AREA)
- Veterinary Medicine (AREA)
- Medicinal Chemistry (AREA)
- Public Health (AREA)
- Chemical & Material Sciences (AREA)
- Pharmacology & Pharmacy (AREA)
- Mycology (AREA)
- Rheumatology (AREA)
- Epidemiology (AREA)
- Microbiology (AREA)
- Immunology (AREA)
- Chemical Kinetics & Catalysis (AREA)
- General Chemical & Material Sciences (AREA)
- Nuclear Medicine, Radiotherapy & Molecular Imaging (AREA)
- Organic Chemistry (AREA)
- Medicines Containing Material From Animals Or Micro-Organisms (AREA)
- Medicines That Contain Protein Lipid Enzymes And Other Medicines (AREA)
- Peptides Or Proteins (AREA)
Abstract
Description
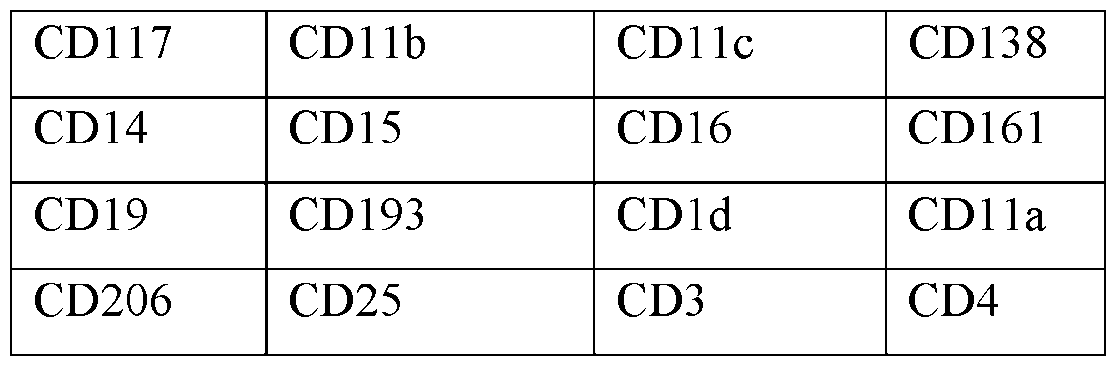


Claims
Priority Applications (3)
| Application Number | Priority Date | Filing Date | Title |
|---|---|---|---|
| AU2024280850A AU2024280850A1 (en) | 2023-05-26 | 2024-05-24 | Treatment of cancer with drq polypeptides |
| EP24816247.1A EP4719466A1 (en) | 2023-05-26 | 2024-05-24 | Treatment of cancer with drq polypeptides |
| JP2025568790A JP2026518270A (en) | 2023-05-26 | 2024-05-24 | Cancer treatment using DRQ polypeptide |
Applications Claiming Priority (2)
| Application Number | Priority Date | Filing Date | Title |
|---|---|---|---|
| US202363469261P | 2023-05-26 | 2023-05-26 | |
| US63/469,261 | 2023-05-26 |
Publications (1)
| Publication Number | Publication Date |
|---|---|
| WO2024249366A1 true WO2024249366A1 (en) | 2024-12-05 |
Family
ID=93658408
Family Applications (1)
| Application Number | Title | Priority Date | Filing Date |
|---|---|---|---|
| PCT/US2024/031149 Ceased WO2024249366A1 (en) | 2023-05-26 | 2024-05-24 | Treatment of cancer with drq polypeptides |
Country Status (4)
| Country | Link |
|---|---|
| EP (1) | EP4719466A1 (en) |
| JP (1) | JP2026518270A (en) |
| AU (1) | AU2024280850A1 (en) |
| WO (1) | WO2024249366A1 (en) |
Citations (3)
| Publication number | Priority date | Publication date | Assignee | Title |
|---|---|---|---|---|
| US20030166898A1 (en) * | 1997-01-30 | 2003-09-04 | Human Genome Sciences, Inc. | Myelin oligodendrocyte glycoprotein-like protein (MOGp) |
| US20190076399A1 (en) * | 2016-03-16 | 2019-03-14 | The Regents Of The University Of California | Detection and treatment of anti-pd-1 therapy resistant metastatic melanomas |
| US20210380660A1 (en) * | 2018-10-05 | 2021-12-09 | Oregon Health & Science University | RECOMBINANT POLYPEPTIDES COMPRISING MODIFIED MHC CLASS II DRa1 DOMAINS AND METHODS OF USE |
-
2024
- 2024-05-24 AU AU2024280850A patent/AU2024280850A1/en active Pending
- 2024-05-24 WO PCT/US2024/031149 patent/WO2024249366A1/en not_active Ceased
- 2024-05-24 JP JP2025568790A patent/JP2026518270A/en active Pending
- 2024-05-24 EP EP24816247.1A patent/EP4719466A1/en active Pending
Patent Citations (3)
| Publication number | Priority date | Publication date | Assignee | Title |
|---|---|---|---|---|
| US20030166898A1 (en) * | 1997-01-30 | 2003-09-04 | Human Genome Sciences, Inc. | Myelin oligodendrocyte glycoprotein-like protein (MOGp) |
| US20190076399A1 (en) * | 2016-03-16 | 2019-03-14 | The Regents Of The University Of California | Detection and treatment of anti-pd-1 therapy resistant metastatic melanomas |
| US20210380660A1 (en) * | 2018-10-05 | 2021-12-09 | Oregon Health & Science University | RECOMBINANT POLYPEPTIDES COMPRISING MODIFIED MHC CLASS II DRa1 DOMAINS AND METHODS OF USE |
Non-Patent Citations (1)
| Title |
|---|
| WENIGER ET AL.: "Molecular biology of Hodgkin lymphoma", LEUKEMIA, vol. 35, 8 March 2021 (2021-03-08), pages 968 - 981, XP037416989, DOI: 10.1038/s41375-021-01204-6 * |
Also Published As
| Publication number | Publication date |
|---|---|
| AU2024280850A9 (en) | 2026-01-08 |
| EP4719466A1 (en) | 2026-04-08 |
| AU2024280850A1 (en) | 2025-12-04 |
| JP2026518270A (en) | 2026-06-04 |
Similar Documents
| Publication | Publication Date | Title |
|---|---|---|
| US20250186503A1 (en) | Methods and combinations for treatment and t cell modulation | |
| EP3362074B1 (en) | Regulatory t cell pd-1 modulation for regulating t cell effector immune responses | |
| US20210396739A1 (en) | Biomarkers for evaluating car-t cells to predict clinical outcome | |
| US20220249663A1 (en) | Methods and compositions for cancer treatment and treatment selection | |
| JP7760374B2 (en) | Ex vivo methods for generating T cell therapeutics and related compositions and methods | |
| EP3718556A2 (en) | Target peptides for immunotherapy and diagnostics | |
| JP7404418B6 (en) | Methods for promoting T cell responses | |
| AU2018243020A1 (en) | Medicinal composition for treating cancer | |
| US20230192886A1 (en) | Adoptive cell therapy combination treatment and compositions thereof | |
| JP2020523018A (en) | Use of CD39 and CD103 for identification of tumor-reactive human T cells for treatment of cancer | |
| EP3697819B1 (en) | Treatment of ovarian cancer with anti-cd47 and anti-pd-l1 | |
| CN114269371A (en) | Combination therapy of cell-mediated cytotoxicity with inhibitors of pro-survival BCL2 family proteins | |
| WO2015034519A1 (en) | Target peptides for immunotherapy and diagnostics | |
| JP2026500232A (en) | Compositions and methods for producing T cells | |
| JP2023500567A (en) | Immunogenic EGFR peptide compositions and their use in treating cancer | |
| Zhu et al. | Targeted inhibition of Nrf2 potentiates antitumor immunity and enhances the efficacy of immunotherapy in hepatocellular carcinoma | |
| EP4281469A1 (en) | T cells for use in therapy | |
| AU2024280850A9 (en) | Treatment of cancer with drq polypeptides | |
| WO2020163692A1 (en) | Treatment of cutaneous t cell lymphoma with targeting of cd47 pathway | |
| US20260108547A1 (en) | Leveraging l-fucose-mediated signaling to induce monocyte-derived dendritic cell polarization | |
| JP2025526566A (en) | Novel antigens for cancer and their uses | |
| WO2025207498A1 (en) | Compositions of kinase inhibitors and methods of using the same for chimeric antigen receptor therapy | |
| JP2025540617A (en) | Peptides and combinations thereof for use in immunotherapy against acute myeloid leukemia (AML) and other hematological malignancies - Patent Application 20070122999 | |
| WO2025034996A1 (en) | Engineered t cells with nk cell receptors & uses thereof | |
| BR122023022573A2 (en) | ISOLATED NUCLEIC ACID MOLECULES, BCMA CHIMERIC ANTIGEN RECEPTORS AND USES THEREOF, ISOLATED POLYPEPTIDE MOLECULES, ANTI-BCMA BINDING DOMAINS, VECTORS, CELLS AND METHODS OF PRODUCING THE SAME |
Legal Events
| Date | Code | Title | Description |
|---|---|---|---|
| 121 | Ep: the epo has been informed by wipo that ep was designated in this application |
Ref document number: 24816247 Country of ref document: EP Kind code of ref document: A1 |
|
| WWE | Wipo information: entry into national phase |
Ref document number: AU2024280850 Country of ref document: AU |
|
| ENP | Entry into the national phase |
Ref document number: 2025568790 Country of ref document: JP Kind code of ref document: A |
|
| WWE | Wipo information: entry into national phase |
Ref document number: 2025568790 Country of ref document: JP |
|
| ENP | Entry into the national phase |
Ref document number: 2024280850 Country of ref document: AU Date of ref document: 20240524 Kind code of ref document: A |
|
| NENP | Non-entry into the national phase |
Ref country code: DE |
|
| WWE | Wipo information: entry into national phase |
Ref document number: 2024816247 Country of ref document: EP |
|
| ENP | Entry into the national phase |
Ref document number: 2024816247 Country of ref document: EP Effective date: 20260102 |
|
| ENP | Entry into the national phase |
Ref document number: 2024816247 Country of ref document: EP Effective date: 20260102 |
|
| ENP | Entry into the national phase |
Ref document number: 2024816247 Country of ref document: EP Effective date: 20260102 |
|
| ENP | Entry into the national phase |
Ref document number: 2024816247 Country of ref document: EP Effective date: 20260102 |
|
| ENP | Entry into the national phase |
Ref document number: 2024816247 Country of ref document: EP Effective date: 20260102 |
|
| ENP | Entry into the national phase |
Ref document number: 2024816247 Country of ref document: EP Effective date: 20260102 |
|
| WWP | Wipo information: published in national office |
Ref document number: 2024816247 Country of ref document: EP |