WO2024228397A1 - 皮膚内部計測装置 - Google Patents
皮膚内部計測装置 Download PDFInfo
- Publication number
- WO2024228397A1 WO2024228397A1 PCT/JP2024/016863 JP2024016863W WO2024228397A1 WO 2024228397 A1 WO2024228397 A1 WO 2024228397A1 JP 2024016863 W JP2024016863 W JP 2024016863W WO 2024228397 A1 WO2024228397 A1 WO 2024228397A1
- Authority
- WO
- WIPO (PCT)
- Prior art keywords
- concentration
- skin
- current
- layer
- electrodes
- Prior art date
- Legal status (The legal status is an assumption and is not a legal conclusion. Google has not performed a legal analysis and makes no representation as to the accuracy of the status listed.)
- Ceased
Links
Images















Classifications
-
- A—HUMAN NECESSITIES
- A61—MEDICAL OR VETERINARY SCIENCE; HYGIENE
- A61B—DIAGNOSIS; SURGERY; IDENTIFICATION
- A61B5/00—Measuring for diagnostic purposes; Identification of persons
-
- A—HUMAN NECESSITIES
- A61—MEDICAL OR VETERINARY SCIENCE; HYGIENE
- A61B—DIAGNOSIS; SURGERY; IDENTIFICATION
- A61B5/00—Measuring for diagnostic purposes; Identification of persons
- A61B5/05—Detecting, measuring or recording for diagnosis by means of electric currents or magnetic fields; Measuring using microwaves or radio waves
- A61B5/053—Measuring electrical impedance or conductance of a portion of the body
- A61B5/0531—Measuring skin impedance
-
- G—PHYSICS
- G01—MEASURING; TESTING
- G01N—INVESTIGATING OR ANALYSING MATERIALS BY DETERMINING THEIR CHEMICAL OR PHYSICAL PROPERTIES
- G01N27/00—Investigating or analysing materials by the use of electric, electrochemical, or magnetic means
- G01N27/02—Investigating or analysing materials by the use of electric, electrochemical, or magnetic means by investigating impedance
Definitions
- the present invention relates to an internal skin measurement device.
- This application claims priority based on Japanese Patent Application No. 2023-076258, filed on May 2, 2023, the contents of which are incorporated herein by reference.
- the skin is composed of three layers: the epidermis, which is about 0.12 to 0.2 mm thick; the dermis, which is about 1.8 mm thick; and subcutaneous tissue (adipose tissue).
- the epidermis which is about 0.12 to 0.2 mm thick
- the dermis which is about 1.8 mm thick
- subcutaneous tissue asdipose tissue.
- sensors and other devices that are as simple and minimally invasive as possible, such as flat sensors that can be simply attached to the surface of the skin, to visualize the distribution of electrolyte and blood protein concentrations in specific layers of the skin.
- hypothyroidism caused by stress or other factors leads to an imbalance between hyaluronic acid and hyaluronidase (an enzyme that breaks down hyaluronic acid), resulting in excess hyaluronic acid in the dermis layer and causing edema, creating a demand for technology to measure the condition inside the skin.
- hyaluronic acid an enzyme that breaks down hyaluronic acid
- hyaluronidase an enzyme that breaks down hyaluronic acid
- necrosis In addition, in the medical field, skin flap surgery using vascular anastomosis is performed for skin tissue grafts in cases of severe burns, etc., but necrosis often occurs due to the difficulty of vascular anastomosis. In order to prevent necrosis, there is a demand for technology to measure the distribution of electrolyte concentrations and blood protein concentrations in specific layers of the skin, such as the epidermis, dermis, and subcutaneous tissue.
- Methods for measuring inside the skin include near-infrared cameras, optical coherence tomography, SHG light (second harmonic generation light), and photo-ultrasound, but these technologies are designed to visualize and measure the shape, and are not capable of visualizing and measuring the distribution of electrolyte concentrations or blood protein concentrations within specific layers of the skin.
- Patent Document 1 discloses a method for determining the sodium ion content of the skin using bioimpedance spectroscopy, in which a current is applied to the skin of a subject at a predetermined frequency, the voltage across the skin caused by the current is measured, and the measured voltage is used to determine the resistance across the skin of the subject at the predetermined frequency, and the measured voltage is used to determine the amount of skin sodium ions.
- Patent Document 2 describes a bioelectrical impedance measurement method for measuring bioelectrical impedance related to information inside the organism from electrical signals measured by attaching electrode pads to the surface of the organism in order to simply and accurately measure information on tissue layers in the depth direction just below the surface of the organism (fat layer, muscle layer, bone tissue layer, etc.).
- the present invention proposes the following means.
- the skin internal measurement device is a current/voltage application/measurement unit having a sensor with a plurality of electrodes that can be placed on the skin at intervals; a concentration distribution measuring unit for measuring at least one of an electrolyte concentration distribution and a blood protein concentration distribution in a specific layer inside the skin,
- the concentration distribution measurement unit detects at least one of the following features, which are information about a specific layer inside the skin and are obtained based on the current, potential difference, and/or phase fluctuation amount measured by the current/voltage application measurement unit: (1) A feature based on the variation between the impedance Z1(f) between a distant electrode where the electric field penetrates a specific skin layer and the impedance Z2(f) between a near electrode where the electric field does not penetrate the specific skin layer but penetrates only the upper layer, (2) A feature based on the amount of change in the potential difference and phase between the far and near electrodes when a square wave current is applied, or a feature based on the amount of change in
- Aspect 2 of the present invention is the skin internal measurement device of aspect 1,
- the concentration calculation unit further
- the system may have a calibration curve comparison unit that calculates the concentration of an electrolyte or blood protein, etc. based on (a) a calibration curve of a distribution function based on electrolyte concentration and relaxation time that has been prepared in advance, and a distribution function based on the relaxation time that has been estimated from the feature amount, or (b) a calibration curve of electrolyte concentration and power spectral density drop that has been prepared in advance, and a power spectral density drop that has been estimated from the feature amount.
- Aspect 3 of the present invention is the skin internal measurement device of aspect 2
- the concentration calculation unit may include a calibration curve comparison unit that calculates the concentration of an electrolyte, blood protein, or the like based on a calibration curve of a distribution function based on an electrolyte concentration and a relaxation time that is created in advance, and a distribution function based on the relaxation time that is estimated from the feature amount.
- Aspect 4 of the present invention is the skin internal measurement device of aspect 2,
- the concentration calculation unit may include a calibration curve comparison unit that calculates the concentration of an electrolyte, blood protein, or the like based on a calibration curve of electrolyte concentration and power spectral density drop that is created in advance and the power spectral density drop that is estimated from the feature amount.
- Aspect 5 of the present invention is the skin internal measurement device of aspect 1,
- the concentration distribution measuring unit includes: a skin specific layer separation unit that performs a predetermined process on the current or potential difference measured by the current/voltage application measurement unit based on a threshold value of the inter-electrode distance;
- the electric property distribution calculation unit may calculate at least one of a conductivity distribution, a permittivity distribution, and a phase distribution based on the current or the potential difference after the predetermined processing.
- a feature quantity carrying information on a specific layer inside the skin obtained based on a current, a potential difference, and/or a phase fluctuation amount measured by a current/voltage application measurement unit having a sensor including a plurality of electrodes arranged on the skin at intervals from each other, the feature quantity being at least one of the following: (1) A feature based on the variation between the impedance Z1(f) between a distant electrode where the electric field penetrates a specific skin layer and the impedance Z2(f) between a near electrode where the electric field does not penetrate the specific skin layer but penetrates only the upper layer, (2) A feature based on the amount of change in the potential difference and phase between the far and near electrodes when a square wave current is applied, or a feature based on the amount of change in the current and phase between the far and near electrodes when a square wave voltage is applied, or (3) performing
- a seventh aspect of the present invention is the measurement method according to the sixth aspect,
- the calculation using the feature quantity may be based on: (a) a calibration curve of a distribution function based on electrolyte concentration and relaxation time, which is prepared prior to the calculation of the electrolyte or blood protein concentration, and a distribution function based on relaxation time, which is estimated from the feature quantity; or (b) a calibration curve of electrolyte concentration and power spectral density drop, which is prepared prior to the calculation of the electrolyte or blood protein concentration, and a power spectral density drop, which is estimated from the feature quantity.
- the above aspect of the present invention provides an internal skin measurement device that can separate specific layers of the skin based on the measured impedance and grasp the condition inside the skin.
- FIG. 1 is a schematic diagram of an internal skin measuring device according to a first embodiment.
- FIG. FIG. 2 is a schematic diagram of a current/voltage application measuring section in FIG. 1 .
- FIG. 2 shows the configuration of the electrodes and skin when the electrodes are in contact with the skin.
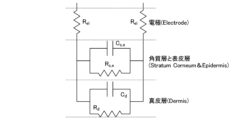
- 4 is an equivalent circuit of the electrodes and skin in FIG. 3.
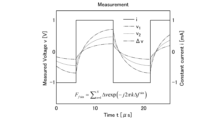
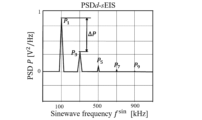
- FIG. 11 is a schematic diagram of an internal skin measuring device according to a second embodiment. 1 shows an example of a square wave applied current i(t), a measured potential difference v1 between the distant electrodes, a measured potential difference v2 between the near electrodes, and a difference ⁇ v between v1 and v2. 1 is an example of a calculated power spectral density (PSD) drop.
- PSD power spectral density
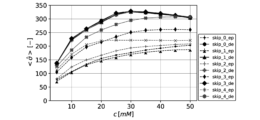
- FIG. 1 is an example of a calibration curve of power spectral density drop ⁇ P obtained by changing the concentration c of an aqueous sodium chloride solution.
- FIG. 13 is a schematic diagram of an internal skin measuring device according to a third embodiment.
- FIG. 14 is a schematic diagram of a current/voltage application measuring section in FIG. 13 . This is the measurement pattern for the four-terminal quasi-adjacent method.
- FIG. 1 is a diagram for explaining processing using spatial voltage threshold (SVT). 1 is an example of an image reconstruction showing sodium ion concentration distribution.
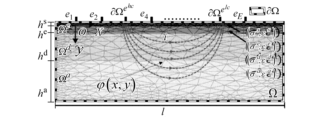
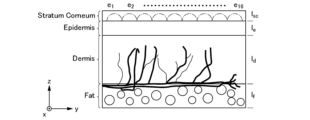
- FIG. 1 is a schematic diagram of each specific layer of the skin used in the electromagnetic simulation.
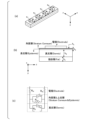
- 1A to 1C are diagrams for explaining the sensor arrangement, skin structure, and skin equivalent circuit used in the electromagnetic simulation of Example 1.
- Example 1 shows the frequency dependence of electrical conductivity ⁇ and relative dielectric constant ⁇ in each specific skin layer used under the electromagnetic simulation conditions of Example 1.
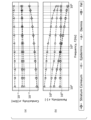
- FIG. 13 is a diagram showing the change in estimated distribution function ⁇ (ln ⁇ ) when the electrode diameter ⁇ and the inter-electrode distance d in Example 1 are changed.
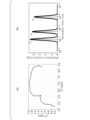
- FIG. 13 is a diagram showing an outline of an experimental apparatus according to a second embodiment. 13 shows a comparison result between the Cole-Cole plot and the equivalent circuit fitting, which are the experimental results of Example 2.
- FIG. 1 shows the calculation results of the skin specific layer separation area in an experiment using the pig skin tissue of Example 2.
- FIG. 13 is a schematic diagram of an internal skin measuring device used in Example 4.
- FIG. 13 is a diagram showing the relationship between the measurement pattern m and the normalized compensation voltage ⁇ v*> when the threshold value d ⁇ in the fourth embodiment is used as a parameter.
- FIG. 13 shows experimental results of a reconstructed image of sodium ion concentration distribution when the threshold value d ⁇ and the concentration of an aqueous sodium chloride solution are used as parameters in Example 4.
- FIG. 13 is a diagram showing the configuration of the electrodes and the skin when the electrodes are in contact with the skin in individual measurement using a skip injection pattern in Example 5.
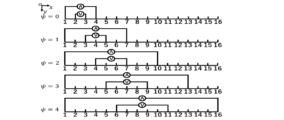
- 13 shows a measurement pattern of the quasi-adjacent method in individual measurement using a skip injection pattern in Example 5.
- 13 is a graph showing the distribution of relaxation time (DRT) analysis of individual measurement data using the skip injection pattern in Example 5.
- 1 is a graph showing the relationship between ⁇ > and the sodium ion concentration in the dermis layer. This is a comparison of the spatially averaged conductivity distribution ⁇ * ⁇ > obtained by electromagnetic simulation and experiment.
- 13 shows the evaluation results of the threshold value d ⁇ by electromagnetic simulation and experiment.
- the skin internal measurement device 100 includes a current/voltage application measurement unit 10 and a concentration distribution measurement unit 50.
- the concentration distribution measurement unit 50 includes a skin specific layer separation unit 51, a distribution function estimation unit 52, a calibration curve comparison unit 53, and an output unit 54.
- the concentration distribution measurement unit 50 of the internal skin measurement device 100 includes, for example, a central processing unit (CPU), a read only memory (ROM), a random access memory (RAM), and a hard disk drive (HDD)/solid state drive (SSD).
- the specific skin layer separation unit 51, the distribution function estimation unit 52, the calibration curve comparison unit 53, and the output unit 54 are realized by the CPU executing a predetermined program.
- the program may be acquired via a recording medium or via a network.
- a dedicated hardware configuration may be used to realize the configuration of the internal skin measurement device 100.
- the concentration distribution measurement units 50A and 50B described later may also have the same configuration as the concentration distribution measurement unit 50. Each unit is described below.
- the current/voltage application measurement unit 10 includes a sensor 20 and a control unit 30.
- the sensor 20 includes a plurality of electrodes 21 (the number of electrodes Q is shown as 4 as an example) that can be placed on the skin at intervals from each other, and a support 25 that holds the electrodes 21.
- the current/voltage application measurement unit 10 has the sensor 20, and applies a predetermined current or potential difference between the electrodes 21 while the electrodes 21 of the sensor 20 are in contact with the skin of the subject, and measures the potential difference or current.
- the potential difference refers to the difference in voltage between two electrodes.
- the potential difference is measured based on a predetermined current application/voltage measurement pattern (a pattern in which two electrodes are selected in sequence from a large number of electrodes, a current is applied, and the potential difference is measured in sequence). At this time, it is desirable to also measure the phase (the time lag between the applied current and the measured potential difference).
- a potential difference the current is measured based on a predetermined voltage application current measurement pattern (a pattern in which two electrodes are selected from a large number of electrodes in sequence, a potential difference is applied, and the current is measured in sequence). At this time, it is preferable to also measure the phase (the time lag between the applied potential difference and the measured current).
- the number Q of the electrodes 21 is, for example, 3 or more.
- the number Q of the electrodes 21 is preferably 8 or more.
- the number Q of the electrodes 21 is preferably 32 or less.
- the number Q of the electrodes 21 may be 16 or less.
- the arrangement position of the electrodes 21 is not particularly limited.
- the electrodes may be arranged linearly, or may be arranged two-dimensionally or three-dimensionally.
- the electrodes 21 are electrically connected to the control unit 30.
- the material or shape of the electrodes 21 there are no particular limitations on the material or shape of the electrodes 21 as long as they can apply a current or potential difference to the skin of the person being measured.
- materials for the electrodes 21 include metals such as Au, Ag, Cu, and stainless steel, conductive polymers, fibers whose surfaces are coated with metals, and fibers whose surfaces are coated with conductive polymers.
- the arrangement of the electrodes 21 may be determined using an electromagnetic simulation based on the size of the electrodes 21 and the distance between the electrodes 21, and using a skin model in a specific skin layer consisting of the stratum corneum, epidermis, and dermis. For example, if the shape of the electrodes in a plane perpendicular to the direction of current application is circular, this is the diameter, but if the shape of the electrodes 21 is rectangular or polygonal, for example, this may be the equivalent circle diameter.
- the size of the electrodes 21 and the distance between the electrodes 21 affect the discrimination of different specific skin layers consisting of the stratum corneum, epidermis (excluding the stratum corneum), dermis, and fat layer. Optimizing the electrode diameter and distance affects the current density only in the specific skin layer of interest, which contains significant distributions of electrolyte and blood protein concentrations.
- the size (circle equivalent diameter) of the electrode 21 is, for example, 0.2 mm to 2.0 mm. More preferably, it is 0.4 mm to 1.2 mm. If the size of the electrode 21 is 0.2 mm to 2.0 mm, the electrolyte concentration and blood protein concentration distribution (e.g., sodium ion concentration distribution) in a specific layer of the skin can be visualized and measured more accurately.
- concentration distribution is used as a term to express one-dimensional space-time, two-dimensional space-time, three-dimensional space-time, four-dimensional space-time (e.g., three-dimensional space and time), etc., and no particular distinction is made between concentration and concentration distribution in terms of terminology.
- the distance between the electrodes 21 is, for example, 0.5 mm to 3.0 mm. More preferably, it is 1.8 mm to 2.6 mm. If the distance between the electrodes 21 is 0.5 mm to 3.0 mm, the electrolyte concentration and blood protein concentration distribution (e.g., sodium ion concentration distribution) in a specific layer of the skin can be visualized and measured more accurately.
- the distance between the electrodes 21 is the center-to-center distance of the electrodes 21.
- the center of the electrodes 21 may be, for example, the center of the smallest encompassing circle that contains the electrodes 21 in a plane perpendicular to the direction of current application.
- the method of electrically connecting the electrode 21 and the control unit 30 is not particularly limited.
- the electrode 21 and the control unit 30 may be connected by a lead wire.
- the support 25 there are no particular limitations on the support 25, so long as it is capable of holding the electrode 21. It is preferable that the support 25 be capable of deforming to conform to the surface shape of the skin of the person being measured. By deforming to conform to the surface shape of the skin, the adhesion between the electrode 21 and the person being measured is improved, and it is possible to more accurately apply a current or potential difference and measure the potential difference or current.
- a preferable material for the support 25 is, for example, a dielectric material such as an elastomer.
- An example of the support 25 is a printed circuit board. There are no particular limitations on the shape of the support 25, but examples include a sheet-like shape and a plate-like shape.
- the control unit 30 includes, for example, a multiplexer for switching between a current application electrode (or a voltage application electrode for applying a potential difference) that applies a current and a voltage measurement electrode (or a current measurement electrode for measuring a current) that measures a potential difference, and an impedance analyzer for performing voltage measurement (or current measurement) and phase measurement.
- the impedance analyzer is a component that changes the applied frequency and amplitude to measure impedance, that is, the ratio of the measured potential difference (applied potential difference) to the applied current (measured current), and its phase.
- the control unit 30 executes a predetermined program in, for example, a CPU, and controls the multiplexer and the impedance analyzer to perform impedance measurement (measurement of the ratio of the potential difference to the current, and its phase).
- the control unit 30 may be controlled only within the current/voltage application measurement unit 10 to perform impedance measurement, or the control unit 30 may be controlled according to a program executed in the concentration distribution measurement unit 50 to perform impedance measurement.
- the result of the impedance measurement is sent to the concentration distribution measurement unit 50.
- the data may be sent from the control unit 30 to the concentration distribution measurement unit 50 via a wire, or may be sent to the concentration distribution measurement unit 50 via other transmission means.
- the control unit 30 applies a current between each electrode 21 and measures the potential difference based on a predetermined current application voltage measurement pattern (a pattern of which electrodes the current is applied between and which electrodes the potential difference is measured between). Alternatively, the control unit 30 applies a potential difference between each electrode 21 and measures the current based on a predetermined voltage application current measurement pattern. The control unit 30 measures the current and phase, or the potential difference and phase, using two or more electrode pairs with different distances between the electrodes in the sensor 20. When applying a current or a potential difference, there is no particular limitation as to which electrodes 21 the current (potential difference) is applied between and between which electrodes the potential difference (current) is measured.
- the number M of current application voltage measurement patterns differs in each current application voltage measurement pattern, and the applied current value and its application frequency are preferably, for example, 1.0 mA or less and AC in the 1 Hz to 1,000 MHz band, taking into account the effect on the living body and the simplicity of the device.
- the concentration distribution measurement unit 50 performs differential processing on the potential difference or current measured by the current/voltage application measurement unit 10 to measure (visualize measurement) at least one of the electrolyte concentration distribution in a specific layer inside the skin and the blood protein concentration distribution.
- electrolytes include sodium ions, potassium ions, magnesium ions, calcium ions, and chloride ions.
- blood proteins include albumin, ⁇ globulin, ⁇ globulin, ⁇ globulin, and fibrinogen.
- the concentration distribution measurement unit 50 includes a specific skin layer separation unit 51, a concentration calculation unit 60, and an output unit 54.
- the concentration calculation unit 60 includes a distribution function estimation unit 52 and a calibration curve comparison unit 53. Each unit is described below.
- the skin specific layer separation unit 51 calculates differential data by performing differential processing on the potential difference and phase or the current and phase measured by the current/voltage application measurement unit 10.
- the distribution function estimation unit 51 performs differential processing of the two measured impedances to calculate the target impedance, which is differential data that is the impedance in a specific layer of the skin.
- the differential data is sent to the distribution function estimation unit 52.
- the specific skin layer is the stratum corneum, the epidermis, the dermis, the adipose tissue layer, etc.
- the two impedance measurements are impedances at different distances between the electrodes 21.
- One is the impedance measured when the center line of the electric field between the electrodes 21 passes through a specific skin layer of interest (a specific target skin layer), and the other is the impedance measured when the center line of the electric field between the electrodes 21 passes through a specific target skin layer of interest (a specific target skin layer).
- the impedance is measured through the specific skin layer excluding the specific skin layer.
- the distance between the electrodes 21 can be appropriately set depending on the specific skin layer of interest.
- FIG. 3 is a diagram showing the configuration of the electrodes and the skin when the electrodes are in contact with each other.
- FIG. 4 is the equivalent circuit of FIG. 3 created by assuming a six-parameter equivalent circuit with the contact resistance of the electrode 21 and the specific skin layer (stratum corneum, epidermis layer (excluding the stratum corneum), dermis layer, and fat layer) as a pair of RC.
- the electric field center line (EFCL) between the electrodes 21 is depicted nonlinearly in a simulated manner.
- the capacitance component of the stratum corneum and the epidermis layer is Cs ,e
- the resistance component of the stratum corneum and the epidermis layer is Rs ,e
- the capacitance component of the dermis layer is Cd
- the resistance component of the dermis layer is Rd .
- the diameter ⁇ of the electrodes 21 and the optimal inter-electrode distance d allow the EFCL to easily pass through the target specific skin layer, so that electrical information of the target specific skin layer can be obtained in more detail.
- Electrical information of the specific skin layer can be obtained by applying a current or voltage between each electrode 21 of the sensor 10, measuring the voltage or current, and calculating the impedance from these values.
- the thickness of each specific layer is represented, for example, by the stratum corneum hs, the epidermis layer (excluding the stratum corneum) he, the dermis layer hd, and the fat layer ha.
- the rightmost electrode of electrodes 1 to 3 (e 1 , e 2 , and e 3 ) is set as a ground electrode.
- a constant current of an AC frequency f is applied to the leftmost electrode and the center electrode, and the potential difference between the leftmost electrode and the ground electrode (between the distant electrodes) and between the center electrode and the ground electrode (between the near electrodes) is measured.
- the target impedance ⁇ Z(f) containing information on the dermis layer is the difference between the impedance Z 1 (f) between the distant electrodes where the EFCL penetrates the dermis layer, and the impedance Z 2 (f) between the near electrodes where the EFCL penetrates only the stratum corneum and epidermis layer.
- This ⁇ Z(f) removes the parasitic components of Z 1 (f) and Z 2 (f), so that the impedance of the specific skin layer can be extracted with high accuracy.
- (f) is a function of the applied frequency.
- the concentration calculation unit 60 uses the target impedance ⁇ Z(f), which is the difference data, to calculate at least one of the conductivity, dielectric constant, and phase that are correlated with the electrolyte concentration and blood protein concentration in the specific layer.
- the concentration calculation unit 60 may include a distribution function estimation unit 52 that estimates a distribution function ⁇ (ln ⁇ ) from the target impedance, and a calibration curve comparison unit that calculates at least one of the electrolyte concentration and blood protein concentration from the estimated distribution function ⁇ (ln ⁇ ) estimated by the distribution function estimation unit 52.
- the distribution function estimation unit 52 estimates the distribution function ⁇ (ln ⁇ ) from the target impedance ⁇ Z(f) which is the difference data.
- the target impedance ⁇ Z(f) may be directly analyzed to estimate the specific applied frequency f (or the relaxation time ⁇ which is the reciprocal of f) which strongly reacts to the electrolyte concentration and blood protein concentration in the specific layer
- the specific applied frequency f (or the relaxation time ⁇ which is the reciprocal of f) which strongly reacts to the electrolyte concentration and blood protein concentration in the specific layer can be easily obtained by estimating using the distribution function ⁇ (ln ⁇ ).
- the method of estimating the distribution function by the distribution function estimation unit 52 will be described below.
- the estimated distribution function is sent to the calibration curve comparison unit 53.
- the impedance Z(f) measured on the skin surface when a constant current of an applied frequency f is applied (superscripts are omitted, but Z(f) corresponds to Z 1 (f) or Z 2 (f) in formula (1)) is expressed by the following formula (2) using the relaxation time ⁇ in the specific layer of the skin, the infinite high frequency resistance R ⁇ , and the distribution function ⁇ (ln ⁇ ).
- j is an imaginary unit
- ln indicates the logarithm of the base e.
- the problem of finding the distribution function ⁇ (ln ⁇ ) when Z(f) is known from this formula (2) is called a mathematical ill-posed inverse problem, and many algorithms have been developed, and known algorithms can be used.
- the impedance used in the above and subsequent formulae may be the impedance equivalent to Z 1 (f) or Z 2 (f) in formula (1), or may be the target impedance ⁇ Z(f). That is, an ill-posed inverse problem may be solved from ⁇ Z(f) to estimate the distribution function ⁇ (ln ⁇ ), or an ill-posed inverse problem may be solved from Z 1 (f) and Z 2 (f) to estimate the distribution functions ⁇ 1 (ln ⁇ ) and ⁇ 2 (ln ⁇ ) corresponding to Z 1 (f) and Z 2 (f), respectively, and then they may be subtracted.
- the distribution function ⁇ (ln ⁇ ) is expressed by the following formula (3) using M (1 ⁇ m ⁇ M) known basis functions gm(ln ⁇ ) and M (1 ⁇ m ⁇ M) unknown fitting parameters ⁇ m.
- the fitting parameters ⁇ m are parameters that adjust the amplitude of the m-th basis function gm and have M elements.
- M which represents the number of fitting parameters and the number of basis functions, is not particularly limited, but is, for example, a number from 10 to 100.
- Estimating the aforementioned distribution function ⁇ (ln ⁇ ) means finding the unknown fitting parameters ⁇ m by solving an ill-posed inverse problem.
- the basis function gm(ln ⁇ ) can be expressed using a radial basis function such as a Gaussian basis function with the relaxation time ⁇ as a function, for example, as shown in the following formula (4).
- ⁇ is a variable
- ln ⁇ m indicates the center value of the m-th Gaussian basis function
- ⁇ 2 indicates the variance value.
- equation (4) When equation (4) is substituted into equation (3) and then substituted into equation (2), the impedance Z(f) of equation (2) is expressed by the following equation (6) from the unknown fitting parameter ⁇ m and the known basis function gm(ln ⁇ ).
- this impedance is decomposed into a real component Zre and an imaginary component Zim
- the real component Zre and the imaginary component Zim are expressed by the following equations (7) and (8).
- a fitting parameter vector ⁇ expressed as a column vector having M elements may be used as shown in the following equation (5), where T in equation (5) indicates transposition.
- the integral of the above real component Z re is represented as A re
- the integral of the imaginary component Z im is represented as A im
- the real component is represented by the following formula (11)
- the imaginary component is represented by the following formula (12).
- ridge regression linear regression with L2 regularization
- ⁇ is a regularization parameter (hyperparameter) ( ⁇ >0).
- and the subscript 2 are L2 norms, the superscript 2 is a square, and 1 ⁇ R F is a column vector with 1 as an element.
- the optimal fitting parameter vector ⁇ * can be found by the following formula (14) using L( ⁇ ).
- the estimated distribution function ⁇ (ln ⁇ ) is obtained by substituting ⁇ * into formula (3).
- the ⁇ above this ⁇ indicates the estimated distribution function obtained by the optimal fitting parameter vector ⁇ * .
- the relaxation times ⁇ on the horizontal axis of the three peaks of this estimated distribution function ⁇ (ln ⁇ ) correspond to the electrolyte concentration and blood protein concentration in each specific layer of the skin, for example, the third peak corresponds strongly to the electrolyte concentration in the dermis layer, and the first peak corresponds strongly to the blood protein concentration in the dermis layer.
- the diameter ⁇ of the electrode 21 and the optimal inter-electrode distance d affect which layer in a specific skin layer is desired to be visualized and measured, and the relaxation time ⁇ of the peak position affects which type of electrolyte concentration and blood protein concentration is desired to be visualized and measured.
- the calibration curve comparison unit 53 calculates at least one of the electrolyte concentration and the blood protein concentration from the estimated distribution function ⁇ (ln ⁇ ) estimated by the distribution function estimation unit 52. Specifically, the content of the target component and the estimated distribution function ⁇ (ln ⁇ ) corresponding to the content of the target component are obtained in advance, and a calibration curve is created. The concentration of the target component (electrolyte, blood protein, etc.) is calculated from the created calibration curve and the estimated distribution function ⁇ (ln ⁇ ) estimated by the distribution function estimation unit 52.
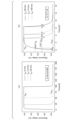
- FIG. 8(a) is an example of a distribution function estimated from the impedance measured by injecting a known aqueous sodium chloride solution with a different concentration c into a dermis layer simulating a living body, and setting the electrodes so that the dermis layer is highly sensitive.
- FIG. 8(b) is a result of enlarging the rightmost peak where a change occurred. In this example, it can be seen that the intensity of the peak decreases when the concentration of the aqueous sodium chloride solution in the dermis layer (the third peak) is increased from 10 mM to 30 mM (theoretically, when sodium ions increase proportionally).
- FIG. 8(b) is an example of a distribution function estimated from the impedance measured by injecting a known aqueous sodium chloride solution with a different concentration c into a dermis layer simulating a living body, and setting the electrodes so that the dermis layer is highly sensitive.
- FIG. 8(b) is a
- FIG. 8(c) shows the result of creating a calibration curve from the peak top value of the estimated distribution function ⁇ in FIG. 8(b) and the known aqueous sodium chloride concentration.
- the electrolyte concentration and blood protein concentration of the specific skin layer can be detected from the estimated distribution function ⁇ , and the concentration distribution of the target component can be obtained.
- the electrolyte concentration and blood protein concentration in the specific skin layer to be obtained differ from the known aqueous solution concentration when the degree of ionization or dissociation is not 1, so this calibration curve may be corrected using the degree of ionization or dissociation.
- the dermis layer in the specific skin layer is taken as an example, but the calibration curve can be created in the same way in other specific skin layers.
- the output unit 54 outputs at least one of the electrolyte concentration and the blood protein concentration sent from the calibration curve comparison unit 53.
- the output destination may be a display unit such as a liquid crystal display, or a storage device such as a HDD.
- the specific skin layer separation unit 51 calculates the difference data by performing difference processing on the potential difference and phase or current and phase measured by the current/voltage application measurement unit 10, and the distribution function estimation unit 52 estimates the distribution function ⁇ (ln ⁇ ) from the difference data, but the present invention is not limited to this.
- the distribution function estimation unit 52 may estimate multiple distribution functions ⁇ (ln ⁇ ) based on the potential difference or current measured, and the specific skin layer separation unit 51 may obtain a difference estimation function by performing difference processing on the estimated multiple distribution functions (e.g., two distribution functions).
- an internal skin measuring device 100A according to a second embodiment of the present invention will be described with reference to FIG.
- the same components as those in the first embodiment are denoted by the same reference numerals, and their description will be omitted, with only the differences being described.
- the internal skin measurement device 100A includes a current/voltage application measurement unit 10A and a concentration distribution measurement unit 50.
- the concentration distribution measurement unit 50A includes a specific skin layer separation unit 51A, a concentration calculation unit 60A, and an output unit 54.
- a current/voltage application/measurement unit 10A of the second embodiment has the same configuration as the current/voltage application/measurement unit 10 of the first embodiment.
- the control unit 30 applies a square wave current or a square wave voltage to the electrodes in contact with the skin and measures the potential difference or current.
- the rightmost electrode of electrodes 1 to 3 (e 1 , e 2 , and e 3 ) is set as a ground electrode, a constant current of AC frequency f is applied to the leftmost electrode and the center electrode, and the voltage between the leftmost electrode and the ground electrode (distant electrode, interelectrode distance 2d) and between the center electrode and the ground electrode (near electrode, interelectrode distance 1d) is measured.
- the rectangular wave application current i(t) may generate a rectangular wave directly or may be generated using a Fourier series, which can be expressed, for example, by the following formula (15).
- fsw in formula (15) indicates the frequency of the rectangular wave application current to be generated
- (2m-1) is the harmonic order
- m is a natural number
- M is the maximum number of harmonics
- the advantage of using a rectangular wave is that it is efficient in measurement, because one rectangular wave contains sine waves and cosine waves with many frequencies. That is, this is why a rectangular wave can be generated using a Fourier series (sine waves and cosine waves with many frequencies). Each specific skin layer has different frequency response characteristics.
- the epidermis layer (excluding the stratum corneum) can be observed at 0 Hz to 10 Hz, the dermis layer at 10 Hz to 1 kHz, and the adipose tissue at 100 Hz to 10 kHz. Since the square wave contains various frequency components, it is easy to grasp the state of each specific skin layer.
- the concentration distribution measurement unit 50A measures (visualizes) at least one of the electrolyte concentration distribution and blood protein concentration distribution in a specific layer inside the skin by performing differential processing on the potential difference and phase or current and phase measured by the current/voltage application measurement unit 10A.
- the concentration distribution measurement unit 50A comprises a specific skin layer separation unit 51A, a power spectrum drop calculation unit 55, a calibration curve comparison unit 53A, and an output unit 54. Each unit will be described below.
- the skin specific layer separation unit 51A calculates differential data by performing differential processing on the potential difference and phase or the current and phase measured by the current/voltage application measurement unit 10A.
- v2 between the near electrodes is mainly influenced by the stratum corneum admittance Ys and the epidermis layer admittance Ye
- v2 between the far electrodes It is assumed that v1 at inter-electrode distance 2d) is mainly influenced by stratum corneum admittance Ys, epidermis layer admittance Ye, and dermis layer admittance Yd.
- the specific skin layer separation unit 51A calculates the voltage drop ⁇ v, which is the subtraction of v1 and v2, as differential data.
- Figure 10 shows an example of the rectangular wave applied current i(t), the measured voltage v1 between the distant electrodes, the measured voltage v2 between the near electrodes, and the difference ⁇ v between v1 and v2 in the rectangular wave applied current and potential difference measurement.
- the horizontal axis of Figure 10 is time ( ⁇ s), and the vertical axis is potential difference (V).
- the calculated voltage drop ⁇ V which is the differential data, is sent to the concentration calculation unit 60A.
- the concentration calculation unit 60A uses the difference data to calculate at least one of the conductivity, the dielectric constant, and the phase that are correlated with the electrolyte concentration and the blood protein concentration in the specific layer.
- the concentration calculation unit 60A includes a power spectrum drop calculation unit 55 that calculates the power spectrum drop ⁇ P from the difference data, and a calibration curve comparison unit 53A that calculates at least one of the electrolyte concentration and the blood protein concentration from the power spectrum drop ⁇ P calculated by the power spectrum drop calculation unit 55.
- the power spectrum drop calculation unit 55 calculates the power spectrum drop ⁇ P from the difference data.
- a Fourier transform is applied to the difference ⁇ v(t) between the measured voltage v1(t) between the far electrodes and the measured voltage v2(t) between the near electrodes, the following equation (16) is obtained.
- the power spectral density (PSD) at the harmonic order is given by the following equation (17), where N is the number of voltage samples, and the PSD is a function of the harmonic order (2m-1).
- Fig. 11 shows an example of the power spectral density (PSD) drop calculated by the power spectral drop calculation unit 55.
- the horizontal axis is frequency (kHz), and the vertical axis is power spectral density ( V2 /Hz).
- the difference between the first and third harmonic signals is ⁇ P.
- ⁇ P is determined by the magnitude of the harmonic order P of the fast Fourier transform (FFT), and the magnitude depends on the electrolyte concentration distribution and blood protein concentration distribution in the specific skin layer.
- FFT fast Fourier transform
- the calibration curve comparison unit 53A calculates at least one of the electrolyte and blood protein concentration in the specific skin layer based on the power spectrum density drop ⁇ P sent from the power spectrum drop calculation unit 55.
- FIG. 12 shows an example of the relationship between the electrolyte concentration c (sodium chloride concentration in FIG. 12) and the power spectrum density drop ⁇ P.
- the horizontal axis of FIG. 12 is the electrolyte concentration (mM), and the vertical axis is the power spectrum density drop ⁇ P [-].
- FIG. 12 there is a high correlation between the electrolyte concentration c and the power spectrum density drop ⁇ P, so by creating a calibration curve in advance as in the first embodiment, the electrolyte concentration in the specific skin layer can be calculated.
- the conductivity of the dermis layer is analyzed using power spectral density at different frequencies Pfsin, since the stratum corneum is permeable to high frequency injections and the dermis layer is low frequency.
- Pfsin power spectral density at different frequencies
- an internal skin measuring device 100B according to a third embodiment of the present invention will be described with reference to FIG.
- the same components as those in the first and second embodiments are denoted by the same reference numerals, and their description will be omitted, with only the differences being described.
- the internal skin measurement device 100B includes a current/voltage application measurement unit 10B and a concentration distribution measurement unit 50.
- the concentration distribution measurement unit 50B includes a specific skin layer separation unit 51B, an electrical property distribution calculation unit 56, and an output unit 54.
- the current/voltage application measurement unit 10B includes a sensor 20B and a control unit 30B.
- the sensor 20B includes a plurality of electrodes 21 (number of electrodes Q) that can be arranged on the skin at intervals.
- the current/voltage application measurement unit 10B applies a predetermined current or potential difference between the electrodes 21 while the electrodes 21 of the sensor 20B are in contact with the skin of the subject, and measures the potential difference or current.
- the potential difference is measured based on a predetermined current application voltage measurement pattern (a pattern in which two electrodes are selected in sequence from a large number of electrodes, a current is applied, and a potential difference is measured in sequence). At this time, it is preferable to also measure the phase (the time lag between the applied current and the measured potential difference).
- a predetermined current application voltage measurement pattern a pattern in which two electrodes are selected in sequence from a large number of electrodes, a potential difference is applied, and a current is measured in sequence. At this time, it is preferable to also measure the phase (the time lag between the applied potential difference and the measured current).
- the number Q of the electrodes 21 is preferably 8 or more.
- the number Q of the electrodes 21 is more preferably 16 or more.
- FIG. 14 shows an example in which multiple electrodes 21 are arranged in a line.
- Multiple electrodes 21 may be arranged in a line on the upper surface of the skin, or may be arranged two-dimensionally.
- a two-dimensional region of a semicircle in the skin depth direction with the length between the leftmost electrode (e1 in the example of FIG. 14) and the rightmost electrode (eE in the example of FIG. 14) of the electrodes 21 as the diameter, is set as the image target region (Region of Interest), and a two-dimensional image of the specific skin layer can be obtained.
- the image target region (Region of Interest)
- a three-dimensional region of a hemisphere in the skin depth direction is set as the image target region (Region of Interest), and a three-dimensional image of the specific skin layer can be obtained.
- the physical quantities of these images are one or more of the conductivity distribution, the dielectric constant distribution, and the phase distribution in the specific skin layer.
- the control unit 30B includes, for example, a multiplexer for switching between a current application electrode (or a voltage application electrode for applying a potential difference) that applies a current and a voltage measurement electrode (or a current measurement electrode for measuring a current) that measures a potential difference, and an impedance analyzer for performing voltage measurement (or current measurement) and phase measurement.
- the impedance analyzer is a component that changes the applied frequency and amplitude to measure impedance, that is, the ratio of the measured potential difference (applied potential difference) to the applied current (measured current), and its phase.
- the control unit 30B executes a predetermined program in, for example, a CPU, and controls the multiplexer and the impedance analyzer to perform impedance measurement (measurement of the ratio of the potential difference to the current, and its phase).
- the control unit 30B may be controlled only within the current/voltage application measurement unit 10B to perform impedance measurement, or the control unit 30B may be controlled according to a program executed in the concentration distribution measurement unit 50B to perform impedance measurement.
- the result of the impedance measurement is sent to the concentration distribution measurement unit 50B.
- the signal may be sent from the control unit 30B to the concentration distribution measuring unit 50B via a wire, or may be sent directly to the concentration distribution measuring unit 50B.
- the control unit 30B applies a current between each electrode 21 and measures the potential difference based on a predetermined current application voltage measurement pattern (a pattern of which electrodes the current is applied between and which electrodes the potential difference is measured between).
- the control unit 30A applies a potential difference between each electrode 21 and measures the current based on a predetermined voltage application current measurement pattern.
- a current or a potential difference there is no particular limitation as to which electrodes 21 the current (potential difference) is applied between and between which electrodes the potential difference (current) is measured.
- the control unit 30B measures the current and phase or the potential difference and phase using two or more electrode pairs with different inter-electrode distances in the sensor 20. Examples of measurement methods include the two-terminal method, the three-terminal method, the four-terminal method, and the four-terminal quasi-adjacent method.
- Figure 15 shows the measurement pattern of the four-terminal quasi-adjacent method when the number of electrodes 21 is 16.
- measurements are performed so that at least one of the pair of electrodes 21 that apply current (current application electrode pair) and the pair of electrodes 21 that measure the potential difference (potential difference measurement electrode pair) are adjacent to each other.
- the number of electrodes Q since the number of electrodes Q is 16, there are a total of 16 ways to select one electrode (current selection electrode) of the current application electrode pair.
- one of the potential difference measurement electrode pairs adjacent to this selected current selection electrode is similarly selected as the adjacent electrode (potential difference selection electrode).
- This potential difference selection electrode is not changed until the current selection electrode is changed.
- the potential difference is measured by the potential difference measurement electrode pair (e.g., the second electrode and the third electrode) adjacent to the current application electrode pair, excluding the current application electrode pair (e.g., the first electrode and the fourth electrode).
- the other electrode of the current application electrode pair is shifted by one (for example, from the fourth electrode toward the sixteenth electrode), and the position of the other electrode of the adjacent potential difference measurement electrode pair is also changed to a position adjacent to the other electrode of the current application electrode pair.
- This is then shifted to the electrode immediately before the electrode selected by one of the electrodes of the current application electrode pair, and measurement is performed. Therefore, there are 13 measurement patterns for one current selection electrode. Therefore, in the four-terminal quasi-adjacent method, the number of measurements (measurement patterns) M is 208 in total.
- a square wave current or the like may be applied as in the second embodiment.
- the skin specific layer separation unit 51B performs differential processing on the potential difference and phase or the current and phase measured by the current/voltage application measurement unit 10B to calculate differential data.
- the penetration depth of the current in the skin specific layer is , is related to the distance d v between the measurement electrodes, and in order to visualize the concentration distribution in a specific skin layer, the penetration depth of the current to the specific skin layer is essential. If the distance d v between the measurement electrodes is too narrow, In this case, the current flows linearly from one electrode to the other, making it difficult to obtain impedance information of a specific skin layer located at a deep position.
- the skin specific layer separation unit 51B performs a predetermined process based on the spatial voltage threshold d ⁇ (SVT) to obtain the concentration of a target component (electrolyte, blood protein, etc.) in the target skin specific layer.
- the potential difference (or current) carrying information on the distribution is amplified, and the potential difference (or current) carrying information on the unintended skin specific layer is reduced.
- the spatial voltage threshold is a threshold based on the distance between the electrodes. and is a function of the distance between the electrodes.
- the skin specific layer separation unit 51B uses a spatial voltage threshold value d ⁇ to perform a predetermined process on the current or potential difference, and obtains the difference data.
- the processed current or potential difference is sent to the electrical property distribution calculation unit 56.
- FIG. 16 is a diagram for explaining processing using a spatial voltage threshold (SVT).
- FIG. 16(a) shows the state of potential difference measurement
- FIG. 16(b) shows the potential difference after processing based on the threshold d ⁇ .
- the distance d v m between the potential difference measurement electrodes in FIG. 16 affects the measurement depth.
- m in d v m means the measurement number.
- the spatial voltage threshold (SVT) d ⁇ can be appropriately set according to the target specific skin layer. For example, when data of the dermis layer is acquired, the measurement depth is set to be the stratum corneum and the epidermis layer when d v m ⁇ d ⁇ .
- d ⁇ is, for example, 1 to 6 mm.
- the spatial voltage threshold (SVT) can be set by investigating the effect of the electrolyte concentration in the target specific skin layer in advance.
- the potential difference v * m after processing based on the spatial voltage threshold is determined, for example, from the average value of v 1 to m in order to reduce the effect of the high resistance of the stratum corneum in the measurement.
- v ⁇ m is the time average of the potential difference expressed by the following formula (18).
- the potential difference (compensated potential difference) v * m after processing with the spatial voltage threshold is expressed by the following formula (19).
- m ⁇ 1, 2, ..., 208 ⁇ is the measurement number.
- the low potential electrode e lp m is organized by integer division and modulus division as shown in the following formula (21).
- the distance d v m (mm) of the electrode voltage is determined from the distance between e hp m and e lp m as shown in the following formula (22).
- the electrical property distribution calculation unit 56 calculates at least one of the electrical conductivity distribution, the dielectric constant distribution, and the phase distribution based on the post-treatment current or the potential difference sent from the skin specific layer separation unit 51 B. The calculated electrical property distribution is sent to the output unit 54.
- FIG. 17 shows an example of image reconstruction.
- the sodium ion concentration distribution image of the skin region ⁇ is reconstructed based on the electrical conductivity distribution ⁇ expressed by the following formula (23), and in this example, the sodium ion concentration distribution of the dermis layer within the dotted line is emphasized by a predetermined process based on the spatial voltage threshold d ⁇ (SVT).
- r n in formula (23) is expressed by the following formula (24), and is a row vector representing the spatial position of the nth (1 ⁇ n ⁇ N) mesh element when the skin region ⁇ is divided into N mesh elements.
- the Jacobian matrix J of the skin region ⁇ is expressed by the following formula (25).
- m is the measurement pattern (1 ⁇ m ⁇ M)
- M is the total number of measurement patterns
- n is the spatial position (mesh element) (1 ⁇ n ⁇ N)
- N is the total number of meshes of the spatial resolution
- T is defined as the transposition matrix.
- the Jacobian matrix J mn of the nth mesh element in the mth measurement pattern can be defined by the second term of the following formula (26), and can be defined as the rate of change of the measured potential difference vm in the mth (1 ⁇ m ⁇ M) measurement pattern when the conductivity ⁇ n of the nth (1 ⁇ n ⁇ N) mesh element changes (expressed by partial differential symbol), and J is the coefficient of the conductivity distribution ⁇ and the measured potential difference v.
- J can be calculated, for example, by the third term of formula (26).
- ⁇ (I k ) in formula (26) is the potential of the n-th mesh element affected by the current I injected between the k electrodes
- ⁇ (I l ) is the potential of the n-th mesh element when the current I is hypothetically injected between the l electrodes
- ⁇ is the Nabla partial differential operator
- the integral symbol indicates the integral of the entire skin region ⁇ .
- Equation (27) The electrical conductivity distribution of the skin layer is calculated using the Gauss-Newton method (Equation (27) below).
- R in Equation (27) is a regularization matrix
- ⁇ is a relaxation coefficient scalar automatically determined by the L-curve method (Hansen and O'Leary 1993).
- ⁇ v in Equation (27) is expressed by Equation (28) below.
- ⁇ vm in Equation (28) is the normalized measurement voltage under the skin boundary shape ⁇ , and is expressed by Equation (29) below.
- vm(0) is the initial measurement voltage
- vm(c) is the inclusion voltage based on the target component concentration c.
- the electrical property distribution calculation unit 56 sends the electrical property distribution of the target component obtained above to the output unit 54.
- the electrical property distribution calculation unit 56 may further perform boundary processing on the calculated electrical property distribution.
- boundary processing will be described below.
- Fig. 18 is a schematic diagram of each specific skin layer used in the electromagnetic simulation.
- hs is the thickness of the stratum corneum
- he is the thickness of the epidermis layer (excluding the stratum corneum)
- hd is the thickness of the dermis layer
- ha is the thickness of the adipose tissue layer
- ⁇ e indicates the target area of the epidermis layer
- ⁇ d indicates the target area of the dermis layer
- ⁇ a indicates the target area of the adipose tissue layer
- ⁇ s indicates the conductivity of the stratum corneum
- ⁇ s indicates the relative dielectric constant of the stratum corneum.
- ⁇ e indicates the conductivity of the epidermis layer, and ⁇ e indicates the relative dielectric constant of the epidermis layer.
- ⁇ d indicates the conductivity of the dermis layer, and ⁇ e indicates the relative dielectric constant of the dermis layer.
- ⁇ a indicates the conductivity of the adipose tissue layer, and ⁇ a indicates the relative dielectric constant of the adipose tissue layer.
- ⁇ (x,y) is the electric potential at the coordinates (x,y).
- the physical relationship between the conductivity distribution and the boundary voltage in the target region ⁇ is governed by a partial differential equation derived from Maxwell's equation in the following equation (30).
- a current I is applied through electrodes e k (e 1 , e 2 , ..., e E in Fig. 18) on the skin surface ⁇
- the potential ⁇ in the target region ⁇ is solved from equation (31).
- the electrical property distribution can be calculated more accurately by performing calculations based on the Neumann boundary conditions in the following equations (32) to (33).
- n represents the outer unit normal vector
- ⁇ ek represents the electrode boundary
- dS represents the corresponding infinitesimal area element of the electrode boundary.
- the internal skin measuring devices 100, 100A, and 100B according to the present embodiment have been described above.
- the technical scope of the present invention is not limited to the above-described embodiment, and various modifications can be made without departing from the spirit of the present invention.
- the components in the above-described embodiments may be replaced with well-known components, and the above-described modified examples may be combined as appropriate.
- FIG. 19(a) shows the sensor used in the two electromagnetic simulations, and four non-invasive electrodes were placed on the skin surface.
- FIG. 19(b) shows the configuration of each specific skin layer, which is composed of the stratum corneum, epidermis layer, dermis layer, and fat layer. The thickness of each layer is represented by the stratum corneum hs, epidermis layer he, dermis layer hd, and fat layer ha.
- the thickness of the dermis layer was changed, and the thickness of each skin layer except the dermis layer was fixed, specifically, the stratum corneum hs was 0.05 mm, the epidermis layer he was 0.45 mm, and the fat layer ha was 5 mm.
- FIG. 19( c ) shows an equivalent circuit of a specific skin layer simplified by the two-terminal method.
- a current flows through the specific skin layer present between each noninvasive electrode, influenced by the size of the electrical equivalent circuit of the combination of the capacitance component C s,e of the stratum corneum and epidermis layer, the resistance component R s,e of the stratum corneum and epidermis layer, the capacitance component C d of the dermis layer, and the resistance component R d of the dermis layer.
- Electromagnetic simulation (estimated distribution function ⁇ (ln ⁇ ) when the ratio r and the interelectrode distance d change)
- Figure 20 shows the frequency dependence of the known electrical conductivity ⁇ and the known relative permittivity ⁇ in each specific skin layer used in the electromagnetic simulation conditions.
- the vertical axis of Fig. 20(a) represents electrical conductivity (S/cm)
- the horizontal axis of Fig. 20(a) represents the frequency of applied current (Hz)
- the vertical axis of Fig. 20(b) represents the relative dielectric constant (-)
- the horizontal axis of Fig. 20(b) represents the frequency of applied current (Hz).
- Fig. 21(a) shows a Nyquist plot obtained from the electromagnetic simulation results of impedance
- Fig. 21(b) shows the estimated distribution function ⁇ (ln ⁇ ) at a specific relaxation time ⁇ , which is the output result of the distribution function estimation unit 52 of the present invention.
- FIG. 22(a) shows the estimated distribution function ⁇ (ln ⁇ ) at ⁇ 1
- the horizontal axis shows the interelectrode distance d
- the vertical axis of FIG. 22(b) shows the estimated distribution function ⁇ (ln ⁇ ) at ⁇ 2
- Example 2 Next, to experimentally verify the first embodiment using the measurement parameters (ratio r and inter-electrode distance d) of the first embodiment optimized in Example 1, an experiment for a skin specific layer separation means was carried out using pig skin tissue (with fat layer and muscle attached) that has mechanical and electrical properties almost similar to those of human skin.
- Figure 23 shows an outline of the experimental apparatus.
- Figure 23 is composed of a sensor, a 4-channel multiplexer, an impedance analyzer (IM 3570, Hioki E.E. Corporation, Tokyo, Japan) as a data acquisition system, and a personal computer for indication and post-processing.
- IM 3570 impedance analyzer
- the sensor used was a printed circuit board (PCB) with dimensions of 25 mm x 35 mm x 1.6 mm, on which four non-invasive electrodes were arranged in a 1 x 4 arrangement.
- the non-invasive electrodes were made of stainless steel and had a diameter of 1 mm, a center-to-center distance between adjacent electrodes of 1 mm, and a thickness of 1 mm from the printed circuit board.
- the two-terminal method was used as the impedance measurement method, and the relationship between the measurement number and each non-invasive electrode is shown in Table 1.
- the column Hc in Table 1 indicates the electrode number for high current application
- the column Hp indicates the electrode number for high potential measurement
- the column Lc indicates the electrode number for low current application
- the column Lp indicates the electrode number for low potential measurement.
- the current flows from the high current application electrode (Hc) through the pig skin tissue and reaches the low current application electrode (Lc), which also includes the ground.
- Electrode numbers e 1 (abbreviated as 1 in the table), e 2 (abbreviated as 2), and e 3 (abbreviated as 3) functioned as the Hc and Hp non-invasive electrodes, and electrode number e 4 (abbreviated as 4) always functioned as the Lp and Lc (ground) electrodes.
- a total of three measurements are obtained by the measurements in Table 1.
- the pig skin tissue sample was composed of the stratum corneum, epidermis, dermis, fat layer, and muscle layer, and the temperature was adjusted until it reached an appropriate temperature ( ⁇ 35°C).
- an appropriate temperature ⁇ 35°C.
- four sodium chloride (NaCl) aqueous solutions with different concentrations (20 mM, 30 mM, 35 mM, and 40 mM) were prepared and injected into the pig's dermis layer.
- FIG. 24(a) shows the results of a Nyquist plot in which the concentration of the sodium chloride aqueous solution is used as a parameter (y-axis) and the applied current frequency is swept, with the real part (x-axis) and imaginary part (z-axis) of the impedance.
- FIG. 24(b) shows a comparison between the experimental results (solid line) and an equivalent circuit fitting (dotted line) based on an EEC (electrical equivalent circuit). As shown in FIG. 24(b), the experimental results and the fitting of the equivalent circuit were in good agreement. It was also confirmed that the resistance value Z re calculated from the x-axis value indicating the minimum value of the y-axis of the Nyquist plot increased with an increase in the sodium chloride aqueous solution concentration c.
- FIG. 25(a) shows the relationship between the relaxation time ⁇ and the estimated distribution function ⁇ (ln ⁇ ) when the concentration of the sodium chloride aqueous solution is used as a parameter in the calculation results of the skin specific layer separation part of the first embodiment in an experiment using pig skin tissue. From this figure, several peak values were confirmed. These peak values correspond to the distribution functions for each skin specific layer.
- the vertical axis of FIG. 25(b) is the estimated distribution function ⁇ (ln ⁇ ) ( ⁇ ), and the horizontal axis is the relaxation time ⁇ (s).
- the local maximum value of the estimated distribution function ⁇ (ln ⁇ ) calculated using the skin specific layer separation unit 51 of the first embodiment indicates the characteristics of each layer of the skin specific layer.
- the electrical characteristics of the dermis layer were measured by determining the difference between the adjacent counter electrode and the distant counter electrode to separate it from the other epidermis layers.
- the peaks were well distinguished, but in other relaxation time regions, the peaks were irregular. From FIG. 25(a), it was found that in the high relaxation time region, the distribution function gives information related to the concentration of sodium ions injected into the dermis layer. Therefore, the analysis was carried out by focusing on the high relaxation time region where useful information of the dermis layer can be obtained.
- the horizontal axis of FIG. 25(b) is the sodium chloride aqueous solution concentration, and the vertical axis is the estimated distribution function ⁇ (ln ⁇ ). From this figure, it was found that the amplitude becomes smaller as the concentration becomes higher in this region.
- the sodium ion concentration of the dermis layer for example, can be measured by the skin internal measurement device according to this embodiment, and the state of edema, the state of necrosis of cells and blood vessels, and the state of chronic kidney disease can be detected.
- Example 3 To experimentally demonstrate the second embodiment, the electrolyte concentration in the dermis layer of pig skin was measured under conditions varying from 5 mmol/L to 50 mmol/L (mimicking a patient with chronic kidney disease (CKD)).
- CKD chronic kidney disease
- Figure 26 shows the configuration of the experimental device used in Example 3.
- An FPGA Xilinx Zynq-SoC
- ADG1404 three-channel analog multiplexer
- Electrode e1 was set as a low current application electrode and a low voltage measurement electrode, and electrode e2 was switched to a high voltage measurement electrode and electrode e3 was switched to a high current application electrode for measurement.
- An analog-digital converter LTC2145 was used to acquire a high-speed data signal with a data resolution of 14 bits and a sampling rate of 125 MS/s. The measured potential difference v was transferred to the power spectrum drop calculation unit.
- Example 3 the conductivity of the dermis layer was analyzed in the time and frequency domains based on the potential difference v measured from two pairs of two-electrode methods (potential difference measurement between e2-e1 and current application between e3-e1).
- the time domain analysis includes the maximum measured potential difference vmax and charging time due to the resistive and capacitive properties of the dermis layer, while the frequency domain analysis includes the power spectral density at the harmonic components. To ensure the reproducibility of the measurements, 10 measurements were taken and the average was calculated.
- the current magnitude i was 1.0 mA
- the duty cycle ⁇ was 50%
- the applied current frequency f was 1 kHz to 200 kHz.
- Pig skin tissue was cut into a size of 2 x 4 cm, and 0.5 mL of sodium chloride solution (NaCl + H 2 O) was injected directly into the dermis layer.
- the sodium chloride solution was prepared by dissolving NaCl powder in 50 mL of distilled water according to the following formula (34).
- the dermis layer was treated with 10 different sodium chloride aqueous solutions with concentrations of 5, 10, 15, 20, 25, 30, 35, 40, 45, and 50 [mmoL/L].
- m NaCl in formula (34) is the mass of NaCl powder
- V is the amount of distilled water
- Mr is the relative molecular weight of NaCl, which is 58.44 [g/mol]. It was confirmed that the injected NaCl was uniformly distributed in the dermis layer and did not diffuse into the stratum corneum, epidermis, or fat layer.
- Figure 27 shows the measurement results of the measured potential difference v due to the difference in applied current frequency fsw when a sodium chloride aqueous solution of concentration c of 10 mmol/L is injected into the dermis layer.
- the horizontal axis of Figure 27(a) shows the elapsed time ( ⁇ s), and the vertical axis shows the measured potential difference v (V).
- FIG. 28(a) shows the time domain results, with the horizontal axis being time ( ⁇ s) and the vertical axis being the measured potential difference v. From this time domain result, information on the maximum measured voltage vmax and the time constant ⁇ can be obtained. The time constant is an important parameter for calculating the intracellular capacitance, extracellular resistance, and intracellular resistance of the dermis layer. From FIG. 28(a), it can be seen that the maximum measured voltage vmax is linearly correlated with c, since it decreases with an increase in c.
- FIG. 28(b) shows the frequency domain, providing information about the power spectral density of the harmonic orders.
- Figure 29 shows the conductance and capacitance of the dermis layer based on a time constant analysis of the sodium chloride aqueous solution concentration.
- the vertical axis of Figure 29(a) shows the conductance of the dermis layer (S/m), and the horizontal axis shows the sodium chloride aqueous solution concentration (mM).
- the vertical axis of Figure 29(b) shows the capacitance of the dermis layer (nF), and the horizontal axis shows the sodium chloride aqueous solution concentration.
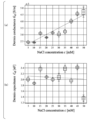
- the vertical axis of FIG. 30 shows the normalized power spectral density drop, and the horizontal axis shows the concentration of the NaCl aqueous solution injected into the dermis layer.
- the coefficient of determination R 2 was greater than 0.90.
- the coefficient of determination decreased for applied current frequencies f greater than 100 kHz.
- the power spectral density drop ⁇ P was calculated based on the following formula (35). Meanwhile, from the calculation, ⁇ P was calculated based on the following formula (36).
- k is a calibration coefficient.
- the harmonic orders from the square wave applied current contain valuable information that was extracted to represent the conductivity, permittivity, and phase of the dermis layer.
- Table 2 shows the results of the time constant analysis to determine the electrical properties of the dermis layer. The results of the time constant analysis showed that the sodium ion concentration c is directly related to the dermis conductance Gd, and that Gd increases as c increases.
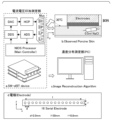
- FIG. 32 shows the configuration of the intradermal measurement device used in Example 4.
- the intradermal measurement device generates a square wave signal and manages the measurement signal.
- a Howland current supplies a constant current i over a wide range of frequencies.
- Electrode switching was performed by a 16-channel analog multiplexer ADG 1406.
- a dual simultaneous analog/digital converter LTC2145 was used for high-speed data acquisition.
- a four-terminal quasi-adjacent method using 16 electrodes was used in Example 4.
- the measured voltage v_m was transferred to a concentration distribution measuring unit 50 (computer).
- the sampling time ⁇ t was controlled to avoid oversampling and to keep the number of potential difference samples N constant at 2048. By keeping N at a constant value, the speed of the FFT processing can be maintained.
- a sodium chloride solution was injected into the dermis layer.
- Pig skin was cut into a size of 10 x 40 mm, and 0.5 ml of sodium chloride solution was injected directly into the dermis layer.
- the sodium chloride concentrations were 5, 10, 15, 20, 25, 30, 35, 40, 45, and 50 mM. There were five skin samples for each condition, and each sample was measured five times to ensure the reproducibility and accuracy of the measurements.
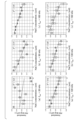
- Fig. 33 shows the pattern change of the normalized compensation voltage ⁇ v*> when the threshold d ⁇ is changed. A significant change in the pattern cut off by the threshold d ⁇ was confirmed. The larger the threshold d ⁇ , the higher the normalized compensation voltage ⁇ v*> became.
- Figure 34 shows the experimental results of reconstructed images of sodium ion concentration distribution when the threshold value d ⁇ and the concentration of the sodium chloride aqueous solution are changed.
- the threshold value d ⁇ 0 mm
- the reconstructed image of sodium ion concentration distribution c had artifacts in the stratum corneum and epidermis regions. c in the epidermis layer was still dominant.
- the image of the c distribution was highlighted in the region of interest ROI (area surrounded by a rectangle in each figure) in the dermis layer, improving the accuracy of quantification.
- Example 5 In order to experimentally demonstrate the effect of combining the third embodiment with another embodiment (here, the first embodiment), a predetermined process was performed based on a threshold value based on the distance between the electrodes, and the potential difference or current carrying information on the concentration distribution of target components (electrolytes, blood proteins, etc.) in the specific skin layer of interest was amplified.
- the Skip method employed a planar sensor array with 16 electrodes and a quasi-adjacent injection pattern for extraction of sodium ion concentration in the dermal layer. Each impedance measurement utilizes four electrodes: high current (Hc), high potential (Hp), low potential (Lp), and low current (Lc).
- the integration of the threshold-based Skip method with DRT provides a promising approach to extract sodium ion concentration in the dermis layer while improving image quality and depth resolution.
- Figure 39 shows a comparison of the spatially averaged conductivity distribution ⁇ * ⁇ > obtained by electromagnetic simulation and experiment.
- Figure 39(a) shows the results when d ⁇ is 0 mm
- Figure 39(b) shows the results when d ⁇ is 2 mm
- Figure 39(c) shows the results when d ⁇ is 4 mm
- Figure 39(d) shows the results when d ⁇ is 8 mm.
- the horizontal axis of each figure is the concentration of the sodium chloride solution (mM)
- the vertical axis is the spatially averaged conductivity distribution ⁇ * ⁇ >.
- ⁇ represents the ⁇ * ⁇ > of the skin region
- ⁇ d represents the ⁇ * ⁇ > of the ROI region.
- the subscripts exp and sim represent the experimental values and electromagnetic simulation values, respectively.
- Figure 40 shows the evaluation results of threshold d ⁇ based on electromagnetic simulation and experiment.
- the upper diagram of Figure 40(a) shows the relationship between the coefficient of determination of the electromagnetic simulation and the threshold
- the lower diagram of Figure 40(a) shows the relationship between the normalized sensitivity S of the electromagnetic simulation and the threshold
- the upper diagram of Figure 40(b) shows the relationship between the coefficient of determination obtained from the experiment and the threshold
- the lower diagram of Figure 40(b) shows the relationship between the normalized sensitivity S obtained from the experiment and the threshold. From these results, it was found that the optimal threshold (threshold distance) was 2 mm.
Landscapes
- Health & Medical Sciences (AREA)
- Life Sciences & Earth Sciences (AREA)
- General Health & Medical Sciences (AREA)
- Pathology (AREA)
- Physics & Mathematics (AREA)
- Molecular Biology (AREA)
- Public Health (AREA)
- Chemical & Material Sciences (AREA)
- Engineering & Computer Science (AREA)
- Biomedical Technology (AREA)
- Heart & Thoracic Surgery (AREA)
- Medical Informatics (AREA)
- Veterinary Medicine (AREA)
- Surgery (AREA)
- Animal Behavior & Ethology (AREA)
- Biophysics (AREA)
- Dermatology (AREA)
- Nuclear Medicine, Radiotherapy & Molecular Imaging (AREA)
- Radiology & Medical Imaging (AREA)
- Chemical Kinetics & Catalysis (AREA)
- Electrochemistry (AREA)
- Analytical Chemistry (AREA)
- Biochemistry (AREA)
- General Physics & Mathematics (AREA)
- Immunology (AREA)
- Measurement And Recording Of Electrical Phenomena And Electrical Characteristics Of The Living Body (AREA)
Abstract
互いに間隔を空けて皮膚に配置可能な複数の電極(21)を備えるセンサ(20)を有する電流電圧印加測定部(10)と、前記皮膚内部の特定層の電解質濃度分布および血液タンパク濃度分布の少なくとも一方を測定する濃度分布測定部(50)と、を備え、前記濃度分布測定部(50)は、前記電流電圧印加測定部(10)が測定した電流、電位差、および/または、位相の変動量に基づき得られた、前記皮膚内部の特定層の情報が載った所定の特徴量を算出する皮膚特定層分離部(51)と、前記差分データを用いて、前記特定層内の電解質濃度および血液タンパク質濃度と相関する導電率、誘電率、および位相のうち少なくとも1つを算出する、濃度算出部(60、60A)と、を備える、皮膚内部計測装置(100)。
Description
本発明は皮膚内部計測装置に関する。
本願は、2023年5月2日に、日本に出願された特願2023-076258号に基づき優先権を主張し、その内容をここに援用する。
本願は、2023年5月2日に、日本に出願された特願2023-076258号に基づき優先権を主張し、その内容をここに援用する。
皮膚は、厚さ約0.12~0.2mmの表皮層、約1.8mmの真皮層、および皮下組織(脂肪層組織)の3層で構成される。医療の分野や美容の分野において、真皮層など皮膚内部の特定層の状態を詳しく知ることが求められている。他方で、用いるセンサ等の機器はなるべく簡単かつ極低侵襲性のもの、例えば皮膚表面に貼るだけの平面的なセンサを使用し、皮膚特定層内の電解質濃度分布・血液たんぱく濃度分布を可視化できるような技術が求められている。
例えば、美容の分野では、ストレスなどによる甲状腺機能低下症により、ヒアルロン酸とヒアルロニダーゼ(ヒアルロン酸の分解酵素)とのバランスが悪化し、真皮層内に過剰にヒアルロン酸が存在することで浮腫が発生することが報告されており、皮膚内部の状態の計測技術が求められている。
また、医療の分野では、重度の火傷等に対して、皮膚組織の移植組織に対して、血管吻合による皮弁手術がなされているが、その血管吻合の困難さのために壊死が生じることも多く、壊死を防ぐためにも、表皮層、真皮層、皮下組織などの皮膚特定層内の電解質濃度分布や血液たんぱく濃度分布の状態の計測技術が求められている。
皮膚内部の計測方法としては、近赤外線カメラ、光干渉断層撮影法(光コヒーレンス・トモグラフィー)、SHG光(第2高調波発生光)、光超音波などがあるが、これらの技術は、形状を可視化計測するものであり、皮膚特定層内の電解質濃度分布・血液たんぱく濃度分布を可視化計測するものではなかった。
皮膚特定層内の電解質濃度分布・血液たんぱく濃度分布を可視化する技術としては、例えば、特許文献1の技術が挙げられる。特許文献1には、生体インピーダンス分光法を用いて皮膚のナトリウム・イオン含有量を決定する方法であって、被験者の皮膚に所定の周波数で電流を印加し、電流によって生じる皮膚にかかる電圧を測定し、測定された電圧を用いて、所定の周波数で被験者の皮膚にかかる抵抗を決定し、測定された電圧を用いて皮膚ナトリウム・イオン量を決定する方法が開示されている。また、特許文献2には、生体表面直下の深さ方向の組織層の情報(脂肪層、筋肉層、骨組織層など)を簡便に且つ精度よく計測するために、生体表面電極パッドを貼着させて測定した電気信号から、該生体内部の情報に関連する生体電気インピーダンスを計測する生体電気インピーダンス計測方法が記載されている。
上記のような従来の生体インピーダンス分光法を技術では、画像の精度を高めるために、センサとして体や手足に巻き付ける電極ベルトや、極小針からなる電極を含むセンサを用いる必要があり、これらの構造を必要としない、簡単かつ極低侵襲性の、例えば皮膚表面に貼るだけの平面的なセンサを用いて、十分な精度で皮膚特定層内の電解質濃度分布・血液たんぱく濃度分布を可視化することは困難であった。そこで、前記課題を解決するために、本発明は以下の手段を提案している。
<1>本発明の態様1の皮膚内部計測装置は、
互いに間隔を空けて皮膚に配置可能な複数の電極を備えるセンサを有する電流電圧印加測定部と、
前記皮膚内部の特定層の電解質濃度分布および血液タンパク濃度分布の少なくとも一方を測定する濃度分布測定部と、を備え、
前記濃度分布測定部は、前記電流電圧印加測定部が測定した電流、電位差、および/または、位相の変動量に基づき得られた、前記皮膚内部の特定層の情報が載った特徴量であって、以下の少なくとも一つの特徴量:
(1)電場が皮膚特定層を浸透する遠方電極間のインピーダンスZ1(f)と、電場が皮膚特定層を浸透せず、その上部の層のみを浸透する近方電極間のインピーダンスZ2(f)との変動量に基づく特徴量、
(2)矩形波電流を印加した場合の遠方電極間と近方電極間の電位差および位相の変動量に基づく特徴量、または矩形波電圧を印加した場合の遠方電極間と近方電極間の電流および位相の変動量に基づく特徴量、または、
(3)電極間距離に基づく閾値に基づき所定の処理を行い、目的とする皮膚特定層内の対象成分の濃度分布の情報が載った電位差または電流を増幅し、目的としない皮膚特定層内の情報が載った電位差または電流を低減した特徴量、
を算出する皮膚特定層分離部と、
前記差分データを用いて、前記特定層内の電解質濃度および血液タンパク質濃度と相関する導電率、誘電率、および位相のうち少なくとも1つを算出する、濃度算出部と、を備える。
<2>本発明の態様2は、態様1の皮膚内部計測装置において、
前記濃度算出部がさらに、
(a)あらかじめ作成された、電解質濃度と緩和時間に基づく分布関数の検量線と、前記特徴量から推定された、緩和時間に基づく分布関数に基づき、または
(b)あらかじめ作成された、電解質濃度とパワースペクトル密度降下の検量線と、前記特徴量から推定された、パワースペクトル密度降下に基づき、電解質または血液タンパクなどの濃度を算出する検量線比較部を有してもよい。
<3>本発明の態様3は、態様2の皮膚内部計測装置において、
前記濃度算出部が、あらかじめ作成された、電解質濃度と緩和時間に基づく分布関数の検量線と、前記特徴量から推定された、緩和時間に基づく分布関数に基づき、電解質または血液タンパクなどの濃度を算出する検量線比較部を有してもよい。
<4>本発明の態様4は、態様2の皮膚内部計測装置において、
前記濃度算出部が、あらかじめ作成された、電解質濃度とパワースペクトル密度降下の検量線と、前記特徴量から推定された、パワースペクトル密度降下に基づき、電解質または血液タンパクなどの濃度を算出する検量線比較部を有してもよい。
<5>本発明の態様5は、態様1の皮膚内部計測装置において、
前記濃度分布測定部は、
前記電流電圧印加測定部で測定された前記電流または前記電位差に対して電極間距離の閾値に基づき、所定の処理を行う皮膚特定層分離部と、
前記所定の処理後の前記電流又は前記電位差に基づき、導電率分布、誘電率分布、および位相分布の少なくとも1つを算出する、電気物性分布算出部と、を備えてもよい。
<6>本発明の態様6の皮膚特定層内の電解質濃度分布・血液たんぱく濃度分布の計測方法では、
互いに間隔を空けて皮膚に配置した複数の電極を備えるセンサを有する電流電圧印加測定部が測定した電流、電位差、および/または、位相の変動量に基づき得られた、前記皮膚内部の特定層の情報が載った特徴量であって、以下の少なくとも一つの特徴量:
(1)電場が皮膚特定層を浸透する遠方電極間のインピーダンスZ1(f)と、電場が皮膚特定層を浸透せず、その上部の層のみを浸透する近方電極間のインピーダンスZ2(f)との変動量に基づく特徴量、
(2)矩形波電流を印加した場合の遠方電極間と近方電極間の電位差および位相の変動量に基づく特徴量、または矩形波電圧を印加した場合の遠方電極間と近方電極間の電流および位相の変動量に基づく特徴量、または、
(3)電極間距離に基づく閾値に基づき所定の処理を行い、目的とする皮膚特定層内の対象成分の濃度分布の情報が載った電位差または電流を増幅し、目的としない皮膚特定層内の情報が載った電位差または電流を低減した特徴量、を算出し、
前記特徴量を用いて、前記特定層内の電解質濃度および血液タンパク質濃度と相関する導電率、誘電率、および位相のうち少なくとも1つを算出した結果を用いる。
<7>本発明の態様7は、態様6の計測方法において、
前記特徴量を用いた算出が
(a)電解質または血液タンパクの濃度の算出に先立って作成された、電解質濃度と緩和時間に基づく分布関数の検量線と、前記特徴量から推定された、緩和時間に基づく分布関数に基づき、または
(b)電解質または血液タンパクの濃度の算出に先立って作成された、電解質濃度とパワースペクトル密度降下の検量線と、前記特徴量から推定された、パワースペクトル密度降下に基づき、電解質または血液タンパクの濃度を算出してもよい。
互いに間隔を空けて皮膚に配置可能な複数の電極を備えるセンサを有する電流電圧印加測定部と、
前記皮膚内部の特定層の電解質濃度分布および血液タンパク濃度分布の少なくとも一方を測定する濃度分布測定部と、を備え、
前記濃度分布測定部は、前記電流電圧印加測定部が測定した電流、電位差、および/または、位相の変動量に基づき得られた、前記皮膚内部の特定層の情報が載った特徴量であって、以下の少なくとも一つの特徴量:
(1)電場が皮膚特定層を浸透する遠方電極間のインピーダンスZ1(f)と、電場が皮膚特定層を浸透せず、その上部の層のみを浸透する近方電極間のインピーダンスZ2(f)との変動量に基づく特徴量、
(2)矩形波電流を印加した場合の遠方電極間と近方電極間の電位差および位相の変動量に基づく特徴量、または矩形波電圧を印加した場合の遠方電極間と近方電極間の電流および位相の変動量に基づく特徴量、または、
(3)電極間距離に基づく閾値に基づき所定の処理を行い、目的とする皮膚特定層内の対象成分の濃度分布の情報が載った電位差または電流を増幅し、目的としない皮膚特定層内の情報が載った電位差または電流を低減した特徴量、
を算出する皮膚特定層分離部と、
前記差分データを用いて、前記特定層内の電解質濃度および血液タンパク質濃度と相関する導電率、誘電率、および位相のうち少なくとも1つを算出する、濃度算出部と、を備える。
<2>本発明の態様2は、態様1の皮膚内部計測装置において、
前記濃度算出部がさらに、
(a)あらかじめ作成された、電解質濃度と緩和時間に基づく分布関数の検量線と、前記特徴量から推定された、緩和時間に基づく分布関数に基づき、または
(b)あらかじめ作成された、電解質濃度とパワースペクトル密度降下の検量線と、前記特徴量から推定された、パワースペクトル密度降下に基づき、電解質または血液タンパクなどの濃度を算出する検量線比較部を有してもよい。
<3>本発明の態様3は、態様2の皮膚内部計測装置において、
前記濃度算出部が、あらかじめ作成された、電解質濃度と緩和時間に基づく分布関数の検量線と、前記特徴量から推定された、緩和時間に基づく分布関数に基づき、電解質または血液タンパクなどの濃度を算出する検量線比較部を有してもよい。
<4>本発明の態様4は、態様2の皮膚内部計測装置において、
前記濃度算出部が、あらかじめ作成された、電解質濃度とパワースペクトル密度降下の検量線と、前記特徴量から推定された、パワースペクトル密度降下に基づき、電解質または血液タンパクなどの濃度を算出する検量線比較部を有してもよい。
<5>本発明の態様5は、態様1の皮膚内部計測装置において、
前記濃度分布測定部は、
前記電流電圧印加測定部で測定された前記電流または前記電位差に対して電極間距離の閾値に基づき、所定の処理を行う皮膚特定層分離部と、
前記所定の処理後の前記電流又は前記電位差に基づき、導電率分布、誘電率分布、および位相分布の少なくとも1つを算出する、電気物性分布算出部と、を備えてもよい。
<6>本発明の態様6の皮膚特定層内の電解質濃度分布・血液たんぱく濃度分布の計測方法では、
互いに間隔を空けて皮膚に配置した複数の電極を備えるセンサを有する電流電圧印加測定部が測定した電流、電位差、および/または、位相の変動量に基づき得られた、前記皮膚内部の特定層の情報が載った特徴量であって、以下の少なくとも一つの特徴量:
(1)電場が皮膚特定層を浸透する遠方電極間のインピーダンスZ1(f)と、電場が皮膚特定層を浸透せず、その上部の層のみを浸透する近方電極間のインピーダンスZ2(f)との変動量に基づく特徴量、
(2)矩形波電流を印加した場合の遠方電極間と近方電極間の電位差および位相の変動量に基づく特徴量、または矩形波電圧を印加した場合の遠方電極間と近方電極間の電流および位相の変動量に基づく特徴量、または、
(3)電極間距離に基づく閾値に基づき所定の処理を行い、目的とする皮膚特定層内の対象成分の濃度分布の情報が載った電位差または電流を増幅し、目的としない皮膚特定層内の情報が載った電位差または電流を低減した特徴量、を算出し、
前記特徴量を用いて、前記特定層内の電解質濃度および血液タンパク質濃度と相関する導電率、誘電率、および位相のうち少なくとも1つを算出した結果を用いる。
<7>本発明の態様7は、態様6の計測方法において、
前記特徴量を用いた算出が
(a)電解質または血液タンパクの濃度の算出に先立って作成された、電解質濃度と緩和時間に基づく分布関数の検量線と、前記特徴量から推定された、緩和時間に基づく分布関数に基づき、または
(b)電解質または血液タンパクの濃度の算出に先立って作成された、電解質濃度とパワースペクトル密度降下の検量線と、前記特徴量から推定された、パワースペクトル密度降下に基づき、電解質または血液タンパクの濃度を算出してもよい。
本発明の上記態様によれば、測定されたインピーダンスに基づいて、皮膚特定層の各層分離し、皮膚内部の状態を把握することが可能な皮膚内部計測装置を提供できる。
(第1実施形態)
以下、図面を参照し、本発明の第一実施形態に係る皮膚内部計測装置を説明する。以下の説明で用いる図面は、特徴をわかりやすくするために便宜上特徴となる部分を拡大して示している場合があり、各構成要素の寸法比率などは実際とは異なっていることがある。以下の説明において例示される材料、寸法等は一例であって、本発明はそれらに限定されるものではなく、本発明の効果を奏する範囲で適宜変更して実施することが可能である。図1に示すように、皮膚内部計測装置100は、電流電圧印加測定部10及び濃度分布測定部50を備える。濃度分布測定部50は、皮膚特定層分離部51、分布関数推定部52、検量線比較部53および出力部54を備える。
以下、図面を参照し、本発明の第一実施形態に係る皮膚内部計測装置を説明する。以下の説明で用いる図面は、特徴をわかりやすくするために便宜上特徴となる部分を拡大して示している場合があり、各構成要素の寸法比率などは実際とは異なっていることがある。以下の説明において例示される材料、寸法等は一例であって、本発明はそれらに限定されるものではなく、本発明の効果を奏する範囲で適宜変更して実施することが可能である。図1に示すように、皮膚内部計測装置100は、電流電圧印加測定部10及び濃度分布測定部50を備える。濃度分布測定部50は、皮膚特定層分離部51、分布関数推定部52、検量線比較部53および出力部54を備える。
皮膚内部計測装置100の濃度分布測定部50は、例えば、Central Processing Unit(CPU),Read Only Memory(ROM)、Random Access Memory(RAM)及びHard Disk Drive(HDD)/Solid State Drive(SSD)を備える。皮膚特定層分離部51、分布関数推定部52、検量線比較部53および出力部54は、CPUにおいて、所定のプログラムを実行することで実現される。プログラムは、記録媒体経由で取得してもよく、ネットワーク経由で取得してもよい。また、皮膚内部計測装置100の構成を実現するための専用のハードウェア構成を用いてもよい。なお、後述する濃度分布測定部50A、50Bも濃度分布測定部50と同様の構成であってもよい。以下、各部について説明する。
(電流電圧印加測定部)
電流電圧印加測定部10について、図2を用いて説明する。図2に示すように、電流電圧印加測定部10は、センサ20と制御部30とを備える。センサ20は、互いに間隔を空けて皮膚に配置可能な複数の電極21(一例として電極数Q=4として図示)と、電極21を保持する支持体25とを備える。電流電圧印加測定部10は、センサ20を有し、センサ20の電極21が被測定者の皮膚に接触した状態で、各電極21間に所定の電流または電位差を印加し、電位差または電流を測定する。ここで、電位差とは二つの電極間の電圧の差を表す。電流を印加する場合は、あらかじめ決めた電流印加電圧測定パターン(多数ある電極から二つずつの電極を順番に選び、電流を印加し順次電位差を測定するパターン)に基づき、電位差を測定する。このとき、位相(印加電流と測定電位差との時間的なずれ)も測定することが望ましい。電位差を印加する場合は、あらかじめ決めた電圧印加電流測定パターン(多数ある電極から二つずつの電極を順番に選び、電位差を印加し順次電流を測定するパターン)に基づき、電流を測定する。このとき、位相(印加電位差と測定電流との時間的なずれ)も測定することが好ましい。以後、電流を印加する場合を中心に記載し、電位差を印加する場合の詳細な記載を省略する場合もある。ここで、電極21の数Qは例えば、3以上である。電極21の数Qは8以上が好ましい。電極21の数Qは32個以下が好ましい。電極21の数Qは、16個以下であってもよい。濃度分布の精度を高めるために電極の数は多いほうが好ましい。電極21の配置位置は、特に限定されない。例えば、直線状に電極を配置してもよいし、2次元的または3次元的に電極を配置してもよい。
電流電圧印加測定部10について、図2を用いて説明する。図2に示すように、電流電圧印加測定部10は、センサ20と制御部30とを備える。センサ20は、互いに間隔を空けて皮膚に配置可能な複数の電極21(一例として電極数Q=4として図示)と、電極21を保持する支持体25とを備える。電流電圧印加測定部10は、センサ20を有し、センサ20の電極21が被測定者の皮膚に接触した状態で、各電極21間に所定の電流または電位差を印加し、電位差または電流を測定する。ここで、電位差とは二つの電極間の電圧の差を表す。電流を印加する場合は、あらかじめ決めた電流印加電圧測定パターン(多数ある電極から二つずつの電極を順番に選び、電流を印加し順次電位差を測定するパターン)に基づき、電位差を測定する。このとき、位相(印加電流と測定電位差との時間的なずれ)も測定することが望ましい。電位差を印加する場合は、あらかじめ決めた電圧印加電流測定パターン(多数ある電極から二つずつの電極を順番に選び、電位差を印加し順次電流を測定するパターン)に基づき、電流を測定する。このとき、位相(印加電位差と測定電流との時間的なずれ)も測定することが好ましい。以後、電流を印加する場合を中心に記載し、電位差を印加する場合の詳細な記載を省略する場合もある。ここで、電極21の数Qは例えば、3以上である。電極21の数Qは8以上が好ましい。電極21の数Qは32個以下が好ましい。電極21の数Qは、16個以下であってもよい。濃度分布の精度を高めるために電極の数は多いほうが好ましい。電極21の配置位置は、特に限定されない。例えば、直線状に電極を配置してもよいし、2次元的または3次元的に電極を配置してもよい。
電極21は、電気的に制御部30と接続される。被測定者の皮膚に電流または電位差を印加できれば、電極21の材質や形状は特に限定されない。電極21の材質としては、例えば、Au、Ag、Cu、ステンレスなどの金属、導電性高分子、表面を金属で被覆した繊維、導電性高分子で表面を被覆した繊維などが挙げられる。電極21を皮膚に接触させるために電流印加方向に対して垂直な面における電極21の形状は特に限定されないが、例えば、円形、多角形状である。電極21は非侵襲的電極であることが好ましい。
電極21の配置は、電極21の大きさと電極21間距離に基づく電磁気シミュレーションを用いて、角質層、表皮層、真皮層からなる皮膚特定層内の皮膚モデルを用いて、決定してもよい。例えば、電流印加方向に対して垂直な面における電極の形状が円形である場合は直径となるが、例えば、電極21の形状が四角形状や多角形状の場合は、円相当直径としてもよい。電極21の大きさと電極21間の距離は、角質層、表皮層(角質層を除く)、真皮層、および脂肪層からなる皮膚の異なる皮膚特定層の識別に影響する。電極の直径および距離を最適化することで、電解質濃度・血液たんぱく濃度の有意な分布を含む目的の皮膚特定層のみの電流密度に影響を及ぼす。
電極21の大きさ(円相当直径)は、例えば、0.2mm~2.0mmである。より好ましくは、0.4mm~1.2mmである。電極21の大きさが0.2mm~2.0mmであれば、皮膚特定層内の電解質濃度・血液たんぱく濃度分布(例えば、ナトリウム・イオン濃度分布)をより正確に可視化計測することができる。ここで濃度分布とは、一次元時空間、二次元時空間、三次元時空間、四次元時空間(例えば三次元空間と時間)などを表現する用語として用い、濃度と濃度分布とは用語上では特に区別はしていない。
電極21間の距離は、例えば、0.5mm~3.0mmである。より好ましくは、1.8mm~2.6mmである。電極21間の距離が0.5mm~3.0mmであれば、皮膚特定層内の電解質濃度・血液たんぱく濃度分布(例えばナトリウム・イオン濃度分布など)をより正確に可視化計測することができる。電極21間の距離は、電極21の中心間距離である。電極21の中心は、例えば、電流印加方向に対して垂直な面において、電極21を内包する最小包含円の中心としてもよい。
電極21と制御部30との電気的な接続方法は、特に限定されない。接続方法としては、例えば、リード線で電極21と制御部30とを接続してもよい。
支持体25は、電極21を保持可能であれば、特に限定されない。支持体25は、被測定者の皮膚の表面形状に沿って変形できることが好ましい。皮膚の表面形状に沿って変形することで、電極21と被測定者との密着性が向上し、より正確に電流または電位差を印加し、電位差または電流を測定することができる。支持体25の材質としては、例えば、エラストマーなどの誘電体が好ましい。支持体25としては例えば、プリント基板である。支持体25の形状は、特に限定されないが、例えば、シート状、板状などが挙げられる。
(制御部)
制御部30は、例えば、電流を印加する電流印加電極(または電位差を印加する電圧印加電極)と電位差を測定する電圧測定電極(または電流を測定する電流測定電極)の切り替えを行うためのマルチプレクサ、電圧測定(または電流測定)と位相測定を行うインピーダンスアナライザなどを備える。インピーダンスアナライザとは、印加周波数と振幅を変化させて、インピーダンス、すなわち、測定電位差(印加電位差)と印加電流(測定電流)の比、および、その位相とを測定する部品である。制御部30は、例えば、CPUにおいて、所定のプログラムを実行し、マルチプレクサおよびインピーダンスアナライザを制御することで、インピーダンス測定(電位差と電流の比、およびその位相の測定)を行う。電流電圧印加測定部10内部だけで制御部30を制御し、インピーダンス測定を行ってもよいし、濃度分布測定部50で実行されたプログラムに応じて制御部30を制御し、インピーダンス測定を行ってもよい。インピーダンス測定の結果は、濃度分布測定部50に送られる。濃度分布測定部50への情報の伝達方法は特に限定されない。制御部30から有線で濃度分布測定部50に送ってもよいし、その他の伝達手段により、濃度分布測定部50に送ってもよい。
制御部30は、例えば、電流を印加する電流印加電極(または電位差を印加する電圧印加電極)と電位差を測定する電圧測定電極(または電流を測定する電流測定電極)の切り替えを行うためのマルチプレクサ、電圧測定(または電流測定)と位相測定を行うインピーダンスアナライザなどを備える。インピーダンスアナライザとは、印加周波数と振幅を変化させて、インピーダンス、すなわち、測定電位差(印加電位差)と印加電流(測定電流)の比、および、その位相とを測定する部品である。制御部30は、例えば、CPUにおいて、所定のプログラムを実行し、マルチプレクサおよびインピーダンスアナライザを制御することで、インピーダンス測定(電位差と電流の比、およびその位相の測定)を行う。電流電圧印加測定部10内部だけで制御部30を制御し、インピーダンス測定を行ってもよいし、濃度分布測定部50で実行されたプログラムに応じて制御部30を制御し、インピーダンス測定を行ってもよい。インピーダンス測定の結果は、濃度分布測定部50に送られる。濃度分布測定部50への情報の伝達方法は特に限定されない。制御部30から有線で濃度分布測定部50に送ってもよいし、その他の伝達手段により、濃度分布測定部50に送ってもよい。
制御部30は、あらかじめ決めた電流印加電圧測定パターン(どの電極間に電流を印加し、どの電極間に電位差を測定するかのパターン)に基づき、各電極21間に電流を印加し、電位差を測定する。または、制御部30は、あらかじめ決めた電圧印加電流測定パターンに基づき、各電極21間に電位差を印加し、電流を測定する。制御部30は、センサ20内の電極間の距離が異なる2組以上の電極対を用いて電流および位相または電位差および位相を測定する。電流を印加する場合、同様に電位差を印加する場合も、どの電極21間に電流(電位差)を印加し、どの電極間で電位差(電流)を測定するかについては、特に限定されない。電流印加電圧測定パターンの数Mは、各電流印加電圧測定パターンで異なる印加する電流値とその印加周波数は、生体への影響や装置の簡便性を鑑みて、例えば、1.0mA以下で、1Hz帯から1,000MHz帯程度までの交流が好ましい。
濃度分布測定部50は、電流電圧印加測定部10で測定した電位差または電流に対し、差分処理を行うことで、皮膚内部の特定層の電解質濃度分布および血液タンパク濃度分布の少なくとも一方を計測(可視化計測)する。電解質としては、例えば、ナトリウム・イオン(ソディウム・イオン)、カリウム・イオン、マグネシウム・イオン、カルシウム・イオン、クロール・イオンなどが挙げられる。血液タンパクとしては、アルブミン、αグロブリン、βグロブリン、γグロブリン、フィブリノゲンなどが挙げられる。濃度分布測定部50は、皮膚特定層分離部51、濃度算出部60、および出力部54を備える。濃度算出部60は、分布関数推定部52、検量線比較部53を備える。以下、各部について説明する。
(皮膚特定層分離部)
皮膚特定層分離部51は、電流電圧印加測定部10で測定した電位差および位相または電流および位相に対し、差分処理を行うことで、差分データを算出する。具体的には、皮膚特定層分離部51は、測定された2つのインピーダンスの差分処理を行うことにより、皮膚特定層内のインピーダンスである差分データである対象インピーダンスを算出する。差分データは、分布関数推定部52に送られる。ここで、皮膚特定層は、角質層、表皮層、真皮層、脂肪組織層などである。当該2つのインピーダンス測定値は、異なる電極21間距離のインピーダンスである。具体的には、測定されるインピーダンスの1つが、電極21間の電場中心線が対象とする皮膚特定層(対象皮膚特定層)を通って測定されるインピーダンスであり、測定されるもう1つのインピーダンスが電極21間の電場中心線が対象皮膚特定層を除く皮膚特定層を通って測定されるインピーダンスである。電極21の距離は対象とする皮膚特定層に応じて、適宜設定することができる。
皮膚特定層分離部51は、電流電圧印加測定部10で測定した電位差および位相または電流および位相に対し、差分処理を行うことで、差分データを算出する。具体的には、皮膚特定層分離部51は、測定された2つのインピーダンスの差分処理を行うことにより、皮膚特定層内のインピーダンスである差分データである対象インピーダンスを算出する。差分データは、分布関数推定部52に送られる。ここで、皮膚特定層は、角質層、表皮層、真皮層、脂肪組織層などである。当該2つのインピーダンス測定値は、異なる電極21間距離のインピーダンスである。具体的には、測定されるインピーダンスの1つが、電極21間の電場中心線が対象とする皮膚特定層(対象皮膚特定層)を通って測定されるインピーダンスであり、測定されるもう1つのインピーダンスが電極21間の電場中心線が対象皮膚特定層を除く皮膚特定層を通って測定されるインピーダンスである。電極21の距離は対象とする皮膚特定層に応じて、適宜設定することができる。
皮膚特定層分離部51の差分処理の効果について次に説明する。図3は、電極が接触した状態での電極と皮膚の構成を示す図である。図4は、電極21の接触抵抗と皮膚特定層(角質層、表皮層(角質層を除く)、真皮層、脂肪層)を1対のRCとして6パラメータの等価回路を仮定して作成した図3の等価回路である。図3では、電極21間の電場中心線(EFCL)を模擬的に非直線的に記している。ここで、角質層と表皮層の容量成分をCs,eとし、角質層と表皮層の抵抗成分をRs,eとし、真皮層の容量成分をCdとし、および、真皮層の抵抗成分をRdとしている。図4の電気的等価回路の大きさの影響を受けて、印加電流は皮膚特定層内を浸透する。
電極21径φと最適な電極間距離dにより、EFCLが目的の皮膚特定層を通過しやすくなるため、目的の皮膚特定層の電気的情報をより詳細に得ることができる。皮膚特定層の電気的情報は、センサ10の各電極21間に電流又は電圧を印加し、電圧又は電流を測定し、それらの値からインピーダンスを求めることができる。各特定層の厚さは、例えば、角質層hs、表皮層(角質層を除く)he、真皮層hd、および脂肪層haで表される。電極1~3(e1、e2、およびe3)の右端電極はアース電極として設定される。左端電極と中央電極には交流周波数fの定電流を印加し、左端電極とアース電極間(遠方電極間)、および、中央電極とアース電極間(近方電極間)の電位差を測定する。例えば、皮膚特定層の中でも真皮層に注目したいときには、真皮層の情報が載った対象インピーダンスΔZ(f)は、EFCLが真皮層を浸透する遠方電極間のインピーダンスZ1(f)と、EFCLが角質層と表皮層のみを浸透する近方電極間のインピーダンスZ2(f)との差となる。具体的には、下記(1)式で表される。このΔZ(f)は、Z1(f)とZ2(f)との寄生成分が除去されるため、皮膚特定層のインピーダンスを精度高く抽出できる。なお(f)は印加周波数の関数であることを示す。

濃度算出部60は、差分データである対象インピーダンスΔZ(f)を用いて、特定層内の電解質濃度および血液たんぱく質濃度と相関する導電率、誘電率、および位相のうち少なくとも1つを算出する。濃度算出部60は、対象インピーダンスから分布関数γ(lnτ)を推定する分布関数推定部52と、分布関数推定部52で推定された推定分布関数γ^(lnτ)から、電解質濃度および血液タンパク濃度の少なくとも一方を算出する検量線比較部とを備えてもよい。
(分布関数推定部)
分布関数推定部52は、差分データである対象インピーダンスΔZ(f)から分布関数γ(lnτ)を推定する。対象インピーダンスΔZ(f)を直接解析して、特定層内の電解質濃度および血液たんぱく質濃度に強く反応する特定の印加周波数f(またはfの逆数である緩和時間τ)を推定してもよいが、分布関数γ(lnτ)を用いて推定することにより、その特定層内の電解質濃度および血液たんぱく質濃度に強く反応する特定の印加周波数f(またはfの逆数である緩和時間τ)を容易に求めることができる。以下、分布関数推定部52の分布関数の推定方法について説明する。推定された分布関数は、検量線比較部53に送られる。
分布関数推定部52は、差分データである対象インピーダンスΔZ(f)から分布関数γ(lnτ)を推定する。対象インピーダンスΔZ(f)を直接解析して、特定層内の電解質濃度および血液たんぱく質濃度に強く反応する特定の印加周波数f(またはfの逆数である緩和時間τ)を推定してもよいが、分布関数γ(lnτ)を用いて推定することにより、その特定層内の電解質濃度および血液たんぱく質濃度に強く反応する特定の印加周波数f(またはfの逆数である緩和時間τ)を容易に求めることができる。以下、分布関数推定部52の分布関数の推定方法について説明する。推定された分布関数は、検量線比較部53に送られる。
印加周波数fの定電流を印加したときの、皮膚表面で測定されたインピーダンスZ(f)(上付き文字は省略しているが、Z(f)は、(1)式のZ1(f)またはZ2(f)に相当する)は、皮膚特定層内の緩和時間τ、無限高周波の抵抗R∞、分布関数γ(lnτ)を用いて、下記(2)式で表される。式(2)において、jは虚数単位であり、lnは底eの対数を示す。この(2)式からZ(f)が既知で、分布関数γ(lnτ)を求める問題は、数学的な不適切逆問題と呼ばれており、多くのアルゴリズムが開発されており、公知のアルゴリズムを用いることができる。本実施形態では、正規化最小二乗、代数再構成、ベイズ推定などの手法を用いることができる。なお、以上と以降の式の説明で用いられるインピーダンスは、(1)式のZ1(f)またはZ2(f)に相当するインピーダンスでもよいし、対象インピーダンスΔZ(f)としてもよい。すなわち、ΔZ(f)から不適切逆問題を解いて、分布関数γ(lnτ)を推定してもよいし、Z1(f)とZ2(f)から不適切逆問題を解いて、それぞれのZ1(f)とZ2(f)に対応する分布関数γ1(lnτ)とγ2(lnτ)を推定してから、それらを引き算してもよい。
分布関数γ(lnτ)は、M個(1≦m≦M)の既知である基底関数gm(lnτ)と、M個(1≦m≦M)の未知であるフィッティング・パラメータθmとを用いて、下記(3)式で表す。フィッティング・パラメータθmは、m番目の基底関数gmの振幅を調整するパラメータでM個の要素を持つ。フィッティング・パラメータの数と基底関数の数を表すMは、特に限定されるものではないが、例えば10から100程度の数である。前述の分布関数γ(lnτ)を推定するということは、この未知であるフィッティング・パラメータθmを、不適切逆問題を解いて求めることを意味する。
基底関数gm(lnτ)は、例えば下記(4)式などの緩和時間τを関数としたガウス基底関数などの放射状基底関数を用いて表すことができる。図5は基底関数の数M=3(Mは変数mの最大値)のときの基底関数gm(lnτ)の例である。ここでτは変数であるが、τm(m=1,2,3)は既知の設定する値であり、lnτmはm番目のガウス基底関数の中心値を示し、σ2は分散値を示す。
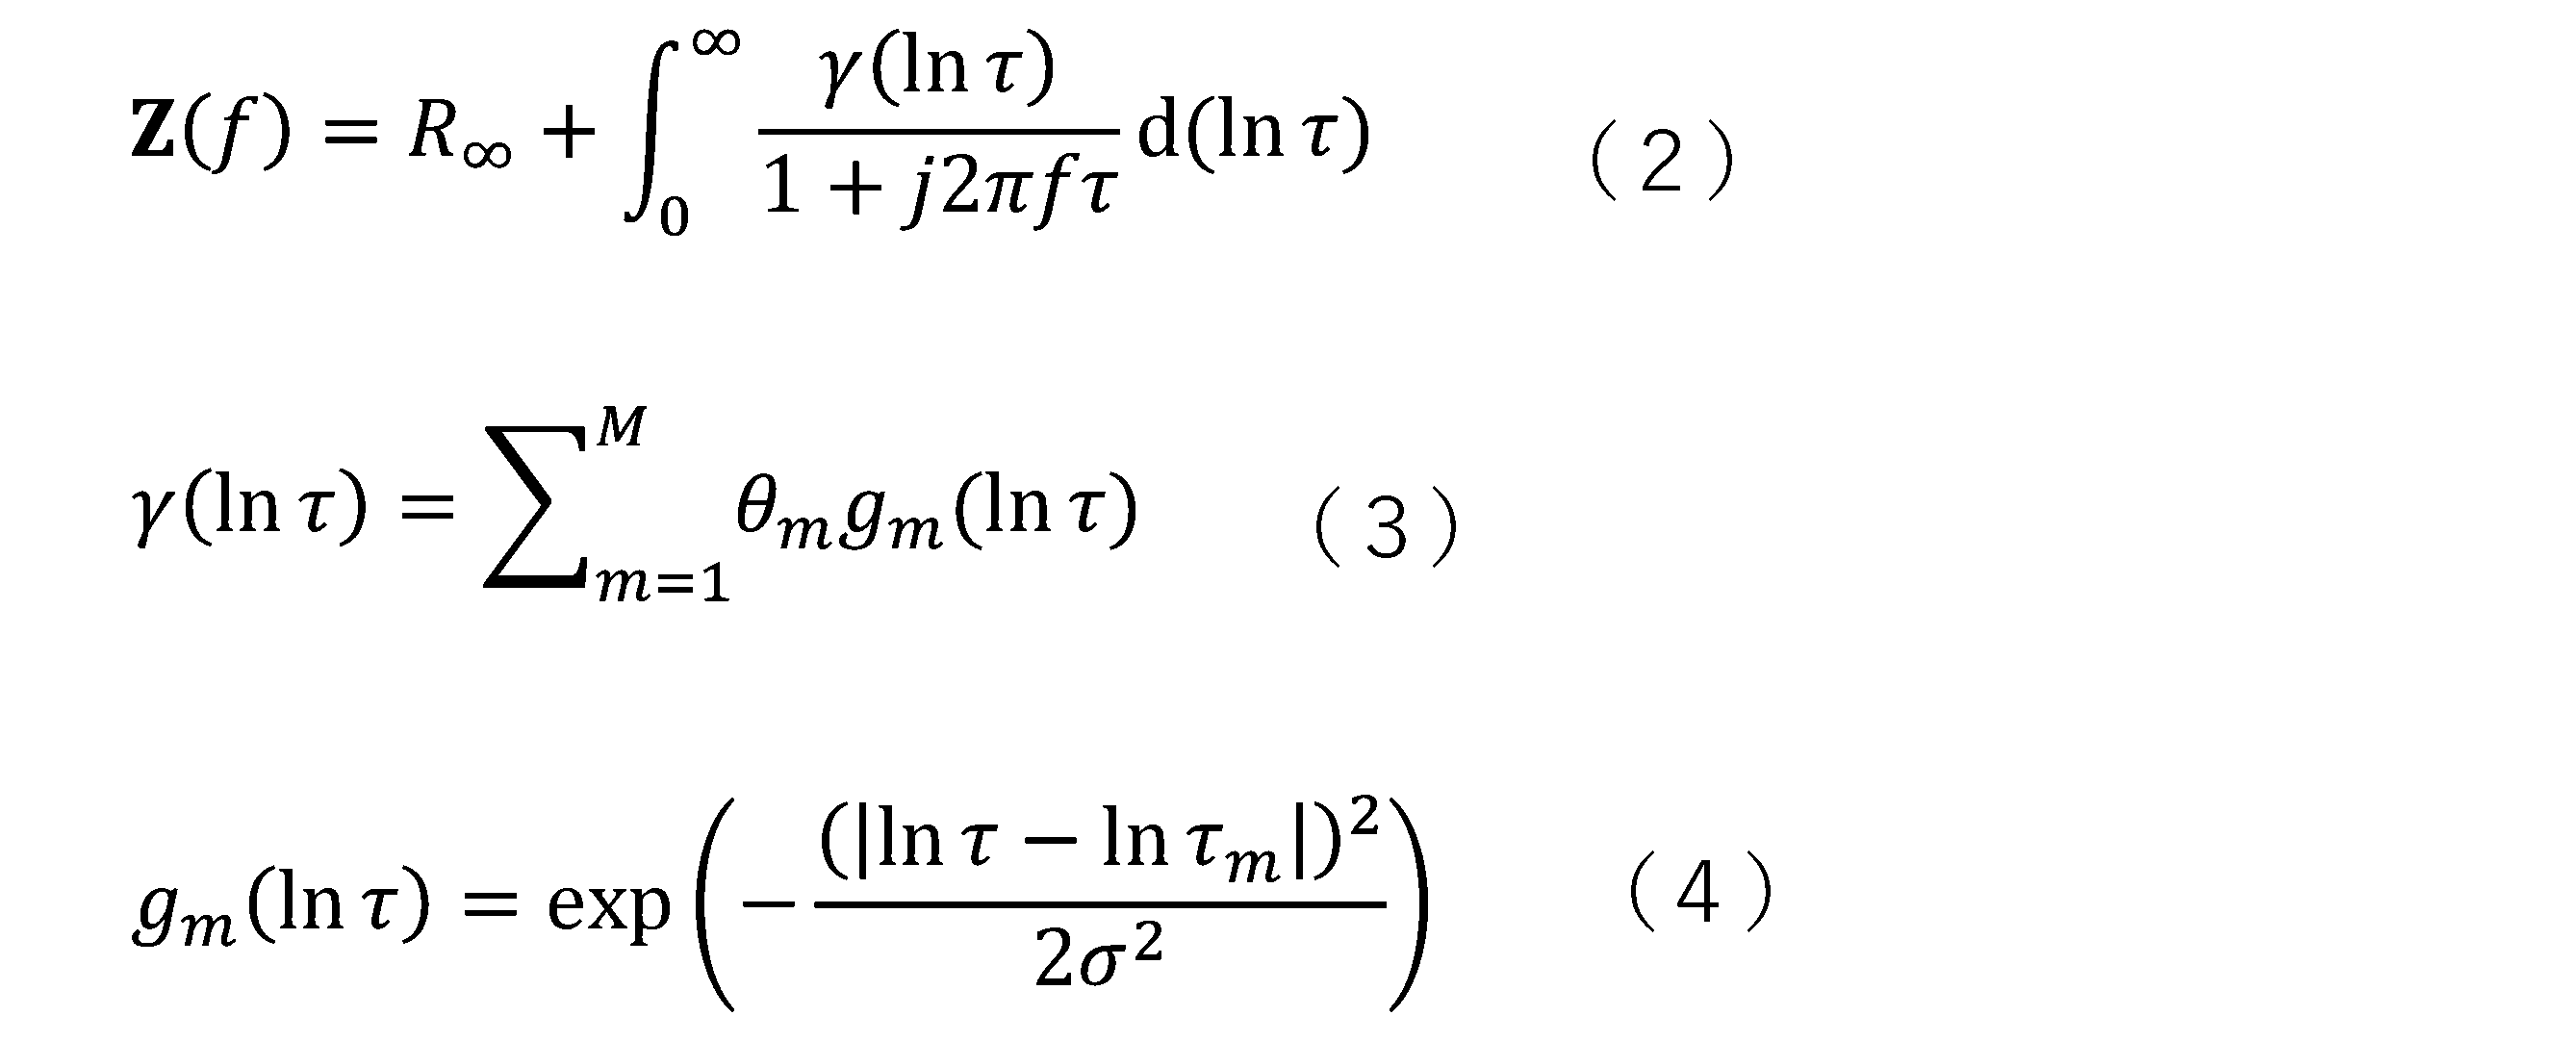
式(4)を式(3)に代入し、それをさらに式(2)に代入すると、式(2)のインピーダンスZ(f)は、未知のフィッティング・パラメータθmと既知の基底関数gm(lnτ)とから、下記(6)式で表される。このインピーダンスを実数成分Zreと虚数成分Zimに分解すると実数成分Zreと虚数成分Zimは、下記(7)式および(8)式で表される。実際に、この未知であるフィッティング・パラメータθmを、不適切逆問題を解いて求める場合には、下記(5)式で表す通り、M個の要素を持った列ベクトルで表記したフィッティング・パラメータ・ベクトルθを用いてもよく、ここで、(5)式中のTは転置を示す。
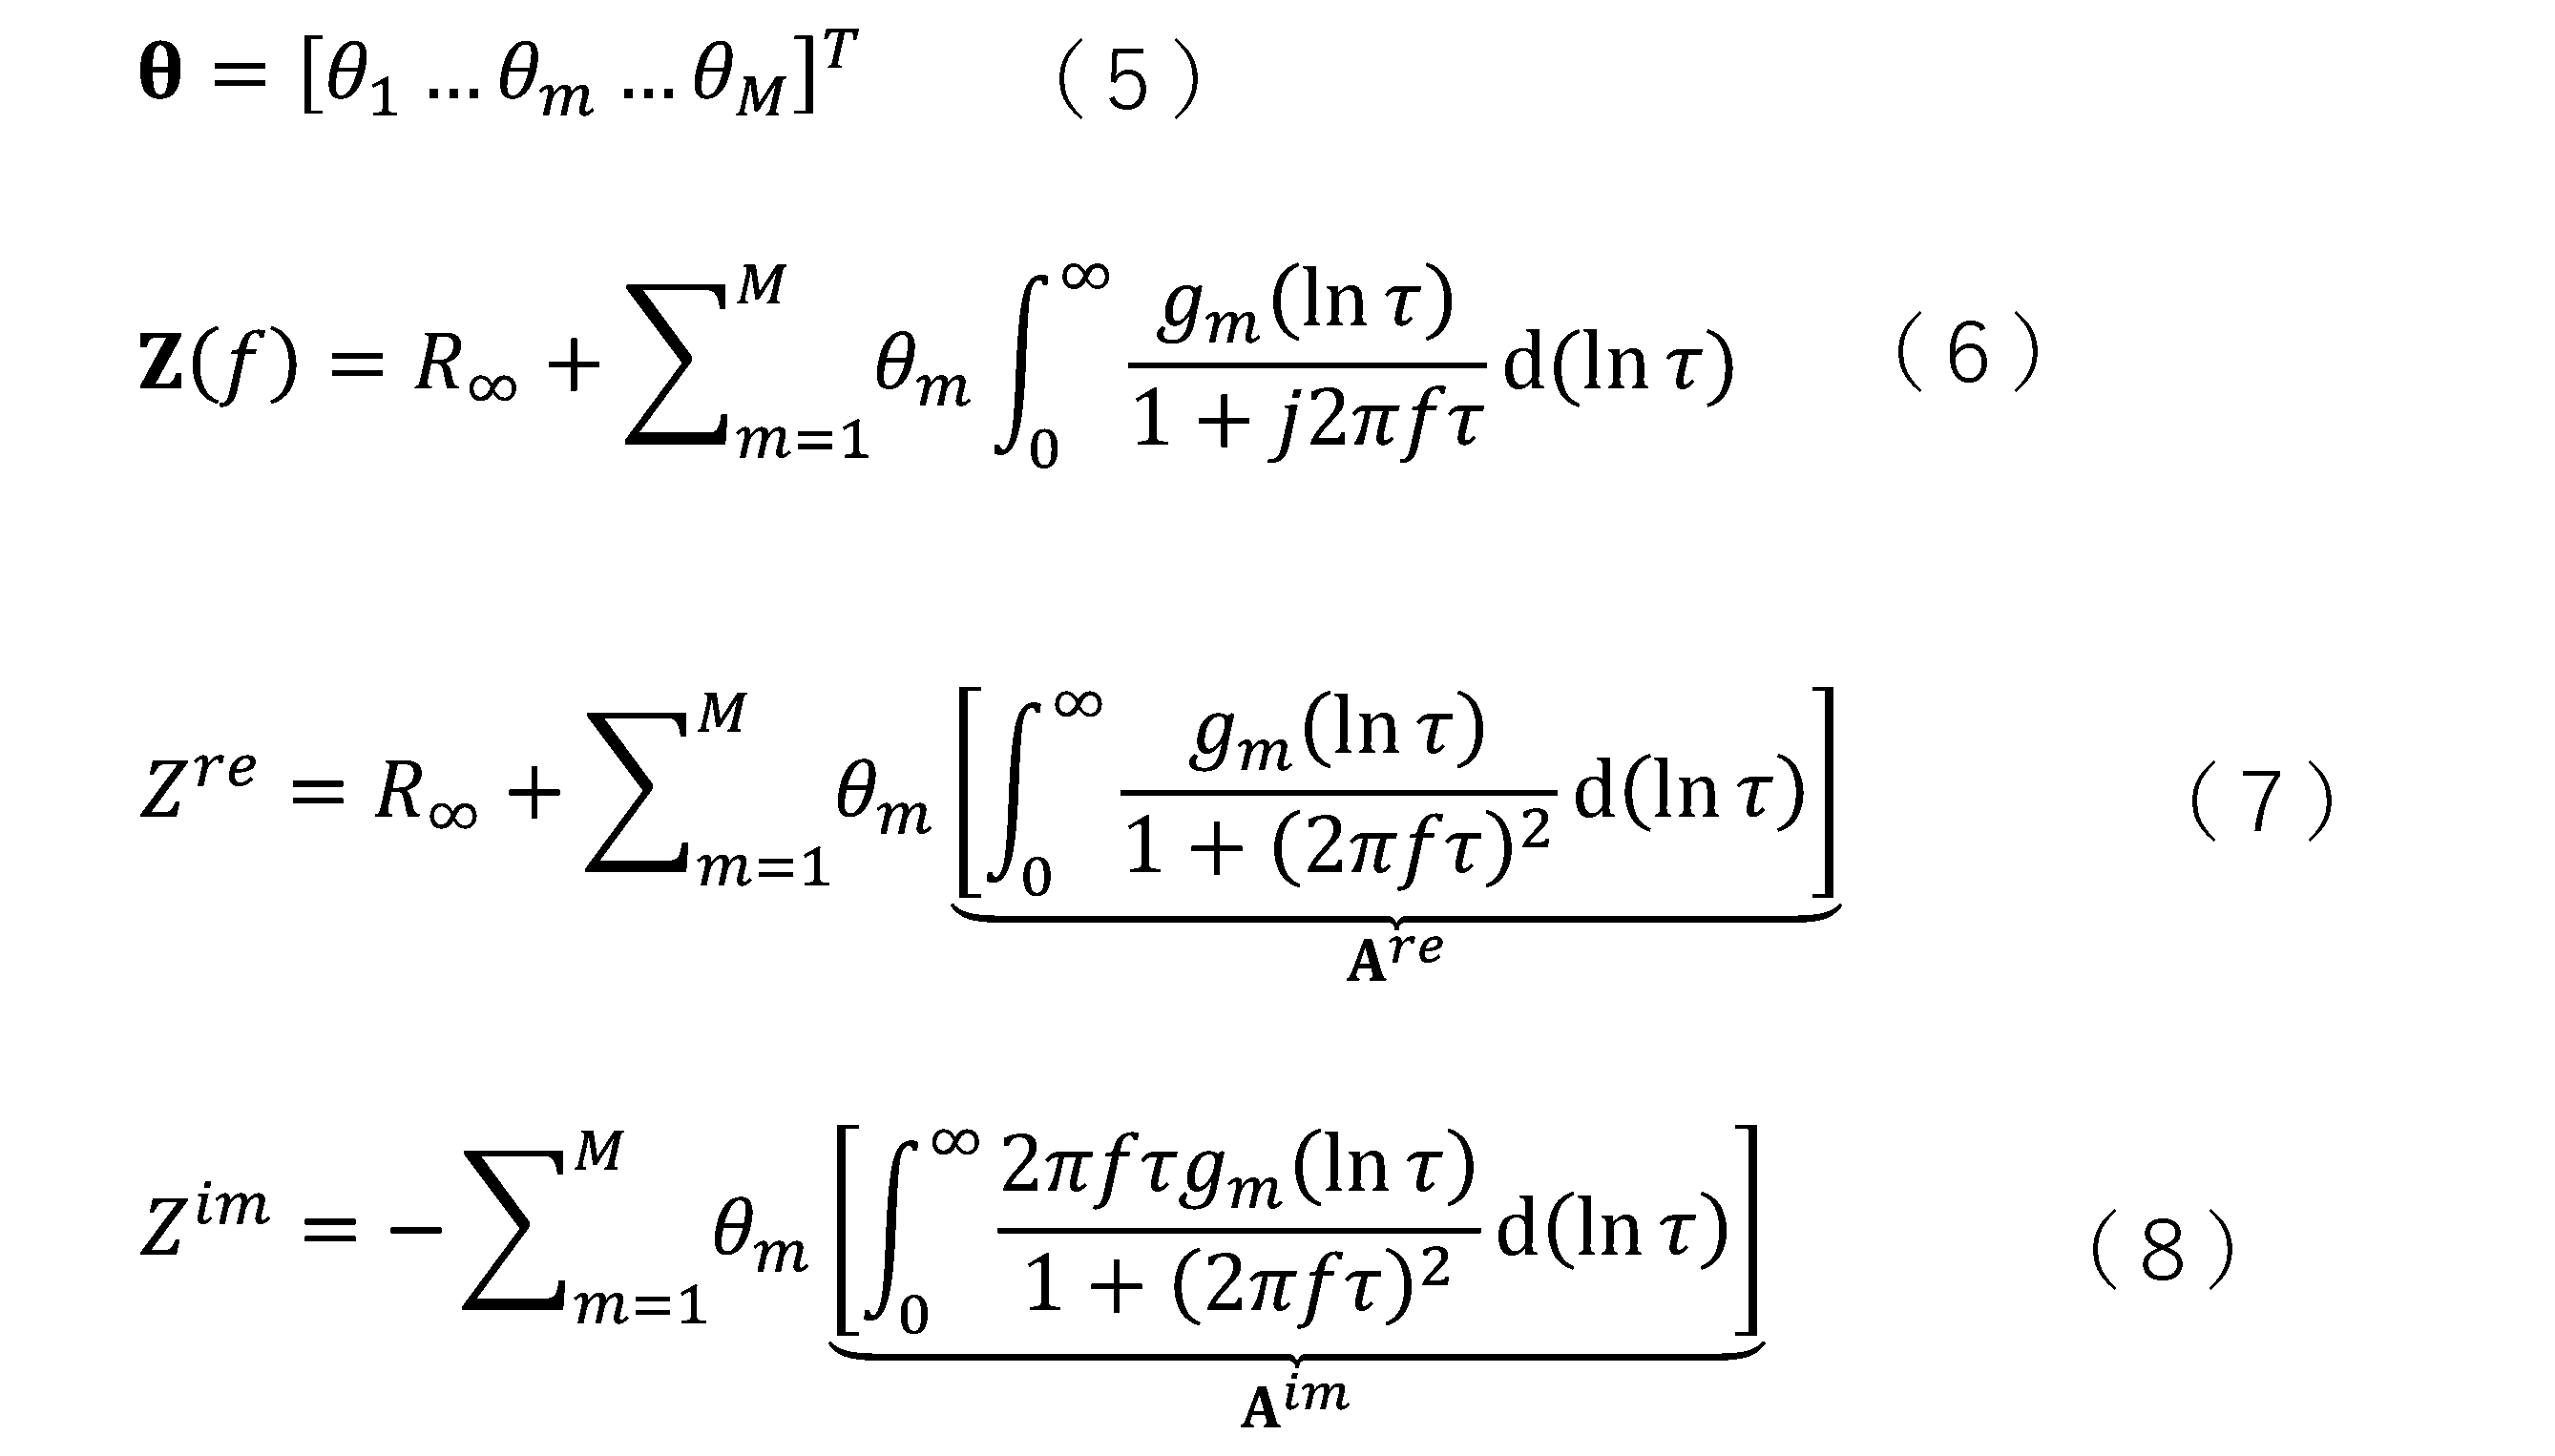
不適切逆問題を解いて求めたフィッティング・パラメータ・ベクトル、すなわち、最適フィッティング・パラメータ・ベクトルθ*の求め方を説明する。ここでは、印加周波数fを印加周波数の個数と定義し直してf(=1,・・・,F)個の印加周波数を用いるので、上記の実数成分Zreと虚数成分Zimは、F個の要素を持った列ベクトルで表記することができ、インピーダンス実数成分ベクトルを下記(9)式で表し、虚数成分ベクトルを下記(10)式で表す。さらに、上記の実数成分Zreの積分の中をAre、虚数成分Zimの積分の中をAimとおいて、M個の基底関数に対応させるためにF行M列の行列で表記し実数成分を下記(11)式で表し、虚数成分を下記(12)式で表すことができる。
最適フィッティング・パラメータ・ベクトルθ*の求め方として、例えば、リッジ回帰(L2正則化を施した線形回帰)を用いることができる。リッジ回帰を用いた場合、フィッティング・パラメータ・ベクトルθを関数としたコスト関数L(θ)=誤差項(損失関数)+正則化項(ペナルティ項))は、下記(13)式で表される。ここで、λは正則化パラメータ(ハイパーパラメータ)(λ>0)である。(13)式において||と下付きの2はL2ノルム、上付き2は2乗、1∈RFは1を要素に持つ列ベクトルである。最適フィッティング・パラメータ・ベクトルθ*は、L(θ)を用い下記(14)式により求めることができる。下記(14)式において、argminはL(θ)を最小にするフィッティング・パラメータ・ベクトルθを求めることを意味する。例えば、M=17のとき図6の通り、θ*を求めることができる。

θ*を求めた後は、そのθ*を式(3)に代入して得られる推定分布関数γ^(lnτ) を求める。このγの上についている^は、最適フィッティング・パラメータ・ベクトルθ*により得られる推定分布関数を示す。図7は、この推定分布関数γ^(lnτ)の一例で、対応する緩和時間τの中心に極大値を持ち、それぞれが緩和時定数τi=RiCiによって定義される並列RC回路の直列ネットワークを示したものである。すなわち、この推定分布関数γ^(lnτ)の3つのピークの横軸の緩和時間τは、それぞれの皮膚特定層内の電解質濃度および血液タンパク濃度に対応し、例えば、3番目のピークは真皮層内の電解質濃度に強く対応し、1番目のピークは真皮層内の血液タンパク濃度に強く対応する。前述の通り、皮膚特定層内のどの層の状態を可視化計測したいかは、電極21径φと最適な電極間距離dが影響し、どの種類の電解質濃度および血液タンパク濃度を可視化計測したいかは、ピーク位置の緩和時間τが影響する。
(検量線比較部)
検量線比較部53は、分布関数推定部52で推定された推定分布関数γ^(lnτ)から、電解質濃度および血液タンパク濃度の少なくとも一方を算出する。具体的には、対象とする成分の含有量と当該成分の含有量に対応する推定分布関数γ^(lnτ)とを予め取得し、検量線を作成する。この作成した検量線と分布関数推定部52で推定された推定分布関数γ^(lnτ)とから、対象成分(電解質、血液タンパクなど)の濃度を算出する。図8(a)は、既知の塩化ナトリウム水溶液濃度cを変えた水溶液を、生体を模擬した真皮層に注入し、真皮層が高感度となる電極配置として、測定したインピーダンスから推定された分布関数の一例である。図8(b)は変化のあった一番右のピークを拡大した結果である。この例では、真皮層(3番目のピーク)内の塩化ナトリウム水溶液濃度を10mM~30mMと増加させると(理論的にナトリウム・イオンが比例的に増加すると)、ピークの強度が減少することが分かる。図8(c)は、図8(b)の推定分布関数γ^のピークトップの値と、既知の塩化ナトリウム水溶液濃度とから検量線を作成した結果である。このように、検量線を予め作成しておくことで、推定分布関数γ^から皮膚特定層の電解質濃度・血液たんぱく濃度を検出し、対象とする成分の濃度分布を得ることができる。ここで、求めたい皮膚特定層内の電解質濃度および血液タンパク濃度と、既知の水溶液濃度とは、電離度や解離度が1ではない場合は異なるので、この検量線は電離度や解離度などを用いて補正してもよい。この例では、皮膚特定層内の真皮層を例にしたが、他の皮膚特定層内においても同様に検量線を作ることができる。
検量線比較部53は、分布関数推定部52で推定された推定分布関数γ^(lnτ)から、電解質濃度および血液タンパク濃度の少なくとも一方を算出する。具体的には、対象とする成分の含有量と当該成分の含有量に対応する推定分布関数γ^(lnτ)とを予め取得し、検量線を作成する。この作成した検量線と分布関数推定部52で推定された推定分布関数γ^(lnτ)とから、対象成分(電解質、血液タンパクなど)の濃度を算出する。図8(a)は、既知の塩化ナトリウム水溶液濃度cを変えた水溶液を、生体を模擬した真皮層に注入し、真皮層が高感度となる電極配置として、測定したインピーダンスから推定された分布関数の一例である。図8(b)は変化のあった一番右のピークを拡大した結果である。この例では、真皮層(3番目のピーク)内の塩化ナトリウム水溶液濃度を10mM~30mMと増加させると(理論的にナトリウム・イオンが比例的に増加すると)、ピークの強度が減少することが分かる。図8(c)は、図8(b)の推定分布関数γ^のピークトップの値と、既知の塩化ナトリウム水溶液濃度とから検量線を作成した結果である。このように、検量線を予め作成しておくことで、推定分布関数γ^から皮膚特定層の電解質濃度・血液たんぱく濃度を検出し、対象とする成分の濃度分布を得ることができる。ここで、求めたい皮膚特定層内の電解質濃度および血液タンパク濃度と、既知の水溶液濃度とは、電離度や解離度が1ではない場合は異なるので、この検量線は電離度や解離度などを用いて補正してもよい。この例では、皮膚特定層内の真皮層を例にしたが、他の皮膚特定層内においても同様に検量線を作ることができる。
(出力部)
出力部54は、検量線比較部53から送られてきた電解質濃度および血液タンパク濃度の少なくとも一方を出力する。出力先は、液晶ディスプレイのような表示部であってもよいし、HDDのような記憶装置であってもよい。
出力部54は、検量線比較部53から送られてきた電解質濃度および血液タンパク濃度の少なくとも一方を出力する。出力先は、液晶ディスプレイのような表示部であってもよいし、HDDのような記憶装置であってもよい。
以上、第1実施形態に係る皮膚内部計測装置100について説明した。上記の説明では、皮膚特定層分離部51が、電流電圧印加測定部10で測定した電位差および位相または電流および位相に対し、差分処理を行うことで、差分データを算出し、分布関数推定部52が、差分データから分布関数γ(lnτ)を推定したが、本発明はこれに限定されない。分布関数推定部52が測定した電位差または電流に基づき、複数の分布関数γ(lnτ)を推定し、皮膚特定層分離部51が、推定された複数の分布関数(例えば、2つの分布関数)に対して差分処理を行うことで、差分推定関数を得てもよい。
(第2実施形態)
次に、本発明に係る第2実施形態の皮膚内部計測装置100Aを、図9を参照して説明する。
なお、この第2実施形態においては、第1実施形態における構成要素と同一の部分については同一の符号を付し、その説明を省略し、異なる点についてのみ説明する。
次に、本発明に係る第2実施形態の皮膚内部計測装置100Aを、図9を参照して説明する。
なお、この第2実施形態においては、第1実施形態における構成要素と同一の部分については同一の符号を付し、その説明を省略し、異なる点についてのみ説明する。
図9に示すように、皮膚内部計測装置100Aは、電流電圧印加測定部10A及び濃度分布測定部50を備える。濃度分布測定部50Aは、皮膚特定層分離部51A、濃度算出部60Aおよび出力部54を備える。
(電流電圧印加測定部10A)
第2実施形態の電流電圧印加測定部10Aは、第1実施形態の電流電圧印加測定部10と同じ構成である。
第2実施形態において、制御部30は、矩形波電流または矩形波電圧を皮膚と接触した電極に印加し、電位差または電流を測定する。ここでは、第1実施形態と同様に電極1~3(e1、e2、およびe3)の右端電極はアース電極として設定され、左端電極と中央電極には交流周波数fの定電流を印加し、左端電極とアース電極間(遠方電極間、電極間距離2d)、および、中央電極とアース電極間(近方電極間、電極間距離1d)の電圧を測定する場合を例に挙げて説明する。
矩形波印加電流i(t)は、直接矩形波を生成してもよいし、フーリエ級数を用いて生成することができ、それは例えば、下記(15)式で表すことができる。ここで、式(15)のfswは生成する矩形波印加電流の周波数を示し、(2m-1)は高調波次数、mは自然数、Mは高調波の最大数で、Mを無限とすれば完全なる矩形波が生成される。(15)式から、矩形波印加電流のスペクトルには、第1次(m=1)、第3次(m=2)、(m=3)などの奇数次の高調波信号2π(2m-1)fが含まれる。矩形波を用いる利点は測定するうえで効率が良いことが挙げられ、その理由は、ひとつの矩形波には数多くの周波数を持つサイン波とコサイン波が含まれているからである。すなわち、フーリエ級数(多数の周波数をもつサイン波とコサイン波)を用いて矩形波を生成できることは、その所以である。皮膚特定層は各皮膚特定層の周波数応答の特性が異なる。例えば、表皮層(角質層を除く)は0Hz~10Hz、真皮層は10Hz~1kHz、脂肪層組織は100Hz~10kHzで観察できる。矩形波は様々な周波数成分を含むので、各皮膚特定層の状態を把握しやすくなる。
第2実施形態の電流電圧印加測定部10Aは、第1実施形態の電流電圧印加測定部10と同じ構成である。
第2実施形態において、制御部30は、矩形波電流または矩形波電圧を皮膚と接触した電極に印加し、電位差または電流を測定する。ここでは、第1実施形態と同様に電極1~3(e1、e2、およびe3)の右端電極はアース電極として設定され、左端電極と中央電極には交流周波数fの定電流を印加し、左端電極とアース電極間(遠方電極間、電極間距離2d)、および、中央電極とアース電極間(近方電極間、電極間距離1d)の電圧を測定する場合を例に挙げて説明する。
矩形波印加電流i(t)は、直接矩形波を生成してもよいし、フーリエ級数を用いて生成することができ、それは例えば、下記(15)式で表すことができる。ここで、式(15)のfswは生成する矩形波印加電流の周波数を示し、(2m-1)は高調波次数、mは自然数、Mは高調波の最大数で、Mを無限とすれば完全なる矩形波が生成される。(15)式から、矩形波印加電流のスペクトルには、第1次(m=1)、第3次(m=2)、(m=3)などの奇数次の高調波信号2π(2m-1)fが含まれる。矩形波を用いる利点は測定するうえで効率が良いことが挙げられ、その理由は、ひとつの矩形波には数多くの周波数を持つサイン波とコサイン波が含まれているからである。すなわち、フーリエ級数(多数の周波数をもつサイン波とコサイン波)を用いて矩形波を生成できることは、その所以である。皮膚特定層は各皮膚特定層の周波数応答の特性が異なる。例えば、表皮層(角質層を除く)は0Hz~10Hz、真皮層は10Hz~1kHz、脂肪層組織は100Hz~10kHzで観察できる。矩形波は様々な周波数成分を含むので、各皮膚特定層の状態を把握しやすくなる。
濃度分布測定部50Aは、電流電圧印加測定部10Aで測定した電位差および位相または電流および位相に対し、差分処理を行うことで、皮膚内部の特定層の電解質濃度分布および血液タンパク濃度分布の少なくとも一方を計測(可視化計測)する。濃度分布測定部50Aは、皮膚特定層分離部51A、パワースペクトル降下算出部55、検量線比較部53A、および出力部54を備える。以下、各部について説明する。
(皮膚特定層分離部)
皮膚特定層分離部51Aは、電流電圧印加測定部10Aで測定した電位差および位相または電流および位相に対し、差分処理を行うことで、差分データを算出する。第2実施形態では、矩形波電流を印加し、電位差および位相を測定した場合に説明する。ここで、近方電極間(電極間距離1d)におけるv2は、主に角質層アドミッタンスYsと表皮層アドミッタンスYeに影響され、遠方電極間(電極間距離2d)でのv1は、主に角質層アドミッタンスYs、表皮層アドミッタンスYeおよび真皮層アドミッタンスYdに影響されると仮定している。
皮膚特定層分離部51Aは、電流電圧印加測定部10Aで測定した電位差および位相または電流および位相に対し、差分処理を行うことで、差分データを算出する。第2実施形態では、矩形波電流を印加し、電位差および位相を測定した場合に説明する。ここで、近方電極間(電極間距離1d)におけるv2は、主に角質層アドミッタンスYsと表皮層アドミッタンスYeに影響され、遠方電極間(電極間距離2d)でのv1は、主に角質層アドミッタンスYs、表皮層アドミッタンスYeおよび真皮層アドミッタンスYdに影響されると仮定している。
皮膚特定層分離部51Aは、差分データとしてv1とv2の差し引きである電圧降下Δvを計算する。図10は、矩形波印加電流および電位差測定における矩形波印加電流i(t)、遠方電極間の測定電圧v1、近方電極間の測定電圧v2、v1とv2との差Δvの一例を示したものである。図10の横軸は時間(μs)、縦軸は電位差(V)である。計算された差分データである電圧降下ΔVは、濃度算出部60Aに送られる。
(濃度算出部)
濃度算出部60Aは、差分データを用いて、特定層内の電解質濃度および血液たんぱく質濃度と相関する導電率、誘電率、および位相のうち少なくとも1つを算出する。濃度算出部60Aは、差分データからパワースペクトル降下ΔPを計算するパワースペクトル降下算出部55と、パワースペクトル降下算出部55で算出されたパワースペクトル降下ΔPから、電解質濃度および血液タンパク濃度の少なくとも一方を算出する検量線比較部53Aとを備える。
濃度算出部60Aは、差分データを用いて、特定層内の電解質濃度および血液たんぱく質濃度と相関する導電率、誘電率、および位相のうち少なくとも1つを算出する。濃度算出部60Aは、差分データからパワースペクトル降下ΔPを計算するパワースペクトル降下算出部55と、パワースペクトル降下算出部55で算出されたパワースペクトル降下ΔPから、電解質濃度および血液タンパク濃度の少なくとも一方を算出する検量線比較部53Aとを備える。
(パワースペクトル降下算出部55)
パワースペクトル降下算出部55は、差分データからパワースペクトル降下ΔPを計算する。
遠方電極間の測定電圧v1(t)と近方電極間の測定電圧v2(t)の差Δv(t)に対して、フーリエ変換を施すと下記(16)式となる。高調波次数でのパワースペクトル密度(PSD)は下記(17)式となる。ここでNは電圧サンプリング数であり、PSDは高調波次数(2m-1)の関数となる。
パワースペクトル降下算出部55は、差分データからパワースペクトル降下ΔPを計算する。
遠方電極間の測定電圧v1(t)と近方電極間の測定電圧v2(t)の差Δv(t)に対して、フーリエ変換を施すと下記(16)式となる。高調波次数でのパワースペクトル密度(PSD)は下記(17)式となる。ここでNは電圧サンプリング数であり、PSDは高調波次数(2m-1)の関数となる。

高調波次数の増加に伴い信号強度は降下する。印加電流周波数と高調波次数の成分を解析する。ここで、高調波次数の正確な振幅を計算するために、高速フーリエ変換出力を信号長さで除して信号パワーを正規化し2倍にしてもよい。
次に、パワースペクトル密度降下(PSDd) ΔPの求め方について説明する。図11は、パワースペクトル降下算出部55による計算されたパワースペクトル密度(PSD)降下の一例を示したものである。横軸は周波数(kHz)、縦軸はパワースペクトル密度(V2/Hz)である。
この図11において、第1次と第3次の高調波信号の差をΔPとする。ΔPは、高速フーリエ変換(FFT)の高調波次数のPの大きさによって決まり、その大きさは、皮膚特定層内の電解質濃度分布・血液たんぱく濃度分布に依存する。即ち、パワースペクトル密度降下ΔPを求めることで、皮膚特定層内の電解質濃度分布・血液たんぱく濃度分布を算出することができる。得られたパワースペクトル密度降下ΔPは、検量線比較部53Aに送られる。
次に、パワースペクトル密度降下(PSDd) ΔPの求め方について説明する。図11は、パワースペクトル降下算出部55による計算されたパワースペクトル密度(PSD)降下の一例を示したものである。横軸は周波数(kHz)、縦軸はパワースペクトル密度(V2/Hz)である。
この図11において、第1次と第3次の高調波信号の差をΔPとする。ΔPは、高速フーリエ変換(FFT)の高調波次数のPの大きさによって決まり、その大きさは、皮膚特定層内の電解質濃度分布・血液たんぱく濃度分布に依存する。即ち、パワースペクトル密度降下ΔPを求めることで、皮膚特定層内の電解質濃度分布・血液たんぱく濃度分布を算出することができる。得られたパワースペクトル密度降下ΔPは、検量線比較部53Aに送られる。
(検量線比較部53A)
検量線比較部53Aは、パワースペクトル降下算出部55から送られてきたパワースペクトル密度降下ΔPに基づいて、皮膚特定層内の電解質および血液たんぱく質濃度の少なくとも一方を算出する。図12は電解質濃度c(図12は塩化ナトリウム濃度)とパワースペクトル密度降下ΔPとの関係の例を示したものである。図12の横軸は電解質濃度(mM)であり、縦軸はパワースペクトル密度降下ΔP[-]である。図12に示すように電解質濃度cとパワースペクトル密度降下ΔPとの間には高い相関があるため、第1実施形態と同様に予め検量線を作成することで、皮膚特定層内の電解質濃度を算出することができる。
検量線比較部53Aは、パワースペクトル降下算出部55から送られてきたパワースペクトル密度降下ΔPに基づいて、皮膚特定層内の電解質および血液たんぱく質濃度の少なくとも一方を算出する。図12は電解質濃度c(図12は塩化ナトリウム濃度)とパワースペクトル密度降下ΔPとの関係の例を示したものである。図12の横軸は電解質濃度(mM)であり、縦軸はパワースペクトル密度降下ΔP[-]である。図12に示すように電解質濃度cとパワースペクトル密度降下ΔPとの間には高い相関があるため、第1実施形態と同様に予め検量線を作成することで、皮膚特定層内の電解質濃度を算出することができる。
例えば、真皮層の導電率は、異なる周波数Pfsinでパワースペクトル密度を使用して分析される。これは、角質層が高周波注入で浸透可能であり、真皮層が低周波数であるためである。矩形波応答として、例えば、低周波数はfsin=fswの1次高調波でPfによって表され、高周波数はfsin=3fsw3次高調波でPfsinによって表される。
(第3実施形態)
次に、本発明に係る第3実施形態の皮膚内部計測装置100Bを、図13を参照して説明する。
なお、この第2実施形態においては、第1実施形態および第2実施形態における構成要素と同一の部分については同一の符号を付し、その説明を省略し、異なる点についてのみ説明する。
次に、本発明に係る第3実施形態の皮膚内部計測装置100Bを、図13を参照して説明する。
なお、この第2実施形態においては、第1実施形態および第2実施形態における構成要素と同一の部分については同一の符号を付し、その説明を省略し、異なる点についてのみ説明する。
図13に示すように、皮膚内部計測装置100Bは、電流電圧印加測定部10B及び濃度分布測定部50を備える。濃度分布測定部50Bは、皮膚特定層分離部51B、電気物性分布算出部56および出力部54を備える。
(電流電圧印加測定部10B)
電流電圧印加測定部10Bについて、図14を用いて説明する。図14に示すように、電流電圧印加測定部10Bは、センサ20Bと制御部30Bとを備える。センサ20Bは、互いに間隔を空けて皮膚に配置可能な複数の電極21(電極数Q)を備える。電流電圧印加測定部10Bは、センサ20Bの電極21が被測定者の皮膚に接触した状態で、各電極21間に所定の電流または電位差を印加し、電位差または電流を測定する。電流を印加する場合は、あらかじめ決めた電流印加電圧測定パターン(多数ある電極から二つずつの電極を順番に選び、電流を印加し順次電位差を測定するパターン)に基づき、電位差を測定する。このとき、位相(印加電流と測定電位差との時間的なずれ)も測定することが望ましい。電位差を印加する場合は、あらかじめ決めた電圧印加電流測定パターン(多数ある電極から二つずつの電極を順番に選び、電位差を印加し順次電流を測定するパターン)に基づき、電流を測定する。このとき、位相(印加電位差と測定電流との時間的なずれ)も測定することが好ましい。以後、電流を印加する場合を中心に記載し、電位差を印加する場合の詳細な記載を省略する場合もある。ここで、第3実施形態において、電極21の数Qは8以上が好ましい。電極21の数Qは16以上であることがより好ましい。
電流電圧印加測定部10Bについて、図14を用いて説明する。図14に示すように、電流電圧印加測定部10Bは、センサ20Bと制御部30Bとを備える。センサ20Bは、互いに間隔を空けて皮膚に配置可能な複数の電極21(電極数Q)を備える。電流電圧印加測定部10Bは、センサ20Bの電極21が被測定者の皮膚に接触した状態で、各電極21間に所定の電流または電位差を印加し、電位差または電流を測定する。電流を印加する場合は、あらかじめ決めた電流印加電圧測定パターン(多数ある電極から二つずつの電極を順番に選び、電流を印加し順次電位差を測定するパターン)に基づき、電位差を測定する。このとき、位相(印加電流と測定電位差との時間的なずれ)も測定することが望ましい。電位差を印加する場合は、あらかじめ決めた電圧印加電流測定パターン(多数ある電極から二つずつの電極を順番に選び、電位差を印加し順次電流を測定するパターン)に基づき、電流を測定する。このとき、位相(印加電位差と測定電流との時間的なずれ)も測定することが好ましい。以後、電流を印加する場合を中心に記載し、電位差を印加する場合の詳細な記載を省略する場合もある。ここで、第3実施形態において、電極21の数Qは8以上が好ましい。電極21の数Qは16以上であることがより好ましい。
図14は複数の電極21を一列に配置した例である。複数の電極21は皮膚上面に一列に配置してもよいし、2次元的に配置してもよい。複数の電極21を一列に配置した場合は電極21のうち、左端電極(図14の例ではe1)と右端電極(図14の例ではeE)との間の長さを直径とした皮膚深さ方向の半円の2次元領域を画像対象領域(Region of Interest)とし、皮膚特定層の2次元画像を得ることができる。また、複数の電極21を2次元的に配置した場合は、皮膚表面内における電極21の外端電極を直径とした皮膚深さ方向の半球の3次元領域を画像対象領域(Region of Interest)とし、皮膚特定層の3次元画像を得ることができる。それらの画像の物理量としては、皮膚特定層内の導電率分布、誘電率分布、および位相分布のうち1種以上である。
(制御部)
制御部30Bは、例えば、電流を印加する電流印加電極(または電位差を印加する電圧印加電極)と電位差を測定する電圧測定電極(または電流を測定する電流測定電極)の切り替えを行うためのマルチプレクサ、電圧測定(または電流測定)と位相測定を行うインピーダンスアナライザなどを備える。インピーダンスアナライザとは、印加周波数と振幅を変化させて、インピーダンス、すなわち、測定電位差(印加電位差)と印加電流(測定電流)の比、および、その位相とを測定する部品である。制御部30Bは、例えば、CPUにおいて、所定のプログラムを実行し、マルチプレクサおよびインピーダンスアナライザを制御することで、インピーダンス測定(電位差と電流の比、およびその位相の測定)を行う。電流電圧印加測定部10B内部だけで制御部30Bを制御し、インピーダンス測定を行ってもよいし、濃度分布測定部50Bで実行されたプログラムに応じて制御部30Bを制御し、インピーダンス測定を行ってもよい。インピーダンス測定の結果は、濃度分布測定部50Bに送られる。濃度分布測定部50Bへの情報の伝達方法は特に限定されない。制御部30Bから有線で濃度分布測定部50Bに送ってもよいし、濃度分布測定部50Bに送ってもよい。
制御部30Bは、例えば、電流を印加する電流印加電極(または電位差を印加する電圧印加電極)と電位差を測定する電圧測定電極(または電流を測定する電流測定電極)の切り替えを行うためのマルチプレクサ、電圧測定(または電流測定)と位相測定を行うインピーダンスアナライザなどを備える。インピーダンスアナライザとは、印加周波数と振幅を変化させて、インピーダンス、すなわち、測定電位差(印加電位差)と印加電流(測定電流)の比、および、その位相とを測定する部品である。制御部30Bは、例えば、CPUにおいて、所定のプログラムを実行し、マルチプレクサおよびインピーダンスアナライザを制御することで、インピーダンス測定(電位差と電流の比、およびその位相の測定)を行う。電流電圧印加測定部10B内部だけで制御部30Bを制御し、インピーダンス測定を行ってもよいし、濃度分布測定部50Bで実行されたプログラムに応じて制御部30Bを制御し、インピーダンス測定を行ってもよい。インピーダンス測定の結果は、濃度分布測定部50Bに送られる。濃度分布測定部50Bへの情報の伝達方法は特に限定されない。制御部30Bから有線で濃度分布測定部50Bに送ってもよいし、濃度分布測定部50Bに送ってもよい。
制御部30Bは、あらかじめ決めた電流印加電圧測定パターン(どの電極間に電流を印加し、どの電極間に電位差を測定するかのパターン)に基づき、各電極21間に電流を印加し、電位差を測定する。または、制御部30Aは、あらかじめ決めた電圧印加電流測定パターンに基づき、各電極21間に電位差を印加し、電流を測定する。電流を印加する場合、同様に電位差を印加する場合も、どの電極21間に電流(電位差)を印加し、どの電極間で電位差(電流)を測定するかについては、特に限定されない。制御部30Bは、センサ20内の電極間距離が異なる2組以上の電極対を用いて電流および位相または前記電位差および位相を測定する。測定の方式としては、例えば、2端子法、3端子法、4端子法、および、4端子準隣接法などが挙げられる。
ここでは、4端子準隣接法について説明する。図15は、電極21の数が16の場合における4端子準隣接法の測定パターンである。図15のように、4端子準隣接法では、電流印加する電極21のペア(電流印加電極対)および電位差を測定する電極21のペア(電位差測定電極対)と少なくとも1つが互いに隣接するように、測定する。図15の場合は、電極数Qが16であるので、電流印加電極対のうちの1つの電極(電流選択電極)の選択方法は、全部で16通りある。また、この選択した電流選択電極に隣接する電位差測定電極対のうちの1つを同様に隣接する電極(電位差選択電極)として選択する。この電位差選択電極は、電流選択電極を変更するまで変更しない。電位差は、電流印加電極対(例えば、第1電極および第4電極)を除外した電流印加電極対に隣接する電位差測定電極対(例えば第2電極および第3電極)で測定する。測定後、電流印加電極対のもう一つの電極を1つずらし(例えば、第4電極から第16電極に向かって1つずらす)、かつ隣接する電位差測定電極対のもう1つの電極の位置も電流印加電極対のもう1つの電極に隣接する位置に変える。これを電流印加電極対の電極の1つが選択した電極の1つ前の電極までずらして測定する。そのため、1つの電流選択電極につき13通りの測定パターンが存在する。したがって、4端子準隣接法では、測定数(測定パターン)Mは、全部で208通りとなる。第2実施形態と同様に矩形波電流などを印加してもよい。
(皮膚特定層分離部)
皮膚特定層分離部51Bは、電流電圧印加測定部10Bで測定した電位差および位相または電流および位相に対し、差分処理を行うことで、差分データを算出する。皮膚特定層内の電流の浸透深度は、測定電極間距離dvと関係があり、皮膚特定層の濃度分布を可視化するためには、皮膚特定層までの電流の浸透深度が必要不可欠である。測定電極間距離dvが狭すぎると、電流が一方の電極から他方の電極へ直線的に流れることになり、深い位置にある皮膚特定層のインピーダンス情報が得られにくくなる。一方、測定電極間距離dvが皮膚特定層の深さより大きいと、電流が皮下脂肪層に多く流れてしまい、皮膚特定層のインピーダンス情報が得られにくくなる。第3実施形態では、皮膚特定層分離部51Bは、空間的電圧閾値dΓ(SVT)に基づき所定の処理を行い、目的とする皮膚特定層内の対象成分(電解質、血液タンパクなど)の濃度分布の情報が載った電位差(または電流)を増幅し、目的としない皮膚特定層内の情報が載った電位差(または電流)を低減する。ここでは、空間的電圧閾値は電極間距離に基づく閾値であり、電極間距離の関数となる。すなわち、電極間距離に応じて、皮膚特定層内の角質層内、表皮層内、真皮層内、および/または、脂肪層内の対象成分(電解質、血液タンパクなど)の濃度分布に焦点を絞ることが可能である。皮膚特定層分離部51Bは、空間的電圧閾値dΓを用い、電流または電位差に対して所定の処理を行った後の差分データである処理後電流または電位差を電気物性分布算出部56に送る。
皮膚特定層分離部51Bは、電流電圧印加測定部10Bで測定した電位差および位相または電流および位相に対し、差分処理を行うことで、差分データを算出する。皮膚特定層内の電流の浸透深度は、測定電極間距離dvと関係があり、皮膚特定層の濃度分布を可視化するためには、皮膚特定層までの電流の浸透深度が必要不可欠である。測定電極間距離dvが狭すぎると、電流が一方の電極から他方の電極へ直線的に流れることになり、深い位置にある皮膚特定層のインピーダンス情報が得られにくくなる。一方、測定電極間距離dvが皮膚特定層の深さより大きいと、電流が皮下脂肪層に多く流れてしまい、皮膚特定層のインピーダンス情報が得られにくくなる。第3実施形態では、皮膚特定層分離部51Bは、空間的電圧閾値dΓ(SVT)に基づき所定の処理を行い、目的とする皮膚特定層内の対象成分(電解質、血液タンパクなど)の濃度分布の情報が載った電位差(または電流)を増幅し、目的としない皮膚特定層内の情報が載った電位差(または電流)を低減する。ここでは、空間的電圧閾値は電極間距離に基づく閾値であり、電極間距離の関数となる。すなわち、電極間距離に応じて、皮膚特定層内の角質層内、表皮層内、真皮層内、および/または、脂肪層内の対象成分(電解質、血液タンパクなど)の濃度分布に焦点を絞ることが可能である。皮膚特定層分離部51Bは、空間的電圧閾値dΓを用い、電流または電位差に対して所定の処理を行った後の差分データである処理後電流または電位差を電気物性分布算出部56に送る。
図16は空間的電圧閾値(SVT)を用いた処理を説明するための図である。図16(a)は、電位差測定の様子を示し、図16(b)は、閾値dΓに基づく、処理後の電位差を示す。図16の電位差測定電極間の距離dv
mは、測定深度に影響する。ここで、dvmのmは測定番号を意味する。空間的電圧閾値(SVT)dΓは、対象とする皮膚特定層に応じて適宜設定することができる。例えば、真皮層のデータを取得する場合、dvm≦dΓにおいて、測定深度が角質層と表皮層となるように設定する。真皮層のデータを取得する場合dΓは、例えば、1~6mmである。空間的電圧閾値(SVT)は、予め対象となる皮膚特定層内での電解質濃度の影響を調べて、設定することができる。空間的電圧閾値に基づき処理した後の電位差v*
mは、例えば、測定における角質層の高抵抗の影響を低減するために、v~
mの平均値から決定される。v~
mは、下記(18)式で表される電位差の時間平均である。一方、d>dΓの場合は、測定深度が深層部(真皮層や皮下脂肪組織)にあるため、空間的電圧閾値で処理した後v*
mはv~
mと等しくなる。以上をまとめると、空間的電圧閾値で処理した後の電位差(補償電位差)v*
mは下記(19)式で表される。
次に、隣接する各電極間距離dとし、16個の電極21を配置し、印加電極対と測定電極対を用いた4端子法で測定し、各電極間の測定方法として4端子準隣接法を用いた例でついて説明する。より具体的には、各測定番号mにおいて、印加電極対(大電流印加電極ehc
mと小電流印加電極elc
m)に矩形波の定電流を印加し、測定電極対(高電位電極ehp
mと低電位電極elp
m)から測定電位差を測定する。たとえば、高電位電極ehp
mは、整数分割で下記(20)式のようになる。式(20におけるm∈{1,2,…,208}は測定番号である。低電位電極elp
mは、整数分割とモジュラス分割により、下記(21)式のように整理される。電極電圧の距離dv
m(mm)は、ehp
mとelp
mの距離から、下記(22)式のように決定される。
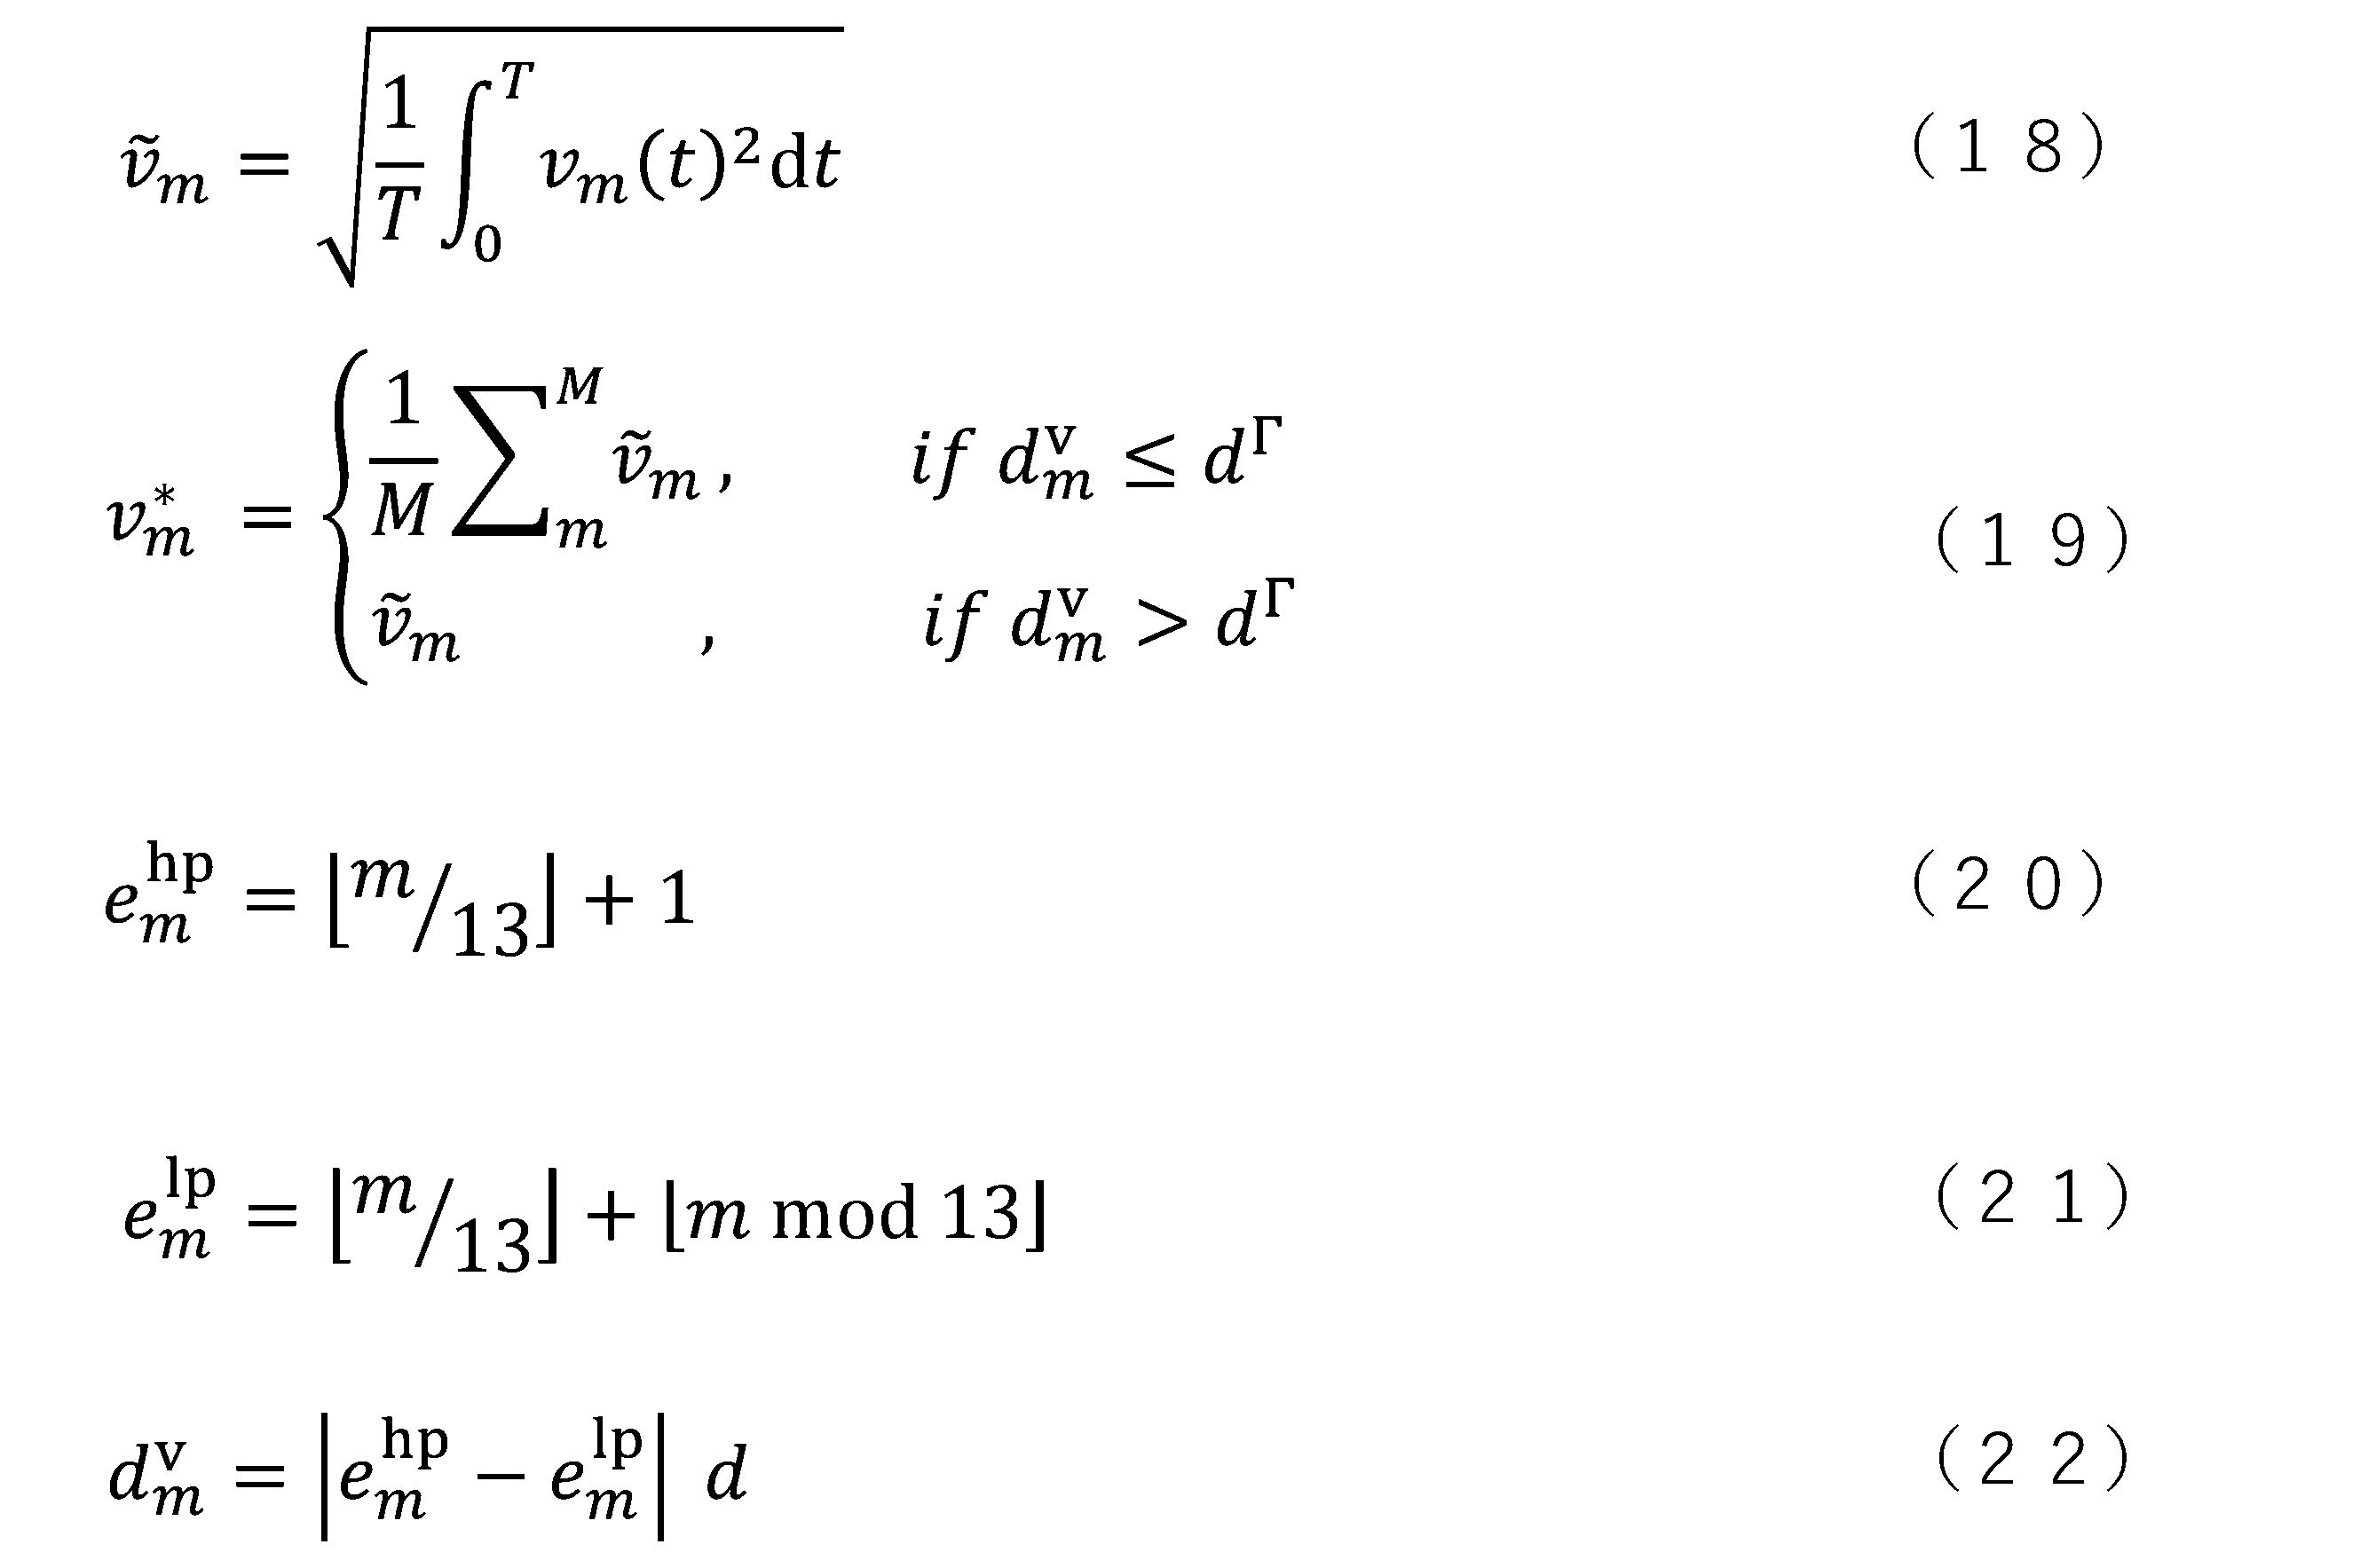
(電気物性分布算出部)
電気物性分布算出部56は、皮膚特定層分離部51Bからおくられた処理後電流または電位差に基づいて、導電率分布、誘電率分布、および位相分布の少なくとも1つを算出する。算出された電気物性分布は、出力部54に送られる。
電気物性分布算出部56は、皮膚特定層分離部51Bからおくられた処理後電流または電位差に基づいて、導電率分布、誘電率分布、および位相分布の少なくとも1つを算出する。算出された電気物性分布は、出力部54に送られる。
図17は画像再構成の一例を示したものである。皮膚領域Ωのナトリウム・イオン濃度分布画像は、下記(23)式で表される導電率分布σに基づいて再構成され、この例では、空間的電圧閾値dΓ(SVT)に基づいた所定の処理により、点線内の真皮層のナトリウム・イオン濃度分布が強調されている。ここで、(23)式中のrnは下記(24)式で表され、皮膚領域ΩをN個のメッシュ要素で分割したときの、n番目(1≦n≦N)のメッシュ要素の空間位置を表す行ベクトルである。
各電極上の電流注入Iと測定電圧vのすべての組み合わせからなるヤコビ行列(感度行列)Jをあらかじめ求めておくことで、皮膚領域Ωの導電率分布σ、誘電率分布、位相分布を求めることができる。例えば、皮膚領域Ωのヤコビ行列Jは、下記(25)式で表される。ここで、mは測定パターン(1≦m≦M)でMは測定パターンの総数、nは空間位置(メッシュ要素)(1≦n≦N)でNは空間分解能のメッシュ総数、Tは転値行列として定義される。m番目の測定パターンにおけるn番目のメッシュ要素のヤコビ行列Jmnは、電位差計測による導電率分布の画像化を例にとると、下記(26)式の2番目の項で定義でき、n番目(1≦n≦N)のメッシュ要素の導電率σnが変化したとき(偏微分記号で表記)のm番目(1≦m≦M)の測定パターンでの測定電位差vmの変化率で定義でき、Jは導電率分布σと測定電位差vとの係数となる。具体的にJは、例えば(26)式の3番目の項で計算することができる。ここで、測定パターンmのときの、電流印加の電極組み合わせをkと表記し、測定電位差の電極組み合わせをlと表記すると、(26)式中のφ(Ik)は、kの電極間に注入された電流Iの影響を受けたn番目のメッシュ要素の電位であり、φ(Il)はlの電極間に仮に電流Iを注入したときのn番目のメッシュ要素の電位であり、∇はナブラ偏微分演算子で、積分記号は皮膚領域Ω全体の積分を示す。ヤコビ行列(感度行列)Jは、対象成分の電解質・血液タンパクに対応して、さらには、印加周波数にも対応して、それぞれ異なったJをあらかじめ用意することで、より精度の高い画像を得ることができる。
各電極上の電流注入Iと測定電圧vのすべての組み合わせからなるヤコビ行列(感度行列)Jをあらかじめ求めておくことで、皮膚領域Ωの導電率分布σ、誘電率分布、位相分布を求めることができる。例えば、皮膚領域Ωのヤコビ行列Jは、下記(25)式で表される。ここで、mは測定パターン(1≦m≦M)でMは測定パターンの総数、nは空間位置(メッシュ要素)(1≦n≦N)でNは空間分解能のメッシュ総数、Tは転値行列として定義される。m番目の測定パターンにおけるn番目のメッシュ要素のヤコビ行列Jmnは、電位差計測による導電率分布の画像化を例にとると、下記(26)式の2番目の項で定義でき、n番目(1≦n≦N)のメッシュ要素の導電率σnが変化したとき(偏微分記号で表記)のm番目(1≦m≦M)の測定パターンでの測定電位差vmの変化率で定義でき、Jは導電率分布σと測定電位差vとの係数となる。具体的にJは、例えば(26)式の3番目の項で計算することができる。ここで、測定パターンmのときの、電流印加の電極組み合わせをkと表記し、測定電位差の電極組み合わせをlと表記すると、(26)式中のφ(Ik)は、kの電極間に注入された電流Iの影響を受けたn番目のメッシュ要素の電位であり、φ(Il)はlの電極間に仮に電流Iを注入したときのn番目のメッシュ要素の電位であり、∇はナブラ偏微分演算子で、積分記号は皮膚領域Ω全体の積分を示す。ヤコビ行列(感度行列)Jは、対象成分の電解質・血液タンパクに対応して、さらには、印加周波数にも対応して、それぞれ異なったJをあらかじめ用意することで、より精度の高い画像を得ることができる。
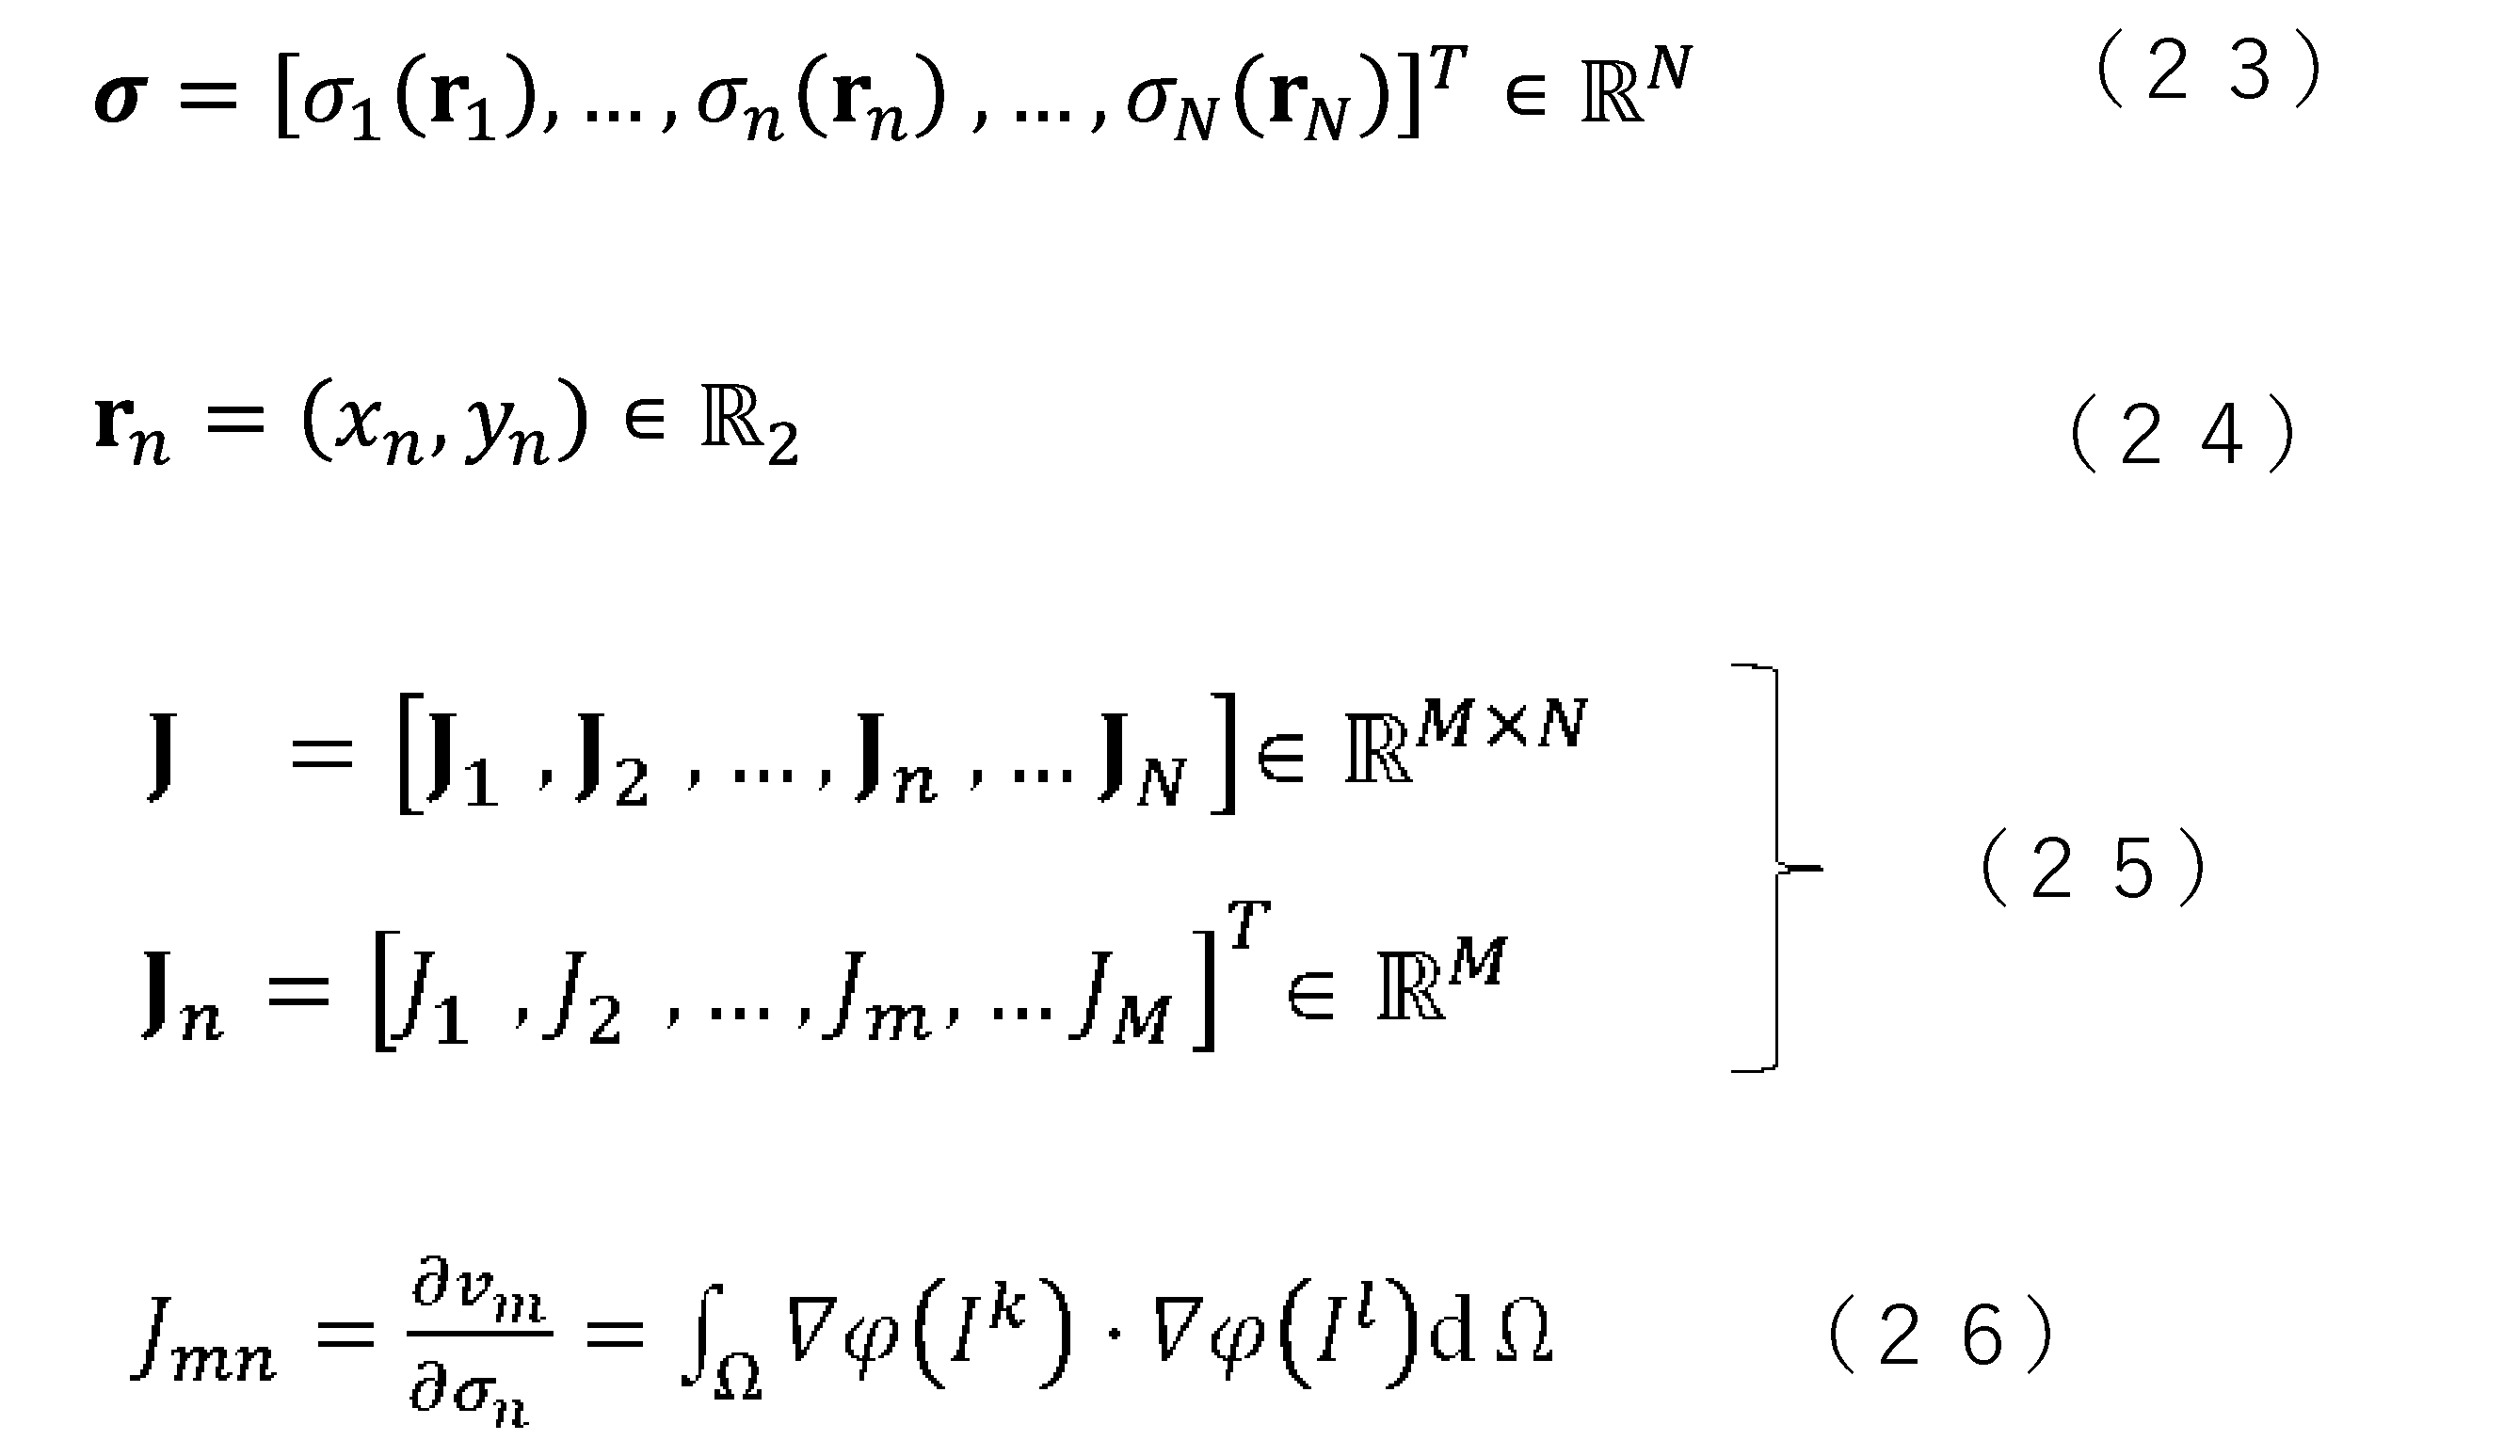
皮膚層の導電率分布は、ガウス・ニュートン法(下記(27)式)を使用して算出する。ここで、(27)式のRは正則化行列、λはLカーブ法(Hansen and O’Leary 1993)によって自動的に決定された緩和係数スカラーである。(27)式中のΔvは、下記(28)式で表される。式(28)のΔvmは皮膚境界形状∂Ω下の正規化測定電圧で、下記(29)式で表される。ここで、vm(0)は初期測定電圧、vm(c)は対象成分濃度cに基づく介在物電圧である。電気物性分布算出部56は、上記で得た対象成分の電気物性分布を出力部54に送る。
(境界処理)
電気物性分布算出部56は、計算された電気物性分布に対し、さらに境界処理を行ってもよい。以下は、境界処理について説明する。
電気物性分布算出部56は、計算された電気物性分布に対し、さらに境界処理を行ってもよい。以下は、境界処理について説明する。
図18は、電磁気シミュレーションで用いる各皮膚特定層の概略図である。図18のhsは角質層の厚さであり、heは表皮層(角質層を除く)の厚さであり、hdは真皮層の厚さであり、haは脂肪組織層の厚さであり、Ωeは表皮層の対象領域を示し、Ωdは真皮層の対象領域を示し、Ωaは脂肪組織層の対象領域を示し、σsは角質層の導電率を示し、εsは角質層の比誘電率を示す。σeは表皮層の導電率を示し、εeは表皮層の比誘電率を示す。σdは真皮層の導電率を示し、εeは真皮層の比誘電率を示す。σaは脂肪組織層の導電率を示し、εaは脂肪組織層の比誘電率を示す。φ(x,y)は、座標(x,y)における電位(ポテンシャル)である。
図18の電極ek(k=1、・・・、E)から印加された電流は、対象領域Ω内で電場Eを生成し、対象領域Ωの電流密度iはi=σEで表される。対象領域Ω内の導電率分布と境界電圧の間の物理的関係は、下記(30)式のマクスウェル方程式から導かれる偏微分方程式によって支配される。電流Iが皮膚表面∂Ω上の電極ek(図18中のe1、e2、・・・、eE)を介して印加される場合、対象領域Ωのポテンシャルφは式(31)から解かれる。例えば、下記(32)~(33)式のノイマン境界条件に基づいて計算することで、電気物性分布をより正確に算出することができる。ここで、nは外側の単位法線ベクトル、∂Ωekは電極境界、dSは対応する電極境界の微小面積要素を表す。

以上、本実施形態に係る皮膚内部計測装置100,100A,100Bについて説明した。
なお、本発明の技術的範囲は前記実施形態に限定されるものではなく、本発明の趣旨を逸脱しない範囲において種々の変更を加えることが可能である。
その他、本発明の趣旨に逸脱しない範囲で、前記実施形態における構成要素を周知の構成要素に置き換えることは適宜可能であり、また、前記した変形例を適宜組み合わせてもよい。
なお、本発明の技術的範囲は前記実施形態に限定されるものではなく、本発明の趣旨を逸脱しない範囲において種々の変更を加えることが可能である。
その他、本発明の趣旨に逸脱しない範囲で、前記実施形態における構成要素を周知の構成要素に置き換えることは適宜可能であり、また、前記した変形例を適宜組み合わせてもよい。
以下、実施例により本発明を説明するが、本発明は以下の実施例に限定されるものではない。
(実施例1)
第1実施形態の測定パラメータ(電極直径φと真皮層厚さhdとの比率r(r=φ/hd)、および、電極間距離d)を最適化するために、実際の各層のイオンやタンパクの濃度変化を想定して、2つの電磁気シミュレーションを行った。図19(a)は、その2つ電磁気シミュレーションで用いたセンサを示し、4つの非侵襲的電極を皮膚表面に配置した。図19(b)は、皮膚特定層の各構成を示したもので、その皮膚特定層は、角質層、表皮層、真皮層、および脂肪層で構成される。各層の厚さは、角質層hs、表皮層he、真皮層hd、および脂肪層h aで表される。電磁気シミュレーションの条件において、真皮層の厚さを変化させ、真皮層を除いた各皮膚層の厚さは固定し、具体的には、角質層hsが0.05mm、表皮層heが0.45mm、および脂肪層h aが5mmとした。非侵襲的電極1~3(e1、e2、およびe3)への印加定電流は、Ihc=1mA、その周波数はf=100Hz~1MHzとした。一方、電極4のel4は常にアースとして設定され、例えば、非侵襲的電極1と非侵襲的電極4間に電流を印加するときは、他の非侵襲的電極2と非侵襲的電極3は浮遊した電極として機能し、電流が非侵襲的電極2と非侵襲的電極3には流れない。図19(c)は、2端子法によって単純化された皮膚特定層の等価回路を示したものである。ここで、角質層と表皮層の容量成分Cs,e、角質層と表皮層の抵抗成分Rs,e、真皮層の容量成分Cd、真皮層の抵抗成分Rdの組み合わせの電気的等価回路の大きさの影響を受けて、各非侵襲的電極間に存在する皮膚特定層内を電流が流れる。
第1実施形態の測定パラメータ(電極直径φと真皮層厚さhdとの比率r(r=φ/hd)、および、電極間距離d)を最適化するために、実際の各層のイオンやタンパクの濃度変化を想定して、2つの電磁気シミュレーションを行った。図19(a)は、その2つ電磁気シミュレーションで用いたセンサを示し、4つの非侵襲的電極を皮膚表面に配置した。図19(b)は、皮膚特定層の各構成を示したもので、その皮膚特定層は、角質層、表皮層、真皮層、および脂肪層で構成される。各層の厚さは、角質層hs、表皮層he、真皮層hd、および脂肪層h aで表される。電磁気シミュレーションの条件において、真皮層の厚さを変化させ、真皮層を除いた各皮膚層の厚さは固定し、具体的には、角質層hsが0.05mm、表皮層heが0.45mm、および脂肪層h aが5mmとした。非侵襲的電極1~3(e1、e2、およびe3)への印加定電流は、Ihc=1mA、その周波数はf=100Hz~1MHzとした。一方、電極4のel4は常にアースとして設定され、例えば、非侵襲的電極1と非侵襲的電極4間に電流を印加するときは、他の非侵襲的電極2と非侵襲的電極3は浮遊した電極として機能し、電流が非侵襲的電極2と非侵襲的電極3には流れない。図19(c)は、2端子法によって単純化された皮膚特定層の等価回路を示したものである。ここで、角質層と表皮層の容量成分Cs,e、角質層と表皮層の抵抗成分Rs,e、真皮層の容量成分Cd、真皮層の抵抗成分Rdの組み合わせの電気的等価回路の大きさの影響を受けて、各非侵襲的電極間に存在する皮膚特定層内を電流が流れる。
電磁気シミュレーション(比率rと電極間距離dの変動時の推定分布関数γ^(lnτ))
侵入皮膚特定層深さEFCLは、電極直径φと真皮層厚さhdとの比率r(r=φ/hd)と隣接する電極間距離dに依存する。rの変動は、0.5(φ/hd=0.5/1)、0.7(φ/hd=1/1.5)、1(φ/hd=2/2)、および1.2(φ/hd=3/2.5)とし、電極間距離dを2mmから8mmまでとした。電流印加する非侵襲的電極(e1、e2、またはe3)、比率rと電極間距離dをパラメータとして、電磁気シミュレーションを実行して、最適電極直径と最適電極間距離を検討した。図20は、電磁気シミュレーション条件で用いた各皮膚特定層における既知の導電率σと既知の比誘電率εの周波数依存性である。図20(a)の縦軸は導電率(S/cm)を示し、図20(a)の横軸は電流印加周波数(Hz)を示す。図20(b)の縦軸は比誘電率(-)を示し、図20(b)の横軸は電流印加周波数(Hz)を示す。
侵入皮膚特定層深さEFCLは、電極直径φと真皮層厚さhdとの比率r(r=φ/hd)と隣接する電極間距離dに依存する。rの変動は、0.5(φ/hd=0.5/1)、0.7(φ/hd=1/1.5)、1(φ/hd=2/2)、および1.2(φ/hd=3/2.5)とし、電極間距離dを2mmから8mmまでとした。電流印加する非侵襲的電極(e1、e2、またはe3)、比率rと電極間距離dをパラメータとして、電磁気シミュレーションを実行して、最適電極直径と最適電極間距離を検討した。図20は、電磁気シミュレーション条件で用いた各皮膚特定層における既知の導電率σと既知の比誘電率εの周波数依存性である。図20(a)の縦軸は導電率(S/cm)を示し、図20(a)の横軸は電流印加周波数(Hz)を示す。図20(b)の縦軸は比誘電率(-)を示し、図20(b)の横軸は電流印加周波数(Hz)を示す。
図21はr=1(φ/hd=2/2)、かつ、電極間距離d=1mmの場合で、前述の電磁気シミュレーション条件のときの皮膚特定層分離部における電磁気シミュレーション結果であり、図21(a)はインピーダンスの電磁気シミュレーション結果から得られたナイキストプロットを示し、図21(b)は、本発明の分布関数推定部52の出力結果である特定の緩和時間τにおける推定分布関数γ^(lnτ)を示す。これら3つのピークは、τ=10-5~10ー3秒の緩和時間τの間に生じた。この緩和時間に対する皮膚の各層の寄与を、次に検討した。
図22は、比率r(=φ/hd)をパラメータとして、電極間距離dの変動時の推定分布関数γ^(lnτ)の変化を示したものであり、その一例として、図22(a)はτ1の時の推定分布関数γ^(lnτ)であり、横軸は電極間距離dである。図22(b)の縦軸はτ2の時の推定分布関数γ^(lnτ)であり、横軸は電極間距離dである。これらの図から、r=0.5は、他の比と比較して推定分布関数γ^(lnτ)が大きいことが分かった。これは、真皮層厚さhdよりも電極直径φが小さいほど、γ^(lnτ)が大きくなることを意味する。さらに、電極間距離dが大きくなるにつれて、γ^(lnτ)の大きさも大きくなった。これは、電極直径φが真皮層厚さhdに匹敵したためと考えられる。
(実施例2)
次に、実施例1において最適化された第1実施形態の測定パラメータ(比率rと電極間距離d)を用いて、第1実施形態を実験的に実証するために、人間の皮膚とほぼ同様の機械的および電気的特性があるブタの皮膚組織(脂肪層および筋肉も付着している)を用いて、皮膚特定層分離手段のための実験を行った。図23に実験装置の概要を示す。図23は、センサ、4チャネルマルチプレクサー、データ取得システムとしてのインピーダンスアナライザ(IM 3570、日置電機株式会社、東京、日本)、および指示と後処理用のパーソナルコンピュータで構成されている。センサは、寸法が25mm×35mm×1.6mmのプリント回路基板(PCB)に、1×4の配置の4つの非侵襲的電極が配置されたものを用いた。
非侵襲的電極は、ステンレス製であり、直径1mmで、隣接する電極の中心間距離は1mm、プリント回路基板からの厚さ1mmとした。
次に、実施例1において最適化された第1実施形態の測定パラメータ(比率rと電極間距離d)を用いて、第1実施形態を実験的に実証するために、人間の皮膚とほぼ同様の機械的および電気的特性があるブタの皮膚組織(脂肪層および筋肉も付着している)を用いて、皮膚特定層分離手段のための実験を行った。図23に実験装置の概要を示す。図23は、センサ、4チャネルマルチプレクサー、データ取得システムとしてのインピーダンスアナライザ(IM 3570、日置電機株式会社、東京、日本)、および指示と後処理用のパーソナルコンピュータで構成されている。センサは、寸法が25mm×35mm×1.6mmのプリント回路基板(PCB)に、1×4の配置の4つの非侵襲的電極が配置されたものを用いた。
非侵襲的電極は、ステンレス製であり、直径1mmで、隣接する電極の中心間距離は1mm、プリント回路基板からの厚さ1mmとした。
測定に適用される電流はI=1mAとし、掃引印加電流周波数はf=100Hz~1MHzとした。本実施例では、インピーダンスの測定手法として2端子法を用い、その測定番号と各非侵襲的電極との関係を表1に示す。表1のHcの欄は高電流印加の電極番号を示し、Hpの欄は高電位測定の電極番号を示し、Lcの欄は低電流印加の電極番号を示し、Lpの欄は低電位測定の電極番号を示す。電流は高電流印加電極(Hc)から、ブタの皮膚組織を通って流れ、接地も含んだ低電流印加電極(Lc)に到達する。電極番号e1(表中は1と省略して表記),e2(2と省略して表記),およびe3(3と省略して表記)は、HcおよびHp非侵襲的電極として機能し、電極番号e4(4と省略して表記)は常にLpおよびLc(接地)電極として機能させた。表1の測定によって、合計で3つの測定値が得られる。
ブタの皮膚組織サンプルは、角質層、表皮層、真皮層、脂肪層、および筋肉層から構成され、適切な温度(±35℃)に達するまで温度を調整した。皮膚のナトリウム・イオン濃度の変化を模倣するために、濃度の異なる4つの塩化ナトリウム(NaCl)水溶液(20mM、30mM、35mM、および、40mM)を用意し、ブタの真皮層に注入した。ハイパーパラメータとして、λ=10ー6を設定し、表1の測定シーケンスに基づき電位差を測定した。

図24(a)は、塩化ナトリウム水溶液濃度をパラメータ(y軸)として、印加電流周波数を掃引して、インピーダンスの実部(x軸)と虚部(z軸)としたナイキストプロットの結果を示したものである。図24(b)は、その実験結果(実線)とEEC(electrical equivalent circuit)に基づく等価回路フィッティング(点線)との比較を示す。図24(b)に示されるように、実験結果と等価回路とのフィッティングはよく一致した。また、塩化ナトリウム水溶液濃度cの増加に伴い、ナイキストプロットのy軸の最小値を示すx軸の値から求められる抵抗値Zreが増加することが確認された。
図25(a)は、ブタ皮膚組織を用いた実験の第1実施形態の皮膚特定層分離部の算出結果で、塩化ナトリウム水溶液濃度をパラメータとしたときの緩和時間τと推定分布関数γ^(lnτ)との関係を示したものである。この図から、いくつかのピーク値が確認された。これらのピーク値は各皮膚特定層に関する分布関数に対応する。真皮層に関する推定分布関数γ^(lnτ)は、緩和時間τ=10ー2秒のピーク値である。図25(b)は、塩化ナトリウム水溶液濃度の変化に対して、正規分布関数が、τ=10-2秒であり、第1実施形態の皮膚特定層分離部の実験に基づいた推定分布関数γ^(lnτ)を示したものである。図25(b)の縦軸は推定分布関数γ^(lnτ)(Ω)であり、横軸は緩和時間τ(s)である。
第1実施形態の皮膚特定層分離部51を用いて計算された推定分布関数γ^(lnτ)の局所極大値は、皮膚特定層の各層の特性を示す。真皮層の電気的特性を他の表皮層から分離するには、隣接する対電極と離れた対電極との差を求めることによって測定した。 緩和時間の長い領域(τ=10-2[s])では、ピークはよく区別されるが、他の緩和時間の領域では、ピークは不規則であった。図25(a)から高緩和時間領域では、分布関数が真皮層に注入されたナトリウム・イオンの濃度に関連した情報を与えていることが分かった。従って、真皮層の有用な情報が得られる高緩和時間領域に着目して解析を進めた。
図25(b)にτ=10-2[s]付近の時定数範囲における分布関数の拡大図を示す。図25(b)の横軸は塩化ナトリウム水溶液濃度であり、縦軸は推定分布関数γ^(lnτ)である。この図から、この領域で濃度が高くなるにつれて、振幅が小さくなっていることがわかった。図25(c)は、τ=10-2s付近の塩化ナトリウム水溶液濃度の変化に対する第1実施形態の皮膚特定層分離部で計算された推定分布関数γ^(lnτ)を示したもので、線形性が認められた。以上の結果から、本実施形態に係る皮膚内部計測装置によって、例えば、真皮層のナトリウム・イオン濃度を計測することができ、浮腫の状態、細胞や血管の壊死状態、および、慢性腎臓病の状態を検出できることが分かった。
(実施例3)
第2実施形態を実験的に実証するために、ブタ皮膚の真皮層電解質濃度を5mmoL/Lから50mmoL/Lに変化する条件下(慢性腎臓病(CKD)患者を模倣)で計測した。
第2実施形態を実験的に実証するために、ブタ皮膚の真皮層電解質濃度を5mmoL/Lから50mmoL/Lに変化する条件下(慢性腎臓病(CKD)患者を模倣)で計測した。
図26は、実施例3で用いた実験装置の構成を示す。矩形波印加電流装置としてFPGA(ザイリンクス Zynq-SoC)と、3チャンネルのアナログマルチプレクサ(ADG1404)を用いた。ブタの皮膚組織の表面には、電極間距離(非侵襲的電極間距離)d=2mm、電極直径φ=0.8mmの3つのe1、e2およびe3に接続した。電極e1は低電流印加電極と低電圧測定電極として設定し、電極e2を高電圧測定電極、および電極e3を高電流印加電極として切り替えて測定した。14ビットのデータ分解能と125MS/sのサンプリングレートの高速データ信号を取得するためにアナログ-デジタルコンバータLTC2145を用いた。測定された電位差vは、パワースペクトル降下算出部に転送した。
実施例3では、真皮層の導電率は、2対の2電極法(e2-e1間電位差測定、およびe3-e1間電流印加)から測定された電位差vに基づいて、時間領域と周波数領域で解析した。時間領域解析には、真皮層の抵抗性および容量性特性による最大測定電位差vmaxおよび充電時間が含まれる。一方、周波数領域解析には、高調波成分でのパワースペクトル密度が含まれる。測定の再現性を保証するために、10回測定しその平均値を求めた。
電流の大きさiは1.0mA、デューティーサイクルδは50%とし、印加電流周波数fは1kHz~200kHzとした。ブタの皮膚組織を2x4cmに切り、0.5mLの塩化ナトリウム水溶液(NaCl+H2O)を真皮層に注射により直接注入した。塩化ナトリウム水溶液は、下記(34)式を用いNaCl粉末を50mLの蒸留水に溶解して作製した。

真皮層は塩化ナトリウム水溶液濃度5、10、15、20、25、30、35、40、45、および、50[mmoL/L]の合計10種類とした。ここで、式(34)中のmNaClはNaCl粉末の質量、Vは蒸留水の量、MrはNaClの相対分子量で58.44[g/moL]である。NaClの注入は真皮層に均一に分布し、角質層、表皮層、脂肪層に拡散していないことを確認した。
矩形波測定では、測定する電位の時間変化における時定数τが、結果に大きな影響を与える。したがって、時定数解析を用いて、適切な矩形波の印加電流周波数を決定することが重要である。図27に、真皮層に10mmoL/Lの塩化ナトリウム水溶液濃度cを注入した場合の印加電流周波数fswの違いによる測定電位差vの測定結果を示す。図27(a)は、fsw=5kH~25kHzの結果を示す。図27(a)の横軸は経過時間(μs)を示し、縦軸は測定した電位差v(V)を示す。図27(b)は、fsw=50kHz~100kHzの結果を示す。図27(b)の横軸は経過時間(μs)を示し、縦軸は測定した電位差v(V)を示す。50kHz~100kHzでの印加電流周波数の場合、時定数τは上記式(16)を使用して計算すると、すべての印加電流周波数範囲は、同様の時定数値であるζ=0.77μsであることが分かった。
図28に、印加電流周波数fsw=100kHzにおける、塩化ナトリウム水溶液濃度cの違いによる測定電圧vの測定結果を示す。図28(a)は時間領域の結果を示すもので、その横軸は時間(μs)であり、縦軸は測定した電位差vである。この時間領域の結果では、最大測定電圧vmaxおよび時定数τに関する情報を取得することができる。時定数は、真皮層の細胞内容量、細胞外抵抗、および細胞内抵抗を計算するための重要なパラメータである。図28(a)より、最大測定電圧vmaxが、cの増加により減少するため、cと線形の相関関係があることが分かった。
図28(b)は周波数領域を示すもので、その高調波次数のパワースペクトル密度に関する情報を示す。
図28(b)は周波数領域を示すもので、その高調波次数のパワースペクトル密度に関する情報を示す。
時間領域解析で測定された電位差vに基づいて、真皮層の特性を計算した。図29は、塩化ナトリウム水溶液濃度の時定数解析に基づく真皮層のコンダクタンスおよびキャパシタンスを示す。図29(a)の縦軸は真皮層のコンダクタンス(S/m)を示し、横軸は塩化ナトリウム水溶液濃度(mM)を示す。図29(b)の縦軸は、真皮層のキャパシタンス(nF)を示し、横軸は、塩化ナトリウム水溶液濃度を示す。これらの結果から、真皮層における塩化ナトリウム水溶液濃度の上昇に伴い、真皮層におけるコンダクタンスが増加することが確認された。
図30は、矩形波印加電流fsw=25kHz~150kHzを使用したブタ皮膚の真皮層測定におけるcとΔPの関係を示す。図30の縦軸は正規化されたパワースペクトル密度降下を示し、横軸は真皮層に注入されたNaCl水溶液の濃度を示す。100kHzおよび120kHzの印加電流周波数では、決定係数R2が0.90を超えていた。決定係数は、100kHzを超える印加電流周波数fでは減少した。実験結果の線形回帰に基づいて、パワースペクトル密度降下ΔPは下記(35)式に基づいて計算した。一方、計算から、ΔPは下記(36)式に基づいて計算した。ここで、kは校正係数である。


図31は、塩化ナトリウム水溶液濃度とfsw=100kHzにおける正規化したPSD降下ΔPとの関係を示したものである。矩形波印加電流印加からの高調波次数には、真皮層の導電率・誘電率・位相を表すために抽出された貴重な情報が含まれている。基本印加電流周波数と第3高調波の電圧振幅を差し引いて算出されるパワースペクトル密度降下は、真皮層で変化した導電率・誘電率・位相と直線的な関係にあることが確認された。表2は、真皮層の電気的特性を決定するための時定数分析の結果である。時定数分析の結果は、ナトリウム・イオン濃度cが真皮コンダクタンスGdに直接関係し、cが増加するとGdが増加することを示された。

(実施例4)
第3実施形態を実験的に実証するために、図32に、実施例4で用いた皮膚内部計測装置の構成を示す。皮膚内部計測装置は矩形波信号を生成し、測定信号を管理する。ハウランド電流は、広範囲の周波数に対して定電流iを供給する。ブタの皮膚に、電極間隔d=2mm、電極直径φ=0.8mmの1列の16個の電極e1,e2~e16に接続した。電極の切り替えは、16チャンネルのアナログマルチプレクサ ADG 1406によって行った。高速データ収集には、デュアル同時アナログ/デジタルコンバータ LTC2145を用いた。
実施例4では、16個の電極からの4端子準隣接法を用いた。測定された電圧v_mは、濃度分布測定部50(コンピュータ)に転送した。
第3実施形態を実験的に実証するために、図32に、実施例4で用いた皮膚内部計測装置の構成を示す。皮膚内部計測装置は矩形波信号を生成し、測定信号を管理する。ハウランド電流は、広範囲の周波数に対して定電流iを供給する。ブタの皮膚に、電極間隔d=2mm、電極直径φ=0.8mmの1列の16個の電極e1,e2~e16に接続した。電極の切り替えは、16チャンネルのアナログマルチプレクサ ADG 1406によって行った。高速データ収集には、デュアル同時アナログ/デジタルコンバータ LTC2145を用いた。
実施例4では、16個の電極からの4端子準隣接法を用いた。測定された電圧v_mは、濃度分布測定部50(コンピュータ)に転送した。
取得プロセスでは、オーバーサンプリングを回避し、電位差サンプリング数Nを2048で一定に保つために、サンプリング時間Δtを制御した。Nを一定値に保つことで、FFT処理の速度を維持することができる。
真皮層のナトリウム・イオン濃度に変化を持たせるために、塩化ナトリウム水溶液を真皮層に注入した。ブタの皮膚を10×40mmに切り、0.5mlの塩化ナトリウム水溶液を真皮層に直接注入した。塩化ナトリウム濃度は、5、10、15、20、25、30、35、40、45、50[mM]とした。各条件には5つの皮膚サンプルがあり、測定の再現性と精度を確保するために、各サンプルは5回測定した。
図33に、閾値dΓを変えた場合における正規化補償電圧<v*>のパターン変化を示す。閾値dΓによってカットオフされたパターンの有意な変化が確認された。閾値dΓが大きいほど、正規化補償電圧<v*>が高くなった。
図34に、閾値dΓおよび塩化ナトリウム水溶液濃度を変えた場合のナトリウム・イオン濃度分布の再構成画像の実験結果を示す。閾値dΓ=0mmの場合、ナトリウム・イオン濃度分布cの再構成画像には、角質層と表皮領域にアーティファクトがあった。表皮層のcがまだ支配的であった。一方、dΓ=2mm、4mm、および6mmの場合、より真皮層の関心領域ROI(各図で四角形で囲った領域)でc分布の画像が強調表示され、定量化の精度が向上した。
(実施例5)
第3実施形態と他の形態(ここでは第1実施形態)との組み合わせの効果を実験的に実証するために、電極間距離に基づく閾値に基づき所定の処理を行い、目的とする皮膚特定層内の対象成分(電解質、血液タンパクなど)の濃度分布の情報が載った電位差または電流を増幅した。
第3実施形態と他の形態(ここでは第1実施形態)との組み合わせの効果を実験的に実証するために、電極間距離に基づく閾値に基づき所定の処理を行い、目的とする皮膚特定層内の対象成分(電解質、血液タンパクなど)の濃度分布の情報が載った電位差または電流を増幅した。
具体的には、Skip法を用いた真皮層のナトリウム・イオン濃度抽出を行った。
Skip法では、16個の電極を持つ平面センサーアレイと、真皮層のナトリウム・イオン濃度抽出のための準隣接注入パターンを採用した。
各インピーダンス測定には、4つの電極(高電流(Hc)、高電位(Hp)、低電位(Lp)、低電流(Lc))が利用される。
Skip法では、16個の電極を持つ平面センサーアレイと、真皮層のナトリウム・イオン濃度抽出のための準隣接注入パターンを採用した。
各インピーダンス測定には、4つの電極(高電流(Hc)、高電位(Hp)、低電位(Lp)、低電流(Lc))が利用される。
従来の準隣接法は、Skip=0とみなされる。Skip=1は、隣接する各作用電極間の1電極スキップを表し、Skip=2、Skip=3、Skip=4は、それぞれ隣接する各作用電極間の2、3、4電極のスキップを意味する(図36)。
Skipを変化させ(Skip=0からSkip=4)、ナトリウム・イオン濃度抽出に最適なスキップ距離を決定するために閾値法を用いた。
EIT画像再構成に最適な周波数を決定するためにDRTを利用した(図37)。
各スキップバリエーションの性能は、真皮層と表皮層の両方で検出された導電率変化に基づいて評価した。
EIT画像再構成に最適な周波数を決定するためにDRTを利用した(図37)。
各スキップバリエーションの性能は、真皮層と表皮層の両方で検出された導電率変化に基づいて評価した。
本実験の結果、実線で示すように、すべてのSkipのバリエーションが真皮層のナトリウム・イオン濃度変化を効果的に検出していることが示された(図38)。
しかし、破線で示すように、表皮層の導電率変化として現れる画像アーティファクトがすべてのスキップバリエーションで観察された。
Skip=1(三角シンボルを繋いだ実線と破線)のバリエーションは、ナトリウム・イオン濃度の変化に対して表皮層の導電率変化が最も目立たず、真皮層のナトリウム・イオン濃度変化を正確に捉えながら画像アーティファクトを最小限に抑えるという優れた性能を示している。
しかし、破線で示すように、表皮層の導電率変化として現れる画像アーティファクトがすべてのスキップバリエーションで観察された。
Skip=1(三角シンボルを繋いだ実線と破線)のバリエーションは、ナトリウム・イオン濃度の変化に対して表皮層の導電率変化が最も目立たず、真皮層のナトリウム・イオン濃度変化を正確に捉えながら画像アーティファクトを最小限に抑えるという優れた性能を示している。
閾値法に基づくスキップ法とDRTとの統合は、画質と深さ分解能を向上させながら真皮層のナトリウム・イオン濃度を抽出する有望なアプローチを提供する。Skip法を系統的に最適化し、DRTを活用することで、画像アーティファクトを最小限に抑えつつ、真皮層のナトリウム・イオン濃度抽出において優れた性能を達成した。
図39に、電磁気シミュレーションと実験による空間平均導電率分布<*σ>の比較を示す。図39(a)は、dΓが0mmの結果であり、図39(b)は、dΓが2mmの結果であり、図39(c)は、dΓが4mmの結果であり、図39(d)は、dΓが8mmの結果である。各図の横軸は塩化ナトリウム水溶液濃度(mM)であり、縦軸は、空間平均導電率分布<*σ>である。Ωは皮膚領域の<*σ>を表し、ΩdはROI領域の<*σ>を示す。添え字のexpは実験値、simは電磁気シミュレーション値を示す。
全体的に、電磁気シミュレーションと実験とでcが増加するにつれて<*σ>が徐々に増加した。ROI領域Ωdの下の決定係数R2は皮膚領域Ωよりも高く、VDTが角質層の画像アーティファクトをより低減し、真皮層Ωdの関心領域(ROI領域)を強調できることが分かった。
図40は、電磁気シミュレーションと実験による閾値dΓの評価結果を示す。図40(a)の上図は電磁気シミュレーションの決定係数と閾値との関係を示し、図40(a)の下図は電磁気シミュレーションの正規化感度Sと閾値との関係を示し、図40(b)の上図は実験から得られた決定係数と閾値との関係を示し、図40(b)の下図は実験から得られた正規化感度Sと閾値との関係を示す。これらの結果から、最適な閾値(閾値距離)は2mmであることが分かった。
測定されたインピーダンスに基づいて、皮膚特定層の各層分離し、皮膚内部の状態を把握することが可能な皮膚内部計測装置を提供できる。
10 電流電圧印加測定部
20 センサ
21 電極
30 制御部
50 濃度分布測定部
51 皮膚特定層分離部
52 分布関数推定部
53 検量線比較部、出力部
60、60A 濃度算出部
100 皮膚内部計測装置
20 センサ
21 電極
30 制御部
50 濃度分布測定部
51 皮膚特定層分離部
52 分布関数推定部
53 検量線比較部、出力部
60、60A 濃度算出部
100 皮膚内部計測装置
Claims (7)
- 互いに間隔を空けて皮膚に配置可能な複数の電極を備えるセンサを有する電流電圧印加測定部と、
前記皮膚内部の特定層の電解質濃度分布および血液タンパク濃度分布の少なくとも一方を測定する濃度分布測定部と、を備え、
前記濃度分布測定部は、前記電流電圧印加測定部が測定した電流、電位差、および/または、位相の変動量に基づき得られた、前記皮膚内部の特定層の情報が載った特徴量であって、以下の少なくとも一つの特徴量:
(1)電場が皮膚特定層を浸透する遠方電極間のインピーダンスZ1(f)と、電場が皮膚特定層を浸透せず、その上部の層のみを浸透する近方電極間のインピーダンスZ2(f)との変動量に基づく特徴量、
(2)矩形波電流を印加した場合の遠方電極間と近方電極間の電位差および位相の変動量に基づく特徴量、または矩形波電圧を印加した場合の遠方電極間と近方電極間の電流および位相の変動量に基づく特徴量、または、
(3)電極間距離に基づく閾値に基づき所定の処理を行い、目的とする皮膚特定層内の対象成分の濃度分布の情報が載った電位差または電流を増幅し、目的としない皮膚特定層内の情報が載った電位差または電流を低減した特徴量、
を算出する皮膚特定層分離部と、
前記特徴量を用いて、前記特定層内の電解質濃度および血液タンパク質濃度と相関する導電率、誘電率、および位相のうち少なくとも1つを算出する、濃度算出部と、を備える、皮膚内部計測装置。 - 前記濃度算出部がさらに、
(a)電解質または血液タンパクの濃度の算出に先立って作成された、電解質濃度と緩和時間に基づく分布関数の検量線と、前記特徴量から推定された、緩和時間に基づく分布関数に基づき、または
(b)電解質または血液タンパクの濃度の算出に先立って作成された、電解質濃度とパワースペクトル密度降下の検量線と、前記特徴量から推定された、パワースペクトル密度降下に基づき、電解質または血液タンパクの濃度を算出する検量線比較部を有することを特徴とする、請求項1に記載の皮膚内部計測装置。 - 前記濃度算出部が、電解質または血液タンパクの濃度の算出に先立って作成された、電解質濃度と緩和時間に基づく分布関数の検量線と、前記特徴量から推定された、緩和時間に基づく分布関数に基づき、電解質または血液タンパクの濃度を算出する検量線比較部を有することを特徴とする、請求項2に記載の皮膚内部測装置。
- 前記濃度算出部が、電解質または血液タンパクの濃度の算出に先立って作成された、電解質濃度とパワースペクトル密度降下の検量線と、前記特徴量から推定された、パワースペクトル密度降下に基づき、電解質または血液タンパクの濃度を算出する検量線比較部を有することを特徴とする、請求項2に記載の皮膚内部計測装置。
- 前記濃度分布測定部は、
前記電流電圧印加測定部で測定された前記電流または前記電位差に対して電極間距離の閾値に基づき、所定の処理を行う皮膚特定層分離部と、
前記所定の処理後の前記電流又は前記電位差に基づき、導電率分布、誘電率分布、および位相分布の少なくとも1つを算出する、電気物性分布算出部と、を備える、請求項1に記載の皮膚内部計測装置。 - 皮膚特定層内の電解質濃度分布・血液たんぱく濃度分布の計測方法であって、
互いに間隔を空けて皮膚に配置した複数の電極を備えるセンサを有する電流電圧印加測定部が測定した電流、電位差、および/または、位相の変動量に基づき得られた、前記皮膚内部の特定層の情報が載った特徴量であって、以下の少なくとも一つの特徴量:
(1)電場が皮膚特定層を浸透する遠方電極間のインピーダンスZ1(f)と、電場が皮膚特定層を浸透せず、その上部の層のみを浸透する近方電極間のインピーダンスZ2(f)との変動量に基づく特徴量、
(2)矩形波電流を印加した場合の遠方電極間と近方電極間の電位差および位相の変動量に基づく特徴量、または矩形波電圧を印加した場合の遠方電極間と近方電極間の電流および位相の変動量に基づく特徴量、または、
(3)電極間距離に基づく閾値に基づき所定の処理を行い、目的とする皮膚特定層内の対象成分の濃度分布の情報が載った電位差または電流を増幅し、目的としない皮膚特定層内の情報が載った電位差または電流を低減した特徴量、
を算出し、
前記特徴量を用いて、前記特定層内の電解質濃度および血液タンパク質濃度と相関する導電率、誘電率、および位相のうち少なくとも1つを算出した結果を用いることを特徴とする計測方法。 - 前記特徴量を用いた算出が
(a)電解質または血液タンパクの濃度の算出に先立って作成された、電解質濃度と緩和時間に基づく分布関数の検量線と、前記特徴量から推定された、緩和時間に基づく分布関数に基づき、または
(b)電解質または血液タンパクの濃度の算出に先立って作成された、電解質濃度とパワースペクトル密度降下の検量線と、前記特徴量から推定された、パワースペクトル密度降下に基づき、電解質または血液タンパクの濃度を算出することを特徴とする、請求項6に記載の計測方法。
Priority Applications (1)
| Application Number | Priority Date | Filing Date | Title |
|---|---|---|---|
| JP2025518162A JPWO2024228397A1 (ja) | 2023-05-02 | 2024-05-02 |
Applications Claiming Priority (2)
| Application Number | Priority Date | Filing Date | Title |
|---|---|---|---|
| JP2023-076258 | 2023-05-02 | ||
| JP2023076258 | 2023-05-02 |
Publications (1)
| Publication Number | Publication Date |
|---|---|
| WO2024228397A1 true WO2024228397A1 (ja) | 2024-11-07 |
Family
ID=93333035
Family Applications (1)
| Application Number | Title | Priority Date | Filing Date |
|---|---|---|---|
| PCT/JP2024/016863 Ceased WO2024228397A1 (ja) | 2023-05-02 | 2024-05-02 | 皮膚内部計測装置 |
Country Status (2)
| Country | Link |
|---|---|
| JP (1) | JPWO2024228397A1 (ja) |
| WO (1) | WO2024228397A1 (ja) |
Cited By (2)
| Publication number | Priority date | Publication date | Assignee | Title |
|---|---|---|---|---|
| CN119322278A (zh) * | 2024-09-30 | 2025-01-17 | 西安交通大学 | 一种锂电池的荷电状态确定方法、装置和设备 |
| CN120938395A (zh) * | 2025-09-02 | 2025-11-14 | 浙江大学 | 一种基于生物电阻抗的创面愈合进程监测方法及系统 |
Citations (4)
| Publication number | Priority date | Publication date | Assignee | Title |
|---|---|---|---|---|
| JP2007097625A (ja) * | 2005-09-30 | 2007-04-19 | Amica:Kk | 皮膚状態評価装置及び皮膚状態評価プログラム並びに同プログラムを記憶したコンピュータ読み取り可能な記憶媒体 |
| JP2011524213A (ja) * | 2008-06-18 | 2011-09-01 | ソリアニス・ホールディング・アーゲー | 皮膚に対する皮膚処理剤の影響を特性描写するための方法および装置 |
| US20160249836A1 (en) * | 2012-07-16 | 2016-09-01 | Sandeep Gulati | Sample optical pathlength control using a noninvasive analyzer apparatus and method of use thereof |
| WO2022217304A1 (en) * | 2021-04-13 | 2022-10-20 | WearOptimo Pty Ltd | Fluid status monitoring |
-
2024
- 2024-05-02 JP JP2025518162A patent/JPWO2024228397A1/ja active Pending
- 2024-05-02 WO PCT/JP2024/016863 patent/WO2024228397A1/ja not_active Ceased
Patent Citations (4)
| Publication number | Priority date | Publication date | Assignee | Title |
|---|---|---|---|---|
| JP2007097625A (ja) * | 2005-09-30 | 2007-04-19 | Amica:Kk | 皮膚状態評価装置及び皮膚状態評価プログラム並びに同プログラムを記憶したコンピュータ読み取り可能な記憶媒体 |
| JP2011524213A (ja) * | 2008-06-18 | 2011-09-01 | ソリアニス・ホールディング・アーゲー | 皮膚に対する皮膚処理剤の影響を特性描写するための方法および装置 |
| US20160249836A1 (en) * | 2012-07-16 | 2016-09-01 | Sandeep Gulati | Sample optical pathlength control using a noninvasive analyzer apparatus and method of use thereof |
| WO2022217304A1 (en) * | 2021-04-13 | 2022-10-20 | WearOptimo Pty Ltd | Fluid status monitoring |
Cited By (3)
| Publication number | Priority date | Publication date | Assignee | Title |
|---|---|---|---|---|
| CN119322278A (zh) * | 2024-09-30 | 2025-01-17 | 西安交通大学 | 一种锂电池的荷电状态确定方法、装置和设备 |
| CN119322278B (zh) * | 2024-09-30 | 2025-10-31 | 西安交通大学 | 一种锂电池的荷电状态确定方法、装置和设备 |
| CN120938395A (zh) * | 2025-09-02 | 2025-11-14 | 浙江大学 | 一种基于生物电阻抗的创面愈合进程监测方法及系统 |
Also Published As
| Publication number | Publication date |
|---|---|
| JPWO2024228397A1 (ja) | 2024-11-07 |
Similar Documents
| Publication | Publication Date | Title |
|---|---|---|
| AU2008241356B2 (en) | Monitoring system and probe | |
| Bera et al. | Electrical impedance spectroscopy (EIS)-based evaluation of biological tissue phantoms to study multifrequency electrical impedance tomography (Mf-EIT) systems | |
| Bera | Bioelectrical impedance methods for noninvasive health monitoring: a review | |
| AU2012351988B2 (en) | Devices, systems and methods for determining the relative spatial change in subsurface resistivities across frequencies in tissue | |
| MacLeod et al. | Recent progress in inverse problems in electrocardiology | |
| WO2024228397A1 (ja) | 皮膚内部計測装置 | |
| JP4378607B2 (ja) | 測定装置 | |
| US20060085048A1 (en) | Algorithms for an active electrode, bioimpedance-based tissue discrimination system | |
| US20120323134A1 (en) | Method and system for determining a location of nerve tissue in three-dimensional space | |
| CA2863041A1 (en) | Tissue mass indicator determination | |
| Karki et al. | Evaluation of a multi-electrode bioimpedance spectroscopy tensor probe to detect the anisotropic conductivity spectra of biological tissues | |
| Bera et al. | A multifrequency electrical impedance tomography (EIT) system for biomedical imaging | |
| Luo et al. | Electrical characterization of basal cell carcinoma using a handheld electrical impedance dermography device | |
| Rifai et al. | Quantification of dermis sodium concentration in skin layers by power spectral density drop of square-wave electrical impedance spectroscopy (PSDd-sEIS) | |
| Dudzinski et al. | Spiral concentric two electrode sensor fabricated by direct writing for skin impedance measurements | |
| Li et al. | Tissue coefficient of bioimpedance spectrometry as an index to discriminate different tissues in vivo | |
| Shishavan et al. | Electrodermal activity monitoring with flexible dry electrodes and AC measurement | |
| Guo et al. | EIT probe based intraoperative tissue inspection for minimally invasive surgery | |
| Irsyadi et al. | Sodium-ion concentration imaging within dermis layer by planar electrical impedance tomography implementing gamma-Jacobian matrix (γJ-pEIT) | |
| Mothi et al. | Development of Electrical Impedance Tomography for Breast Phantom Monitoring | |
| Lovasz et al. | Data-Driven Conductivity Mapping for Tissue Margin Estimation with a Multi-Electrode Sensor Array | |
| AlDisi et al. | Modelingof the Effect of Skin Temperature on Hydration Assessment | |
| Zhang | Electrical Impedance Based Spectroscopy and Tomography Techniques for Obesity and Heart Diseases | |
| Aprihapsari et al. | Multi-Channel Trans-Admittance Imaging for Anomaly Detection | |
| Mendolia | Master thesis: Electrical impedance tomography for external wound monitoring: measurements, signal processing and image reconstruction |
Legal Events
| Date | Code | Title | Description |
|---|---|---|---|
| 121 | Ep: the epo has been informed by wipo that ep was designated in this application |
Ref document number: 24800128 Country of ref document: EP Kind code of ref document: A1 |
|
| ENP | Entry into the national phase |
Ref document number: 2025518162 Country of ref document: JP Kind code of ref document: A |
|
| WWE | Wipo information: entry into national phase |
Ref document number: 2025518162 Country of ref document: JP |
|
| NENP | Non-entry into the national phase |
Ref country code: DE |