WO2024218866A1 - 分析装置 - Google Patents
分析装置 Download PDFInfo
- Publication number
- WO2024218866A1 WO2024218866A1 PCT/JP2023/015492 JP2023015492W WO2024218866A1 WO 2024218866 A1 WO2024218866 A1 WO 2024218866A1 JP 2023015492 W JP2023015492 W JP 2023015492W WO 2024218866 A1 WO2024218866 A1 WO 2024218866A1
- Authority
- WO
- WIPO (PCT)
- Prior art keywords
- analysis
- sensor value
- sensor
- value data
- processing unit
- Prior art date
- Legal status (The legal status is an assumption and is not a legal conclusion. Google has not performed a legal analysis and makes no representation as to the accuracy of the status listed.)
- Ceased
Links
Images


Classifications
-
- G—PHYSICS
- G01—MEASURING; TESTING
- G01N—INVESTIGATING OR ANALYSING MATERIALS BY DETERMINING THEIR CHEMICAL OR PHYSICAL PROPERTIES
- G01N27/00—Investigating or analysing materials by the use of electric, electrochemical, or magnetic means
- G01N27/62—Investigating or analysing materials by the use of electric, electrochemical, or magnetic means by investigating the ionisation of gases, e.g. aerosols; by investigating electric discharges, e.g. emission of cathode
-
- G—PHYSICS
- G01—MEASURING; TESTING
- G01N—INVESTIGATING OR ANALYSING MATERIALS BY DETERMINING THEIR CHEMICAL OR PHYSICAL PROPERTIES
- G01N30/00—Investigating or analysing materials by separation into components using adsorption, absorption or similar phenomena or using ion-exchange, e.g. chromatography or field flow fractionation
- G01N30/02—Column chromatography
- G01N30/62—Detectors specially adapted therefor
- G01N30/72—Mass spectrometers
-
- G—PHYSICS
- G01—MEASURING; TESTING
- G01N—INVESTIGATING OR ANALYSING MATERIALS BY DETERMINING THEIR CHEMICAL OR PHYSICAL PROPERTIES
- G01N30/00—Investigating or analysing materials by separation into components using adsorption, absorption or similar phenomena or using ion-exchange, e.g. chromatography or field flow fractionation
- G01N30/02—Column chromatography
- G01N30/86—Signal analysis
Definitions
- the present invention relates to an analytical device that includes at least one of a chromatograph and a mass spectrometer.
- an analytical device When performing an analysis using an analytical device, there is a possibility that accurate analysis results may not be obtained depending on the state of the analytical device. Therefore, an analytical device has been proposed that has the function of determining whether the analytical device is in a normal state by comparing each control value in the analytical device with a reference value.
- the above reference value is an absolute value.
- Patent Document 1 proposes a method for checking whether the performance of an analytical device is maintaining a reference value, and proposes technology that makes it easier to recognize changes in the performance of an analytical device that gradually deteriorates. Specifically, the proposed technology outputs index information that is an indicator of the performance of the analytical device in a chronological order, and issues a specified warning notification depending on the result of a determination of whether the index information exceeds a preset threshold value.
- Patent Document 2 proposes a technology that calculates the reliability of the space charge effect, a phenomenon that affects mass analysis, when the space charge effect is corrected based on the mass spectrum, and compares the reliability with a predetermined threshold value.
- the present invention was made in consideration of the above situation, and aims to provide an analysis device that can more accurately determine the state of the analysis device.
- the first aspect of the present invention is an analytical device including at least one of a chromatograph and a mass spectrometer, comprising a sensor, a memory unit, and a comparison processor.
- the sensor detects the state of the analytical device and outputs a sensor value corresponding to the state.
- the memory unit stores sensor value data representing the change in the sensor value over time as analysis time passes.
- the comparison processor compares the difference in the sensor values at the same analysis time or the difference in values representing the change in the sensor value over the same analysis time range for multiple sensor value data obtained by performing multiple analyses under the same analysis conditions with a threshold value.
- a second aspect of the present invention is an analytical device including at least one of a chromatograph and a mass spectrometer, comprising a sensor, a memory unit, and a comparison processing unit.
- the sensor detects the state of the analytical device and outputs a sensor value corresponding to the state.
- the memory unit stores sensor value data that represents the change in the sensor value over time as the analysis time progresses.
- the comparison processing unit compares the difference between images representing each sensor value data in the same analysis time range for multiple sensor value data obtained by performing multiple analyses under the same analysis conditions with a threshold value.
- the state of the analysis device can be determined more accurately based on the comparison results from the comparison processing unit.
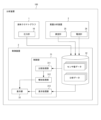
- FIG. 1 is a schematic diagram illustrating an embodiment of an analytical device.
- FIG. 2 is a block diagram showing an example of an electrical configuration of the analysis device.
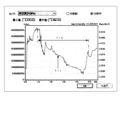
- FIG. 13 is a diagram for explaining an example of processing by the comparison processing unit, showing sensor value data of the degree of vacuum when the analysis device is normal. 13 is a diagram for explaining an example of processing by the comparison processing unit, showing sensor value data of the degree of vacuum when the analysis device is abnormal.
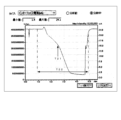
- FIG. FIG. 13 is a diagram for explaining another example of processing by the comparison processing unit, showing sensor value data of the interface current when the analysis device is normal.
- FIG. 13 is a diagram for explaining another example of processing by the comparison processing unit, showing sensor value data of the interface current when the analysis device is abnormal.
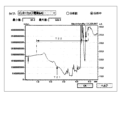
- 11 is a diagram for explaining an example of a process performed by a display processing unit;
- FIG. 13A and 13B are diagrams for explaining another example of the process by the display processing unit.
- This analytical device 100 is a device in which a liquid chromatograph 1 and a mass spectrometer 2 are combined, and a liquid sample is introduced into the mass spectrometer 2 via the liquid chromatograph 1.
- the liquid chromatograph 1 comprises a mobile phase storage section 11, a pump 12, a sample injection device 13, a column 14, and a column oven 15.
- a mobile phase consisting of a liquid such as an organic solvent is stored in the mobile phase storage section 11.
- the mobile phase in the mobile phase storage section 11 is pumped out by driving the pump 12 and supplied to the column 14.
- the pump 12 is a liquid delivery pump constituted by, for example, a high-pressure pump, and the mobile phase is pumped out of the mobile phase storage section 11 at a set pressure.
- the liquid sample is injected from the sample injection device 13 at any timing into the mobile phase supplied to the column 14. This causes the liquid sample to be supplied to the column 14 together with the mobile phase.
- the column 14 is housed in a column oven 15. The inside of the column oven 15 is heated by a heater (not shown), and as the liquid sample passes through the column 14 heated in the column oven 15 together with the mobile phase, the components in the liquid sample are separated over time.
- the liquid sample that has passed through the column 14 is introduced into the mass spectrometer 2 with each component in the liquid sample separated. That is, each component in the separated liquid sample is introduced sequentially from the liquid chromatograph 1 to the mass spectrometer 2.
- the mass spectrometer 2 includes an ionization section 21 and a detector 22. Each component in the liquid sample introduced from the liquid chromatograph 1 to the mass spectrometer 2 is ionized in the ionization section 21 and then supplied into a vacuum chamber 24 via an interface 23. A voltage is applied to the interface 23, and analysis is performed with a set current (interface current) flowing through the interface 23.
- the vacuum chamber 24 is reduced in pressure by a vacuum pump (not shown) to create a vacuum state.
- the vacuum chamber 24 is also provided with, for example, an ion lens and a quadrupole mass spectrometer (neither of which are shown). Ions introduced into the vacuum chamber 24 from the ionization section 21 via the interface 23 are separated according to their mass-to-charge ratio and detected by the detector 22. This provides a chromatogram as analytical data.
- parameters such as the set pressure of the pump 12, the set temperature in the column oven 15, the set current of the interface 23, or the set pressure in the vacuum chamber 24 are examples of analysis conditions, but the analysis conditions may include various other parameters.
- the control device 3 includes a control unit 31, a storage unit 32, a display unit 33, and the like.
- the control unit 31 is electrically connected to the memory unit 32 and the display unit 33.
- the memory unit 32 includes, for example, a ROM (Read Only Memory), a RAM (Random Access Memory) or a hard disk, and stores necessary data in addition to computer programs.
- the display unit 33 includes, for example, a liquid crystal display.
- the memory unit 32 stores signals (sensor values) output from various sensors provided in the liquid chromatograph 1 and the mass spectrometer 2.
- the sensor values are output values from sensors for detecting the state of the analysis device 100 (such as the liquid chromatograph 1 or the mass spectrometer 2), and are distinguished from the output values (analysis data) from the detector 22 in that they are values that correspond to the state of the analysis device 100.
- Examples of the above sensors include the pressure gauge 16 provided in the liquid chromatograph 1, or the vacuum gauge 25 or ammeter 26 provided in the mass spectrometer 2.
- the pressure gauge 16 detects the pump pressure (discharge pressure) of the pump 12.
- the vacuum gauge 25 detects the degree of vacuum based on the pressure inside the vacuum chamber 24.
- the ammeter 26 detects the current (interface current) flowing through the interface 23.
- the sensor values output from these sensors are associated with the time that has elapsed during the analysis (analysis time) and are stored in the memory unit 32 as data (sensor value data) that represents the change in the sensor value over time as the analysis time passes. That is, the memory unit 32 stores the sensor value data separately from the analysis data. When multiple analyses are performed, the analysis data and sensor value data for each analysis are associated with each other and stored in the memory unit 32.
- the control unit 31 is configured by a processor including, for example, a CPU (Central Processing Unit).
- the control unit 31 functions as a comparison processing unit 311, a notification processing unit 312, a display processing unit 313, and the like, as a result of the processor executing a computer program.
- the comparison processing unit 311 performs a comparison process using the sensor value data stored in the storage unit 32 to determine the state of the analysis device 100. The specific processing performed by this comparison processing unit 311 will be described later.
- the notification processing unit 312 performs processing to notify an abnormality in the analysis device 100 based on the result of the comparison by the comparison processing unit 311. Specifically, when the result of the comparison by the comparison processing unit 311 indicates that the state of the analysis device 100 is abnormal, the notification processing unit 312 performs processing to display that fact on the display unit 33.
- the notification by the notification processing unit 312 is not limited to a configuration in which the notification is performed by displaying on the display unit 33, and may be performed by other means such as audio.
- the notification processing unit 312 may be configured to not only notify when the state of the analysis device 100 is determined to be abnormal, but also when it is determined to be normal.
- the display processing unit 313 performs display on the display unit 33 based on the data stored in the memory unit 32. Specifically, the display processing unit 313 can display the analysis data (chromatogram) stored in the memory unit 32 on the display unit 33, and can also display images based on the sensor value data stored in the memory unit 32.
- the analysis data chromatogram
- FIGs 3A and 3B are diagrams for explaining an example of processing by the comparison processing unit 311.
- Figure 3A shows sensor value data of the degree of vacuum when the analysis device 100 is normal
- Figure 3B shows sensor value data of the degree of vacuum when the analysis device 100 is abnormal.
- the degree of vacuum represents the change over time in the sensor value output from the vacuum gauge 25 during each analysis.
- the processing by the comparison processing unit 311 can be performed by any of the methods exemplified in (3-1) to (3-3) below, using multiple sensor value data obtained by multiple analyses performed under the same analysis conditions.
- the "same analysis time” may be any time during the analysis or may be a preset time.
- the comparison processing unit 311 calculates the difference between a value representing changes in sensor values in an arbitrary time range T12 during analysis in the reference state and a value representing changes in sensor values in the same time range T12 during analysis of sensor value data to be compared as shown in Fig. 3B, and compares this difference with a threshold value. That is, the processing by comparison processing unit 311 is performed by comparing the difference in values representing changes in sensor values in the same analysis time range (time range T12) for multiple sensor value data obtained by performing multiple analyses under the same analysis conditions with a threshold value.
- the value representing the change in the sensor value can be calculated, for example, using the average value or standard deviation of the sensor value in the time range T12, but is not limited to such methods and can be calculated using any other method.
- the "same analysis time range” may be the entire time range from the start to the end of the analysis, or a portion of that time range. If it is a portion of that time range, it may be any time range during the analysis, or a pre-set time range.
- the comparison processing unit 311 calculates the difference between an image representing sensor value data in an arbitrary time range T12 during analysis in the reference state and an image in the same time range T12 during analysis of sensor value data to be compared as shown in Fig. 3B, and compares the difference with a threshold value. That is, the processing by comparison processing unit 311 is performed by comparing the difference between images representing each sensor value data in the same analysis time range (time range T12) for multiple sensor value data obtained by performing multiple analyses under the same analysis conditions with a threshold value.
- the difference between the images representing each sensor value data can be calculated by finding the difference in values based on each image that has been quantified using, for example, image recognition or machine learning, but the calculation is not limited to such a method and can be done using any other method.
- the "same analysis time range” may be the entire time range from the start to the end of the analysis, or a partial time range. If it is a partial time range, it may be any time range during the analysis, or a pre-set time range.
- the sensor value data in the reference state corresponding to FIG. 3A may be, for example, sensor value data from the first analysis of multiple analyses, or sensor value data from the analysis immediately prior to the analysis from which the sensor value data to be compared was obtained, or any sensor value data selected by the user. Furthermore, the sensor value data in the reference state may be calculated by image recognition or machine learning based on the sensor value data from multiple analyses.
- Figures 4A and 4B are diagrams for explaining other examples of processing by the comparison processing unit 311.
- Figure 4A shows sensor value data of the interface current when the analysis device 100 is normal
- Figure 4B shows sensor value data of the interface current when the analysis device 100 is abnormal.
- the interface current represents the change over time in the sensor value output from the ammeter 26 during each analysis.
- the processing by the comparison processing unit 311 can be performed by any of the methods exemplified below in (4-1) to (4-3) using multiple sensor value data obtained by multiple analyses performed under the same analysis conditions.
- the "same analysis time” may be any time during the analysis or may be a preset time.
- the comparison processing unit 311 calculates the difference between a value representing changes in sensor values in an arbitrary time range T22 during analysis in the reference state and a value representing changes in sensor values in the same time range T22 during analysis of sensor value data to be compared as shown in Fig. 4B, and compares this difference with a threshold value. That is, the processing by comparison processing unit 311 is performed by comparing the difference in values representing changes in sensor values in the same analysis time range (time range T22) for multiple sensor value data obtained by performing multiple analyses under the same analysis conditions with a threshold value.
- the value representing the change in the sensor value can be calculated, for example, using the average value or standard deviation of the sensor value in the time range T22, but is not limited to such methods and can be calculated using any other method.
- the "same analysis time range” may be the entire time range from the start to the end of the analysis, or a portion of that time range. If it is a portion of that time range, it may be any time range during the analysis, or a pre-set time range.
- the comparison processing unit 311 calculates the difference between an image representing sensor value data in an arbitrary time range T22 during analysis in the reference state and an image in the same time range T22 during analysis of sensor value data to be compared as shown in Fig. 4B, and compares this difference with a threshold value. That is, the processing by the comparison processing unit 311 is performed by comparing the difference between images representing each sensor value data in the same analysis time range (time range T22) for multiple sensor value data obtained by performing multiple analyses under the same analysis conditions with a threshold value.
- the difference between the images representing each sensor value data can be calculated by finding the difference in values based on each image that has been quantified using, for example, image recognition or machine learning, but the calculation is not limited to such a method and can be done using any other method.
- the "same analysis time range” may be the entire time range from the start to the end of the analysis, or a portion of the time range. If it is a portion of the time range, it may be any time range during the analysis, or a pre-set time range.
- the sensor value data in the reference state corresponding to FIG. 4A may be, for example, sensor value data from the first analysis of multiple analyses, or sensor value data from the analysis immediately prior to the analysis from which the sensor value data to be compared was obtained, or any sensor value data selected by the user. Furthermore, the sensor value data in the reference state may be calculated by image recognition or machine learning based on the sensor value data from multiple analyses.
- An example of processing by the display processing unit Fig. 5 is a diagram for explaining an example of processing by the display processing unit 313.
- images representing a plurality of sensor value data obtained by performing a plurality of analyses under the same analysis conditions are superimposed and displayed on the display unit 33 by the display processing unit 313.
- "superimposed and displayed” means that they are displayed based on the same vertical and horizontal axes
- the "image" representing the sensor value data is a graph displayed based on the same vertical and horizontal axes.
- each sensor value obtained by performing five analyses, Measurement 1 to Measurement 5, within the same analysis time range is plotted at regular time intervals (for example, every 0.5 minutes), and an image representing each sensor value data is superimposed and displayed on the display unit 33.
- the vertical axis is not limited to the degree of vacuum, and may be other sensor values such as the interface current.
- the "same analysis time range” may be the entire time range from the start to the end of the analysis, or a portion of that time range. If it is a portion of that time range, it may be any time range during the analysis, or a pre-set time range.
- the state of the analysis device 100 can be determined based on an image such as that shown in FIG. 5.
- the user may determine the state of the analysis device 100 by visually inspecting the image, or the state of the analysis device 100 may be determined by image processing.
- An example of the image processing is a process of comparing a peak value or a peak area in the image with a threshold value, but is not limited to this.
- the state of the analysis device 100 can be determined with even greater accuracy.
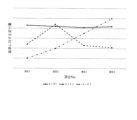
- FIG. 6 Another example of processing by the display processing unit Fig. 6 is a diagram for explaining another example of processing by the display processing unit 313.
- an image showing a time series of changes in sensor values at the same analysis time for a plurality of pieces of sensor value data obtained by performing a plurality of analyses under the same analysis conditions is displayed on the display unit 33 by the display processing unit 313.
- the "same analysis time" may be any time during the analysis, or may be a preset time.
- the horizontal axis corresponds to the time series of each measurement, Measurement 1 to Measurement 4, and the vertical axis shows the amount of change in the sensor value relative to the reference.
- the output values from each sensor, Sensor 1 to Sensor 3 are plotted, but output values from two or less sensors, or four or more sensors, may also be plotted. Examples of sensors 1 to 3 include the pressure gauge 16, the vacuum gauge 25, and the ammeter 26.
- the state of the analysis device 100 can be determined based on an image such as that shown in FIG. 6.
- the user may determine the state of the analysis device 100 by visually inspecting the image, or the state of the analysis device 100 may be determined by image processing.
- An example of the image processing is a process of comparing a peak value or a peak area in the image with a threshold value, but is not limited to this.
- the state of the analysis device 100 can be determined with even greater accuracy.
- the analysis device 100 in which the liquid chromatograph 1 and the mass spectrometer 2 are combined has been described.
- the present invention is applicable to an analysis device 100 including at least one of a chromatograph and a mass spectrometer. Therefore, the analysis device 100 may be an apparatus in which a gas chromatograph and a mass spectrometer are combined.
- the analysis device 100 may be an apparatus consisting of only a liquid chromatograph or a gas chromatograph, or may be an apparatus consisting of only a mass spectrometer.
- the sensor value data to be compared may be read from the storage unit 32 after analysis and processed by the comparison processing unit 311, or may be read in real time from the storage unit 32 during analysis and processed by the comparison processing unit 311.
- the sensor value data is not limited to the pump pressure detected by the pressure gauge 16, the degree of vacuum detected by the vacuum gauge 25, or the interface current detected by the ammeter 26, but may also consist of output values from various other sensors.
- An analysis device including at least one of a chromatograph and a mass spectrometer, a sensor that detects a state of the analysis device and outputs a sensor value corresponding to the state; a storage unit that stores sensor value data representing a change in the sensor value over time as an analysis time elapses;
- the analysis device may further include a comparison processing unit that compares the difference in the sensor values at the same analysis time or the difference in values representing the change in the sensor values at the same analysis time range with a threshold value for multiple sensor value data obtained by performing multiple analyses under the same analysis conditions.
- the state of the analysis device can be determined more accurately by comparing the difference in sensor values at the same analysis time or the difference in values representing the change in sensor values over the same analysis time range for multiple sensor value data obtained by performing multiple analyses under the same analysis conditions with a threshold value.
- the state of the analysis device is abnormal but the sensor value is determined to be normal when compared with the threshold value, it is possible to accurately determine that the state of the analysis device is abnormal by comparing the difference in sensor values or the difference in values representing the change in sensor values with the threshold value.
- An analysis device including at least one of a chromatograph and a mass spectrometer, a sensor that detects a state of the analysis device and outputs a sensor value corresponding to the state; a storage unit that stores sensor value data representing a change in the sensor value over time as an analysis time elapses;
- the present invention may further include a comparison processing unit that compares the difference between images representing each of a plurality of sensor value data obtained by performing a plurality of analyses under the same analysis conditions with a threshold value for the same analysis time range.
- the state of the analysis device can be determined more accurately by comparing the difference in images representing each sensor value data in the same analysis time range for multiple sensor value data obtained by performing multiple analyses under the same analysis conditions with a threshold value.
- the state of the analysis device is abnormal but the sensor value is determined to be normal when compared with the threshold value, it is possible to accurately determine that the state of the analysis device is abnormal by comparing the difference in images representing each sensor value data with the threshold value.
- the analysis device may further include a notification processing unit that notifies an abnormality in the analysis device based on a result of the comparison by the comparison processing unit.
- the apparatus may further include a display processing unit that displays images representing a plurality of pieces of sensor value data obtained by performing a plurality of analyses under the same analysis conditions in an overlapping manner within the same analysis time range.
- the apparatus may further include a display processing unit that displays an image showing a time series of changes in the sensor values at the same analysis time for multiple pieces of sensor value data obtained by performing multiple analyses under the same analysis conditions.
- the state of the analysis device can be determined based on the image.
- the state of the analysis device can be determined with even greater accuracy.
Landscapes
- Chemical & Material Sciences (AREA)
- General Health & Medical Sciences (AREA)
- Life Sciences & Earth Sciences (AREA)
- Health & Medical Sciences (AREA)
- Analytical Chemistry (AREA)
- Biochemistry (AREA)
- Physics & Mathematics (AREA)
- General Physics & Mathematics (AREA)
- Immunology (AREA)
- Pathology (AREA)
- Chemical Kinetics & Catalysis (AREA)
- Electrochemistry (AREA)
- Other Investigation Or Analysis Of Materials By Electrical Means (AREA)
Priority Applications (3)
| Application Number | Priority Date | Filing Date | Title |
|---|---|---|---|
| CN202380096631.5A CN120981718A (zh) | 2023-04-18 | 2023-04-18 | 分析装置 |
| JP2025514930A JPWO2024218866A1 (https=) | 2023-04-18 | 2023-04-18 | |
| PCT/JP2023/015492 WO2024218866A1 (ja) | 2023-04-18 | 2023-04-18 | 分析装置 |
Applications Claiming Priority (1)
| Application Number | Priority Date | Filing Date | Title |
|---|---|---|---|
| PCT/JP2023/015492 WO2024218866A1 (ja) | 2023-04-18 | 2023-04-18 | 分析装置 |
Publications (1)
| Publication Number | Publication Date |
|---|---|
| WO2024218866A1 true WO2024218866A1 (ja) | 2024-10-24 |
Family
ID=93152401
Family Applications (1)
| Application Number | Title | Priority Date | Filing Date |
|---|---|---|---|
| PCT/JP2023/015492 Ceased WO2024218866A1 (ja) | 2023-04-18 | 2023-04-18 | 分析装置 |
Country Status (3)
| Country | Link |
|---|---|
| JP (1) | JPWO2024218866A1 (https=) |
| CN (1) | CN120981718A (https=) |
| WO (1) | WO2024218866A1 (https=) |
Citations (6)
| Publication number | Priority date | Publication date | Assignee | Title |
|---|---|---|---|---|
| JP2015052533A (ja) * | 2013-09-06 | 2015-03-19 | 株式会社日立製作所 | クロマトグラフィー装置およびクロマトグラフィー方法 |
| US20170168028A1 (en) * | 2015-12-10 | 2017-06-15 | Shimadzu Corporation | Analyzer control system |
| JP2020094817A (ja) * | 2018-12-10 | 2020-06-18 | 株式会社日立ハイテク | 液体クロマトグラフ質量分析装置 |
| JP2021032901A (ja) * | 2019-08-27 | 2021-03-01 | エフ ホフマン−ラ ロッシュ アクチェン ゲゼルシャフト | 分析装置の状態をチェックする技術 |
| WO2022230282A1 (ja) * | 2021-04-27 | 2022-11-03 | 株式会社日立ハイテク | 自動分析装置 |
| WO2023042348A1 (ja) * | 2021-09-16 | 2023-03-23 | 株式会社島津製作所 | 質量分析装置の電圧設定方法及び質量分析装置 |
-
2023
- 2023-04-18 WO PCT/JP2023/015492 patent/WO2024218866A1/ja not_active Ceased
- 2023-04-18 CN CN202380096631.5A patent/CN120981718A/zh active Pending
- 2023-04-18 JP JP2025514930A patent/JPWO2024218866A1/ja active Pending
Patent Citations (6)
| Publication number | Priority date | Publication date | Assignee | Title |
|---|---|---|---|---|
| JP2015052533A (ja) * | 2013-09-06 | 2015-03-19 | 株式会社日立製作所 | クロマトグラフィー装置およびクロマトグラフィー方法 |
| US20170168028A1 (en) * | 2015-12-10 | 2017-06-15 | Shimadzu Corporation | Analyzer control system |
| JP2020094817A (ja) * | 2018-12-10 | 2020-06-18 | 株式会社日立ハイテク | 液体クロマトグラフ質量分析装置 |
| JP2021032901A (ja) * | 2019-08-27 | 2021-03-01 | エフ ホフマン−ラ ロッシュ アクチェン ゲゼルシャフト | 分析装置の状態をチェックする技術 |
| WO2022230282A1 (ja) * | 2021-04-27 | 2022-11-03 | 株式会社日立ハイテク | 自動分析装置 |
| WO2023042348A1 (ja) * | 2021-09-16 | 2023-03-23 | 株式会社島津製作所 | 質量分析装置の電圧設定方法及び質量分析装置 |
Also Published As
| Publication number | Publication date |
|---|---|
| JPWO2024218866A1 (https=) | 2024-10-24 |
| CN120981718A (zh) | 2025-11-18 |
Similar Documents
| Publication | Publication Date | Title |
|---|---|---|
| KR20190099258A (ko) | 검출기에 대한 캘리브레이션, 검증 및 감도 검사를 위한 장치 및 방법 | |
| JP6380555B2 (ja) | 分析装置 | |
| US9322814B2 (en) | Mass spectrometer | |
| JP6269810B2 (ja) | 質量分析方法及び質量分析装置 | |
| JP6176334B2 (ja) | 質量分析方法、質量分析装置、及び質量分析データ処理プログラム | |
| JP2010066185A (ja) | ガスクロマトグラフ装置 | |
| WO2018207228A1 (ja) | クロマトグラフ質量分析データ処理装置及びクロマトグラフ質量分析データ処理用プログラム | |
| JPWO2018173223A1 (ja) | 質量分析装置及びクロマトグラフ質量分析装置 | |
| JP5757264B2 (ja) | クロマトグラフ質量分析データ処理装置 | |
| US20220187262A1 (en) | Device and method for anomaly detection of gas sensor | |
| WO2024218866A1 (ja) | 分析装置 | |
| JP2022545666A (ja) | 機械学習を使用した圧力トレースからのlc問題診断 | |
| CN112514028B (zh) | 质量分析装置及质量分析方法 | |
| JP6413785B2 (ja) | 質量分析装置及びクロマトグラフ質量分析装置 | |
| JP5747839B2 (ja) | クロマトグラフ質量分析用データ処理装置 | |
| US20060219893A1 (en) | Apparatus and method for detecting threats | |
| EP3561500B1 (en) | Mass spectrometer and program for mass spectrometer | |
| CN119780326B (zh) | 一种进出口食品中有害物残留质谱检测方法 | |
| JP4999995B1 (ja) | 解析装置、解析方法、及びプログラム | |
| CN114544795B (zh) | 质谱中气体流参数的异常检测 | |
| JP2006113034A (ja) | タンパク質データの分析 | |
| JP2020046272A (ja) | 保守管理装置、保守管理方法および保守管理プログラム | |
| EP1328785A1 (en) | Improved method of measuring vacuum pressure in sealed vials | |
| AU2001295780A1 (en) | Improved method of measuring vacuum pressure in sealed vials | |
| CN104409310A (zh) | 一种离子透镜系统的调谐方法及装置 |
Legal Events
| Date | Code | Title | Description |
|---|---|---|---|
| 121 | Ep: the epo has been informed by wipo that ep was designated in this application |
Ref document number: 23934012 Country of ref document: EP Kind code of ref document: A1 |
|
| ENP | Entry into the national phase |
Ref document number: 2025514930 Country of ref document: JP Kind code of ref document: A |
|
| WWE | Wipo information: entry into national phase |
Ref document number: 2025514930 Country of ref document: JP |
|
| NENP | Non-entry into the national phase |
Ref country code: DE |
|
| 122 | Ep: pct application non-entry in european phase |
Ref document number: 23934012 Country of ref document: EP Kind code of ref document: A1 |