WO2024070682A1 - 解析方法および解析装置 - Google Patents
解析方法および解析装置 Download PDFInfo
- Publication number
- WO2024070682A1 WO2024070682A1 PCT/JP2023/033319 JP2023033319W WO2024070682A1 WO 2024070682 A1 WO2024070682 A1 WO 2024070682A1 JP 2023033319 W JP2023033319 W JP 2023033319W WO 2024070682 A1 WO2024070682 A1 WO 2024070682A1
- Authority
- WO
- WIPO (PCT)
- Prior art keywords
- calculated
- electrolyte
- drs signal
- spectrum signal
- dielectric relaxation
- Prior art date
- Legal status (The legal status is an assumption and is not a legal conclusion. Google has not performed a legal analysis and makes no representation as to the accuracy of the status listed.)
- Ceased
Links
Images








Classifications
-
- G—PHYSICS
- G01—MEASURING; TESTING
- G01N—INVESTIGATING OR ANALYSING MATERIALS BY DETERMINING THEIR CHEMICAL OR PHYSICAL PROPERTIES
- G01N27/00—Investigating or analysing materials by the use of electric, electrochemical, or magnetic means
- G01N27/02—Investigating or analysing materials by the use of electric, electrochemical, or magnetic means by investigating impedance
- G01N27/04—Investigating or analysing materials by the use of electric, electrochemical, or magnetic means by investigating impedance by investigating resistance
- G01N27/06—Investigating or analysing materials by the use of electric, electrochemical, or magnetic means by investigating impedance by investigating resistance of a liquid
-
- G—PHYSICS
- G01—MEASURING; TESTING
- G01N—INVESTIGATING OR ANALYSING MATERIALS BY DETERMINING THEIR CHEMICAL OR PHYSICAL PROPERTIES
- G01N22/00—Investigating or analysing materials by the use of microwaves or radio waves, i.e. electromagnetic waves with a wavelength of one millimetre or more
-
- G—PHYSICS
- G01—MEASURING; TESTING
- G01N—INVESTIGATING OR ANALYSING MATERIALS BY DETERMINING THEIR CHEMICAL OR PHYSICAL PROPERTIES
- G01N27/00—Investigating or analysing materials by the use of electric, electrochemical, or magnetic means
- G01N27/02—Investigating or analysing materials by the use of electric, electrochemical, or magnetic means by investigating impedance
- G01N27/026—Dielectric impedance spectroscopy
Definitions
- This technology is an analysis method and analysis device.
- a calibration model is prepared that represents the relationship between the intensity of the complex dielectric constant in a specific frequency band and the concentration, and the complex dielectric constant is measured in that specific frequency band, and the concentration of the electrolyte is calculated based on the complex dielectric constant measurement results (see, for example, Patent Document 1).
- NMR nuclear magnetic resonance
- the analysis method of one embodiment of the present technology performs molecular dynamics calculations on an electrolyte to calculate the behavior over time of a series of atoms constituting the electrolyte, calculates a first dielectric relaxation spectrum signal of the constituent components based on the behavior over time of the series of atoms, calculates a second dielectric relaxation spectrum signal of the electrolyte based on the first dielectric relaxation spectrum signal, and calculates physical property values specific to the constituent components based on the first dielectric relaxation spectrum signal and the second dielectric relaxation spectrum signal.
- the analysis device of one embodiment of the present technology includes a calculation unit that calculates physical property values related to the electrolyte, and the calculation unit calculates the behavior over time of a series of atoms that constitute the constituent components of the electrolyte by performing molecular dynamics calculations on the electrolyte, calculates a first dielectric relaxation spectrum signal of the constituent components based on the behavior over time of the series of atoms, calculates a second dielectric relaxation spectrum signal of the electrolyte based on the first dielectric relaxation spectrum signal, and calculates physical property values specific to the constituent components based on the first dielectric relaxation spectrum signal and the second dielectric relaxation spectrum signal.
- the analytical method or apparatus performs molecular dynamics calculations on an electrolyte to calculate the behavior over time of a series of atoms constituting the electrolyte, calculate a first dielectric relaxation spectrum signal of the constituent, calculate a second dielectric relaxation spectrum signal of the electrolyte, and calculate physical property values specific to the constituent, thereby making it possible to easily and accurately analyze the physical properties of the electrolyte.
- FIG. 11 is a block diagram showing a configuration of an analysis device in a second modified example.
- 1 shows the calculation results of a time correlation function in Example 1.
- 1 shows an approximation result of a time correlation function in Example 1.
- 1 shows the calculation results of individual calculated dielectric relaxation spectrum signals (real parts of dielectric constant) and calculated dielectric relaxation spectrum signals (real parts of dielectric constant) in Example 1.
- 1 shows the calculation results of an individual calculated dielectric relaxation spectrum signal (imaginary part of dielectric constant) and a calculated dielectric relaxation spectrum signal (imaginary part of dielectric constant) in Example 1.
- 1 shows the calculation results of the calculated dielectric relaxation spectrum signal (dielectric real part and dielectric imaginary part) in Example 1.
- Example 1 shows the measurement results of the actually measured dielectric relaxation spectrum signal (dielectric real part and dielectric imaginary part) in Example 1.
- 13 shows the calculation results of an individual calculated dielectric relaxation spectrum signal (imaginary part of dielectric constant) and a calculated dielectric relaxation spectrum signal (imaginary part of dielectric constant) in Example 2.
- 1 shows the calculation results of the calculated dielectric relaxation spectrum signal (dielectric real part and dielectric imaginary part) in Example 2.
- 1 shows the measurement results of the actually measured dielectric relaxation spectrum signal (the real part of the dielectric constant and the imaginary part of the dielectric constant) in Example 2.
- 13 shows the results of calculation of individual calculated dielectric relaxation spectrum signals (imaginary part of dielectric constant) in Example 3 (three-component system).
- Example 3 shows the results of calculation of individual calculated dielectric relaxation spectrum signals (imaginary part of dielectric constant) in Example 3 (two-component system). 13 shows the calculation results of the calculated dielectric relaxation spectrum signal (dielectric real part and dielectric imaginary part) in Example 3. 1 shows the measurement results of the actually measured dielectric relaxation spectrum signal (dielectric real part and dielectric imaginary part) in Example 3.
- Analysis device and analysis method (first embodiment) 1-1.
- Analysis device 1-2. Analysis method 1-3. Actions and effects 2.
- Analysis device 2-2. Analysis method 2-3. Actions and effects 3. Modifications
- the analysis method in the first embodiment of the present technology is explained by the operation (analysis procedure) of the analysis device described here, so the analysis method will also be explained below.
- This analysis device is used to analyze the physical properties of an electrolyte, and the results of the analysis of the physical properties are used as a guideline for designing the composition of an electrolyte with the desired performance.
- This electrolyte contains one or more types of constituent components, and the analysis device analyzes the overall physical properties of the electrolyte, as well as the physical properties of each of the constituent components contained in the electrolyte.
- the one or more types of components described here include one or more types of neutral molecules and ion pairs.
- the type of neutral molecule may be only one type, or may be two or more types.
- the type of ion pair may be only one type, or may be two or more types. Details of the neutral molecules and ion pairs will be described later.
- the electrolyte is a liquid electrolyte with ionic conductivity, and contains a solvent and an electrolyte salt. Details of the solvent and the electrolyte salt will be described later.
- the electrolyte can be used in any application, but examples include electricity storage devices such as batteries and capacitors.
- the battery may be a primary battery or a secondary battery.
- the mobility (particularly rotational mobility) of each component contained in an electrolyte is an important factor that significantly affects the ion transport properties of the electrolyte. Therefore, by analyzing an electrolyte using an analytical device, it is possible to grasp the overall physical properties of the electrolyte, which reflect the physical properties resulting from the mobility of each component, as well as the physical properties of each component resulting from that mobility. This makes it possible to easily and accurately design the composition of an electrolyte with excellent ion transport properties.
- the analysis device described here uses molecular dynamics calculations to calculate the dielectric relaxation spectrum signals of each component in order to analyze the physical properties of the electrolyte, more specifically, the physical properties of each component contained in the electrolyte.
- MD calculations molecular dynamics calculations
- DRS signals dielectric relaxation spectrum signals
- the DRS signal is a signal that represents the dielectric behavior of a material (a so-called complex dielectric spectrum signal) and contains a real part of the dielectric constant and an imaginary part of the dielectric constant.
- Analysis equipment 1 shows a block diagram of an analysis device 100, which is a specific example of an analysis device in the first embodiment. As shown in FIG. 1, the analysis device 100 includes a calculation unit 10 and a measurement unit 20. and a comparison unit 30.
- the calculation unit 10 calculates a physical property value P for the electrolyte solution containing the constituent C.
- the type of the constituent C may be only one type or may be two or more types.
- the type of the physical property value P is not particularly limited, so it may be only one type or may be two or more types.
- the physical property value P includes one or more types of characteristic time, relaxation strength, static dielectric constant, concentration, and salt dissociation degree. Details of the characteristic time, relaxation strength, static dielectric constant, concentration, and salt dissociation degree will be described later.
- This calculation unit 10 includes a calculation element that performs a series of calculation processes such as MD calculations, and a specific example of such a calculation element is a microprocessor.
- the calculation unit 10 performs MD calculations on the electrolyte to calculate the behavior over time of a series of atoms that make up component C. This MD calculation tracks the change over time in the behavior (position and energy) of each atom that makes up the substance by solving Newton's equations of motion in classical mechanics.
- the method of MD calculation (including the type of force field) is not particularly limited as long as the software is capable of performing the MD calculation. In this case, the conditions for the MD calculation can be set arbitrarily.
- the calculation unit 10 also calculates the DRS signal of component C based on the calculation results using the MD calculation, i.e., the calculation results of the behavior of a series of atoms over time. Specifically, the calculation unit 10 calculates the DRS signal of component C based on the calculation results using the MD calculation, and calculates the DRS signal of the entire electrolyte based on the DRS signal of component C.
- the former DRS signal is the DRS signal (first dielectric relaxation spectrum signal) of component C calculated by calculation unit 10, and hereinafter this DRS signal is referred to as the "individual calculated DRS signal S1.”
- the latter DRS signal is the DRS signal (second dielectric relaxation spectrum signal) of the electrolyte calculated by calculation unit 10, and hereinafter this DRS signal is referred to as the "calculated DRS signal S2.”
- the calculation unit 10 calculates the individual calculated DRS signal S1, and then sets the individual calculated DRS signal S1 as the calculated DRS signal S2.
- the calculation unit 10 calculates the individual calculated DRS signal S1 for each component C, and then calculates the calculated DRS signal S2 by adding up the individual calculated DRS signals S1 for each component C.
- the calculation unit 10 calculates not only the calculated DRS signal S2 of the electrolyte but also the individual calculated DRS signal S1 of the constituent C in order to make it possible to attribute the DRS signal (actually measured DRS signal S3) measured by the actual measurement unit 20 using the individual calculated DRS signal S1, as described below.
- calculation unit 10 calculates the physical property value P specific to the constituent C based on the individual calculated DRS signal S1 and the calculated DRS signal S2.
- the calculation unit 10 performs the calculation process described below in order to calculate the individually calculated DRS signal S1. That is, the calculation unit 10 calculates the total electric dipole moment of the component C based on the calculation result of the MD calculation. The calculation unit 10 also calculates the time correlation function of the component C based on the calculation result of the total electric dipole moment, and then approximates the calculation result of the time correlation function to an exponential function. Furthermore, the calculation unit 10 calculates the individually calculated DRS signal S1 of the component C by Fourier transforming the approximation result of the time correlation function.
- an individual calculated DRS signal S1 is calculated for each of the constituent components C, and thus multiple individual calculated DRS signals S1 are obtained. Therefore, as described above, the multiple individual calculated DRS signals S1 are added together to calculate the calculated DRS signal S2 of the electrolyte.
- calculation procedure 1 the calculation procedure for the individually calculated DRS signal S1 in the first embodiment will be referred to as "calculation procedure 1" to distinguish it from the calculation procedure for the individually calculated DRS signal S1 in the second embodiment described later.
- This data D1 includes information such as the individual calculated DRS signal S1, the calculated DRS signal S2, and the physical property value P.
- the measurement unit 20 measures the DRS signal of the electrolyte by analyzing the electrolyte using dielectric relaxation spectroscopy.
- This DRS signal is the DRS signal (third dielectric relaxation spectrum signal) of the electrolyte measured by the measurement unit 20, and hereinafter, this DRS signal is referred to as the "measured DRS signal S3.”
- the dielectric relaxation spectroscopy is a useful analysis method that can grasp the ion transportability of the electrolyte as well as the mobility of each component C that affects the ion transportability.
- the measurement unit 20 After measuring the actual DRS signal S3, the measurement unit 20 corrects the actual DRS signal S3. In this case, it is preferable for the measurement unit 20 to correct the actual DRS signal S3 by removing errors caused by the ionic conductivity of the electrolyte from the actual DRS signal S3. This is because errors caused by physical properties other than the mobility of each component C are eliminated, improving the measurement accuracy of the actual DRS signal S3.
- the measurement unit 20 includes a dielectric spectroscopy unit and a correction unit, not shown.
- the dielectric spectroscopy unit measures the measured DRS signal S3 by irradiating the electrolyte with electromagnetic waves and receiving a response wave from the electrolyte.
- the method for measuring the measured DRS signal S3 is not particularly limited, but as an example, the reflection transmission method (S-parameter method) is preferable. This is because it is possible to measure the measured DRS signal S3 of the liquid (electrolyte in this case) with high accuracy.
- the dielectric spectroscopy unit After measuring the measured DRS signal S3, the dielectric spectroscopy unit outputs the measurement result of the measured DRS signal S3 to the correction unit.
- the dielectric spectroscopy section includes a measurement cell, a transmitter, a receiver, a dielectric spectroscopy sensor, and a computing element.
- the measurement cell is a container that holds an electrolyte. It is preferable that the electrolyte held inside the measurement cell does not contain any air bubbles. In addition, it is preferable that the amount of electrolyte held in the measurement cell is an appropriate amount that can be contacted by the probe described below.
- the transmitter irradiates electromagnetic waves such as microwaves to the electrolyte contained inside the measurement cell.
- the frequency of the microwaves is not particularly limited, but an example would be 100 MHz to 100 GHz.
- the receiver receives the response wave from the measurement cell via the dielectric spectroscopy sensor.
- This response wave includes electromagnetic waves reflected by the electrolyte and electromagnetic waves transmitted through the electrolyte.
- the calculation element calculates the measured DRS signal S3 based on the amplitude and phase of the response wave received by the receiver.
- a specific example of the calculation element is a microprocessor.
- the dielectric spectroscopy section that measures the measured DRS signal S3 using the reflection transmission method is a vector network analyzer (VNA) to which an open-ended probe is connected via a microwave coaxial cable.
- VNA vector network analyzer
- This probe is connected to the measurement cell via two ports (a first port and a second port), and the microwave coaxial cable is a coaxial cable that corresponds to the frequency band of the microwaves irradiated to the electrolyte.
- the dielectric spectroscopy section using this reflection transmission method calculates the measured DRS signal S3 using reflection coefficients S11 and S22, which are defined as the reflected wave/incident wave.
- the reflection coefficient S11 is the reflection coefficient corresponding to the first port
- the reflection coefficient S22 is the reflection coefficient corresponding to the second port.
- the correction section corrects the measurement results of the actual DRS signal S3 measured by the dielectric spectroscopy section.
- the correction method of the correction section is not particularly limited and can be set arbitrarily. In particular, in order to focus on the rotational part of the molecular motion of each constituent component C, it is preferable that the correction section removes errors caused by ionic conductivity (ionic conductivity) contained in the measurement results of the actual DRS signal S3, as described above.
- the correction section when the measured DRS signal S3 is input from the dielectric spectroscopy section, the correction section performs fitting using a so-called Debye type relaxation function on the imaginary part of the dielectric constant of the measured DRS signal S3 in a frequency band of 500 MHz or more, which is generally less susceptible to errors caused by the ionic conductivity of the electrolyte. In this way, the correction section corrects the measured DRS signal S3 in a frequency band of less than 500 MHz by extrapolating the fitting results to the low frequency side.
- the measured DRS signal S3 corresponding to the error removed by the correction unit represents the physical properties of each component C due to the ionic conduction phenomenon, as described above, and the physical properties are information regarding the motility (ion transport properties) other than the rotational motion.
- the measured DRS signal S3 removed by the correction unit may be used separately to grasp the physical properties of the electrolyte as information regarding the motility other than the rotational motion of each component C.
- correction unit An example of a correction unit is a microprocessor.
- the measurement unit 20 includes a correction unit to correct the measurement result of the measured DRS signal S3. However, if there is no need to correct the measurement result of the measured DRS signal S3, the measurement unit 20 does not need to include a correction unit.
- the measurement unit 20 After measuring the actual DRS signal S3, the measurement unit 20 outputs data D2 to the comparison unit 30.
- This data D2 includes information such as the actual DRS signal S3.
- the comparison unit 30 compares the calculated DRS signal S2 and the measured DRS signal S3 with each other based on the data D1 input from the calculation unit 10 and the data D2 input from the measurement unit 20. As a result, the comparison unit 30 assigns the measured DRS signal S3 using the individual calculated DRS signal S1, which is a component of the calculated DRS signal S2, according to the comparison result between the calculated DRS signal S2 and the measured DRS signal S3.
- a specific example of the comparison unit 30 is a microprocessor.
- the comparison unit 30 confirms that the calculated DRS signal S2 and the measured DRS signal S3 qualitatively match each other.
- the comparison unit 30 compares the spectral shape of the calculated DRS signal S2 with the spectral shape of the measured DRS signal S3 to confirm that the calculated DRS signal S2 and the measured DRS signal S3 qualitatively match each other.
- the comparison unit 30 confirms that the spectral shape of the calculated DRS signal S2 and the spectral shape of the measured DRS signal S3 qualitatively match each other, it determines that the calculated DRS signal S2 and the measured DRS signal S3 qualitatively match each other.
- This comparison unit 30 includes an arithmetic element that performs a comparison process between the calculated DRS signal S2 and the measured DRS signal S3 using image analysis processing, and a specific example of the arithmetic element is a microprocessor.
- the method of the comparison process is not particularly limited as long as the software is capable of executing the comparison process. In this case, the conditions for the comparison process can be set arbitrarily.
- the comparison unit 30 compares the calculated DRS signal S2 with the correction result of the measured DRS signal S3 to assign the calculated DRS signal S2 to the measured DRS signal S3.
- the measured DRS signal S3 actually measured by the measurement unit 20 using an electrolyte is important information for investigating the physical properties (mobility at the molecular level) of the electrolyte, but it is difficult to grasp the detailed physical properties of the electrolyte using only the measured DRS signal S3.
- the measured DRS signal S3 of the electrolyte is a signal obtained by adding up the DRS signals that should be measured for each constituent component C, but it is extremely difficult to measure the DRS signal for each constituent component C in the measurement unit 20.
- the measured DRS signal S3 of the electrolyte is a signal obtained by adding up the DRS signals that should be measured for each constituent component C, but it is extremely difficult to measure the DRS signal for each constituent component C in the measurement unit 20.
- the comparison unit 30 acquires the calculated DRS signal S2 and the measured DRS signal S3, and then verifies that the calculated DRS signal S2 and the measured DRS signal S3 qualitatively match each other.
- the measured DRS signal S3 measured by the measurement unit 20 is one DRS signal measured for the electrolyte, as described above.
- the calculated DRS signal S2 calculated by the calculation unit 10 is a DRS signal obtained by adding together the individual calculated DRS signals S1 calculated for each constituent component C, as described above, and therefore is one DRS signal calculated for the electrolyte (calculated DRS signal S2) and includes DRS signals calculated for each constituent component C (individual calculated DRS signals S1).
- the comparison unit 30 confirms that the calculated DRS signal S2 and the measured DRS signal S3 qualitatively match each other, the reliability of the calculated DRS signal S2 relative to the measured DRS signal S3 (in other words, the validity of the MD calculation) is guaranteed, and the reliability of the individual calculated DRS signals S1 constituting the calculated DRS signal S2 is also guaranteed. Therefore, even if it is not possible to measure a DRS signal for each constituent component C, it is technically guaranteed that the individual calculated DRS signals S1 can be adopted as information representing the physical properties of each constituent component C, and it becomes possible to attribute the measured DRS signal S3 using the individual calculated DRS signals S1.
- This comparison unit 30 performs comparison and attribution based on the calculated DRS signal S2 and the measured DRS signal S3, and then outputs data D3 to the outside.
- This data D3 includes information such as the individual calculated DRS signal S1, the calculated DRS signal S2, the measured DRS signal S3, and the physical property value P.
- Analysis device 100 may further include one or more of the other components.
- the display unit displays the calculation results by the calculation unit 10, the measurement results by the measurement unit 20, and the comparison results (attribution results) by the comparison unit 30.
- the memory unit stores a series of calculation results calculated by the analysis device 100.
- the power supply is the power source for the analysis device 100.
- the electrolyte solution used in the analysis using analysis device 100 contains a solvent and an electrolyte salt.
- the electrolyte solution may further contain one or more of various additives.
- the solvent is one or more of the media that disperse or dissolve the electrolyte salt, and may be an aqueous solvent or a non-aqueous solvent.
- non-aqueous solvent is not particularly limited, but examples include one or more of cyclic carbonate esters, chain carbonate esters, and chain carboxylate esters.
- cyclic carbonates include ethylene carbonate and propylene carbonate.
- chain carbonates include dimethyl carbonate, diethyl carbonate, and ethyl methyl carbonate.
- chain carboxylates include ethyl propionate and propyl propionate.
- the electrolyte salt is a solute dispersed or dissolved in a solvent, and contains one or more kinds of metal salts.
- the type of metal salt is not particularly limited, but as an example, the metal salt contains one or more kinds of lithium salts selected from lithium hexafluorophosphate (LiPF 6 ), lithium tetrafluoroborate (LiBF 4 ), lithium bis(fluorosulfonyl)imide (LiN(FSO 2 ) 2 ), lithium bis(trifluoromethanesulfonyl)imide (LiN(CF 3 SO 2 ) 2 ), etc.
- component C contains one or more of neutral molecules and ion pairs.
- Neutral molecules are electrically neutral molecules and are chemically and temporally stable components. There are no particular limitations on the type of neutral molecule, but an example would be a solvent molecule.
- An ion pair is an electrical bond between a cation and an anion.
- ion pair There are no particular limitations on the type of ion pair. Examples include contact ion pairs (CIP), solvent-separated ion pairs (SIP), and solvent-separated ion pairs (SSIP), and other electrical bonds may also be used.
- CIP contact ion pairs
- SIP solvent-separated ion pairs
- SSIP solvent-separated ion pairs
- the types of ions that form an ion pair are not particularly limited as long as they are two or more types. Therefore, the types of cations that form an ion pair may be one type or two or more types. Similarly, the types of anions that form an ion pair may be one type or two or more types.
- the ion pairs described here include not only electrical bonds between one type of cation and one type of anion, but also electrical bonds between two or more types of cations and two or more types of anions (so-called ionic bonds). These ionic bonds also include polymers such as tetramers.
- ion pairs are dynamic components that alternately form (assemble) and disappear (disperse) over time in the electrolyte.
- the analysis device 100 can not only investigate the physical properties of neutral molecules, but also the physical properties of ion pairs by analyzing the electrolyte using the calculation unit 10, measurement unit 20, and comparison unit 30.
- the electrolyte contains two or more types of constituent components C (multiple neutral molecules m and multiple ion pairs x).
- MD calculation Specifically, first, an MD calculation for the electrolyte is performed.
- two or more types of constituent components C contained in the electrolyte are unknown, two or more types of constituent components C that are assumed to be contained in the electrolyte may be set.
- the method of MD calculation (including the type of force field) is not particularly limited as long as the software is capable of performing the MD calculation as described above. In this case, the conditions for the MD calculation can be set arbitrarily.
- the electric dipole moment is calculated only when the condition that the distance r WX between the center of gravity W of the cation and the center of gravity X of the anion is equal to or less than a predetermined distance is satisfied.
- the electrolyte salt is lithium hexafluorophosphate (LiPF 6 )
- the threshold value (distance r WX ) of "0.425 nm" mentioned above is the position where the radial distribution function of the phosphorus atom (P) centered on the lithium atom shows the first dip when the electrolyte salt is lithium hexafluorophosphate (LiPF 6 ), and is a value that is appropriately determined according to the type of cation and the type of anion. Note that, although the ion pair x when focusing on the closest position between the lithium atom and the anion is the CIP, it is possible to perform a similar analysis for ion pairs x other than the CIP by determining the second closest position based on the radial distribution function.
- the time correlation function of the total electric dipole moment for the neutral molecule m is calculated using the formula (4).
- time correlation function of the total electric dipole moment for the ion pair x is calculated using the formula (5).
- the least squares method is used to fit the time correlation function of the neutral molecule m. This removes noise (fluctuation error) from the time correlation function, suppressing the effects of calculation errors in the Fourier transform described below.
- the least squares method is also used to fit the time correlation function of the ion pair x. This removes noise (fluctuation error) from the time correlation function, and as described above, the effects of calculation errors in the Fourier transform described below are suppressed.
- the relaxation strength ⁇ m of the neutral molecule m is calculated using the calculation formula expressed by formula (8).
- the relaxation strength ⁇ m is used to Fourier transform the approximation result of the time correlation function for the neutral molecule m, thereby calculating the real part of the dielectric constant using the calculation formula expressed by formula (6) and calculating the imaginary part of the dielectric constant using the calculation formula expressed by formula (7).
- an individual calculation DRS signal S1 including the real part of the dielectric constant and the imaginary part of the dielectric constant is calculated for the neutral molecule m.
- ⁇ m is the relaxation strength of neutral molecule m; V is the volume; K B is the Boltzmann constant; T is the temperature.
- the relaxation strength ⁇ x of the ion pair x is calculated using the calculation formula expressed by formula (11).
- the relaxation strength ⁇ x is used to Fourier transform the approximation result of the time correlation function for the ion pair x, thereby calculating the real part of the dielectric constant using the calculation formula expressed by formula (9) and calculating the imaginary part of the dielectric constant using the calculation formula expressed by formula (10). In this way, an individual calculated DRS signal S1 including the real part of the dielectric constant and the imaginary part of the dielectric constant is calculated for the ion pair x.
- ⁇ x is the relaxation strength of ion pair x.
- V is the volume.
- K B is the Boltzmann constant.
- T is the temperature.
- A is a scaling factor.
- a scaling factor A is used when calculating the relaxation strength ⁇ x of the ion pair x. If the total electric dipole moment of the ion pair x is calculated without considering the effect of the solvent present around the ion pair x, the accuracy of the finally calculated individually calculated DRS signal S1 may be reduced due to an error. Therefore, in order to effectively introduce the shielding effect of the solvent around the ion pair x, an appropriate scaling factor A is used.
- the value of the scaling factor A is not particularly limited, but an example is 0.25.
- the calculated DRS signal S2 of the electrolyte is calculated by adding the individual calculated DRS signal S1 of the neutral molecule m and the individual calculated DRS signal S1 of the ion pair x.
- a physical property value P specific to each constituent component C is calculated based on the individual calculated DRS signal S1 and the calculated DRS signal S2.
- the relaxation strength ⁇ m is calculated using the formula (8) as described above.
- the relaxation strength ⁇ x is calculated using the formula (11) as described above.
- the characteristic time ⁇ m of a neutral molecule m When calculating the characteristic time ⁇ m of a neutral molecule m, the frequency of the peak position of the individual calculated DRS signal S1 (imaginary part of dielectric constant) for the neutral molecule m is set as a specific frequency ⁇ m , and the characteristic time ⁇ m is calculated using the calculation formula expressed by formula (12). This characteristic time ⁇ m is the reciprocal of the specific frequency ⁇ m .
- the characteristic time ⁇ x is calculated using the formula (13) by setting the frequency of the peak position of the individual calculation DRS signal S1 (imaginary part of dielectric constant) related to the ion pair x as a specific frequency ⁇ x .
- This characteristic time ⁇ x is the reciprocal of the specific frequency ⁇ x .
- the dielectric constant is calculated as ⁇ 0 (or ⁇ 0) based on the individual calculated DRS signal S1 (dielectric constant real part) for that neutral molecule m, and the calculated value of the dielectric constant is set as the static dielectric constant ⁇ m sta .
- the dielectric constant is calculated as ⁇ 0 (or ⁇ 0) based on the individual calculated DRS signal S1 (dielectric constant real part) for the ion pair x, and the calculated value of the dielectric constant is set as the static dielectric constant ⁇ x sta .
- the electrolyte is analyzed by the measurement unit 20 using dielectric relaxation spectroscopy according to the procedure described below, thereby measuring the measured DRS signal S3 of the electrolyte.
- the measured DRS signal S3 is corrected.
- the measured DRS signal S3 is fitted using a Debye type relaxation function to remove errors caused by the ionic conductivity of the electrolyte from the measured DRS signal S3.
- the comparison unit 30 compares the calculated DRS signal S2 and the measured DRS signal S3 with each other and confirms that the calculated DRS signal S2 and the measured DRS signal S3 qualitatively match each other, thereby attributing the measured DRS signal S3 using the individual calculated DRS signal S1, which is a component of the calculated DRS signal S2.
- the spectral shapes of the calculated DRS signal S2 and the measured DRS signal S3 are compared to determine whether they qualitatively match each other.
- comparison items when comparing the spectral shapes of both are as follows. (1) The frequency value at the peak position of the imaginary part of the dielectric constant; (2) The intensity value at the peak position of the imaginary part of the dielectric constant; (3) The static dielectric constant; (4) The tendency of the series of values shown in (1) to (3) to change when the concentration of the electrolyte is changed.
- the reliability of the calculated DRS signal S2 is guaranteed, and therefore the reliability of the multiple individual calculated DRS signals S1 that make up the calculated DRS signal S2 is also guaranteed. Therefore, if the measured DRS signal S3 could be decomposed into its constituent components C, there would be no technical or logical (accuracy) problem in assuming that multiple individual calculated DRS signals S1 would be obtained.
- the analysis device 100 may store the data D3 internally without outputting the data D3 externally.
- the analysis device 100 may store the data D3 internally and output the data D3 externally.
- the analysis device 100 includes a calculation unit 10, a measurement unit 20, and a comparison unit 30.
- the calculation unit 10 calculates the individual calculated DRS signal S1 and the calculated DRS signal S2 using MD calculations related to the electrolyte, and calculates the physical property value P.
- the measurement unit 20 measures the measured DRS signal S3 related to the electrolyte by analyzing the electrolyte using dielectric relaxation spectroscopy.
- the comparison unit 30 compares the calculated DRS signal S2 and the measured DRS signal S3 with each other, thereby attributing the measured DRS signal S3 using the individual calculated DRS signal S1, which is a component of the calculated DRS signal S2.
- the calculation unit 10 calculates the individually calculated DRS signal S1 using calculation procedure 1. Specifically, the calculation unit 10 calculates the total electric dipole moment of the component C, calculates the time correlation function of the component C, approximates the time correlation function to an exponential function, and performs a Fourier transform on the approximation result of the time correlation function to calculate the individually calculated DRS signal S1 of the component C.
- the comparison unit 30 compares the calculated DRS signal S2 of the electrolyte calculated by the calculation unit 10 using MD calculation with the measured DRS signal S3 of the electrolyte measured by the measurement unit 20 using dielectric relaxation spectroscopy.
- the reliability of the calculated DRS signal S2 relative to the measured DRS signal S3 is guaranteed, and the reliability of the multiple individual calculated DRS signals S1 that make up the calculated DRS signal S2 is also guaranteed. Therefore, it becomes possible to attribute the measured DRS signal S3 using the individual calculated DRS signal S1, which is a component of the calculated DRS signal S2.
- the composition of the electrolyte solution having the desired performance can be designed as described above, without actually measuring the physical properties of the neutral molecule m and the physical properties of the ion pair x, and the physical properties of the electrolyte solution can be easily and accurately analyzed.
- the electrolyte contains a solvent and an electrolyte salt, and component C contains one or more of neutral molecules and ion pairs, not only the properties of the neutral molecules but also the properties of the ion pairs are analyzed. Therefore, the properties of the electrolyte can be analyzed with higher accuracy, resulting in greater effectiveness.
- the various physical properties related to the electrolyte can be analyzed with higher accuracy, resulting in greater effectiveness.
- the calculation unit 10 calculates the total electric dipole moment of the component C, calculates the time correlation function of the component C, approximates the time correlation function to an exponential function, and performs a Fourier transform on the time correlation function to calculate the individually calculated DRS signal S1. This allows the individually calculated DRS signal S1 of the component C to be calculated with high accuracy using a calculation process, and therefore a higher effect can be obtained.
- the calculation unit 10 calculates the individual calculated DRS signals S1 for each of the two or more types of constituent C, and then calculates the calculated DRS signal S2 by adding up these individual calculated DRS signals S1, a higher effect can be obtained because the calculated DRS signal S2 is calculated even when there are two or more types of constituent C.
- the measurement unit 20 corrects the measured DRS signal S3 by removing errors caused by the ionic conductivity of the electrolyte from the measured DRS signal S3, and the comparison unit 30 compares the calculated DRS signal S2 with the corrected result of the measured DRS signal S3, thereby improving the accuracy of the comparison and therefore the accuracy of the attribution. Therefore, the physical properties of the electrolyte can be analyzed with higher accuracy, resulting in a greater effect.
- the individual calculated DRS signal S1 and the calculated DRS signal S2 are calculated using MD calculations for the electrolyte
- the measured DRS signal S3 for the electrolyte is measured using dielectric relaxation spectroscopy
- the calculated DRS signal S2 and the measured DRS signal S3 are compared with each other
- the measured DRS signal S3 is assigned using the individual calculated DRS signal S1, which is a component of the calculated DRS signal S2, and the physical property value P for the electrolyte is calculated. Therefore, for the reasons described above, the physical properties of the electrolyte can be analyzed easily and with high accuracy.
- the analysis device 100 of the second embodiment has a configuration similar to that of the analysis device 100 of the first embodiment, except that the calculation procedure of the individually calculated DRS signal S1 by the calculation unit 10 is different, as described below.
- the details of the electrolyte, the constituent component C, and the physical property value P are as described above.
- the configuration of the analysis device 100 in the second embodiment is similar to the configuration of the analysis device 100 in the first embodiment, except as described below.
- the calculation unit 10 performs the calculation process described below in order to calculate the individual calculated DRS signal S1. That is, the calculation unit 10 calculates the individual electric dipole moment of the component C based on the calculation result of the MD calculation. The calculation unit 10 also calculates the time correlation function of the component C based on the individual electric dipole moment, and then calculates the rotational correlation time of the component C by approximating the time correlation function to an exponential function. Furthermore, the calculation unit 10 calculates the individual calculated DRS signal S1 of the component C based on the rotational correlation time.
- calculation procedure 2 the calculation procedure for the individually calculated DRS signal S1 in the second embodiment.
- the configuration of the analysis device 100 in the second embodiment is similar to the configuration of the analysis device 100 in the first embodiment, except that the calculation unit 10 uses calculation procedure 2 instead of calculation procedure 1 to calculate the individually calculated DRS signal S1.
- the procedure of the analysis method in the second embodiment is the same as the procedure of the analysis method in the first embodiment, except as described below.
- the calculation unit 10 To calculate the individual calculation DRS signal S1, the calculation unit 10 performs the calculation process described below based on the results of the MD calculation.
- the coordinates and charge of each atom at each time are read based on the trajectory included in the calculation result of the MD calculation, whereby the individual electric dipole moment of the i-th neutral molecule m among the N m neutral molecules m is calculated at each time, and the individual electric dipole moment of the i-th ion pair x among the N x ion pairs x is calculated at each time.
- the individual dipole moment of the neutral molecule m is normalized to calculate the rotational correlation function of the neutral molecule m using the formula (14) for a unit vector with a length of 1.
- N m is the number of neutral molecules m.
- the rotational correlation function of the ion pair x is calculated using the formula (15) for a unit vector with a length of 1.
- N pair is the number of ion pairs whose individual dipole moments become finite at least once during the trajectory of the MD calculation.
- the rotational correlation time of neutral molecule m is calculated by fitting the rotational correlation function of the neutral molecule m using the least squares method. Also, the rotational correlation time of ion pair x is calculated by fitting the rotational correlation function of ion pair x using the least squares method.
- the characteristic time of neutral molecule m is calculated using the formula (16), and the characteristic frequency of neutral molecule m is calculated using the formula (17).
- the characteristic time of ion pair x is calculated using the formula (18), and the characteristic frequency of ion pair x is calculated using the formula (19).
- the real part of the dielectric constant is calculated by assuming the Debye relaxation expressed by the formula (20) as the relaxation form for restoring the DRS signal
- the imaginary part of the dielectric constant is calculated by assuming the Debye relaxation expressed by the formula (21) as the relaxation form for restoring the DRS signal.
- the calculation method of the relaxation strength ⁇ m is as described above.
- the individually calculated DRS signal S1 including the real part of the dielectric constant and the imaginary part of the dielectric constant is calculated for the neutral molecule m.
- the real part of the dielectric constant is calculated by assuming the Debye relaxation expressed by the formula (22) as the relaxation form, and the imaginary part of the dielectric constant is calculated by assuming the Debye relaxation expressed by the formula (23) as the relaxation form.
- the calculation method of the relaxation strength ⁇ x is as described above. In this way, the individual calculated DRS signal S1 including the real part of the dielectric constant and the imaginary part of the dielectric constant is calculated for the ion pair x.
- the calculated DRS signal S2 of the electrolyte is calculated by adding the individual calculated DRS signal S1 of the neutral molecule m and the individual calculated DRS signal S1 of the ion pair x.
- the analysis device 100 includes the calculation unit 10, the measurement unit 20, and the comparison unit 30 described above.
- the calculation unit 10 calculates the individual calculated DRS signal S1 using calculation procedure 2 instead of calculation procedure 1. Specifically, the calculation unit 10 calculates the individual electric dipole moment of the component C, calculates the rotational correlation function of the component C, approximates the rotational correlation function to an exponential function, calculates the rotational correlation time of the component C, and calculates the individual calculated DRS signal S1 of the component C.
- the reliability of the calculated DRS signal S2 (individually calculated DRS signal S1) relative to the measured DRS signal S3 is guaranteed, and the physical properties of not only the neutral molecule m but also the ion pair x are grasped.
- the composition of the electrolyte solution having the desired performance can be designed without actually measuring the physical properties of the neutral molecule m and the physical properties of the ion pair x, and the physical properties of the electrolyte solution can be easily and accurately analyzed, as in the first embodiment.
- the individual calculated DRS signal S1 and the calculated DRS signal S2 are calculated using MD calculations for the electrolyte, the measured DRS signal S3 for the electrolyte is measured using dielectric relaxation spectroscopy, and the calculated DRS signal S2 and the measured DRS signal S3 are compared with each other, whereby the measured DRS signal S3 is assigned using the individual calculated DRS signal S1, which is a component of the calculated DRS signal S2, and the physical property value P for the electrolyte is calculated. Therefore, for the reasons described above, the physical properties of the electrolyte can be analyzed easily and with high accuracy.
- calculation processing is performed using the calculation unit 10, and then measurement processing is performed using the actual measurement unit 20.
- calculation processing using the calculation unit 10 may be performed after measurement processing using the actual measurement unit 20. Even in this case, since comparison processing can be performed in the comparison unit 30, the same effect can be obtained.
- FIG. 2 shows a block configuration of an analysis device 200 in the second modification, and corresponds to FIG.
- the analysis device 100 includes a calculation unit 10, a measurement unit 20, and a comparison unit 30.
- the analysis device 200 may include only the calculation unit 10 without including the measurement unit 20 and the comparison unit 30.
- the configuration of the analysis device 200 is similar to that of the analysis device 100, except that it does not include the measurement unit 20 and the comparison unit 30, and outputs data D1 to the outside.
- the analysis device 100 in order to guarantee the reliability of the calculation DRS signal S2, it is necessary to perform not only the calculation process of the calculation DRS signal S2 by the calculation unit 10, but also the measurement process of the measured DRS signal S3 by the measurement unit 20 and the comparison process of the calculation DRS signal S2 and the measured DRS signal S3 by the comparison unit 30. Therefore, the analysis device 100 must include not only the calculation unit 10 but also the measurement unit 20 and the comparison unit 30, as shown in FIG. 1.
- the analysis device 200 may have only the calculation unit 10, without having the measurement unit 20 and the comparison unit 30, as shown in FIG. 2.
- the calculation unit 10 may calculate the individually calculated DRS signal S1 using the calculation procedure 1 described in the first embodiment, or the calculation unit 10 may calculate the individually calculated DRS signal S1 using the calculation procedure 2 described in the second embodiment.
- the calculation unit 10 may perform an MD calculation, calculate the total electric dipole moment, calculate a time correlation function, approximate the time correlation function to an exponential function, perform a Fourier transform on the approximation result of the time correlation function, calculate the individual calculated DRS signal S1 and the calculated DRS signal S2, calculate the physical property value P, and output data D1 to the outside.
- the calculation unit 10 may perform an MD calculation, calculate an individual electric dipole moment, calculate a rotational correlation function, approximate the rotational correlation function to an exponential function, calculate a rotational correlation time, calculate each of the individual calculated DRS signals S1 and S2, calculate the physical property value P, and output data D1.
- the reliability of the calculated DRS signal S2 (individually calculated DRS signal S1) is guaranteed, and for the reasons explained in the first and second embodiments, the physical properties of the electrolyte can be analyzed easily and with high accuracy.
- the calculation unit 10 used calculation procedure 1 to calculate the individually calculated DRS signal S1
- the calculation unit 10 used calculation procedure 2 to calculate the individually calculated DRS signal S1.
- the calculation unit 10 may use both calculation procedures 1 and 2 to calculate the individually calculated DRS signal S1.
- the calculation unit 10 may use both calculation procedures 1 and 2 to calculate the individually calculated DRS signal S1.
- the calculation accuracy of the individually calculated DRS signal S1 can be further improved, and a greater effect can be obtained.
- calculation procedure 1 If only one of calculation procedures 1 and 2 is used, it is preferable to use calculation procedure 1.
- the Debye relaxation is assumed as the relaxation form in order for the calculation unit 10 to calculate the individually calculated DRS signal S1.
- the relaxation form is not particularly limited and can be changed arbitrarily.
- the relaxation form may be Cole-Davidson relaxation, in addition to Debye relaxation.
- Cole-Davidson relaxation is assumed as the relaxation form, the above-mentioned characteristic times ⁇ m , ⁇ x and relaxation strengths ⁇ m , ⁇ x may be used as they are, but it should be noted that additional parameters are required.
- the above-mentioned additional parameters are identified by applying the least squares method to each of the calculated DRS signal S2 (individual calculated DRS signal S1) and the measured DRS signal S3. Even when Cole-Davidson relaxation is used as the relaxation form, it is possible to attribute the measured DRS signal S3 using the individual calculated DRS signal S1, as in the case where Debye relaxation is assumed as the relaxation form.
- the reliability of the calculated DRS signal S2 (individually calculated DRS signal S1) is guaranteed, and the measured DRS signal S3 is derived using the individually calculated DRS signal S1, so the physical properties of the electrolyte can be analyzed easily and with high accuracy.
- modified example 2 described here is not limited to the second embodiment, and may be applied to both modified examples 2 and 3. In this case as well, the same effect can be obtained.
- the analysis device 100 includes the comparison unit 30, and as described above, the comparison unit 30 performs a comparison process between the calculated DRS signal S2 and the measured DRS signal S3 by utilizing image analysis processing.
- the analysis device 100 does not necessarily have to include the comparison unit 30.
- a display device that displays the calculated DRS signal S2 and the measured DRS signal S3, etc., may be used so that the user of the analysis device 100 can visually and artificially compare the calculated DRS signal S2 with the measured DRS signal S3. Even in this case, it is possible to attribute the measured DRS signal S3 using the calculated DRS signal S2, and therefore a similar effect can be obtained.
- Example 1 As described below, the properties of the electrolyte solution were investigated by analyzing the electrolyte solution using the analysis device 100 (analysis method) described in the first embodiment.
- the electrolyte solution used here contains propylene carbonate (PC) as a solvent and lithium hexafluorophosphate (LiPF 6 ) as an electrolyte salt.
- PC propylene carbonate
- LiPF 6 lithium hexafluorophosphate
- WMI-MD software capable of executing MD calculations, was used for the calculation unit 10. This software uses APPLE&P as the force field.
- a vector network analyzer (VNA N5234A manufactured by Keysight), a microwave coaxial cable (MWX221 manufactured by JUNFLON), and an open-ended probe (85070E-020 manufactured by Keysight) were used as the dielectric spectroscopy section of the measurement section 20. As described above, this open-ended probe was connected to the vector network analyzer via the microwave coaxial cable.
- the measurement method used for the actual measurement unit 20 is the reflection transmission method (S-parameter method) that uses the reflection coefficients S11 and S22.
- the reflection coefficient S11 is the reflection coefficient of the first port of the vector network analyzer
- the reflection coefficient S22 is the reflection coefficient of the second port of the vector network analyzer.
- the software used to calculate the complex dielectric constant (measured DRS signal S3) based on the reflection coefficient was the software included with the vector network analyzer mentioned above.
- a pure solvent with a known dielectric constant was placed inside the open measurement cell and the measurement was calibrated using that pure solvent.
- the pure solvents used were water, benzonitrile, and N,N-dimethylacetamide.
- a syringe was used to introduce electrolyte into the measurement cell, bringing the tip of the open-ended probe into contact with the electrolyte. In this case, care was taken to ensure that air was not included in the electrolyte, and the amount (volume) of electrolyte contained was kept constant during measurement.
- the comparison unit 30 used software capable of performing comparison processing using image analysis processing, which is a program capable of qualitatively comparing the calculated DRS signal S2 and the measured DRS signal S3 based on the series of comparison items described above. This program is an original program created using Python.
- Figure 3 shows the calculation results of the time correlation function (horizontal axis is time (ns), vertical axis is time correlation function), and Figure 4 shows the approximation results of the time correlation function (horizontal axis is time (ns), vertical axis is time correlation function).
- Figure 5 shows the calculation results of the individual calculated DRS signal S1 (real part of dielectric constant) and the calculated DRS signal S2 (real part of dielectric constant) (horizontal axis is frequency ⁇ (GHz), vertical axis is real part of dielectric constant).
- Figure 6 shows the calculation results of the individual calculated DRS signal S1 (imaginary part of dielectric constant) and the measured DRS signal S3 (imaginary part of dielectric constant) (horizontal axis is frequency ⁇ (GHz), vertical axis is imaginary part of dielectric constant).
- Figure 7 shows the calculation results of the calculated DRS signal S2 (real part of dielectric constant and imaginary part of dielectric constant) (horizontal axis is frequency ⁇ (GHz), vertical axis is real part of dielectric constant and imaginary part of dielectric constant).
- Figure 8 shows the measurement results of the actual DRS signal S3 (the real and imaginary parts of the dielectric constant) (the horizontal axis is the frequency ⁇ (GHz), and the vertical axis is the real and imaginary parts of the dielectric constant).
- the composition of the electrolyte was set in order to perform MD calculations on the electrolyte.
- PC was set as the solvent and LiPF6 was set as the electrolyte salt.
- PC C4H6O3
- CIP Li + PF6-
- the equilibrium volume at room temperature and pressure was obtained in the NPT ensemble, where the number of particles, pressure, and temperature are all constant, and after performing equilibrium calculations for a time period of approximately 10 ns, the main calculations were performed.
- the history of the behavior (position, i.e., coordinates) of the series of atoms that make up each constituent C was obtained.
- the content of the electrolyte salt described here is the content of the electrolyte salt relative to the solvent.
- the total electric dipole moment of each component C (neutral molecule m and ion pair x (CIP)) was calculated, and then the time correlation function of each component C was calculated based on the total electric dipole moment. Details of the calculation procedures for the total electric dipole moment and the time correlation function are as described above.
- the time correlation function was approximated to an exponential function.
- the least squares method was used to fit the time correlation function. This eliminated the calculation error of the time correlation function (fluctuation error of the time correlation function), and the time correlation function was approximated. Details of the approximation procedure for the time correlation function are as described above.
- the approximation result of the time correlation function was Fourier transformed to calculate the individual calculated DRS signal S1 (real part of dielectric constant and imaginary part of dielectric constant) of each constituent C, and then the calculated DRS signal S2 (real part of dielectric constant and imaginary part of dielectric constant) of the electrolyte was calculated by adding up these individual calculated DRS signals S1.
- the value of the scaling factor A was set to 0.25.
- an individual calculated DRS signal S1 (real part of dielectric constant) was obtained for each component C (neutral molecule m (PC) and ion pair x (CIP)).
- an individual calculated DRS signal S1 (imaginary part of dielectric constant) was obtained for each component C (neutral molecule m (PC) and ion pair x (CIP)).
- the horizontal axis indicates frequency ⁇ (GHz) and the vertical axis indicates the real part of dielectric constant.
- the horizontal axis indicates frequency ⁇ (GHz) and the vertical axis indicates the imaginary part of dielectric constant.
- a calculated DRS signal S2 of the electrolyte was obtained.
- the horizontal axis indicates the frequency ⁇ (GHz)
- the vertical axis indicates the real part of the dielectric constant and the imaginary part of the dielectric constant.
- the relaxation strength ⁇ m , characteristic time ⁇ m , concentration n m and static dielectric constant ⁇ m sta were calculated as the physical property values P of the neutral molecule m (PC).
- the relaxation strength ⁇ x , characteristic time ⁇ x , concentration n x and static dielectric constant ⁇ x sta were calculated as the physical property values P of the ion pair x (CIP).
- the salt dissociation degree ⁇ of the electrolyte was calculated. The calculation procedure for each physical property value P is as described above.
- the physical property values P when the content of electrolyte salt in the electrolyte solution was 1M were as follows.
- the salt dissociation degree ⁇ of the electrolyte solution was 0.76.
- data D1 was output from the calculation unit 10 to the comparison unit 30. Details regarding data D1 are as described above.
- an electrolyte solution was prepared by adding an electrolyte salt (LiPF 6 ) to a solvent (PC) and then stirring the solvent, as described above.
- the electrolyte salt content (M) in the electrolyte solution was set to 11 types (0M, 0.2M, 0.4M, 0.6M, 0.8M, 1M, 1.2M, 1.4M, 1.6M, 1.8M, and 2M).
- the electrolyte salt content described here is the electrolyte salt content relative to the solvent.
- the electrolyte was analyzed using dielectric relaxation spectroscopy to measure the measured DRS signal S3 of the electrolyte.
- the response wave reflected and transmitted microwave components
- the measured DRS signal S3 real and imaginary parts of the dielectric constant
- the measured DRS signal S3 was corrected to remove measurement errors caused by the ionic conductivity of the electrolyte.
- the measured DRS signal S3 was fitted using a Debye type relaxation function. As a result, measurement errors caused by motions other than rotational motion were removed from the measured DRS signal S3, and the measured DRS signal S3 was corrected.
- FIG. 8 the real and imaginary parts of the dielectric constant are shown together in one drawing (FIG. 8) to make it easier to compare them with each other.
- the content of the electrolyte salt in the electrolyte solution was set to 11 types, so FIG. 8 shows 11 types of real and imaginary parts of the dielectric constant.
- data D2 was output from the measurement unit 20 to the comparison unit 30. Details regarding data D2 are as described above.
- the frequency ⁇ (the so-called peak position) at which the intensity of the imaginary part of the dielectric constant is at a maximum decreases, and more specifically, the frequency ⁇ decreases from approximately 5 GHz to approximately 0.5 GHz.
- the static dielectric constant ⁇ sta decreased, more specifically, the static dielectric constant ⁇ sta decreased from about 60 to about 35.
- the calculated DRS signal S2 and the measured DRS signal S3 qualitatively matched each other. This ensured the reliability of the calculated DRS signal S2 relative to the measured DRS signal S3, and therefore ensured the reliability of the individual calculated DRS signal S1, which is a component of the calculated DRS signal S2. Therefore, the measured DRS signal S3 could be attributed using the individual calculated DRS signal S1.
- the analysis device 100 output data D3 to the outside. Details regarding data D3 are as described above. This completes the analysis of the electrolyte solution using the analysis device 100.
- the spectral shape of the measured DRS signal S3 is determined mainly according to the spectral shape of the neutral molecule m (PC).
- the frequency ⁇ at which the individual calculated DRS signal S1 (imaginary part of dielectric constant) for the neutral molecule m (PC) is at a maximum decreases as the content of electrolyte salt in the electrolyte increases. This suggests that the mobility of the neutral molecule m (PC) decreases when the content of electrolyte salt in the electrolyte increases.
- the frequency ⁇ at which the intensity of the individually calculated DRS signal S1 (imaginary part of dielectric constant) for the ion pair x (CIP) is at its maximum decreases as the content of electrolyte salt in the electrolyte increases. This suggests that as the content of electrolyte salt in the electrolyte increases, the mobility of the ion pair x (CIP) also decreases.
- the frequency (average coordination number) at which cations (Li + ) and anions (PF 6 - ) come into contact with each other was actually calculated based on the MD calculation trajectory, and it was confirmed that the average coordination number increased as the content of electrolyte salt in the electrolyte solution increased.
- the characteristic frequency v x of the ion pair x (CIP) was decreased more than the characteristic frequency v m of the neutral molecule m (PC). This means that the response of the ion pair x (CIP) to the external electric field is slower than the response of the neutral molecule m (PC) to the external electric field, and therefore the mobility of the ion pair x (CIP) is lower than that of the neutral molecule m (PC).
- the ionic conductivity of the electrolyte can be estimated by utilizing the measurement error due to ionic conductivity calculated during the measurement process of the actual DRS signal S3.
- Example 2 As described below, the electrolyte was analyzed using the analysis device 100 (analysis method) described in the second embodiment to investigate the physical properties of the electrolyte.
- the electrolyte used here contains propylene carbonate (PC) and diethyl carbonate (DEC) as a mixed solvent, and lithium hexafluorophosphate (LiPF 6 ) as an electrolyte salt.
- Figure 9 shows the calculation results of the individual calculated DRS signal S1 (imaginary part of dielectric constant) and the calculated DRS signal S2 (imaginary part of dielectric constant) (horizontal axis is frequency ⁇ (GHz), vertical axis is imaginary part of dielectric constant).
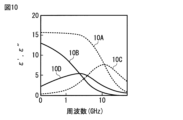
- Figure 10 shows the calculation results of the calculated DRS signal S2 (real part of dielectric constant and imaginary part of dielectric constant) (horizontal axis is frequency ⁇ (GHz), vertical axis is real part of dielectric constant and imaginary part of dielectric constant).
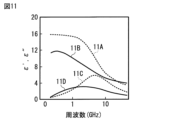
- Figure 11 shows the measurement results of the actual DRS signal S3 (real and imaginary parts of the dielectric constant) (horizontal axis is frequency ⁇ (GHz), vertical axis is real and imaginary parts of the dielectric constant).
- the composition of the electrolyte was set in order to perform MD calculations for the electrolyte.
- PC and DEC were set as the solvent
- LiPF6 was set as the electrolyte salt.
- CIP Li + PF6- ) , which is an ion pair x , were set as the constituent component C.
- the electrolyte salt content in the electrolyte solution was set to two types (0 M and 1 M).
- the electrolyte salt content described here is the electrolyte salt content relative to the solvent, as described above.
- each component C neutral molecule m and ion pair x (CIP)
- CIP neutral molecule m and ion pair x
- the rotational correlation time of each component C was calculated by approximating the rotational correlation function to an exponential function.
- the individual calculated DRS signal S1 (real part of dielectric constant and imaginary part of dielectric constant) of each component C was calculated based on the rotational correlation time, and then the calculated DRS signal S2 (real part of dielectric constant and imaginary part of dielectric constant) of the electrolyte was calculated.
- a calculated DRS signal S2 of the electrolyte was obtained.
- the horizontal axis indicates the frequency ⁇ (GHz)
- the vertical axis indicates the real part of the dielectric constant and the imaginary part of the dielectric constant.
- FIG. 9 shows not only the individual calculated DRS signal S1 (imaginary part of dielectric constant) but also the calculated DRS signal S2 (imaginary part of dielectric constant). Also, in FIG. 10, the positional relationship between the real part of dielectric constant and the imaginary part of dielectric constant is adjusted.
- the relaxation strength ⁇ m , characteristic time ⁇ m , concentration n m and static dielectric constant ⁇ m sta were calculated as the physical property values P of the neutral molecule m (PC, DEC).
- the relaxation strength ⁇ x , characteristic time ⁇ x , concentration n x and static dielectric constant ⁇ x sta were calculated as the physical property values P of the ion pair x (CIP).
- the salt dissociation degree ⁇ of the electrolyte was calculated.
- the physical property values P when the content of the electrolyte salt in the electrolyte solution was 1M were as follows.
- the relaxation strength ⁇ m 9.2
- the characteristic time ⁇ m 31.5 ps
- the concentration n m 2.9 M
- the static dielectric constant ⁇ m sta 9.2.
- the relaxation strength ⁇ m 0.6
- the characteristic time ⁇ m 13.5 ps
- the concentration n m 5.9 M
- the static dielectric constant ⁇ m sta 0.6.
- the relaxation strength ⁇ x 4.1
- the characteristic time ⁇ x 180.0 ps
- the concentration n x 0.4 M
- the static dielectric constant ⁇ x sta 4.1.
- the salt dissociation degree ⁇ of the electrolyte solution was 0.51.
- an electrolyte solution was prepared by adding an electrolyte salt (LiPF 6 ) to a mixed solvent (PC and DEC) and then stirring the mixed solvent as described above.
- an electrolyte salt LiPF 6
- PC and DEC mixed solvent
- the electrolyte salt content (M) in the electrolyte solution was set to two types (0M and 1M).
- the electrolyte salt content described here is the electrolyte salt content relative to the solvent.
- the electrolyte solution was analyzed using dielectric relaxation spectroscopy to measure the actual DRS signal S3 of the electrolyte solution.
- the details of the measurement procedure for the actual DRS signal S3 were the same as in Example 1.
- the measured DRS signal S3 shown in Figure 11 was obtained.
- the horizontal axis represents frequency ⁇ (GHz) and the vertical axis represents the real part and imaginary part of the dielectric constant.
- Figure 11 shows the real part and imaginary part of the dielectric constant together.
- the electrolyte salt content in the electrolyte solution was set to two types, so Figure 11 shows two types of real parts of the dielectric constant and two types of imaginary parts of the dielectric constant.
- the frequency ⁇ at which the intensity of the imaginary part of the dielectric constant is at a maximum decreases, and more specifically, the frequency ⁇ decreases from approximately 7 GHz to approximately 2 GHz.
- the maximum intensity value of the imaginary part of the dielectric constant decreases, and more specifically, the maximum intensity value of the imaginary part of the dielectric constant decreases from approximately 6 to approximately 3.
- the intensity of the real part of the dielectric constant at the time when the frequency ⁇ is at a minimum decreases, and more specifically, the intensity of the real part of the dielectric constant decreases from approximately 16 to approximately 12.
- the frequency ⁇ at which the intensity of the imaginary part of the dielectric constant is at its maximum decreases; more specifically, the frequency ⁇ decreases from approximately 10 GHz to approximately 2 GHz.
- the maximum value of the intensity of the imaginary part of the dielectric constant decreases, and more specifically, the maximum value of the intensity of the imaginary part of the dielectric constant decreases from approximately 8 to approximately 5.
- the intensity of the real part of the dielectric constant when the frequency ⁇ is at a minimum decreases, and more specifically, the intensity of the real part of the dielectric constant decreases from approximately 16 to approximately 13.
- the calculated DRS signal S2 and the measured DRS signal S3 qualitatively matched each other. This ensured the reliability of the calculated DRS signal S2 relative to the measured DRS signal S3, and therefore ensured the reliability of the individual calculated DRS signal S1, which is a component of the calculated DRS signal S2. Therefore, the measured DRS signal S3 could be attributed using the individual calculated DRS signal S1.
- the spectral shape of the measured DRS signal S3 is determined mainly according to the spectral shape of the neutral molecule m (PC).
- the spectral shape of the neutral molecule m (DEC) has almost no effect on the spectral shape of the measured DRS signal S3.
- the frequency ⁇ when the intensity of the individually calculated DRS signal S1 (imaginary part of the dielectric constant) for the neutral molecule m (DEC) is at its maximum is greater than the frequency ⁇ when the intensity of the individually calculated DRS signal S1 (imaginary part of the dielectric constant) for the neutral molecule m (PC) is at its maximum. This suggests that the mobility of the neutral molecule m (DEC) is higher than that of the neutral molecule m (PC).
- the frequency ⁇ when the intensity of the imaginary part of the dielectric constant is maximum in the former case is lower than the frequency ⁇ when the intensity of the imaginary part of the dielectric constant is maximum in the latter case.
- the neutral molecule m (PC) that determines the spectral shape of the measured DRS signal S3.
- the neutral molecule m (DEC) also has a significant effect on the spectral shape of the measured DRS signal S3.
- the relaxation strength ⁇ x in Example 2 is increased compared to the relaxation strength ⁇ x in Example 1.
- this relaxation strength ⁇ x represents the effect of ion pair x (CIP) on the physical properties of the electrolyte. This suggests that even if the content of electrolyte salt in the electrolyte is constant, by increasing the proportion of DEC in the mixed solvent (mixing ratio), ion pair x (CIP) is more likely to be formed in the electrolyte.
- Example 1 In detail, the same advantages as in Example 1 were obtained. In this case, the same advantages were obtained even when using a mixed solvent.
- the electrolyte was analyzed using the analysis device 100 (analysis method) described in the first embodiment to investigate the physical properties of the electrolyte.
- the electrolyte used here contains diethyl carbonate (DEC) as a solvent and lithium hexafluorophosphate (LiPF 6 ) as an electrolyte salt.
- DEC diethyl carbonate
- LiPF 6 lithium hexafluorophosphate
- the configuration of the analysis device 100 in the third embodiment is similar to the configuration of the analysis device 100 in the first embodiment.
- each of Figures 12 and 13 shows the calculation results (horizontal axis is frequency ⁇ (GHz), vertical axis is imaginary part of dielectric constant) of an individual calculation DRS signal S1 for an electrolyte solution with an electrolyte salt content of 1M.
- Figure 12 shows the calculation results when component C is a three-component system
- Figure 13 shows the calculation results when component C is a two-component system. The details of the "three-component system" and "two-component system” described here will be described later.
- Figure 14 shows the calculation results of the calculated DRS signal S2 (real part of dielectric constant and imaginary part of dielectric constant) (horizontal axis is frequency ⁇ (GHz), vertical axis is real part of dielectric constant and imaginary part of dielectric constant).
- Figure 14 shows the calculation results when component C is a three-component system in an electrolyte solution with an electrolyte salt content of 1M.
- Figure 15 shows the measurement results of the measured DRS signal S3 (real part of dielectric constant and imaginary part of dielectric constant) (horizontal axis is frequency ⁇ (GHz), vertical axis is real part of dielectric constant and imaginary part of dielectric constant).
- the composition of the electrolyte was set in order to perform MD calculations for the electrolyte.
- DEC was set as the solvent
- LiPF6 was set as the electrolyte salt.
- the neutral molecule m, DEC ( C5H10O3 ), the ion pair x, CIP (Li + PF6- ), and the ion pair x, ion associate ( Li2 ( PF6 ) 2 ), were set as a system ( ternary system) containing three types of constituent components C.
- multiple types of ion associates including not only Li2 ( PF6 ) 2 but also Li2PF6 and Li( PF6 ) 2 were set as the ion pair x .
- the individual calculated DRS signals S1 real and imaginary parts of the dielectric constant of each component C (neutral molecule m (DEC) and ion pair x (CIP and ion associate)) in the three-component system were calculated using the same procedure as in Example 1, and then the calculated DRS signal S2 (real and imaginary parts of the dielectric constant) of the electrolyte was calculated.
- the individual calculated DRS signals S1 real and imaginary parts of the dielectric constant of each component C (neutral molecule m (DEC) and ion pair x (CIP)) in the two-component system were calculated using the same procedure as in Example 1, and then the calculated DRS signal S2 (real and imaginary parts of the dielectric constant) of the electrolyte was calculated.
- an individual calculated DRS signal S1 (imaginary part of dielectric constant) was obtained for a two-component system (component C is neutral molecule m (DEC) and ion pair x (CIP)).
- component C is neutral molecule m (DEC) and ion pair x (CIP)
- the horizontal axis indicates frequency ⁇ (GHz) and the vertical axis indicates the imaginary part of dielectric constant.
- a calculated DRS signal S2 of the electrolyte was obtained.
- the horizontal axis indicates the frequency ⁇ (GHz)
- the vertical axis indicates the real part of the dielectric constant and the imaginary part of the dielectric constant.
- each of Figures 12 and 13 shows not only the individual calculated DRS signal S1 but also the calculated DRS signal S2. Also, in Figure 14, the positional relationship between the real part of the dielectric constant and the imaginary part of the dielectric constant has been adjusted.
- the relaxation strength ⁇ m , characteristic time ⁇ m , concentration n m and static dielectric constant ⁇ m sta were calculated as the physical property value P of the neutral molecule m (DEC).
- the relaxation strength ⁇ x , characteristic time ⁇ x , concentration n x and static dielectric constant ⁇ x sta were calculated as the physical property value P of the ion pair x (CIP and ion associate).
- the salt dissociation degree ⁇ of the electrolyte was calculated.
- the physical property values P when the content of the electrolyte salt in the electrolyte solution was 1M were as follows.
- the salt dissociation degree ⁇ of the electrolyte solution was 0.28.
- an electrolyte solution was prepared by adding an electrolyte salt (LiPF 6 ) to a solvent (DEC) and then stirring the solvent, as described above.
- LiPF 6 electrolyte salt
- DEC solvent
- the electrolyte salt content (M) in the electrolyte solution was set to two types (0M and 1M).
- the electrolyte salt content described here is the electrolyte salt content relative to the solvent.
- the measured DRS signal S3 (real part of dielectric constant and imaginary part of dielectric constant) shown in Figure 15 was obtained.
- the horizontal axis represents frequency ⁇ (GHz) and the vertical axis represents the real part of dielectric constant and imaginary part of dielectric constant.
- Figure 15 shows the real part of dielectric constant and the imaginary part of dielectric constant together.
- the content of electrolyte salt in the electrolyte solution was set to two types, so Figure 15 shows two types of real part of dielectric constant and two types of imaginary part of dielectric constant.
- the frequency ⁇ at which the intensity of the imaginary part of the dielectric constant is at a maximum decreases, and more specifically, the frequency ⁇ decreases from approximately 20 GHz to approximately 0.5 GHz.
- the maximum intensity of the imaginary part of the dielectric constant increased, and more specifically, the maximum intensity of the imaginary part of the dielectric constant increased from approximately 0.5 to approximately 3.
- the intensity of the real part of the dielectric constant at the time when the frequency ⁇ becomes minimum increases, and more specifically, the intensity of the real part of the dielectric constant increases from approximately 3 to approximately 10.
- the frequency ⁇ at which the intensity of the imaginary part of the dielectric constant is at its maximum decreases; more specifically, the frequency ⁇ decreases from approximately 30 GHz to approximately 0.5 GHz.
- the maximum value of the intensity of the imaginary part of the dielectric constant increases, and more specifically, the maximum value of the intensity of the imaginary part of the dielectric constant increases from approximately 0.5 to approximately 4.
- the intensity of the real part of the dielectric constant at the time when the frequency ⁇ is at a minimum increases, and more specifically, the intensity of the real part of the dielectric constant increases from approximately 1 to approximately 10.
- the calculated DRS signal S2 and the measured DRS signal S3 qualitatively matched each other. This ensured the reliability of the calculated DRS signal S2 relative to the measured DRS signal S3, and therefore ensured the reliability of the individual calculated DRS signal S1, which is a component of the calculated DRS signal S2. Therefore, the measured DRS signal S3 could be attributed using the individual calculated DRS signal S1.
- the individual calculated DRS signal S1 for the three-component system shown in FIG. 12 (component C is neutral molecule m (DEC) and ion pair x (CIP and ion associate)) and the individual calculated DRS signal S1 for the two-component system shown in FIG. 13 (component C is neutral molecule m (DEC) and ion pair x (CIP)) showed the following tendency.
- Example 2 In detail, the same advantages as in Example 1 were obtained. In this case, in particular, similar advantages were obtained when focusing on ion associates as well as CIP as the ion pair x.
- the present technology can also be configured as follows.
- a molecular dynamics calculation is performed on the electrolyte to calculate the behavior of a series of atoms constituting the components of the electrolyte over time; calculating a first dielectric relaxation spectrum signal of the constituent based on the behavior of the set of atoms over time; calculating a second dielectric relaxation spectrum signal of the electrolyte solution based on the first dielectric relaxation spectrum signal; calculating a physical property value specific to the constituent based on the first dielectric relaxation spectrum signal and the second dielectric relaxation spectrum signal; analysis method.
- the electrolyte solution includes a solvent and an electrolyte salt, The components include at least one of neutral molecules and ion pairs; The analysis method described in ⁇ 1>.
- the physical property value includes at least one of a characteristic time, a relaxation strength, a static dielectric constant, a concentration, and a salt dissociation degree.
- ⁇ 4> To calculate the first dielectric relaxation spectrum signal, calculating a total electric dipole moment for the constituent based on the behavior of the set of atoms over time; calculating a time correlation function of the components based on the total electric dipole moment; Approximating the time correlation function to an exponential function; Calculating the first dielectric relaxation spectrum signal of the component by Fourier transforming the approximation result of the time correlation function.
- ⁇ 5> To calculate the first dielectric relaxation spectrum signal, calculating individual electric dipole moments of said constituents based on the behavior of said set of atoms over time; calculating rotational correlation functions of the components based on the individual electric dipole moments; calculating the rotational correlation times of the components by approximating the rotational correlation function to an exponential function; calculating the first dielectric relaxation spectrum signal of the constituent based on the rotational correlation time; The analysis method according to any one of ⁇ 1> to ⁇ 3>.
- the constituents include two or more of a neutral molecule and an ion pair, calculating said first dielectric relaxation spectrum signal for each of two or more of said components; calculating the second dielectric relaxation spectrum signal by summing the first dielectric relaxation spectrum signals for two or more of the constituents;
- the analysis method according to any one of ⁇ 1> to ⁇ 5>.
- ⁇ 7> moreover, analyzing the electrolyte solution using dielectric relaxation spectroscopy to measure a third dielectric relaxation spectrum signal of the electrolyte solution; attributing the third dielectric relaxation spectrum signal using the first dielectric relaxation spectrum signal by comparing the second dielectric relaxation spectrum signal and the third dielectric relaxation spectrum signal to each other.
- the analysis method according to any one of ⁇ 1> to ⁇ 6>.
- ⁇ 8> After measuring the third dielectric relaxation spectrum signal, a signal component caused by the ionic conductivity of the electrolyte is removed from the third dielectric relaxation spectrum signal, thereby correcting the third dielectric relaxation spectrum signal; comparing the second dielectric relaxation spectrum signal and the corrected result of the third dielectric relaxation spectrum signal with each other; The analysis method described in ⁇ 7>.
- a calculation unit is provided for calculating physical properties of the electrolyte, The calculation unit is A molecular dynamics calculation is performed on the electrolyte to calculate the behavior of a series of atoms constituting the electrolyte over time; calculating a first dielectric relaxation spectrum signal of the constituent based on the behavior of the set of atoms over time; calculating a second dielectric relaxation spectrum signal of the electrolyte solution based on the first dielectric relaxation spectrum signal; Calculating the physical property value specific to the constituent based on the first dielectric relaxation spectrum signal and the second dielectric relaxation spectrum signal. Analysis equipment.
- the electrolyte solution includes a solvent and an electrolyte salt, The components include at least one of neutral molecules and ion pairs;
- the physical property value includes at least one of a characteristic time, a relaxation strength, a static dielectric constant, a concentration, and a salt dissociation degree.
- the calculation unit calculates the first dielectric relaxation spectrum signal.
- the analysis device calculates the first dielectric relaxation spectrum signal.
- the constituents include two or more of a neutral molecule and an ion pair;
- the calculation unit is calculating said first dielectric relaxation spectrum signal for each of two or more of said components; calculating the second dielectric relaxation spectrum signal by summing the first dielectric relaxation spectrum signals for two or more of the constituents;
- the analysis device according to any one of ⁇ 9> to ⁇ 13>.
- ⁇ 15> moreover, a measuring unit for measuring a third dielectric relaxation spectrum signal of the electrolyte by analyzing the electrolyte using a dielectric relaxation spectroscopy method; and a comparison unit for comparing the second dielectric relaxation spectrum signal with the third dielectric relaxation spectrum signal to assign the third dielectric relaxation spectrum signal using the first dielectric relaxation spectrum signal.
- the measurement unit corrects the third dielectric relaxation spectrum signal by removing a signal component caused by ionic conductivity of the electrolyte from the third dielectric relaxation spectrum signal after measuring the third dielectric relaxation spectrum signal;
- the comparison unit compares the second dielectric relaxation spectrum signal and the correction result of the third dielectric relaxation spectrum signal with each other.
Landscapes
- Chemical & Material Sciences (AREA)
- Physics & Mathematics (AREA)
- Pathology (AREA)
- General Health & Medical Sciences (AREA)
- Immunology (AREA)
- Health & Medical Sciences (AREA)
- Life Sciences & Earth Sciences (AREA)
- Analytical Chemistry (AREA)
- Biochemistry (AREA)
- General Physics & Mathematics (AREA)
- Chemical Kinetics & Catalysis (AREA)
- Electrochemistry (AREA)
- Spectroscopy & Molecular Physics (AREA)
- Electromagnetism (AREA)
- Measurement Of Resistance Or Impedance (AREA)
- Investigating Or Analyzing Materials By The Use Of Electric Means (AREA)
Abstract
解析方法は、電解液に関する分子動力学計算を行うことにより、その電解液の構成成分を構成する一連の原子の経時的な挙動を計算し、その一連の原子の経時的な挙動に基づいて、構成成分の第1誘電緩和スペクトル信号を計算し、その第1誘電緩和スペクトル信号に基づいて、電解液の第2誘電緩和スペクトル信号を計算し、その第1誘電緩和スペクトル信号および第2誘電緩和スペクトル信号に基づいて、構成成分に固有の物性値を計算する。
Description
本技術は、解析方法および解析装置
蓄電デバイスに用いられる電解液の構成を設計するために、その電解液の物性に関するさまざまな解析方法および解析装置が提案されている。
具体的には、電解液の予備検討において、特定周波数帯域における複素誘電率の強度と濃度との関係を表す検量モデルを準備しておくことにより、その特定周波数帯域において複素誘電率を測定していると共に、その複素誘電率の測定結果に基づいて電解液の濃度を求めている(例えば、特許文献1参照。)。
また、核磁気共鳴法(NMR)を用いて、磁場に対して電解液から得られるスペクトル信号に基づいて、分子の回転相関時間、分子量および分子体積を求めている(例えば、特許文献2参照。)。
電解液の物性を解析するために解析方法および解析装置に関する様々な検討がなされているが、その解析レベルは未だ十分でないため、改善の余地がある。
電解液の物性を容易かつ高精度に解析することが可能である解析方法および解析装置を提供する。
本技術の一実施形態の解析方法は、電解液に関する分子動力学計算を行うことにより、その電解液の構成成分を構成する一連の原子の経時的な挙動を計算し、その一連の原子の経時的な挙動に基づいて、構成成分の第1誘電緩和スペクトル信号を計算し、その第1誘電緩和スペクトル信号に基づいて、電解液の第2誘電緩和スペクトル信号を計算し、その第1誘電緩和スペクトル信号および第2誘電緩和スペクトル信号に基づいて、構成成分に固有の物性値を計算するものである。
本技術の一実施形態の解析装置は、電解液に関する物性値を計算する計算部を備え、その計算部は、電解液に関する分子動力学計算を行うことにより、その電解液の構成成分を構成する一連の原子の経時的な挙動を計算し、その一連の原子の経時的な挙動に基づいて、構成成分の第1誘電緩和スペクトル信号を計算し、その第1誘電緩和スペクトル信号に基づいて、電解液の第2誘電緩和スペクトル信号を計算し、その第1誘電緩和スペクトル信号および第2誘電緩和スペクトル信号に基づいて、構成成分に固有の物性値を計算するものである。
本技術の一実施形態の解析方法または解析装置によれば、電解液に関する分子動力学計算を行うことにより、その電解液の構成成分を構成する一連の原子の経時的な挙動を計算し、その構成成分の第1誘電緩和スペクトル信号を計算し、その電解液の第2誘電緩和スペクトル信号を計算し、その構成成分に固有の物性値を計算するので、その電解液の物性を容易かつ高精度に解析することができる。
なお、本技術の効果は、必ずしもここで説明された効果に限定されるわけではなく、後述する本技術に関連する一連の効果のうちのいずれの効果でもよい。
以下、本技術の一実施形態に関して、図面を参照しながら詳細に説明する。なお、説明する順序は、下記の通りである。
1.解析装置および解析方法(第1実施形態)
1-1.解析装置
1-2.解析方法
1-3.作用および効果
2.解析装置および解析方法(第2実施形態)
2-1.解析装置
2-2.解析方法
2-3.作用および効果
3.変形例
1.解析装置および解析方法(第1実施形態)
1-1.解析装置
1-2.解析方法
1-3.作用および効果
2.解析装置および解析方法(第2実施形態)
2-1.解析装置
2-2.解析方法
2-3.作用および効果
3.変形例
<1.解析装置および解析方法(第1実施形態)>
まず、本技術の第1実施形態における解析装置に関して説明する。
まず、本技術の第1実施形態における解析装置に関して説明する。
なお、本技術の第1実施形態における解析方法は、ここで説明する解析装置の動作(解析手順)により説明されるため、その解析方法に関しては、以下で併せて説明する。
この解析装置は、電解液の物性を解析するために用いられる装置であり、その物性の解析結果は、所望の性能を有する電解液の構成を設計するための指針として用いられる。この電解液は、1種類または2種類以上の構成成分を含んでおり、解析装置では、電解液の全体の物性が解析されると共に、その電解液に含まれている各構成成分の物性も解析される。
ここで説明した1種類または2種類以上の構成成分は、中性分子およびイオン対のうちのいずれか1種類または2種類以上を含んでいる。中性分子の種類は、1種類だけでもよいし、2種類以上でもよい。同様に、イオン対の種類は、1種類だけでもよいし、2種類以上でもよい。なお、中性分子およびイオン対のそれぞれの詳細に関しては、後述する。
電解液は、イオン伝導性を有する液状の電解質であり、溶媒および電解質塩を含んでいる。なお、溶媒および電解質塩のそれぞれの詳細に関しては、後述する。電解液の用途は、特に限定されないが、一例を挙げると、電池およびキャパシタなどの蓄電デバイスである。この電池は、一次電池でもよいし、二次電池でもよい。
これにより、解析装置を用いた電解液の解析結果に基づいて、所望の性能を有する電解液の構成を設計することが可能になるため、その解析装置を用いた解析方法は、多様な用途に用いられる電解液の研究開発、設計および品質管理などに有用である。
詳細には、電解液に含まれている各構成成分の運動性(特に、回転運動)は、その電解液のイオン輸送性に大きな影響を及ぼす重要な因子である。このため、解析装置を用いて電解液を解析することにより、各構成成分の運動性に由来する物性が反映された電解液の全体の物性を把握することが可能になると共に、その運動性に由来する各構成成分の物性も把握することが可能になる。これにより、優れたイオン輸送性を有する電解液の構成を容易かつ高精度に設計することができる。
特に、ここで説明する解析装置は、電解液の物性、より具体的には電解液に含まれている各構成成分の物性を解析するために、分子動力学(Molecular dynamics)計算を用いて各構成成分の誘電緩和スペクトル(Dielectric relaxation spectrum)信号を計算する。
以下では、分子動力学計算を「MD計算」と呼称すると共に、誘電緩和スペクトル信号を「DRS信号」と呼称する。
MD計算は、各構成成分を構成している一連の原子の経時的な挙動を計算するシミュレーションである。DRS信号は、物質の誘電挙動を表す信号(いわゆる複素誘電率スペクトル信号)であり、誘電率実部および誘電率虚部を含んでいる。
<1-1.解析装置>
図1は、第1実施形態における解析装置の一具体例である解析装置100のブロック構成を表している。この解析装置100は、図1に示したように、計算部10と、実測部20と、比較部30とを備えている。
図1は、第1実施形態における解析装置の一具体例である解析装置100のブロック構成を表している。この解析装置100は、図1に示したように、計算部10と、実測部20と、比較部30とを備えている。
[計算部]
計算部10は、構成成分Cを含んでいる電解液に関する物性値Pを計算する。構成成分Cの種類は、上記したように、1種類だけでもよいし、2種類以上でもよい。また、物性値Pの種類は、特に限定されないため、1種類だけでもよいし、2種類以上でもよい。具体的には、物性値Pは、特徴時間、緩和強度、静的誘電率、濃度および塩解離度のうちのいずれか1種類または2種類以上を含んでいる。なお、特徴時間、緩和強度、静的誘電率、濃度および塩解離度のそれぞれの詳細に関しては、後述する。
計算部10は、構成成分Cを含んでいる電解液に関する物性値Pを計算する。構成成分Cの種類は、上記したように、1種類だけでもよいし、2種類以上でもよい。また、物性値Pの種類は、特に限定されないため、1種類だけでもよいし、2種類以上でもよい。具体的には、物性値Pは、特徴時間、緩和強度、静的誘電率、濃度および塩解離度のうちのいずれか1種類または2種類以上を含んでいる。なお、特徴時間、緩和強度、静的誘電率、濃度および塩解離度のそれぞれの詳細に関しては、後述する。
この計算部10は、MD計算などの一連の計算処理を行う演算素子を含んでおり、その演算素子の具体例は、マイクロプロセッサなどである。
具体的には、計算部10は、電解液に関するMD計算を行うことにより、構成成分Cを構成している一連の原子の経時的な挙動を計算する。このMD計算は、物質を構成している各原子に関して、古典力学におけるニュートンの運動方程式を解くことにより、各原子の挙動(位置およびエネルギー)の時間変化を追跡する。
MD計算の方法(力場の種類を含む。)は、そのMD計算を実行することが可能であるソフトウェアであれば、特に限定されない。この場合において、MD計算の条件は、任意に設定可能である。
また、計算部10は、MD計算を用いた計算結果、すなわち一連の原子の経時的な挙動の計算結果に基づいて、構成成分CのDRS信号を計算する。具体的には、計算部10は、MD計算を用いた計算結果に基づいて、構成成分CのDRS信号を計算すると共に、その構成成分CのDRS信号に基づいて、電解液の全体のDRS信号を計算する。
前者のDRS信号は、計算部10により計算される構成成分CのDRS信号(第1誘電緩和スペクトル信号)であり、以下では、そのDRS信号を「個別計算DRS信号S1」と呼称する。また、後者のDRS信号は、計算部10により計算される電解液のDRS信号(第2誘電緩和スペクトル信号)であり、以下では、そのDRS信号を「計算DRS信号S2」と呼称する。
構成成分Cの種類が1種類である場合には、計算部10は、個別計算DRS信号S1を計算したのち、その個別計算DRS信号S1を計算DRS信号S2とする。一方、構成成分Cの種類が2種類以上である場合には、計算部10は、各構成成分Cの個別計算DRS信号S1を計算したのち、その各構成成分Cの個別計算DRS信号S1を加算することにより、計算DRS信号S2を計算する。
計算部10が電解液の計算DRS信号S2だけでなく構成成分Cの個別計算DRS信号S1も計算するのは、後述するように、その個別計算DRS信号S1を用いて、実測部20により測定されるDRS信号(実測DRS信号S3)を帰属することを可能にするためである。
さらに、計算部10は、個別計算DRS信号S1および計算DRS信号S2に基づいて、構成成分Cに固有の物性値Pを計算する。
ここでは、計算部10は、個別計算DRS信号S1を計算するために、以下で説明する計算処理を順に行う。すなわち、計算部10は、MD計算の計算結果に基づいて、構成成分Cのトータル電気双極子モーメントを計算する。また、計算部10は、トータル電気双極子モーメントの計算結果に基づいて、構成成分Cの時間相関関数を計算したのち、その時間相関関数の計算結果を指数関数に近似する。さらに、計算部10は、時間相関関数の近似結果をフーリエ変換することにより、構成成分Cの個別計算DRS信号S1を計算する。
電解液が2種類以上の構成成分Cを含んでいる場合には、その構成成分Cごとに個別計算DRS信号S1が計算されるため、複数の個別計算DRS信号S1が得られる。よって、上記したように、複数の個別計算DRS信号S1が加算されることにより、電解液の計算DRS信号S2が計算される。
以下では、後述する第2実施形態における個別計算DRS信号S1の計算手順と区別するために、第1実施形態における個別計算DRS信号S1の計算手順を「計算手順1」と呼称する。
ここで説明した計算部10の機能の詳細に関しては、後述する解析装置100の動作(解析手順)を説明する際に具体的に説明する。
この計算部10は、個別計算DRS信号S1および計算DRS信号S2を計算したのち、比較部30にデータD1を出力する。このデータD1は、個別計算DRS信号S1および計算DRS信号S2および物性値Pなどの情報を含んでいる。
[実測部]
実測部20は、誘電緩和スペクトロスコピー法を用いて電解液を分析することにより、その電解液のDRS信号を測定する。このDRS信号は、実測部20により測定される電解液のDRS信号(第3誘電緩和スペクトル信号)であり、以下では、そのDRS信号を「実測DRS信号S3」と呼称する。誘電緩和スペクトロスコピー法は、電解液のイオン輸送性と共に、そのイオン輸送性に影響を及ぼす各構成成分Cの運動性を把握することが可能である有用な解析手法である。
実測部20は、誘電緩和スペクトロスコピー法を用いて電解液を分析することにより、その電解液のDRS信号を測定する。このDRS信号は、実測部20により測定される電解液のDRS信号(第3誘電緩和スペクトル信号)であり、以下では、そのDRS信号を「実測DRS信号S3」と呼称する。誘電緩和スペクトロスコピー法は、電解液のイオン輸送性と共に、そのイオン輸送性に影響を及ぼす各構成成分Cの運動性を把握することが可能である有用な解析手法である。
なお、実測部20は、実測DRS信号S3を測定したのち、その実測DRS信号S3を補正する。この場合において、実測部20は、電解液のイオン伝導性に起因する誤差を実測DRS信号S3から除去することにより、その実測DRS信号S3を補正することが好ましい。各構成成分Cの運動性以外の物性に起因する誤差が排除されるため、実測DRS信号S3の測定精度が向上するからである。
ここでは、実測部20は、図示しない誘電分光部および補正部を含んでいる。
誘電分光部は、電解液に対して電磁波を照射すると共に、その電解液からの応答波を受光することにより、実測DRS信号S3を測定する。実測DRS信号S3の測定方法は、特に限定されないが、一例を挙げると、反射伝送法(Sパラメータ法)であることが好ましい。液体(ここでは電解液)の実測DRS信号S3を高精度に測定することが可能だからである。この誘電分光部は、実測DRS信号S3を測定したのち、その実測DRS信号S3の測定結果を補正部に出力する。
より具体的には、誘電分光部は、測定セル、発信器、受信器、誘電分光センサおよび演算素子を含んでいる。
測定セルは、電解液が収容される容器である。測定セルの内部に収容された電解液には、気泡が含まれていないことが好ましい。また、測定セルに収容される電解液の収容量は、後述するプローブが接触可能である適正量であることが好ましい。
発信器は、測定セルの内部に収容されている電解液にマイクロ波などの電磁波を照射する。マイクロ波の周波数は、特に限定されないが、一例を挙げると、100MHz~100GHzである。
受信器は、測定セルから誘電分光センサを介して応答波を受信する。この応答波は、電解液により反射された電磁波と、その電解液を透過した電磁波とを含んでいる。
演算素子は、受信器により受信された応答波の振幅および位相などに基づいて、実測DRS信号S3を計算する。演算素子の具体例は、マイクロプロセッサなどである。
誘電分光部の具体的な構成は、特に限定されない。一例を挙げると、反射伝送法を用いて実測DRS信号S3を測定する誘電分光部は、マイクロ波用同軸ケーブルを介して終端開放型のプローブが接続されているベクトルネットワークアナライザ(VNA)などである。このプローブは、2つのポート(第1ポートおよび第2ポート)を介して測定セルに接続されていると共に、マイクロ波用同軸ケーブルは、電解液に照射されるマイクロ波の周波数帯域に対応する同軸ケーブルである。
この反射伝送法を用いた誘電分光部は、反射波/入射波として定義される反射係数S11,S22を用いて、実測DRS信号S3を計算する。反射係数S11は、第1ポートに対応する反射係数であると共に、反射係数S22は、第2ポートに対応する反射係数である。
補正部は、誘電分光部により測定された実測DRS信号S3の測定結果を補正する。補正部の補正方法は、特に限定されないため、任意に設定可能である。中でも、補正部は、各構成成分Cの分子運動のうちの回転部分に注目するために、上記したように、実測DRS信号S3の測定結果に含まれているイオン伝導性(イオン伝導率)に起因する誤差を除去することが好ましい。
具体的には、補正部は、誘電分光部から実測DRS信号S3が入力されると、その実測DRS信号S3の誘電率虚部のうち、一般的に電解液のイオン伝導性に起因する誤差の影響を受けにくい500MHz以上の周波数帯域における誘電率虚部を対象として、いわゆるDebye型の緩和関数を用いたフィッティングを行う。これにより、補正部は、フィッティングの結果を低周波数側に外挿することにより、500MHz未満の周波数帯域における実測DRS信号S3を補正する。
なお、補正部により除去された誤差に対応する実測DRS信号S3は、上記したように、イオン伝導現象に起因する各構成成分Cの物性を表しているため、その物性は、回転運動以外の運動性(イオン輸送性)に関する情報である。これにより、補正部により除去された実測DRS信号S3は、各構成成分Cの回転運動以外の運動性に関する情報として、別途、電解液の物性を把握するために利用されてもよい。
補正部の具体例は、マイクロプロセッサなどである。
ここでは、実測部20は、上記したように、実測DRS信号S3の測定結果を補正するために補正部を含んでいる。ただし、実測DRS信号S3の測定結果を補正する必要がない場合には、実測部20は、補正部を含んでいなくてもよい。
ここで説明した実測部20の機能の詳細に関しては、後述する解析装置100の動作(解析手順)を説明する際に具体的に説明する。
この実測部20は、実測DRS信号S3を測定したのち、比較部30にデータD2を出力する。このデータD2は、実測DRS信号S3などの情報を含んでいる。
[比較部]
比較部30は、計算部10から入力されたデータD1と、実測部20から入力されたデータD2とに基づいて、計算DRS信号S2と実測DRS信号S3とを互いに比較する。これにより、比較部30は、計算DRS信号S2と実測DRS信号S3との比較結果に応じて、その計算DRS信号S2の構成要素である個別計算DRS信号S1を用いて実測DRS信号S3を帰属する。比較部30の具体例は、マイクロプロセッサなどである。
比較部30は、計算部10から入力されたデータD1と、実測部20から入力されたデータD2とに基づいて、計算DRS信号S2と実測DRS信号S3とを互いに比較する。これにより、比較部30は、計算DRS信号S2と実測DRS信号S3との比較結果に応じて、その計算DRS信号S2の構成要素である個別計算DRS信号S1を用いて実測DRS信号S3を帰属する。比較部30の具体例は、マイクロプロセッサなどである。
すなわち、比較部30は、計算DRS信号S2と実測DRS信号S3とが互いに定性的に一致していることを確認する。この場合において、比較部30は、計算DRS信号S2と実測DRS信号S3とが互いに定性的に一致していることを確認するために、その計算DRS信号S2のスペクトル形状と実測DRS信号S3のスペクトル形状とを互いに比較する。これにより、比較部30は、計算DRS信号S2のスペクトル形状と実測DRS信号S3のスペクトル形状とが互いに定性的に一致していることを確認した場合に、その計算DRS信号S2と実測DRS信号S3とが互いに定性的に一致していると判定する。
この比較部30は、画像解析処理を利用して計算DRS信号S2と実測DRS信号S3との比較処理を行う演算素子を含んでおり、その演算素子の具体例は、マイクロプロセッサなどである。比較処理の方法は、その比較処理を実行することが可能であるソフトウェアであれば、特に限定されない。この場合において、比較処理の条件は、任意に設定可能である。
なお、実測部20が実測DRS信号S3を補正した場合には、比較部30は、実測DRS信号S3に対する計算DRS信号S2の帰属を行うために、その計算DRS信号S2と実測DRS信号S3の補正結果とを互いに比較する。
ここで、電解液を用いて実測部20により実際に測定される実測DRS信号S3は、その電解液の物性(分子レベルの運動性)を調べる上で重要な情報であるが、その実測DRS信号S3だけでは、詳細な電解液の物性を把握することが困難である。なぜなら、電解液が2種類以上の構成成分Cを含んでいる場合において、その電解液の実測DRS信号S3は、構成成分Cごとに測定されるはずであるDRS信号が加算された信号であるが、実測部20において構成成分CごとにDRS信号を測定することは極めて困難だからである。これにより、実測DRS信号S3を用いると、電解液の全体の物性を把握することは可能であるが、その電解液の全体の物性に影響を及ぼす各構成成分Cの物性を把握することは極めて困難である。
そこで、電解液の全体の物性を把握するだけでなく、各構成成分Cの物性も把握するために、比較部30は、計算DRS信号S2および実測DRS信号S3を取得したのち、その計算DRS信号S2と実測DRS信号S3とが互いに定性的に一致していることを確認する。
実測部20により測定された実測DRS信号S3は、上記したように、電解液に関して測定された1つのDRS信号である。これに対して、計算部10により計算された計算DRS信号S2は、上記したように、各構成成分Cに関して計算された個別計算DRS信号S1が加算されたDRS信号であるため、電解液に関して計算された1つのDRS信号(計算DRS信号S2)であると共に、各構成成分Cに関して計算されたDRS信号(個別計算DRS信号S1)を含んでいる。
これにより、計算DRS信号S2と実測DRS信号S3とが互いに定性的に一致していることが比較部30により確認されると、その実測DRS信号S3に対する計算DRS信号S2の信頼性(言い換えれば、MD計算の妥当性)が担保されるため、その計算DRS信号S2を構成している個別計算DRS信号S1の信頼性も担保される。よって、構成成分CごとにDRS信号を測定できなくても、その各構成成分Cの物性を表す情報として個別計算DRS信号S1を採用することが技術的に保証されるため、その個別計算DRS信号S1を用いて実測DRS信号S3を帰属することが可能になる。
ここで説明した比較部30の機能の詳細に関しては、後述する解析装置100の動作(解析手順)を説明する際に具体的に説明する。
この比較部30は、計算DRS信号S2および実測DRS信号S3に基づく比較および帰属を行ったのち、外部にデータD3を出力する。このデータD3は、個別計算DRS信号S1、計算DRS信号S2、実測DRS信号S3および物性値Pなどの情報を含んでいる。
[その他]
なお、解析装置100は、さらに、他の構成要素のうちのいずれか1種類または2種類以上を備えていてもよい。
なお、解析装置100は、さらに、他の構成要素のうちのいずれか1種類または2種類以上を備えていてもよい。
他の構成要素の具体例は、表示部、記憶部および電源などである。表示部は、計算部10による計算結果、実測部20による測定結果および比較部30による比較結果(帰属結果)などを表示する。記憶部は、解析装置100において計算された一連の計算結果などを記憶する。電源は、解析装置100の電力源である。
[電解液]
解析装置100を用いた解析に用いられる電解液は、上記したように、溶媒および電解質塩を含んでいる。ただし、電解液は、さらに、各種の添加剤のうちのいずれか1種類または2種類以上を含んでいてもよい。
解析装置100を用いた解析に用いられる電解液は、上記したように、溶媒および電解質塩を含んでいる。ただし、電解液は、さらに、各種の添加剤のうちのいずれか1種類または2種類以上を含んでいてもよい。
溶媒は、電解質塩を分散または溶解させる媒質のうちのいずれか1種類または2種類以上であり、水性溶媒でもよいし、非水溶媒でもよい。
非水溶媒の種類は、特に限定されないが、一例を挙げると、環状炭酸エステル、鎖状炭酸エステルおよび鎖状カルボン酸エステルなどのうちのいずれか1種類または2種類以上を含んでいる。
環状炭酸エステルの具体例は、炭酸エチレンおよび炭酸プロピレンなどである。鎖状炭酸エステルの具体例は、炭酸ジメチル、炭酸ジエチルおよび炭酸エチルメチルなどである。鎖状カルボン酸エステルの具体例は、プロピオン酸エチルおよびプロピオン酸プロピルなどである。
電解質塩は、溶媒中において分散または溶解される溶質であり、金属塩のうちのいずれか1種類または2種類以上を含んでいる。金属塩の種類は、特に限定されないが、一例を挙げると、その金属塩は、六フッ化リン酸リチウム(LiPF6 )、四フッ化ホウ酸リチウム(LiBF4 )、ビス(フルオロスルホニル)イミドリチウム(LiN(FSO2 )2 )およびビス(トリフルオロメタンスルホニル)イミドリチウム(LiN(CF3 SO2 )2 )などのうちのリチウム塩のうちのいずれか1種類または2種類以上を含んでいる。
構成成分Cは、上記したように、中性分子およびイオン対のうちのいずれか1種類または2種類以上を含んでいる。
中性分子は、電気的に中性の分子であり、化学的かつ経時的に安定な成分である。中性分子の種類は、特に限定されないが、一例を挙げると、溶媒の分子などである。
イオン対は、カチオンとアニオンとの電気的結合体である。イオン対の種類は、特に限定されないが、一例を挙げると、接触イオン対(CIP)、溶媒(SIP)および溶媒分離イオン対(SSIP)などであり、それら以外の電気的結合体でもよい。
イオン対を形成するイオンの種類は、上記したように、2種類以上であれば、特に限定されない。このため、イオン対を形成するカチオンの種類は、1種類だけでもよいし、2種類以上でもよい。同様に、イオン対を形成するアニオンの種類は、1種類だけでもよいし、2種類以上でもよい。
これにより、ここで説明するイオン対には、1種類のカチオンと1種類のアニオンとの電気的結合体だけでなく、2種類以上のカチオンと2種類以上のアニオンとの電気的結合体(いわゆるイオン結合体)も含まれる。このイオン結合体には、四量体などの多量体も含まれる。
特に、イオン対は、電解液中において電気的に安定な静的成分である中性分子とは異なり、その電解液中において経時的に形成(集合)および消滅(離散)を交互に繰り返す動的成分である。これにより、解析装置100では、計算部10、実測部20および比較部30を用いて電解液を解析することにより、中性分子の物性を調べることができるだけでなく、イオン対の物性を調べることもできる。
中性分子の物性は、従来から調べることが可能であったが、イオン対の物性は、従来は調べることが極めて困難であった。よって、解析装置100を用いた電解液の解析は、特に、従来は困難であったイオン対の物性まで調べることが可能になった点において、極めて重要である。
<1-2.解析方法>
次に、解析装置100を用いた解析方法に関して説明する。ここで説明する解析方法は、いわゆる解析装置100の動作(解析手順)である。
次に、解析装置100を用いた解析方法に関して説明する。ここで説明する解析方法は、いわゆる解析装置100の動作(解析手順)である。
以下では、説明を分かりやすくするために、電解液が2種類以上の構成成分C(複数の中性分子mおよび複数のイオン対x)を含んでいる場合を例に挙げる。
[計算部の計算手順]
解析装置100が電解液を解析する場合には、最初に、以下で説明する手順により、計算部10において、電解液に関するMD計算を行うことにより、個別計算DRS信号S1、計算DRS信号S2および物性値Pのそれぞれを計算する。
解析装置100が電解液を解析する場合には、最初に、以下で説明する手順により、計算部10において、電解液に関するMD計算を行うことにより、個別計算DRS信号S1、計算DRS信号S2および物性値Pのそれぞれを計算する。
(MD計算)
具体的には、最初に、電解液に関するMD計算を実施する。
具体的には、最初に、電解液に関するMD計算を実施する。
この場合には、電解液に含まれていることが既知である2種類以上の構成成分Cを設定することにより、MD計算用のソフトウェアを用いてMD計算を実行する。このMD計算により、各構成成分Cを構成する一連の原子の経時的な挙動が計算される。
なお、電解液に含まれている2種類以上の構成成分Cが不明である場合には、その電解液に含まれていることが想定される2種類以上の構成成分Cを設定してもよい。
MD計算の方法(力場の種類を含む。)は、上記したように、そのMD計算を実行することが可能であるソフトウェアであれば、特に限定されない。この場合において、MD計算の条件は、任意に設定可能である。
続いて、個別計算DRS信号S1を計算するために、MD計算の計算結果に基づいて、以下で説明する計算処理を行う。
(トータル電気双極子モーメントの計算)
具体的には、各構成成分Cのトータル電気双極子モーメントを計算する。
具体的には、各構成成分Cのトータル電気双極子モーメントを計算する。
この場合には、MD計算の計算結果に含まれているトラジェクトリに基づいて、各時刻における各原子の座標および電荷に関する情報を読み込む。これにより、式(1)で表される計算式を用いて、MD計算の計算セルに含まれているNm 個の中性分子mのうちのi(i=1,2,3,・・・,Nm )番目の中性分子mの個別電気双極子モーメントを計算する。

続いて、式(2)で表される計算式を用いて、中性分子mのトータル電気双極子モーメントを計算する。
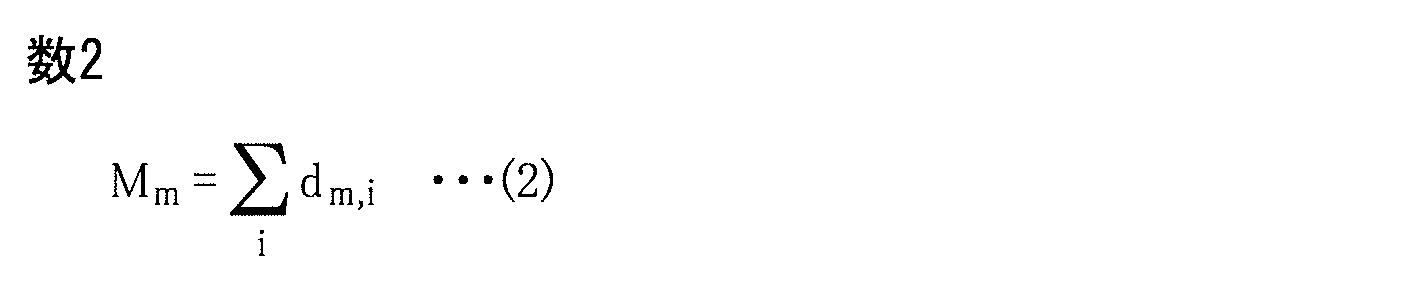
最後に、式(3)で表される計算式を用いて、イオン対xのトータル電気双極子モーメントを計算する。dx,i の計算手順は、式(1)を用いた計算手順と同様である。
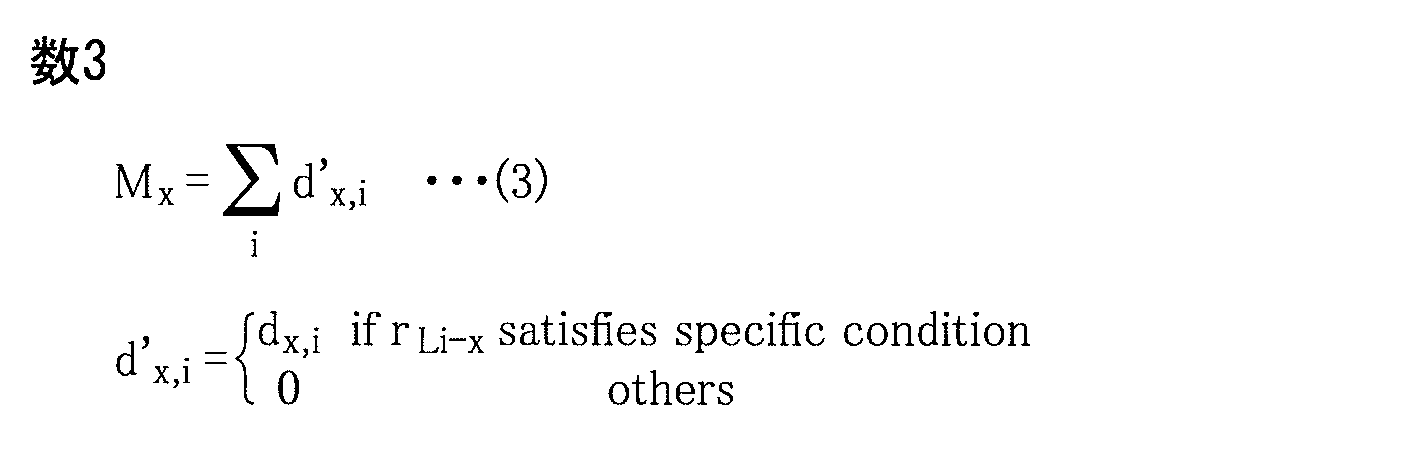
ここで、イオン対x(CIP)のトータル電気双極子モーメントを計算する場合には、カチオンの重心Wとアニオンの重心Xとの間の距離rW-X が所定の距離以下になる条件を満たした場合のみ、電気双極子モーメントを計算する。一例を挙げると、電解質塩が六フッ化リン酸リチウム(LiPF6 )である場合には、距離rW-X が0.425nm(=4.25Å)以下になる条件を満たした場合のみ、電気双極子モーメントを計算する。
なお、上記した「0.425nm」という閾値(距離rW-X )は、電解質塩が六フッ化リン酸リチウム(LiPF6 )である場合において、リチウム原子を中心としたリン原子(P)の動径分布関数が最初のディップを示す位置であり、カチオンの種類およびアニオンの種類に応じて適正に決定される値である。なお、リチウム原子とアニオンとの最近接位置に着目した場合のイオン対xをCIPとしているが、動径分布関数に基づいて第二近接位置などを求めることにより、CIP以外の他のイオン対xに関しても同様の解析を行うことが可能である。
(時間相関関数の計算)
続いて、トータル双極子モーメントに基づいて、各構成成分Cの時間相関関数を計算する。
続いて、トータル双極子モーメントに基づいて、各構成成分Cの時間相関関数を計算する。
この場合には、式(4)で表される計算式を用いて、中性分子mに関するトータル電気双極子モーメントの時間相関関数を計算する。
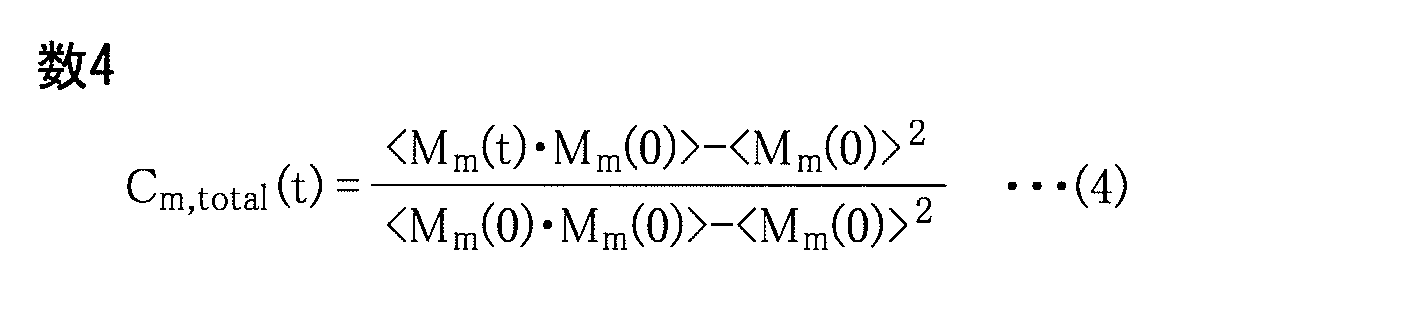
また、式(5)で表される計算式を用いて、イオン対xに関するトータル電気双極子モーメントの時間相関関数を計算する。
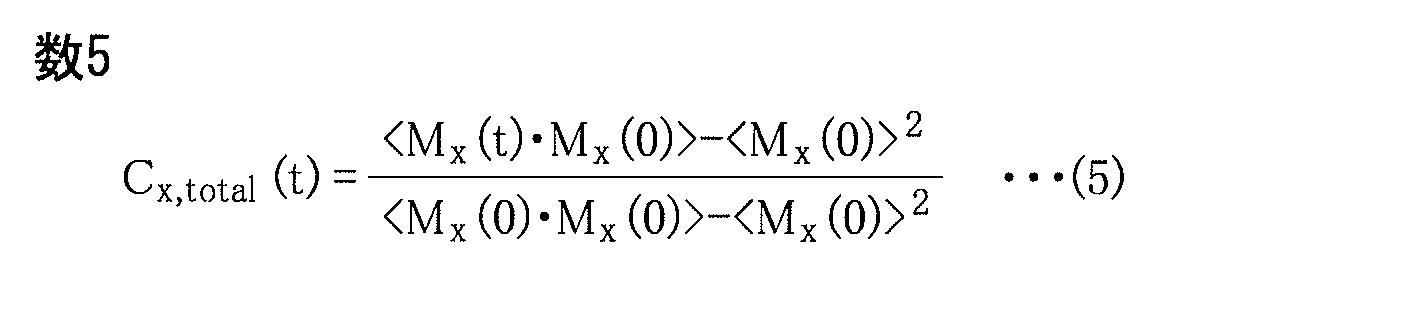
(時間相関関数の近似)
続いて、時間相関関数を指数関数に近似する。
続いて、時間相関関数を指数関数に近似する。
この場合には、最小二乗法を用いて、中性分子mの時間相関関数をフィッティングする。これにより、時間相関関数からノイズ(変動誤差)が除去されるため、後述するフーリエ変換において計算誤差などの影響が抑制される。
また、最小二乗法を用いて、イオン対xの時間相関関数をフィッティングする。これにより、時間相関関数からノイズ(変動誤差)が除去されるため、上記したように、後述するフーリエ変換において計算誤差などの影響が抑制される。
(時間相関関数のフーリエ変換、個別計算DRS信号S1の計算および計算DRS信号S2の計算)
続いて、時間相関関数の近似結果をフーリエ変換することにより、個別計算DRS信号S1および計算DRS信号S2のそれぞれを計算する。
続いて、時間相関関数の近似結果をフーリエ変換することにより、個別計算DRS信号S1および計算DRS信号S2のそれぞれを計算する。
具体的には、式(8)で表される計算式を用いて、中性分子mの緩和強度Δεm を計算する。また、緩和強度Δεm を用いて、中性分子mに関する時間相関関数の近似結果をフーリエ変換することにより、式(6)で表される計算式を用いて誘電率実部を計算すると共に、式(7)で表される計算式を用いて誘電率虚部を計算する。これにより、中性分子mに関して、誘電率実部および誘電率虚部を含む個別計算DRS信号S1が計算される。



また、式(11)で表される計算式を用いて、イオン対xの緩和強度Δεx を計算する。また、緩和強度Δεx を用いて、イオン対xに関する時間相関関数の近似結果をフーリエ変換することにより、式(9)で表される計算式を用いて誘電率実部を計算すると共に、式(10)で表される計算式を用いて誘電率虚部を計算する。これにより、イオン対xに関して、誘電率実部および誘電率虚部を含む個別計算DRS信号S1が計算される。


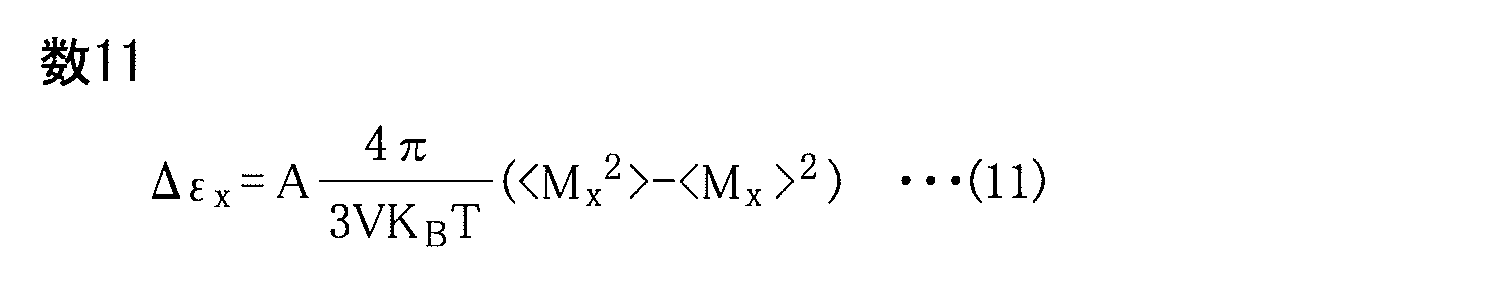
式(11)に示したように、イオン対xの緩和強度Δεx を計算する場合には、スケーリングファクターAを用いる。イオン対xの周辺に存在する溶媒の影響を考慮せずに、そのイオン対xのトータル電気双極子モーメントを計算すると、最終的に計算される個別計算DRS信号S1の精度は、誤差に起因して低下する可能性がある。そこで、イオン対xの周辺の溶媒に対する遮蔽効果を有効的に導入するために、適切なスケーリングファクターAを用いる。スケーリングファクターAの値は、特に限定されないが、一例を挙げると、0.25である。
よって、中性分子mの個別計算DRS信号S1と、イオン対xの個別計算DRS信号S1とを加算することにより、電解液の計算DRS信号S2を計算する。
(物性値の計算)
続いて、個別計算DRS信号S1および計算DRS信号S2に基づいて、各構成成分Cに固有の物性値Pを計算する。
続いて、個別計算DRS信号S1および計算DRS信号S2に基づいて、各構成成分Cに固有の物性値Pを計算する。
ここでは、物性値Pとして、緩和強度Δεm ,Δεx 、特徴時間τm ,τx 、濃度nm ,nx 、静的誘電率εm
sta,εx
staおよび塩解離度αを計算する場合を例に挙げる。
中性分子mの緩和強度Δεm を計算する場合には、上記したように、式(8)に示した計算式を用いて緩和強度Δεm を計算する。また、イオン対xの緩和強度Δεx を計算する場合には、上記したように、式(11)に示した計算式を用いて緩和強度Δεx を計算する。
中性分子mの特徴時間τm を計算する場合には、その中性分子mに関する個別計算DRS信号S1(誘電率虚部)のピーク位置の周波数を特定周波数νm とすることにより、式(12)で表される計算式を用いて特徴時間τm を計算する。この特徴時間τm は、特定周波数νm の逆数である。
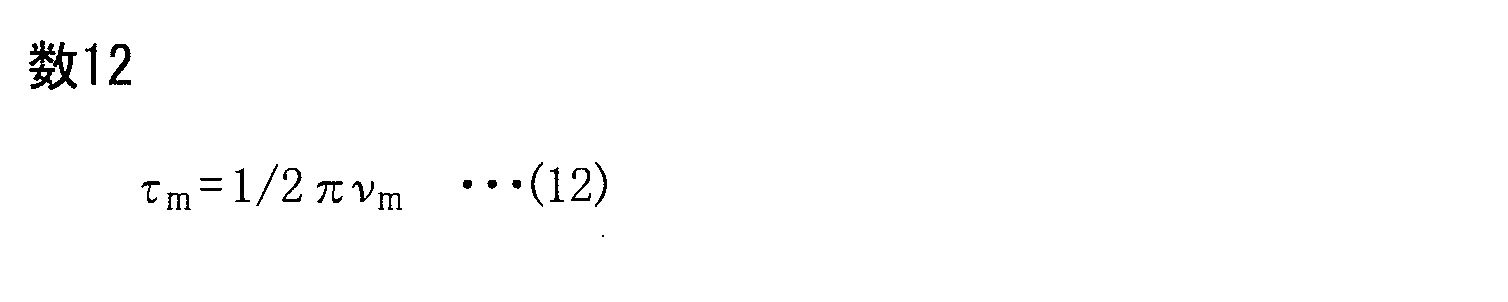
また、イオン対xの特徴時間τx を計算する場合には、そのイオン対xに関する個別計算DRS信号S1(誘電率虚部)のピーク位置の周波数を特定周波数νx とすることにより、式(13)で表される計算式を用いて特徴時間τx を計算する。この特徴時間τx は、特定周波数νx の逆数である。
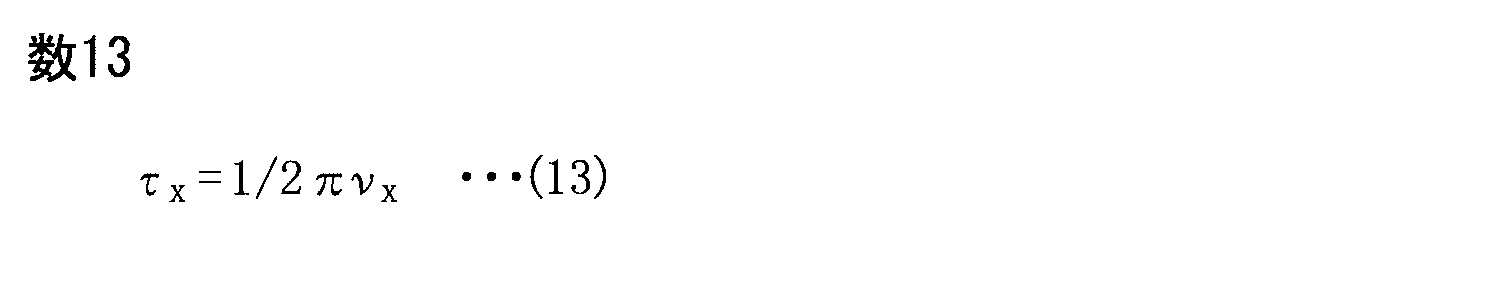
中性分子mの濃度nm を計算する場合には、MD計算の計算セルに含まれている中性分子mの個数Nm と、そのMD計算の計算セルの体積Vとに基づいて、nm =Nm /Vという計算式を用いて濃度nm を算出する。
また、イオン対xの濃度nx を計算する場合には、MD計算の計算セルに含まれているイオン対xの平均個数<Nx >と、そのMD計算の計算セルの体積Vとに基づいて、nx =<Nx >/Vという計算式を用いて濃度nx を算出する。
塩解離度αを計算する場合には、MD計算の計算セルに含まれているカチオンの総数Ncat と、そのカチオンうちのアニオンに接近していないカチオンの平均個数<Ncat,free>とに基づいて、α=<Ncat,free>/Ncat という計算式を用いて塩解離度αを算出する。
中性分子mの静的誘電率εm
staを計算する場合には、その中性分子mに関する個別計算DRS信号S1(誘電率実部)に基づいて、ω→0(またはν→0)として誘電率を計算することにより、その誘電率の計算値を静的誘電率εm
staとする。
また、イオン対xの静的誘電率εx
staを計算する場合には、そのイオン対xに関する個別計算DRS信号S1(誘電率実部)に基づいて、ω→0(またはν→0)として誘電率を計算することにより、その誘電率の計算値を静的誘電率εx
staとする。
(データD1の出力)
最後に、比較部30にデータD1を出力する。データD1に関する詳細は、上記した通りである。
最後に、比較部30にデータD1を出力する。データD1に関する詳細は、上記した通りである。
[実測部の測定手順]
次に、以下で説明する手順により、実測部20において、誘電緩和スペクトロスコピー法を用いて電解液を分析することにより、その電解液の実測DRS信号S3を測定する。
次に、以下で説明する手順により、実測部20において、誘電緩和スペクトロスコピー法を用いて電解液を分析することにより、その電解液の実測DRS信号S3を測定する。
(実測DRS信号S3の測定)
具体的には、最初に、誘電緩和スペクトロスコピー法を用いた電解液の分析結果に基づいて、その電解液に関する実測DRS信号S3を測定する。
具体的には、最初に、誘電緩和スペクトロスコピー法を用いた電解液の分析結果に基づいて、その電解液に関する実測DRS信号S3を測定する。
(実測DRS信号S3の補正)
続いて、実測DRS信号S3を補正する。この場合には、上記したように、Debye型の緩和関数を用いて実測DRS信号S3のフィッティングを行うことにより、その実測DRS信号S3から電解液のイオン伝導性に起因する誤差を除去する。
続いて、実測DRS信号S3を補正する。この場合には、上記したように、Debye型の緩和関数を用いて実測DRS信号S3のフィッティングを行うことにより、その実測DRS信号S3から電解液のイオン伝導性に起因する誤差を除去する。
(データS2の出力)
最後に、比較部30にデータD2を出力する。データD2に関する詳細は、上記した通りである。
最後に、比較部30にデータD2を出力する。データD2に関する詳細は、上記した通りである。
[比較部の比較手順]
最後に、以下で説明する手順により、比較部30において、計算DRS信号S2と実測DRS信号S3とを互いに比較すると共に、その計算DRS信号S2と実測DRS信号S3とが互いに定性的に一致していることを確認することにより、その計算DRS信号S2の構成要素である個別計算DRS信号S1を用いて実測DRS信号S3を帰属する。
最後に、以下で説明する手順により、比較部30において、計算DRS信号S2と実測DRS信号S3とを互いに比較すると共に、その計算DRS信号S2と実測DRS信号S3とが互いに定性的に一致していることを確認することにより、その計算DRS信号S2の構成要素である個別計算DRS信号S1を用いて実測DRS信号S3を帰属する。
(計算DRS信号S2と実測DRS信号S3との比較)
具体的には、最初に、計算DRS信号S2と実測DRS信号S3とを互いに比較することにより、その計算DRS信号S2と実測DRS信号S3とが互いに定性的に一致しているかどうかを確認する。
具体的には、最初に、計算DRS信号S2と実測DRS信号S3とを互いに比較することにより、その計算DRS信号S2と実測DRS信号S3とが互いに定性的に一致しているかどうかを確認する。
この場合には、計算DRS信号S2のスペクトル形状と、実測DRS信号S3のスペクトル形状とが互いに定性的に一致しているかどうかの観点において、両者のスペクトル形状を互いに比較する。
両者のスペクトル形状を互いに比較する際における比較項目の一例は、以下で説明する通りである。
(1)誘電率虚部のピーク位置における周波数の値
(2)誘電率虚部のピーク位置における強度の値
(3)静的誘電率の値
(4)電解液の濃度を変化させた場合において、(1)~(3)のそれぞれに示した一連の値が変化する傾向
(1)誘電率虚部のピーク位置における周波数の値
(2)誘電率虚部のピーク位置における強度の値
(3)静的誘電率の値
(4)電解液の濃度を変化させた場合において、(1)~(3)のそれぞれに示した一連の値が変化する傾向
(個別計算DRS信号S1を用いた実測DRS信号S3の帰属)
続いて、個別計算DRS信号S1を用いて実測DRS信号S3を帰属する。
続いて、個別計算DRS信号S1を用いて実測DRS信号S3を帰属する。
この場合には、計算DRS信号S2と実測DRS信号S3とが互いに定性的に一致していることを確認した場合において、その計算DRS信号S2の信頼性が担保されたため、個別計算DRS信号S1を用いて実測DRS信号S3を帰属することができたと判定する。
この場合には、計算DRS信号S2の信頼性が担保されるため、その計算DRS信号S2を構成している複数の個別計算DRS信号S1の信頼性も併せて担保される。よって、仮に実測DRS信号S3を構成成分Cごとに分解できたとすると、複数の個別計算DRS信号S1が取得されるはずであると考えても技術的かつ論理的(精度的)に問題がないことになる。
(データD3の出力)
最後に、外部にデータD3を出力する。データD3に関する詳細は、上記した通りである。
最後に、外部にデータD3を出力する。データD3に関する詳細は、上記した通りである。
なお、解析装置100は、外部にデータD3を出力せずに、内部にデータD3を記憶してもよい。もちろん、解析装置100は、内部にデータD3を記憶すると共に、外部にデータD3を出力してもよい。
<1-3.作用および効果>
第1実施形態の解析装置100によれば、その解析装置100が計算部10、実測部20および比較部30を備えている。この計算部10は、電解液に関するMD計算を用いて個別計算DRS信号S1および計算DRS信号S2のそれぞれを計算すると共に、物性値Pを計算する。実測部20は、誘電緩和スペクトロスコピー法を用いて電解液を分析することにより、その電解液に関する実測DRS信号S3を測定する。比較部30は、計算DRS信号S2と実測DRS信号S3とを互いに比較することにより、その計算DRS信号S2の構成要素である個別計算DRS信号S1を用いて実測DRS信号S3を帰属する。
第1実施形態の解析装置100によれば、その解析装置100が計算部10、実測部20および比較部30を備えている。この計算部10は、電解液に関するMD計算を用いて個別計算DRS信号S1および計算DRS信号S2のそれぞれを計算すると共に、物性値Pを計算する。実測部20は、誘電緩和スペクトロスコピー法を用いて電解液を分析することにより、その電解液に関する実測DRS信号S3を測定する。比較部30は、計算DRS信号S2と実測DRS信号S3とを互いに比較することにより、その計算DRS信号S2の構成要素である個別計算DRS信号S1を用いて実測DRS信号S3を帰属する。
特に、計算部10は、計算手順1を用いて個別計算DRS信号S1を計算する。具体的には、計算部10は、構成成分Cのトータル電気双極子モーメントを計算し、その構成成分Cの時間相関関数を計算し、その時間相関関数を指数関数に近似し、その時間相関関数の近似結果をフーリエ変換することにより、構成成分Cの個別計算DRS信号S1を計算する。
この場合には、比較部30において、MD計算を用いて計算部10により計算された電解液の計算DRS信号S2と、誘電緩和スペクトロスコピー法を用いて実測部20により測定された電解液の実測DRS信号S3とが互いに比較される。これにより、計算DRS信号S2と実測DRS信号S3とが互いに定性的に一致していることが確認されると、その実測DRS信号S3に対する計算DRS信号S2の信頼性が担保されるため、その計算DRS信号S2を構成している複数の個別計算DRS信号S1の信頼性も担保される。よって、計算DRS信号S2の構成要素である個別計算DRS信号S1を用いて実測DRS信号S3を帰属することが可能になる。
これにより、中性分子mに関する個別計算DRS信号S1に基づいて、その中性分子mに関する物性が把握されるだけでなく、イオン対xに関する個別計算DRS信号S1に基づいて、そのイオン対xに関する物性も把握される。よって、中性分子mに関する物性だけでなく、イオン対xに関する物性も加味することにより、イオン輸送性などに関して所望の性能を有する電解液の構成を自由に設計することが可能になる。
これらのことから、新規な電解液の構成を設計する際に、実際に中性分子mの物性およびイオン対xの物性を測定しなくても、上記したように、所望の性能を有する電解液の構成が設計されるため、その電解液の物性を容易かつ高精度に解析することができる。
この場合には、特に、上記したように、従来は困難であったイオン対の物性も把握することができる。しかも、計算DRS信号S2(個別計算DRS信号S1)だけを用いて構成成分Cの物性を把握することができるため、あらかじめ検量線などの検量モデルを準備する必要がないと共に、DRS信号の強度を規格化する必要もない。よって、電解液の詳細な物性がより容易に解析されるため、所望の性能を有する電解液の構成をより高精度に設計することができる。
特に、電解液が溶媒および電解質塩を含んでおり、構成成分Cが中性分子およびイオン対のうちのいずれか1種類または2種類以上を含んでいれば、その中性分子の物性だけに限られず、そのイオン対の物性も解析される。よって、電解液の物性がより高精度に解析されるため、より高い効果を得ることができる。
また、物性値Pが緩和強度、特徴時間、静的誘電率、濃度および塩解離度のうちのいずれか1種類または2種類以上を含んでいれば、電解液に関する多様な物性がより高精度に解析されるため、より高い効果を得ることができる。
また、計算部10が個別計算DRS信号S1を計算するために、構成成分Cのトータル電気双極子モーメントを計算し、その構成成分Cの時間相関関数を計算し、その時間相関関数を指数関数に近似し、その時間相関関数をフーリエ変換することにより、個別計算DRS信号S1を計算すれば、計算処理を用いて構成成分Cの個別計算DRS信号S1が高精度に計算されるため、より高い効果を得ることができる。
また、構成成分Cが中性分子およびイオン対のうちの2種類以上を含んでおり、計算部10が2種類以上の構成成分Cのそれぞれの個別計算DRS信号S1を計算したのち、それらの個別計算DRS信号S1を加算することにより計算DRS信号S2を計算すれば、その構成成分Cの種類が2種類以上である場合においても計算DRS信号S2が計算されるため、より高い効果を得ることができる。
また、実測部20が実測DRS信号S3から電解液のイオン伝導性に起因する誤差を除去することにより、その実測DRS信号S3を補正すると共に、比較部30が計算DRS信号S2と実測DRS信号S3の補正結果とを互いに比較すれば、その比較の精度が向上するため、帰属の精度も向上する。よって、電解液の物性がより高精度に解析されるため、より高い効果を得ることができる。
この他、第1実施形態の解析方法によれば、電解液に関するMD計算を用いて個別計算DRS信号S1および計算DRS信号S2のそれぞれを計算し、誘電緩和スペクトロスコピー法を用いて電解液に関する実測DRS信号S3を測定し、その計算DRS信号S2と実測DRS信号S3とを互いに比較し、その計算DRS信号S2の構成要素である個別計算DRS信号S1を用いて実測DRS信号S3を帰属し、その電解液に関する物性値Pを計算している。よって、上記した理由により、電解液の物性を容易かつ高精度に解析することができる。
この解析方法に関する他の作用および効果は、解析装置100に関する他の作用および効果と同様である。
<2.解析装置および解析方法(第2実施形態)>
次に、本技術の第2実施形態における解析装置および解析方法に関して説明する。
次に、本技術の第2実施形態における解析装置および解析方法に関して説明する。
第2実施形態の解析装置100は、以下で説明するように、計算部10による個別計算DRS信号S1の計算手順が異なることを除いて、第1実施形態における解析装置100の構成と同様の構成を有している。なお、電解液、構成成分Cおよび物性値Pのそれぞれに関する詳細は、上記した通りである。
<2-1.解析装置>
ここでは、既に説明した図1を参照しながら、第2実施形態の解析装置100の構成に関して説明する。
ここでは、既に説明した図1を参照しながら、第2実施形態の解析装置100の構成に関して説明する。
第2実施形態における解析装置100の構成は、以下で説明することを除いて、第1実施形態における解析装置100の構成と同様である。
ここでは、計算部10は、個別計算DRS信号S1を計算するために、以下で説明する計算処理を順に行う。すなわち、計算部10は、MD計算の計算結果に基づいて、構成成分Cの個別電気双極子モーメントを計算する。また、計算部10は、個別電気双極子モーメントに基づいて、構成成分Cの時間相関関数を計算したのち、その時間相関関数を指数関数に近似することにより、構成成分Cの回転相関時間を計算する。さらに、計算部10は、回転相関時間に基づいて、構成成分Cの個別計算DRS信号S1を計算する。
以下では、第2実施形態における個別計算DRS信号S1の計算手順を「計算手順2」と呼称する。これにより、第2実施形態の解析装置100の構成は、計算部10が個別計算DRS信号S1を計算するために計算手順1の代わりに計算手順2を用いることを除いて、第1実施形態の解析装置100の構成と同様である。
ここで説明した計算部10の機能の詳細に関しては、後述する解析装置100の動作(解析手順)を説明する際に具体的に説明する。
<2-2.解析方法>
第2実施形態の解析装置100を用いた解析方法に関して説明する。ここで説明する解析方法は、上記したように、解析装置100の動作(解析手順)である。
第2実施形態の解析装置100を用いた解析方法に関して説明する。ここで説明する解析方法は、上記したように、解析装置100の動作(解析手順)である。
第2実施形態における解析方法の手順は、以下で説明することを除いて、第1実施形態における解析方法の手順と同様である。
個別計算DRS信号S1を計算するためには、計算部10において、MD計算の計算結果に基づいて、以下で説明する計算処理を行う。
(個別電気双極子モーメントの計算)
具体的には、最初に、各構成成分Cの個別電気双極子モーメントを計算する。
具体的には、最初に、各構成成分Cの個別電気双極子モーメントを計算する。
この場合には、MD計算の計算結果に含まれているトラジェクトリに基づいて、各時刻における各原子の座標および電荷を読み込む。これにより、Nm 個の中性分子mのうちのi番目の中性分子mの個別電気双極子モーメントを時刻ごとに計算すると共に、Nx 個のイオン対xのうちのi番目のイオン対xの個別電気双極子モーメントを時刻ごとに計算する。
(回転相関関数の計算)
続いて、個別電気双極子モーメントに基づいて、各構成成分Cの回転相関関数を計算する。この回転相関関数は、時間に対して指数関数的に減衰する。
続いて、個別電気双極子モーメントに基づいて、各構成成分Cの回転相関関数を計算する。この回転相関関数は、時間に対して指数関数的に減衰する。
この場合には、中性分子mの個別双極子モーメントを規格化することにより、長さを1とした単位ベクトルに対して、式(14)で表される計算式を用いて、その中性分子mの回転相関関数を計算する

また、イオン対xの個別双極子モーメントを規格化することにより、長さを1とした単位ベクトルに対して、式(15)で表される計算式を用いて、そのイオン対xの回転相関関数を計算する

(回転相関関数の近似および回転相関時間の計算)
続いて、回転相関関数を指数関数に近似することにより、各構成成分Cの回転相関時間を計算する。
続いて、回転相関関数を指数関数に近似することにより、各構成成分Cの回転相関時間を計算する。
この場合には、最小二乗法を用いて中性分子mの回転相関関数をフィッティングすることにより、その中性分子mの回転相関時間を計算する。また、最小二乗法を用いてイオン対xの回転相関関数をフィッティングすることにより、そのイオン対xの回転相関時間を計算する。
これにより、式(16)で表される計算式を用いて、中性分子mの特徴時間を計算すると共に、式(17)で表される計算式を用いて、その中性分子mの特徴周波数を算出する。また、式(18)で表される計算式を用いて、イオン対xの特徴時間を計算すると共に、式(19)で表される計算式を用いて、そのイオン対xの特徴周波数を計算する。



(個別計算DRS信号S1の計算および計算DRS信号S2の計算)
続いて、回転相関時間に基づいて、個別計算DRS信号S1および計算DRS信号S2のそれぞれを計算する。
続いて、回転相関時間に基づいて、個別計算DRS信号S1および計算DRS信号S2のそれぞれを計算する。
具体的には、中性分子mの個別計算DRS信号S1を計算する場合には、DRS信号を復元するための緩和形態として、式(20)で表されるDebye緩和を仮定することにより、誘電率実部を計算すると共に、同様にDRS信号を復元するための緩和形態として、式(21)で表されるDebye緩和を仮定することにより、誘電率虚部を計算する。緩和強度Δεm の計算方法は、上記した通りである。これにより、中性分子mに関して、誘電率実部および誘電率虚部を含む個別計算DRS信号S1が計算される。


また、イオン対xの個別計算DRS信号S1を計算する場合には、緩和形態として、式(22)で表されるDebye緩和を仮定することにより、誘電率実部を計算すると共に、同様に緩和形態として、式(23)で表されるDebye緩和を仮定することにより、誘電率虚部を計算する。緩和強度Δεx の計算方法は、上記した通りである。これにより、イオン対xに関して、誘電率実部および誘電率虚部を含む個別計算DRS信号S1が計算される。


よって、中性分子mの個別計算DRS信号S1と、イオン対xの個別計算DRS信号S1とを加算することにより、電解液の計算DRS信号S2を計算する。
<2-3.作用および効果>
第2実施形態の解析装置100によれば、その解析装置100が上記した計算部10、実測部20および比較部30を備えている。
第2実施形態の解析装置100によれば、その解析装置100が上記した計算部10、実測部20および比較部30を備えている。
特に、計算部10は、計算手順1の代わりに計算手順2を用いて個別計算DRS信号S1を計算する。具体的には、計算部10は、構成成分Cの個別電気双極子モーメントを計算し、その構成成分Cの回転相関関数を計算し、その回転相関関数を指数関数に近似し、その構成成分Cの回転相関時間を計算し、その構成成分Cの個別計算DRS信号S1を計算する。
この場合には、第1実施形態に関して説明した場合と同様の理由により、実測DRS信号S3に対する計算DRS信号S2(個別計算DRS信号S1)の信頼性が担保されるため、中性分子mの物性だけでなくイオン対xの物性も把握される。これにより、中性分子mの物性だけでなくイオン対xの物性も加味することにより、イオン輸送性などに関して所望の性能を有する電解液の構成を自由に設計することが可能になる。
これらのことから、新規な電解液の構成を設計する際に、実際に中性分子mの物性およびイオン対xの物性を測定しなくても、所望の性能を有する電解液の構成が設計されるため、第1実施形態と同様に、その電解液の物性を容易かつ高精度に解析することができる。
この他、第2実施形態の解析方法によれば、電解液に関するMD計算を用いて個別計算DRS信号S1および計算DRS信号S2のそれぞれを計算し、誘電緩和スペクトロスコピー法を用いて電解液に関する実測DRS信号S3を測定し、その計算DRS信号S2と実測DRS信号S3とを互いに比較することにより、その計算DRS信号S2の構成要素である個別計算DRS信号S1を用いて実測DRS信号S3を帰属し、その電解液に関する物性値Pを計算している。よって、上記した理由により、電解液の物性を容易かつ高精度に解析することができる。
なお、第2実施形態における解析装置100および解析方法のそれぞれに関する他の作用および効果は、第1実施形態における解析装置100の解析方法のそれぞれに関する他の作用および効果と同様である。
<3.変形例>
上記した解析装置100の構成は、適宜、変更可能であると共に、上記した解析方法の手順は、適宜、変更可能である。なお、以下で説明する一連の変形例のうちの任意の2種類以上は、互いに組み合わされてもよい。
上記した解析装置100の構成は、適宜、変更可能であると共に、上記した解析方法の手順は、適宜、変更可能である。なお、以下で説明する一連の変形例のうちの任意の2種類以上は、互いに組み合わされてもよい。
[変形例1]
第1実施形態および第2実施形態のそれぞれでは、計算部10を用いた計算処理を行ったのち、実測部20を用いた測定処理を行っている。しかしながら、実測部20を用いた測定処理を行ったのち、計算部10を用いた計算処理を行ってもよい。この場合においても、比較部30において比較処理を行うことが可能であるため、同様の効果を得ることができる。
第1実施形態および第2実施形態のそれぞれでは、計算部10を用いた計算処理を行ったのち、実測部20を用いた測定処理を行っている。しかしながら、実測部20を用いた測定処理を行ったのち、計算部10を用いた計算処理を行ってもよい。この場合においても、比較部30において比較処理を行うことが可能であるため、同様の効果を得ることができる。
[変形例2]
図2は、変形例2における解析装置200のブロック構成を表しており、図1に対応している。
図2は、変形例2における解析装置200のブロック構成を表しており、図1に対応している。
解析装置100は、図1に示したように、計算部10、実測部20および比較部30を備えている。しかしながら、解析装置200は、図2に示したように、実測部20および比較部30を備えておらずに計算部10だけを備えていてもよい。
解析装置200の構成は、実測部20および比較部30を備えていないと共に、データD1を外部に出力することを除いて、解析装置100の構成と同様である。
具体的には、解析装置100を用いて、任意の構成を有する電解液を未だ解析したことがない場合には、計算DRS信号S2と実測DRS信号S3との比較が未だ行われていないと共に、個別計算DRS信号S1を用いた実測DRS信号S3の帰属も未だ行われていないため、その個別計算DRS信号S1および計算DRS信号S2のそれぞれの信頼性が未だ担保されていない。この場合には、計算DRS信号S2の信頼性を担保するために、計算部10による計算DRS信号S2の計算処理だけでなく、実測部20による実測DRS信号S3の測定処理と、比較部30による計算DRS信号S2と実測DRS信号S3との比較処理とを行うことが必要になる。よって、解析装置100は、図1に示したように、計算部10だけでなく実測部20および比較部30も備えていなければならない。
これに対して、解析装置100を用いて、任意の構成を有する電解液を既に解析したことがある場合には、計算DRS信号S2と実測DRS信号S3との比較が既に行われていると共に、個別計算DRS信号S1を用いた実測DRS信号S3の帰属も既に行われているため、その個別計算DRS信号S1および計算DRS信号S2のそれぞれの信頼性が既に担保されている。この場合には、あらためて計算DRS信号S2の信頼性を担保する必要がないため、計算部10による計算DRS信号S2の計算処理だけが必要であるのに対して、実測部20による実測DRS信号S3の測定処理と、比較部30による計算DRS信号S2と実測DRS信号S3との比較処理とが不要になる。よって、既に信頼性が担保されている計算DRS信号S2(個別計算DRS信号S1)をそのまま流用すればよいため、解析装置200は、図2に示したように、実測部20および比較部30を備えておらずに、計算部10だけを備えていてもよい。
すなわち、計算DRS信号S2の信頼性が既に担保されている場合には、計算部10、実測部20および比較部30を備えている解析装置100の代わりに、その実測部20および比較部30を備えておらずに計算部10だけを備えている解析装置200を用いてもよい。
この解析装置200では、第1実施形態において説明した計算手順1を用いて計算部10が個別計算DRS信号S1を計算してもよいし、第2実施形態において説明した計算手順2を用いて計算部10が個別計算DRS信号S1を計算してもよい。
具体的には、計算手順1を用いる場合には、計算部10は、MD計算を実施し、トータル電気双極子モーメントを計算し、時間相関関数を計算し、その時間相関関数を指数関数に近似し、その時間相関関数の近似結果をフーリエ変換し、個別計算DRS信号S1および計算DRS信号S2のそれぞれを計算し、物性値Pを計算し、外部にデータD1を出力してもよい。
また、計算手順2を用いる場合には、計算部10は、MD計算を実施し、個別電気双極子モーメントを計算し、回転相関関数を計算し、その回転相関関数を指数関数に近似し、回転相関時間を計算し、個別計算DRS信号S1および計算DRS信号S2のそれぞれを計算し、物性値Pを計算し、データD1を出力してもよい。
この場合においても、計算DRS信号S2(個別計算DRS信号S1)の信頼性が担保されるため、第1実施形態および第2実施形態のそれぞれにおいて説明した理由により、電解液の物性を容易かつ高精度に解析することができる。
[変形例3]
第1実施形態では、計算部10が個別計算DRS信号S1を計算するために計算手順1を用いたと共に、第2実施形態では、計算部10が個別計算DRS信号S1を計算するために計算手順2を用いた。
第1実施形態では、計算部10が個別計算DRS信号S1を計算するために計算手順1を用いたと共に、第2実施形態では、計算部10が個別計算DRS信号S1を計算するために計算手順2を用いた。
しかしながら、計算部10は、個別計算DRS信号S1を計算するために、計算手順1,2の双方を用いてもよい。この場合には、計算手順1により計算された個別計算DRS信号S1と、計算手順2により計算された個別計算DRS信号S1とを互いに比較することにより、最終的に個別計算DRS信号S1を決定すれば、その個別計算DRS信号S1の計算精度がより向上するため、より高い効果を得ることができる。
なお、計算手順1,2のうちのどちらか一方だけを用いる場合には、計算手順1を用いることが好ましい。
ただし、計算手順1だけを用いる場合には、セルサイズおよび計算時間などの要因によっては、統計量不足に起因して個別計算DRS信号S1の再現性が不十分になる可能性がある。そこで、個別計算DRS信号S1の計算精度を十分に高くすることにより、その個別計算DRS信号S1の信頼性を十分に高くするためには、変形例2において説明したように、計算手順1,2を併用することが好ましい。
[変形例4]
第2実施形態では、計算部10が個別計算DRS信号S1を計算するために緩和形態としてDebye型緩和を仮定した。しかしながら、緩和形態は、特に限定されないため、任意に変更可能である。
第2実施形態では、計算部10が個別計算DRS信号S1を計算するために緩和形態としてDebye型緩和を仮定した。しかしながら、緩和形態は、特に限定されないため、任意に変更可能である。
具体的には、緩和形態は、Debye型緩和の他、Cole-Davidson型緩和などでもよい。緩和形態としてCole-Davidson型緩和を仮定する場合には、上記した特徴時間τm ,τx および緩和強度Δεm ,Δεx などをそのまま流用してもよいが、追加のパラメータが必要になることに留意すべきである。ただし、計算DRS信号S2(個別計算DRS信号S1)および実測DRS信号S3のそれぞれに関して最小二乗法を適用することにより、上記した追加のパラメータが同定される。緩和形態としてCole-Davidson型緩和を用いても、その緩和形態としてDebye型緩和を仮定した場合と同様に、個別計算DRS信号S1を用いて実測DRS信号S3を帰属することが可能になる。
この場合においても、計算DRS信号S2(個別計算DRS信号S1)の信頼性が担保されると共に、その個別計算DRS信号S1を用いて実測DRS信号S3が帰属されるため、電解液の物性を容易かつ高精度に解析することができる。
なお、ここで説明した変形例2は、第2実施形態に限られず、変形例2,3のそれぞれに適用されてもよい。この場合においても、同様の効果を得ることができる。
[変形例5]
第1実施形態では、図1に示したように、解析装置100が比較部30を備えており、上記したように、その比較部30が画像解析処理を利用して計算DRS信号S2と実測DRS信号S3との比較処理を行う。
第1実施形態では、図1に示したように、解析装置100が比較部30を備えており、上記したように、その比較部30が画像解析処理を利用して計算DRS信号S2と実測DRS信号S3との比較処理を行う。
しかしながら、ここでは具体的に図示しないが、解析装置100が比較部30を備えていなくてもよい。この場合には、比較部30の代わりに、計算DRS信号S2および実測DRS信号S3などを表示する表示装置を用いることにより、解析装置100の使用者が目視で人為的に計算DRS信号S2と実測DRS信号S3との比較処理を行ってもよい。この場合においても、計算DRS信号S2を用いて実測DRS信号S3を帰属することが可能になるため、同様の効果を得ることができる。
本技術の実施例に関して説明する。
<実施例1>
以下で説明するように、第1実施形態において説明した解析装置100(解析方法)を用いて電解液を解析することにより、その電解液の物性を調べた。ここで用いた電解液は、溶媒として炭酸プロピレン(PC)を含んでいると共に、電解質塩として六フッ化リン酸リチウム(LiPF6 )を含んでいる。
以下で説明するように、第1実施形態において説明した解析装置100(解析方法)を用いて電解液を解析することにより、その電解液の物性を調べた。ここで用いた電解液は、溶媒として炭酸プロピレン(PC)を含んでいると共に、電解質塩として六フッ化リン酸リチウム(LiPF6 )を含んでいる。
[解析装置の構成]
解析装置100の構成は、以下で説明する通りである。
解析装置100の構成は、以下で説明する通りである。
(計算部の構成)
計算部10としては、MD計算を実行可能であるソフトウェアとしてWMI-MDを用いた。このソフトウェアは、力場としてAPPLE&Pを用いている。
計算部10としては、MD計算を実行可能であるソフトウェアとしてWMI-MDを用いた。このソフトウェアは、力場としてAPPLE&Pを用いている。
(実測部の構成)
実測部20の誘電分光部としては、ベクトルネットワークアナライザ(Keysight社製のVNA N5234A)と、マイクロ波用同軸ケーブル(JUNFLON社製のMWX221)と、終端開放型のプローブ(Keysight社製の85070E-020)とを用いた。この終端開放型のプローブは、上記したように、マイクロ波用同軸ケーブルを介してベクトルネットワークアナライザに接続されている。
実測部20の誘電分光部としては、ベクトルネットワークアナライザ(Keysight社製のVNA N5234A)と、マイクロ波用同軸ケーブル(JUNFLON社製のMWX221)と、終端開放型のプローブ(Keysight社製の85070E-020)とを用いた。この終端開放型のプローブは、上記したように、マイクロ波用同軸ケーブルを介してベクトルネットワークアナライザに接続されている。
実測部20の測定方法としては、反射係数S11,S22を用いる反射伝送法(Sパラメータ法)を採用した。反射係数S11は、ベクトルネットワークアナライザの第1ポートの反射係数であると共に、反射係数S22は、ベクトルネットワークアナライザの第2ポートの反射係数である。
反射係数に基づいて複素誘電率(実測DRS信号S3)を計算するためのソフトウェアとしては、上記したベクトルネットワークアナライザに付属されているソフトウェアを用いた。
実測DRS信号S3を測定する前には、開放状態である測定セルの内部に、誘電率が既知である純溶媒を収容することにより、その純溶媒を用いて校正した。この純溶媒としては、水、ベンゾニトリルおよびN,N-ジメチルアセトアミドを用いた。
実測DRS信号S3を測定する際には、シリンジを用いて測定セルの内部に電解液を導入することにより、終端開放型のプローブの先端を電解液に接触させた。この場合には、電解液中に空気が含まれないように注意したと共に、測定時において電解液の収容量(体積)を一定に維持した。
実測部20の補正部としては、マイクロソフト社製の表計算ソフト(エクセル)を用いた。
(比較部の構成)
比較部30としては、画像解析処理を利用した比較処理を実行可能であるソフトウェアとして、上記した一連の比較項目に基づいて計算DRS信号S2と実測DRS信号S3とを定性的に比較可能であるプログラムを用いた。このプログラムは、Pythonを用いて作成されたオリジナルのプログラムである。
比較部30としては、画像解析処理を利用した比較処理を実行可能であるソフトウェアとして、上記した一連の比較項目に基づいて計算DRS信号S2と実測DRS信号S3とを定性的に比較可能であるプログラムを用いた。このプログラムは、Pythonを用いて作成されたオリジナルのプログラムである。
[解析装置を用いた電解液の解析]
以下で説明する手順により、解析装置100を用いて電解液を解析した。図3~図8のそれぞれは、解析装置100を用いた電解液の解析結果を表している。
以下で説明する手順により、解析装置100を用いて電解液を解析した。図3~図8のそれぞれは、解析装置100を用いた電解液の解析結果を表している。
具体的には、図3は、時間相関関数の計算結果(横軸は時間(ns)、縦軸は時間相関関数)を表していると共に、図4は、時間相関関数の近似結果(横軸は時間(ns)、縦軸は時間相関関数)を表している。
図5は、個別計算DRS信号S1(誘電率実部)および計算DRS信号S2(誘電率実部)の計算結果(横軸は周波数ν(GHz)、縦軸は誘電率実部)を表している。図6は、個別計算DRS信号S1(誘電率虚部)および実測DRS信号S3(誘電率虚部)の計算結果(横軸は周波数ν(GHz)、縦軸は誘電率虚部)を表している。図7は、計算DRS信号S2(誘電率実部および誘電率虚部)の計算結果(横軸は周波数ν(GHz)、縦軸は誘電率実部および誘電率虚部)を表している。
図8は、実測DRS信号S3(誘電率実部および誘電率挙部)の測定結果(横軸は周波数ν(GHz)、縦軸は誘電率実部および誘電率虚部)を表している。
(個別計算DRS信号S1の計算および計算DRS信号S2の計算)
解析装置100を用いて電解液を解析する場合には、最初に、以下で説明するように、計算部10において、計算手順1を用いて個別計算DRS信号S1を計算したのち、計算DRS信号S2を計算した。
解析装置100を用いて電解液を解析する場合には、最初に、以下で説明するように、計算部10において、計算手順1を用いて個別計算DRS信号S1を計算したのち、計算DRS信号S2を計算した。
具体的には、最初に、電解液に関するMD計算を行うために、その電解液の構成を設定した。この場合には、上記したように、溶媒としてPCを設定したと共に、電解質塩としてLiPF6 を設定した。これにより、構成成分Cとして、中性分子mであるPC(C4 H6 O3 )と、イオン対xであるCIP(Li+ PF6
-)とを設定した。
MD計算の条件は、系のサイズ(原子数)=約5000個~10000個、時間刻み=0.5fsとした。この場合には、希薄状態を出発状態として、粒子数、圧力および温度のそれぞれが一定であるNPTアンサンブルにおいて常温常圧における平衡体積を取得したと共に、約10nsの時間において平衡化計算を行ったのち、本計算を実行した。また、NPTアンサンブルにおいて、18ns以上の時間に対して計算を実行することにより、各構成成分Cを構成している一連の原子の挙動(位置、すなわち座標)の履歴を取得した。
電解液中における電解質塩の含有量(M=mol/dm3 )は、5種類(0M、0.5M、1M、1.5Mおよび2M)となるように設定した。ここで説明した電解質塩の含有量は、溶媒に対する電解質塩の含有量である。
続いて、MD計算の計算結果に基づいて、各構成成分C(中性分子mおよびイオン対x(CIP))のトータル電気双極子モーメントを計算したのち、そのトータル電気双極子モーメントに基づいて、各構成成分Cの時間相関関数を計算した。なお、トータル電気双極子モーメントの計算手順および時間相関関数の計算手順のそれぞれに関する詳細は、上記した通りである。
これにより、一連の構成成分Cのうちの中性分子m(PC)に関する時間相関関数の計算結果だけを具体的に挙げると、図3に示した時間相関関数の計算結果が得られた。図3では、上記したように、横軸が時間(ns)を示していると共に、縦軸が中性分子mであるPCの時間相関関数を表している。上記したように、電解液中における電解質塩の含有量を5種類となるように設定したため、図3では、5種類の時間相関関数の計算結果が示されている。
図3において、3A~3Eと電解液中における電解質塩の含有量との関係は、3A=0M、3B=0.5M、3C=1M、3D=1.5M、3E=2Mである。
続いて、時間相関関数を指数関数に近似した。この場合には、最小二乗法を用いて、時間相関関数をフィッティングした。これにより、時間相関関数の計算誤差(時間相関関数の変動誤差)が除去されたため、その時間相関関数が近似された。なお、時間相関関数の近似手順に関する詳細は、上記した通りである。
これにより、一連の構成成分Cのうちの中性分子m(PC)に関する時間相関関数の近似結果だけを具体的に挙げると、図4に示した時間相関関数の近似結果が得られた。すなわち、図4に示した時間相関関数の近似結果は、図3に示した時間相関関数の計算結果に対応している。
図4において、4A~4Eと電解液中における電解質塩の含有量との関係は、4A=0M、4B=0.5M、4C=1M、4D=1.5M、4E=2Mである。
続いて、時間相関関数の近似結果をフーリエ変換することにより、各構成成分Cの個別計算DRS信号S1(誘電率実部および誘電率虚部)を計算したのち、それらの個別計算DRS信号S1を加算することにより、電解液の計算DRS信号S2(誘電率実部および誘電率虚部)を計算した。この場合には、スケーリングファクターAの値を0.25とした。
なお、時間相関関数のフーリエ変換手順、個別計算DRS信号S1の計算手順および計算DRS信号S2の計算手順のそれぞれに関する詳細は、上記した通りである。
これにより、図5に示したように、各構成成分C(中性分子m(PC)およびイオン対x(CIP))に関する個別計算DRS信号S1(誘電率実部)が得られた。また、図6に示したように、各構成成分C(中性分子m(PC)およびイオン対x(CIP))に関する個別計算DRS信号S1(誘電率虚部)が得られた。図5では、上記したように、横軸が周波数ν(GHz)を示していると共に、縦軸が誘電率実部を示している。図6では、上記したように、横軸が周波数ν(GHz)を示していると共に、縦軸が誘電率虚部を示している。
また、図7に示したように、電解液の計算DRS信号S2が得られた。図7では、上記したように、横軸が周波数ν(GHz)を示していると共に、縦軸が誘電率実部および誘電率虚部を示している。
なお、図5では、上記したように、互いに比較しやすくするために個別計算DRS信号S1(誘電率実部)だけでなく計算DRS信号S2(誘電率実部)も併せて示している。
図5において、5A~5Gと電解液中における電解質塩の含有量との関係は、5A=0M、5B~5D=1M、5E~5G=2Mである。また、図5では、5C,5F=中性分子m(PC)の個別計算DRS信号S1、5B,5E=イオン対x(CIP)の個別計算DRS信号S1、5A,5D,5G=計算DRS信号S2を示している。
また、図6では、上記したように、互いに比較しやすくするために個別計算DRS信号S1(誘電率虚部)だけでなく計算DRS信号S2(誘電率虚部)も併せて示している。)
図6において、6A~6Gと電解液中における電解質塩の含有量との関係は、6A=0M、6B~6D=1M、6E~6G=2Mである。また、図6では、6C,6F=中性分子m(PC)の個別計算DRS信号S1、6B,6E=イオン対x(CIP)の個別計算DRS信号S1、6A,6D,6G=計算DRS信号S2を示している。
また、図7では、誘電率実部と誘電率虚部とを互いに比較しやすくするために、その誘電率実部と誘電率虚部とを1つの図面(図7)中にまとめて示している。この場合には、適宜、誘電率実部と誘電率虚部との位置関係を調整している。
図7において、7A~7Fと電解液中における電解質塩の含有量との関係は、7A,7D=0M、7B,7E=1M、7C,7F=2Mである。また、図7では、7A~7C=計算DRS信号S2(誘電率実部)、7D~7F=計算DRS信号S2(誘電率虚部)を示している。
(物性値Pの計算)
次に、計算部10において、個別計算DRS信号S1および計算DRS信号S2に基づいて、各構成成分Cに固有の物性値Pを計算した。
次に、計算部10において、個別計算DRS信号S1および計算DRS信号S2に基づいて、各構成成分Cに固有の物性値Pを計算した。
ここでは、中性分子m(PC)の物性値Pとして、緩和強度Δεm 、特徴時間τm 、濃度nm および静的誘電率εm
staのそれぞれを計算した。また、イオン対x(CIP)の物性値Pとして、緩和強度Δεx 、特徴時間τx 、濃度nx および静的誘電率εx
staのそれぞれを計算した。この他、電解液の塩解離度αを計算した。なお、各物性値Pの計算手順は、上記した通りである。
この結果、電解液中における電解質塩の含有量が1Mである場合の物性値Pは、以下の通りであった。中性分子m(PC)に関して、緩和強度Δεm =41.5、特徴時間τm =66.5ps、濃度nm =11.4M、静的誘電率εm
sta=41.5であった。イオン対x(CIP)に関して、緩和強度Δεx =1.0、特徴時間τx =76.0ps、濃度nx =0.1M、静的誘電率εx
sta=1.0であった。電解液の塩解離度α=0.76であった。
これにより、計算部10から比較部30にデータD1を出力した。データD1に関する詳細は、上記した通りである。
(実測DRS信号S3の測定)
次に、以下で説明するように、実測部20において実測DRS信号S3を測定した。
次に、以下で説明するように、実測部20において実測DRS信号S3を測定した。
具体的には、最初に、電解液を準備した。この場合には、上記したように、溶媒(PC)に電解質塩(LiPF6 )を添加したのち、その溶媒を撹拌することにより、電解液を調製した。
電解液中における電解質塩の含有量(M)は、11種類(0M、0.2M、0.4M、0.6M、0.8M、1M、1.2M、1.4M、1.6M、1.8Mおよび2M)となるように設定した。ここで説明した電解質塩の含有量は、溶媒に対する電解質塩の含有量である。
続いて、誘電緩和スペクトロスコピー法を用いて電解液を分析することにより、その電解液の実測DRS信号S3を測定した。この場合には、電解液(温度=25℃)にマイクロ波(周波数=200MHz~43.5GHz)を照射したのち、応答波(マイクロ波の反射成分および透過成分)を受信することにより、その応答波に基づいて実測DRS信号S3(誘電率実部および誘電率虚部)を計算した。
続いて、電解液のイオン伝導性に起因する測定誤差を除去するために、実測DRS信号S3を補正した。この場合には、上記したように、Debye型の緩和関数を用いて実測DRS信号S3のフィッティングを行う。これにより、回転運動以外の運動に起因する測定誤差が実測DRS信号S3から除去されたため、その実測DRS信号S3が補正された。
これにより、図8に示した実測DRS信号S3の測定結果が得られた。図8では、上記したように、横軸が周波数ν(GHz)を示していると共に、縦軸が誘電率実部および誘電率虚部を示している。
なお、図8では、誘電率実部と誘電率虚部とを互いに比較しやすくするために、その誘電率実部および誘電率虚部を1つの図面(図8)中にまとめて示している。上記したように、電解液中における電解質塩の含有量を11種類となるように設定したため、図8では、11種類の誘電率実部および11種類の誘電率虚部が示されている。
図8において、8A~8Kと電解液中における電解質塩の含有量との関係は、8A,8L=0M、8B,8M=0.2M、8C、8N=0.4M、8D,8O=0.6M、8E,8P=0.8M、8F,8Q=1M、8G,8R=1.2M、8H,8S=1.4M、8I,8T=1.6M、8J,8U=1.8M、8K,8V=2Mである。また、図8では、8A~8K=実測DRS信号S3(誘電率実部)、8L~8V=実測DRS信号S3(誘電率虚部)を示している。
最後に、実測部20から比較部30にデータD2出力した。データD2に関する詳細は、上記した通りである。
(計算DRS信号S2と実測DRS信号S3との比較および個別計算DRS信号S1を用いた実測DRS信号S3の帰属)
最後に、以下で説明するように、比較部30において、計算DRS信号S2と実測DRS信号S3とを互いに比較した。
最後に、以下で説明するように、比較部30において、計算DRS信号S2と実測DRS信号S3とを互いに比較した。
具体的には、図7に示した計算DRS信号S2と、図8に示した実測DRS信号S3との間において、両者のスペクトル形状が互いに定性的に一致しているかどうかを確認した。この結果、以下で説明する傾向が見出された。
具体的には、第1に、計算DRS信号S2および実測DRS信号S3のそれぞれでは、電解液中における電解質塩の含有量が0Mから2Mに増加すると、誘電率虚部の強度が最大となる時の周波数ν(いわゆるピーク位置)が減少し、より具体的には周波数νが約5GHzから約0.5GHzに減少した。
第2に、計算DRS信号S2および実測DRS信号S3のそれぞれでは、電解液中における電解質塩の含有量が0Mから2Mに増加すると、誘電率虚部の強度の最大値(いわゆるピーク強度)が減少し、より具体的には誘電率虚部の強度が約30から約12に減少した。
第3に、計算DRS信号S2および実測DRS信号S3のそれぞれでは、電解液中における電解質塩の含有量が0Mから2Mに増加すると、静的誘電率εsta が減少し、より具体的には静的誘電率εsta が約60から約35に減少した。
これらの傾向から、計算DRS信号S2と実測DRS信号S3とが互いに定性的に一致した。これにより、実測DRS信号S3に対する計算DRS信号S2の信頼性が担保されたため、その計算DRS信号S2の構成要素である個別計算DRS信号S1の信頼性も担保された。よって、個別計算DRS信号S1を用いて実測DRS信号S3を帰属することができた。
最後に、解析装置100は、外部にデータD3を出力した。データD3に関する詳細は、上記した通りである。これにより、解析装置100を用いた電解液の解析が完了した。
[考察]
電解液に関する計算DRS信号S2の信頼性が担保されたため、各構成成分C(中性分子m(PC)およびイオン対x(CIP))に関する個別計算DRS信号S1の信頼性も担保された。これにより、図3~図8に示した結果から、以下で説明する物性が導き出された。
電解液に関する計算DRS信号S2の信頼性が担保されたため、各構成成分C(中性分子m(PC)およびイオン対x(CIP))に関する個別計算DRS信号S1の信頼性も担保された。これにより、図3~図8に示した結果から、以下で説明する物性が導き出された。
第1に、図5~図8から明らかなように、電解液中における電解質塩の含有量が0M~2Mである範囲において、実測DRS信号S3のスペクトル形状は、主に、中性分子m(PC)のスペクトル形状に応じて決定されている。
第2に、図7から明らかなように、中性分子m(PC)に関する個別計算DRS信号S1(誘電率虚部)が最大になる時の周波数νは、電解液中における電解質塩の含有量が増加するに応じて減少している。これにより、電解液中における電解質塩の含有量が増加すると、中性分子m(PC)の運動性が低下すると考えられる。
同様に、イオン対x(CIP)に関する個別計算DRS信号S1(誘電率虚部)の強度が最大になる時の周波数νは、電解液中における電解質塩の含有量が増加するに応じて減少している。これにより、電解液中における電解質塩の含有量が増加すると、イオン対x(CIP)の運動性も低下すると考えられる。
第3に、図5および図6から明らかなように、イオン対x(CIP)に関する個別計算DRS信号S1(誘電率虚部)の強度は、電解液中における電解質塩の含有量が増加するに応じて増加している。これにより、電解液中における電解質塩の含有量が増加すると、イオン対x(CIP)の濃度が増加する。
この場合には、実際に、MD計算のトラジェクトリに基づいて、カチオン(Li+ )とアニオン(PF6
-)とが互いに接触する頻度(平均配位数)を算出したところ、電解液中における電解質塩の含有量が増加するに応じて平均配位数が増加していることが確認された。
第4に、図6から明らかなように、同一の系内(電解液)において、イオン対x(CIP)の特徴周波数νx は、中性分子m(PC)の特徴周波数νm よりも減少した。これにより、外部電場に対するイオン対x(CIP)の応答は、外部電場に対する中性分子m(PC)の応答よりも遅くなるため、そのイオン対x(CIP)の運動性は、中性分子m(PC)の運動性よりも低いと考えられる。
第5に、図5から明らかなように、中性分子m(PC)の静的誘電率εm
staおよびイオン対x(CIP)の静的誘電率εx
staのそれぞれは、電解液中における電解質塩の含有量が増加するに応じて減少した。
これらのことから、電解液が溶媒(PC)および電解質塩(LiPF6 )を含んでいるため、構成成分Cが中性分子m(PC)およびイオン対x(CIP)を含んでいる電解液の物性に関して、新規かつ有用な情報が得られた。
詳細には、個別計算DRS信号S1および計算DRS信号S2に基づいて、各構成成分Cに関する物性値P(緩和強度Δεm ,Δεx 、特徴時間τm ,τx 、濃度nm ,nx 、静的誘電率εm
sta,εx
staおよび塩解離度α)を取得することができた。この場合には、物性値Pに基づいて、各構成成分Cの運動性を把握することができたと共に、各構成成分Cの運動性に関する電解液の濃度依存性も把握することができた。
また、化学的に静的である中性分子mの物性だけでなく、化学的に動的であるイオン対x(CIP)の物性も把握することができた。この場合には、イオン対xの濃度に基づいて、電解液中における電解質塩のイオン解離性を見積もることもできる。
さらに、実測DRS信号S3の測定過程において計算されるイオン伝導性に起因する測定誤差を利用すれば、電解液のイオン伝導性を見積もることもできる。
<実験例2>
以下で説明するように、第2実施形態において説明した解析装置100(解析方法)を用いて電解液を解析することにより、その電解液の物性を調べた。ここで用いた電解液は、混合溶媒として炭酸プロピレン(PC)および炭酸ジエチル(DEC)を含んでいると共に、電解質塩として六フッ化リン酸リチウム(LiPF6 )を含んでいる。この場合には、混合溶媒の混合比(重量比)をPC:DEC=30:70とした。
以下で説明するように、第2実施形態において説明した解析装置100(解析方法)を用いて電解液を解析することにより、その電解液の物性を調べた。ここで用いた電解液は、混合溶媒として炭酸プロピレン(PC)および炭酸ジエチル(DEC)を含んでいると共に、電解質塩として六フッ化リン酸リチウム(LiPF6 )を含んでいる。この場合には、混合溶媒の混合比(重量比)をPC:DEC=30:70とした。
[解析装置の構成]
実施例2における解析装置100の構成は、計算部10が個別計算DRS信号S1を計算するために計算手順1の代わりに計算手順2を用いたことを除いて、実施例1における解析装置100の構成と同様にした。
実施例2における解析装置100の構成は、計算部10が個別計算DRS信号S1を計算するために計算手順1の代わりに計算手順2を用いたことを除いて、実施例1における解析装置100の構成と同様にした。
[解析装置を用いた電解液の解析]
以下で説明する手順により、解析装置100を用いて電解液を解析した。図9~図11のそれぞれは、解析装置100を用いた電解液の解析結果を表している。
以下で説明する手順により、解析装置100を用いて電解液を解析した。図9~図11のそれぞれは、解析装置100を用いた電解液の解析結果を表している。
具体的には、図9は、個別計算DRS信号S1(誘電率虚部)および計算DRS信号S2(誘電率虚部)の計算結果(横軸は周波数ν(GHz)、縦軸は誘電率虚部)を表している。図10は、計算DRS信号S2(誘電率実部および誘電率虚部)の計算結果(横軸は周波数ν(GHz)、縦軸は誘電率実部および誘電率虚部)を表している。
図11は、実測DRS信号S3(誘電率実部および誘電率虚部)の測定結果(横軸は周波数ν(GHz)、縦軸は誘電率実部および誘電率虚部)を表している。
(個別計算DRS信号S1の計算および計算DRS信号S2の計算)
解析装置100を用いて電解液を解析する場合には、最初に、以下で説明するように、計算部10において、計算手順2を用いて各構成成分Cの計算DRS信号S1を計算した共に、電解液の計算DRS信号S2を計算した。
解析装置100を用いて電解液を解析する場合には、最初に、以下で説明するように、計算部10において、計算手順2を用いて各構成成分Cの計算DRS信号S1を計算した共に、電解液の計算DRS信号S2を計算した。
具体的には、最初に、電解液に関するMD計算を行うために、電解液の構成を設定した。この場合には、上記したように、溶媒としてPCおよびDECを設定したと共に、電解質塩としてLiPF6 を設定した。これにより、構成成分Cとして、中性分子mである炭酸プロピレン(C4 H6 O3 )および炭酸ジエチル(C5 H10O3 )と、イオン対xであるCIP(Li+ PF6
-)とを設定した。
続いて、電解液に関するMD計算を実施した。MD計算の計算手順は、実施例1と同様にした。電解液中における電解質塩の含有量は、2種類(0Mおよび1M)となるように設定した。ここで説明した電解質塩の含有量は、上記したように、溶媒に対する電解質塩の含有量である。
続いて、MD計算の計算結果に基づいて、各構成成分C(中性分子mおよびイオン対x(CIP))の個別電気双極子モーメントを計算したのち、その個別電気双極子モーメントに基づいて、各構成成分Cの回転相関関数を計算した。また、回転相関関数を指数関数に近似することにより、各構成成分Cの回転相関時間を計算した。さらに、回転相関時間に基づいて、各構成成分Cの個別計算DRS信号S1(誘電率実部および誘電率虚部)を計算したのち、電解液の計算DRS信号S2(誘電率実部および誘電率虚部)を計算した。
なお、個別電気双極子モーメントの計算手順、回転相関関数の計算手順、回転相関関数の近似手順、回転相関時間の計算手順、個別計算DRS信号S1の計算手順および計算DRS信号S2の計算手順のそれぞれに関する詳細は、上記した通りである。
これにより、図9に示したように、各構成成分C(中性分子m(PC,DEC)およびイオン対(CIP))に関する個別計算DRS信号S1(誘電率虚部)が得られた。図9では、上記したように、横軸が周波数ν(GHz)を示していると共に、縦軸が誘電率虚部を示している。
また、図10に示したように、電解液の計算DRS信号S2が得られた。図10では、上記したように、横軸が周波数ν(GHz)を示していると共に、縦軸が誘電率実部および誘電率虚部を示している。
なお、図9では、個別計算DRS信号S1(誘電率虚部)だけでなく、計算DRS信号S2(誘電率虚部)も併せて示している。また、図10では、誘電率実部と誘電率虚部との位置関係を調整している。
図9において、9A~9Gと電解液中における電解質塩の含有量との関係は、9A~9C=0M、9D~9G=1Mである。また、図9では、9A,9D=中性分子m(DEC)の個別計算DRS信号S1、9B,9E=中性分子m(PC)の個別計算DRS信号S1、9F=イオン対x(CIP)の個別計算DRS信号S1、9C,9G=計算DRS信号S2を示している。
図10において、10A~10Dと電解液中における電解質塩の含有量との関係は、10A,10C=0M、10B,10D=1Mである。また、図10では、10A,10B=計算DRS信号S2(誘電率実部)、10C,10D=計算DRS信号S2(誘電率虚部)を示している。
(物性値Pの計算)
次に、計算部10において、個別計算DRS信号S1および計算DRS信号S2に基づいて、各構成成分Cに固有の物性値Pを計算した。
次に、計算部10において、個別計算DRS信号S1および計算DRS信号S2に基づいて、各構成成分Cに固有の物性値Pを計算した。
ここでは、中性分子m(PC,DEC)の物性値Pとして、緩和強度Δεm 、特徴時間τm 、濃度nm および静的誘電率εm
staのそれぞれを計算した。また、イオン対x(CIP)の物性値Pとして、緩和強度Δεx 、特徴時間τx 、濃度nx および静的誘電率εx
staのそれぞれを計算した。この他、電解液の塩解離度αを計算した。
この結果、電解液中における電解質塩の含有量が1Mである場合の物性値Pは、以下の通りであった。中性分子m(PC)に関して、緩和強度Δεm =9.2、特徴時間τm =31.5ps、濃度nm =2.9M、静的誘電率εm
sta=9,2であった。中性分子m(DEC)に関して、緩和強度Δεm =0.6、特徴時間τm =13.5ps、濃度nm =5.9M、静的誘電率εm
sta=0.6であった。イオン対x(CIP)に関して、緩和強度Δεx =4.1、特徴時間τx =180.0ps、濃度nx =0.4M、静的誘電率εx
sta=4.1であった。電解液の塩解離度α=0.51であった。
(実測DRS信号S3の測定)
次に、以下で説明するように、実測部20において実測DRS信号S3を測定した。
次に、以下で説明するように、実測部20において実測DRS信号S3を測定した。
具体的には、最初に、電解液を準備した。この場合には、上記したように、混合溶媒(PCおよびDEC)に電解質塩(LiPF6 )を添加したのち、その混合溶媒を撹拌することにより、電解液を調製した。
電解液中における電解質塩の含有量(M)は、2種類(0Mおよび1M)となるように設定した。ここで説明した電解質塩の含有量は、溶媒に対する電解質塩の含有量である。
続いて、誘電緩和スペクトロスコピー法を用いて電解液を分析することにより、その電解液の実測DRS信号S3を測定した。実測DRS信号S3の測定手順に関する詳細は、実施例1と同様にした。
これにより、図11に示した実測DRS信号S3が得られた。図11では、上記したように、横軸が周波数ν(GHz)を表していると共に、縦軸が誘電率実部および誘電率虚部を表している。なお、図11では、誘電率実部と誘電率虚部とをまとめて示している。上記したように、電解液中における電解質塩の含有量を2種類となるように設定したため、図11では、2種類の誘電率実部および2種類の誘電率虚部が示されている。
図11において、11A~11Dと電解液中における電解質塩の含有量との関係は、11A,11C=0M、11B,11D=1Mである。また、図11では、11A,11B=実測DRS信号S3(誘電率実部)、11C,11D=実測DRS信号S3(誘電率虚部)を示している。
(計算DRS信号S2と実測DRS信号S3との比較および個別計算DRS信号S1を用いた実測DRS信号S3の帰属)
最後に、以下で説明するように、比較部30において計算DRS信号S2と実測DRS信号S3とを互いに比較した。
最後に、以下で説明するように、比較部30において計算DRS信号S2と実測DRS信号S3とを互いに比較した。
具体的には、図10に示した計算DRS信号S2と、図11に示した実測DRS信号S3との間において、両者のスペクトル形状が互いに定性的に一致しているかどうかを確認した。この結果、以下で説明する傾向が見出された。
具体的には、実測DRS信号S3では、電解液中における電解質塩の含有量が増加すると、誘電率虚部の強度が最大になる時の周波数νが減少し、より具体的には周波数νが約7GHzから約2GHzに減少した。
また、実測DRS信号S3では、電解液中における電解質塩の含有量が増加すると、誘電率虚部の強度の最大値が減少し、より具体的には誘電率虚部の強度の最大値が約6から約3に減少した。
さらに、実測DRS信号S3では、電解液中における電解質塩の含有量が増加すると、周波数νが最小(=約0.2GHz)になる時における誘電率実部の強度が減少し、より具体的には誘電率実部の強度が約16から約12に減少した。
これに対して、計算DRS信号S2では、電解液中における電解質塩の含有量が増加すると、誘電率虚部の強度が最大になる時の周波数νが減少し、より具体的には周波数νが約10GHzから約2GHzに減少した。
また、計算DRS信号S2では、電解液中における電解質塩の含有量が増加すると、誘電率虚部の強度の最大値が減少し、より具体的には誘電率虚部の強度の最大値が約8から約5に減少した。
さらに、計算DRS信号S2では、電解液中における電解質塩の含有量が増加すると、周波数νが最小(=約0.2GHz)になる時における誘電率実部の強度が減少し、より具体的には誘電率実部の強度が約16から約13に減少した。
これらの傾向から、計算DRS信号S2と実測DRS信号S3とが互いに定性的に一致した。これにより、実測DRS信号S3に対する計算DRS信号S2の信頼性が担保されたため、その計算DRS信号S2の構成要素である個別計算DRS信号S1の信頼性も担保された。よって、個別計算DRS信号S1を用いて実測DRS信号S3を帰属することができた。
[考察]
電解液に関する計算DRS信号S2の信頼性が担保されたため、各構成成分C(中性分子m(PCおよびDEC)およびイオン対x(CIP))に関する個別計算DRS信号S1の信頼性も担保された。これにより、図9~図11に示した結果から、以下で説明する物性が導き出された。
電解液に関する計算DRS信号S2の信頼性が担保されたため、各構成成分C(中性分子m(PCおよびDEC)およびイオン対x(CIP))に関する個別計算DRS信号S1の信頼性も担保された。これにより、図9~図11に示した結果から、以下で説明する物性が導き出された。
第1に、図9~図11から明らかなように、電解液中における電解質塩の含有量が0M~2Mである範囲において、実測DRS信号S3のスペクトル形状は、主に、中性分子m(PC)のスペクトル形状に応じて決定されている。これにより、中性分子m(DEC)のスペクトル形状は、実測DRS信号S3のスペクトル形状にほとんど影響を及ぼしていない。
ただし、中性分子m(DEC)に関する個別計算DRS信号S1(誘電率虚部)の強度が最大になる時の周波数νは、中性分子m(PC)に関する個別計算DRS信号S1(誘電率虚部)の強度が最大になる時の周波数νよりも増加している。これにより、中性分子m(DEC)の運動性は、中性分子m(PC)の運動性よりも高いと考えられる。
なお、電解液中における電解質塩の含有量が大きい場合(=1M)における計算DRS信号S3のスペクトル形状は、電解液中における電解質塩の含有量が小さい場合(=0M)における計算DRS信号S3のスペクトル形状よりもブロードである。この場合において、前者において誘電率虚部の強度が最大になる時の周波数νは、後者において誘電率虚部の強度が最大になる時の周波数νよりも減少している。
これにより、上記したように、実測DRS信号S3のスペクトル形状を決定しているのは、主に、中性分子m(PC)である。ただし、周波数νが小さい領域では、中性分子m(DEC)も実測DRS信号S3のスペクトル形状に小さくない影響を及ぼしている。
第2に、図7および図11から明らかなように、実施例2における緩和強度Δεx は、実施例1における緩和強度Δεx よりも増加している。この緩和強度Δεx は、上記したように、電解液の物性に対するイオン対x(CIP)の影響を表している。これにより、電解液中における電解質塩の含有量が一定であっても、混合溶媒中におけるDECの割合(混合比)を増加させることにより、その電解液中ではイオン対x(CIP)が形成されやすくなると考えられる。
これらのことから、混合溶媒(PCおよびDEC)および電解質塩(LiPF6 )を含んでいるため、構成成分Cとして中性分子m(PCおよびDEC)およびイオン対x(CIP)を含んでいる電解液の物性に関して、新規かつ有用な情報が得られた。
詳細には、実施例1と同様の利点を得ることができた。この場合には、特に、混合溶媒を用いても同様の利点を得ることができた。
<実験例3>
以下で説明するように、第1実施形態において説明した解析装置100(解析方法)を用いて電解液を解析することにより、その電解液の物性を調べた。ここで用いた電解液は、溶媒として炭酸ジエチル(DEC)を含んでいると共に、電解質塩として六フッ化リン酸リチウム(LiPF6 )を含んでいる。
以下で説明するように、第1実施形態において説明した解析装置100(解析方法)を用いて電解液を解析することにより、その電解液の物性を調べた。ここで用いた電解液は、溶媒として炭酸ジエチル(DEC)を含んでいると共に、電解質塩として六フッ化リン酸リチウム(LiPF6 )を含んでいる。
[解析装置の構成]
実施例3における解析装置100の構成は、実施例1における解析装置100の構成と同様にした。
実施例3における解析装置100の構成は、実施例1における解析装置100の構成と同様にした。
[電解液の解析]
以下で説明する手順により、解析装置100を用いて電解液を解析した。図12~図15のそれぞれは、解析装置100を用いた電解液の解析結果を表している。
以下で説明する手順により、解析装置100を用いて電解液を解析した。図12~図15のそれぞれは、解析装置100を用いた電解液の解析結果を表している。
具体的には、図12および図13のそれぞれは、電解質塩の含有量が1Mである電解液に関する個別計算DRS信号S1(誘電率虚部)の計算結果(横軸は周波数ν(GHz)、縦軸は誘電率虚部)を表している。ただし、図12では、構成成分Cを三成分系とした場合の計算結果を示していると共に、図13では、構成成分Cを二成分系とした場合の計算結果を示している。ここで説明した「三成分系」および「二成分系」のそれぞれの詳細に関しては、後述する。
図14は、計算DRS信号S2(誘電率実部および誘電率虚部)の計算結果(横軸は周波数ν(GHz)、縦軸は誘電率実部および誘電率虚部)を表している。図14では、電解質塩の含有量が1Mである電解液において構成成分Cが三成分系である場合の計算結果を示している。図15は、実測DRS信号S3(誘電率実部および誘電率虚部)の測定結果(横軸は周波数ν(GHz)、縦軸は誘電率実部および誘電率虚部)を表している。
(個別計算DRS信号S1の計算および計算DRS信号S2の計算)
解析装置100を用いて電解液を解析する場合には、最初に、以下で説明するように、計算部10において、計算手順1を用いて各構成成分Cの個別計算DRS信号S1を計算したと共に、電解液の計算DRS信号S2を計算した。
解析装置100を用いて電解液を解析する場合には、最初に、以下で説明するように、計算部10において、計算手順1を用いて各構成成分Cの個別計算DRS信号S1を計算したと共に、電解液の計算DRS信号S2を計算した。
具体的には、最初に、電解液に関するMD計算を行うために、その電解液の構成を設定した。この場合には、上記したように、溶媒としてDECを設定したと共に、電解質塩としてLiPF6 を設定した。
この場合には、3種類の構成成分Cを含んでいる系(三成分系)として、中性分子mであるDEC(C5 H10O3 )と、イオン対xであるCIP(Li+ PF6
-)と、イオン対xであるイオン会合体(Li2 (PF6 )2 )とを設定した。この場合には、イオン対xとしてLi2 (PF6 )2 だけでなくLi2 PF6 およびLi(PF6 )2 などを含む複数種類のイオン会合体を設定した。
また、比較のために、2種類の構成成分Cを含んでいる系(二成分系)として、中性分子mであるDEC(C5 H10O3 )と、イオン対xであるCIP(Li+ PF6
-)とを設定した。
続いて、電解液に関するMD計算を実施した。MD計算の計算手順は、実施例1と同様にした。電解液中における電解質塩の含有量は、2種類(0Mおよび1M)とした。
続いて、MD起算の計算結果に基づいて、実施例1と同様の手順により、三成分系における各構成成分C(中性分子m(DEC)およびイオン対x(CIPおよびイオン会合体))の個別計算DRS信号S1(誘電率実部および誘電率虚部)を計算したのち、電解液の計算DRS信号S2(誘電率実部および誘電率虚部)を計算した。
また、比較のために、MD起算の計算結果に基づいて、実施例1と同様の手順により、二成分系における各構成成分C(中性分子m(DEC)およびイオン対x(CIP))の個別計算DRS信号S1(誘電率実部および誘電率虚部)を計算したのち、電解液の計算DRS信号S2(誘電率実部および誘電率虚部)を計算した。
これにより、図12に示したように、三成分系(構成成分Cは中性分子m(DEC)およびイオン対x(CIPおよびイオン会合体))に関する個別計算DRS信号S1(誘電率虚部)が得られた。図12では、上記したように、横軸が周波数ν(GHz)を示していると共に、縦軸が誘電率虚部を示している。
また、図13に示したように、二成分系(構成成分Cは中性分子m(DEC)およびイオン対x(CIP))に関する個別計算DRS信号S1(誘電率虚部)が得られた。図13では、上記したように、横軸が周波数ν(GHz)を示していると共に、縦軸が誘電率虚部を示している。
さらに、図14に示したように、電解液の計算DRS信号S2が得られた。図14では、上記したように、横軸が周波数ν(GHz)を示していると共に、縦軸が誘電率実部および誘電率虚部を示している。
なお、図12および図13のそれぞれでは、上記したように、個別計算DRS信号S1だけでなく計算DRS信号S2も併せて示している。また、図14では、誘電率実部と誘電率虚部との位置関係を調整している。
図12において、12A~12Dと電解液中における電解質塩の含有量との関係は、12A~12D=1Mである。また、図12では、12A=中性分子m(DEC)の個別計算DRS信号S1(誘電率虚部)、12B=イオン対x(CIP)の個別計算DRS信号S1(誘電率虚部)、12C=イオン対x(イオン会合体)の個別計算DRS信号S1(誘電率虚部)、12D=電解液の計算DRS信号S2(誘電率虚部)を示している。
図13において、13A~13Cと電解液中における電解質塩の含有量との関係は、13A~13C=1Mである。また、図13では、13A=中性分子m(DEC)の個別計算DRS信号S1(誘電率虚部)、13B=イオン対x(CIP)の個別計算DRS信号S1(誘電率虚部)、13C=電解液の計算DRS信号S2(誘電率虚部)を示している。
図14において、14A~14Dと電解液中における電解質塩の含有量との関係は、14A,14C=0M、14B,14D=1Mである。また、図14では、14A,14B=計算DRS信号S2(誘電率実部)、14C,14D=計算DRS信号S2(誘電率虚部)を示している。
(物性値Pの計算)
次に、計算部10において、個別計算DRS信号S1および計算DRS信号S2に基づいて、各構成成分Cに固有の物性値Pを計算した。
次に、計算部10において、個別計算DRS信号S1および計算DRS信号S2に基づいて、各構成成分Cに固有の物性値Pを計算した。
ここでは、中性分子m(DEC)の物性値Pとして、緩和強度Δεm 、特徴時間τm 、濃度nm および静的誘電率εm
staのそれぞれを計算した。また、イオン対x(CIPおよびイオン会合体)の物性値Pとして、緩和強度Δεx 、特徴時間τx 、濃度nx および静的誘電率εx
staのそれぞれを計算した。この他、電解液の塩解離度αを計算した。
この結果、電解液中における電解質塩の含有量が1Mである場合の物性値Pは、以下の通りであった。中性分子m(DEC)に関して、緩和強度Δεm =0.9、特徴時間τm =9.3ps、濃度nm =7.8M、静的誘電率εm
sta=0.9であった。イオン対x(CIP)に関して、緩和強度Δεx =6.5、特徴時間τx =453.0ps、濃度nx =0.5M、静的誘電率εx
sta=6.5であった。イオン対x(イオン会合体)に関して、緩和強度Δεx =2.7、特徴時間τx =76.0ps、濃度nx =0.1M、静的誘電率εx
sta=2.7であった。電解液の塩解離度α=0.28であった。
(実測DRS信号S3の測定)
次に、以下で説明するように、実測部20において実測DRS信号S3を測定した。
次に、以下で説明するように、実測部20において実測DRS信号S3を測定した。
具体的には、最初に、電解液を準備した。この場合には、上記したように、溶媒(DEC)に電解質塩(LiPF6 )を添加したのち、その溶媒を撹拌することにより、電解液を調製した。
電解液中における電解質塩の含有量(M)は、2種類(0Mおよび1M)となるように設定した。ここで説明した電解質塩の含有量は、溶媒に対する電解質塩の含有量である。
続いて、誘電緩和スペクトロスコピー法を用いて電解液を分析することにより、その電解液の実測DRS信号S3を測定した。実測DRS信号S3の測定手順は、実施例1と同様にした。
これにより、図15に示した実測DRS信号S3(誘電率実部および誘電率虚部)が得られた。図15では、上記したように、横軸が周波数ν(GHz)を表していると共に、縦軸が誘電率実部および誘電率虚部を表している。なお、図15では、誘電率実部と誘電率虚部とまとめて示している。上記したように、電解液中における電解質塩の含有量を2種類となるように設定したため、図15では、2種類の誘電率実部および2種類の誘電率虚部が示されている。
図15において、15A~15Dと電解液中における電解質塩の含有量との関係は、15A,15C=0M、15B,15D=1Mである。また、図15では、15A,15B=実測DRS信号S3(誘電率実部)、15C,15D=実測DRS信号S3(誘電率虚部)を示している。
(計算DRS信号S2と実測DRS信号S3との比較および個別計算DRS信号S1を用いた実測DRS信号S3の帰属)
最後に、以下で説明するように、比較部30において計算DRS信号S2と実測DRS信号S3とを互いに比較した。
最後に、以下で説明するように、比較部30において計算DRS信号S2と実測DRS信号S3とを互いに比較した。
具体的には、図14に示した計算DRS信号S2と、図15に示した実測DRS信号S3との間において、両者のスペクトル形状が互いに定性的に一致しているかどうかを確認した。この結果、以下で説明する傾向が見出された。
具体的には、実測DRS信号S3では、電解液中における電解質塩の含有量が増加すると、誘電率虚部の強度が最大となる時の周波数νが減少し、より具体的には周波数νが約20GHzから約0.5GHzに減少した。
また、実測DRS信号S3では、電解液中における電解質塩の含有量が増加すると、誘電率虚部の強度の最大値が増加し、より具体的には誘電率虚部の最大値が約0.5から約3に増加した。
さらに、実測DRS信号S3では、電解液中における電解質塩の含有量が増加すると、周波数νが最小(=約0.2GHz)になる時における誘電率実部の強度が増加し、より具体的には誘電率実部の強度が約3から約10に増加した。
これに対して、計算DRS信号S2では、電解液中における電解質塩の含有量が増加すると、誘電率虚部の強度が最大となる時の周波数νが減少し、より具体的には周波数νが約30GHzから約0.5GHzに減少した。
また、計算DRS信号S2では、電解液中における電解質塩の含有量が増加すると、誘電率虚部の強度の最大値が増加し、より具体的には誘電率虚部の強度の最大値が約0.5から約4に増加した。
さらに、計算DRS信号S2では、電解液中における電解質塩の含有量が増加すると、周波数νが最小(=約0.2GHz)になる時における誘電率実部の強度が増加し、より具体的には誘電率実部の強度が約1から約10に増加した。
これらの傾向から、計算DRS信号S2と実測DRS信号S3とが互いに定性的に一致した。これにより、実測DRS信号S3に対する計算DRS信号S2の信頼性が担保されたため、その計算DRS信号S2の構成要素である個別計算DRS信号S1の信頼性も担保された。よって、個別計算DRS信号S1を用いて実測DRS信号S3を帰属することができた。
[考察]
電解液に関する計算DRS信号S2の信頼性が担保されたため、各構成成分C(中性分子m(DEC)およびイオン対x(CIPおよびイオン会合体))に関する個別計算DRS信号S1の信頼性も担保された。これにより、図12~図15に示した結果から、実測DRS信号S3のスペクトル形状、中性分子mの運動性、イオン対xがスペクトル形状に及ぼす影響、イオン対x(CIP)の形成容易性などに関して、実施例1において導き出された傾向と同様の傾向が得られた。
電解液に関する計算DRS信号S2の信頼性が担保されたため、各構成成分C(中性分子m(DEC)およびイオン対x(CIPおよびイオン会合体))に関する個別計算DRS信号S1の信頼性も担保された。これにより、図12~図15に示した結果から、実測DRS信号S3のスペクトル形状、中性分子mの運動性、イオン対xがスペクトル形状に及ぼす影響、イオン対x(CIP)の形成容易性などに関して、実施例1において導き出された傾向と同様の傾向が得られた。
特に、図12に示した三成分系(構成成分Cは中性分子m(DEC)およびイオン対x(CIPおよびイオン会合体))に関する個別計算DRS信号S1と、図13に示した二成分系(構成成分Cは中性分子m(DEC)およびイオン対x(CIP))に関する個別計算DRS信号S1とを互いに比較した結果、以下で説明する傾向も得られた。
図13から明らかなように、イオン対xとしてイオン会合体まで考慮しなかった二成分系の計算DRS信号S2では、周波数νが約5GHzである帯域において誘電率虚部の強度が局所的に減少したため、いわゆる窪みが発生した。
これに対して、図12から明らかなように、イオン対xとしてイオン会合体まで考慮した三成分系の計算DRS信号S2では、上記した窪みが発生しなかった。これにより、図12に示した周波数νが約1GHz~10GHzである帯域における誘電率虚部の挙動は、図15に示した実測DRS信号S3のうちの同帯域における誘電率虚部の挙動と同様の傾向を示し、より具体的には、誘電率虚部がほぼ直線的に変化した。
これにより、溶媒(DEC)および電解質塩(LiPF6 )を含んでいる電解液(電解液中における電解質塩の含有量=1M)の内部では、1種類のカチオン(Li+ )と1種類のアニオン(PF6ー)とが互いに接近することに応じてCIP(LiPF6 )が形成されているわけではない。この電解液の内部では、2種類のカチオン(Li+ )と2種類のアニオン(PF6ー)とが互いに会合することに応じて特殊なイオン会合体(Li2 (PF6 )2 )が形成されていると考えられる。
これらのことから、溶媒(DEC)および電解質塩(LiPF6 )を含んでいるため、構成成分Cとして中性分子m(DEC)およびイオン対x(CIPおよびイオン会合体)を含んでいる電解液の物性に関して、新規かつ有用な情報が得られた。この場合には、特に、電解液の物性にCIPが影響を及ぼしていることに限らず、その電解液の物性にイオン会合体が影響を及ぼしていることも確認されたため、そのイオン会合体の影響も把握することができた。
詳細には、実施例1と同様の利点を得ることができた。この場合には、特に、イオン対xとしてCIPだけでなくイオン会合体に着目した場合においても同様の利点を得ることができた。
[まとめ]
図3~図15に示した結果から、解析装置100(解析方法)を用いて電解液を解析することにより、実測DRS信号S3に対する計算DRS信号S2の信頼性が担保されたと共に、その計算DRS信号S2の構成要素である個別計算DRS信号S1の信頼性も担保されたため、その個別計算DRS信号S1を用いて実測DRS信号S3を帰属することができた。これにより、各構成成分Cに固有の物性値Pを取得することができたと共に、中性分子mの物性だけでなくイオン対x(CIPおよびイオン会合体)の物性も把握することができた。よって、電解液の物性を容易かつ高精度に解析することができる。
図3~図15に示した結果から、解析装置100(解析方法)を用いて電解液を解析することにより、実測DRS信号S3に対する計算DRS信号S2の信頼性が担保されたと共に、その計算DRS信号S2の構成要素である個別計算DRS信号S1の信頼性も担保されたため、その個別計算DRS信号S1を用いて実測DRS信号S3を帰属することができた。これにより、各構成成分Cに固有の物性値Pを取得することができたと共に、中性分子mの物性だけでなくイオン対x(CIPおよびイオン会合体)の物性も把握することができた。よって、電解液の物性を容易かつ高精度に解析することができる。
以上、いくつかの実施形態および実施例を挙げながら本技術に関して説明したが、その本技術の構成は、各実施形態および実施例において説明された構成に限定されないため、種々に変形可能である。
本明細書中に記載された効果は、あくまで例示であるため、本技術の効果は、本明細書中に記載された効果に限定されない。よって、本技術に関して、他の効果が得られてもよい。
なお、本技術は、以下のような構成を取ることもできる。
<1>
電解液に関する分子動力学計算を行うことにより、前記電解液の構成成分を構成する一連の原子の経時的な挙動を計算し、
前記一連の原子の経時的な挙動に基づいて、前記構成成分の第1誘電緩和スペクトル信号を計算し、
前記第1誘電緩和スペクトル信号に基づいて、前記電解液の第2誘電緩和スペクトル信号を計算し、
前記第1誘電緩和スペクトル信号および前記第2誘電緩和スペクトル信号に基づいて、前記構成成分に固有の物性値を計算する、
解析方法。
<2>
前記電解液は、溶媒および電解質塩を含み、
前記構成成分は、中性分子およびイオン対のうちの少なくとも1種類を含む、
<1>に記載の解析方法。
<3>
前記物性値は、特徴時間、緩和強度、静的誘電率、濃度および塩解離度のうちの少なくとも1種類を含む、
<1>または<2>に記載の解析方法。
<4>
前記第1誘電緩和スペクトル信号を計算するために、
前記一連の原子の経時的な挙動に基づいて、前記構成成分のトータル電気双極子モーメントを計算し、
前記トータル電気双極子モーメントに基づいて、前記構成成分の時間相関関数を計算し、
前記時間相関関数を指数関数に近似し、
前記時間相関関数の近似結果をフーリエ変換することにより、前記構成成分の前記第1誘電緩和スペクトル信号を計算する、
<1>ないし<3>のいずれか1つに記載の解析方法。
<5>
前記第1誘電緩和スペクトル信号を計算するために、
前記一連の原子の経時的な挙動に基づいて、前記構成成分の個別電気双極子モーメントを計算し、
前記個別電気双極子モーメントに基づいて、前記構成成分の回転相関関数を計算し、
前記回転相関関数を指数関数に近似することにより、前記構成成分の回転相関時間を計算し、
前記回転相関時間に基づいて、前記構成成分の前記第1誘電緩和スペクトル信号を計算する、
<1>ないし<3>のいずれか1つに記載の解析方法。
<6>
前記構成成分は、中性分子およびイオン対のうちの2種類以上を含み、
2種類以上の前記構成成分のそれぞれの前記第1誘電緩和スペクトル信号を計算し、
2種類以上の前記構成成分に関する前記第1誘電緩和スペクトル信号を加算することにより、前記第2誘電緩和スペクトル信号を計算する、
<1>ないし<5>のいずれか1つに記載の解析方法。
<7>
さらに、
誘電緩和スペクトロスコピー法を用いて前記電解液を分析することにより、前記電解液の第3誘電緩和スペクトル信号を測定し、
前記第2誘電緩和スペクトル信号と前記第3誘電緩和スペクトル信号とを互いに比較することにより、前記第1誘電緩和スペクトル信号を用いて前記第3誘電緩和スペクトル信号を帰属する、
<1>ないし<6>のいずれか1つに記載の解析方法。
<8>
前記第3誘電緩和スペクトル信号を測定したのち、前記電解液のイオン伝導性に起因する信号成分を前記第3誘電緩和スペクトル信号から除去することにより、前記第3誘電緩和スペクトル信号を補正し、
前記第2誘電緩和スペクトル信号と前記第3誘電緩和スペクトル信号の補正結果とを互いに比較する、
<7>に記載の解析方法。
<9>
電解液に関する物性値を計算する計算部を備え、
前記計算部は、
前記電解液に関する分子動力学計算を行うことにより、前記電解液の構成成分を構成する一連の原子の経時的な挙動を計算し、
前記一連の原子の経時的な挙動に基づいて、前記構成成分の第1誘電緩和スペクトル信号を計算し、
前記第1誘電緩和スペクトル信号に基づいて、前記電解液の第2誘電緩和スペクトル信号を計算し、
前記第1誘電緩和スペクトル信号および前記第2誘電緩和スペクトル信号に基づいて、前記構成成分に固有の前記物性値を計算する、
解析装置。
<10>
前記電解液は、溶媒および電解質塩を含み、
前記構成成分は、中性分子およびイオン対のうちの少なくとも1種類を含む、
<9>に記載の解析装置。
<11>
前記物性値は、特徴時間、緩和強度、静的誘電率、濃度および塩解離度のうちの少なくとも1種類を含む、
<9>または<10>に記載の解析装置。
<12>
前記計算部は、前記第1誘電緩和スペクトル信号を計算するために、
前記一連の原子の経時的な挙動に基づいて、前記構成成分のトータル電気双極子モーメントを計算し、
前記トータル電気双極子モーメントに基づいて、前記構成成分の時間相関関数を計算し、
前記時間相関関数を指数関数に近似し、
前記時間相関関数の近似結果をフーリエ変換することにより、前記構成成分の前記第1誘電緩和スペクトル信号を計算する、
<9>ないし<11>のいずれか1つに記載の解析装置。
<13>
前記計算部は、前記第1誘電緩和スペクトル信号を計算するために、
前記一連の原子の経時的な挙動に基づいて、前記構成成分の個別電気双極子モーメントを計算し、
前記個別電気双極子モーメントに基づいて、前記構成成分の回転相関関数を計算し、
前記回転相関関数を指数関数に近似することにより、前記構成成分の回転相関時間を計算し、
前記回転相関時間に基づいて、前記構成成分の前記第1誘電緩和スペクトル信号を計算する、
<9>ないし<11>のいずれか1つに記載の解析装置。
<14>
前記構成成分は、中性分子およびイオン対のうちの2種類以上を含み、
前記計算部は、
2種類以上の前記構成成分のそれぞれの前記第1誘電緩和スペクトル信号を計算し、
2種類以上の前記構成成分に関する前記第1誘電緩和スペクトル信号を加算することにより、前記第2誘電緩和スペクトル信号を計算する、
<9>ないし<13>のいずれか1つに記載の解析装置。
<15>
さらに、
誘電緩和スペクトロスコピー法を用いて前記電解液を分析することにより、前記電解液の第3誘電緩和スペクトル信号を測定する実測部と、
前記第2誘電緩和スペクトル信号と前記第3誘電緩和スペクトル信号とを互いに比較することにより、前記第1誘電緩和スペクトル信号を用いて前記第3誘電緩和スペクトル信号を帰属する比較部と
を備えた、<9>ないし<14>のいずれか1つに記載の解析装置。
<16>
前記実測部は、前記第3誘電緩和スペクトル信号を測定したのち、前記電解液のイオン伝導性に起因する信号成分を前記第3誘電緩和スペクトル信号から除去することにより、前記第3誘電緩和スペクトル信号を補正し、
前記比較部は、前記第2誘電緩和スペクトル信号と前記第3誘電緩和スペクトル信号の補正結果とを互いに比較する、
<15>に記載の解析装置。
<1>
電解液に関する分子動力学計算を行うことにより、前記電解液の構成成分を構成する一連の原子の経時的な挙動を計算し、
前記一連の原子の経時的な挙動に基づいて、前記構成成分の第1誘電緩和スペクトル信号を計算し、
前記第1誘電緩和スペクトル信号に基づいて、前記電解液の第2誘電緩和スペクトル信号を計算し、
前記第1誘電緩和スペクトル信号および前記第2誘電緩和スペクトル信号に基づいて、前記構成成分に固有の物性値を計算する、
解析方法。
<2>
前記電解液は、溶媒および電解質塩を含み、
前記構成成分は、中性分子およびイオン対のうちの少なくとも1種類を含む、
<1>に記載の解析方法。
<3>
前記物性値は、特徴時間、緩和強度、静的誘電率、濃度および塩解離度のうちの少なくとも1種類を含む、
<1>または<2>に記載の解析方法。
<4>
前記第1誘電緩和スペクトル信号を計算するために、
前記一連の原子の経時的な挙動に基づいて、前記構成成分のトータル電気双極子モーメントを計算し、
前記トータル電気双極子モーメントに基づいて、前記構成成分の時間相関関数を計算し、
前記時間相関関数を指数関数に近似し、
前記時間相関関数の近似結果をフーリエ変換することにより、前記構成成分の前記第1誘電緩和スペクトル信号を計算する、
<1>ないし<3>のいずれか1つに記載の解析方法。
<5>
前記第1誘電緩和スペクトル信号を計算するために、
前記一連の原子の経時的な挙動に基づいて、前記構成成分の個別電気双極子モーメントを計算し、
前記個別電気双極子モーメントに基づいて、前記構成成分の回転相関関数を計算し、
前記回転相関関数を指数関数に近似することにより、前記構成成分の回転相関時間を計算し、
前記回転相関時間に基づいて、前記構成成分の前記第1誘電緩和スペクトル信号を計算する、
<1>ないし<3>のいずれか1つに記載の解析方法。
<6>
前記構成成分は、中性分子およびイオン対のうちの2種類以上を含み、
2種類以上の前記構成成分のそれぞれの前記第1誘電緩和スペクトル信号を計算し、
2種類以上の前記構成成分に関する前記第1誘電緩和スペクトル信号を加算することにより、前記第2誘電緩和スペクトル信号を計算する、
<1>ないし<5>のいずれか1つに記載の解析方法。
<7>
さらに、
誘電緩和スペクトロスコピー法を用いて前記電解液を分析することにより、前記電解液の第3誘電緩和スペクトル信号を測定し、
前記第2誘電緩和スペクトル信号と前記第3誘電緩和スペクトル信号とを互いに比較することにより、前記第1誘電緩和スペクトル信号を用いて前記第3誘電緩和スペクトル信号を帰属する、
<1>ないし<6>のいずれか1つに記載の解析方法。
<8>
前記第3誘電緩和スペクトル信号を測定したのち、前記電解液のイオン伝導性に起因する信号成分を前記第3誘電緩和スペクトル信号から除去することにより、前記第3誘電緩和スペクトル信号を補正し、
前記第2誘電緩和スペクトル信号と前記第3誘電緩和スペクトル信号の補正結果とを互いに比較する、
<7>に記載の解析方法。
<9>
電解液に関する物性値を計算する計算部を備え、
前記計算部は、
前記電解液に関する分子動力学計算を行うことにより、前記電解液の構成成分を構成する一連の原子の経時的な挙動を計算し、
前記一連の原子の経時的な挙動に基づいて、前記構成成分の第1誘電緩和スペクトル信号を計算し、
前記第1誘電緩和スペクトル信号に基づいて、前記電解液の第2誘電緩和スペクトル信号を計算し、
前記第1誘電緩和スペクトル信号および前記第2誘電緩和スペクトル信号に基づいて、前記構成成分に固有の前記物性値を計算する、
解析装置。
<10>
前記電解液は、溶媒および電解質塩を含み、
前記構成成分は、中性分子およびイオン対のうちの少なくとも1種類を含む、
<9>に記載の解析装置。
<11>
前記物性値は、特徴時間、緩和強度、静的誘電率、濃度および塩解離度のうちの少なくとも1種類を含む、
<9>または<10>に記載の解析装置。
<12>
前記計算部は、前記第1誘電緩和スペクトル信号を計算するために、
前記一連の原子の経時的な挙動に基づいて、前記構成成分のトータル電気双極子モーメントを計算し、
前記トータル電気双極子モーメントに基づいて、前記構成成分の時間相関関数を計算し、
前記時間相関関数を指数関数に近似し、
前記時間相関関数の近似結果をフーリエ変換することにより、前記構成成分の前記第1誘電緩和スペクトル信号を計算する、
<9>ないし<11>のいずれか1つに記載の解析装置。
<13>
前記計算部は、前記第1誘電緩和スペクトル信号を計算するために、
前記一連の原子の経時的な挙動に基づいて、前記構成成分の個別電気双極子モーメントを計算し、
前記個別電気双極子モーメントに基づいて、前記構成成分の回転相関関数を計算し、
前記回転相関関数を指数関数に近似することにより、前記構成成分の回転相関時間を計算し、
前記回転相関時間に基づいて、前記構成成分の前記第1誘電緩和スペクトル信号を計算する、
<9>ないし<11>のいずれか1つに記載の解析装置。
<14>
前記構成成分は、中性分子およびイオン対のうちの2種類以上を含み、
前記計算部は、
2種類以上の前記構成成分のそれぞれの前記第1誘電緩和スペクトル信号を計算し、
2種類以上の前記構成成分に関する前記第1誘電緩和スペクトル信号を加算することにより、前記第2誘電緩和スペクトル信号を計算する、
<9>ないし<13>のいずれか1つに記載の解析装置。
<15>
さらに、
誘電緩和スペクトロスコピー法を用いて前記電解液を分析することにより、前記電解液の第3誘電緩和スペクトル信号を測定する実測部と、
前記第2誘電緩和スペクトル信号と前記第3誘電緩和スペクトル信号とを互いに比較することにより、前記第1誘電緩和スペクトル信号を用いて前記第3誘電緩和スペクトル信号を帰属する比較部と
を備えた、<9>ないし<14>のいずれか1つに記載の解析装置。
<16>
前記実測部は、前記第3誘電緩和スペクトル信号を測定したのち、前記電解液のイオン伝導性に起因する信号成分を前記第3誘電緩和スペクトル信号から除去することにより、前記第3誘電緩和スペクトル信号を補正し、
前記比較部は、前記第2誘電緩和スペクトル信号と前記第3誘電緩和スペクトル信号の補正結果とを互いに比較する、
<15>に記載の解析装置。
Claims (16)
- 電解液に関する分子動力学計算を行うことにより、前記電解液の構成成分を構成する一連の原子の経時的な挙動を計算し、
前記一連の原子の経時的な挙動に基づいて、前記構成成分の第1誘電緩和スペクトル信号を計算し、
前記第1誘電緩和スペクトル信号に基づいて、前記電解液の第2誘電緩和スペクトル信号を計算し、
前記第1誘電緩和スペクトル信号および前記第2誘電緩和スペクトル信号に基づいて、前記構成成分に固有の物性値を計算する、
解析方法。 - 前記電解液は、溶媒および電解質塩を含み、
前記構成成分は、中性分子およびイオン対のうちの少なくとも1種類を含む、
請求項1に記載の解析方法。 - 前記物性値は、特徴時間、緩和強度、静的誘電率、濃度および塩解離度のうちの少なくとも1種類を含む、
請求項1または請求項2に記載の解析方法。 - 前記第1誘電緩和スペクトル信号を計算するために、
前記一連の原子の経時的な挙動に基づいて、前記構成成分のトータル電気双極子モーメントを計算し、
前記トータル電気双極子モーメントに基づいて、前記構成成分の時間相関関数を計算し、
前記時間相関関数を指数関数に近似し、
前記時間相関関数の近似結果をフーリエ変換することにより、前記構成成分の前記第1誘電緩和スペクトル信号を計算する、
請求項1ないし請求項3のいずれか1項に記載の解析方法。 - 前記第1誘電緩和スペクトル信号を計算するために、
前記一連の原子の経時的な挙動に基づいて、前記構成成分の個別電気双極子モーメントを計算し、
前記個別電気双極子モーメントに基づいて、前記構成成分の回転相関関数を計算し、
前記回転相関関数を指数関数に近似することにより、前記構成成分の回転相関時間を計算し、
前記回転相関時間に基づいて、前記構成成分の前記第1誘電緩和スペクトル信号を計算する、
請求項1ないし請求項3のいずれか1項に記載の解析方法。 - 前記構成成分は、中性分子およびイオン対のうちの2種類以上を含み、
2種類以上の前記構成成分のそれぞれの前記第1誘電緩和スペクトル信号を計算し、
2種類以上の前記構成成分に関する前記第1誘電緩和スペクトル信号を加算することにより、前記第2誘電緩和スペクトル信号を計算する、
請求項1ないし請求項5のいずれか1項に記載の解析方法。 - さらに、
誘電緩和スペクトロスコピー法を用いて前記電解液を分析することにより、前記電解液の第3誘電緩和スペクトル信号を測定し、
前記第2誘電緩和スペクトル信号と前記第3誘電緩和スペクトル信号とを互いに比較することにより、前記第1誘電緩和スペクトル信号を用いて前記第3誘電緩和スペクトル信号を帰属する、
請求項1ないし請求項6のいずれか1項に記載の解析方法。 - 前記第3誘電緩和スペクトル信号を測定したのち、前記電解液のイオン伝導性に起因する信号成分を前記第3誘電緩和スペクトル信号から除去することにより、前記第3誘電緩和スペクトル信号を補正し、
前記第2誘電緩和スペクトル信号と前記第3誘電緩和スペクトル信号の補正結果とを互いに比較する、
請求項7に記載の解析方法。 - 電解液に関する物性値を計算する計算部を備え、
前記計算部は、
前記電解液に関する分子動力学計算を行うことにより、前記電解液の構成成分を構成する一連の原子の経時的な挙動を計算し、
前記一連の原子の経時的な挙動に基づいて、前記構成成分の第1誘電緩和スペクトル信号を計算し、
前記第1誘電緩和スペクトル信号に基づいて、前記電解液の第2誘電緩和スペクトル信号を計算し、
前記第1誘電緩和スペクトル信号および前記第2誘電緩和スペクトル信号に基づいて、前記構成成分に固有の前記物性値を計算する、
解析装置。 - 前記電解液は、溶媒および電解質塩を含み、
前記構成成分は、中性分子およびイオン対のうちの少なくとも1種類を含む、
請求項9に記載の解析装置。 - 前記物性値は、特徴時間、緩和強度、静的誘電率、濃度および塩解離度のうちの少なくとも1種類を含む、
請求項9または請求項10に記載の解析装置。 - 前記計算部は、前記第1誘電緩和スペクトル信号を計算するために、
前記一連の原子の経時的な挙動に基づいて、前記構成成分のトータル電気双極子モーメントを計算し、
前記トータル電気双極子モーメントに基づいて、前記構成成分の時間相関関数を計算し、
前記時間相関関数を指数関数に近似し、
前記時間相関関数の近似結果をフーリエ変換することにより、前記構成成分の前記第1誘電緩和スペクトル信号を計算する、
請求項9ないし請求項11のいずれか1項に記載の解析装置。 - 前記計算部は、前記第1誘電緩和スペクトル信号を計算するために、
前記一連の原子の経時的な挙動に基づいて、前記構成成分の個別電気双極子モーメントを計算し、
前記個別電気双極子モーメントに基づいて、前記構成成分の回転相関関数を計算し、
前記回転相関関数を指数関数に近似することにより、前記構成成分の回転相関時間を計算し、
前記回転相関時間に基づいて、前記構成成分の前記第1誘電緩和スペクトル信号を計算する、
請求項9ないし請求項11のいずれか1項に記載の解析装置。 - 前記構成成分は、中性分子およびイオン対のうちの2種類以上を含み、
前記計算部は、
2種類以上の前記構成成分のそれぞれの前記第1誘電緩和スペクトル信号を計算し、
2種類以上の前記構成成分に関する前記第1誘電緩和スペクトル信号を加算することにより、前記第2誘電緩和スペクトル信号を計算する、
請求項9ないし請求項13のいずれか1項に記載の解析装置。 - さらに、
誘電緩和スペクトロスコピー法を用いて前記電解液を分析することにより、前記電解液の第3誘電緩和スペクトル信号を測定する実測部と、
前記第2誘電緩和スペクトル信号と前記第3誘電緩和スペクトル信号とを互いに比較することにより、前記第1誘電緩和スペクトル信号を用いて前記第3誘電緩和スペクトル信号を帰属する比較部と
を備えた、請求項9ないし請求項14のいずれか1項に記載の解析装置。 - 前記実測部は、前記第3誘電緩和スペクトル信号を測定したのち、前記電解液のイオン伝導性に起因する信号成分を前記第3誘電緩和スペクトル信号から除去することにより、前記第3誘電緩和スペクトル信号を補正し、
前記比較部は、前記第2誘電緩和スペクトル信号と前記第3誘電緩和スペクトル信号の補正結果とを互いに比較する、
請求項15に記載の解析装置。
Priority Applications (2)
| Application Number | Priority Date | Filing Date | Title |
|---|---|---|---|
| JP2024550043A JPWO2024070682A1 (ja) | 2022-09-30 | 2023-09-13 | |
| US18/975,376 US20250102454A1 (en) | 2022-09-30 | 2024-12-10 | Analysis method and analysis apparatus |
Applications Claiming Priority (2)
| Application Number | Priority Date | Filing Date | Title |
|---|---|---|---|
| JP2022-157924 | 2022-09-30 | ||
| JP2022157924 | 2022-09-30 |
Related Child Applications (1)
| Application Number | Title | Priority Date | Filing Date |
|---|---|---|---|
| US18/975,376 Continuation US20250102454A1 (en) | 2022-09-30 | 2024-12-10 | Analysis method and analysis apparatus |
Publications (1)
| Publication Number | Publication Date |
|---|---|
| WO2024070682A1 true WO2024070682A1 (ja) | 2024-04-04 |
Family
ID=90477601
Family Applications (1)
| Application Number | Title | Priority Date | Filing Date |
|---|---|---|---|
| PCT/JP2023/033319 Ceased WO2024070682A1 (ja) | 2022-09-30 | 2023-09-13 | 解析方法および解析装置 |
Country Status (3)
| Country | Link |
|---|---|
| US (1) | US20250102454A1 (ja) |
| JP (1) | JPWO2024070682A1 (ja) |
| WO (1) | WO2024070682A1 (ja) |
Citations (2)
| Publication number | Priority date | Publication date | Assignee | Title |
|---|---|---|---|---|
| JP2006317311A (ja) * | 2005-05-13 | 2006-11-24 | Hitachi Ltd | 緩和時間特定およびスペクトル帰属決定方法および計測結果表示方法 |
| JP2019190896A (ja) * | 2018-04-20 | 2019-10-31 | 日本電信電話株式会社 | 成分濃度測定装置および成分濃度測定方法 |
-
2023
- 2023-09-13 WO PCT/JP2023/033319 patent/WO2024070682A1/ja not_active Ceased
- 2023-09-13 JP JP2024550043A patent/JPWO2024070682A1/ja active Pending
-
2024
- 2024-12-10 US US18/975,376 patent/US20250102454A1/en active Pending
Patent Citations (2)
| Publication number | Priority date | Publication date | Assignee | Title |
|---|---|---|---|---|
| JP2006317311A (ja) * | 2005-05-13 | 2006-11-24 | Hitachi Ltd | 緩和時間特定およびスペクトル帰属決定方法および計測結果表示方法 |
| JP2019190896A (ja) * | 2018-04-20 | 2019-10-31 | 日本電信電話株式会社 | 成分濃度測定装置および成分濃度測定方法 |
Non-Patent Citations (1)
| Title |
|---|
| UMEBAYASHI, YASUHIRO ET AL. : "3J14 Research on ultra-concentrated electrolytic solutions using dielectric relaxation spectroscopy", PROCEEDINGS OF THE SPRING MEETING OF THE ELECTROCHEMICAL SOCIETY OF JAPAN ECSJ; OSAKA PREFECTURE UNIVERSITY, JAPAN; MARCH 15-17, 2022, vol. 89, 15 March 2022 (2022-03-15) - 17 March 2022 (2022-03-17), XP009554312 * |
Also Published As
| Publication number | Publication date |
|---|---|
| US20250102454A1 (en) | 2025-03-27 |
| JPWO2024070682A1 (ja) | 2024-04-04 |
Similar Documents
| Publication | Publication Date | Title |
|---|---|---|
| CN114355222B (zh) | 基于电压曲线的电池健康状态估计方法、装置及可读介质 | |
| Deng et al. | Consistent diffusivity measurement between galvanostatic intermittent titration technique and electrochemical impedance spectroscopy | |
| JP5923518B2 (ja) | 液体混合物の導電率を予測する方法 | |
| Valiskó et al. | Unraveling the behavior of the individual ionic activity coefficients on the basis of the balance of ion–ion and ion–water interactions | |
| Kowsari et al. | Tracing dynamics, self-diffusion, and nanoscale structural heterogeneity of pure and binary mixtures of ionic liquid 1-hexyl-2, 3-dimethylimidazolium bis (fluorosulfonyl) imide with acetonitrile: insights from molecular dynamics simulations | |
| Dai et al. | The dependence of lithium transference numbers on temperature, salt concentration and anion type in poly (vinylidene fluoride)–hexafluoropropylene copolymer-based gel electrolytes | |
| Levi et al. | Two parallel diffusion paths model for interpretation of PITT and EIS responses from non-uniform intercalation electrodes | |
| Cai et al. | Investigation of an M-Sequence based impedance spectrum acquisition method for lithium-ion batteries from the engineering application perspective | |
| CN109406444A (zh) | 变压器油含水率-吸收系数标准曲线拟合方法、含水率检测方法、装置及存储介质 | |
| Balabajew et al. | Minimizing artifacts in three-electrode double layer capacitance measurements caused by stray capacitances | |
| Fan et al. | Polarization loss analysis and ageing characterisation of transformer oil‐immersed insulation by using decoupled frequency domain spectroscopy | |
| Sawayama et al. | Fluorinated alkyl-phosphate-based electrolytes with controlled lithium-ion coordination structure | |
| CN119785917A (zh) | 电解液性能预测方法、装置、设备及可读存储介质 | |
| Krachkovskiy et al. | Determination of binary diffusivities in concentrated lithium battery electrolytes via NMR and conductivity measurements | |
| Binninger et al. | AMOEBA polarizable force field for molecular dynamics simulations of glyme solvents | |
| Olbrich et al. | Operando raman gradient analysis for temperature-dependent electrolyte characterization | |
| Kerisit et al. | Solvation structure and transport properties of alkali cations in dimethyl sulfoxide under exogenous static electric fields | |
| CN116013421B (zh) | 一种电解液性能评估方法、装置、存储介质及电子设备 | |
| Figiel et al. | Predicting Thermodynamic Properties of Ions in Single Solvents and in Mixed Solvents Using a Modified Born Term within the ePC-SAFT Framework | |
| US20250102454A1 (en) | Analysis method and analysis apparatus | |
| Skiba et al. | Experimental Pathways for Unlocking Thermodynamics of Ion Coordination in Battery Electrolytes | |
| Bai et al. | A Refinement and High-Degree Stable Marching-on-in-Degree Method for Wideband Scattering From Perfect Conductors | |
| Chinen et al. | Two-port Equivalent Circuits Deduced from S-parameter Measurements of NaCl Solutions | |
| CN119644172A (zh) | 一种电池健康状态评估方法、装置、电子设备及存储介质 | |
| Hockicko et al. | Investigation of relaxation and transport processes in LiPO (N) glasses |
Legal Events
| Date | Code | Title | Description |
|---|---|---|---|
| 121 | Ep: the epo has been informed by wipo that ep was designated in this application |
Ref document number: 23871915 Country of ref document: EP Kind code of ref document: A1 |
|
| WWE | Wipo information: entry into national phase |
Ref document number: 2024550043 Country of ref document: JP |
|
| NENP | Non-entry into the national phase |
Ref country code: DE |
|
| 122 | Ep: pct application non-entry in european phase |
Ref document number: 23871915 Country of ref document: EP Kind code of ref document: A1 |