WO2024062511A1 - 電動機の状態診断装置、状態診断方法および異常予兆推論装置 - Google Patents
電動機の状態診断装置、状態診断方法および異常予兆推論装置 Download PDFInfo
- Publication number
- WO2024062511A1 WO2024062511A1 PCT/JP2022/034868 JP2022034868W WO2024062511A1 WO 2024062511 A1 WO2024062511 A1 WO 2024062511A1 JP 2022034868 W JP2022034868 W JP 2022034868W WO 2024062511 A1 WO2024062511 A1 WO 2024062511A1
- Authority
- WO
- WIPO (PCT)
- Prior art keywords
- electric motor
- unit
- frequency
- analysis
- section
- Prior art date
- Legal status (The legal status is an assumption and is not a legal conclusion. Google has not performed a legal analysis and makes no representation as to the accuracy of the status listed.)
- Ceased
Links
Images


Classifications
-
- G—PHYSICS
- G01—MEASURING; TESTING
- G01R—MEASURING ELECTRIC VARIABLES; MEASURING MAGNETIC VARIABLES
- G01R31/00—Arrangements for testing electric properties; Arrangements for locating electric faults; Arrangements for electrical testing characterised by what is being tested not provided for elsewhere
- G01R31/34—Testing dynamo-electric machines
- G01R31/343—Testing dynamo-electric machines in operation
-
- G—PHYSICS
- G01—MEASURING; TESTING
- G01R—MEASURING ELECTRIC VARIABLES; MEASURING MAGNETIC VARIABLES
- G01R19/00—Arrangements for measuring currents or voltages or for indicating presence or sign thereof
- G01R19/165—Indicating that current or voltage is either above or below a predetermined value or within or outside a predetermined range of values
- G01R19/16528—Indicating that current or voltage is either above or below a predetermined value or within or outside a predetermined range of values using digital techniques or performing arithmetic operations
-
- G—PHYSICS
- G01—MEASURING; TESTING
- G01R—MEASURING ELECTRIC VARIABLES; MEASURING MAGNETIC VARIABLES
- G01R19/00—Arrangements for measuring currents or voltages or for indicating presence or sign thereof
- G01R19/165—Indicating that current or voltage is either above or below a predetermined value or within or outside a predetermined range of values
- G01R19/16566—Circuits and arrangements for comparing voltage or current with one or several thresholds and for indicating the result not covered by subgroups G01R19/16504, G01R19/16528, G01R19/16533
- G01R19/16571—Circuits and arrangements for comparing voltage or current with one or several thresholds and for indicating the result not covered by subgroups G01R19/16504, G01R19/16528, G01R19/16533 comparing AC or DC current with one threshold, e.g. load current, over-current, surge current or fault current
-
- G—PHYSICS
- G01—MEASURING; TESTING
- G01R—MEASURING ELECTRIC VARIABLES; MEASURING MAGNETIC VARIABLES
- G01R23/00—Arrangements for measuring frequencies; Arrangements for analysing frequency spectra
- G01R23/005—Circuits for comparing several input signals and for indicating the result of this comparison, e.g. equal, different, greater, smaller (comparing phase or frequency of 2 mutually independent oscillations in demodulators)
-
- G—PHYSICS
- G01—MEASURING; TESTING
- G01R—MEASURING ELECTRIC VARIABLES; MEASURING MAGNETIC VARIABLES
- G01R23/00—Arrangements for measuring frequencies; Arrangements for analysing frequency spectra
- G01R23/16—Spectrum analysis; Fourier analysis
-
- G—PHYSICS
- G01—MEASURING; TESTING
- G01R—MEASURING ELECTRIC VARIABLES; MEASURING MAGNETIC VARIABLES
- G01R29/00—Arrangements for measuring or indicating electric quantities not covered by groups G01R19/00 - G01R27/00
- G01R29/02—Measuring characteristics of individual pulses, e.g. deviation from pulse flatness, rise time or duration
- G01R29/023—Measuring pulse width
-
- G—PHYSICS
- G06—COMPUTING OR CALCULATING; COUNTING
- G06N—COMPUTING ARRANGEMENTS BASED ON SPECIFIC COMPUTATIONAL MODELS
- G06N20/00—Machine learning
-
- H—ELECTRICITY
- H02—GENERATION; CONVERSION OR DISTRIBUTION OF ELECTRIC POWER
- H02H—EMERGENCY PROTECTIVE CIRCUIT ARRANGEMENTS
- H02H7/00—Emergency protective circuit arrangements specially adapted for specific types of electric machines or apparatus or for sectionalised protection of cable or line systems, and effecting automatic switching in the event of an undesired change from normal working conditions
- H02H7/08—Emergency protective circuit arrangements specially adapted for specific types of electric machines or apparatus or for sectionalised protection of cable or line systems, and effecting automatic switching in the event of an undesired change from normal working conditions for dynamo-electric motors
-
- H—ELECTRICITY
- H02—GENERATION; CONVERSION OR DISTRIBUTION OF ELECTRIC POWER
- H02P—CONTROL OR REGULATION OF ELECTRIC MOTORS, ELECTRIC GENERATORS OR DYNAMO-ELECTRIC CONVERTERS; CONTROLLING TRANSFORMERS, REACTORS OR CHOKE COILS
- H02P29/00—Arrangements for regulating or controlling electric motors, appropriate for both AC and DC motors
- H02P29/02—Providing protection against overload without automatic interruption of supply
- H02P29/024—Detecting a fault condition, e.g. short circuit, locked rotor, open circuit or loss of load
-
- H—ELECTRICITY
- H02—GENERATION; CONVERSION OR DISTRIBUTION OF ELECTRIC POWER
- H02H—EMERGENCY PROTECTIVE CIRCUIT ARRANGEMENTS
- H02H3/00—Emergency protective circuit arrangements for automatic disconnection directly responsive to an undesired change from normal electric working condition with or without subsequent reconnection ; integrated protection
- H02H3/46—Emergency protective circuit arrangements for automatic disconnection directly responsive to an undesired change from normal electric working condition with or without subsequent reconnection ; integrated protection responsive to frequency deviations
-
- H—ELECTRICITY
- H02—GENERATION; CONVERSION OR DISTRIBUTION OF ELECTRIC POWER
- H02H—EMERGENCY PROTECTIVE CIRCUIT ARRANGEMENTS
- H02H3/00—Emergency protective circuit arrangements for automatic disconnection directly responsive to an undesired change from normal electric working condition with or without subsequent reconnection ; integrated protection
- H02H3/50—Emergency protective circuit arrangements for automatic disconnection directly responsive to an undesired change from normal electric working condition with or without subsequent reconnection ; integrated protection responsive to the appearance of abnormal wave forms, e.g. AC in DC installations
- H02H3/52—Emergency protective circuit arrangements for automatic disconnection directly responsive to an undesired change from normal electric working condition with or without subsequent reconnection ; integrated protection responsive to the appearance of abnormal wave forms, e.g. AC in DC installations responsive to the appearance of harmonics
Definitions
- the present disclosure relates to a motor condition diagnosis device, a condition diagnosis method, and an abnormality sign inference device.
- Electric motors are used as power for production line equipment and mechanical equipment in industrial plants, and are indispensable in industry. Therefore, normal and stable operation continuity is required at all times.
- a technique for constantly monitoring electric motors includes a method for diagnosing abnormalities by detecting the current added to the electric motor.
- Patent Document 1 discloses a method for detecting an abnormality in a rotating mechanical system, which detects an abnormality in the motor by measuring the current applied to the motor and performing frequency analysis.
- the above method for detecting abnormalities in rotating mechanical systems involves performing fast Fourier transform on the current information of the detected electric motor, extracting characteristic frequencies from the obtained analysis results, and determining the degree of deterioration of abnormalities in the rotating mechanical system from its peak value. Calculate the deterioration parameters of On the other hand, as deterioration parameters used for abnormality determination of a rotating mechanical system, it is necessary to calculate a plurality of parameters such as an effective current value, a three-phase current balance, and a current monotone wave ratio.
- the present disclosure has been made to solve the above-mentioned problems, and the state of the motor can be determined using the peak intensity of sideband waves caused by the natural frequency of the belt gear as a parameter, without the need to calculate multiple parameters.
- the object of the present invention is to obtain a state diagnosing device, a state diagnosing method, and an abnormality sign inference device for an electric motor that can perform diagnosis.
- the motor status diagnostic device includes a current input section into which current data detected by a current detector from the motor is input, and a frequency analysis of the current data input from the current input section to calculate an analysis result.
- An analysis section a calculation section that detects multiple peak intensities of sideband waves of the power supply frequency of the motor from the analysis results, and a calculation section that calculates the natural frequency of the belt gear section from the rating information of the motor, and calculates the natural frequency of the belt gear section from the multiple peak intensities detected by the calculation section.
- an eigenpeak extractor that extracts the peak intensity of sideband waves that occur at a position separated by the eigenfrequency from the power supply frequency of the motor, and a peak intensity threshold and eigenpeak extractor that are calculated from a normally operating motor. and a determination section that performs a comparison with the peak intensity extracted in the step 2 and diagnoses the electric motor.
- the method for diagnosing the condition of a motor includes a step of inputting current data detected by a current detector from the motor, a step of performing frequency analysis of the input current data and calculating an analysis result, and a step of performing frequency analysis of the input current data and calculating an analysis result. From the results, the step of detecting multiple peak intensities of sideband waves of the power supply frequency of the motor, calculating the natural frequency of the belt gear part from the rating information of the motor, and calculating the characteristic frequency of the belt gear part based on the power supply frequency of the motor from the detected multiple peak intensities.
- the method includes a step of extracting the peak intensity of sideband waves occurring at a position separated by the frequency, and a step of diagnosing the motor by comparing the peak intensity with a peak intensity threshold value calculated from a normally operating motor. .
- the motor abnormality sign inference device includes a data acquisition unit that acquires current data and a motor diagnosis result linked to the current data before frequency analysis from the motor state diagnosis device; A trained model generation unit that learns the current data acquired from the data acquisition unit based on the diagnostic results and generates a trained model, and a trained model that uses the current data newly acquired from the data acquisition unit to detect signs of motor abnormality. and a current data inference unit that performs inference and outputs an inference result.
- the characteristic peak extraction section extracts the peak intensity of the sideband wave caused by the belt gear frequency from the peak intensity of the sideband wave detected from the spectrum waveform by the calculation section,
- the determining unit diagnoses the state of the motor by comparing the extracted peak intensity with a peak intensity threshold. This has the effect of reducing the number of parameters required for diagnosis and shortening the time required for diagnosis.
- the motor abnormality sign inference inference device of the present disclosure before the motor status diagnosis device diagnoses that there is an abnormality in the motor, the abnormality sign is inferred from the current data, and the presence or absence of the abnormality sign is output to the monitoring device. This allows maintenance of the electric motor to be carried out in a planned manner.
- FIG. 1 is an overall system configuration diagram of a motor condition diagnostic device according to a first embodiment
- FIG. 1 is a hardware configuration diagram of a motor condition diagnostic device according to a first embodiment
- FIG. 3 is a configuration diagram of an arithmetic processing unit of the motor condition diagnosis device according to the first embodiment.
- FIG. 3 is a diagram showing a connection relationship between a motor, a belt gear section, and load equipment of the motor condition diagnosis device according to the first embodiment.
- 2 is a flowchart illustrating a processing procedure during learning of the electric motor condition diagnosis device according to the first embodiment.
- 3 is a flowchart illustrating a processing procedure during diagnosis by the electric motor condition diagnosis device according to the first embodiment.
- FIG. 3 is a flowchart illustrating a frequency analysis processing procedure of the electric motor condition diagnosis device according to the first embodiment.
- FIG. 3 is a diagram comparing analysis results when the electric motor is normal and when an abnormality occurs.
- FIG. 2 is a configuration diagram of an arithmetic processing unit of a motor condition diagnostic device according to a second embodiment.
- 7 is a flowchart illustrating a processing procedure during learning of the electric motor condition diagnosis device according to the second embodiment. 7 is a flowchart showing a processing procedure at the time of diagnosis by the electric motor condition diagnosis device according to the second embodiment.
- FIG. 7 is an overall system configuration diagram of a motor condition diagnostic device according to a third embodiment.
- FIG. 13 is a diagram illustrating an overall system configuration of an abnormality sign inference device for an electric motor according to a fourth embodiment.
- 12 is a flowchart illustrating the processing procedure during learning of the abnormality sign inference inference device for a motor according to the fourth embodiment.
- 12 is a flowchart illustrating a processing procedure when the abnormality sign inference inference device for a motor according to Embodiment 4 is used.
- FIG. 1 is an overall system configuration diagram of a motor condition diagnostic device according to a first embodiment.
- FIG. 2 is a hardware configuration diagram of the motor condition diagnostic device according to the first embodiment.
- FIG. 3 is a configuration diagram of the arithmetic processing section of the motor condition diagnostic device according to the first embodiment.
- FIG. 4 is a diagram showing the connection relationship between the motor, the belt gear section, and the load equipment of the motor condition diagnosis device according to the first embodiment.
- FIG. 5 is a flowchart showing the processing procedure during learning of the electric motor condition diagnosis device according to the first embodiment.
- FIG. 6 is a flowchart showing a processing procedure during diagnosis by the electric motor condition diagnosis device according to the first embodiment.
- FIG. 7 is a flowchart showing a frequency analysis processing procedure of the motor condition diagnosis device according to the first embodiment.
- FIG. 8 is a diagram comparing the analysis results when the motor is normal and when an abnormality occurs.
- a molded circuit breaker 2 As shown in FIG. 1, a molded circuit breaker 2, an electromagnetic contactor 3, a current detector 4, and a motor 5 are connected to the main circuit 1.
- the molded circuit breaker 2 prevents overcurrent from flowing to the motor 5 when an abnormality occurs in the system.
- the electromagnetic contactor 3 plays the role of a switch that turns the electric motor 5 ON/OFF.
- Current detector 4 detects the load current of main circuit 1 and outputs it to current input section 7 of condition diagnosis device 100 .
- the electric motor 5 is connected to mechanical equipment 6 constituting a production line or the like, and is driven by a power converter or the like (not shown).
- the electric motor 5 uses a three-phase induction motor, for example, it is not limited to this.
- the condition diagnostic device 100 includes a current input section 7, an arithmetic processing section 8, a rating information storage section 9, a rating information setting section 10, a display section 11, a contactor drive section 12, an output section 13, and a communication section 14.
- the current input section 7 inputs current data detected by the current detector 4 and outputs it to the arithmetic processing section 8 .
- the arithmetic processing unit 8 analyzes the current data input by the current input unit 7, calculates parameters used for diagnosing the electric motor 5, and performs an abnormality diagnosis of the electric motor 5. Details of the arithmetic processing unit 8 will be described later.
- FIG. 2 is a hardware configuration diagram of the state diagnosis device 100 according to the present disclosure.
- the state diagnosis device 100 includes a processor 20 such as a CPU (Central Processing Unit), a memory 30 such as a RAM (Random Access Memory), a display 40, and an input interface (I/F) 50.
- the arithmetic processing unit 8 is realized by the processor 20 executing a program stored in the memory 30. However, these may be realized by, for example, a plurality of processors 20 working together.
- Rating information such as the power supply frequency, rated output, rated current, number of poles, and rated rotation speed of the motor 5 is input in advance to the rated information setting section 10.
- the rating information is basic information written in the catalog, instruction manual, etc. of the manufacturer of the electric motor 5.
- the number of electric motors 5 to be diagnosed is one, but when diagnosing a plurality of electric motors 5, the rating information of each electric motor 5 is input in advance to the rating information setting section 10. I'll keep it.
- the rating information storage unit 9 stores the rating information input to the rating information setting unit 10, and outputs it to the arithmetic processing unit 8 as necessary.
- FIG. 1 shows an example in which the rating information storage section 9 and the rating information setting section 10 are provided separately, the present invention is not limited to this.
- the rating information storage section 9 and the rating information setting section 10 may be provided together to store the rating information of the motor 5 and output it to the arithmetic processing section 8 when analyzing the current data input from the current input section 7. .
- the rating information storage section 9 and the rating information setting section 10 are not limited to the configuration provided in the condition diagnosis device 100, and may be provided externally. In that case, it is preferable to store the rating information of the electric motor 5 in an external server, for example, and input it to the arithmetic processing unit 8 when diagnosing the electric motor 5.
- a display section 11 , a contactor drive section 12 , an output section 13 , and a communication section 14 are connected to the arithmetic processing section 8 .
- the display unit 11 displays the detected current data and displays the abnormal state, alarm, etc. when the arithmetic processing unit 8 detects an abnormality in the electric motor 5. Note that the warning may be provided not only by display but also by an alarm or the like.
- the contactor drive unit 12 outputs a control signal to open and close the electromagnetic contactor 3 when the arithmetic processing unit 8 detects an abnormality in the electric motor 5. Further, the output unit 13 outputs abnormal conditions, alarms, etc. to the production line management department.
- the communication unit 14 transmits information such as the abnormal state of the motor 5 to a monitoring device 200, such as a PC or a tablet terminal, which is provided outside and serves as a parent device for the entire condition diagnostic device 100, via the network. Note that the method of transmitting data from the communication unit 14 to the monitoring device 200 may be either wired or wireless.
- the calculation processing section 8 includes a current fluctuation calculation section 110, an analysis section determination section 111, a calculation section 112, a reference value storage section 113, a diagnosis result storage section 114, an analysis section 120, and a diagnosis section 130.
- the analysis section 120 includes a frequency analysis section 121 , a peak detection calculation section 122 , a rotational frequency band extraction section 123 , a frequency axis conversion section 124 , and an averaging processing section 125 .
- the diagnosis unit 130 also includes a unique peak extraction unit 131 and a determination unit 132.
- the current fluctuation calculation unit 110 calculates whether or not there is a fluctuation in the current data input from the current input unit 7, and judges whether or not the current data is in a stable state. Specifically, it performs a statistical analysis of the fluctuation in the current data. For example, it judges whether the electric motor 5 is in a stable state using an analysis method such as the Mahalanobis distance.
- the current fluctuation calculation unit 110 also acquires and stores in advance a section determination threshold value from a normally operating motor 5 as a threshold value for determining whether the current data is in a stable state.
- the section determination threshold value is selected in advance by acquiring current data from multiple motors 5 and setting a range that is smaller than the standard deviation of the acquired current data.
- current data from the motor 5 to be diagnosed may be collected for a certain period of time, and the section determination threshold value may be set based on the standard deviation of the collected current data or the like.
- the section determination threshold value may not be stored in the current fluctuation calculation unit 110, but may be stored in the rating information storage unit 9 together with the rating information of the motor 5.
- the analysis section determination section 111 compares the section determination threshold value calculated in advance from a normally operating electric motor with the calculation result by the current fluctuation calculation section 110, and determines the analysis section. That is, the analysis section determination section 111 extracts a section in a stable state from the current data input from the current input section 7, and determines the analysis section to be executed by the analysis section 120. Specifically, an interval in which the statistical fluctuation calculated by the current fluctuation calculation unit 110 is equal to or less than a preset threshold value is defined as a stable interval, that is, an analysis interval.
- the analysis section 120 includes a frequency analysis section 121, a peak detection calculation section 122, a rotational frequency band extraction section 123, a frequency axis conversion section 124, and an averaging processing section 125.
- the frequency analysis unit 121 performs frequency analysis of the current data input from the current input unit 7 in the analysis interval extracted by the analysis interval determination unit 111, and calculates a spectral waveform as the analysis result.
- the current data is analyzed by, for example, current FFT analysis (Fast Fourier Transform) analysis, discrete Fourier analysis, etc.
- the peak detection calculation unit 122 detects a plurality of sideband waves of the power supply frequency from the spectrum waveform obtained by frequency analysis by the frequency analysis unit 121, and calculates the peak intensity of the detected sideband waves. Specifically, the peak detection calculation unit 122 extracts a portion where the steep slope is reversed from the detected sideband wave of the power supply frequency by first-order, second-order, and third-order differential calculations, and calculates the peak intensity. When calculating the peak intensity in this way, even small peak intensities can be detected by performing differential calculation up to the third order.
- the rotational frequency band extraction unit 123 calculates the rotational frequency from the rating information of the electric motor 5, and calculates the peak intensity of the sideband wave of the power supply frequency that occurs at a position separated by the rotational frequency from the power supply frequency of the electric motor 5 using a peak detection calculation unit.
- the peak intensities of the plurality of sideband waves detected in step 122 are extracted. Specifically, the rotational frequency is calculated from the rated rotational speed of the rated information stored in the rated information storage section 9, and the calculated rotational frequency is used to calculate the rotational frequency separation from the power supply frequency on both sides of high frequency and low frequency. Then, sideband waves with peak intensities of the same degree are extracted.
- the rotational frequency band extracting unit 123 calculates the rotational frequency using the following equation (1) using the rating information stored in the rating information storage unit 9. Note that the rotational frequency is fn, the power supply frequency is f, the number of poles is P, and the slip of the motor 5 is s.
- the rotational frequency band extraction unit 123 calculates the rotational frequency using equation (1), and calculates the peak intensity of the sideband wave of the power supply frequency occurring in the rotational frequency band from the sideband wave calculated in the peak detection calculation unit 122. Extract from the peak intensity.
- the rotational frequency band refers to a frequency at a position separated by the rotational frequency from the power supply frequency of the electric motor 5, and a position away from the power supply frequency by the rotational frequency on the low frequency side and a position away from the power supply frequency on the high frequency side. It refers to two things: a position separated by the rotational frequency.
- the frequency axis conversion unit 124 calculates a correction value for aligning the frequency axes of the spectrum waveform obtained by frequency analysis, and corrects the spectrum waveform calculated in the frequency analysis unit 121.
- the spectrum waveform obtained by frequency analysis of the current data has a deviation in rotational frequency depending on the load torque of the electric motor 5. Therefore, the frequency axis conversion unit 124 calculates a correction value for the spectral waveform so that the averaging processing unit 125 (described later) can accurately overlap a plurality of spectral waveforms without any deviation and perform the averaging process. Each is corrected so that the frequency axes of the spectrum waveforms are aligned.
- the correction value calculated by the frequency axis conversion unit 124 will be explained.
- the slip of the electric motor 5 changes depending on the load torque condition of the electric motor 5, and the rotation frequency fn calculated by equation (1) in the rotation frequency band extracting section 123 also changes according to the slip of the electric motor 5.
- the frequency axis conversion unit 124 takes into account the deviation due to such slippage.
- the deviation from the standard is corrected based on the situation, that is, the no-load state. Specifically, according to equation (3), when the slip is 2%, there is a deviation of 0.06 Hz compared to the rotation frequency in the no-load state. In such a case, the frequency axis conversion unit 124 corrects the spectrum waveform by setting the correction value to 0.06 Hz.
- the frequency axis conversion unit 124 uses the rotation frequency in a state where the electric motor 5 is not slipping, that is, in a no-load state as a reference, and when the rotation frequency calculated in the rotation frequency band extraction unit 123 deviates from the reference, Each spectrum waveform is corrected using the difference from the reference as a correction value.
- the averaging processing unit 125 performs a process of averaging the plurality of spectral waveforms corrected by the frequency axis conversion unit 124.
- the frequency axis conversion unit 124 calculates and corrects a correction value for aligning the rotational frequencies for each spectrum waveform, and superimposes a plurality of spectrum waveforms whose frequency axes are aligned and performs averaging processing.
- the spectral waveforms of can be accurately superimposed and averaged.
- the calculation unit 112 detects a plurality of peak intensities of sideband waves of the power supply frequency from the analysis results of the analysis unit 120. Specifically, the calculation unit 112 detects a plurality of peak intensities of sideband waves of the power supply frequency from the spectrum waveform averaged by the averaging processing unit 125. The output result of the calculation unit 112 is output to the unique peak extraction unit 131 of the diagnosis unit 130.
- the diagnosis unit 130 includes a unique peak extraction unit 131 and a determination unit 132.
- FIG. 4 shows the transmission of vibration to the belt gear unit 60 when an abnormality occurs in the electric motor 5.
- the belt gear unit 60 refers to the belt and gears that connect the electric motor 5 and the load equipment 70.
- the inherent peak extraction unit 131 extracts the peak intensity of the sideband wave caused by the inherent frequency (hereinafter referred to as the belt gear frequency) that appears when an abnormality occurs in the belt gear unit 60 that connects the electric motor 5 and the load equipment 70. That is, the inherent peak extraction unit 131 extracts the peak intensity of the sideband wave caused by the belt gear frequency from the peak intensities of multiple sideband waves detected in the calculation unit 112.
- the belt gear frequency refers to the inherent frequency that appears when an abnormality occurs in the belt gear unit 60, but it may also be the inherent frequency that appears when an abnormality occurs in the belt, or the inherent frequency that appears when an abnormality occurs in the gear.
- the unique peak extraction unit 131 calculates the belt gear frequency based on the rating information stored in the rating information storage unit 9, and extracts peak intensities that occur at positions separated by the belt gear frequency on both sides of the high frequency and low frequency from the power supply frequency. Extract sideband waves of the same degree.
- the belt gear frequency is calculated from the following formula (4) using the rated information of the electric motor 5 stored in the rated information storage unit 9. Note that the belt gear frequency is F, the power supply frequency is f, and the number of poles is P.
- the eigenpeak extraction unit 131 extracts sideband waves whose peak intensities are comparable to each other, which occur at positions 10 Hz apart on both sides of the high frequency and low frequency from the power supply frequency. That is, sideband waves having similar peak intensities are extracted from both sides of the frequency side higher than the power supply frequency and the sideband waves lower than the power supply frequency.
- FIG. 4 is a diagram showing the connection relationship between the electric motor 5, the belt gear section 60, and the load equipment 70.
- FIG. 4 when an abnormality occurs in the electric motor 5, vibrations of the electric motor 5 are transmitted to a belt gear section 60 connected to the electric motor 5. Further, even when an abnormality occurs in the load equipment 70, vibrations of the load equipment 70 are transmitted to the belt gear section 60. Therefore, by extracting the sideband waves caused by the belt gear frequency of the belt gear section 60, the unique peak extraction section 131 detects not only abnormalities in the belt gear section 60 but also abnormalities in the electric motor 5 and the load equipment 70 connected to the belt gear section 60. can also be detected.
- the determination unit 132 uses the peak intensity of the sideband wave caused by the belt gear frequency extracted by the unique peak extraction unit 131 and the current data of the normally operating motor 5 stored in the reference value storage unit 113 in advance.
- the calculated peak intensity of the sideband wave is compared with a peak intensity threshold, and the presence or absence of an abnormality in the electric motor 5 is diagnosed. A specific processing procedure at the time of diagnosis will be described later using FIG. 7.
- the arithmetic processing unit 8 outputs information informing the display unit 11, the contactor drive unit 12, the output unit 13, and the communication unit 14 of the abnormality.
- the diagnosis result is stored in the diagnosis result storage section 114. Note that the diagnosis result of the electric motor 5 stored in the diagnosis result storage section 114 is preferably stored in association with the current data before frequency analysis is performed by the frequency analysis section 121.
- the reference value storage unit 113 stores the peak intensity of the sideband wave caused by the belt gear frequency, obtained in advance from the current data of the normally operating motor 5, as a reference value, that is, a peak intensity threshold value, used when diagnosing the motor 5.
- a peak intensity threshold value may be stored in the rating information storage section 9 together with the rating information. The specific processing procedure will be described later using FIG.
- FIG. 5 is a flowchart showing a procedure for calculating a peak intensity threshold value used for comparison with the peak intensity of sideband waves.
- step S101 the rating information of the normally operating electric motor 5 is input to the rating information setting unit 10 and stored in the rating information storage unit 9.
- the rating information of the electric motor 5 may be input and stored in the rating information storage section 9. Further, when there are a plurality of electric motors 5 to be diagnosed, the rating information for each is input and stored.
- step S102 the current input unit 7 receives the current of the electric motor 5 to be diagnosed, which is acquired by the current detector 4.
- step S103 the current fluctuation calculating section 110 calculates whether the fluctuation of the current data input to the current input section 7, that is, the current data is in a stable state, and the analysis section determining section 111 calculates whether or not the fluctuation of the current data input to the current input section 7 is in a stable state. is extracted and determined as the analysis interval for frequency analysis.
- the current fluctuation calculation unit 110 calculates the current data and compares it with the section determination threshold. If the section determination threshold is not satisfied, the current data is determined to be in an unstable state, and the process returns to step S102. If it is determined that the state is stable, the process advances to step S104.
- step S104 the frequency analysis unit 121 performs frequency analysis on the current data in the analysis section determined to be in a stable state, and calculates a spectrum waveform as the analysis result.
- a spectrum waveform which is the analysis result obtained by frequency analysis, is output to the calculation section 112. Note that details of the frequency analysis in step S104 will be described later using FIG. 7.
- step S105 the unique peak extraction unit 131 calculates the belt gear frequency caused by the belt gear unit 60 corresponding to the electric motor from the information on the electric motor 5 stored in the rating information storage unit 9.
- step S106 the characteristic peak extraction unit 131 extracts the peak intensity of the sideband wave caused by the belt gear frequency from the peak intensity of the sideband wave input from the calculation unit 112. That is, the unique peak extracting unit 131 uses the belt gear frequency calculated in step S105 to extract sideband waves having similar peak intensities that occur at positions separated by the belt gear frequency on both sides of the high frequency and low frequency from the power supply frequency.
- step S107 the reference value storage unit 113 stores the peak intensity threshold of the sideband wave extracted by the unique peak extraction unit 131 in step S106 as a threshold value used at the time of diagnosis.
- FIG. 6 is a flowchart showing the processing procedure during diagnosis.
- step S201 the current of the electric motor 5 to be diagnosed, which is acquired by the current detector 4, is input to the current input unit 7.
- step S202 the current fluctuation calculating section 110 calculates whether the fluctuation of the current data input to the current input section 7, that is, the current data is in a stable state, and the analysis section determining section 111 calculates whether the fluctuation of the current data input to the current input section 7 is in a stable state. is extracted and determined as the analysis interval for frequency analysis.
- the current fluctuation calculation unit 110 calculates the current data and compares it with the section determination threshold. If the section determination threshold is not satisfied, the current data is determined to be in an unstable state, and the process returns to step S201. If it is determined that the state is stable, the process advances to step S203.
- step S203 the frequency analysis unit 121 performs frequency analysis on the current data in the analysis section determined to be in a stable state in step S202, and calculates a spectrum waveform as the analysis result.
- a spectrum waveform which is an analysis result obtained by frequency analysis, is input to the calculation unit 112. Note that details of the frequency analysis will be described later using FIG. 7.
- step S204 the unique peak extraction unit 131 calculates the belt gear frequency caused by the belt gear unit 60 of the electric motor 5 to be diagnosed from the rating information of the electric motor 5 stored in the rating information storage unit 9.
- step S205 the unique peak extraction unit 131 extracts the peak intensity of the sideband wave caused by the belt gear frequency from the peak intensity of the sideband wave input from the calculation unit 112. That is, the unique peak extracting unit 131 uses the belt gear frequency calculated in step S105 to extract sideband waves having similar peak intensities that occur at positions separated by the belt gear frequency on both sides of the high frequency and low frequency from the power supply frequency.
- step S206 the determination unit 132 compares the peak intensity of the sideband wave caused by the belt gear frequency extracted in step S205 with the peak intensity threshold value stored in the reference value storage unit 113.
- step S207 the determining unit 132 compares the peak intensity of the sideband wave caused by the belt gear frequency with the peak intensity threshold value stored in the reference value storage unit 113, and determines that the peak intensity of the sideband wave is the peak intensity. If the threshold value is satisfied, it is determined that there is an abnormality in the electric motor 5, and the process proceeds to step S208. On the other hand, if the peak intensity threshold is not satisfied, it is determined that the electric motor 5 is normal, and the process returns to step S201.
- step S208 the determination unit 132 outputs the diagnosis result to the display unit 11, contactor drive unit 12, output unit 13, and communication unit 14. Further, the diagnosis result is stored in the diagnosis result storage unit 114.
- FIG. 7 is a diagram showing a frequency analysis flow.
- the steps S301 to S308 in FIG. 7 correspond to the steps S101 to S103 in FIG. 5 and S201 to S203 in FIG. 6.
- S301 shown in FIG. 7, S102, S201, and S302 are the same as S103 and S202, so the explanation will be omitted.
- step S303 the frequency analysis unit 121 performs frequency analysis on the current data in the analysis section determined to be in a stable state, and calculates a spectrum waveform as the analysis result.
- the frequency analysis section 121 inputs the calculated spectrum waveform to the peak detection calculation section 122.
- step S304 the peak detection calculation unit 122 detects multiple peak intensities of the sideband waves of the power supply frequency from the spectral waveform that is the result of the frequency analysis input from the frequency analysis unit 121.
- the rotational frequency band extraction unit 123 extracts the peak intensity of the sideband waves in the rotational frequency band from the peak intensities of the plurality of sideband waves detected by the peak detection calculation unit 122.
- the rotational frequency band extraction unit 123 extracts the peak intensities of sideband waves in the rotational frequency band on each of both sides of the high frequency and low frequency from the power supply frequency.
- the peak intensity is extracted by calculating the rotational frequency from the rated rotational speed of the rated information stored in the rated information storage section 9, and extracting sideband waves that occur at positions separated by the rotational frequency from the center of the power supply frequency. .
- step S306 the frequency axis conversion unit 124 calculates a correction value for the spectral waveform in order to reduce the influence of deviation in rotational frequency due to load torque, and uses the calculated correction value to align the frequency axis of the spectral waveform. Make corrections. This makes it possible to eliminate deviations in rotational frequency due to load torque conditions.
- step S307 the averaging processing unit 125 repeats steps S301 to S306 multiple times, and collects multiple spectral waveforms that have been through steps S301 to S306.
- the number of repetitions is not particularly limited, but it is advisable to set a number of repetitions in the rated information storage unit 9, for example, and repeat the process the set number of times. When the number of repetitions has been reached, the process proceeds to step S318.
- step S308 the multiple spectral waveforms with aligned frequency axes collected in step S307 are superimposed and averaged. This makes it possible to remove the effects of noise, etc.
- the method for diagnosing the condition of the electric motor 5 includes the steps of inputting the current data detected by the electric motor 5 by the current detector 4, performing frequency analysis of the input current data, and calculating the analysis result.
- Diagnosis of the motor 5 is performed by extracting the peak intensity of sideband waves occurring at a position separated by the natural frequency based on , and comparing the peak intensity with a peak intensity threshold value calculated from a normally operating motor 5. and a step of performing. Thereby, the state of the electric motor 5 can be diagnosed using one peak intensity of sideband waves caused by the belt gear frequency as a parameter, and calculation of a plurality of parameters can be made unnecessary.
- FIG. 8 is a diagram comparing the frequency analysis results when the motor 5 is normal and when an abnormality occurs.
- the solid line shows the analysis result when the electric motor 5 is normal
- the dotted line shows the analysis result when the electric motor 5 has abnormality.
- the state diagnosis device 100 of the electric motor 5 uses a peak intensity threshold value, which is a threshold value of the peak intensity of the sideband wave caused by the belt gear frequency, acquired in advance from the normally operating electric motor 5, to The abnormality of the electric motor 5 can be diagnosed by using it as a threshold value for determining whether the electric motor 5 is abnormal or not, and determining that the electric motor 5 is abnormal when the peak intensity threshold is satisfied.
- a peak intensity threshold value which is a threshold value of the peak intensity of the sideband wave caused by the belt gear frequency
- the condition diagnosis device 100 for the electric motor 5 analyzes the frequency of the current data acquired from the electric motor 5, and detects the frequency caused by the belt gear frequency extracted by the characteristic peak extraction unit 131 from the spectrum waveform that is the analysis result.
- the state of the electric motor 5 is diagnosed using the peak intensity of the sideband waves.
- the state of the electric motor 5 can be diagnosed using one peak intensity of the sideband wave caused by the belt gear frequency as a parameter used for diagnosis. Therefore, the number of parameters required for diagnosis can be reduced and the time required for diagnosis can be shortened.
- the analysis section 120 includes the peak detection calculation section 122, the rotational frequency band extraction section 123, the frequency axis conversion section 124, and the averaging processing section 125, but the present invention is not limited to this.
- the frequency analysis unit 121 may frequency-analyze the current data input from the current input unit 7 to calculate a spectrum waveform as an analysis result, and output the calculated spectrum waveform to the calculation unit 112.
- the analysis section 120 may include the frequency analysis section 121.
- condition diagnosis device 100 has been described as diagnosing an abnormality when the peak intensity of the sideband wave extracted by the unique peak extraction unit 131 satisfies the peak intensity threshold
- Any method may be used to determine whether the peak intensity threshold is satisfied. For example, it may be determined that there is an abnormality when the time for satisfying the peak intensity threshold is longer than a certain time. Alternatively, a number of times may be set, and an abnormality may be determined when the number of times the peak intensity threshold is satisfied exceeds the set number of times.
- FIG. 9 is a configuration diagram of the arithmetic processing section 80 of the motor condition diagnostic device according to this embodiment.
- FIG. 10 is a flowchart showing the processing procedure during learning of the motor condition diagnosis device according to the present embodiment.
- FIG. 11 is a flowchart showing the processing procedure during diagnosis by the motor condition diagnosis device according to the present embodiment.
- the characteristic peak extraction unit 131 extracts the peaks of sideband waves that occur at positions separated by belt gear frequencies on both sides of the power supply frequency at low frequencies and high frequencies.
- the condition diagnosis device 100 is shown in which the intensity is extracted, and the diagnosis unit 130 diagnoses the condition of the electric motor 5 by comparing the peak intensity of the extracted sideband wave with a peak intensity threshold.
- a state diagnosis device 101 for a motor 5 is provided, in which a calculation section 140 includes an OA value calculation section 141 that calculates an overall value (hereinafter referred to as "OA value”) used when diagnosing the state of the motor 5. shows.
- the other configurations are the same as those in Embodiment 1, and the same components as in Embodiment 1 are given the same numbers and their explanations will be omitted.
- the arithmetic processing unit 80 of the condition diagnosis device 101 includes a current fluctuation calculation unit 110, an analysis interval determination unit 111, a reference value storage unit 113, a diagnosis result storage unit 114, an analysis unit 120, a diagnosis unit 130, and a calculation unit 110. 140.
- the diagnosis section 130 can diagnose the condition of the motor 5 by comparing the peak intensity of the sideband wave with the peak intensity threshold, thereby reducing the number of parameters required for condition diagnosis and shortening the diagnosis time. .
- calculation unit 140 of the calculation processing unit 80 includes an OA value calculation unit 141.
- the OA value calculation unit 141 calculates an OA value, which is an average value of amplitude, from the spectrum waveform, which is the analysis result calculated by the analysis unit 120, as information for determining abnormality in the electric motor 5.
- the OA value calculated at the time of learning is stored in the reference value storage unit 113, and the OA value calculated at the time of diagnosis is output to the determination unit 133.
- the OA value refers to the average magnitude of the amplitude of the entire spectrum waveform, which is the analysis result obtained by frequency analysis of current data.
- the signal strength at the power supply frequency and its harmonic components accounts for a large proportion of the calculated OA value. Therefore, peaks of frequency components in the power supply frequency and high-order frequency components at integral multiples of the power supply frequency, that is, harmonic components of the power supply frequency, may be removed from the OA value calculated by the OA value calculation unit 141. By excluding values that account for a large proportion of the OA value in this way, misdiagnosis can be prevented.
- FIGS. 10 and 11 the same numbers are attached to the same processing contents as in FIG. 5.
- FIG. 11 the same numbers are attached to the same processing contents as in FIG. 6. Therefore, steps S107 and S108 in FIG. 10, and steps S207, S209, and S210 in FIG. 11 will be explained below, and other explanations will be omitted.
- step S108 the OA value calculation unit 141 calculates the OA value from the spectrum waveform that is the analysis result output from the analysis unit 120.
- the OA value calculated by the OA value calculation section 141 is output to the reference value storage section 113.
- the reference value storage unit 113 stores the OA value output from the OA value calculation unit 141 as a reference value, that is, an OA threshold value used at the time of diagnosis. Further, the reference value storage unit 113 stores the peak intensity of the sideband wave caused by the belt gear frequency extracted by the unique peak extraction unit 131 in S106 as a reference value used at the time of diagnosis, that is, a peak intensity threshold value. In this manner, in step S107, the OA threshold and the peak intensity threshold are stored in the reference value storage unit 113 as learning data. Note that the OA threshold and the peak intensity threshold may be stored in the rating information storage section 9.
- step S209 the OA value calculation unit 141 calculates the OA value from the spectral waveform, which is the analysis result output from the analysis unit 120.
- the calculated OA value is output from the OA value calculation unit 141 to the judgment unit 133 of the diagnosis unit 130.
- step S210 the determination unit 133 compares the OA value calculated by the OA value calculation unit 141 in step S209 and the OA threshold value stored in the reference value storage unit 113.
- step S207 the determining unit 133 determines that the electric motor 5 It is determined that there is an abnormality, and the process advances to step S208. Further, if either one does not satisfy the threshold value, it is determined that the electric motor 5 is normal, and the process returns to step S201.
- the method for diagnosing the condition of the electric motor 5 includes the steps of inputting the current data detected by the electric motor 5 by the current detector 4, performing frequency analysis of the input current data, and calculating the analysis result.
- the step of diagnosing the motor 5 by comparing the OA threshold value calculated from the normally operating motor 5 and the OA value.
- the accuracy of the diagnosis result can be improved more than the method for diagnosing the state of the electric motor 5 according to the first embodiment.
- the condition diagnosis device 101 for the electric motor 5 includes the OA value calculation section 141 in the calculation section 140, and the judgment section 133 uses the OA value calculated in the OA value calculation section 141 and the characteristic peak extraction section.
- the state of the electric motor 5 is diagnosed using the peak intensity of the sideband wave caused by the belt gear frequency extracted in step 131. Thereby, the number of parameters required for diagnosis can be reduced and the time required for diagnosis can be shortened. Moreover, the accuracy of the diagnosis result can be improved more than the method for diagnosing the state of the electric motor 5 according to the first embodiment.
- FIG. 12 is an overall system configuration diagram of the motor condition diagnostic device according to this embodiment.
- a state diagnosing device 102 for an electric motor 5 is shown in which the state diagnosing device 100 for an electric motor 5 according to the first embodiment is further provided with a learning section 15, a model storage section 16, and an inference section 17.
- the other configurations are the same as those in Embodiment 1, and the same components as in Embodiment 1 are given the same numbers and their explanations will be omitted.
- the condition diagnosis device 102 includes, for example, a current input section 7, an arithmetic processing section 81, a rating information storage section 9, a rating information setting section 10, a display section 11, a contactor drive section 12, an output section 13, It includes a communication section 14, a learning section 15, a model storage section 16, and an inference section 17.
- the characteristic peak extraction unit 131 extracts the peak intensity of the sideband wave caused by the belt gear frequency from the peak intensity of the sideband wave detected from the spectrum waveform by the calculation unit 112, and extracts the peak intensity of the sideband wave caused by the belt gear frequency.
- the state of the electric motor 5 is diagnosed by comparing it with a threshold value. Thereby, abnormality diagnosis of the electric motor 5 can be performed using the peak intensity of sideband waves caused by the belt gear frequency as a parameter used at the time of diagnosis, so that the number of parameters required for diagnosis can be reduced and the time required for diagnosis can be shortened.
- the learning unit 15 acquires the current data acquired from the current input unit 7 and the diagnosis result of the electric motor 5 stored in the diagnosis result storage unit 114, and learns by linking the diagnosis result and the current data to create a learned model. generate. That is, the diagnosis result stored in the diagnosis result storage unit 114 is stored in association with the current data before frequency analysis, and the learning unit 15 calculates the diagnosis result from the time series data of the current data acquired from the current input unit 7.
- a trained model is generated by learning time-series patterns that indicate signs of anomalies based on the .
- learning unit 15 when the learning unit 15 generates the trained model, learning is performed based on current data for a certain period before the electric motor 5 is determined to be abnormal.
- a method is used to infer a time-series pattern of current data that is not included in the pattern using deep learning.
- known machine learning methods such as genetic programming, functional logic programming, and support vector machines may be used.
- the model storage unit 16 stores the trained model generated by the learning unit 15.
- the trained model to be stored is not limited to the trained model generated by the learning unit 15, and for example, pre-trained data may be read from outside and stored as a trained model.
- the model storage unit 16 is not limited to being provided in the condition diagnosis device 102, and may be provided in an external server, etc.
- the inference unit 17 infers signs of abnormality in the electric motor 5 based on the current data newly acquired from the current input unit 7 using the learned model stored in the model storage unit 16, and outputs the inference result to the monitoring device 200. That is, current data is acquired from the current input unit 7, and using the trained model stored in the model storage unit 16, it is inferred whether or not the time series pattern is seen as a symptom when the motor 5 is abnormal. If a symptom is observed, it is determined that there is an abnormality in the electric motor 5, and the inference result is output to the monitoring device 200.
- the inference result is not limited to being output to the monitoring device 200, but may be output to the display unit 11, contactor drive unit 12, output unit 13, and communication unit 14 via the arithmetic processing unit 8.
- the inference result is not limited to being output to the monitoring device 200, but may be output to the display unit 11, contactor drive unit 12, output unit 13, and communication unit 14 via the arithmetic processing unit 8.
- the state diagnosis device 102 for the electric motor 5 further includes the learning section 15, the model storage section 16, and the inference section 17, and the learning section 15 has already been learned from the current data acquired based on the analysis results.
- a model is generated, and the inference unit 17 uses the learned model to infer an abnormality in the motor 5 from the current data.
- the state diagnosis device 102 was described in which the state diagnosis device 100 of the first embodiment was further provided with the learning section 15, the model storage section 16, and the inference section 17, but the state diagnosis device 102 of the second embodiment
- the device 101 may further include a learning section 15, a model storage section 16, and an inference section 17.
- FIG. 13 is a diagram showing the overall system configuration of an electric motor abnormality sign inference device according to this embodiment.
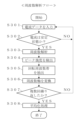
- Fig. 14 is a flowchart showing the processing procedure when the electric motor abnormality sign inference device according to this embodiment learns.
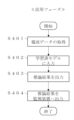
- Fig. 15 is a flowchart showing the processing procedure when the electric motor abnormality sign inference device according to this embodiment is utilized.
- an abnormality sign inference device 300 for the electric motor 5 that is externally attached to the state diagnosis device 100 for the electric motor 5 is shown.
- the other configurations are the same as those in Embodiment 1, and the same components as in Embodiment 1 are given the same numbers and their explanations will be omitted.
- the condition diagnosis device 100 includes, for example, a current input section 7, an arithmetic processing section 8, a rating information storage section 9, a rating information setting section 10, a display section 11, a contactor drive section 12, and an output section 13. , a communication section 14.
- the unique peak extraction unit 131 extracts the peak intensity of the sideband wave caused by the belt gear frequency from the peak intensity of the sideband wave detected from the spectrum waveform by the calculation unit 112, and extracts the peak intensity of the sideband wave caused by the belt gear frequency.
- the state of the electric motor 5 is diagnosed by comparing it with a threshold value. Thereby, abnormality diagnosis of the electric motor 5 can be performed using the peak intensity of sideband waves caused by the belt gear frequency as a parameter used at the time of diagnosis, so that the number of parameters required for diagnosis can be reduced and the time required for diagnosis can be shortened.
- the abnormality sign inference device 300 for the electric motor 5 includes a data acquisition section 310, a learned model generation section 320, a learned model storage section 330, and a current data inference section 340.
- the data acquisition unit 310 acquires current data from the current input unit 7 of the condition diagnosis device 100, and receives the diagnosis results of the motor 5 linked to the current data before frequency analysis from the diagnosis result storage unit 114 of the arithmetic processing unit 8. get.
- the learned model generation unit 320 learns the current data acquired from the data acquisition unit 310 from the diagnosis results and generates a learned model. Specifically, a learned model is generated by learning a time-series pattern indicating a sign of an abnormality based on the diagnosis result from the time-series data of the current data acquired from the current input unit 7. Note that the number of data of the trained model to be trained is not particularly limited, but for example, the number of data to be learned is set in advance in the trained model generation unit 320, etc., and the learning is terminated when learning of the set number of data is completed. It is better to do this.
- the trained model storage unit 330 stores the trained model generated by the trained model generation unit 320.
- the trained model to be stored is not limited to the trained model generated by the trained model generation unit 320, and, for example, trained data may be read from outside and stored as the trained model.
- the learned model storage unit 330 is not limited to being provided in the abnormality sign inference device 300, and may be provided in, for example, an external server.
- the current data inference unit 340 uses the current data newly acquired from the data acquisition unit 310 to infer signs of abnormality in the electric motor 5 using the learned model, and outputs the inference result to the monitoring device 200. That is, the data acquisition unit 310 acquires current data from the current input unit 7, and the current data acquired using the learned model stored in the learned model storage unit 330 is a time series that is seen as a sign when the electric motor 5 is abnormal. It is inferred whether it is a pattern or not, and if a sign of an abnormality is observed, it is determined that there is an abnormality in the electric motor 5 and the inference result is output to the monitoring device 200.
- the inference result is not limited to being output to the monitoring device 200, but may be output to the display unit 11, contactor drive unit 12, output unit 13, and communication unit 14 via the arithmetic processing unit 8.
- the inference result is not limited to being output to the monitoring device 200, but may be output to the display unit 11, contactor drive unit 12, output unit 13, and communication unit 14 via the arithmetic processing unit 8.
- FIG. 14 is a flowchart showing the learning phase.
- step S301 the data acquisition unit 310 acquires current data from the current input unit 7, and acquires a diagnosis result associated with the current data before frequency analysis from the diagnosis result storage unit 114 of the arithmetic processing unit 8.
- step S302 the trained model generation unit 320 learns signs of abnormality in the electric motor 5 from the current data and diagnosis results output from the data acquisition unit 310. That is, from the current data for a certain period before the electric motor 5 is diagnosed as abnormal from the current input unit 7, a time-series pattern of current data that is common when the motor 5 is diagnosed as abnormal is learned from the diagnosis results, and a learned model is generated. generate.
- step S303 the trained model storage unit 330 stores the trained model generated in step S302.
- FIG. 15 is a flowchart showing the utilization phase.
- step S401 the data acquisition unit 310 acquires current data from the current input unit 7.
- step S402 the current data acquired by the data acquisition unit 310 in step S401 is input to the learned model stored in the learned model storage unit 330.
- step S403 the current data inference unit 340 outputs the inference result of the current data input to the learned model, that is, the result of inferring whether there is a sign of abnormality in the electric motor 5 from the current data acquired from the data acquisition unit 310.
- step S404 the inference result output from the current data inference unit 340 is output to the monitoring device 200.
- the inference result is not limited to being output to the monitoring device 200, but may be output to the display unit 11, the contactor drive unit 12, the output unit 13, and the communication unit 14 via the arithmetic processing unit 8.
- the abnormality sign inference device 300 for the electric motor 5 learns the current data acquired from the state diagnosis device 100 from the diagnosis results to generate a learned model, and learns the newly acquired current data.
- the abnormality sign of the electric motor 5 is inferred by inputting it into the completed model. In this way, before the state diagnosis device 100 of the electric motor 5 diagnoses that there is an abnormality in the motor 5, it infers an abnormality sign from the current data and outputs the presence or absence of an abnormality sign to the monitoring device 200, thereby performing maintenance of the electric motor 5. can be carried out in a planned manner. Further, by setting up a maintenance plan in advance, unnecessary stop periods of the mechanical equipment 6 connected to the electric motor 5 can be shortened.
- a learned model is generated from the current data and diagnosis results obtained from the state diagnosis device 100 of the first embodiment, and the newly obtained current data is input to the learned model to operate the electric motor 5.
- the configuration is configured to infer abnormality signs
- a learned model is generated from the current data and diagnosis results obtained from the condition diagnosis device 101 of the second embodiment, and the newly obtained current data is input to the learned model to calculate the electric motor. It is also possible to use a configuration that infers the signs of abnormality in No. 5.
Landscapes
- Physics & Mathematics (AREA)
- General Physics & Mathematics (AREA)
- Engineering & Computer Science (AREA)
- Software Systems (AREA)
- Theoretical Computer Science (AREA)
- Mathematical Physics (AREA)
- Power Engineering (AREA)
- Artificial Intelligence (AREA)
- Medical Informatics (AREA)
- Evolutionary Computation (AREA)
- Computing Systems (AREA)
- General Engineering & Computer Science (AREA)
- Data Mining & Analysis (AREA)
- Computer Vision & Pattern Recognition (AREA)
- Tests Of Circuit Breakers, Generators, And Electric Motors (AREA)
- Testing Of Devices, Machine Parts, Or Other Structures Thereof (AREA)
Priority Applications (5)
| Application Number | Priority Date | Filing Date | Title |
|---|---|---|---|
| JP2023507895A JP7287591B1 (ja) | 2022-09-20 | 2022-09-20 | 電動機の状態診断装置、状態診断方法および異常予兆推論装置 |
| DE112022007789.1T DE112022007789T5 (de) | 2022-09-20 | 2022-09-20 | Zustandsdiagnoseeinrichtung, zustandsdiagnoseverfahren und abnormalitätszeicheninferenzeinrichtung für einen elektromotor |
| KR1020257008248A KR20250048104A (ko) | 2022-09-20 | 2022-09-20 | 전동기의 상태 진단 장치, 상태 진단 방법 및 이상 전조 추론 장치 |
| CN202280099791.0A CN119836575A (zh) | 2022-09-20 | 2022-09-20 | 电动机的状态诊断装置、状态诊断方法及异常预兆推测装置 |
| PCT/JP2022/034868 WO2024062511A1 (ja) | 2022-09-20 | 2022-09-20 | 電動機の状態診断装置、状態診断方法および異常予兆推論装置 |
Applications Claiming Priority (1)
| Application Number | Priority Date | Filing Date | Title |
|---|---|---|---|
| PCT/JP2022/034868 WO2024062511A1 (ja) | 2022-09-20 | 2022-09-20 | 電動機の状態診断装置、状態診断方法および異常予兆推論装置 |
Publications (1)
| Publication Number | Publication Date |
|---|---|
| WO2024062511A1 true WO2024062511A1 (ja) | 2024-03-28 |
Family
ID=86610976
Family Applications (1)
| Application Number | Title | Priority Date | Filing Date |
|---|---|---|---|
| PCT/JP2022/034868 Ceased WO2024062511A1 (ja) | 2022-09-20 | 2022-09-20 | 電動機の状態診断装置、状態診断方法および異常予兆推論装置 |
Country Status (5)
| Country | Link |
|---|---|
| JP (1) | JP7287591B1 (https=) |
| KR (1) | KR20250048104A (https=) |
| CN (1) | CN119836575A (https=) |
| DE (1) | DE112022007789T5 (https=) |
| WO (1) | WO2024062511A1 (https=) |
Families Citing this family (1)
| Publication number | Priority date | Publication date | Assignee | Title |
|---|---|---|---|---|
| WO2025017843A1 (ja) * | 2023-07-18 | 2025-01-23 | 三菱電機株式会社 | 異常判別装置、学習装置、電源装置、異常判別システムおよび異常判別方法 |
Citations (6)
| Publication number | Priority date | Publication date | Assignee | Title |
|---|---|---|---|---|
| JP2011257362A (ja) * | 2010-06-11 | 2011-12-22 | Takada Corp | 回転機械系の異常診断方法 |
| JP2016090546A (ja) * | 2014-11-11 | 2016-05-23 | 旭化成エンジニアリング株式会社 | 電流診断装置および電流診断方法 |
| WO2018142569A1 (ja) * | 2017-02-03 | 2018-08-09 | 三菱電機株式会社 | 電動機の診断装置 |
| JP2019159730A (ja) * | 2018-03-12 | 2019-09-19 | 株式会社リコー | 保守システム、保守サーバ、保守方法 |
| WO2020144939A1 (ja) * | 2019-01-11 | 2020-07-16 | パナソニックIpマネジメント株式会社 | 診断システム、診断方法、プログラム及び記録媒体 |
| WO2021166168A1 (ja) * | 2020-02-20 | 2021-08-26 | 三菱電機株式会社 | 電動機の診断装置 |
Family Cites Families (1)
| Publication number | Priority date | Publication date | Assignee | Title |
|---|---|---|---|---|
| JP5985099B1 (ja) | 2016-03-31 | 2016-09-06 | 株式会社高田工業所 | 回転機械系の異常検知方法、その異常検知方法を用いた回転機械系の異常監視方法、及びその異常監視方法を用いた回転機械系の異常監視装置 |
-
2022
- 2022-09-20 DE DE112022007789.1T patent/DE112022007789T5/de active Pending
- 2022-09-20 WO PCT/JP2022/034868 patent/WO2024062511A1/ja not_active Ceased
- 2022-09-20 JP JP2023507895A patent/JP7287591B1/ja active Active
- 2022-09-20 KR KR1020257008248A patent/KR20250048104A/ko active Pending
- 2022-09-20 CN CN202280099791.0A patent/CN119836575A/zh active Pending
Patent Citations (6)
| Publication number | Priority date | Publication date | Assignee | Title |
|---|---|---|---|---|
| JP2011257362A (ja) * | 2010-06-11 | 2011-12-22 | Takada Corp | 回転機械系の異常診断方法 |
| JP2016090546A (ja) * | 2014-11-11 | 2016-05-23 | 旭化成エンジニアリング株式会社 | 電流診断装置および電流診断方法 |
| WO2018142569A1 (ja) * | 2017-02-03 | 2018-08-09 | 三菱電機株式会社 | 電動機の診断装置 |
| JP2019159730A (ja) * | 2018-03-12 | 2019-09-19 | 株式会社リコー | 保守システム、保守サーバ、保守方法 |
| WO2020144939A1 (ja) * | 2019-01-11 | 2020-07-16 | パナソニックIpマネジメント株式会社 | 診断システム、診断方法、プログラム及び記録媒体 |
| WO2021166168A1 (ja) * | 2020-02-20 | 2021-08-26 | 三菱電機株式会社 | 電動機の診断装置 |
Also Published As
| Publication number | Publication date |
|---|---|
| JPWO2024062511A1 (https=) | 2024-03-28 |
| DE112022007789T5 (de) | 2025-07-17 |
| CN119836575A (zh) | 2025-04-15 |
| JP7287591B1 (ja) | 2023-06-06 |
| KR20250048104A (ko) | 2025-04-07 |
Similar Documents
| Publication | Publication Date | Title |
|---|---|---|
| EP3474029B1 (en) | Load abnormality detection device | |
| JP7046064B2 (ja) | 電動機の診断装置 | |
| EP3492938B1 (en) | Electric motor diagnosis device | |
| TWI710701B (zh) | 泵浦監測裝置及其方法 | |
| JP6190841B2 (ja) | 電動機の診断装置 | |
| JP6316510B1 (ja) | 電動機の診断装置 | |
| JP7361881B2 (ja) | 電動機の診断装置 | |
| JP6968323B1 (ja) | 異常診断装置及び異常診断方法 | |
| EP3716469B1 (en) | EQUIPMENT DETERIORATION DIAGNOSTIC DEVICE | |
| WO2019198563A1 (ja) | 診断支援装置、回転機システム及び診断支援方法 | |
| WO2024062511A1 (ja) | 電動機の状態診断装置、状態診断方法および異常予兆推論装置 | |
| JP2021076597A (ja) | 過渡速度動作中の振動傾向を決定することによるロータ異常の検出 | |
| WO2023195093A1 (ja) | 電動機の状態診断装置、状態診断方法および異常予兆推論装置 | |
| JP5932880B2 (ja) | 装置故障評価装置 | |
| US20230303088A1 (en) | Determining a load of a drive device | |
| JP2011122853A (ja) | 装置故障評価システム | |
| CN120065066B (zh) | 一种排水设备的电气配件状态监测方法及系统 | |
| US20260063719A1 (en) | Computer implemented method and system for anomaly detection in industrial drivetrain | |
| WO2026046884A1 (en) | Computer implemented method and system for anomaly detection in industrial drivetrain | |
| JP2025008396A (ja) | 異常検知システム |
Legal Events
| Date | Code | Title | Description |
|---|---|---|---|
| ENP | Entry into the national phase |
Ref document number: 2023507895 Country of ref document: JP Kind code of ref document: A |
|
| 121 | Ep: the epo has been informed by wipo that ep was designated in this application |
Ref document number: 22959475 Country of ref document: EP Kind code of ref document: A1 |
|
| WWE | Wipo information: entry into national phase |
Ref document number: 202280099791.0 Country of ref document: CN |
|
| ENP | Entry into the national phase |
Ref document number: 20257008248 Country of ref document: KR Kind code of ref document: A |
|
| WWE | Wipo information: entry into national phase |
Ref document number: 1020257008248 Country of ref document: KR |
|
| WWP | Wipo information: published in national office |
Ref document number: 1020257008248 Country of ref document: KR |
|
| WWP | Wipo information: published in national office |
Ref document number: 202280099791.0 Country of ref document: CN |
|
| WWE | Wipo information: entry into national phase |
Ref document number: 112022007789 Country of ref document: DE |
|
| WWP | Wipo information: published in national office |
Ref document number: 112022007789 Country of ref document: DE |
|
| 122 | Ep: pct application non-entry in european phase |
Ref document number: 22959475 Country of ref document: EP Kind code of ref document: A1 |