WO2024053380A1 - 血管内皮機能評価システム、血管内皮機能評価装置、及び血管内皮機能評価方法 - Google Patents
血管内皮機能評価システム、血管内皮機能評価装置、及び血管内皮機能評価方法 Download PDFInfo
- Publication number
- WO2024053380A1 WO2024053380A1 PCT/JP2023/030016 JP2023030016W WO2024053380A1 WO 2024053380 A1 WO2024053380 A1 WO 2024053380A1 JP 2023030016 W JP2023030016 W JP 2023030016W WO 2024053380 A1 WO2024053380 A1 WO 2024053380A1
- Authority
- WO
- WIPO (PCT)
- Prior art keywords
- pulse wave
- blood pressure
- vascular endothelial
- endothelial function
- peripheral blood
- Prior art date
- Legal status (The legal status is an assumption and is not a legal conclusion. Google has not performed a legal analysis and makes no representation as to the accuracy of the status listed.)
- Ceased
Links
Images


Classifications
-
- G—PHYSICS
- G16—INFORMATION AND COMMUNICATION TECHNOLOGY [ICT] SPECIALLY ADAPTED FOR SPECIFIC APPLICATION FIELDS
- G16H—HEALTHCARE INFORMATICS, i.e. INFORMATION AND COMMUNICATION TECHNOLOGY [ICT] SPECIALLY ADAPTED FOR THE HANDLING OR PROCESSING OF MEDICAL OR HEALTHCARE DATA
- G16H50/00—ICT specially adapted for medical diagnosis, medical simulation or medical data mining; ICT specially adapted for detecting, monitoring or modelling epidemics or pandemics
- G16H50/30—ICT specially adapted for medical diagnosis, medical simulation or medical data mining; ICT specially adapted for detecting, monitoring or modelling epidemics or pandemics for calculating health indices; for individual health risk assessment
-
- A—HUMAN NECESSITIES
- A61—MEDICAL OR VETERINARY SCIENCE; HYGIENE
- A61B—DIAGNOSIS; SURGERY; IDENTIFICATION
- A61B5/00—Measuring for diagnostic purposes; Identification of persons
- A61B5/0048—Detecting, measuring or recording by applying mechanical forces or stimuli
- A61B5/0053—Detecting, measuring or recording by applying mechanical forces or stimuli by applying pressure, e.g. compression, indentation, palpation, grasping, gauging
-
- A—HUMAN NECESSITIES
- A61—MEDICAL OR VETERINARY SCIENCE; HYGIENE
- A61B—DIAGNOSIS; SURGERY; IDENTIFICATION
- A61B5/00—Measuring for diagnostic purposes; Identification of persons
- A61B5/02—Detecting, measuring or recording for evaluating the cardiovascular system, e.g. pulse, heart rate, blood pressure or blood flow
- A61B5/02007—Evaluating blood vessel condition, e.g. elasticity, compliance
-
- A—HUMAN NECESSITIES
- A61—MEDICAL OR VETERINARY SCIENCE; HYGIENE
- A61B—DIAGNOSIS; SURGERY; IDENTIFICATION
- A61B5/00—Measuring for diagnostic purposes; Identification of persons
- A61B5/02—Detecting, measuring or recording for evaluating the cardiovascular system, e.g. pulse, heart rate, blood pressure or blood flow
- A61B5/021—Measuring pressure in heart or blood vessels
- A61B5/02108—Measuring pressure in heart or blood vessels from analysis of pulse wave characteristics
- A61B5/02116—Measuring pressure in heart or blood vessels from analysis of pulse wave characteristics of pulse wave amplitude
-
- A—HUMAN NECESSITIES
- A61—MEDICAL OR VETERINARY SCIENCE; HYGIENE
- A61B—DIAGNOSIS; SURGERY; IDENTIFICATION
- A61B5/00—Measuring for diagnostic purposes; Identification of persons
- A61B5/02—Detecting, measuring or recording for evaluating the cardiovascular system, e.g. pulse, heart rate, blood pressure or blood flow
- A61B5/021—Measuring pressure in heart or blood vessels
- A61B5/02108—Measuring pressure in heart or blood vessels from analysis of pulse wave characteristics
- A61B5/02125—Measuring pressure in heart or blood vessels from analysis of pulse wave characteristics of pulse wave propagation time
-
- A—HUMAN NECESSITIES
- A61—MEDICAL OR VETERINARY SCIENCE; HYGIENE
- A61B—DIAGNOSIS; SURGERY; IDENTIFICATION
- A61B5/00—Measuring for diagnostic purposes; Identification of persons
- A61B5/02—Detecting, measuring or recording for evaluating the cardiovascular system, e.g. pulse, heart rate, blood pressure or blood flow
- A61B5/021—Measuring pressure in heart or blood vessels
- A61B5/02141—Details of apparatus construction, e.g. pump units or housings therefor, cuff pressurising systems, arrangements of fluid conduits or circuits
-
- A—HUMAN NECESSITIES
- A61—MEDICAL OR VETERINARY SCIENCE; HYGIENE
- A61B—DIAGNOSIS; SURGERY; IDENTIFICATION
- A61B5/00—Measuring for diagnostic purposes; Identification of persons
- A61B5/02—Detecting, measuring or recording for evaluating the cardiovascular system, e.g. pulse, heart rate, blood pressure or blood flow
- A61B5/021—Measuring pressure in heart or blood vessels
- A61B5/022—Measuring pressure in heart or blood vessels by applying pressure to close blood vessels, e.g. against the skin; Ophthalmodynamometers
-
- A—HUMAN NECESSITIES
- A61—MEDICAL OR VETERINARY SCIENCE; HYGIENE
- A61B—DIAGNOSIS; SURGERY; IDENTIFICATION
- A61B5/00—Measuring for diagnostic purposes; Identification of persons
- A61B5/72—Signal processing specially adapted for physiological signals or for diagnostic purposes
- A61B5/7235—Details of waveform analysis
- A61B5/7239—Details of waveform analysis using differentiation including higher order derivatives
-
- A—HUMAN NECESSITIES
- A61—MEDICAL OR VETERINARY SCIENCE; HYGIENE
- A61B—DIAGNOSIS; SURGERY; IDENTIFICATION
- A61B5/00—Measuring for diagnostic purposes; Identification of persons
- A61B5/74—Details of notification to user or communication with user or patient; User input means
- A61B5/742—Details of notification to user or communication with user or patient; User input means using visual displays
-
- A—HUMAN NECESSITIES
- A61—MEDICAL OR VETERINARY SCIENCE; HYGIENE
- A61B—DIAGNOSIS; SURGERY; IDENTIFICATION
- A61B2560/00—Constructional details of operational features of apparatus; Accessories for medical measuring apparatus
- A61B2560/04—Constructional details of apparatus
- A61B2560/0462—Apparatus with built-in sensors
-
- A—HUMAN NECESSITIES
- A61—MEDICAL OR VETERINARY SCIENCE; HYGIENE
- A61B—DIAGNOSIS; SURGERY; IDENTIFICATION
- A61B2562/00—Details of sensors; Constructional details of sensor housings or probes; Accessories for sensors
- A61B2562/02—Details of sensors specially adapted for in-vivo measurements
- A61B2562/0233—Special features of optical sensors or probes classified in A61B5/00
-
- A—HUMAN NECESSITIES
- A61—MEDICAL OR VETERINARY SCIENCE; HYGIENE
- A61B—DIAGNOSIS; SURGERY; IDENTIFICATION
- A61B5/00—Measuring for diagnostic purposes; Identification of persons
- A61B5/68—Arrangements of detecting, measuring or recording means, e.g. sensors, in relation to patient
- A61B5/6801—Arrangements of detecting, measuring or recording means, e.g. sensors, in relation to patient specially adapted to be attached to or worn on the body surface
- A61B5/6813—Specially adapted to be attached to a specific body part
- A61B5/6824—Arm or wrist
-
- A—HUMAN NECESSITIES
- A61—MEDICAL OR VETERINARY SCIENCE; HYGIENE
- A61B—DIAGNOSIS; SURGERY; IDENTIFICATION
- A61B5/00—Measuring for diagnostic purposes; Identification of persons
- A61B5/68—Arrangements of detecting, measuring or recording means, e.g. sensors, in relation to patient
- A61B5/6801—Arrangements of detecting, measuring or recording means, e.g. sensors, in relation to patient specially adapted to be attached to or worn on the body surface
- A61B5/6813—Specially adapted to be attached to a specific body part
- A61B5/6825—Hand
- A61B5/6826—Finger
Definitions
- the present invention relates to a vascular endothelial function evaluation system, a vascular endothelial function evaluation device, and a vascular endothelial function evaluation method.
- Vascular endothelial cells perform contraction and relaxation of the vascular wall, adhesion of inflammatory cells to the vascular wall, vascular permeability, and regulation of the coagulation and fibrinolytic system. These functions of vascular endothelial cells (vascular endothelial function) are reduced by various lifestyle-related diseases such as hypertension, diabetes, dyslipidemia, and obesity.
- vascular endothelial function vascular endothelial function
- vascular endothelial function are reduced by various lifestyle-related diseases such as hypertension, diabetes, dyslipidemia, and obesity.
- a blood flow-dependent vasodilation test FMD
- EndoPAT test EndoPAT test
- Patent Document 1 a device for evaluating vascular endothelial function using a cuff-type blood pressure monitor is known (Patent Document 1). This evaluation device evaluates the vascular endothelium based on pulse waves detected by a pressure sensor connected to the cuff of a cuff-type blood pressure monitor in any two periods before pressure stimulation, during pressure stimulation, and after pressure stimulation. Evaluate functionality.
- a conventional vascular endothelial function evaluation device utilizes a pulse wave acquired by a pressure sensor connected to a cuff to evaluate vascular endothelial function. From the pulse waves acquired by this pressure sensor, information about large blood vessels is mainly obtained, and information about small blood vessels such as arterioles and capillaries cannot be obtained.
- An object of the present invention is to provide a vascular endothelial function evaluation system, a vascular endothelial function evaluation device, and a vascular endothelial function evaluation method that are capable of evaluating vascular endothelial function including arterioles and capillaries.
- a pulse wave measurement unit that generates a pulse wave signal from a measurement result of a pulse wave sensor attached to a part farther from the heart than a pressurized part to apply pressure for avascularization; an output section; a peripheral blood pressure index calculation unit that calculates a peripheral blood pressure index related to the steepness of the rise for each beat of the pulse wave signal generated by the pulse wave measurement unit;
- a vascular endothelial function evaluation system is provided, which includes a vascular endothelial function evaluation unit that evaluates vascular endothelial function based on the calculated value of the peripheral blood pressure index from the time when avascularization is released until an evaluation time has elapsed.
- a pulse wave measurement device that generates a pulse wave signal from the measurement results of a pulse wave sensor attached to a region farther from the heart than a pressurized region for avascularization;
- a peripheral blood pressure index related to the steepness of the rise for each beat of the pulse wave signal generated by the pulse wave measuring device is calculated, and the peripheral blood pressure index is calculated from the time when avascularization is released until the evaluation time elapses.
- a vascular endothelial function evaluation device is provided that includes a control terminal that evaluates vascular endothelial function based on calculated values and outputs an evaluation result.
- a vascular endothelial function evaluation method is provided for evaluating vascular endothelial function based on temporal changes in the peripheral blood pressure index.
- Peripheral blood pressure indicators include information on blood flow in peripheral blood vessels such as arterioles and capillaries. Since the vascular endothelial function is evaluated based on the calculated value of the peripheral blood pressure index from the time when avascularization is released until the evaluation time has elapsed, the vascular endothelial function including information on peripheral blood vessels can be evaluated.
- FIG. 1 is a block diagram of a vascular endothelial function evaluation system according to a first embodiment.
- FIG. 2A is a perspective view of the pulse wave measuring device
- FIG. 2B is a schematic diagram of the photoplethysmogram sensor and living tissue in a state where the pulse wave measuring device is attached to a finger.
- FIG. 3 is a flowchart showing the procedure of the vascular endothelial function evaluation method according to the first embodiment.
- FIG. 4 is a graph showing an example of a pulse wave, a velocity pulse wave, and an acceleration pulse wave.
- FIG. 5 is a graph showing an example of a pulse wave and an accelerated pulse wave.
- Figures 6A and 6B show the vicinity of the elbow on the side where the finger is located when the height from the heart to the measurement site (finger) is changed, and when the measurement site is adjusted to the chest height. It is a graph showing the relationship between the value of peripheral blood pressure index "1/VE0.5" found from the pulse wave measured when cooling the body and the systolic blood pressure measured at the wrist.
- Figures 7A and 7B show the vicinity of the elbow on the side where the finger, which is the measurement site, is adjusted when the height from the heart to the measurement site (finger) is changed, and when the measurement site is adjusted to the chest height.
- FIG. 9 is a graph showing a pulse wave obtained from subject A whose blood pressure is within the normal range.
- FIG. 10A to FIG. 10F are graphs showing temporal changes in the peripheral blood pressure index determined from the pulse wave shown in FIG. 9.
- FIG. 11 is a graph showing a pulse wave obtained from another subject B whose blood pressure was within the normal range.
- the figures from FIG. 12A to FIG. 12F are graphs showing temporal changes in the peripheral blood pressure index determined from the pulse wave shown in FIG. 11.
- FIG. 13 is a graph showing a pulse wave obtained from subject C whose blood pressure exceeds the normal range.
- 14A, FIG. 14B, and FIG. 14C are graphs showing temporal changes in the peripheral blood pressure index determined from the pulse wave shown in FIG. 13.
- FIG. 15 is a graph showing a pulse wave measured for subject A whose pulse wave shown in FIG.
- FIG. 16A to FIG. 16F are graphs showing temporal changes in the peripheral blood pressure index determined from the pulse wave shown in FIG. 15.
- FIG. 17 is a flowchart showing the procedure of the vascular endothelial function evaluation method according to the second example.
- FIG. 18 is a flowchart showing the procedure of a method for evaluating vascular endothelial function according to a modification of the second embodiment.
- 19A and 19B are graphs showing temporal changes in the amplitude S (FIG. 5) and the peripheral blood pressure index "a/S" determined from the pulse wave of subject A shown in FIG. 15.
- FIG. 20 is a block diagram of a vascular endothelial function evaluation system according to the fourth embodiment.
- FIG. 21 is a schematic diagram of a user wearing a measuring device when evaluating vascular endothelial function using the vascular endothelial function evaluation system according to the fourth example.
- FIG. 1 is a block diagram of a vascular endothelial function evaluation system according to a first embodiment.
- the vascular endothelial function evaluation system according to the first embodiment includes a pulse wave measurement device 20, a control terminal 30, a server 40, and a cuff type blood pressure monitor 50.
- the pulse wave measuring device 20, the control terminal 30, the server 40, and the cuff type blood pressure monitor 50 each include communication units 24, 33, 44, and 55, and perform data communication with each other via these communication units.
- communication between the pulse wave measurement device 20 and the control terminal 30 and communication between the cuff-type blood pressure monitor 50 and the control terminal 30 are based on short-range wireless communication standards such as Bluetooth (registered trademark). Wireless communication is used.
- a wireless LAN or the like is used for communication between the control terminal 30 and the server 40.
- the pulse wave measuring device 20 includes a photoplethysmographic sensor 21 , a light emission control section 22 , a pulse wave measuring section 23 , and a communication section 24 .
- Photoplethysmographic sensor 21 includes a light emitting element and a light receiving element. The light receiving element receives the light output from the light emitting element and passes through the living tissue, and measures the intensity of the received light.
- the light emission control section 22 controls light emission of the light emitting element.
- the pulse wave measurement unit 23 generates a pulse wave signal based on the measured value of the intensity of light from the photoplethysmogram sensor 21.
- the control terminal 30 includes a control section 31, an output section 32, and a communication section 33.
- a control terminal 30 for example, a smartphone or the like can be used. By installing an application program on a smartphone, the smartphone can be used as the control terminal 30.
- the control unit 31 receives a pulse wave signal from the pulse wave measurement device 20 and transfers the received pulse wave signal to the server 40. Furthermore, the evaluation result of vascular endothelial function is received from the server 40 and the evaluation result is output to the output unit 32 .
- the output unit 32 includes, for example, a display device that displays images. The evaluation results of vascular endothelial function are displayed as images or characters on the display device.
- the server 40 includes a pulse wave feature calculation unit 41 , a peripheral blood pressure index calculation unit 42 , a vascular endothelial function evaluation unit 43 , and a communication unit 44 .
- the pulse wave feature amount calculation unit 41 calculates various feature amounts of the waveform of the pulse wave signal (hereinafter sometimes simply referred to as "pulse wave") received from the control terminal 30.
- the peripheral blood pressure index calculation unit 42 calculates a peripheral blood pressure index related to the steepness of the rise of the pulse wave for each beat, based on the feature amount of the pulse wave.
- the peripheral blood pressure index can be used as an index representing the magnitude of peripheral blood pressure.
- the peripheral blood pressure index will be described in detail later with reference to the drawings from FIG. 4 to FIG. 8B.
- the vascular endothelial function evaluation unit 43 evaluates the vascular endothelial function based on the temporal change in the peripheral blood pressure index, and transmits the evaluation result to the control terminal 30. Furthermore, the evaluation results are stored.
- the cuff type blood pressure monitor 50 includes a pressurizing section 51, a pulse detecting section 52, a controlling section 53, a blood pressure calculating section 54, and a communicating section 55.
- a cuff-type automatic electronic blood pressure monitor can be used as the cuff-type blood pressure monitor 50.
- the control unit 53 receives a command from the control terminal 30 and controls pressurization of the pressurizing unit 51 .
- Pressure section 51 includes a cuff. By wrapping the cuff around the user's upper arm and controlling pressurization, avascularization can be started and released.
- the pulse detection unit 52 detects the pulse of the area around which the cuff is wrapped.
- the blood pressure calculation unit 54 calculates the blood pressure based on the pressure applied to the cuff and the detection result of the pulse detection unit 52.
- FIG. 2A is a perspective view of the pulse wave measuring device 20.
- a ring-shaped device worn on a user's finger is used as the pulse wave measuring device 20.
- Photoplethysmographic sensor 21 includes two light emitting elements 21A, 21B and one light receiving element 21C.
- the two light emitting elements 21A, 21B and one light receiving element 21C are arranged on the inner surface of the ring-shaped mounting member 27. Note that it may be configured to include only one of the light emitting elements 21A and 21B.
- the light emitting elements 21A and 21B output light toward the finger.
- the light receiving element 21C is attached at a position where light reflected by or transmitted through the living tissue inside the finger is incident.
- the mounting member 27 further incorporates a light emission control section 22, a pulse wave measurement section 23, and a communication section 24.
- the light emission control section 22, the pulse wave measurement section 23, and the communication section 24 may be configured by one integrated circuit.
- FIG. 2B is a schematic diagram of the photoplethysmographic sensor 21 and living tissue in a state where the pulse wave measuring device 20 is attached to a finger.
- the light emitting elements 21A, 21B and the light receiving element 21C come into contact with the user's body surface 70.
- the light emitting elements 21A and 21B irradiate measurement light toward the body surface 70.
- the irradiated light is absorbed, reflected, or scattered (hereinafter sometimes simply referred to as "reflection") by the epidermal region 71, arterioles 72, and capillaries 73 within the body surface 70.
- a portion of the light that passes through living tissues such as the epidermal region 71, arterioles 72, and capillaries 73 enters the light receiving element 21C.
- the arteriole 72 is a thin blood vessel with a diameter of, for example, 20 ⁇ m or more and 200 ⁇ m or less, and exists between the artery and the capillary blood vessel 73.
- a plurality of capillaries 73 branch from the arteriole 72.
- the capillary blood vessel 73 is a thin blood vessel with a diameter of about 10 ⁇ m, for example, and connects an artery and a vein.
- a plurality of capillaries 73 are distributed in an area shallower than the area where arterioles 72 are distributed.
- Arterial blood contains hemoglobin, and hemoglobin has the property of absorbing light for measurement. The amount of blood flow changes as the heart beats, and the amount of light absorbed changes in accordance with the change in blood flow. Therefore, the intensity of light received by the light receiving element 21C changes with the heartbeat.
- the light-emitting element 21A one that outputs light in a wavelength range from blue to yellow-green (wavelength range of 450 nm or more and 570 nm or less), preferably 500 nm or more and 550 nm or less, is used.
- the light emitting element 21B outputs light in a wavelength range from red to near infrared light, preferably in a wavelength range of 750 nm or more and 950 nm or less.
- a light emitting diode (LED), a vertical cavity surface emitting laser (VCSEL), or the like is used as the light emitting elements 21A and 21B.
- a photodiode (PD), a phototransistor, or the like is used as the light receiving element 21C.
- pulse waves obtained using light in the wavelength range from blue to yellow-green include areas shallow from the skin surface, particularly shallower than areas where arterioles 72 are distributed, and mainly areas where capillaries 73 are distributed.
- the information will be reflected.
- the arrow pointing from the light-emitting element 21A to the light-receiving element 21C shown in FIG. 2B does not indicate a path through which light propagates. It shows that the light enters the light receiving element 21C through a distributed region.
- the distance L1 between the light emitting element 21A and the light receiving element 21C is set. It is preferable to keep it short. For example, it is preferable that the interval L1 be 1 mm or more and 3 mm or less.
- Light with wavelengths shorter than 450 nm can damage living tissues.
- the wavelength of the light used to measure pulse waves is preferably 450 nm or more.
- the distance L2 between the light emitting element 21B and the light receiving element 21C is set to 5 mm or more and 20 mm or less. is preferred.
- the absorbance of hemoglobin decreases. Therefore, it is preferable to use light in the wavelength range of 950 nm or less to obtain the pulse wave signal.
- one light-receiving element 21C is arranged for two light-emitting elements 21A and 21B, but one light-receiving element is arranged for one light-emitting element 21A, and the other light-emitting element Other light receiving elements may be arranged for 21B.
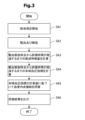
- FIG. 3 is a flowchart showing the procedure of the vascular endothelial function evaluation method according to the first example.
- the user wraps the cuff of the cuff-type blood pressure monitor 50 around one upper arm or wrist.
- the pulse wave measuring device 20 (FIG. 2A) is attached to the base of the index finger on the same side as the arm around which the cuff is wrapped. Note that the pulse wave measuring device 20 may be attached to a finger other than the index finger, and may be attached to the fingertip.
- the control terminal 30 starts pulse wave measurement by controlling the pulse wave measurement device 20 (FIG. 1) (step SA1).
- the measured pulse wave is transmitted to the server 40 (FIG. 1).
- the control terminal 30 controls the cuff-type blood pressure monitor 50 (FIG. 1) to start avascularization, and after a certain period of time has elapsed, the avascularization is released (step SA2).
- the pulse wave feature amount calculation unit 41 of the server 40 calculates the pulse wave feature amount of the pulse wave waveform for each beat from the point of release of avascularization until a predetermined evaluation time has elapsed (step SA3).
- the length of evaluation time is set in advance.
- the peripheral blood pressure index calculation unit 42 of the server 40 calculates a peripheral blood pressure index for each pulse of the pulse wave based on the calculated value of the pulse wave feature amount from the point of release of avascularization until the evaluation time has elapsed. (Step SA4). Thereby, the time change of the peripheral blood pressure index within the evaluation time is determined.
- the vascular endothelial function evaluation unit 43 of the server 40 evaluates the vascular endothelial function based on the plurality of calculated values of the peripheral blood pressure index (step SA5).
- the vascular endothelial function evaluation unit 43 transmits the evaluation results to the control terminal 30.
- the control unit 31 of the control terminal 30 outputs the evaluation result received from the server 40 to the output unit 32 (step SA6).
- vascular endothelial function is evaluated in five stages from level 1 to level 5.
- FIG. 4 is a graph showing an example of a pulse wave, a velocity pulse wave, and an acceleration pulse wave.
- the pulse wave feature calculation unit 41 (FIG. 1) of the server 40 performs first-order differentiation and second-order differentiation of the pulse wave.
- the waveforms obtained by first-order differentiation and second-order differentiation of a pulse wave are referred to as a velocity pulse wave and an acceleration pulse wave, respectively.
- the velocity pulse wave is determined by numerically differentiating the intensity of the pulse wave, which is distributed discretely at time intervals corresponding to the sampling rate, by the time interval corresponding to the sampling rate.
- the acceleration pulse wave is determined by numerically differentiating the magnitude of the velocity pulse wave.
- the horizontal axis of FIG. 4 represents time in units [s], the left vertical axis represents the magnitude of the velocity pulse wave and acceleration pulse wave normalized so that the maximum value is 1, and the right vertical axis represents the pulse wave. represents the size of in arbitrary units.
- a solid line, a long broken line, and a short broken line in the graph shown in FIG. 4 indicate a pulse wave, a velocity pulse wave, and an acceleration pulse wave, respectively.
- five peaks appear in an accelerated pulse wave within one beat.
- the 1st, 2nd, 3rd, 4th, and 5th peaks within one beat are called a wave, b wave, c wave, d wave, and e wave, respectively.
- the full width at half maximum of the first upward peak of the velocity pulse wave is written as "VE0.5".
- the difference between the peak value of the a wave and the peak value of the b wave is marked as “ab”
- the difference between the peak value of the a wave and the peak value of the d wave is marked as "ad”.
- a concave portion called the notch IC appears slightly behind the maximum peak of the pulse wave.
- FIG. 5 is a graph showing an example of a pulse wave and an accelerated pulse wave.
- the horizontal axis represents time, the left vertical axis represents the magnitude of the pulse wave in arbitrary units, and the right vertical axis represents the magnitude of the accelerated pulse wave in arbitrary units. 5 scales on the horizontal axis corresponds to 0.2 s.
- the peak value of the a wave of the accelerated pulse wave is marked as "a”, and the amplitude of the pulse wave is marked as "S”.
- the amplitude S of the pulse wave corresponds to the difference between the minimum value and the maximum value after the waveform is corrected so that the minimum values of two consecutive pulse waves have the same magnitude.
- peripheral blood pressure index is defined as blood pressure in peripheral arterioles and capillaries.
- Peripheral blood pressure is sometimes used to mean blood pressure at the wrist or ankle measured with a cuff-type blood pressure monitor, but blood pressure at the wrist or ankle is a value measured in a large artery (such as the radial artery).
- Blood pressure in blood vessels decreases as blood progresses from large arteries to arterioles and capillaries. The degree to which blood pressure decreases varies depending on the measurement site, the individual's vascular condition (presence of arteriosclerosis, etc.), mental condition (autonomic nerve condition, etc.), environment (temperature, presence of noise, etc.), clothing, etc.
- peripheral blood pressure index an index that is effective for determining peripheral blood pressure is adopted as a peripheral blood pressure index.
- the peripheral blood pressure index is considered to have the following characteristics. First, when blood vessels are healthy and under conditions where vascular resistance does not change, peripheral blood pressure indicators have a positive correlation with blood pressure in the upper arm or wrist. Second, when the vicinity of the measurement site is cooled to constrict blood vessels, the peripheral blood pressure index decreases. When blood vessels constrict, peripheral vascular resistance increases and blood pressure in the upper arm and wrist may rise.
- pulse wave feature quantities that reflect the above two features of the peripheral blood pressure index.
- VE0.5 full width at half maximum
- a/S amplitude S of the pulse wave
- a/S the ratio of the difference "a-b” between the peak value of the a-wave and the peak value of the b-wave of the accelerated pulse wave to the difference "a-d” between the peak value of the a-wave and the peak value of the d-wave
- peripheral blood pressure index are related to the steepness of the rise of the pulse wave.
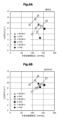
- FIGS. 6A and 6B show the vicinity of the elbow on the side where the finger is located when the height from the heart to the measurement site (finger) is changed, and when the measurement site is adjusted to the chest height. It is a graph showing the relationship between the value of peripheral blood pressure index "1/VE0.5" found from the pulse wave measured when cooling the body and the systolic blood pressure measured at the wrist.
- FIGS. 6A and 6B show a case where green light outputted from the light emitting element 21A (FIG. 2A) and a case where near infrared light outputted from the light emitting element 21B (FIG. 2A) are used to measure the pulse wave, respectively. The measurement results are shown below.
- Pulse waves measured using green light mainly reflect fluctuations in blood flow in capillaries 73 (FIG. 2B), and pulse waves measured using near-infrared light mainly reflect fluctuations in blood flow in capillaries 73 and arterioles 72. (FIG. 2B) reflects the fluctuations in blood flow.
- the horizontal axis of the graphs in FIGS. 6A and 6B represents the systolic blood pressure at the wrist in units of [mmHg], and the vertical axis represents the peripheral blood pressure index “1/(VE0.5)” in units of [s ⁇ 1 ]. represent.
- the three hollow symbols shown for each subject are the peripheral blood pressure index "1/VE0" obtained from the pulse wave obtained by setting the height of the measurement site (finger) to the height of the navel, chest, and forehead. .5".
- the value of the peripheral blood pressure index "1/VE0.5” decreases in the order of height of the measurement site: navel, chest, and forehead.
- the symbol filled in black for each subject is the peripheral blood pressure index "1/VE0.5" obtained from the pulse wave obtained with the measurement site set at chest level and the area near the elbow cooled. ” value is shown.
- the peripheral blood pressure index "1/VE0.5” has a generally positive correlation with the systolic blood pressure at the wrist. I understand. Furthermore, although there are some exceptions, it can be seen that when the vicinity of the measurement site is cooled to constrict blood vessels, the peripheral blood pressure index "1/VE0.5” decreases. The appearance of this change matches the expected characteristics of the peripheral blood pressure index. Therefore, the peripheral blood pressure index "1/VE0.5" is considered to be an effective index for estimating peripheral blood pressure.
- the peripheral blood pressure index "1/VE0.5" the reciprocal of the parameter representing the width of the maximum peak of the velocity pulse wave may be used.
- a negative exponent of a parameter representing the width of the maximum peak of the velocity pulse wave may be used.
- a parameter representing the width of the maximum peak of the velocity pulse wave may be used as a variable, and a function such that the value of the function decreases as the width of the peak increases may be used as the peripheral blood pressure index.
- Figures 7A and 7B show the vicinity of the elbow on the side where the finger, which is the measurement site, is adjusted when the height from the heart to the measurement site (finger) is changed, and when the measurement site is adjusted to the chest height. It is a graph showing the relationship between the value of the peripheral blood pressure index "a/S" determined from the pulse wave measured when the patient is cooled, and the systolic blood pressure measured at the wrist.
- FIGS. 7A and 7B show measurement results when green light and near-infrared light were used to measure pulse waves, respectively.
- the horizontal axis of the graphs in FIGS. 7A and 7B represents the systolic blood pressure at the wrist in units [mmHg], and the vertical axis represents the peripheral blood pressure index "a/S" in arbitrary units.
- the meaning of each symbol in FIGS. 7A and 7B is the same as the meaning of each symbol in the graphs shown in FIGS. 6A and 6B.
- peripheral blood pressure index "a/S” is considered to be an effective index for estimating peripheral blood pressure. Note that from the results shown in FIGS. 7A and 7B, it can be seen that it is preferable to use green light rather than near-infrared light for measuring the peripheral blood pressure index "a/S".
- the peripheral blood pressure index "a/S” the product of the peak value a of the a wave of the accelerated pulse wave to a power with a positive index and the amplitude S of the pulse wave to a power with a negative index is calculated as the peripheral blood pressure. It can also be used as an indicator.
- the peripheral blood pressure index may be calculated based on information regarding the peak value of the a-wave of the accelerated pulse wave and the amplitude of the pulse wave signal.
- a function may be used as a peripheral blood pressure index in which the peak value a and the amplitude S are used as variables, and when the peak value a increases, the value of the function also increases, and when the amplitude S increases, the value of the function decreases. .
- Figures 8A and 8B show the vicinity of the elbow on the side where the finger, which is the measurement site, is adjusted when the height from the heart to the measurement site (finger) is changed, and when the measurement site is adjusted to the chest height.
- 2 is a graph showing the relationship between the value of the peripheral blood pressure index "(ab)/(ad)" determined from the pulse wave measured when the patient is cooled, and the systolic blood pressure measured at the wrist.
- FIGS. 8A and 8B show measurement results when green light and near-infrared light were used to measure pulse waves, respectively.
- the horizontal axis of the graphs in FIGS. 8A and 8B represents the systolic blood pressure at the wrist in units [mmHg], and the vertical axis represents the peripheral blood pressure index "(ab)/(ad)".
- the meaning of each symbol in FIGS. 8A and 8B is the same as the meaning of each symbol in the graphs shown in FIGS. 6A and 6B.
- peripheral blood pressure index "(ab)/(ad)" is considered to be an effective index for estimating peripheral blood pressure.
- peripheral blood pressure index (a-b)/(a-d)
- the peripheral blood pressure index may be calculated based on information regarding the difference between the peripheral blood pressure index and the peripheral blood pressure index.
- the difference (a-b) between the peak value of the a-wave and the peak value of the b-wave and the difference (a-d) between the peak value of the a-wave and the peak value of the d-wave are variables
- the difference (a A function in which the value of the function increases as the value of -b) increases, and decreases as the value of the difference (ad) increases may be used as the peripheral blood pressure index.
- FIG. 9 is a graph showing a pulse wave obtained from subject A whose blood pressure was within the normal range.
- the horizontal axis represents the elapsed time from the start of pulse wave measurement in units [s], and the vertical axis represents the photoplethysmogram (a value obtained by inverting the output from the photoplethysmographic sensor 21 (FIG. 1)) in arbitrary units.
- Solid lines Gr and Ir in the graph of FIG. 9 indicate the measurement results when green light and near-infrared light were used, respectively.
- Subject A's systolic blood pressure was 115 mmHg
- diastolic blood pressure was 76 mmHg
- pulse rate was 65 bpm.
- pressurization using the cuff-type sphygmomanometer 50 was started. It takes about ten seconds from the start of pressurization to the start of avascularization. Once avascularization begins, pulse waves cannot be obtained. Approximately 60 seconds after the start of pulse wave measurement, the pressure within the cuff decreases and pulse waves can be detected. The period of avascularization is marked as Pa, and in FIG. 9, the avascularization period is colored in light gray. The measurement was terminated when approximately 120 seconds had elapsed from the start of the measurement.
- the graphs from FIG. 10A to FIG. 10F represent temporal changes in the peripheral blood pressure index, and the horizontal axes of these graphs represent elapsed time in units of [s].
- the vertical axes of the graphs in FIGS. 10A and 10D represent the peripheral blood pressure index "1/VE0.5" in units [s -1 ]
- the vertical axes of the graphs in FIGS. 10B and 10E represent the peripheral blood pressure index "a/S " is expressed in arbitrary units
- the vertical axis of the graphs in FIGS. 10C and 10F represents the peripheral blood pressure index "(ab)/(ad).”
- the graphs from FIG. 10A to FIG. 10C show the peripheral blood pressure index determined from the pulse wave measured using green light
- the graphs from FIG. 10D to FIG. 10F show the peripheral blood pressure index measured using near-infrared light. It shows a peripheral blood pressure index determined from pulse waves.
- FIG. 11 is a graph showing a pulse wave obtained from another subject B whose blood pressure was within the normal range.
- the horizontal axis represents the elapsed time from the start of pulse wave measurement in units [s], and the vertical axis represents the photoplethysmogram (a value obtained by inverting the output from the photoplethysmographic sensor 21 (FIG. 1)) in arbitrary units.
- Solid lines Gr and Ir in the graph of FIG. 11 indicate the measurement results when using green light and near-infrared light, respectively.
- Subject B's systolic blood pressure was 104 mmHg
- diastolic blood pressure was 76 mmHg
- pulse rate was 66 bpm.
- the period of pressurization by the cuff type sphygmomanometer 50 from the start to the end of pulse wave measurement is the same as the case shown in FIG. 9.
- the period of avascularization is marked as Pa, and in FIG. 11, the avascularization period is colored in light gray.
- the graphs from FIG. 12A to FIG. 12F represent temporal changes in the peripheral blood pressure index, and the horizontal axes of these graphs represent elapsed time in units of [s].
- the vertical axes of the graphs in FIGS. 12A and 12D represent the peripheral blood pressure index "1/VE0.5" in units [s -1 ]
- the vertical axes of the graphs in FIGS. 12B and 12E represent the peripheral blood pressure index "a/S " is expressed in arbitrary units
- the vertical axis of the graphs in FIGS. 12C and 12F represents the peripheral blood pressure index "(ab)/(ad).”
- the graphs from FIG. 12A to FIG. 12C show the peripheral blood pressure index determined from the pulse wave measured using green light
- the graphs from FIG. 12D to FIG. 12F show the peripheral blood pressure index measured using near-infrared light. It shows a peripheral blood pressure index determined from pulse waves.
- Peripheral blood pressure index determined from the pulse wave measured using green light and near-infrared light for subject A (graphs from FIG. 10A to FIG. 10F), and determined from the pulse wave measured using green light for subject B. All of the peripheral blood pressure indicators (graphs in FIGS. 12A, 12B, and 12C) decreased immediately after the release of avascularization compared to before the initiation of avascularization. Approximately 10 seconds after the release of avascularization, the peripheral blood pressure index has returned to the value before the initiation of avascularization. Note that the decrease in subject A's peripheral blood pressure index is more remarkable than the decrease in subject B's peripheral blood pressure index. In the peripheral blood pressure index (graphs in FIGS. 12D, 12E, and 12F) determined from the pulse wave measured using near-infrared light for subject B, no clear decrease is observed immediately after the release of avascularization.
- the mechanism by which the peripheral blood pressure index decreases immediately after the release of avascularization can be considered as follows.
- vascular endothelial function When vascular endothelial function is normal, the blood vessel dilates due to vascular endothelial function when avascularization is released.
- the blood that has flowed into the large blood vessels is used to expand the large blood vessels, thereby suppressing the rapid flow of blood into the downstream capillaries.
- the increase in the peripheral blood pressure index is suppressed for about 10 seconds from the time of release of avascularization.
- FIG. 13 is a graph showing a pulse wave obtained from subject C whose blood pressure exceeds the normal range. It is thought that vascular endothelial function was decreased in this subject.
- the horizontal axis of the graph shown in FIG. 13 represents the elapsed time from the start of pulse wave measurement in units [s], and the vertical axis represents the photoplethysmogram (a value obtained by inverting the output from the photoplethysmogram sensor 21 (FIG. 1)). ) expressed in arbitrary units.
- Solid lines Gr and Ir in the graph of FIG. 13 indicate the measurement results when green light and near-infrared light were used, respectively.
- Subject C's systolic blood pressure was 164 mmHg
- diastolic blood pressure was 104 mmHg
- pulse rate was 59 bpm.
- the period of pressurization by the cuff type sphygmomanometer 50 from the start to the end of pulse wave measurement is the same as the case shown in FIG. 9.
- the period of avascularization is marked as Pa, and in FIG. 13, the avascularization period is colored in light gray.
- the graphs in FIGS. 14A, 14B, and 14C represent temporal changes in peripheral blood pressure indicators.
- the horizontal axes of these graphs represent elapsed time in units of [s].
- the vertical axis of the graph in FIG. 14A represents the peripheral blood pressure index "1/VE0.5" in units [s -1 ]
- the vertical axis of the graph in FIG. 14B represents the peripheral blood pressure index "a/S” in arbitrary units.
- the vertical axis of the graph in FIG. 14C represents the peripheral blood pressure index "(ab)/(ad)”.
- the graphs from FIG. 14A to FIG. 14C show peripheral blood pressure indices determined from pulse waves measured using green light. It was not possible to calculate clear pulse wave features from pulse waves obtained using near-infrared light.
- peripheral blood pressure index increased immediately after the release of avascularization compared to before the initiation of avascularization. Approximately 10 seconds after the release of avascularization, the peripheral blood pressure index has returned to the value before the initiation of avascularization.
- the mechanism by which the peripheral blood pressure index increases immediately after the release of avascularization can be considered as follows.
- vascular endothelial function is impaired, blood vessels will not dilate sufficiently even if avascularization is released. Blood flowing into large blood vessels directly flows into downstream arterioles and capillaries, which is thought to increase the peripheral blood pressure index.
- a peripheral blood pressure index is calculated based on the pulse wave until a certain period of time (hereinafter referred to as evaluation time ET) has elapsed from the time of avascularization release.
- FIG. 10A shows an example of the evaluation time ET.
- the evaluation time is divided into a front period ET 1 and a rear period ET 2 , and the average value M 1 of the peripheral blood pressure index in the front period ET 1 and the average value M 2 of the peripheral blood pressure index in the rear period are calculated. calculate.
- Vascular endothelial function is evaluated based on the average value M 1 of the peripheral blood pressure index in the front period ET 1 and the average value M 2 of the peripheral blood pressure index in the rear period ET 2 .
- M 1 /M 2 is the vascular endothelial function
- the evaluation index the value obtained by dividing the average value M 1 of the peripheral blood pressure index in the anterior period ET 1 by the average value M 2 of the peripheral blood pressure index in the posterior period ET 2
- M 1 /M 2 is the vascular endothelial function
- the evaluation index the larger the value (referred to as the evaluation index) is, the worse the vascular endothelial function is.
- vascular endothelial function may be evaluated in five stages based on the magnitude of the vascular endothelial function evaluation index M 1 /M 2 .
- vascular endothelial function may be evaluated based on the difference between the average values M 1 and M 2 .
- the evaluation time ET may be set to 40 seconds, and when 10 seconds have elapsed from the time of release of avascularization, the period may be divided into a front period ET 1 and a rear period ET 2 .
- the evaluation time ET and the time point at which the front period ET 1 and the rear period ET 2 are divided are preferably determined with reference to data obtained from many subjects.
- the vascular endothelial function is evaluated by pressurizing the upstream artery for avascularization and measuring the peripheral blood pressure of the downstream arteriole or capillary. Therefore, it is possible to evaluate the vascular endothelial function from the avascularization site to the arterioles and capillaries.
- the photoplethysmogram measured by the photoplethysmographic sensor 21 was used as the pulse wave for calculating the peripheral blood pressure index, but pulse waves measured by other sensors may also be used. It's okay. For example, a pressure pulse wave may be used.
- the evaluation time ET (FIG. 10A) is divided into an anterior period ET 1 and a posterior period ET 2 , and the vascular endothelial function is evaluated based on the ratio of the average value of the peripheral blood pressure index in the two periods.
- other methods may be used to assess vascular endothelial function.
- the vascular endothelial function may be evaluated based on a plurality of calculated values of the peripheral blood pressure index within the evaluation time ET.
- vascular endothelial function may be evaluated based on trends in temporal changes in a plurality of calculated values of peripheral blood pressure indices within evaluation time ET.
- a ring-shaped device to be worn on a finger is used as the pulse wave measuring device 20 (FIG. 2A), but devices of other shapes may also be used.
- a clip-type device that is attached to the tip of a finger may be used.
- the pulse wave measuring device 20 in addition to a device worn on a finger, a wristwatch type device or a wristband type device worn on a wrist may be used.
- the upper arm is pressurized to ablate blood and the pulse wave is measured with a finger, but the ablation site and the pulse wave measurement site are not limited to these. It is preferable to pressurize a part of the body to abate blood, and measure the pulse wave at a part farther from the heart than the pressurized part.
- the control terminal 30 controls the aspiration and release of the cuff-type blood pressure monitor 50, but does not communicate with the control terminal 30 as a device that performs aspiration and release.
- independent ones may be used.
- a cuff-type blood pressure monitor that does not communicate with the control terminal 30 may be used, or an aneroid blood pressure monitor may be used.
- the user or a nearby person may pressurize and release the cuff.
- the pulse wave feature calculation unit 41 (FIG. 1) can detect the start and release points of avascularization from the acquired pulse wave.
- the pulse wave measuring device 20, the control terminal 30, and the server 40 share various functions, but other functions may be shared.
- the function of the pulse wave feature calculation section 41 may be implemented by the control terminal 30.
- all functions of the server 40 may be realized by the control terminal 30.
- all functions of the control terminal 30 may be realized by the server 40.
- the vascular endothelial function is evaluated using the peripheral blood pressure index calculated from the pulse wave after the release of avascularization .
- a peripheral blood pressure index calculated from a pulse wave for a certain period of time before avascularization may be used.
- the average value of the peripheral blood pressure index during the period ET 2 after the evaluation time ET shown in FIG. 10A may be used instead of the average value of the peripheral blood pressure index during the period ET 2 after the evaluation time ET shown in FIG. 10A. That is, the average value of the peripheral blood pressure index during period ET 1 may be compared with the average value of the peripheral blood pressure index for a certain period of time before avascularization.
- the vascular endothelium is Functionality may be evaluated.
- vascular endothelial function may be evaluated based on the peripheral blood pressure index for a certain period of time before avascularization, the average value of the peripheral blood pressure index during period ET 2 , and the average value of the peripheral blood pressure index during period ET 1 .
- the average value of the peripheral blood pressure index for a certain period of time before avascularization and the peripheral blood pressure index for period ET 2 may be adopted, or a weighted average value depending on the amount of time deviation from period ET 1 . may also be used.
- the waveform of the peripheral blood pressure index for a certain period of time before avascularization and the waveform of the peripheral blood pressure index for period ET 2 are used.
- Linear approximation or curve approximation may be performed, and representative values of the peripheral blood pressure index for a certain period of time before avascularization and the peripheral blood pressure index for period ET 2 may be determined based on the approximate straight line or curve.
- the vascular endothelial function may be evaluated based on this representative value and the average value of the peripheral blood pressure index during the period ET 1 after release of avascularization.
- the representative value for example, a value at the midpoint of an approximate straight line or an approximate curve may be adopted.
- Peripheral blood pressure indicators fluctuate due to exercise, sudden changes in temperature, stress, tension, etc.
- vascular endothelial function By evaluating vascular endothelial function with reference to the peripheral blood pressure index before avascularization, it is possible to reduce the influence of fluctuations in the peripheral blood pressure index due to various factors and improve evaluation accuracy. For example, if the average value of the peripheral blood pressure index during period ET 2 shown in FIG. It is better to make it .
- control terminal 30 controls the pulse wave measurement device 20 (FIG. 1) and the cuff-type blood pressure monitor 50 (FIG. 1), but the pulse wave measurement device 20 and the cuff-type blood pressure monitor 50 may directly communicate with each other, and the pulse wave measuring device 20 may control the timing of pressurization and release by the cuff type blood pressure monitor 50.
- the pulse wave measuring device 20 measures the pulse wave in synchronization with the timing of pressurization and release by the cuff type blood pressure monitor 50. Thereby, blood pressure can be measured in parallel while pulse waves are being measured. Since avascularization starts after a certain period of time has elapsed from the start of pressurization, the control terminal 30 acquires pressurization and release timing information from the pulse wave measurement device 20 to identify the timing of avascularization and release. becomes easier.
- a vascular endothelial function evaluation system and a vascular endothelial function evaluation method according to a second embodiment will be described with reference to the drawings from FIG. 15 to FIG. 17.
- a description of the components common to the vascular endothelial function evaluation system and the vascular endothelial function evaluation method according to the first embodiment described with reference to the drawings from FIG. 1 to FIG. 14C will be omitted.
- the length of the avascularization period Pa (FIGS. 9, 11, and 13) (the avascularization time) is approximately 30 seconds.
- the ablation time is made longer.
- FIG. 15 is a graph showing a pulse wave measured with a longer ablation time for subject A whose pulse wave shown in FIG. 9 was measured.
- the horizontal axis represents the elapsed time from the start of pulse wave measurement in units [s], and the vertical axis represents the photoplethysmogram (a value obtained by inverting the output from the photoplethysmographic sensor 21 (FIG. 1)) in arbitrary units.
- the pressure site was pressurized using an aneroid sphygmomanometer cuff.
- Solid lines Gr and Ir in the graph of FIG. 15 indicate the measurement results when green light and near-infrared light were used, respectively.
- pressurization using an aneroid sphygmomanometer was started. It takes about ten seconds from the start of pressurization to the start of avascularization. Once avascularization begins, pulse waves cannot be obtained. Approximately 150 seconds after the start of pulse wave measurement, the air in the cuff was removed. The period of avascularization is marked as Pa, and in FIG. 15, the avascularization period is colored in light gray. The measurement was terminated when approximately 300 seconds had elapsed from the start of the measurement.
- the graphs from FIG. 16A to FIG. 16F represent temporal changes in the peripheral blood pressure index, and the horizontal axes of these graphs represent elapsed time in units of [s].
- the vertical axes of the graphs in FIGS. 16A and 16D represent the peripheral blood pressure index "1/VE0.5" in units [s -1 ]
- the vertical axes of the graphs in FIGS. 16B and 16E represent the peripheral blood pressure index "a/S " is expressed in arbitrary units
- the vertical axis of the graphs in FIGS. 16C and 16F represents the peripheral blood pressure index "(ab)/(ad).”
- the graphs from FIG. 16A to FIG. 16C show the peripheral blood pressure index determined from the pulse wave measured using green light
- the graphs from FIG. 16D to FIG. 16F show the peripheral blood pressure index measured using near-infrared light. It shows a peripheral blood pressure index determined from pulse waves.
- the peripheral blood pressure index decreases when avascularization is released compared to before avascularization occurs regardless of the avascularization time.
- the peripheral blood pressure index recovers to its original value in about 10 seconds.
- the peripheral blood pressure index when measurement is performed under conditions where the avascularization time is relatively long, it takes a longer time for the peripheral blood pressure index to return to its original value. For example, when measured using green light, it takes about 30 seconds for the peripheral blood pressure index to return to its original value, and when measured using near-infrared light, it takes about 120 seconds for the peripheral blood pressure index to return to its original value.
- the avascularization time is increased, the decrease in the peripheral blood pressure index when measured using near-infrared light becomes clearer than when the avascularization time is short.
- the mechanism behind the phenomenon in which it takes a long time for the peripheral blood pressure index to return to its original value when near-infrared light is used can be considered as follows.
- the inflow of blood into capillaries is suppressed, resulting in a decrease in the peripheral blood pressure index.
- the avascularization time is long, the blood flow in the capillaries and arterioles is reduced, and it takes time for the capillaries to fill with blood. After that, it takes time for the arterioles to fill with blood.
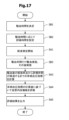
- FIG. 17 is a flowchart showing the procedure of the vascular endothelial function evaluation method according to the second example.
- the user determines the ablation time (step SB1).
- the user inputs the determined avascularization time into the control terminal 30 (FIG. 1).
- the control unit 31 of the control terminal 30 sets an evaluation time according to the input avascularization time (step SB2).
- the control unit 31 starts measuring the pulse wave (step SA1), similarly to the first embodiment (FIG. 3).
- avascularization and release are performed based on the fixed avascularization time (step SA2), but in the second embodiment, avascularization and release are performed based on the avascularization time set in step SB2. , perform avascularization and release (step SB3).
- the subsequent steps from step SA3 to step SA5 are the same as those from step SA3 to step SA5 in the first embodiment (FIG. 3).
- the excellent effects of the second embodiment will be explained.
- the second embodiment by making the avascularization time longer than in the first embodiment, the decrease in the peripheral blood pressure index after the release of avascularization clearly appears, so that the accuracy of evaluation of vascular endothelial function can be improved. Furthermore, by increasing the evaluation time in accordance with the longer avascularization time, it is possible to stably detect changes in the decline and recovery of the peripheral blood pressure index after the release of avascularization.
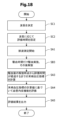
- FIG. 18 is a flowchart showing the procedure of a method for evaluating vascular endothelial function according to a modification of the second embodiment.
- the user determines the avascularization time (step SB1), but in this modification, the user determines the wavelength of light used to measure the pulse wave (step SC1). After that, evaluation time is set according to the wavelength (step SC2).
- the subsequent procedure is the same as in the second embodiment.
- FIGS. 19A and 19B a description of the components common to the vascular endothelial function evaluation system and the vascular endothelial function evaluation method according to the first and second embodiments will be omitted.
- FIG. 19A and 19B are graphs showing temporal changes in the amplitude S (FIG. 5) and peripheral blood pressure index "a/S" determined from the pulse wave of subject A shown in FIG. 15.
- the graph in FIG. 19A was obtained from a pulse wave measured using green light
- the graph in FIG. 19B was obtained from a pulse wave measured using near-infrared light.
- the amplitude S of the pulse wave is clearly larger than the amplitude S of the pulse wave before acupuncture during the period until 60 seconds have passed from the time of release of acupuncture.
- the tendency for the amplitude S of the pulse wave to increase is noticeable both when the measurement light is green light and when the measurement light is near-infrared light. It is presumed that the reason why the amplitude S of the pulse wave increases is that the blood flow rate increases due to vasodilation.
- vascular endothelial function is good, the blood vessel will be sufficiently dilated after the ablation is released, and the increase in the amplitude S of the pulse wave will be large.
- vascular endothelial function is reduced, blood vessel expansion becomes insufficient, and as a result, the amount of increase in pulse wave amplitude S becomes small.
- the vascular endothelial function can be evaluated based on the increase in the amplitude S of the pulse wave after the release of avascularization.
- the vascular endothelial function is evaluated based on the amount of increase in the amplitude S of the pulse wave in addition to the calculated value of the peripheral blood pressure index from the time of release of avascularization.
- the vascular endothelial function is evaluated based on the amount of increase in the amplitude S of the pulse wave, thereby improving the evaluation accuracy.
- vascular endothelial function evaluation system and a vascular endothelial function evaluation method according to a fourth embodiment will be described with reference to FIGS. 20 and 21.
- a description of the components common to the vascular endothelial function evaluation system and the vascular endothelial function evaluation method according to the first embodiment will be omitted.
- FIG. 20 is a block diagram of a vascular endothelial function evaluation system according to the fourth embodiment.
- the vascular endothelial function evaluation system according to the first embodiment includes a pulse wave measurement device 20, a control terminal 30, a server 40, and a cuff type blood pressure monitor 50.
- the vascular endothelial function evaluation system according to the fourth embodiment further includes a reference pulse wave measurement device 60.
- the reference pulse wave measurement device 60 includes a reference photoplethysmogram sensor 61 , a light emission control section 62 , a reference pulse wave measurement section 63 , and a communication section 64 .
- the configurations and functions of the reference photoplethysmographic sensor 61, the light emission control section 62, the reference pulse wave measurement section 63, and the communication section 64 are the same as those of the photoplethysmographic sensor 21 and the light emission control section 22 of the pulse wave measurement device 20 according to the first embodiment.
- the configuration and function of the pulse wave measuring section 23 and the communication section 24 are the same.
- the reference pulse wave measuring section 63 generates a reference pulse wave signal based on the output from the reference photoplethysmogram sensor 61.
- the pulse wave sensor 61 is replaced with the reference photoplethysmogram sensor 61 and the pulse wave sensor is measured using the same method as the photoplethysmogram sensor 21.
- a reference pulse wave sensor is used to measure the
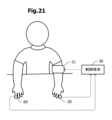
- FIG. 21 is a schematic diagram of a user wearing a measurement device when evaluating vascular endothelial function using the vascular endothelial function evaluation system according to the fourth example.
- the user wraps the pressurizing part 51 of the cuff-type blood pressure monitor 50, for example, the cuff, around one upper arm.
- the pulse wave measuring device 20 is attached to the finger of the arm on which the pressurizing part 51 is attached.
- the reference pulse wave measurement device 60 is attached to the finger of the opposite arm. In this way, the reference pulse wave measurement device 60 is attached to a site symmetrical to the attachment site of the pulse wave measurement device 20 on the human body.
- the pulse wave measurement device 20 acquires a pulse wave
- the reference pulse wave measurement device 60 acquires a reference pulse wave.
- the peripheral blood pressure index determined from the pulse wave acquired by the pulse wave measuring device 20 and the peripheral blood pressure index determined from the reference pulse wave are compared to evaluate vascular endothelial function.
- the average value of the peripheral blood pressure index obtained from the pulse wave acquired by the pulse wave measuring device 20 during the period ET 1 is denoted as M 1
- the average value during the period ET 2 is denoted as M 2
- the average value of the peripheral blood pressure index determined from the reference pulse wave during period ET 1 is denoted as MR 1
- the average value during period ET 2 is denoted as MR 2 .
- vascular endothelial function is evaluated based on M 1 /M 2
- vascular endothelial function is evaluated based on (M 1 /M 2 )/(MR 1 /MR 2 ). evaluate.
- the average values MR 1 and MR 2 are approximately equal because avascularization is not performed.
- the average value MR2 may change from the average value MR1 due to some external factor. That is, MR 1 /MR 2 may deviate from 1.
- the influence of this external factor is also reflected to the same extent in the value of M 1 /M 2 .
- the influence of external factors is almost eliminated and the accuracy of the evaluation of the vascular endothelial function is improved. can be increased.
- Pulse wave measurement device 21 Photoelectric pulse wave sensor 21A, 21B Light emitting element 21C Light receiving element 22 Light emission control section 23 Pulse wave measurement section 24 Communication section 27 Mounting member 30 Control terminal 31 Control section 32 Output section 33 Communication section 40 Server 41 Pulse wave Feature value calculation section 42 Peripheral blood pressure index calculation section 43 Vascular endothelial function evaluation section 44 Communication section 50 Cuff type blood pressure monitor 51 Pressure section 52 Pulse detection section 53 Control section 54 Blood pressure calculation section 55 Communication section 60 Reference pulse wave measurement device 61 Reference Photoplethysmographic sensor 62 Light emission control section 63 Reference pulse wave measurement section 64 Communication section 70 User's body surface 71 Epidermal region 72 Arterioles 73 Capillaries
Landscapes
- Health & Medical Sciences (AREA)
- Life Sciences & Earth Sciences (AREA)
- Engineering & Computer Science (AREA)
- Public Health (AREA)
- Medical Informatics (AREA)
- Biomedical Technology (AREA)
- General Health & Medical Sciences (AREA)
- Pathology (AREA)
- Cardiology (AREA)
- Animal Behavior & Ethology (AREA)
- Heart & Thoracic Surgery (AREA)
- Biophysics (AREA)
- Molecular Biology (AREA)
- Surgery (AREA)
- Physics & Mathematics (AREA)
- Veterinary Medicine (AREA)
- Physiology (AREA)
- Vascular Medicine (AREA)
- Primary Health Care (AREA)
- Data Mining & Analysis (AREA)
- Databases & Information Systems (AREA)
- Epidemiology (AREA)
- Artificial Intelligence (AREA)
- Computer Vision & Pattern Recognition (AREA)
- Psychiatry (AREA)
- Signal Processing (AREA)
- Ophthalmology & Optometry (AREA)
- Measuring Pulse, Heart Rate, Blood Pressure Or Blood Flow (AREA)
Priority Applications (4)
| Application Number | Priority Date | Filing Date | Title |
|---|---|---|---|
| DE112023002643.2T DE112023002643T5 (de) | 2022-09-09 | 2023-08-21 | System, vorrichtung und verfahren zur bewertung der vaskulären endothelfunktion |
| CN202380064152.5A CN119836258A (zh) | 2022-09-09 | 2023-08-21 | 血管内皮功能评价系统、血管内皮功能评价装置以及血管内皮功能评价方法 |
| JP2024545541A JP7790584B2 (ja) | 2022-09-09 | 2023-08-21 | 血管内皮機能評価システム、及び血管内皮機能評価装置 |
| US19/018,361 US20250143585A1 (en) | 2022-09-09 | 2025-01-13 | System, apparatus, and method for evaluating vascular endothelial function |
Applications Claiming Priority (2)
| Application Number | Priority Date | Filing Date | Title |
|---|---|---|---|
| JP2022143981 | 2022-09-09 | ||
| JP2022-143981 | 2022-09-09 |
Related Child Applications (1)
| Application Number | Title | Priority Date | Filing Date |
|---|---|---|---|
| US19/018,361 Continuation US20250143585A1 (en) | 2022-09-09 | 2025-01-13 | System, apparatus, and method for evaluating vascular endothelial function |
Publications (1)
| Publication Number | Publication Date |
|---|---|
| WO2024053380A1 true WO2024053380A1 (ja) | 2024-03-14 |
Family
ID=90191002
Family Applications (1)
| Application Number | Title | Priority Date | Filing Date |
|---|---|---|---|
| PCT/JP2023/030016 Ceased WO2024053380A1 (ja) | 2022-09-09 | 2023-08-21 | 血管内皮機能評価システム、血管内皮機能評価装置、及び血管内皮機能評価方法 |
Country Status (5)
| Country | Link |
|---|---|
| US (1) | US20250143585A1 (https=) |
| JP (1) | JP7790584B2 (https=) |
| CN (1) | CN119836258A (https=) |
| DE (1) | DE112023002643T5 (https=) |
| WO (1) | WO2024053380A1 (https=) |
Citations (6)
| Publication number | Priority date | Publication date | Assignee | Title |
|---|---|---|---|---|
| JP2006263354A (ja) * | 2005-03-25 | 2006-10-05 | Denso Corp | 人体の個体情報取得装置、血圧測定装置および脈波信号解析装置 |
| JP2011189080A (ja) * | 2010-03-16 | 2011-09-29 | Toyama Univ | 指尖脈波解析装置及びこれを用いた血管内皮機能評価システム |
| US20120065514A1 (en) * | 2008-12-30 | 2012-03-15 | Morteza Naghavi | Cardiohealth Methods and Apparatus |
| JP2017170014A (ja) * | 2016-03-25 | 2017-09-28 | 京セラ株式会社 | 血圧推定装置、血圧計、血圧推定システム、及び血圧推定方法 |
| JP2019503824A (ja) * | 2015-12-07 | 2019-02-14 | メディシ テクノロジーズ,エルエルシー | 観察的心不全モニタリングシステム |
| JP2022518173A (ja) * | 2019-01-09 | 2022-03-14 | トゥルン イリオピスト | 動脈系の機能性を測定するための装置 |
-
2023
- 2023-08-21 WO PCT/JP2023/030016 patent/WO2024053380A1/ja not_active Ceased
- 2023-08-21 CN CN202380064152.5A patent/CN119836258A/zh active Pending
- 2023-08-21 DE DE112023002643.2T patent/DE112023002643T5/de active Pending
- 2023-08-21 JP JP2024545541A patent/JP7790584B2/ja active Active
-
2025
- 2025-01-13 US US19/018,361 patent/US20250143585A1/en active Pending
Patent Citations (6)
| Publication number | Priority date | Publication date | Assignee | Title |
|---|---|---|---|---|
| JP2006263354A (ja) * | 2005-03-25 | 2006-10-05 | Denso Corp | 人体の個体情報取得装置、血圧測定装置および脈波信号解析装置 |
| US20120065514A1 (en) * | 2008-12-30 | 2012-03-15 | Morteza Naghavi | Cardiohealth Methods and Apparatus |
| JP2011189080A (ja) * | 2010-03-16 | 2011-09-29 | Toyama Univ | 指尖脈波解析装置及びこれを用いた血管内皮機能評価システム |
| JP2019503824A (ja) * | 2015-12-07 | 2019-02-14 | メディシ テクノロジーズ,エルエルシー | 観察的心不全モニタリングシステム |
| JP2017170014A (ja) * | 2016-03-25 | 2017-09-28 | 京セラ株式会社 | 血圧推定装置、血圧計、血圧推定システム、及び血圧推定方法 |
| JP2022518173A (ja) * | 2019-01-09 | 2022-03-14 | トゥルン イリオピスト | 動脈系の機能性を測定するための装置 |
Also Published As
| Publication number | Publication date |
|---|---|
| JPWO2024053380A1 (https=) | 2024-03-14 |
| CN119836258A (zh) | 2025-04-15 |
| US20250143585A1 (en) | 2025-05-08 |
| JP7790584B2 (ja) | 2025-12-23 |
| DE112023002643T5 (de) | 2025-04-24 |
Similar Documents
| Publication | Publication Date | Title |
|---|---|---|
| US12239421B2 (en) | Sensor device | |
| US7544168B2 (en) | Measuring systolic blood pressure by photoplethysmography | |
| CN112426141B (zh) | 血压检测装置以及电子设备 | |
| JP3213278B2 (ja) | 非観血連続血圧推定装置 | |
| US20140142434A1 (en) | System and method of measurement of systolic blood pressure | |
| US11154208B2 (en) | System and method of measurement of average blood pressure | |
| JP2018501016A (ja) | ウェアラブル血行動態センサ | |
| WO2014089665A1 (en) | System for measurement of cardiovascular health | |
| WO2015049963A1 (ja) | 生体情報測定装置および該方法 | |
| US20250072836A1 (en) | Pulse wave signal processor, physiological information measurement device, and contact-pressure abnormality determination method | |
| WO2002085203A1 (fr) | Dispositif d'estimation de forme d'onde de pression sanguine centrale et dispositif de detection de forme d'onde de pression sanguine peripherique | |
| CN105708431A (zh) | 血压实时测量装置及测量方法 | |
| KR20190105421A (ko) | 광혈류 측정기 기반의 인체착용형 혈압 측정장치 및 혈압 측정방법 | |
| JP2006239114A (ja) | カフレス電子血圧計 | |
| KR20060081166A (ko) | 광혈류 측정신호를 이용한 혈압측정시스템을 내장한휴대용 무선단말기 | |
| KR20200129811A (ko) | 혈압 측정 시스템 및 이를 이용한 혈압 측정 방법 | |
| US20200359916A1 (en) | Blood pressure meter and method for measuring blood pressure using the same | |
| US20240423547A1 (en) | Blood pressure estimation method and biological information measurement system | |
| JP7790584B2 (ja) | 血管内皮機能評価システム、及び血管内皮機能評価装置 | |
| KR20200043900A (ko) | 혈압계 및 이를 이용한 혈압 측정 방법 | |
| WO2023162756A1 (ja) | 血行動態推定方法 | |
| JP7776014B2 (ja) | 脈圧測定装置及び脈圧測定方法 | |
| JP7708307B2 (ja) | 末梢血圧推定方法および生体情報測定システム | |
| JP2000225097A (ja) | 携帯型血圧計 | |
| Panula et al. | An Automated Device for Recording Peripheral Arterial Waveform |
Legal Events
| Date | Code | Title | Description |
|---|---|---|---|
| 121 | Ep: the epo has been informed by wipo that ep was designated in this application |
Ref document number: 23862919 Country of ref document: EP Kind code of ref document: A1 |
|
| ENP | Entry into the national phase |
Ref document number: 2024545541 Country of ref document: JP Kind code of ref document: A |
|
| WWE | Wipo information: entry into national phase |
Ref document number: 112023002643 Country of ref document: DE |
|
| WWE | Wipo information: entry into national phase |
Ref document number: 202380064152.5 Country of ref document: CN |
|
| WWP | Wipo information: published in national office |
Ref document number: 202380064152.5 Country of ref document: CN |
|
| WWP | Wipo information: published in national office |
Ref document number: 112023002643 Country of ref document: DE |
|
| 122 | Ep: pct application non-entry in european phase |
Ref document number: 23862919 Country of ref document: EP Kind code of ref document: A1 |