WO2024042736A1 - 情報処理方法、情報処理システム、及び情報処理プログラム - Google Patents
情報処理方法、情報処理システム、及び情報処理プログラム Download PDFInfo
- Publication number
- WO2024042736A1 WO2024042736A1 PCT/JP2023/005451 JP2023005451W WO2024042736A1 WO 2024042736 A1 WO2024042736 A1 WO 2024042736A1 JP 2023005451 W JP2023005451 W JP 2023005451W WO 2024042736 A1 WO2024042736 A1 WO 2024042736A1
- Authority
- WO
- WIPO (PCT)
- Prior art keywords
- attribute
- data
- information processing
- value
- mfcvae
- Prior art date
- Legal status (The legal status is an assumption and is not a legal conclusion. Google has not performed a legal analysis and makes no representation as to the accuracy of the status listed.)
- Ceased
Links
Images










Classifications
-
- G—PHYSICS
- G06—COMPUTING OR CALCULATING; COUNTING
- G06N—COMPUTING ARRANGEMENTS BASED ON SPECIFIC COMPUTATIONAL MODELS
- G06N3/00—Computing arrangements based on biological models
- G06N3/02—Neural networks
-
- G—PHYSICS
- G06—COMPUTING OR CALCULATING; COUNTING
- G06N—COMPUTING ARRANGEMENTS BASED ON SPECIFIC COMPUTATIONAL MODELS
- G06N3/00—Computing arrangements based on biological models
- G06N3/02—Neural networks
- G06N3/04—Architecture, e.g. interconnection topology
- G06N3/045—Combinations of networks
- G06N3/0455—Auto-encoder networks; Encoder-decoder networks
Definitions
- the present invention relates to an information processing method, an information processing system, and an information processing program.
- the quality of an AI (Artificial Intelligence) model depends on the quality of the data used.
- it is useful to evaluate information regarding attributes of training data used when building an AI model and test data used when making inferences.
- Patent Document 1 For example, in Patent Document 1, three images corresponding to the same semantic feature are extracted from training data, and variational auto-processing is performed to minimize the loss function of the latent variable corresponding to the semantic feature for each of the three images. Update encoder parameters. This improves the identifiability of different images having the same semantic features.
- Non-Patent Document 1 by increasing the independence of latent variables so that the information given by each latent variable to the input value is unique, the content and size of attributes corresponding to changes in latent variables can be changed. It increases the interpretability of changes. As a result, it can be seen that, for example, in handwritten character data, the angle of the character changes continuously from diagonally left to diagonally right in response to a change in a certain latent variable.
- Non-Patent Document 2 a latent variable is expressed as a linear combination of orthogonal bases, and by associating the coefficients of the base obtained through learning with changes in the attributes of data, the attributes corresponding to changes in the coefficients of the base are This increases the interpretability of changes in the content and magnitude of the changes. As a result, it can be seen that, for example, in face image data, the color of hair changes continuously from gold to black in response to a change in a certain base coefficient.
- One aspect of the disclosure of the present application aims to improve the interpretability of attributes and attribute values corresponding to latent variables in training data and test data.
- One aspect of the disclosure of the present application is an information processing method executed by an information processing system having a processing unit and a storage unit, wherein the processing unit processes reference data in which attribute values are assigned to a plurality of attributes of the data.
- MFCVAE Multi-Facet Clustering Variational Auto-Encoder
- a fifth step of calculating a function value of a loss function obtained by adding an additional term based on the index for each attribute to the loss function of the MFCVAE which has the following: , a sixth step of updating the model parameters of the MFCVAE by error backpropagation based on the function value calculated in the fifth step, and from the first step to the sixth step, the prediction error is Alternatively, the MFCVAE model learning is performed by repeating this order in this order until the number of epochs satisfies a predetermined condition.
- FIG. 3 is a diagram for explaining the problems of the conventional technology (MFCVAE).
- FIG. 3 is a diagram for explaining the operation of the information processing system according to the first embodiment during model learning.
- FIG. 3 is a diagram for explaining the operation of the information processing system according to the first embodiment when assigning attribute values to evaluation data.
- FIG. 3 is a diagram for explaining the operation of the information processing system according to the first embodiment when generating data with specified attribute values.
- FIG. 3 is a diagram for explaining the transition of the coefficient of determination during model learning of the information processing system according to the first embodiment.
- FIG. 1 is a block diagram showing the configuration of an information processing system according to a first embodiment.
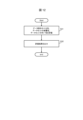
- FIG. 5 is a flowchart showing feature amount extraction processing according to the first embodiment.
- 7 is a flowchart showing attribute value assignment processing according to the first embodiment.
- 5 is a flowchart showing data generation processing according to the first embodiment.
- 7 is a flowchart showing data quality evaluation processing according to the first embodiment.
- 3 is a diagram showing an example 1 of outputting attributes and attribute values (attributes and attribute values for data) according to the first embodiment;
- FIG. FIG. 7 is a diagram showing an example 2 of outputting data, attributes, and attribute values (the number of data for each attribute and attribute value) according to the first embodiment;
- FIG. 2 is a block diagram showing the configuration of an information processing system according to a second embodiment.
- Identical or similar constituent elements may be given the same reference numerals, and the explanation of the previously mentioned components in the later embodiments may be omitted, or only the differences may be explained. Furthermore, when there are a plurality of identical or similar constituent elements, the same reference numerals may be given different subscripts for explanation. Furthermore, if there is no need to distinguish between these multiple components, the subscripts may be omitted from the description.
- various information will be explained in a table format, but the various information may be in a data format other than the table format.
- various names such as “XX information”, “XX table”, “XX list”, and “XX queue” are interchangeable.
- "XX table” may be called “XX list”.
- identification information expressions such as “identification information,” “identifier,” “name,” “ID,” and “number” are used, but these are interchangeable.
- FIG. 1 is a diagram for explaining problems in the prior art.
- MFCVAE is an extended variational auto-encoder (VAE) that can output latent variables from multiple viewpoints.
- a variational autoencoder is a generative model that uses a neural network and assumes a probability distribution as the space of latent variables.
- the viewpoint in MFCVAE is the type of latent variable (vector) output by MFCVAE, and in the case of character data, it corresponds to "type of character", “character shape (thickness, angle, etc.)", etc.
- the variational autoencoder is available in Document 1 “Diederik P Kingma, Max Welling, “Auto-Encoding Variational Bayes,” May 2014. [Retrieved August 1, 2020], Internet ⁇ URL: https:// arxiv.org/abs/1312.6114>” MFCVAE is based on Document 2 “Fabian Falck et.al, “Multi-Facet Clustering Variational Autoencoders,” Oct. 2021. [Retrieved August 1, 2020], Internet ⁇ URL: https://arxiv.org/abs/ 2106.05241>”.
- features are information that characterizes data (attributes, attribute values, latent variables, etc.).
- a feature amount is a value of a feature that can be expressed quantitatively.
- Attributes are properties that characterize data (in the case of character data, such as “thickness”, “slope”, “amount of noise”, “degree of character breakage”, etc.).
- Attribute value is a value indicating the degree of the attribute (in the example of character data, "1 mm” for the attribute "Thickness”, “10 degrees” for the attribute “Tilt”, “10%” for the attribute "Noise amount", "Level 2" for "degree of brokenness of letters”).
- Attribute values may be continuous values or discrete values.
- a latent variable is a feature quantity output from an encoder in variational autoencoder related technology. Variational autoencoder-related technology refers to all variational autoencoder technologies having variational Bayes algorithms, including VAE and MFCVAE.
- the group 101 of latent variable 1 and latent variable 2 corresponds to characters whose attribute "thickness" is thin.
- Group 102 is a group of latent variables that correspond to characters whose attribute "thickness” is medium.
- Group 103 is a group of latent variables whose attribute "thickness” corresponds to bold characters.
- Group 104 is a group of latent variables corresponding to characters with a small attribute "noise amount”.
- Group 105 is a group of latent variables corresponding to characters whose attribute "noise amount” is medium.
- Group 106 is a group of latent variables corresponding to characters with a large attribute "noise amount".
- "thick,” “medium,” and “thin” for the attribute “thickness,” and “large,” “medium,” and “small” for the attribute “noise amount” are merely illustrative expressions, and quantitative expressions or This is an example of a label given to .
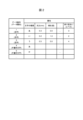
- FIG. 2 is a diagram showing reference data and evaluation data (in the case of character data).
- each row is called data.
- attribute such as "character type,”"thickness,” and "slant.”
- attribute values are stored and data in which attribute values are not stored.
- “Character type” is image data of the corresponding character.
- data in which an attribute value is stored is reference data regarding that attribute
- data in which an attribute value is not stored is evaluation data regarding that attribute.
- the reference data is data whose attribute values are known and are used to determine the attribute values of the evaluation data.
- the evaluation data is target data that is assigned by determining an attribute value for an attribute whose attribute value is unknown.
- the data of "data number” "1" “2” “3" of "data attribute” "print” which has attribute values such as "thickness” and “slant” are standard data and have attribute values.
- Data with "data attributes”, “handwritten characters”, “data numbers”, "4" and "5" that are not included are evaluation data. More generally, the reference data includes printed and handwritten text, and the evaluation data includes handwritten text.
- FIG. 3 is a diagram showing reference data and evaluation data (in the case of general data).
- reference data and evaluation data are separated for each data attribute.
- the standard data and evaluation data are generalized, and for each data, the data in which the attribute value is stored for each attribute is the standard data for the corresponding attribute, and the data in which the attribute value is stored for each attribute is the standard data.
- the data is evaluation data regarding the corresponding attribute.
- the reference data is the data of "Data Number” “1”, “2”, “3”, “4", and the evaluation data is the data of "Data Number” “5".
- the reference data is the data of "data number” "1”, “2”, and “5", and the evaluation data is the data of "data number” "3" and "4".
- the purpose of the following embodiment is to estimate the attribute value of evaluation data for each attribute using the attribute value of reference data.
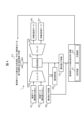
- FIG. 4 is a diagram for explaining the operation of the information processing system 1 according to the first embodiment during model learning.
- variational autoencoder-related technology is used to predict attribute values using a multiple regression model based on latent variables of the reference data 201 using reference data 201 in which attribute values are assigned to attributes in advance. Perform model training using the new loss function.
- the information processing system 1 has an MFCVAE 2.
- MFCVAE2 is configured to include an encoder 203 and a decoder 205.
- the data (training data set) input to the encoder 203 includes only the reference data 201 or includes both the reference data 201 and the evaluation data 202.
- Encoder 203 outputs latent variable 204, which is an intermediate output of MFCVAE2.
- MFCVAE2 sets a multiple regression model in which the latent variable 204 is an explanatory variable and the correct value (correct label) 208 of the attribute value is an objective variable.
- the model is not limited to a multiple regression model, and may be either a linear regression model or a nonlinear regression model. Since the multiple regression model has the advantage that the load of model calculation is small, the multiple regression model is adopted in this embodiment.
- the information processing system 1 calculates a partial regression coefficient 209 that minimizes the mean square error between the predicted value of the attribute value and the correct value 208 of the attribute value, and the predicted value 210 of the attribute value at that time, from the latent variable 204 and the correct value 208 of the attribute value. demand.
- the predicted value 210 of the attribute value is calculated as a linear combination of the latent variables 204 whose respective coefficients are the partial regression coefficients 209.
- the coefficient of determination 211 or prediction that can be an index representing the goodness of fit takes a smaller value as the fit to the multiple regression model (fitting of the multiple regression model) is better.
- An error 212 is determined.
- the coefficient of determination 211 and the prediction error 212 are learned using a loss function 213 that includes an index representing the degree of adaptation to the multiple regression model. Encoder 203 is trained in this way.
- the latent variable 204 is input to the decoder 205.
- the decoder 205 outputs reconstructed reference data 206, which is the reference data 201 reconstructed by the decoder 205, and reconstructed evaluation data 207, which is the evaluation data 202 reconstructed by the decoder 205.
- the reconstruction evaluation data 207 is data to which attribute values are assigned.
- Equation (1) the objective function, the variational lower bound (ELBO), is expressed as in equation (1).
- equation (1) the parameters of the MFCVAE model are learned so that a negative loss function in which the sign of the lower limit of variation in Equation (1) is made negative is minimized (see Document 2 mentioned above).
- equation (1) "D" is the training dataset, "x” is the training data included in the training dataset, "z ⁇ ” is the latent variable, " ⁇ ” is the encoder parameter, “ ⁇ ” is the decoder parameter, “KL(A
- the degree-of-freedom adjusted coefficient of determination at viewpoint j is R f,j 2
- the weighting coefficient of each degree-of-freedom adjusted coefficient of determination R f,j 2 is ⁇ j (>0).
- the objective function is set as shown in equation (2).
- the right side of equation (2) is obtained by adding the third term ⁇ j R f,j 2 to the expression in parentheses of the expected value E[*] on the right side of equation (1).
- a coefficient of determination R j 2 which will be described later, may be used instead of the degree-of-freedom adjusted coefficient of determination R f,j 2 .
- the coefficient of determination R j 2 and the degree of freedom adjusted coefficient of determination R f,j 2 are examples of the coefficient of determination 211.
- the first term in parentheses of the expected value E[*] in equation (2) is a reconstruction error term representing the error in data reconstruction by MFCVAE.
- the second term in parentheses of the expected value E[*] in equation (2) is a regularization term that imposes constraints on the distribution of the latent variables, such as suppressing variations in the latent variables of MFCVAE.
- the third term in parentheses of the expected value E[*] in Equation (2) is an additional term based on an index that takes a smaller value as the fit to the multiple regression model for the latent variables and attribute values for each attribute is better.
- loss function 213 (expressed as loss function Loss) is a negative objective function, it is expressed as in Expression (3) using the objective function of Expression (2).
- the parameters of the MFCVAE model are learned so that the loss function Loss is minimized, that is, the coefficient of determination R f,i 2 is maximized.
- each attribute of the data has a one-to-one correspondence with each of the J viewpoints of the MFCVAE. If the attribute value of attribute j is assigned to data n having index number n, data n is reference data in attribute j. On the other hand, if the attribute value of attribute j is not assigned to data n, data n is evaluation data for attribute j.
- B j be a set of indexes of reference data regarding a certain attribute j
- M j be the number of elements in the set B j .
- Set B j ⁇ b j,1 , b j,2 , ..., b j, Mj ⁇ .
- the predicted value of the attribute value is Let be y ⁇ n,j .
- the predicted value y ⁇ n,j of the attribute value is expressed as in equation (4).
- the mean squared error MSE j which is the prediction error between the attribute value y n,j (where n ⁇ B j ) regarding a certain attribute j and the predicted value y ⁇ n,j of the attribute value by the multiple regression model, is expressed by equation (6). It is expressed as follows.
- the mean square error MSEj is an example of the prediction error 212.
- the partial regression coefficient w j is a function of the latent variable Z j and the attribute value y j .
- the partial regression coefficient w j is an example of the partial regression coefficient 209.
- the prediction error between the attribute value y n,j (where n ⁇ B j ) regarding a certain attribute j and the predicted value y ⁇ n,j of the attribute value by the multiple regression model is not limited to the mean square error, but also the average error, Mean absolute error, mean squared error, mean error rate, mean absolute error rate, etc. may also be employed.
- the coefficient of determination R j 2 for a certain attribute j represents how much the explanatory variable explains the objective variable.
- the coefficient of determination R j 2 is expressed as in equation (10) using the average value y n,j of the attribute values.
- the coefficient of determination has the property that it approaches 1 as the number of explanatory variables increases, so when the number of explanatory variables is large, the degree of freedom adjusted coefficient of determination R f,j 2 that corrects this property is May be adopted.
- the degree of freedom adjusted coefficient of determination R f,j 2 is expressed as equation (11) since the number of explanatory variables is p and the number of samples of reference data is M j .
- the weighting coefficient ⁇ j can be obtained from a comparison of the absolute values of the reconstruction error term, the regularization term, and the coefficient of determination R j 2 (R f, j 2 ).
- the weighting coefficient ⁇ j for the coefficient of determination R j 2 is the reconstruction error term of the expression in parentheses of the expected value E[*] on the right side of equation ( 2 ), where the order of
- the weighting coefficient ⁇ j for the degree-of-freedom adjusted coefficient of determination R f, j 2 also has the order of
- the decoder 205 uses the attributes and attribute values of the reference data 201 and the evaluation data 202 (the assigned attribute values in the case of the evaluation data 202), and the last learning of the encoder 203.
- the partial regression coefficient 209 obtained in each epoch is used.
- a latent variable (latent variable vector Z n,j ) is calculated from equation (4) using the attributes and attribute values of the reference data 201 and evaluation data 202 and the partial regression coefficient 209.
- the decoder 205 inputs the calculated latent variables and outputs reconstructed reference data 206 and reconstructed evaluation data 207, which are obtained by reconstructing the input reference data 201 and evaluation data 202, respectively.
- FIG. 5 is a diagram for explaining the operation of the information processing system 1 according to the first embodiment when assigning attribute values to the evaluation data 202.
- the information processing system 1 first inputs the evaluation data 202 into the trained encoder 203 to obtain latent variables 204.
- the information processing system 1 uses the partial regression coefficients 209 obtained in the final epoch of learning of MFCVAE2 (FIG. 4) to create a linear combination equation of the latent variables 204 using the predicted value 210 of the attribute value and the partial regression coefficient 209 as each coefficient. Calculate with.
- the information processing system 1 assigns the predicted value 210 of the attribute value to the evaluation data 202.
- FIG. 6 is a diagram for explaining the operation of the information processing system 1 according to the first embodiment when generating data with specified attribute values.
- Data generation in variational autoencoder related technology, refers to outputting data from a decoder using latent variables as input.
- the information processing system 1 uses the attribute and attribute value 401 that the user wants to generate and the partial regression coefficient 209 obtained at the end of learning of MFCVAE2 (FIG. 4).
- a latent variable 204 is calculated.
- the information processing system 1 inputs the calculated latent variable 204 to the decoder 205 to generate data 405 having the attribute value 401 that is desired to be generated.
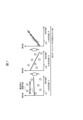
- FIG. 7 is a diagram for explaining the transition of the coefficient of determination during model learning of the information processing system 1 according to the first embodiment.
- latent variables are plotted on the horizontal axis
- attribute values are plotted on the vertical axis
- actual values of the attribute values are represented by points
- predicted values of the attribute values are represented by straight lines.
- the information processing system 1 adds an additional term to the loss function of MFCVAE2, including the coefficient of determination of a multiple regression model in which latent variables are explanatory variables and attribute values are objective functions, and trains MFCVAE2 so that the coefficient of determination becomes high. .
- the coefficient of determination is low at the early stage of learning ( Figure 7(a)), but as the number of epochs of learning progresses, it changes to the middle stage of learning ( Figure 7(b)) and then to the late stage ( Figure 7(c)). Accordingly, the coefficient of determination becomes high, and the accuracy of predicting attribute values based on latent variables becomes high.
- FIG. 8 is a block diagram showing the configuration of the information processing system 1 according to the first embodiment.
- the information processing system 1 includes a data storage section 602 , a feature extraction section 603 , an attribute value assignment section 608 , a data generation section 614 , and a data quality evaluation section 612 .
- the data storage unit 602 is a memory or storage, and receives and stores the reference data 201 and evaluation data 202.
- the data storage unit 602 may be a device included in the information processing system 1 or an external device to the information processing system 1.
- the feature extraction unit 603 executes model learning of MFCVAE2 based on the reference data 201 stored in the data storage unit 602 of MFCVAE2. Further, the feature amount extraction unit 603 performs attribute estimation of the evaluation data 202 stored in the data storage unit 602 of the MFCVAE2. Further, the feature extraction unit 603 generates data specifying attribute values.
- the feature extraction unit 603 includes a regression model fitness evaluation unit 604, a loss calculation unit 605, a model update unit 606, and an encoder unit 607. The processing function of the feature extraction unit 603 will be described later with reference to FIG.
- the attribute value assigning unit 608 estimates the attributes of the evaluation data 202 and outputs the attributes and attribute values 611 of the evaluation data 202.
- the attribute value assigning unit 608 includes an attribute value estimating unit 609 and an attribute and attribute value output unit 610. The processing function of the attribute value assigning unit 608 will be described later with reference to FIG.
- the data generation unit 614 inputs the attribute and attribute value 611 of the target data output by the attribute value assignment unit 608, generates data specifying the attribute value, and outputs the generated data 405.
- the data generation section 614 includes a latent variable calculation section 615, a decoding section 616, and a data output section 617. The processing functions of the data generation unit 614 will be described later with reference to FIG. 11.
- the data quality evaluation unit 612 evaluates the quality of the target data based on the attributes and attribute values 611 of the target data (reference data 201, evaluation data 202) output by the attribute value assigning unit 608, and outputs the data quality evaluation result 613. Output.
- the data quality evaluation unit 612 uses the attributes and attribute values 611 of the evaluation target data to evaluate the quality of the target data from the following viewpoints, for example.
- For quality evaluation see “Machine Learning Quality Management Guidelines,” National Institute of Advanced Industrial Science and Technology, [Retrieved August 1, 2020], Internet ⁇ URL: https://www.aist.go.jp/ aist_j/press_release/pr2020/pr20200630_2/pr20200630_2.html>.
- Sufficiency of data design Ensuring sufficient training data and test data for the various situations that the target system that uses the data must respond to.
- the feature amount extraction unit 603, the attribute value assignment unit 608, the data generation unit 614, and the data quality evaluation unit 612 may be realized on one computer, or may be realized on different computers. These forms of integration and distribution can be changed as appropriate.
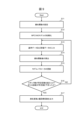
- FIG. 9 is a flowchart showing feature extraction processing according to the first embodiment.
- the feature extraction process is executed by the feature extraction unit 603 (FIG. 8) in response to a user instruction.
- the regression model fit evaluation unit 604 uses an index indicating the goodness of fit of the MFCVAE model (in this embodiment, a multiple regression model) with the latent variables of the reference data 201 as explanatory variables and the attribute values as objective variables. is set to the loss function Loss.
- the index set to the loss function Loss is the degree-of-freedom adjusted coefficient of determination R f,j 2 at the viewpoint j.
- step S12 the regression model fitness evaluation unit 604 initializes the MFCVAE model.
- step S13 the regression model fitness evaluation unit 604 inputs the reference data 201 and the evaluation data 202 to the MFCVAE model.
- step S13 the regression model fitness evaluation unit 604 may input at least the reference data 201 to the MFCVAE model.
- step S14 the loss calculation unit 605 calculates the function value of the loss function Loss based on equation (3).
- the regression model fitness evaluation unit 604 performs the following process as a step before the loss calculation unit 605 calculates the function value of the loss function Loss. That is, the regression model suitability evaluation unit 604 sets a multiple regression model for each attribute, using the latent variable output from the MFCVAE model as an explanatory variable and the attribute value as an objective variable in response to the input data in step S13. .
- the regression model suitability evaluation unit 604 calculates, for each attribute, the predicted value of the attribute value and the regression coefficient of the multiple regression model that minimizes the prediction error for the attribute value, from the latent variable and the attribute value.
- the regression model fitness evaluation unit 604 sets an index for each attribute that takes a smaller value as the fit to the multiple regression model for the latent variables and attribute values is better. Calculated as follows. After that, the loss calculation unit 605 calculates the function value of the loss function Loss in step S14.
- the regression model fitness evaluation unit 604 calculates an additional term of the loss function Loss using the reference data 201.
- the loss calculation unit 605 calculates the reconstruction error term and the regularization term using either or both of the reference data 201 and the evaluation data 202. This is because the additional term of the loss function Loss is based on the goodness of fit to the multiple regression model between latent variables and attribute values, so the additional term of the loss function Loss can be calculated only for reference data that includes attribute values. .
- step S15 the model updating unit 606 updates the parameters of the MFCVAE model by error backpropagation.
- step S16 the model update unit 606 determines whether a predetermined condition (the number of epochs exceeds a predetermined number, or the error between the estimated value by the MFCVAE model and the actual value is less than a predetermined value) is satisfied. .
- the model update unit 606 moves the process to step S17 when the predetermined condition is satisfied (step S16 YES), and returns the process to step S13 when the predetermined condition is not satisfied (step S16 NO).
- step S17 the encoder unit 607 inputs the evaluation data 202 to the encoder 203 of the trained MFCVAE model, and outputs the latent variable 204 and the partial regression coefficient 209.
- FIG. 10 is a flowchart showing attribute value assignment processing according to the first embodiment.
- the attribute value assignment process is executed by the attribute value assignment unit 608 (FIG. 8) in response to a user instruction.
- step S21 the attribute value estimation unit 609 calculates the predicted value 210 of the attribute value of the evaluation data 202 from the latent variable 204 and the partial regression coefficient 209 obtained from the feature quantity extraction unit 603 (encoder 203).
- step S22 the attribute and attribute value output unit 610 calculates each attribute value for each attribute from the attributes and attribute values of the reference data 201 and the evaluation data 202 for which the predicted value 210 of the attribute value was calculated in step S21. A histogram of the appearance frequency of is obtained (see FIG. 14 described later). Then, the attribute and attribute value output unit 610 calculates the probability that each attribute value appears in each attribute of the reference data 201 and the evaluation data 202 as a data content rate based on this histogram, and outputs the result.
- FIG. 11 is a flowchart showing data generation processing according to the first embodiment.
- the data generation process is executed by the data generation unit 614 (FIG. 8) in response to a user instruction.
- step S31 the data generation unit 614 receives input from the user of attributes and attribute values 401 to be generated.
- step S32 the latent variable calculation unit 615 calculates and outputs the latent variable 204 from the attributes and attribute values 401 and the partial regression coefficients 209 received as input in step S31.
- step S33 the decoding unit 616 (decoder 205) uses the latent variable 204 calculated in step S32 as input to reconstruct data 405 (for example, character data) having the attribute and attribute value 401 to be generated.
- step S34 the data output section 617 outputs the data 405 reconstructed by the decoding section 616 (decoder 205).
- the latent variable calculation unit 615 skips step S32 and calculates the value corresponding to this reference data 201 in step S33. It is assumed that the data is reconstructed data 405.
- FIG. 12 is a flowchart showing data quality evaluation processing according to the first embodiment.
- the data quality evaluation process is executed by the data quality evaluation unit 612 (FIG. 8) in response to a user instruction.
- step S41 the data quality evaluation unit 612 evaluates, for example, the above-mentioned (1) sufficiency of data design, (2) coverage of the data set, (3) regarding the attributes and attribute values 611 output by the attribute value assigning unit 608. ) Assess at least one aspect of the homogeneity of the dataset.
- step S42 the data quality evaluation unit 612 outputs the data quality evaluation result 613 of step S41.
- FIG. 13 is a diagram showing an output example 1 of attributes and attribute values (attributes and attribute values for data).
- FIG. 13 shows that the attribute value estimating unit 609 (FIG. 8) of the attribute value assigning unit 608 assigns an attribute value to the data to which the attribute value shown in FIG. 2 or 3 was not assigned, and outputs the attribute and attribute value. 610.
- FIG. 14 is a diagram showing an output example 2 of data, attributes, and attribute values (the number of data for each attribute and attribute value).
- FIG. 14 is an example of output obtained by changing the display method of FIG. 13.
- FIG. 14 is a histogram of attributes of the attribute value assigning unit 608 and attribute values for each attribute output by the attribute value output unit 610 (FIG. 8).
- (2) data set coverage and (3) data uniformity for each attribute it is possible to check, for example, the above-mentioned (2) data set coverage and (3) data uniformity for each attribute.
- (2) Coverage of the data set is considered to be satisfied if the attribute values of each attribute in the histogram in FIG. 14 are distributed over a predetermined wide range and each frequency is equal to or greater than a predetermined number.
- (3) Data uniformity is considered to be satisfied if the attribute values of each attribute in the histogram in FIG. 14 are evenly distributed over a predetermined wide range.
- Such analysis makes it possible to confirm missing data for attribute values.
- the histogram 1101 in FIG. 14 shows the frequency distribution of attribute 1.
- the histogram 1101 has a data distribution range that is wider or equivalent to that of the histograms 1102 and 1103, there are attribute values that do not exist in this distribution range. In this respect, it can be said that the histogram 1101 does not satisfy (2) coverage of the data set.
- the distribution of attribute values is not uniform. The uniformity of the distribution of attribute values can be determined based on statistical values representing variations such as variance and standard deviation of attribute values. In this respect, it can be said that the histogram 1101 does not satisfy (3) data uniformity.
- the histogram 1102 in FIG. 14 shows the frequency distribution of attribute 2.
- Histogram 1102 has a narrower data distribution range than histograms 1101 and 1103, and there are attribute values that do not exist in this distribution range. In this respect, it can be said that the histogram 1102 does not satisfy (2) coverage of the data set. Further, in the histogram 1102, the distribution of attribute values is not uniform. In this respect, it can be said that the histogram 1102 does not satisfy (3) data uniformity.
- a histogram 1103 in FIG. 14 shows the frequency distribution of attribute J.
- the histogram 1103 has a data distribution range that is wider than or equivalent to that of the histograms 1101 and 1102, there are attribute values that do not exist in this distribution range. In this respect, it can be said that the histogram 1103 does not satisfy (2) coverage of the data set.
- the distribution of attribute values in the histogram 1103 is not uniform compared to the histograms 1101 and 1102. In this respect, it can be said that the histogram 1102 does not satisfy (3) data uniformity.
- each graph in FIG. 14 may be a graph in which the vertical axis is the "data content rate at which each attribute value appears in each attribute of the reference data 201 and the evaluation data 202" instead of the "number of data.”
- Embodiment 1 the user explicitly specifies attributes of training data and test data and expresses them with quantitative attribute values, thereby enabling attribute analysis with high interpretability for the user. Therefore, it is easy to discover missing data in training data or test data, or characteristics of data that are often misclassified.
- the user interprets the attributes that the latent variable should have. Since the attributes can be specified explicitly, attribute analysis can be performed according to the user's intention.
- attributes can only be known qualitatively, making it impossible to compare attributes between data learned with different datasets or different models.
- attribute values are determined quantitatively, so it is possible to compare attributes between data learned using different data sets or different models.
- attribute values can be assigned with a smaller amount of data or learning than when estimating attribute values using a regression model using supervised learning.
- data generation in data generation, data can be generated by specifying attribute values for a plurality of attributes, so required data can be easily generated. Further, when generating data, if reference data corresponding to the specified attribute and attribute value exists, the data corresponding to this reference data is adopted as the reconstructed data. Thereby, data can be quickly reconstructed compared to the case where latent variables are calculated from attributes, attribute values, and partial regression coefficients, and data is reconstructed by decoding with a decoder.
- one information processing system 1 is used to perform model learning (FIGS. 4 and 9), attribute value assignment and output of the relationship between attributes and attribute values (FIGS. 5 and 10), and data quality evaluation processing ( An example of executing Fig. 12) is shown.
- model learning, attribute value assignment, and data quality evaluation processing may be executed in parallel by a plurality of information processing systems 1 (1-1, 1-2, . . . , 1-n) shown in FIG. 15.
- steps S13 to S16 may be executed using input data including different reference data 201 for each of the plurality of information processing systems 1. . Then, at least one of the plurality of information processing systems 1 merges and outputs the learning results of the MFCVAE model obtained by each information processing system 1.
- each information processing system 1 assigns attribute values to each input data and outputs the relationship between attributes and attribute values (step S21 ⁇ S23 (FIG. 10)) may be executed. Then, at least one of the plurality of information processing systems 1 merges and outputs the relationship between attributes and attribute values (FIG. 14) obtained by each information processing system 1.
- the latent variables are quantitatively determined, the calculation results can be merged even if each model is processed in parallel in a separate system, so multiple systems can perform model learning, attribute value assignment, and It becomes possible to distribute the load of each process for outputting the relationship between attributes and attribute values. Therefore, these processes can be completed and necessary data can be generated in a shorter time than conventionally.
- Embodiments can be applied to character recognition of handwritten characters as described above.
- a rotation speed label may be attached to vibration data of factory equipment.
- the premise is that the vibration data of factory equipment acquired in the past is not labeled with the rotation speed, so a new device that can measure the rotation speed will be introduced, and the vibration data of the factory equipment acquired in the past will be compared with the rotation speed. This is the case when adding a label.
- an impression evaluation of the song may be performed. It is possible to label the impression of an unknown song based on the impression of the song (fun, sad, happy, lonely, etc.) evaluated by the user in advance.
- the research fields of academic papers may be visualized. Based on papers for which the degree of relationship with each field is known in advance (the degree of relationship with the image recognition field is 30, the degree of relationship with the reinforcement learning field is 50, etc.), the relationship of unknown papers with each field is calculated. This is a case of estimating the degree.
- FIG. 16 is a hardware diagram showing the configuration of computer 1000.
- the information processing system 1 or each system in which the information processing system 1 such as the feature amount extraction unit 603, the attribute value assignment unit 608, the data generation unit 614, and the data quality evaluation unit 612 is distributed as appropriate may be realized by the computer 1000. Ru.
- the computer 1000 includes a processor 1001 including a CPU, a main storage device 1002, an auxiliary storage device 1003, a network interface 1004, an input device 1005, and an output device 1006, which are interconnected via an internal communication line 1009 such as a bus. Be prepared.
- the processor 1001 controls the overall operation of the computer 1000.
- the main storage device 1002 is composed of, for example, a volatile semiconductor memory, and is used as a work memory of the processor 1001.
- the auxiliary storage device 1003 is an example of a non-temporary storage medium, and is composed of a large-capacity nonvolatile storage device such as a hard disk device, SSD (Solid State Drive), or flash memory, and stores various programs and data for a long period of time. used for holding.
- An executable program 1100 stored in the auxiliary storage device 1003 is loaded into the main storage device 1002 when the computer 1000 is started or when necessary, and the processor 1001 executes the executable program 1100 loaded into the main storage device 1002. This realizes a system that executes various processes.
- executable program 1100 may be recorded on a non-temporary recording medium, read from the non-temporary recording medium by a medium reading device, and loaded into the main storage device 1002.
- executable program 1100 may be obtained from an external computer via a network and loaded into main storage 1002.
- the network interface 1004 is an interface device for connecting the computer 1000 to each network in the system or for communicating with other computers.
- the network interface 1004 includes, for example, a NIC (Network Interface Card) such as a wired LAN (Local Area Network) or a wireless LAN.
- NIC Network Interface Card
- wired LAN Local Area Network
- wireless LAN Wireless Local Area Network
- the input device 1005 includes a keyboard, a pointing device such as a mouse, and is used by the user to input various instructions and information to the computer 1000.
- the output device 1006 includes, for example, a display device such as a liquid crystal display or an organic EL (Electro Luminescence) display, and an audio output device such as a speaker, and is used to present necessary information to the user when necessary.
- a display device such as a liquid crystal display or an organic EL (Electro Luminescence) display
- an audio output device such as a speaker
- the present invention is not limited to the embodiments described above, and includes various modifications and equivalent configurations within the scope of the appended claims.
- the embodiments described above have been described in detail to explain the present invention in an easy-to-understand manner, and the present invention is not necessarily limited to having all the configurations described.
- a part of the configuration of one embodiment may be replaced with the configuration of another embodiment.
- the configuration of one embodiment may be added to the configuration of another embodiment.
- other configurations may be added, deleted, or replaced with some of the configurations of each embodiment.
- each of the configurations, functions, processing units, processing means, etc. described above may be partially or entirely realized in hardware by, for example, designing an integrated circuit.
- the functions may be implemented in software by having a processor interpret and execute programs that implement the respective functions.
- Information such as programs, tables, files, etc. that realize each function is stored in storage devices such as memory, hard disks, SSDs (Solid State Drives), or non-standard storage devices such as IC (Integrated Circuit) cards, SD cards, and DVDs (Digital Versatile Discs). It can be stored on a temporary storage medium.
- storage devices such as memory, hard disks, SSDs (Solid State Drives), or non-standard storage devices such as IC (Integrated Circuit) cards, SD cards, and DVDs (Digital Versatile Discs). It can be stored on a temporary storage medium.
- control lines and information lines shown are those considered necessary for explanation, and do not necessarily show all control lines and information lines necessary for implementation. In reality, almost all configurations can be considered interconnected.
Landscapes
- Engineering & Computer Science (AREA)
- Theoretical Computer Science (AREA)
- Physics & Mathematics (AREA)
- Data Mining & Analysis (AREA)
- General Health & Medical Sciences (AREA)
- Biomedical Technology (AREA)
- Biophysics (AREA)
- Computational Linguistics (AREA)
- Life Sciences & Earth Sciences (AREA)
- Evolutionary Computation (AREA)
- Artificial Intelligence (AREA)
- Molecular Biology (AREA)
- Computing Systems (AREA)
- General Engineering & Computer Science (AREA)
- General Physics & Mathematics (AREA)
- Mathematical Physics (AREA)
- Software Systems (AREA)
- Health & Medical Sciences (AREA)
- Machine Translation (AREA)
Abstract
学習モデルの訓練データ及びテストデータの属性と属性値の解釈性を高める。このため、データの複数の属性に属性値が付与されている基準データを含んだ入力データの入力に対してMFCVAEから出力された潜在変数を説明変数とし、属性値を目的変数とする回帰モデルを属性毎に設定する。潜在変数と属性値とから、属性値に対する予測誤差が最小となる属性値の予測値及び回帰モデルの回帰係数を属性毎に算出する。属性毎の予測値及び回帰係数に基づいて、潜在変数及び属性値の回帰モデルへの適合が良いほど小さい値を取る属性毎の指標に基づく追加項を追加したMFCVAEの損失関数の関数値を算出する。関数値に基づく誤差逆伝搬によってMFCVAEのモデルパラメータを更新する。以上のようにMFCVAEのモデル学習を実行する。
Description
本発明は、情報処理方法、情報処理システム、及び情報処理プログラムに関する。
AI(Artificial Intelligence)モデルの品質は、利用するデータの品質に依存する。AIモデルの品質を保証するためには、AIモデルを構築する際の訓練データや推論を行う際のテストデータが有する属性に関する情報を評価することが有用である。そのために、変分オートエンコーダ技術を用いて、学習モデルのエンコーダから潜在変数(特徴量)を抽出し、データの属性情報の内容を明らかにしたり、お互い類似する属性情報をもつデータを抽出したりすること等が行われている。
例えば特許文献1では、訓練データから同一のセマンティック特徴に対応する3つの画像を抽出し、3つの画像の各画像について、セマンティック特徴に対応する潜在変数の損失関数を最小化するように変分オートエンコーダのパラメータを更新する。これにより、同一のセマンティック特徴を有する異なる画像の識別性を高めている。
また例えば非特許文献1では、各潜在変数が入力値に対して与える情報が一意となるように潜在変数の独立性を高めることで、潜在変数の変化に対応する属性の内容やその大きさの変化の解釈性を高めている。その結果、例えば手書き文字データにおいて、ある潜在変数の変化に対して、文字の角度が左斜めから右斜めへ連続変化することが分かる。
また例えば非特許文献2では、直行する基底の線形結合で潜在変数を表現し、学習によって得られた基底の係数とデータの属性の変化とを対応付けることで、基底の係数の変化に対応する属性の内容やその大きさの変化の解釈性を高めている。その結果、例えば顔画像データにおいて、ある基底の係数の変化に対して、髪の毛の色が金色から黒色に連続変化することが分かる。
Shuyang Gao,Rob Brekelmans,Greg Ver Steeg,Aram Galstyan,"Auto-Encoding Total Correlation Explanation," Proceedings of the 22nd International Conference on Artificial Intelligence and Statistics pages 1157-1166.,[online], Proceedings of Machine Learning Research (PMLR) 2019.,[令和4年8月1日検索],インターネット<URL:https://arxiv.org/abs/1802.05822>
Jin-Young Kim, Sung-Bae Cho,"BasisVAE: Orthogonal Latent Space for Deep Disentangled Representation," [online], International Conference on Learning Representations (ICLR) 2020.,[令和4年8月1日検索],インターネット<URL:https://arxiv.org/abs/1802.05822>
しかしながら上述の従来技術では、潜在変数と、それに対応する属性や属性値がユーザの解釈に依存し、定性的にしか評価できないため、データの属性と属性値の解釈性が依然として低いという問題があった。
本願の開示の一側面では、訓練データやテストデータの潜在変数に対応する属性と属性値の解釈性を高めることを目的とする。
本願の開示の一側面では、処理部と記憶部とを有する情報処理システムが実行する情報処理方法であって、前記処理部が、データの複数の属性に属性値が付与されている基準データを含んだ入力データを、該データの前記複数の属性のそれぞれに関する潜在変数を出力するMFCVAE(Multi-Facet Clustering Variational Auto-Encoder)に入力する第1ステップと、前記入力データの入力に対して前記MFCVAEから出力された前記潜在変数を説明変数とし、前記属性値を目的変数とする回帰モデルを前記属性毎に設定する第2ステップと、前記潜在変数と前記属性値とから、該属性値に対する予測誤差が最小となる前記属性値の予測値及び前記回帰モデルの回帰係数を前記属性毎に算出する第3ステップと、前記第3ステップによって算出された前記属性毎の前記予測値及び前記回帰係数に基づいて、前記潜在変数及び前記属性値の前記回帰モデルへの適合が良いほど小さい値を取る指標を前記属性毎に算出する第4ステップと、前記MFCVAEによるデータ再構成の誤差を表す再構成誤差項と、前記潜在変数の分布に制約を与える正則化項と、を有する前記MFCVAEの損失関数に、前記属性毎の前記指標に基づく追加項を追加した損失関数の関数値を算出する第5ステップと、前記第5ステップによって算出された前記関数値に基づく誤差逆伝搬によって前記MFCVAEのモデルパラメータを更新する第6ステップと、を実行し、前記第1ステップから前記第6ステップまでを、前記予測誤差又はエポック回数が所定条件を充足するまでこの順序で繰り返すことで前記MFCVAEのモデル学習を実行する、ことを特徴とする。
本願の開示の一側面によれば、学習モデルの訓練データやテストデータの属性と属性値の解釈性を高めることができる。前述した以外の課題、構成及び効果は、以下の実施形態の説明により明らかにされる。
以下、図面を参照して本願の開示に係る実施形態を説明する。実施形態は、図面も含めて本願を説明するための例示である。実施形態では、説明の明確化のため、適宜、省略及び簡略化がされている。特に限定しない限り、実施形態の構成要素は単数でも複数でもよい。また、ある実施形態と他の実施形態を組み合わせた形態も、本願に係る実施形態に含まれる。
同一又は類似の構成要素には、同一の符号を付与し、既出に対する後出の実施形態での説明を省略する、又は差分を中心とした説明のみを行う場合がある。また、同一又は類似の構成要素が複数ある場合には、同一の符号に異なる添字を付して説明する場合がある。また、これらの複数の構成要素を区別する必要がない場合には、添字を省略して説明する場合がある。
以下の実施形態では、各種情報をテーブル形式で説明するが、各種情報はテーブル形式以外のデータ形式であってもよい。また、例えば、「XX情報」「XXテーブル」「XXリスト」「XXキュー」等の各種呼称は、これらは互換可能である。例えば「XXテーブル」は、「XXリスト」と呼んでもよい。また、識別情報について説明する際に、「識別情報」「識別子」「名」「ID」「番号」等の表現を用いるが、これらは互換可能である。
(従来技術の問題点)
実施形態の説明に先立ち、実施形態が前提とする従来技術(MFCVAE:Multi-Facet Clustering Variational Autoencoders)の問題点について説明する。図1は、従来技術の問題点を説明するための図である。MFCVAEは、複数の観点での潜在変数を出力可能な、拡張された変分オートエンコーダ(VAE:Variational Auto-Encoder)である。変分オートエンコーダとは、ニューラルネットワークを使い、潜在変数の空間として確率分布を仮定した生成モデルである。MFCVAEにおける観点とは、MFCVAEが出力する潜在変数(ベクトル)の種類であり、文字データの例では「文字の種類」「字形(太さ、角度等)」等が該当する。
実施形態の説明に先立ち、実施形態が前提とする従来技術(MFCVAE:Multi-Facet Clustering Variational Autoencoders)の問題点について説明する。図1は、従来技術の問題点を説明するための図である。MFCVAEは、複数の観点での潜在変数を出力可能な、拡張された変分オートエンコーダ(VAE:Variational Auto-Encoder)である。変分オートエンコーダとは、ニューラルネットワークを使い、潜在変数の空間として確率分布を仮定した生成モデルである。MFCVAEにおける観点とは、MFCVAEが出力する潜在変数(ベクトル)の種類であり、文字データの例では「文字の種類」「字形(太さ、角度等)」等が該当する。
なお、変分オートエンコーダは、文献1「Diederik P Kingma, Max Welling,“Auto-Encoding Variational Bayes,” May 2014.,[令和4年8月1日検索],インターネット<URL:https://arxiv.org/abs/1312.6114>」に開示されている。MFCVAEは、文献2「Fabian Falck et.al, “Multi-Facet Clustering Variational Autoencoders, Oct. 2021.[令和4年8月1日検索],インターネット<URL:https://arxiv.org/abs/2106.05241>」に開示されている。
以下、特徴とは、データを特徴づける情報(属性、属性値、潜在変数等)である。特徴量とは、定量的に表現可能な特徴の値である。属性とは、データを特徴づける性質(文字データの例では「太さ」「傾き」「ノイズ量」「文字の砕け度合い」等)である。属性値とは、属性の度合いを示す値(文字データの例では属性「太さ」に対する「1mm」、属性「傾き」に対する「10度」、属性「ノイズ量」に対する「10%」、属性「文字の砕け度合い」に対する「レベル2」等)である。属性値は、連続値でも離散値でもよい。潜在変数とは、変分オートエンコーダ関連技術において、エンコーダから出力される特徴量である。変分オートエンコーダ関連技術とは、VAEやMFCVAEを含む変分ベイズアルゴリズムを有する変分オートエンコーダ技術全般を指す。
MFCVAEは、一つの潜在変数の変化に対して、複数の属性の属性値が変化する。このため、ある潜在変数の変化に対して変化する属性の対応付けが困難であった。図1を参照して、手書き文字の場合について属性及び属性値を例に説明する。
図1に示すように、潜在変数1を横軸、潜在変数2を縦軸に取った座標系において、潜在変数1及び潜在変数2のグループ101は、属性「太さ」が細い文字に対応した潜在変数のグループである。グループ102は、属性「太さ」が中程度の文字に対応した潜在変数のグループである。グループ103は、属性「太さ」が太い文字に対応した潜在変数のグループである。グループ104は、属性「ノイズ量」が少ない文字に対応した潜在変数のグループである。グループ105は、属性「ノイズ量」が中程度の文字に対応した潜在変数のグループである。グループ106は、属性「ノイズ量」が多い文字に対応した潜在変数のグループである。ここで属性「太さ」の「太い」「中程度」「細い」、及び属性「ノイズ量」の「多い」「中程度」「少ない」は例示的表現に過ぎず、定量的な表現又はこれに付与したラベルの一例である。
図1に示す例では、潜在変数の変化に対して、全ての属性値が一様に増加あるいは減少するものではない。よって、ある潜在変数の変化に対する属性値の変化の対応付けが困難である。例えば図1では、潜在変数1の値が小さいグループ101からグループ103、グループ102へと二段階にわたり増加すると、属性「太さ」の属性値が「細い」、「太い」、「中程度」と変化する。しかし、潜在変数1の値の一様な増加に対して、属性値の変化が一様でない。潜在変数1の変化に関する属性「ノイズ量」の属性値の変化も同様である。その結果、ある潜在変数の変化に対する属性値の変化の解釈がしにくい。
一方、潜在変数2の値が小さいグループ103からグループ102、グループ101へと二段階にわたり増加すると、属性「太さ」の属性値が「太い」、「中程度」、「細い」と変化するように、潜在変数1の値の一様な増加に対して、属性値が一様に減少する。潜在変数2に関する属性「ノイズ量」の属性値の変化も同様である。その結果、潜在変数の変化に対して、属性値が一様に減少するため、ある潜在変数の変化に対する属性値の変化の解釈がしやすい。
(基準データと評価データ)
先ず、文字データの基準データと評価データを説明する。図2は、基準データと評価データ(文字データの場合)を示す図である。図2において、各行をデータという。それぞれのデータに対して、「文字の種類」「太さ」「傾き」といった各属性について、属性値が格納されているデータと格納されていないデータがある。「文字の種類」は該当の文字のイメージデータである。
先ず、文字データの基準データと評価データを説明する。図2は、基準データと評価データ(文字データの場合)を示す図である。図2において、各行をデータという。それぞれのデータに対して、「文字の種類」「太さ」「傾き」といった各属性について、属性値が格納されているデータと格納されていないデータがある。「文字の種類」は該当の文字のイメージデータである。
ある属性において、属性値が格納されているデータが、その属性に関する基準データであり、属性値が格納されていないデータが、その属性に関する評価データである。基準データは、評価データの属性値を求めるために用いられる属性値が既知のデータである。評価データは、属性値が未知の属性に関して属性値を求めて付与される対象のデータである。
文字データの場合、手書き文字データに対して、一般に「A」や「B」といった文字の種類の属性値を付与するのは容易であるが、「太さ」や「傾き」などの属性値を付与するのは容易ではない。そこでゴシック体といった「太さ」や「傾き」といった属性の属性値が変更可能である活字を用いて、変分オートエンコーダのモデルを学習する。
図2の例では「太さ」や「傾き」等の属性値を持つ「データ属性」“活字”の「データ番号」“1”“2”“3”のデータが基準データ、属性値を持たない「データ属性」“手書き文字”「データ番号」“4”“5”のデータが評価データとなる。より一般には、基準データは活字及び手書き文字を含み、評価データは手書き文字を含む。
次に、一般データの基準データと評価データを説明する。図3は、基準データと評価データ(一般データの場合)を示す図である。図2では、データ属性毎に基準データと評価データが分かれていた。図3では基準データと評価データを一般化し、それぞれのデータに対して、各属性に関して属性値が格納されているデータが該当の属性に関する基準データであり、各属性に関して属性値が格納されていないデータが該当の属性に関する評価データである。
「属性1」に関して、基準データは「データ番号」“1”“2”“3”“4”のデータであり、評価データは「データ番号」“5”のデータである。同様に、「属性2」に関して、基準データは「データ番号」“1”“2”“5”のデータであり、評価データは「データ番号」“3”“4”のデータである。
以下の実施形態の目的は、各属性において、基準データの属性値を利用して評価データの属性値を推定することである。
[実施形態1]
(モデル学習時及びデータ再構成時の動作)
図4は、実施形態1に係る情報処理システム1のモデル学習時の動作を説明するための図である。本実施形態では、属性に対して属性値が予め付与された基準データ201を用い、基準データ201の潜在変数を基に属性値を重回帰モデルで予測できるように、変分オートエンコーダ関連技術において新規の損失関数を用いてモデル学習を実行する。
(モデル学習時及びデータ再構成時の動作)
図4は、実施形態1に係る情報処理システム1のモデル学習時の動作を説明するための図である。本実施形態では、属性に対して属性値が予め付与された基準データ201を用い、基準データ201の潜在変数を基に属性値を重回帰モデルで予測できるように、変分オートエンコーダ関連技術において新規の損失関数を用いてモデル学習を実行する。
情報処理システム1は、MFCVAE2を有する。MFCVAE2は、エンコーダ203とデコーダ205とを含んで構成される。
MFCVAE2のモデル学習時には、エンコーダ203に入力されるデータ(訓練データセット)は、基準データ201のみを含むか、あるいは基準データ201及び評価データ202の両方を含む。エンコーダ203は、MFCVAE2の中間出力である潜在変数204を出力する。MFCVAE2は、潜在変数204を説明変数とし、属性値の正解値(正解ラベル)208を目的変数とする重回帰モデルを設定する。なお重回帰モデルに限らず、線形回帰モデル及び非線形回帰モデルの何れでもよい。重回帰モデルは、モデル計算の負荷が少ないという利点があることから、本実施形態では重回帰モデルを採用する。
情報処理システム1は、潜在変数204と属性値の正解値208とから、属性値の予測値と正解値との平均二乗誤差を最小化する偏回帰係数209及びその時の属性値の予測値210を求める。属性値の予測値210は、偏回帰係数209を各係数とする潜在変数204の一次結合として算出される。属性値の正解値208と属性値の予測値210とに基づいて、重回帰モデルへの適合(重回帰モデルの当てはまり)が良いほど小さい値を取る適合度を表す指標となり得る決定係数211や予測誤差212が求められる。決定係数211や予測誤差212は、重回帰モデルへの適合度を表す指標を含む損失関数213で学習される。このようにしてエンコーダ203が学習される。
潜在変数204は、デコーダ205に入力される。デコーダ205は、デコーダ205によって再構成された基準データ201である再構成基準データ206と、デコーダ205によって再構成された評価データ202である再構成評価データ207とを出力する。再構成評価データ207は、属性値が付与されたデータとなっている。
ここで、偏回帰係数209、損失関数213、決定係数211、予測誤差212を説明する。
従来技術のMFCVAEでは、目的関数である変分下限(Evidence Lower Bound(ELBO))は、式(1)のように表される。従来手法のMFCVAEでは、式(1)の変分下限の符号をマイナスにした負の損失関数が最小化されるようにMFCVAEモデルのパラメータが学習される(上述の文献2参照)。式(1)において“D”は訓練データセット、“x”が訓練データセットに含まれる訓練データ、“z→”は潜在変数、“θ”はエンコーダのパラメータ、“φ”はデコーダのパラメータ、“KL(A|B)”は分布Aと分布BのKLダイバージェンスを表す。

これに対して本実施形態では、観点jでの自由度調整済み決定係数をRf,j
2、各自由度調整済み決定係数Rf,j
2の重み係数をγj(>0)として、式(2)のように目的関数を設定する。式(2)の右辺は、式(1)の右辺の期待値E[*]のカッコ内の式に第3項γjRf,j
2が追加されたものである。
なお、式(2)の第3項では、自由度調整済み決定係数Rf,j
2ではなく、後述の決定係数Rj
2が採用されてもよい。決定係数Rj
2、自由度調整済み決定係数Rf,j
2は、決定係数211の一例である。

ここで、式(2)の期待値E[*]のカッコ内の第1項は、MFCVAEによるデータ再構成の誤差を表す再構成誤差項である。式(2)の期待値E[*]のカッコ内の第2項は、MFCVAEの潜在変数のバラつきを抑制する等の潜在変数の分布に制約を与える正則化項である。式(2)の期待値E[*]のカッコ内の第3項は、属性毎の潜在変数及び属性値に対する重回帰モデルへの適合が良いほど小さい値を取る指標に基づく追加項である。
損失関数213(損失関数Lossと表す)は負の目的関数であるから、式(2)の目的関数を用いて式(3)のように表される。

本実施形態では、損失関数Lossが最小化、すなわち決定係数Rf,i
2が最大化されるように、MFCVAEモデルのパラメータが学習される。
次に、観点jの決定係数Rj
2、及び観点jの自由度調整済み決定係数Rf,j
2の算出方法を説明する。
データ数がN個、データの属性の種類がj=1,2,…,JのJ個、ある属性jにおける潜在変数の次元数をKjとする。またデータの各属性がMFCVAEのJ個の各観点と一対一に対応しているものとする。インデックス番号nであるデータnに属性jの属性値が付与されていれば、データnは属性jにおいて基準データである。一方データnに属性jの属性値が付与されていなければ、データnは属性jにおいて評価データである。
ある属性jに関する基準データのインデックスの集合をBj、集合Bjの要素数をMjとする。集合Bj={bj,1,bj,2,…,bj,Mj}とする。ある属性jに関する基準データnにおける潜在変数をzn,j={zn,j,1,zn,j,2,…,zn,j,Kj}、属性値の正解値をyn,j、潜在変数zn,jを説明変数とする。また、属性値を目的変数とした重回帰モデルの偏回帰係数をwj={wj,0,wj,1,wj,2,…,wj,Kj}T、属性値の予測値をy^n,jとする。属性値の予測値y^n,jは、式(4)のように表される。

ただし、式(5)のように潜在変数ベクトルZn,jを定義した。

ある属性jに関する属性値yn,j(ただしn∈Bj)と重回帰モデルによる属性値の予測値y^n,jとの予測誤差である平均二乗誤差MSEjは、式(6)のように表される。平均二乗誤差MSEjは、予測誤差212の一例である。

ここで平均二乗誤差MSEjを最小化するwjは、式(6)の右辺をwjで偏微分してゼロとおく(∇wj=0)ことで、式(7)のように、偏回帰係数wjは、潜在変数Zjと属性値yjの関数となる。偏回帰係数wjは、偏回帰係数209の一例である。

ただし式(7)において、潜在変数Zjと属性値yjを、式(8)と式(9)に示すようにおいた。


なお、ある属性jに関する属性値yn,j(ただしn∈Bj)と重回帰モデルによる属性値の予測値y^n,jとの予測誤差は、平均二乗誤差に限らず、平均誤差、平均絶対誤差、平均平方二乗誤差、平均誤差率、平均絶対誤差率等を採用することもできる。
ある属性jに関する決定係数Rj
2は、説明変数が目的変数をどれくらい説明しているかを表す。決定係数Rj
2は、属性値の平均値y ̄n,jを用いて式(10)のように表される。

また決定係数は、説明変数の数が増えるほど1に近づくという性質を持っているため、説明変数の数が多い場合には、この性質を補正した自由度調整済み決定係数Rf,j
2が採用されてもよい。自由度調整済み決定係数Rf,j
2は、説明変数の数をpとし、基準データのサンプル数はMjであるので、式(11)のように表される。

なお、重み係数γjは、再構成誤差項、正則化項、及び決定係数Rj
2(Rf,j
2)の絶対値の比較から求めることができる。具体的には、決定係数Rj
2に対する重み係数γjは、|γjRj
2|のオーダーが式(2)の右辺の期待値E[*]のカッコ内の式の再構成誤差項と正則化項の各絶対値のオーダーと同じになるように定められる。同様に、自由度調整済み決定係数Rf,j
2に対する重み係数γjも、|γjRf,j
2|のオーダーが、式(2)の右辺の期待値E[*]のカッコ内の式の再構成誤差項と正則化項の各絶対値のオーダーと同じになるように定められる。
基準データ201及び評価データ202の再構成時には、デコーダ205は、基準データ201及び評価データ202の属性及び属性値(評価データ202の場合は付与された属性値)と、エンコーダ203の学習の最後のエポックで得た偏回帰係数209を用いる。そして、基準データ201及び評価データ202の属性及び属性値と、偏回帰係数209とを用いて、式(4)から、潜在変数(潜在変数ベクトルZn,j)を算出する。そして、デコーダ205は、算出した潜在変数を入力として、入力された基準データ201及び評価データ202をそれぞれ再構成した再構成基準データ206及び再構成評価データ207を出力する。
(属性値付与時の動作)
図5は、実施形態1に係る情報処理システム1の評価データ202に対する属性値付与時の動作を説明するための図である。情報処理システム1は、評価データ202への属性値付与時には、先ず評価データ202を学習済みのエンコーダ203に入力し、潜在変数204を得る。情報処理システム1は、MFCVAE2(図4)の学習の最終エポックで得た偏回帰係数209を用い、属性値の予測値210を、偏回帰係数209を各係数とする潜在変数204の一次結合式で算出する。情報処理システム1は、属性値の予測値210を評価データ202に付与する。
図5は、実施形態1に係る情報処理システム1の評価データ202に対する属性値付与時の動作を説明するための図である。情報処理システム1は、評価データ202への属性値付与時には、先ず評価データ202を学習済みのエンコーダ203に入力し、潜在変数204を得る。情報処理システム1は、MFCVAE2(図4)の学習の最終エポックで得た偏回帰係数209を用い、属性値の予測値210を、偏回帰係数209を各係数とする潜在変数204の一次結合式で算出する。情報処理システム1は、属性値の予測値210を評価データ202に付与する。
(データ生成時の動作)
図6は、実施形態1に係る情報処理システム1の属性値を指定したデータ生成時の動作を説明するための図である。データ生成とは、変分オートエンコーダ関連技術において、潜在変数を入力として、デコーダからデータを出力することをいう。情報処理システム1は、生成させたい属性値401を持つデータ405の生成時には、ユーザが生成させたい属性及び属性値401と、MFCVAE2(図4)の学習の最後で得た偏回帰係数209とから潜在変数204を算出する。そして情報処理システム1は、算出した潜在変数204をデコーダ205に入力することで、生成させたい属性値401を持つデータ405を生成する。
図6は、実施形態1に係る情報処理システム1の属性値を指定したデータ生成時の動作を説明するための図である。データ生成とは、変分オートエンコーダ関連技術において、潜在変数を入力として、デコーダからデータを出力することをいう。情報処理システム1は、生成させたい属性値401を持つデータ405の生成時には、ユーザが生成させたい属性及び属性値401と、MFCVAE2(図4)の学習の最後で得た偏回帰係数209とから潜在変数204を算出する。そして情報処理システム1は、算出した潜在変数204をデコーダ205に入力することで、生成させたい属性値401を持つデータ405を生成する。
なお、データ生成の際に、指定された属性及び属性値401に該当する基準データ201が存在する場合には、この基準データ201に対応するデータを再構成したデータ405として採用する。指定された属性及び属性値401に該当する基準データ201が存在しない場合に、生成させたい属性及び属性値401と、偏回帰係数209とから潜在変数204を算出する。そして、算出した潜在変数204をデコーダ205に入力することで、生成させたい属性値401を持つデータ405を生成する。
(モデル学習時の決定係数の推移)
図7は、実施形態1に係る情報処理システム1のモデル学習時の決定係数の推移を説明するための図である。図7のグラフでは、潜在変数を横軸、属性値を縦軸に取り、属性値の実際の値を点で表し、属性値の予測値を直線で表している。情報処理システム1は、MFCVAE2の損失関数に、潜在変数を説明変数、属性値を目的関数とする重回帰モデルの決定係数を含む追加項を追加し、決定係数が高くなるようにMFCVAE2を学習させる。その結果、学習の初期では決定係数は低い(図7(a))が、学習のエポック数が進行して学習の中期(図7(b))、後期(図7(c))と推移するに従って、決定係数は高くなり、潜在変数に基づく属性値の予測精度が高くなる。
図7は、実施形態1に係る情報処理システム1のモデル学習時の決定係数の推移を説明するための図である。図7のグラフでは、潜在変数を横軸、属性値を縦軸に取り、属性値の実際の値を点で表し、属性値の予測値を直線で表している。情報処理システム1は、MFCVAE2の損失関数に、潜在変数を説明変数、属性値を目的関数とする重回帰モデルの決定係数を含む追加項を追加し、決定係数が高くなるようにMFCVAE2を学習させる。その結果、学習の初期では決定係数は低い(図7(a))が、学習のエポック数が進行して学習の中期(図7(b))、後期(図7(c))と推移するに従って、決定係数は高くなり、潜在変数に基づく属性値の予測精度が高くなる。
(実施形態1に係る情報処理システム1の構成)
図8は、実施形態1に係る情報処理システム1の構成を示すブロック図である。情報処理システム1は、データ記憶部602、特徴量抽出部603、属性値付与部608、データ生成部614、及びデータ品質評価部612を有する。
図8は、実施形態1に係る情報処理システム1の構成を示すブロック図である。情報処理システム1は、データ記憶部602、特徴量抽出部603、属性値付与部608、データ生成部614、及びデータ品質評価部612を有する。
データ記憶部602は、メモリ又はストレージであり、基準データ201と評価データ202の入力を受け付け、蓄積する。データ記憶部602は、情報処理システム1に含まれる装置であっても、情報処理システム1の外部装置であっても何れでもよい。
特徴量抽出部603は、MFCVAE2のデータ記憶部602に格納されている基準データ201を元に、MFCVAE2のモデル学習を実行する。また特徴量抽出部603は、MFCVAE2のデータ記憶部602に格納されている評価データ202の属性推定を行う。また特徴量抽出部603は、属性値を指定したデータ生成を行う。特徴量抽出部603は、回帰モデル適合度評価部604、損失算出部605、モデル更新部606、及びエンコーダ部607を有する。特徴量抽出部603の処理機能は、図9を参照して後述する。
属性値付与部608は、評価データ202の属性推定を行い、評価データ202の属性及び属性値611を出力する。属性値付与部608は、属性値推定部609と、属性及び属性値出力部610とを有する。属性値付与部608の処理機能は、図10を参照して後述する。
データ生成部614は、属性値付与部608によって出力された対象データの属性及び属性値611を入力として、属性値を指定したデータ生成を行い、生成したデータ405を出力する。データ生成部614は、潜在変数算出部615、デコード部616、及びデータ出力部617を有する。データ生成部614の処理機能は、図11を参照して後述する。
データ品質評価部612は、属性値付与部608によって出力された対象データ(基準データ201、評価データ202)の属性及び属性値611に基づいて対象データの品質評価を行い、データ品質評価結果613を出力する。
データ品質評価部612は、評価の対象データの属性及び属性値611を用いて、一例として、下記のような観点で対象データの品質評価を行う。品質評価については“機械学習品質マネジメントガイドライン”、国立研究開発法人産業技術総合研究所、[令和4年8月1日検索]、インターネット<URL:https://www.aist.go.jp/aist_j/press_release/pr2020/pr20200630_2/pr20200630_2.html>を参照すればよい。
(1)データ設計の十分性:データを用いる対象のシステムが対応すべき様々な状況に対して十分な訓練データやテストデータを確保していること。
(2)データセットの被覆性:基準を定めて網羅したそれぞれのケースに対してそれぞれのケースに対応する入力の可能性に対して抜け漏れなく、レアケース及び通常ケースそれぞれに正しく推論できる学習に必要な十分な量のデータが与えられていること。
(3)データの均一性:全体として推論性能の期待値を最大化するように、訓練データを偏り無く用意すること。
(1)データ設計の十分性:データを用いる対象のシステムが対応すべき様々な状況に対して十分な訓練データやテストデータを確保していること。
(2)データセットの被覆性:基準を定めて網羅したそれぞれのケースに対してそれぞれのケースに対応する入力の可能性に対して抜け漏れなく、レアケース及び通常ケースそれぞれに正しく推論できる学習に必要な十分な量のデータが与えられていること。
(3)データの均一性:全体として推論性能の期待値を最大化するように、訓練データを偏り無く用意すること。
なお、データ品質評価部612の処理機能は、図12を参照して後述する。
また、特徴量抽出部603、属性値付与部608、データ生成部614、及びデータ品質評価部612は、1つのコンピュータ上に実現されていてもよいし、異なるコンピュータ上に実現されてもよく、これらの統合分散の形態は適宜変更可能である。
(実施形態1に係る特徴量抽出処理)
図9は、実施形態1に係る特徴量抽出処理を示すフローチャートである。特徴量抽出処理は、特徴量抽出部603(図8)によって、ユーザ指示を契機として実行される。
図9は、実施形態1に係る特徴量抽出処理を示すフローチャートである。特徴量抽出処理は、特徴量抽出部603(図8)によって、ユーザ指示を契機として実行される。
先ずステップS11では、回帰モデル適合度評価部604は、基準データ201の潜在変数を説明変数とし、属性値を目的変数としたMFCVAEモデル(本実施形態では重回帰モデル)の当てはまりの良さを示す指標を損失関数Lossに設定する。損失関数Lossに設定される指標は、本実施形態では、観点jでの自由度調整済み決定係数Rf,j
2である。
次にステップS12では、回帰モデル適合度評価部604は、MFCVAEモデルの初期化を行う。次にステップS13では、回帰モデル適合度評価部604は、基準データ201及び評価データ202をMFCVAEモデルに入力する。ステップS13では、回帰モデル適合度評価部604は、少なくとも基準データ201をMFCVAEモデルに入力すればよい。
次にステップS14では、損失算出部605は、式(3)に基づいて損失関数Lossの関数値を算出する。回帰モデル適合度評価部604は、損失算出部605による損失関数Lossの関数値の算出の前段階として、次の処理を行う。すなわち、回帰モデル適合度評価部604は、ステップS13の入力データの入力に対してMFCVAEモデルから出力された潜在変数を説明変数とし、属性値を目的変数とする重回帰モデルを属性毎に設定する。次に、回帰モデル適合度評価部604は、潜在変数と属性値とから、属性値に対する予測誤差が最小となる属性値の予測値及び重回帰モデルの回帰係数を属性毎に算出する。次に、回帰モデル適合度評価部604は、算出された属性毎の予測値及び回帰係数に基づいて、潜在変数及び属性値に対する重回帰モデルへの適合が良いほど小さい値を取る指標を属性毎に算出する。その後、損失算出部605は、ステップS14で、損失関数Lossの関数値を算出する。
なお、入力データが基準データ201及び評価データ202を含む場合、ステップS14では、回帰モデル適合度評価部604は、損失関数Lossの追加項を、基準データ201を用いて計算する。一方、損失算出部605は、再構成誤差項及び正則化項を、基準データ201及び評価データ202の何れか一方又は両方を用いて計算する。これは、損失関数Lossの追加項は、潜在変数と属性値との重回帰モデルへの適合度に基づくことから、属性値を含む基準データのみ損失関数Lossの追加項を計算可能なためである。
次にステップS15では、モデル更新部606は、誤差逆伝搬によりMFCVAEモデルのパラメータを更新する。次にステップS16では、モデル更新部606は、所定条件(エポック数が所定回数を超えたか、又はMFCVAEモデルによる推定値と実際の値の誤差が所定値を下回った)が充足されたかを判定する。モデル更新部606は、所定条件が充足された場合(ステップS16YES)にステップS17に処理を移し、所定条件が充足されていない場合(ステップS16NO)にステップS13に処理を戻す。
ステップS17では、エンコーダ部607は、学習済みのMFCVAEモデルのエンコーダ203に評価データ202を入力し、潜在変数204と偏回帰係数209を出力する。
(実施形態1に係る属性値付与処理)
図10は、実施形態1に係る属性値付与処理を示すフローチャートである。属性値付与処理は、属性値付与部608(図8)によって、ユーザ指示を契機として実行される。
図10は、実施形態1に係る属性値付与処理を示すフローチャートである。属性値付与処理は、属性値付与部608(図8)によって、ユーザ指示を契機として実行される。
先ずステップS21では、属性値推定部609は、特徴量抽出部603(エンコーダ203)から得られた潜在変数204と偏回帰係数209から、評価データ202の属性値の予測値210を算出する。次にステップS22では、属性及び属性値出力部610は、基準データ201と、ステップS21で属性値の予測値210が算出された評価データ202との属性及び属性値から、属性毎の各属性値の出現頻度のヒストグラムを求める(後述の図14参照)。そして属性及び属性値出力部610は、このヒストグラムをもとに各属性値が基準データ201及び評価データ202の各属性において出現する確率をデータ含有率として求め、結果を出力する。
(実施形態1に係るデータ生成処理)
図11は、実施形態1に係るデータ生成処理を示すフローチャートである。データ生成処理は、データ生成部614(図8)によって、ユーザ指示を契機として実行される。
図11は、実施形態1に係るデータ生成処理を示すフローチャートである。データ生成処理は、データ生成部614(図8)によって、ユーザ指示を契機として実行される。
先ずステップS31では、データ生成部614は、ユーザによる生成させたい属性及び属性値401の入力を受け付ける。次にステップS32では、潜在変数算出部615は、ステップS31で入力を受け付けた属性及び属性値401と偏回帰係数209から、潜在変数204を計算して出力する。次にステップS33では、デコード部616(デコーダ205)は、ステップS32で計算された潜在変数204を入力として生成させたい属性及び属性値401を持つデータ405(例えば文字データ)を再構成する。次にステップS34では、データ出力部617は、デコード部616(デコーダ205)によって再構成されたデータ405を出力する。
なお、潜在変数算出部615は、ステップS31で入力を受け付けた属性及び属性値401に該当する基準データ201が存在する場合には、ステップS32をスキップし、ステップS33でこの基準データ201に対応するデータを再構成したデータ405とする。
(実施形態1に係るデータ品質評価処理)
図12は、実施形態1に係るデータ品質評価処理を示すフローチャートである。データ品質評価処理は、データ品質評価部612(図8)によって、ユーザ指示を契機として実行される。
図12は、実施形態1に係るデータ品質評価処理を示すフローチャートである。データ品質評価処理は、データ品質評価部612(図8)によって、ユーザ指示を契機として実行される。
ステップS41では、データ品質評価部612は、属性値付与部608によって出力された属性及び属性値611に関して、例えば上述の(1)データ設計の十分性、(2)データセットの被覆性、(3)データセットの均一性の少なくとも一つの観点で評価する。次にステップS42では、データ品質評価部612は、ステップS41のデータ品質評価結果613を出力する。
(属性及び属性値の出力例1)
図13は、属性及び属性値の出力例1(データに対する属性及び属性値)を示す図である。図13は、属性値付与部608の属性値推定部609(図8)によって、例えば図2又は図3に示す属性値が付与されていなかったデータに属性値が付与され、属性及び属性値出力部610によって出力されたものである。
図13は、属性及び属性値の出力例1(データに対する属性及び属性値)を示す図である。図13は、属性値付与部608の属性値推定部609(図8)によって、例えば図2又は図3に示す属性値が付与されていなかったデータに属性値が付与され、属性及び属性値出力部610によって出力されたものである。
(属性及び属性値の出力例2)
図14は、データ、属性、及び属性値の出力例2(各属性及び属性値に対するデータ数)を示す図である。図14は、図13の表示方法を変えた出力例である。図14は、属性値付与部608の属性及び属性値出力部610(図8)によって出力される属性毎の属性値のヒストグラムである。この表示によって、属性毎に例えば上述の(2)データセットの被覆性や(3)データの均一性を確認できる。(2)データセットの被覆性は、図14のヒストグラムの各属性の属性値が所定の広い範囲に分布しかつ各度数が何れも所定数以上であることで充足されると考えられる。(3)データの均一性は、図14のヒストグラムの各属性の属性値が所定の広い範囲に均等に分布していることで充足されると考えられる。このような分析によって、属性値に対して不足しているデータを確認することが可能となる。
図14は、データ、属性、及び属性値の出力例2(各属性及び属性値に対するデータ数)を示す図である。図14は、図13の表示方法を変えた出力例である。図14は、属性値付与部608の属性及び属性値出力部610(図8)によって出力される属性毎の属性値のヒストグラムである。この表示によって、属性毎に例えば上述の(2)データセットの被覆性や(3)データの均一性を確認できる。(2)データセットの被覆性は、図14のヒストグラムの各属性の属性値が所定の広い範囲に分布しかつ各度数が何れも所定数以上であることで充足されると考えられる。(3)データの均一性は、図14のヒストグラムの各属性の属性値が所定の広い範囲に均等に分布していることで充足されると考えられる。このような分析によって、属性値に対して不足しているデータを確認することが可能となる。
例えば図14のヒストグラム1101は、属性1の度数分布を示す。ヒストグラム1101は、ヒストグラム1102、1103と比較してデータの分布範囲が広い又は同等であるが、この分布範囲に存在しない属性値がある。この点でヒストグラム1101は、(2)データセットの被覆性が充足されていないと言える。またヒストグラム1101は、属性値の分布が均一でない。属性値の分布の均一性は、属性値の分散や標準偏差といったバラつきを表す統計値に基づいて判断できる。この点でヒストグラム1101は、(3)データの均一性が充足されていないと言える。
また図14のヒストグラム1102は、属性2の度数分布を示す。ヒストグラム1102は、ヒストグラム1101、1103と比較してデータの分布範囲が狭く、この分布範囲に存在しない属性値がある。この点でヒストグラム1102は、(2)データセットの被覆性が充足されていないと言える。またヒストグラム1102は、属性値の分布が均一でない。この点でヒストグラム1102は、(3)データの均一性が充足されていないと言える。
また図14のヒストグラム1103は、属性Jの度数分布を示す。ヒストグラム1103は、ヒストグラム1101、1102と比較してデータの分布範囲が広い又は同等であるが、この分布範囲に存在しない属性値がある。この点でヒストグラム1103は、(2)データセットの被覆性が充足されていないと言える。またヒストグラム1103は、ヒストグラム1101、1102と比較して属性値の分布が均一でない。この点でヒストグラム1102は、(3)データの均一性が充足されていないと言える。
なお、図14の各グラフを、「データ数」に代えて「各属性値が基準データ201及び評価データ202の各属性において出現するデータ含有率」を縦軸とするグラフとしてもよい。
[実施形態1の効果]
本実施形態では、訓練データやテストデータの属性をユーザが明示的に指定し、定量的な属性値で表すことにより、ユーザにとって解釈性の高い属性分析が可能となる。このため、訓練データやテストデータの中に不足しているデータや、誤判別の多いデータの特徴を発見しやすい。
本実施形態では、訓練データやテストデータの属性をユーザが明示的に指定し、定量的な属性値で表すことにより、ユーザにとって解釈性の高い属性分析が可能となる。このため、訓練データやテストデータの中に不足しているデータや、誤判別の多いデータの特徴を発見しやすい。
また本実施形態では、従来技術のように、得られた潜在変数の持つ属性をユーザが解釈する(偏在変数は太さ又は角度に依存する等)ではなく、ユーザが潜在変数に持たせるべき属性を明示的に指定できるため、ユーザの意図に従った属性分析が可能となる。
また、従来技術では属性が定性的にしか分からないため、異なるデータセットや異なるモデルで学習したデータ間の属性は比較できなかった。しかし、本実施形態では属性値が定量的に求まるため、異なるデータセットや異なるモデルで学習したデータ間の属性の比較が可能となる。
また、本実施形態では、属性値の予測に限定した場合であっても、教師あり学習による回帰モデルを使って属性値を推定する場合よりも少ないデータ量又は学習量で属性値を付与できる。
また、本実施形態では、データ生成では、複数の属性に対する属性値を指定してデータ生成できるため、必要とされるデータを容易に生成できる。また、データ生成の際に、指定された属性及び属性値に該当する基準データが存在する場合にはこの基準データに対応するデータを再構成したデータとして採用する。これにより、属性及び属性値と偏回帰係数から潜在変数を算出しデコーダでデコードしてデータを再構成する場合と比較して、速やかにデータを再構成できる。
[実施形態2]
実施形態1では、1つの情報処理システム1を用いてモデル学習(図4、図9)、属性値付与及び属性と属性値の関係の出力(図5、図10)、及びデータ品質評価処理(図12)を実行する例を示した。しかし、モデル学習、属性値付与、及びデータ品質評価処理は、図15に示す複数の情報処理システム1(1‐1,1-2,…,1-n)で並列に実行されてもよい。
実施形態1では、1つの情報処理システム1を用いてモデル学習(図4、図9)、属性値付与及び属性と属性値の関係の出力(図5、図10)、及びデータ品質評価処理(図12)を実行する例を示した。しかし、モデル学習、属性値付与、及びデータ品質評価処理は、図15に示す複数の情報処理システム1(1‐1,1-2,…,1-n)で並列に実行されてもよい。
例えばモデル学習を複数の情報処理システム1で実行する場合、ステップS13~S16(図9)を、複数の情報処理システム1毎にそれぞれ異なる基準データ201を含む入力データを用いて実行してもよい。そして、複数の情報処理システム1の少なくとも1つが、各情報処理システム1によって得られたMFCVAEモデルの学習結果をマージして出力する。
また複数の情報処理システム1毎に得られたMFCVAEのモデルのそれぞれの学習結果に基づいて、情報処理システム1毎に各入力データへの属性値付与及び属性と属性値の関係の出力(ステップS21~S23(図10))を実行してもよい。そして、複数の情報処理システム1の少なくとも1つが、各情報処理システム1によって得られた属性と属性値の関係(図14)をマージして出力する。
本実施形態では、従来技術と比較して、潜在変数が定量的に求まるため、モデル毎に別システムで並列処理しても計算結果をマージできることから、複数システムでモデル学習、属性値付与、及び属性と属性値の関係の出力の各処理の負荷分散が可能となる。よって、従来と比較して短い時間で、これらの処理を完了させ、必要とされるデータを生成することができる。
(実施形態の適用例)
実施形態は、上述のように手書き文字の文字認識に適用できる。その他、実施形態は、全てのデータにラベル付与するのが困難であり、一部のデータのみ正確な属性値(ラベル)が付与されており、残りのデータに属性値(ラベル)を付与したいといったケースであれば適用できる。
実施形態は、上述のように手書き文字の文字認識に適用できる。その他、実施形態は、全てのデータにラベル付与するのが困難であり、一部のデータのみ正確な属性値(ラベル)が付与されており、残りのデータに属性値(ラベル)を付与したいといったケースであれば適用できる。
例えば、工場設備の振動データに対する回転数のラベルの付与がある。前提として過去に取得した工場設備の振動データには回転数のラベルが付与されておらず、新たに回転数が計測できる装置を導入し、過去に取得した工場設備のデータに対して回転数のラベルを付与するような場合である。
また、画像における被写体の角度予測がある。角度のラベル付与された少量のデータから、未知の画像の被写体の角度を予測する場合である。この適用例は、ロボットが物をつかむときの把持の方向制御等に利用できる。
また、楽曲の印象評価を行う場合がある。予めユーザが評価した楽曲の印象(楽しい、悲しい、うれしい、寂しいなど)から、未知の楽曲の印象のラベル付与を行うことができる。
また、学会論文の研究分野の可視化を行う場合がある。予め各分野との関係度(画像認識分野との関連度が30、強化学習分野との関連度が50、・・・)が分かっている論文を基に、未知の論文の各分野との関係度を推定する場合である。
(コンピュータ1000のハードウェア)
図16は、コンピュータ1000の構成を示すハードウェア図である。例えば、情報処理システム1、あるいは特徴量抽出部603、属性値付与部608、データ生成部614、及びデータ品質評価部612等の情報処理システム1を適宜分散した各システムは、コンピュータ1000によって実現される。
図16は、コンピュータ1000の構成を示すハードウェア図である。例えば、情報処理システム1、あるいは特徴量抽出部603、属性値付与部608、データ生成部614、及びデータ品質評価部612等の情報処理システム1を適宜分散した各システムは、コンピュータ1000によって実現される。
コンピュータ1000は、バス等の内部通信線1009を介して相互に接続されたCPUをはじめとするプロセッサ1001、主記憶装置1002、補助記憶装置1003、ネットワークインタフェース1004、入力装置1005、及び出力装置1006を備える。
プロセッサ1001は、コンピュータ1000全体の動作制御を司る。また主記憶装置1002は、例えば揮発性の半導体メモリから構成され、プロセッサ1001のワークメモリとして利用される。補助記憶装置1003は、非一時的記憶媒体の一例であり、ハードディスク装置、SSD(Solid State Drive)、又はフラッシュメモリ等の大容量の不揮発性の記憶装置から構成され、各種プログラムやデータを長期間保持するために利用される。
補助記憶装置1003に格納された実行可能プログラム1100がコンピュータ1000の起動時や必要時に主記憶装置1002にロードされ、主記憶装置1002にロードされた実行可能プログラム1100をプロセッサ1001が実行する。これにより、各種処理を実行するシステムが実現される。
なお、実行可能プログラム1100は、非一時的記録媒体に記録され、媒体読み取り装置によって非一時的記録媒体から読み出されて、主記憶装置1002にロードされてもよい。または、実行可能プログラム1100は、ネットワークを介して外部のコンピュータから取得されて、主記憶装置1002にロードされてもよい。
ネットワークインタフェース1004は、コンピュータ1000をシステム内の各ネットワークに接続する、あるいは他のコンピュータと通信するためのインタフェース装置である。ネットワークインタフェース1004は、例えば、有線LAN(Local Area Network)や無線LAN等のNIC(Network Interface Card)から構成される。
入力装置1005は、キーボードや、マウス等のポインティングデバイス等から構成され、ユーザがコンピュータ1000に各種指示や情報を入力するために利用される。出力装置1006は、例えば、液晶ディスプレイ又は有機EL(Electro Luminescence)ディスプレイ等の表示装置や、スピーカ等の音声出力装置から構成され、必要時に必要な情報をユーザに提示するために利用される。
なお、本発明は前述した実施形態に限定されるものではなく、添付した特許請求の範囲の趣旨内における様々な変形例及び同等の構成が含まれる。例えば、前述した実施形態は本発明を分かりやすく説明するために詳細に説明したものであり、必ずしも説明した全ての構成を備えるものに本発明は限定されない。また、ある実施形態の構成の一部を他の実施形態の構成に置き換えてもよい。また、ある実施形態の構成に他の実施形態の構成を加えてもよい。また、各実施形態の構成の一部について、他の構成の追加、削除、又は置換をしてもよい。
また、前述した各構成、機能、処理部、処理手段等は、それらの一部又は全部を、例えば集積回路で設計する等により、ハードウェアで実現してもよい。あるいは、プロセッサがそれぞれの機能を実現するプログラムを解釈し実行することにより、ソフトウェアで実現してもよい。
各機能を実現するプログラム、テーブル、ファイル等の情報は、メモリ、ハードディスク、SSD(Solid State Drive)等の記憶装置、又は、IC(Integrated Circuit)カード、SDカード、DVD(Digital Versatile Disc)の非一時的記録媒体に格納することができる。
また、制御線や情報線は説明上必要と考えられるものを示しており、実装上必要な全ての制御線や情報線を示しているとは限らない。実際には、ほとんど全ての構成が相互に接続されていると考えてよい。
1:情報処理システム、201:基準データ、202:評価データ、204:潜在変数、603:特徴量抽出部、608:属性値付与部、612:データ品質評価部、614:データ生成部、1000:コンピュータ。
Claims (17)
- 処理部と記憶部とを有する情報処理システムが実行する情報処理方法であって、
前記処理部が、
データの複数の属性に属性値が付与されている基準データを含んだ入力データを、該データの前記複数の属性のそれぞれに関する潜在変数を出力するMFCVAE(Multi-Facet Clustering Variational Auto-Encoder)に入力する第1ステップと、
前記入力データの入力に対して前記MFCVAEから出力された前記潜在変数を説明変数とし、前記属性値を目的変数とする回帰モデルを前記属性毎に設定する第2ステップと、
前記潜在変数と前記属性値とから、該属性値に対する予測誤差が最小となる前記属性値の予測値及び前記回帰モデルの回帰係数を前記属性毎に算出する第3ステップと、
前記第3ステップによって算出された前記属性毎の前記予測値及び前記回帰係数に基づいて、前記潜在変数及び前記属性値の前記回帰モデルへの適合が良いほど小さい値を取る指標を前記属性毎に算出する第4ステップと、
前記MFCVAEによるデータ再構成の誤差を表す再構成誤差項と、前記潜在変数の分布に制約を与える正則化項と、を有する前記MFCVAEの損失関数に、前記属性毎の前記指標に基づく追加項を追加した損失関数の関数値を算出する第5ステップと、
前記第5ステップによって算出された前記関数値に基づく誤差逆伝搬によって前記MFCVAEのモデルパラメータを更新する第6ステップと、を実行し、
前記第1ステップから前記第6ステップまでを、前記予測誤差又はエポック回数が所定条件を充足するまでこの順序で繰り返すことで前記MFCVAEのモデル学習を実行する、ことを特徴とする情報処理方法。 - 請求項1に記載の情報処理方法であって、
前記回帰モデルは、重回帰モデルである、ことを特徴とする情報処理方法。 - 請求項1に記載の情報処理方法であって、
前記属性毎の前記指標は、前記回帰モデルの決定係数である、ことを特徴とする情報処理方法。 - 請求項1に記載の情報処理方法であって、
前記属性毎の前記指標は、前記予測誤差である、ことを特徴とする情報処理方法。 - 請求項4に記載の情報処理方法であって、
前記予測誤差は、平均二乗誤差である、ことを特徴とする情報処理方法。 - 請求項1に記載の情報処理方法であって、
前追加項は、前記属性毎の前記指標に、前記属性毎の重み係数を乗算した項であり、
前記処理部が、
前記属性毎の前記重み係数を、前記属性毎に、前記指標と前記再構成誤差項及び前記正則化項との各絶対値のオーダーが等しくなるように決定する、ことを特徴とする情報処理方法。 - 請求項1に記載の情報処理方法であって、
前記入力データは、前記基準データ及び前記属性に前記属性値が付与されていない評価データを含み、
前記処理部が、前記第5ステップにおいて、
前記追加項を、前記基準データを用いて計算し、
前記再構成誤差項及び前記正則化項を、前記基準データ及び前記評価データの何れか一方又は両方を用いて計算する、ことを特徴とする情報処理方法。 - 請求項1に記載の情報処理方法であって、
前記入力データは、前記基準データ及び前記属性に前記属性値が付与されていない評価データを含み、
前記処理部が、
前記第1ステップから前記第6ステップまでを繰り返すことでモデル学習済みの前記MFCVAEに前記評価データを入力し、前記評価データに関する前記潜在変数を取得する第7ステップと、
前記第7ステップによって取得された前記潜在変数と、前記MFCVAEのモデル学習の最終エポック時における前記回帰係数とに基づいて、前記評価データの前記属性値が付与されていない前記属性の前記属性値の予測値を算出して該評価データに該属性値として付与する第8ステップと、を実行することを特徴とする情報処理方法。 - 請求項8に記載の情報処理方法であって、
前記処理部が、
前記基準データと前記第8ステップによって前記予測値が付与された前記評価データとの前記属性及び前記属性値に関する情報を出力する第9ステップ、を実行することを特徴とする情報処理方法。 - 請求項8に記載の情報処理方法であって、
前記処理部が、
前記基準データと前記第8ステップによって前記予測値が付与された前記評価データとを用いて、データの設計の十分性、データの被覆性、又はデータの均一性を含む観点に従って前記入力データを評価する第10ステップ、を実行することを特徴とする情報処理方法。 - 請求項1に記載の情報処理方法であって、
複数の前記情報処理システムの各前記処理部が、
前記第1ステップから前記第6ステップまでを、前記予測誤差又はエポック回数が所定条件を充足するまで繰り返すことで前記MFCVAEをモデル学習することを、それぞれ異なる前記入力データを用いて実行し、
各前記処理部によって得られた前記MFCVAEのモデルの学習結果をマージして出力する第11ステップ、を実行することを特徴とする情報処理方法。 - 請求項8に記載の情報処理方法であって、
複数の前記情報処理システムの各前記処理部が、
前記第1ステップから前記第8ステップまでを、それぞれ異なる前記入力データを用いて実行し、
各前記処理部によって得られた、前記基準データと前記第8ステップによって前記予測値が付与された前記評価データの前記属性及び前記属性値に関する情報をマージして出力する第12ステップ、を実行することを特徴とする情報処理方法。 - 請求項1に記載の情報処理方法であって、
前記処理部が、
指定された前記属性及び前記属性値を、前記第1ステップから前記第6ステップまでを繰り返すことでモデル学習済みの前記MFCVAEに入力し、入力された前記属性及び前記属性値と前記回帰係数とから前記潜在変数を算出し、該潜在変数を基に、入力された前記属性及び前記属性値に対応する前記データを再構成する第13ステップ、を実行することを特徴とする情報処理方法。 - 請求項13に記載の情報処理方法であって、
前記処理部が、
前記指定された前記属性及び前記属性値に該当する前記基準データが存在する場合には、該基準データに対応する前記データを再構成したデータとして採用し、
前記指定された前記属性及び前記属性値に該当する前記基準データが存在しない場合に、前記第13ステップを実行する、ことを特徴とする情報処理方法。 - 請求項1に記載の情報処理方法であって、
前記基準データは活字及び手書き文字を含み、前記評価データは手書き文字を含む、ことを特徴とする情報処理方法。 - データの複数の属性に属性値が付与されている基準データを含んだ入力データを、該データの前記複数の属性のそれぞれに関する潜在変数を出力するMFCVAE(Multi-Facet Clustering Variational Auto-Encoder)に入力し、
前記入力データの入力に対して前記MFCVAEから出力された前記潜在変数を説明変数とし、前記属性値を目的変数とする回帰モデルを前記属性毎に設定し、
前記潜在変数と前記属性値とから、該属性値に対する予測誤差が最小となる前記属性値の予測値及び前記回帰モデルの回帰係数を前記属性毎に算出し、
算出された前記属性毎の前記予測値及び前記回帰係数に基づいて、前記潜在変数及び前記属性値の前記回帰モデルへの適合が良いほど小さい値を取る指標を前記属性毎に算出する回帰モデル適合度評価部と、
前記MFCVAEによるデータ再構成の誤差を表す再構成誤差項と、前記潜在変数の分布に制約を与える正則化項と、を有する前記MFCVAEの損失関数に、前記属性毎の前記指標に基づく追加項を追加した損失関数の関数値を算出する損失算出部と、
前記損失算出部によって算出された前記関数値に基づく誤差逆伝搬によって前記MFCVAEのモデルパラメータを更新するモデル更新部と、を有し、
前記回帰モデル適合度評価部、前記損失算出部、及び前記モデル更新部は、前記予測誤差又はエポック回数が所定条件を充足するまでこの順序で処理を順次繰り返すことで前記MFCVAEのモデル学習を実行する、ことを特徴とする情報処理システム。 - コンピュータを情報処理システムとして機能させるための情報処理プログラムであって、
前記コンピュータを、
データの複数の属性に属性値が付与されている基準データを含んだ入力データを、該データの前記複数の属性のそれぞれに関する潜在変数を出力するMFCVAE(Multi-Facet Clustering Variational Auto-Encoder)に入力し、
前記入力データの入力に対して前記MFCVAEから出力された前記潜在変数を説明変数とし、前記属性値を目的変数とする回帰モデルを前記属性毎に設定し、
前記潜在変数と前記属性値とから、該属性値に対する予測誤差が最小となる前記属性値の予測値及び前記回帰モデルの回帰係数を前記属性毎に算出し、
算出された前記属性毎の前記予測値及び前記回帰係数に基づいて、前記潜在変数及び前記属性値の前記回帰モデルへの適合が良いほど小さい値を取る指標を前記属性毎に算出する回帰モデル適合度評価部と、
前記MFCVAEによるデータ再構成の誤差を表す再構成誤差項と、前記潜在変数の分布に制約を与える正則化項と、を有する前記MFCVAEの損失関数に、前記属性毎の前記指標に基づく追加項を追加した損失関数の関数値を算出する損失算出部と、
前記損失算出部によって算出された前記関数値に基づく誤差逆伝搬によって前記MFCVAEのモデルパラメータを更新するモデル更新部と、して機能させ、
前記回帰モデル適合度評価部、前記損失算出部、及び前記モデル更新部は、前記予測誤差又はエポック回数が所定条件を充足するまでこの順序で処理を順次繰り返すことで前記MFCVAEのモデル学習を実行する、ことを特徴とする情報処理プログラム。
Applications Claiming Priority (2)
| Application Number | Priority Date | Filing Date | Title |
|---|---|---|---|
| JP2022133545A JP7761545B2 (ja) | 2022-08-24 | 2022-08-24 | 情報処理方法、情報処理システム、及び情報処理プログラム |
| JP2022-133545 | 2022-08-24 |
Publications (1)
| Publication Number | Publication Date |
|---|---|
| WO2024042736A1 true WO2024042736A1 (ja) | 2024-02-29 |
Family
ID=90012866
Family Applications (1)
| Application Number | Title | Priority Date | Filing Date |
|---|---|---|---|
| PCT/JP2023/005451 Ceased WO2024042736A1 (ja) | 2022-08-24 | 2023-02-16 | 情報処理方法、情報処理システム、及び情報処理プログラム |
Country Status (2)
| Country | Link |
|---|---|
| JP (1) | JP7761545B2 (ja) |
| WO (1) | WO2024042736A1 (ja) |
Families Citing this family (1)
| Publication number | Priority date | Publication date | Assignee | Title |
|---|---|---|---|---|
| WO2025204972A1 (ja) * | 2024-03-26 | 2025-10-02 | ソニーセミコンダクタソリューションズ株式会社 | 情報処理装置、情報処理方法、プログラム、データ生成装置、データ生成方法、学習システム |
Citations (1)
| Publication number | Priority date | Publication date | Assignee | Title |
|---|---|---|---|---|
| JP2020144799A (ja) * | 2019-03-08 | 2020-09-10 | 富士通株式会社 | データ処理プログラム及びデータ処理方法 |
-
2022
- 2022-08-24 JP JP2022133545A patent/JP7761545B2/ja active Active
-
2023
- 2023-02-16 WO PCT/JP2023/005451 patent/WO2024042736A1/ja not_active Ceased
Patent Citations (1)
| Publication number | Priority date | Publication date | Assignee | Title |
|---|---|---|---|---|
| JP2020144799A (ja) * | 2019-03-08 | 2020-09-10 | 富士通株式会社 | データ処理プログラム及びデータ処理方法 |
Non-Patent Citations (2)
| Title |
|---|
| FALCK FABIAN, ZHANG HAOTING, WILLETTS MATTHEW, NICHOLSON GEORGE, YAU CHRISTOPHER, HOLMES CHRIS: "Multi-Facet Clustering Variational Autoencoders", ARXIV (CORNELL UNIVERSITY), CORNELL UNIVERSITY LIBRARY, ARXIV.ORG, ITHACA, 9 June 2021 (2021-06-09), Ithaca, XP093142179, Retrieved from the Internet <URL:https://arxiv.org/pdf/2106.05241.pdf> [retrieved on 20240318], DOI: 10.48550/arxiv.2106.05241 * |
| MASATOSHI SEKINE, ATSUSUKE NIIHARA, TOMOYUKI MYOJIN, ERI IMAYA: "Application of multifaceted clustering variational autoencoder to handwritten character data for extracting diverse attribute information from datasets View usages", SOFTWARE ENGINEERING SYMPOSIUM 2022; SEPTEMBER 5 TO 7, 2022, 29 August 2022 (2022-08-29), JP, pages 145 - 146, XP009558367 * |
Also Published As
| Publication number | Publication date |
|---|---|
| JP7761545B2 (ja) | 2025-10-28 |
| JP2024030579A (ja) | 2024-03-07 |
Similar Documents
| Publication | Publication Date | Title |
|---|---|---|
| CN114255381B (zh) | 图像识别模型的训练方法、图像识别方法、装置及介质 | |
| CN110046707B (zh) | 一种神经网络模型的评估优化方法和系统 | |
| Zheng et al. | Resolving the bias in electronic medical records | |
| CN110210625B (zh) | 基于迁移学习的建模方法、装置、计算机设备和存储介质 | |
| US20190122097A1 (en) | Data analysis apparatus, data analysis method, and data analysis program | |
| WO2019160003A1 (ja) | モデル学習装置、モデル学習方法、プログラム | |
| US12321866B2 (en) | Data diversity visualization and quantification for machine learning models | |
| CN109948735A (zh) | 一种多标签分类方法、系统、装置及存储介质 | |
| CN118397382A (zh) | 一种基于标签平滑和分布正则化的图像增量学习方法 | |
| WO2024159819A1 (zh) | 训练方法、版面分析、质量评估方法、装置、设备和介质 | |
| CN114529191B (zh) | 用于风险识别的方法和装置 | |
| CN118196013A (zh) | 支持多医生协同监督的多任务医学图像分割方法及系统 | |
| US20220327394A1 (en) | Learning support apparatus, learning support methods, and computer-readable recording medium | |
| CN108108769B (zh) | 一种数据的分类方法、装置及存储介质 | |
| WO2024042736A1 (ja) | 情報処理方法、情報処理システム、及び情報処理プログラム | |
| CN113158068A (zh) | 基于大数据的终端信息推荐方法 | |
| JP2019095894A (ja) | 推定装置、学習装置、学習済みモデル、推定方法、学習方法、及びプログラム | |
| JP4140915B2 (ja) | 利用者の行動を支援するシステム | |
| CN116018613A (zh) | 机器学习程序、机器学习方法以及推定装置 | |
| KR20210141150A (ko) | 이미지 분류 모델을 이용한 이미지 분석 방법 및 장치 | |
| JP7700542B2 (ja) | 情報処理装置、情報処理方法およびプログラム | |
| CN113297828B (zh) | 一种文本生成方法、装置、计算机设备及存储介质 | |
| CN117836786A (zh) | 用于机器学习的计算机模型的迭代训练 | |
| JP7056804B2 (ja) | 経験損失推定システム、経験損失推定方法および経験損失推定プログラム | |
| JP2022148878A (ja) | プログラム、情報処理装置、及び方法 |
Legal Events
| Date | Code | Title | Description |
|---|---|---|---|
| 121 | Ep: the epo has been informed by wipo that ep was designated in this application |
Ref document number: 23856862 Country of ref document: EP Kind code of ref document: A1 |
|
| NENP | Non-entry into the national phase |
Ref country code: DE |
|
| 122 | Ep: pct application non-entry in european phase |
Ref document number: 23856862 Country of ref document: EP Kind code of ref document: A1 |