WO2024034305A1 - 脈圧測定装置及び脈圧測定方法 - Google Patents
脈圧測定装置及び脈圧測定方法 Download PDFInfo
- Publication number
- WO2024034305A1 WO2024034305A1 PCT/JP2023/025307 JP2023025307W WO2024034305A1 WO 2024034305 A1 WO2024034305 A1 WO 2024034305A1 JP 2023025307 W JP2023025307 W JP 2023025307W WO 2024034305 A1 WO2024034305 A1 WO 2024034305A1
- Authority
- WO
- WIPO (PCT)
- Prior art keywords
- pulse
- pulse wave
- blood pressure
- index
- wave
- Prior art date
- Legal status (The legal status is an assumption and is not a legal conclusion. Google has not performed a legal analysis and makes no representation as to the accuracy of the status listed.)
- Ceased
Links
Images


Classifications
-
- A—HUMAN NECESSITIES
- A61—MEDICAL OR VETERINARY SCIENCE; HYGIENE
- A61B—DIAGNOSIS; SURGERY; IDENTIFICATION
- A61B5/00—Measuring for diagnostic purposes; Identification of persons
- A61B5/02—Detecting, measuring or recording for evaluating the cardiovascular system, e.g. pulse, heart rate, blood pressure or blood flow
- A61B5/021—Measuring pressure in heart or blood vessels
-
- A—HUMAN NECESSITIES
- A61—MEDICAL OR VETERINARY SCIENCE; HYGIENE
- A61B—DIAGNOSIS; SURGERY; IDENTIFICATION
- A61B5/00—Measuring for diagnostic purposes; Identification of persons
- A61B5/103—Measuring devices for testing the shape, pattern, colour, size or movement of the body or parts thereof, for diagnostic purposes
- A61B5/11—Measuring movement of the entire body or parts thereof, e.g. head or hand tremor or mobility of a limb
-
- A—HUMAN NECESSITIES
- A61—MEDICAL OR VETERINARY SCIENCE; HYGIENE
- A61B—DIAGNOSIS; SURGERY; IDENTIFICATION
- A61B5/00—Measuring for diagnostic purposes; Identification of persons
- A61B5/16—Devices for psychotechnics; Testing reaction times ; Devices for evaluating the psychological state
Definitions
- the present invention relates to a pulse pressure measuring device and a pulse pressure measuring method.
- Pulse wave information is optically acquired from parts of the living body, pulse rate and pulse wave time information are calculated from the acquired pulse wave information, and blood pressure information is estimated based on the pulse rate and pulse wave time information.
- a pulse wave measuring device that outputs pulse waves is known (see Patent Document 1).
- Estimated blood pressure information includes information such as blood pressure, blood pressure status, arteriosclerosis, vascular age, and whether or not the patient is predisposed to stroke.
- Pulse pressure which is the difference between systolic blood pressure and diastolic blood pressure, is one indicator for determining health status.
- Conventional pulse wave measurement devices cannot measure pulse pressure.
- An object of the present invention is to provide a pulse pressure measuring device and a pulse pressure measuring method that can measure pulse pressure.
- a peripheral blood pressure index calculation unit that calculates a peripheral blood pressure index related to the steepness of the rise of a pulse wave signal measured by a pulse wave sensor worn by the user; a pulse wave feature calculation unit that calculates an ae time index that includes information regarding the elapsed time from the peak of the a wave to the peak of the e wave of the accelerated pulse wave obtained by second-order differentiation of the waveform of the pulse wave signal;
- a pulse pressure measuring device is provided that includes a pulse pressure calculation section that calculates pulse pressure based on the peripheral blood pressure index and the ae time index.
- a pulse wave sensor attached to the user acquires a pulse wave signal
- a pulse pressure measuring device calculates a peripheral blood pressure index related to the steepness of the rise of the pulse wave signal
- the pulse pressure measurement device calculates an ae time index that includes information regarding the elapsed time from the peak of the a wave to the peak of the e wave of the accelerated pulse wave obtained by second-order differentiation of the waveform of the pulse wave signal
- a pulse pressure measuring method is provided in which the pulse pressure measuring device calculates the pulse pressure based on the peripheral blood pressure index and the ae time index.
- Peripheral blood pressure indicators that have a correlation with blood pressure also have a correlation with pulse pressure. Furthermore, the elapsed time from the peak of the a-wave to the peak of the e-wave of the accelerated pulse wave also has a correlation with the pulse pressure.
- pulse pressure can be calculated with high accuracy.
- FIG. 1 is a block diagram and a schematic diagram of a pulse pressure measuring device according to a first embodiment.
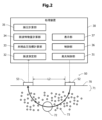
- FIG. 2 is a block diagram and a schematic diagram of a pulse pressure measuring device according to a modification of the first embodiment.
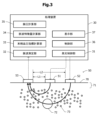
- FIG. 3 is a block diagram and a schematic diagram of a pulse pressure measuring device according to another modification of the first embodiment.
- FIG. 4 is a perspective view and a block diagram of a pulse pressure measuring device according to a modification of the first embodiment shown in FIG. 3.
- FIG. 5 is a graph showing an example of a pulse wave, a velocity pulse wave, and an acceleration pulse wave.
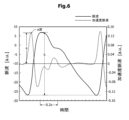
- FIG. 6 is a graph showing an example of a pulse wave and an accelerated pulse wave.
- Figures 7A and 7B show the vicinity of the elbow on the side where the finger, which is the measurement site, is adjusted when the height from the heart to the measurement site (finger) is changed, and when the measurement site is adjusted to the chest height. It is a graph showing the relationship between the value of peripheral blood pressure index "1/VE0.5" found from the pulse wave measured when cooling the body and the systolic blood pressure measured at the wrist.
- Figures 8A and 8B show the vicinity of the elbow on the side where the finger, which is the measurement site, is adjusted when the height from the heart to the measurement site (finger) is changed, and when the measurement site is adjusted to the chest height.
- FIGS. 1 It is a graph showing the relationship between the value of the peripheral blood pressure index "a/S” determined from the pulse wave measured when the patient is cooled, and the systolic blood pressure measured at the wrist.
- Figures 9A and 9B show the area near the elbow on the side where the finger, which is the measurement site, is adjusted when the height from the heart to the measurement site (finger) is changed, and when the measurement site is adjusted to the chest height.
- 2 is a graph showing the relationship between the value of the peripheral blood pressure index "(ab)/(ad)" determined from the pulse wave measured when the patient is cooled, and the systolic blood pressure measured at the wrist.
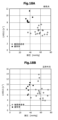
- FIGS. 10A and 10B are scatter diagrams of multiple subjects, with the horizontal axis representing wrist systolic blood pressure and the vertical axis representing peripheral blood pressure index "1/VE0.5.”
- FIGS. 11A and 11B are scatter diagrams of a plurality of subjects, with the horizontal axis representing wrist systolic blood pressure and the vertical axis representing peripheral blood pressure index "a/S.”
- 12A and 12B are scatter diagrams of a plurality of subjects, with the horizontal axis representing wrist systolic blood pressure and the vertical axis representing peripheral blood pressure index "(ab)/(ad)".
- FIGS. 14A and 14B are scatter diagrams of a plurality of subjects in which the vertical axis is the elapsed time from the peak of the a wave to the peak of the b wave of the accelerated pulse wave, and the horizontal axis is the systolic blood pressure at the wrist.
- FIGS. 14A and 14B are scatter diagrams of a plurality of subjects in which the vertical axis is the elapsed time from the peak of the b wave to the peak of the d wave of the accelerated pulse wave, and the horizontal axis is the systolic blood pressure at the wrist.
- FIGS. 15A and 15B are scatter diagrams of a plurality of subjects in which the vertical axis is the elapsed time from the peak of the d wave to the peak of the e wave of the accelerated pulse wave, and the horizontal axis is the systolic blood pressure at the wrist.
- FIGS. 16A and 16B are scatter diagrams of a plurality of subjects in which the vertical axis is the elapsed time from the peak of the a wave to the peak of the e wave of the accelerated pulse wave, and the horizontal axis is the systolic blood pressure at the wrist.
- FIG. 17 is a scatter diagram of multiple subjects, with pulse interval as the vertical axis and wrist systolic blood pressure as the horizontal axis.
- FIGS. 18A and 18B are scatter diagrams of a plurality of subjects, with pulse pressure as the horizontal axis and peripheral blood pressure index "1/VE0.5" as the vertical axis.
- 19A and 19B are scatter diagrams of a plurality of subjects, with pulse pressure as the horizontal axis and peripheral blood pressure index "(ab)/(ad)" as the vertical axis.
- FIGS. 20A and 20B are scatter diagrams of a plurality of subjects, with pulse pressure as the horizontal axis and feature quantity "de time” as the vertical axis.
- FIGS. 21A and 21B are scatter diagrams of a plurality of subjects, with pulse pressure as the horizontal axis and feature quantity "ae time” as the vertical axis.
- FIG. 22 is a scatter diagram of a plurality of subjects, with pulse pressure as the horizontal axis and pulse interval as the vertical axis.
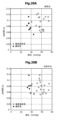
- 23A and 23B are scatter diagrams of a plurality of subjects, with pulse pressure as the horizontal axis and pulse pressure index value Pa as the vertical axis.
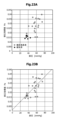
- 24A and 24B are scatter diagrams of a plurality of subjects, with pulse pressure as the horizontal axis and pulse pressure index value Pad as the vertical axis.
- FIG. 25 is a scatter diagram showing a plurality of measurement results of one subject over a long period of time, with pulse pressure as the horizontal axis and pulse pressure index value Pad as the vertical axis.
- FIG. 26 is a perspective view and a block diagram of a pulse pressure measuring device according to a third embodiment.
- FIG. 26 is a perspective view and a block diagram of a pulse pressure measuring device according to a third embodiment.
- FIG. 27 is a schematic diagram for explaining the procedure for measuring the difference in height between the ring device and the heart.
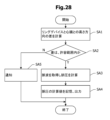
- FIG. 28 is a flowchart showing the procedure of a pulse pressure measuring method executed by the pulse pressure measuring device according to the third embodiment.
- FIG. 29 is a flowchart showing the procedure of a pulse pressure measuring method executed by a pulse pressure measuring device according to a modification of the third embodiment.
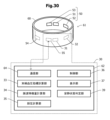
- FIG. 30 is a perspective view and a block diagram of a pulse pressure measuring device according to a fourth embodiment.
- FIG. 31 is a flowchart showing the procedure of the pulse pressure measuring method executed by the pulse pressure measuring device according to the fourth embodiment.
- FIG. 32 is a perspective view and a block diagram of a pulse pressure measuring device according to a fifth embodiment.
- FIG. 33 is a flowchart showing the procedure of a pulse pressure measuring method executed by the pulse pressure measuring device according to the fifth embodiment.
- a pulse pressure measuring device according to a first embodiment will be described with reference to FIGS. 1, 2, 3, and 4.
- the pulse pressure measuring device calculates pulse pressure based on the waveform of a pulse wave obtained from a subject.
- Pulse waves are used to measure various biological information. For example, it is used to measure pulse rate and oxygen saturation. In addition, it is also used to measure autonomic nervous function based on pulse interval variations, and to measure respiration rate based on baseline variations in pulse waves and pulse interval variations. Furthermore, a technique for estimating blood pressure from the waveform shape of a pulse wave has also been developed. Pulse waves are classified into pressure pulse waves (piezoelectric pulse waves) measured using a piezoelectric sensor or the like, and volume pulse waves (photoplethysm waves) measured using a photoplethysmographic sensor.
- pressure pulse waves piezoelectric pulse waves
- volume pulse waves photoplethysm waves
- Pulse pressure is the difference between systolic blood pressure and diastolic blood pressure, and its normal value is said to be 40 mmHg or more and 50 mmHg or less.
- An example of pulse pressure exceeding the normal range is when stroke volume increases. Possible causes of increased stroke volume include exercise, hyperthyroidism, and anemia.
- pulse pressure exceeds the normal range when the elasticity of large blood vessels decreases.
- blood vessels become stiff, systolic blood pressure increases.
- systolic blood pressure increases, a reaction occurs that dilates peripheral blood vessels, and diastolic blood pressure actually decreases.
- pulse pressure increases. For example, if the aorta has extensive arteriosclerosis, the pulse pressure increases.
- the pulse pressure exceeds 65 mmHg, the risk of myocardial infarction and cerebrovascular disease increases. Measuring pulse pressure helps discover those who are prone to these diseases.
- the pulse pressure measuring device is applicable to both piezoelectric pulse waves and photoplethysmograms. More information can be obtained from photoplethysmography than from piezoelectric plethysmography.
- a photoplethysmogram will be explained as an example.
- FIG. 1 is a block diagram and a schematic diagram of a pulse pressure measuring device according to a first embodiment.
- the pulse pressure measuring device according to the first embodiment includes a processing device 30 and a photoplethysmographic sensor 50.
- Photoplethysmographic sensor 50 includes a light emitting element 51 and a light receiving element 53.
- the processing device 30 includes a light emission control section 31 , a pulse wave measurement section 32 , a peripheral blood pressure index calculation section 33 , a pulse wave feature amount calculation section 34 , a pulse pressure calculation section 35 , a control section 36 , and a display section 37 .
- the light emitting element 51 and the light receiving element 53 are used in contact with the user's body surface 70.
- the light emitting element 51 irradiates measurement light toward the body surface 70 .
- the irradiated light is absorbed, reflected, or scattered (hereinafter sometimes simply referred to as "reflection") by the epidermal region 71, arterioles 72, and capillaries 73 within the body surface 70.
- a part of the reflected light enters the light receiving element 53.
- the arteriole 72 is a thin blood vessel with a diameter of, for example, 20 ⁇ m or more and 200 ⁇ m or less, and exists between the artery and the capillary blood vessel 73.
- a plurality of capillaries 73 branch from the arteriole 72.
- the capillary blood vessel 73 is a thin blood vessel with a diameter of about 10 ⁇ m, for example, and connects an artery and a vein.
- a plurality of capillaries 73 are distributed in an area shallower than the area where arterioles 72 are distributed.
- the light emitting element 51 outputs light for measurement under the control of the processing device 30.
- a signal indicating the intensity of light measured by the light receiving element 53 is input to the processing device 30 .
- a signal indicating the intensity of light detected by the light receiving element 53 will be referred to as a "pulse wave signal".
- Arterial blood contains hemoglobin, and hemoglobin has the property of absorbing light for measurement. The amount of blood flow changes as the heart beats, and the amount of light absorbed changes in accordance with the change in blood flow. Therefore, the intensity of the pulse wave signal changes as the heart beats.
- the light emitting element 51 one that outputs light in a wavelength range from blue to yellowish green (wavelength range of 450 nm or more and 550 nm or less), preferably 500 nm or more and 550 nm or less is used.
- a light emitting diode (LED), a vertical cavity surface emitting laser (VCSEL), or the like is used as the light emitting element 51.
- a photodiode (PD), a phototransistor, or the like is used as the light receiving element 53.
- pulse waves obtained using light in the wavelength range from blue to yellow-green include areas shallow from the skin surface, particularly shallower than areas where arterioles 72 are distributed, and mainly areas where capillaries 73 are distributed.
- the information will be reflected.
- the arrows shown in FIG. 1 do not necessarily indicate the path through which light propagates, but rather the light output from the light emitting element 51 passes through the epidermis region 71 and the region where capillaries 73 are mainly distributed, and passes through the light receiving element 53. It is shown that it is incident on .
- the distance L1 between the light emitting element 51 and the light receiving element 53 is set. It is preferable to keep it short. For example, it is preferable that the interval L1 be 1 mm or more and 3 mm or less.
- Light with wavelengths shorter than 450 nm can damage living tissues.
- the wavelength of the light used to measure pulse waves is preferably 450 nm or more.
- FIG. 2 is a block diagram and a schematic diagram of a pulse pressure measuring device according to a modification of the first embodiment.
- a light emitting element 52 having a different emission wavelength is used in place of the light emitting element 51 of the pulse pressure measuring device according to the first embodiment (FIG. 1).
- the light emitting element 52 used in the modification shown in FIG. 2 outputs light in a wavelength range from red to near-infrared light, for example, in a wavelength range of 750 nm or more and 950 nm or less.
- Light in the wavelength range from red to near-infrared light is absorbed less by living tissues than light in the wavelength range from blue to yellow-green. Therefore, pulse waves obtained using light in the wavelength range from red to near-infrared light reflect information from a deeper region from the skin surface.
- the distance L2 between the light emitting element 52 and the light receiving element 53 is set to 5 mm or more and 20 mm or less. is preferred.
- the absorbance of hemoglobin decreases. Therefore, it is preferable to use light in the wavelength range of 950 nm or less to obtain the pulse wave signal.
- FIG. 3 is a block diagram and a schematic diagram of a pulse pressure measuring device according to another modification of the first embodiment.
- the pulse pressure measuring device according to the second modification includes a light-emitting element 51 (FIG. 1) that outputs light in a wavelength range from blue to yellow-green, and a light-emitting element 52 that outputs light in a wavelength range from red to near-infrared light. It has both.
- the light receiving element 53 detects light in the wavelength range of both the light output from the light emitting element 51 and the light output from the light emitting element 52.
- a preferable range of the distance L1 between the light emitting element 51 and the light receiving element 53 is 1 mm or more and 3 mm or less, and a preferable range of the distance L2 between the light emitting element 52 and the light receiving element 53 is 5 mm or more and 20 mm or less.
- one light-receiving element 53 is arranged for two light-emitting elements 51 and 52, but one light-receiving element is arranged for one light-emitting element 51, and the other light-emitting element Other light receiving elements may be arranged with respect to element 52.
- the control unit 36 of the processing device 30 performs controls such as starting and ending the measurement, displaying the measurement results on the display unit 37, and storing the measurement results.
- the light emission control unit 31 controls pulsed light emission of the light emitting element 51 or the light emitting element 52.
- the light emitting element 51 or the light emitting element 52 is caused to emit pulsed light at a predetermined frequency of 100 Hz or more and 1000 Hz or less.
- the light emitting element 51 and the light emitting element 52 are caused to emit light alternately.
- the pulse wave measurement unit 32 generates a pulse wave waveform (hereinafter sometimes simply referred to as a "pulse wave") from the measurement result (pulse wave signal) input from the light receiving element 53.
- the pulse wave measurement unit 32 generates a pulse wave by reading the measured value of light intensity from the light receiving element 53 at a predetermined sampling rate in synchronization with the pulsed light emission of the light emitting element 51 or 52.
- the pulse wave measurement unit 32 reads the measured value of light intensity from the light receiving element 53 at a predetermined sampling rate in synchronization with the pulsed light emission of the light emitting element 51 or the light emitting element 52. Accordingly, a pulse wave due to the light output from the light emitting element 51 and a pulse wave due to the light output from the light emitting element 52 are generated separately.
- the peripheral blood pressure index calculation unit 33 calculates a peripheral blood pressure index related to the steepness of the rise of the pulse wave from the pulse wave generated by the pulse wave measurement unit 32.
- the pulse wave feature calculating unit 34 calculates an ae time index from the pulse wave generated by the pulse wave measuring unit 32.
- the peripheral blood pressure index and the ae time index will be explained in detail later.
- the pulse pressure calculation unit 35 calculates the pulse pressure based on the peripheral blood pressure index and the ae time index to obtain a measured value of the pulse pressure.
- FIG. 4 is a perspective view and a block diagram of a pulse pressure measuring device according to a modification of the first embodiment shown in FIG. 3.
- the pulse pressure measuring device according to this modification includes a ring device 61 and a portable mobile terminal 62.
- the ring device 61 will be explained below.
- Two light emitting elements 51 and 52 and one light receiving element 53 are attached to the inner surface of the annular mounting member 60.
- the attachment member 60 is used by being attached to a user's finger.
- the mounting member 60 is prepared in a plurality of sizes depending on the thickness of the user's fingers.
- the light emitting elements 51 and 52 output light toward the finger.
- the light receiving element 53 is attached at a position where the light reflected inside the finger is incident.
- the mounting member 60 further incorporates a light emission control section 31, a pulse wave measurement section 32, and a communication section 55.
- the light emission control section 31, the pulse wave measurement section 32, and the communication section 55 may be configured as one integrated circuit.
- the functions of the processing device 30 are realized by a ring device 61 and a portable mobile terminal 62.
- the mobile terminal 62 for example, a smartphone, a tablet terminal, a notebook computer, etc. are used.
- the mobile terminal 62 includes a communication section 64 , a peripheral blood pressure index calculation section 33 , a pulse wave feature amount calculation section 34 , a pulse pressure calculation section 35 , a control section 36 , and a display section 37 .
- the functions of the peripheral blood pressure index calculation section 33, the pulse wave feature amount calculation section 34, and the pulse pressure calculation section 35 may be realized by a server. When this configuration is adopted, data communication is performed between the mobile terminal 62 and the server via a communication line.
- Data communication is performed between the communication unit 55 of the ring device 61 and the communication unit 64 of the mobile terminal 62.
- short-range wireless communication systems of various standards are used, for example.
- the excellent effects of using the ring device 61 to acquire pulse waves will be explained. Since fingers have relatively thin epidermis, they are suitable for acquiring pulse waves using the photoplethysmogram sensor 50. Furthermore, since the capillary path is less complicated than that of the face, the value of the pulse wave feature value is likely to be stable. Therefore, the reliability of the pulse pressure determined from the pulse wave increases. Furthermore, when the pulse pressure measuring device is used continuously or intermittently, an excellent effect can be obtained in that even if the ring device 61 is worn on the finger for a long time, there is little discomfort or discomfort.
- peripheral blood pressure index which is one basic information for determining pulse pressure using the pulse pressure measuring device according to the first embodiment, will be described.
- peripheral blood pressure is defined as blood pressure in peripheral arterioles and capillaries.
- Peripheral blood pressure is sometimes used to mean blood pressure at the wrist or ankle measured with a cuff-type blood pressure monitor, but blood pressure at the wrist or ankle is a value measured in a large artery (such as the radial artery).
- Blood pressure in blood vessels decreases as blood progresses from large arteries to arterioles and capillaries. The degree to which blood pressure decreases varies depending on the measurement site, the individual's vascular condition (presence of arteriosclerosis, etc.), mental condition (autonomic nerve condition, etc.), environment (temperature, presence of noise, etc.), clothing, etc.
- peripheral blood pressure index an index that is effective for determining peripheral blood pressure is adopted as a peripheral blood pressure index.
- the peripheral blood pressure index is considered to have the following characteristics. First, when blood vessels are healthy and under conditions where vascular resistance does not change, peripheral blood pressure indicators have a positive correlation with blood pressure in the upper arm or wrist. Second, when the vicinity of the measurement site is cooled to constrict blood vessels, the peripheral blood pressure index decreases. When blood vessels constrict, peripheral vascular resistance increases and blood pressure in the upper arm and wrist may rise.
- FIG. 5 is a graph showing an example of a pulse wave, velocity pulse wave, and acceleration pulse wave.
- the peripheral blood pressure index calculation unit 33 (FIGS. 1, 2, and 3) performs first-order differentiation and second-order differentiation of the pulse wave.
- the waveforms obtained by first-order differentiation and second-order differentiation of a pulse wave are referred to as a velocity pulse wave and an acceleration pulse wave, respectively.
- the velocity pulse wave is determined by numerically differentiating the intensity of the pulse wave, which is distributed discretely at time intervals corresponding to the sampling rate, by the time interval corresponding to the sampling rate.
- the acceleration pulse wave is determined by numerically differentiating the magnitude of the velocity pulse wave.
- the horizontal axis of FIG. 5 represents time in units [s]
- the left vertical axis represents the magnitude of the velocity pulse wave and acceleration pulse wave normalized so that the maximum value is 1
- the right vertical axis represents the pulse wave. represents the size of in arbitrary units.
- a solid line, a long broken line, and a short broken line in the graph shown in FIG. 2 indicate a pulse wave, a velocity pulse wave, and an acceleration pulse wave, respectively.
- five peaks appear in an accelerated pulse wave within one beat.
- the 1st, 2nd, 3rd, 4th, and 5th peaks within one beat are called a wave, b wave, c wave, d wave, and e wave, respectively.
- the full width at half maximum of the first upward peak of the velocity pulse wave is written as "VE0.5".
- the difference between the peak value of the a wave and the peak value of the b wave is marked as “ab”
- the difference between the peak value of the a wave and the peak value of the d wave is marked as "ad”.
- a concave portion called the notch IC appears slightly behind the maximum peak of the pulse wave.
- FIG. 6 is a graph showing an example of a pulse wave and an accelerated pulse wave.
- the horizontal axis represents time, the left vertical axis represents the magnitude of the pulse wave in arbitrary units, and the right vertical axis represents the magnitude of the accelerated pulse wave in arbitrary units.
- 5 scales on the horizontal axis corresponds to 0.2 s.
- the peak value of the a wave of the accelerated pulse wave is marked as "a”, and the amplitude of the pulse wave is marked as "S”.
- the amplitude S of the pulse wave corresponds to the difference between the minimum value and the maximum value after the waveform is corrected so that the minimum values of two consecutive pulse waves have the same magnitude.
- pulse wave feature quantities that reflect the above two features of the peripheral blood pressure index.
- VE0.5 full width at half maximum
- a/S ⁇ Ratio of amplitude S of pulse wave to peak value a of wave a of accelerated pulse wave
- a/S ⁇ Ratio of amplitude S of pulse wave to peak value a of wave a of accelerated pulse wave
- a/S ⁇ Ratio of amplitude S of pulse wave to peak value a of wave a of accelerated pulse wave
- a/S ⁇ Ratio of amplitude S of pulse wave to peak value a of wave a of accelerated pulse wave
- a/S ⁇ Ratio of amplitude S of pulse wave to peak value a of wave a of accelerated pulse wave
- a/S ⁇ Ratio of amplitude S of pulse wave to peak value a of wave a of accelerated pulse wave
- a/S ⁇ Ratio of amplitude S of pulse wave to peak value
- Figures 7A and 7B show the vicinity of the elbow on the side where the finger, which is the measurement site, is adjusted when the height from the heart to the measurement site (finger) is changed, and when the measurement site is adjusted to the chest height. It is a graph showing the relationship between the value of peripheral blood pressure index "1/VE0.5" found from the pulse wave measured when cooling the body and the systolic blood pressure measured at the wrist. 7A and 7B show the case where the pulse pressure measuring device shown in FIG. 1 (green light) is used to measure the pulse wave, and the pulse pressure measuring device shown in FIG. 2 (near infrared light) is used to measure the pulse wave, respectively. The measurement results are shown below.
- Pulse waves measured using green light mainly reflect fluctuations in blood flow in capillaries 73 (FIG. 1)
- pulse waves measured using near-infrared light mainly reflect fluctuations in blood flow in capillaries 73 and arterioles 72.
- the fluctuations in blood flow shown in ( Figure 2) are reflected.
- the horizontal axis of the graphs in FIGS. 7A and 7B represents the systolic blood pressure at the wrist in units [mmHg], and the vertical axis represents the peripheral blood pressure index "1/(VE0.5)" in units [s -1 ]. represent.
- the results of measurements performed on three subjects A, B, and C are shown using triangle symbols, square symbols, and circle symbols, respectively.
- the three hollow symbols shown for each subject indicate the values of the pulse wave features obtained from the pulse waves obtained by setting the height of the measurement site (finger) to the height of the navel, chest, and forehead. It shows.
- the value of the peripheral blood pressure index "1/VE0.5" decreases in the order of height of the measurement site: navel, chest, and forehead.
- the symbol filled in black for each subject is the peripheral blood pressure index "1/VE0.5" obtained from the pulse wave obtained with the measurement site set at chest level and the area near the elbow cooled. ” value is shown.
- the peripheral blood pressure index "1/VE0.5” has a generally positive correlation with the systolic blood pressure at the wrist. I understand. Furthermore, although there are some exceptions, it can be seen that when the vicinity of the measurement site is cooled to constrict blood vessels, the peripheral blood pressure index "1/VE0.5” decreases. The appearance of this change matches the expected characteristics of the peripheral blood pressure index. Therefore, the peripheral blood pressure index "1/VE0.5" is considered to be an effective index for estimating peripheral blood pressure.
- the peripheral blood pressure index "1/VE0.5" the reciprocal of the parameter representing the width of the maximum peak of the velocity pulse wave may be used.
- a negative exponent of a parameter representing the width of the maximum peak of the velocity pulse wave may be used.
- a parameter representing the width of the maximum peak of the velocity pulse wave may be used as a variable, and a function such that the value of the function decreases as the width of the peak increases may be used as the peripheral blood pressure index.
- FIGS. 8A and 8B show the vicinity of the elbow on the side where the finger, which is the measurement site, is adjusted when the height from the heart to the measurement site (finger) is changed, and when the measurement site is adjusted to the chest height. It is a graph showing the relationship between the value of the peripheral blood pressure index "a/S" determined from the pulse wave measured when the patient is cooled, and the systolic blood pressure measured at the wrist.
- FIGS. 8A and 8B show the case where the pulse pressure measuring device shown in FIG. 1 (green light) is used to measure the pulse wave, and the pulse pressure measuring device shown in FIG. 2 (near infrared light) is used to measure the pulse wave, respectively. The measurement results are shown below.
- the horizontal axis of the graphs in FIGS. 8A and 8B represents the systolic blood pressure at the wrist in units [mmHg], and the vertical axis represents the peripheral blood pressure index "a/S" in arbitrary units.
- the meaning of each symbol in FIGS. 8A and 8B is the same as the meaning of each symbol in the graphs shown in FIGS. 7A and 7B.
- peripheral blood pressure index "a/S” is considered to be an effective index for estimating peripheral blood pressure. Note that from the results shown in FIGS. 8A and 8B, it can be seen that it is preferable to use green light rather than near-infrared light for measuring the peripheral blood pressure index "a/S".
- the peripheral blood pressure index "a/S” the product of the peak value a of the a wave of the accelerated pulse wave to a power with a positive index and the amplitude S of the pulse wave to a power with a negative index is calculated as the peripheral blood pressure. It can also be used as an indicator.
- the peripheral blood pressure index may be calculated based on information regarding the peak value of the a-wave of the accelerated pulse wave and the amplitude of the pulse wave signal.
- a function may be used as a peripheral blood pressure index in which the peak value a and the amplitude S are used as variables, and when the peak value a increases, the value of the function also increases, and when the amplitude S increases, the value of the function decreases. .
- Figures 9A and 9B show the area near the elbow on the side where the finger, which is the measurement site, is adjusted when the height from the heart to the measurement site (finger) is changed, and when the measurement site is adjusted to the chest height.
- 2 is a graph showing the relationship between the value of the peripheral blood pressure index "(ab)/(ad)" determined from the pulse wave measured when the patient is cooled, and the systolic blood pressure measured at the wrist.
- 9A and 9B show the case where the pulse pressure measuring device shown in FIG. 1 (green light) is used to measure the pulse wave, and the pulse pressure measuring device shown in FIG. 2 (near infrared light) is used to measure the pulse wave, respectively. The measurement results are shown below.
- the horizontal axis of the graphs in FIGS. 9A and 9B represents the systolic blood pressure at the wrist in units [mmHg], and the vertical axis represents the peripheral blood pressure index "(ab)/(ad)".
- the meaning of each symbol in FIGS. 9A and 9B is the same as the meaning of each symbol in the graphs shown in FIGS. 7A and 7B.
- peripheral blood pressure index "(ab)/(ad)" is considered to be an effective index for estimating peripheral blood pressure.
- peripheral blood pressure index (a-b)/(a-d)
- the peripheral blood pressure index may be calculated based on information regarding the difference between the peripheral blood pressure index and the peripheral blood pressure index.
- the difference (a-b) between the peak value of the a-wave and the peak value of the b-wave and the difference (a-d) between the peak value of the a-wave and the peak value of the d-wave are variables
- the difference (a A function in which the value of the function increases as the value of -b) increases, and decreases as the value of the difference (ad) increases may be used as the peripheral blood pressure index.
- the hand with the photoplethysmogram sensor was held at chest height, and the photoplethysmogram and blood pressure were each measured. If both were measured at the same time, blood flow in the finger would be inhibited by the cuff, so blood pressure was measured with a cuff-type sphygmomanometer after the photoplethysmogram measurement was completed.
- FIGS. 10A and 10B are scatter diagrams of multiple subjects in which the horizontal axis is the wrist systolic blood pressure (hereinafter sometimes simply referred to as blood pressure) and the vertical axis is the peripheral blood pressure index "1/VE0.5".
- FIGS. 11A and 11B are scatter diagrams of a plurality of subjects, with the horizontal axis representing wrist systolic blood pressure and the vertical axis representing peripheral blood pressure index "a/S.”
- 12A and 12B are scatter diagrams of a plurality of subjects, with the horizontal axis representing wrist systolic blood pressure and the vertical axis representing peripheral blood pressure index "(ab)/(ad)".
- FIGS. 10A, 11A, and 12A show the results of measuring pulse waves using green light
- FIGS. 10B, 11B, and 12B show the results of measuring pulse waves using near-infrared light. show.
- the black circle symbol and the hollow circle symbol indicate the measurement results of a healthy person and the measurement result of a diabetic patient, respectively.
- FIGS. 10A and 10B It can be seen from FIGS. 10A and 10B that the higher the blood pressure, the smaller the peripheral blood pressure index "1/VE0.5” tends to be. Furthermore, when pulse waves are measured using green light, the peripheral blood pressure index "1/VE0.5” of diabetic patients is concentrated in a relatively low range, and the peripheral blood pressure index "1/VE0.5” of healthy subjects is concentrated in a relatively low range. .5" is clearly separated from the distribution range. Such measurement results are presumed to be due to the following mechanism.
- vascular disease When blood sugar levels remain high, blood vessels become fragile and crumbly, a condition known as vascular disease, which progresses to arteriosclerosis in large blood vessels. Small blood vessels are also damaged, resulting in decreased blood vessel function (vascular endothelial function) and poor blood flow.
- peripheral blood pressure decreases as it progresses from large arteries to arterioles and capillaries. It is assumed that when vascular endothelial function decreases, the degree of decrease in peripheral blood pressure increases. It is said that approximately 40% to 60% of diabetic patients have hypertension. In the evaluation results shown in FIG. 10A, the systolic blood pressure of diabetic patients is higher than that of healthy subjects, but this tendency is not significant. On the other hand, it is clear that the peripheral blood pressure index "1/VE0.5" of diabetic patients tends to be lower than the peripheral blood pressure index "1/VE0.5" of healthy people. This can be explained by the fact that peripheral vascular disease occurs in diabetic patients and blood flow to peripheral blood vessels is inhibited, resulting in a decrease in the peripheral blood pressure index "1/VE0.5".
- the peripheral blood pressure index "a/S” tends to decrease as the blood pressure increases, similar to the peripheral blood pressure index "1/VE0.5". Note that in diabetic patients, the dispersion of the peripheral blood pressure index "a/S” is large, and the correlation between the peripheral blood pressure index "a/S” and blood pressure is not clear. This is presumed to be because the peak value a of the a wave of the accelerated pulse wave and the amplitude S of the pulse wave (FIG. 6) are easily influenced by various factors.
- the peripheral blood pressure index "(a-b)/(a-d)” tends to decrease as the blood pressure increases, similar to the peripheral blood pressure index "1/VE0.5". show. Furthermore, the magnitude of the peripheral blood pressure index "(a-b)/(a-d)” calculated from the pulse wave obtained using green light is clearly separated between healthy subjects and diabetic patients. . The three measurement results located on the horizontal axis where the peripheral blood pressure index "(ab)/(ad)" is zero indicate subjects for whom the b wave of the accelerated pulse wave could not be detected.
- FIGS. 13A to 17 feature quantities of pulse waves that are thought to have a causal relationship with blood pressure will be described.
- the drawings from FIG. 13A to FIG. 17 are scatter diagrams of a plurality of subjects, with the horizontal axis representing wrist systolic blood pressure and the vertical axis representing various characteristic amounts of pulse waves.
- the vertical axis in FIGS. 13A and 13B represents the elapsed time from the peak of the a wave of the accelerated pulse wave to the peak of the b wave (hereinafter referred to as "ab time”) in units [s].
- the vertical axis in FIGS. 14A and 14B represents the elapsed time from the peak of the b wave to the peak of the d wave of the accelerated pulse wave (hereinafter referred to as "bd time”) in units [s].
- the vertical axis in FIGS. 15A and 15B represents the elapsed time from the peak of the d wave to the peak of the e wave of the accelerated pulse wave (hereinafter referred to as "de time”) in units [s].
- 16A and 16B represents the elapsed time from the peak of the a wave of the accelerated pulse wave to the peak of the e wave (hereinafter referred to as "ae time”) in units of [s].
- the vertical axis in FIG. 17 represents the pulse interval in units [s].
- FIGS. 13A, 14A, 15A, and 16A show the characteristic amounts of pulse waves measured using green light
- FIGS. 13B, 14B, 15B, and 16B show the characteristics of pulse waves measured using near-infrared light.
- the characteristic quantities of the pulse wave measured using the method are shown.
- the pulse intervals shown in FIG. 17 are the same regardless of whether green light or near-infrared light is used.
- the feature amount "ab time” and systolic blood pressure have a weak negative correlation.
- the feature amount "bd time” and the systolic blood pressure have a positive correlation.
- the feature amount "de time” and the systolic blood pressure have a negative correlation.
- the feature quantity "ae time” and the pulse interval had no correlation with systolic blood pressure.
- the time when the peak of the d wave of the accelerated pulse wave appears is close to the time when the pulse wave takes its maximum value.
- the vicinity of the b-wave of the accelerated pulse wave is regarded as an ejection wave, and the vicinity of the d-wave is regarded as a reflected wave, and thereafter (near 0.4 seconds shown in FIG. 5), a notch IC of the pulse wave appears. Since there is no clear correlation between blood pressure and "ae time", the higher the blood pressure, the shorter the "de time". (in the direction approaching the peak position of the e-wave).
- An increase in blood flow means an increase in ejection waves and reflected waves. Therefore, due to the increase in blood flow, the convex portion of the pulse wave (range from the B wave to the D wave) spreads backward. As a result, it is thought that the position of the peak of the d-wave also moves backward. That is, it is considered that the blood flow rate increased due to the increase in blood pressure, and the "de time" became shorter due to the increase in the blood flow rate.
- the measurement results of some diabetic patients are located on the horizontal axis where "ab time” or "bd time” is 0 seconds. This indicates that the b wave of the accelerated pulse wave could not be detected. It can be seen that there were more subjects for whom b-waves could not be detected when measurements were taken using green light than when measurements were taken using near-infrared light. In subjects with poor peripheral blood circulation, such as diabetic patients, the b-wave of the accelerated pulse wave is often small, making it difficult to detect the b-wave.
- peripheral blood pressure index "1 /VE0.5'' Figure 10A
- peripheral blood pressure index ⁇ (a-b)/(a-d)'' when using green light and feature amount ⁇ (a-b)/(ad)'' when using green light or near-infrared light. It can be seen that "de time" can be mentioned.
- FIG. 18A to FIG. 22 are scatter diagrams of a plurality of subjects, with the horizontal axis representing pulse pressure and the vertical axis representing various characteristic amounts of pulse waves.
- the vertical axis in FIGS. 18A and 18B represents the peripheral blood pressure index "1/VE0.5" in units [s ⁇ 1 ].
- the vertical axis in FIGS. 19A and 19B represents the peripheral blood pressure index "(ab)/(ad)”.
- the vertical axis in FIGS. 20A and 20B represents the feature amount "de time” in units [s].
- the vertical axis in FIGS. 21A and 21B represents the feature amount "ae time” in units [s].
- the vertical axis in FIG. 22 represents the pulse interval in units [s].
- FIG. 18A, FIG. 19A, FIG. 20A, and FIG. 21A show the characteristic amounts of pulse waves measured using green light
- FIG. 18B, FIG. 19B, FIG. 20B, and FIG. The characteristic quantities of the pulse wave measured using the method are shown.
- the pulse intervals shown in FIG. 22 are the same regardless of whether green light or near-infrared light is used.
- peripheral blood pressure index "1/VE0.5” Figures 18A and 18B
- peripheral blood pressure index "(a-b)/(a-d)” 19A, FIG. 19B
- the feature amount "ae time” FIGS. 21A, 21B
- a stronger correlation was observed when green light was used than when near-infrared light was used.
- No significant correlation with pulse pressure is confirmed between the feature amount "de time” (FIGS. 20A and 20B) and the pulse interval (FIG. 22).
- peripheral blood pressure index "1/VE0.5” and the peripheral blood pressure index "(ab)/(ad)” have a negative correlation with pulse pressure. This is similar to the relationship between the peripheral blood pressure index "1/VE0.5” and the peripheral blood pressure index "(ab)/(ad)” and systolic blood pressure. It can be expected that a subject with a small peripheral blood pressure index "1/VE0.5” and a small peripheral blood pressure index "(ab)/(ad)” will have a large vascular resistance. It is generally known that when vascular resistance is high, pulse pressure is high. In other words, it is based on such general knowledge that the peripheral blood pressure index "1/VE0.5” and the peripheral blood pressure index "(a-b)/(a-d)” have a negative correlation with pulse pressure. does not contradict.
- the feature quantity "ae time” has a negative correlation with pulse pressure. There is no significant difference in the feature quantity "ae time” between when measured using green light and when measured using near-infrared light.
- the notch IC (FIG. 5) that appears in the pulse wave is said to be at the end of the systole, and the position of the peak of the e wave of the accelerated pulse wave corresponds to the position of the notch IC. Since there is no difference in "ae time” when using green light and when using near-infrared light, it is assumed that "ae time” is not easily affected by blood vessel conditions, etc. .
- a long “ae time” means that the left ventricle contracts for a long time. Therefore, "ae time” is considered to have a positive correlation with stroke cardiac output.
- the fact that the pulse pressure has a positive correlation with the "ae time” can be explained by the fact that as the stroke volume increases, the pulse pressure increases.
- pulse pressure is calculated based on a peripheral blood pressure index "1/VE0.5" that has a correlation with pulse pressure and a feature amount "ae time”.
- the pulse pressure is calculated using a function whose variables are the value of the power of the peripheral blood pressure index "1/VE0.5" and the value of the power of the feature quantity "ae time”.
- ⁇ and ⁇ are positive fitting parameters.
- the actual pulse pressure value can be calculated by multiplying the pulse pressure index value Pa by a coefficient.
- the fitting parameters ⁇ , ⁇ , and coefficients can be determined by actually conducting evaluation experiments.
- Pulse waves of a plurality of subjects were measured, and a pulse pressure index value Pa was calculated from the pulse waves. Furthermore, pulse pressure was calculated from the systolic and diastolic blood pressures measured at the wrist. Subjects included multiple healthy subjects and multiple diabetic patients. The measurement of the pulse wave was performed with the ring device 61 (FIG. 4) attached to the subject's finger, and the height of the measurement site approximately aligned with the height of the heart.
- the horizontal axis represents pulse pressure in the unit [mmHg], and the vertical axis represents pulse pressure index value Pa.
- the peripheral blood pressure index "1/VE0.5" was determined from the pulse wave measured using green light, and the feature amount "ae time” was determined from the pulse wave measured using near-infrared light.
- the filled circle symbols and hollow circle symbols in FIG. 23A indicate the measurement results of healthy subjects and diabetic patients, respectively. Overall, it can be seen that the pulse pressure index value Pa and the pulse pressure have a positive correlation.
- FIG. 23B is a scatter diagram showing the measurement results without distinguishing between healthy subjects and diabetic patients.
- the regression line is shown as a broken line.
- the coefficient of determination R 2 was approximately 0.47.
- the correlation coefficient is about 0.69, and it can be said that there is a sufficient correlation between the pulse pressure index value Pa and the pulse pressure.
- the pulse pressure measurement method according to the first embodiment allows the pulse pressure to be determined using the photoplethysmographic sensor.
- the peripheral blood pressure index "1/VE0.5" and the feature quantity "ae time” are obtained, and the pulse pressure can be calculated using equation (1). Note that the accuracy of the fitting parameters ⁇ and ⁇ may be improved by collecting more subjects and performing an evaluation experiment.
- the peripheral blood pressure index "1/VE0.5” is determined using green light, and the feature amount “ae time” is determined using near-infrared light.
- the peripheral blood pressure index "1/VE0.5” may be determined using near-infrared light, or the feature amount "ae time” may be determined using green light.
- green light instead of green light, light having a wavelength range from blue to yellow-green may be used.
- peripheral blood pressure index "1/VE0.5” another peripheral blood pressure index related to the steepness of the rise of the pulse wave, such as the peripheral blood pressure index "a/S” or “ (ab)/(ad)” may also be used.
- an index having a positive correlation with "ae time” herein referred to as "ae time index”
- a function may be used in which the value of the function decreases as the peripheral blood pressure index increases, and the value of the function increases as the ae time index increases.
- FIGS. 23A and 23B were collected by wearing the ring device 61 (FIG. 4) on the subject's fingertip, it may also be worn on the subject's fingertip.
- a ring-shaped ring device 61 (FIG. 5) is worn on the finger, but instead of the ring device 61, a device shaped to be worn on a part other than the finger may be used.
- a wearable device may be a wristband or wristwatch type that is worn on the wrist, an earphone type that is worn in the ear, a patch type that is attached to the skin, or a wearable device that is worn around the neck.
- a neckband type one may also be used.
- the pulse pressure measuring device does not necessarily have to be wearable, and may be a device that measures a pulse wave by pressing a finger against the photoplethysmographic sensor 50 as necessary.
- the pulse pressure measuring device may be a portable device such as a smartphone, or a fixed device.
- light reflected from living tissue such as a finger is detected, but light transmitted through living tissue may also be detected.
- a light emitting element and a light receiving element are placed facing each other with the finger in between. Note that depending on the positional relationship between the light emitting element and the light receiving element, both the light reflected by the living tissue and the light transmitted through the living tissue may be detected by the light receiving element. That is, the light receiving element may detect the light that is output from the light emitting element and passes through the biological tissue.
- pulse pressure is calculated based on a peripheral blood pressure index "1/VE0.5" that has a correlation with pulse pressure and a feature amount "ae time”.
- the pulse pressure is calculated based on the feature quantity "de time” in addition to the peripheral blood pressure index "1/VE0.5" and the feature quantity "ae time”.
- pulse pressure can be calculated using a function whose variables are the power of the peripheral blood pressure index "1/VE0.5", the power of the feature quantity "ae time”, and the power of the feature quantity "de time”. calculate.
- the pulse pressure index value Pad is calculated using the following formula.
- Pad (1/VE0.5) - ⁇ ⁇ (ae time) ⁇ ⁇ (de time) - ⁇ ... (2)
- ⁇ , ⁇ , and ⁇ are positive fitting parameters.
- the actual pulse pressure value can be calculated by multiplying the pulse pressure index value Pad by a coefficient.
- the fitting parameters ⁇ , ⁇ , ⁇ , and coefficients can be determined by actually conducting evaluation experiments.
- the horizontal axis represents pulse pressure in units [mmHg], and the vertical axis represents pulse pressure index value Pad.
- the peripheral blood pressure index "1/VE0.5" is obtained from the pulse wave measured using green light, and the feature quantities "ae time” and "de time” are obtained from the pulse wave measured using near-infrared light. Ta.
- the filled circle symbols and hollow circle symbols in FIG. 24A indicate the measurement results of healthy subjects and diabetic patients, respectively. Overall, it can be seen that the pulse pressure index value Pad and pulse pressure have a positive correlation.
- FIG. 24B is a scatter diagram showing the measurement results without distinguishing between healthy subjects and diabetic patients.
- the regression line is shown as a broken line.
- the coefficient of determination R 2 was approximately 0.52.
- the correlation coefficient is about 0.72, and it can be said that there is a strong correlation between the pulse pressure index value Pad and the pulse pressure. In this manner, the pulse pressure measurement method according to the second embodiment allows the pulse pressure to be determined using the photoplethysmographic sensor.
- the peripheral blood pressure index "1/VE0.5", the feature quantity "ae time”, and the feature quantity "de time” are obtained, and the pulse pressure can be calculated using equation (2).
- the accuracy of the fitting parameters ⁇ , ⁇ , and ⁇ may be improved by collecting more subjects and performing an evaluation experiment.
- the peripheral blood pressure index "1/VE0.5” is determined using green light, and the feature quantities “ae time” and “de time” are determined using near-infrared light.
- the peripheral blood pressure index "1/VE0.5” may be obtained using near-infrared light, or the feature quantity "ae time” or “de time” may be obtained using green light. .
- green light instead of green light, light having a wavelength range from blue to yellow-green may be used.
- peripheral blood pressure index "1/VE0.5” another peripheral blood pressure index related to the steepness of the rise of the pulse wave, such as the peripheral blood pressure index "a/S” or " (ab)/(ad)" may also be used.
- an ae time index having a positive correlation with "ae time” may be used.
- an index having a positive correlation with "de time” herein referred to as "de time index”
- the value of the function decreases as the peripheral blood pressure index increases, the value of the function increases as the ae time index increases, and the value of the function decreases as the de time index increases.
- a function may also be used.
- FIG. 25 is a scatter diagram of multiple measurement results measured over a long period of time for one subject. Note that this subject is a healthy person and is different from the subject who collected the data shown in FIGS. 24A and 24B.
- the horizontal axis of FIG. 25 represents pulse pressure in units [mmHg], and the vertical axis represents pulse pressure index value Pad.
- the fitting parameters ⁇ , ⁇ , and ⁇ in equation (2) are the same as in FIGS. 24A and 24B.
- One set consisted of measuring the pulse wave with the height of the measurement site approximately matching the navel height, chest height, and forehead height, and 24 sets of measurements were performed over a 20-day period. went. The measurement times were morning, noon, and evening. During 20 days, 9 sets of measurements were performed in the morning, 12 sets of measurements were performed in the afternoon, and 3 sets of measurements were performed in the evening.
- the measurement procedure is as follows. First, the pulse wave is measured using a photoplethysmographic sensor at the level of the navel, and then the blood pressure at the wrist is measured at the level of the navel. Next, the pulse wave is measured using a photoplethysmographic sensor at chest level, and then the blood pressure at the wrist is measured at chest level. Next, the pulse wave is measured using a photoplethysmographic sensor at the level of the forehead, and finally the blood pressure at the wrist is measured at the level of the forehead. The measurement of pulse waves by the photoplethysmographic sensor and the measurement of blood pressure at the wrist are not performed at the same time.
- the circle symbol, square symbol, and triangle symbol in the scatter diagram shown in Figure 25 indicate the measurement results obtained by adjusting the height of the measurement site to the forehead height, chest height, and navel height, respectively. .
- the broken line shown in FIG. 25 is the same as the regression line shown in FIG. 24B. As can be seen from FIG. 25, the pulse pressure tends to be relatively large at the navel level and relatively small at the forehead level.
- the pulse pressure index value Pad varies among the navel height, chest height, and forehead height, but is distributed in almost the same range regardless of the height of the measurement site. It can be seen that this distribution almost overlaps with the distribution of the pulse pressure index value Pad of a healthy person shown in FIG. 24A. Therefore, it can be inferred that the pulse pressure index value Pad calculated using equation (2) will not vary greatly even if the height of the measurement site deviates from the height of the heart.
- What is useful to the user is the value of the pulse pressure at heart level. Considering user convenience, it is desirable to be able to estimate the pulse pressure value at the heart level even if the height of the measurement site, such as a finger, deviates from the heart level.
- the calculation formula for the pulse pressure index value Pad of formula (2) used in the second embodiment is also useful from the viewpoint of user convenience.
- the blood pressure measuring device has a function of measuring the difference in height between the measurement site and the heart.
- FIG. 26 is a perspective view and a block diagram of a pulse pressure measuring device according to a third embodiment.
- the pulse pressure measuring device according to the third embodiment includes a ring device 61 and a mobile terminal 62, similar to the pulse pressure measuring device according to the modification of the first embodiment shown in FIG.
- the mobile terminal 62 of the pulse pressure measuring device according to the third embodiment has, in addition to the configuration of the mobile terminal 62 of the pulse pressure measuring device according to the modification of the first embodiment (FIG. 4), a camera 63, an acceleration sensor 65, and a It includes a calculation unit 38.
- the height calculation unit 38 calculates the difference in height between the ring device 61 and the user's heart.
- FIG. 27 is a schematic diagram for explaining the procedure for measuring the difference in height between the ring device 61 and the heart.
- a user who wants to measure pulse pressure wears the ring device 61 on his finger, grips the mobile terminal 62 with the hand on which he wears the ring device 61, and images his own face with the camera 63.
- the height calculation section 38 (FIG. 26) of the mobile terminal 62 displays the captured image on the display section 37 in real time. Furthermore, the height calculation unit 38 displays an oval or rectangular figure on the display unit 37, superimposed on the image of the user's face.
- the user While viewing the display unit 37, the user adjusts the relative position of the mobile terminal 62 and his or her face so that the image of his or her face fits within an oval or rectangular shape. Further, the user maintains a posture such that the trunk of the user's body is along the vertical direction.
- the height calculation unit 38 stores the user's physical information such as height and weight in advance. Furthermore, statistical relationship information between physical information and face size is stored in the height calculation section 38. The height calculation unit 38 calculates the size of the user's face from the stored physical information using statistical relationship information between the physical information and the facial size. A distance L1 from the mobile terminal 62 to the user's face (for example, eyes) is calculated from the determined face size and the size of the user's face image.
- the height calculation unit 38 calculates the inclination of the mobile terminal 62 with respect to the vertical direction (direction of gravity) from the measurement results of the acceleration sensor 65.
- the height H1 from the mobile terminal 62 to the user's eyes is calculated based on the inclination of the mobile terminal 62 and the distance L1 from the mobile terminal 62 to the user's eyes.
- the height calculation unit 38 statistically calculates the height H2 from the heart to the eyes based on the user's physical information. However, an error occurs in the height H2 in a posture in which the trunk is greatly bent, such as when the user bends forward. Here, it is assumed that the trunk is not tilted. For example, as the height H2 from the heart to the eyes, the difference between the medial canthus height and the nipple height included in the "AIST human body size database 1991-1992" can be used.
- the height calculation unit 38 uses the height H1 from the mobile terminal 62 to the user's eyes and the height H2 from the heart to the eyes to calculate the difference in height between the mobile terminal 62 and the heart. calculate. It can be assumed that the height of the ring device 61 (measurement site) is approximately equal to the height of the mobile terminal 62.
- FIG. 28 is a flowchart showing the procedure of the pulse pressure measurement method executed by the pulse pressure measurement device according to the third embodiment.
- the height calculation unit 38 calculates the difference in height between the ring device 61 and the heart (step SA1). This calculation can be performed by the method described with reference to FIG.
- the height calculation unit 38 determines whether the calculated value of the difference between the ring device 61 and the heart is within an allowable range (step SA2). If the difference is within the allowable range, the pulse pressure calculation unit 35 (FIG. 26) calculates the pulse pressure based on the measured pulse wave (step SA3).
- the pulse pressure measurement method according to the first embodiment or the second embodiment can be used to calculate the pulse pressure.
- the control unit 36 stores or outputs the calculated value of the pulse pressure (step SA4).
- the calculated value of pulse pressure is stored, for example, in association with the date and time of measurement.
- the calculated value of the pulse pressure is outputted, for example, by displaying it on the display unit 37 (FIG. 26), transmitting it to the server, etc.
- the functions of the peripheral blood pressure index calculation section 33, the pulse wave feature amount calculation section 34, and the pulse pressure calculation section 35 (FIG. 4) may be realized by a server.
- the server calculates the pulse pressure, stores the calculated value of the pulse pressure, and transmits the calculated value of the pulse pressure to the mobile terminal 62 (FIG. 4).
- step SA2 If it is determined in step SA2 that the difference is outside the allowable range, the height calculation unit 38 notifies the user that the difference in height between the ring device 61 and the heart is outside the allowable range ( Step SA5).
- the user who receives this notification can adjust the height of the ring device 61 to match the height of the heart and perform re-measurement.
- pulse pressure can be measured by adjusting the height of the measurement site to the height of the heart. Therefore, the accuracy of pulse pressure measurement can be improved. Note that even if it is determined in step SA2 that the difference is outside the allowable range, the pulse pressure is measured and the measured value of the pulse pressure is output with a note indicating that the reliability of the measured value is not high. It's okay.
- FIG. 29 is a flowchart showing the procedure of a pulse pressure measuring method executed by a pulse pressure measuring device according to a modification of the third embodiment.
- the height calculation unit 38 calculates the difference in height between the ring device 61 and the heart (step SA1), as in the third embodiment (FIG. 28).
- pulse pressure is not measured if the difference is outside the allowable range, but in this modification, the pulse pressure is measured based on the measured pulse wave regardless of whether the difference is within the allowable range.
- the pulse pressure calculation unit 35 calculates the pulse pressure (step SA3).
- the pulse pressure calculation unit 35 corrects the calculated value of the pulse pressure based on the difference in height between the ring device 61 and the heart (step SA5).
- the relationship between the height difference between the ring device 61 and the heart and the pulse pressure may be determined in advance by conducting an evaluation experiment.
- the corrected value of pulse pressure is stored or output (step SA6).
- blood pressure and pulse pressure change depending on the amount of exercise. Furthermore, when the measurement site is moving, inertial force acts on the blood in the blood vessels, so the waveform of the pulse wave fluctuates. Medically useful are blood pressure and pulse pressure measured in a resting state. Furthermore, during exercise, the contact state between the photoplethysmogram sensor and the skin tends to change. If the contact state changes, noise will be superimposed on the measured pulse wave. In the fourth embodiment, it is determined whether the user is in a resting state, and the medically useful pulse pressure in the resting state is measured.
- FIG. 30 is a perspective view and a block diagram of a pulse pressure measuring device according to a fourth embodiment.
- the pulse pressure measuring device according to the fourth embodiment includes a ring device 61 and a mobile terminal 62, similarly to the pulse pressure measuring device according to the modified example of the first embodiment (FIG. 4).
- the ring device 61 of the pulse pressure measuring device according to the fourth embodiment is equipped with an acceleration sensor 54 in addition to the configuration of the ring device 61 of the pulse pressure measuring device according to the modified example of the first embodiment (FIG. 4).
- the mobile terminal 62 includes a resting state determining section 39 in addition to the configuration of the mobile terminal 62 of the pulse pressure measuring device according to the modification of the first embodiment.
- the resting state determining unit 39 uses the measurement results of the acceleration sensor 54 to determine whether the user is in a resting state. For example, when the measured value of acceleration by the acceleration sensor 54 remains below the determination threshold for a predetermined period of time, for example, 5 minutes, the resting state determination unit 39 determines that the user is in a resting state.
- FIG. 31 is a flowchart showing the procedure of the pulse pressure measuring method executed by the pulse pressure measuring device according to the fourth embodiment.
- the resting state determination unit 39 determines whether the user wearing the ring device 61 is in a resting state (step SB1). When it is determined that the user is not in a resting state, determination of the resting state is repeatedly performed at a constant cycle until the user is in a resting state (step SB2). If it is determined that the user is in a resting state, the pulse pressure calculation unit 35 calculates the pulse pressure based on the pulse wave acquired at that time (step SB3). Thereafter, the calculated value of pulse pressure is stored or output (step SB4).
- the excellent effects of the fourth embodiment will be explained.
- the pulse pressure is calculated based on the pulse wave when the user is in a resting state, the accuracy of the calculated value of the pulse pressure can be improved.
- the fourth embodiment it is determined whether or not the ring device 61 is in a resting state based on the measured value of acceleration by the acceleration sensor 54 mounted on the ring device 61.
- a gyro sensor may be installed in place of the acceleration sensor 54, and whether or not the vehicle is in a resting state may be determined based on the angular acceleration measured by the gyro sensor.
- the acceleration sensor 54 and the gyro sensor may be used together to determine whether or not the person is in a resting state.
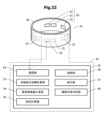
- FIG. 32 is a perspective view and a block diagram of a pulse pressure measuring device according to a fifth embodiment.
- the pulse pressure measuring device according to the fifth embodiment includes a ring device 61 and a mobile terminal 62, similarly to the pulse pressure measuring device according to the modified example of the first embodiment (FIG. 4).
- the ring device 61 of the pulse pressure measuring device according to the fifth embodiment is equipped with an acceleration sensor 54, similar to the ring device 61 (FIG. 30) of the pulse pressure measuring device according to the fourth embodiment.
- the mobile terminal 62 includes a sleep state determining section 40 in addition to the configuration of the mobile terminal 62 of the pulse pressure measuring device according to the modification of the first embodiment.
- the sleep state determining unit 40 uses the measurement results of the acceleration sensor 54 to determine whether the user is in a resting state. A method for determining whether a user is in a sleeping state or in an awake state will be described below.
- the sleep state determining unit 40 determines that body movement is occurring, for example, when the measured value of acceleration by the acceleration sensor 54 exceeds a predetermined threshold. When the number of occurrences of body movements within a predetermined time is less than or equal to a predetermined threshold, it is determined that the subject is in a sleeping state.
- the predetermined time may be selected, for example, from a range of 15 minutes or more and 90 minutes or less. Even during sleep, acceleration may suddenly increase due to things like turning over in bed, but this happens less frequently than when awake, so it is not possible to accurately determine whether or not a person is in a sleeping state based on the number of body movements that occur within a given period of time. can.
- the fingers move more frequently when awake than the hips, chest, wrists, etc. Utilizing this characteristic, by wearing the ring device 61 on your finger, it is possible to determine whether or not you are in a sleep state with higher accuracy than when you wear a photoplethysmographic sensor on other parts such as your wrist. can.
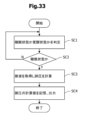
- FIG. 33 is a flowchart showing the procedure of the pulse pressure measuring method executed by the pulse pressure measuring device according to the fifth embodiment.
- the sleep state determination unit 40 determines whether the user wearing the ring device 61 is in a sleep state or an awake state (step SC1). If it is determined that the patient is not in a sleeping state, the determination as to whether the patient is in a sleeping state or in an awake state is repeated at regular intervals (step SC2).
- the pulse wave measurement unit 32 measures the pulse wave
- the pulse pressure calculation unit 35 calculates the pulse pressure (step SC3). Note that after it is determined that the person is in a sleeping state, it is further determined whether or not the person is in a resting state, similarly to step SB1 shown in FIG. may be calculated. Once the calculated value of pulse pressure is determined, the control unit 36 stores or outputs the calculated value of pulse pressure (step SC4).
- pulse pressure during a sleeping state can be automatically determined. If it is determined that the patient is not in a sleeping state, the pulse wave is not measured, so battery consumption can be reduced.
- whether or not the person is in a sleeping state is determined based on the frequency of occurrence of body movements, but it may be determined whether or not the person is in a sleeping state using other methods. It is known that the temperature of your hands and fingers increases during sleep. A temperature sensor is mounted on the ring device 61 (Fig. 32), and the circadian rhythm is estimated from the measured value of the temperature sensor, and the temperature measured value is combined with the frequency of body movements to determine whether or not the patient is in a sleep state. Good too.
- the pulse rate tends to decrease compared to when awake. Furthermore, respiratory fluctuations are more likely to occur in the pulse rate. Utilizing this characteristic, it may be determined whether or not the person is in a sleeping state by adding the tendency of fluctuations in pulse rate to the frequency of body movements.
- the fifth embodiment it is determined whether or not the person is in a sleeping state based on the frequency of occurrence of body movements.
- pulse wave measurement is started when the frequency of body movements becomes less than a certain frequency, and whether the sleep state is determined based on the frequency of body movements and the measured pulse wave. It may be determined whether or not.
- the pulse wave is not measured when the awake state is determined, but if the battery capacity is sufficiently large, the pulse wave is measured both in the sleeping state and in the awake state. and pulse pressure may be calculated. In this case, it is preferable to store the calculated value of the pulse pressure in association with identification information that distinguishes between the awake state and the sleeping state. This makes it possible to know the difference in tendency between the leg pressure in the awake state and the pulse pressure in the sleeping state.
- Processing device 31 Light emission control section 32 Pulse wave measurement section 33 Peripheral blood pressure index calculation section 34 Pulse wave feature amount calculation section 35 Pulse pressure calculation section 36 Control section 37 Display section 38 Height calculation section 39 Resting state determination section 40 Sleep state determination Part 50 Photoplethysmographic sensor 51, 52 Light emitting element 53 Light receiving element 54 Acceleration sensor 55 Communication part 56 Gyro sensor 60 Mounting member 61 Ring device 62 Mobile terminal 63 Camera 64 Communication part 65 Acceleration sensor 70 User's body surface 71 Epidermal area 72 Fine Artery 73 Capillary
Landscapes
- Health & Medical Sciences (AREA)
- Life Sciences & Earth Sciences (AREA)
- Engineering & Computer Science (AREA)
- Animal Behavior & Ethology (AREA)
- Public Health (AREA)
- Veterinary Medicine (AREA)
- Biophysics (AREA)
- Pathology (AREA)
- Physics & Mathematics (AREA)
- Biomedical Technology (AREA)
- Heart & Thoracic Surgery (AREA)
- Medical Informatics (AREA)
- Molecular Biology (AREA)
- Surgery (AREA)
- General Health & Medical Sciences (AREA)
- Cardiology (AREA)
- Physiology (AREA)
- Educational Technology (AREA)
- Oral & Maxillofacial Surgery (AREA)
- Child & Adolescent Psychology (AREA)
- Developmental Disabilities (AREA)
- Dentistry (AREA)
- Hospice & Palliative Care (AREA)
- Psychiatry (AREA)
- Psychology (AREA)
- Social Psychology (AREA)
- Vascular Medicine (AREA)
- Measuring Pulse, Heart Rate, Blood Pressure Or Blood Flow (AREA)
Priority Applications (1)
| Application Number | Priority Date | Filing Date | Title |
|---|---|---|---|
| JP2024540317A JP7776014B2 (ja) | 2022-08-12 | 2023-07-07 | 脈圧測定装置及び脈圧測定方法 |
Applications Claiming Priority (2)
| Application Number | Priority Date | Filing Date | Title |
|---|---|---|---|
| JP2022128681 | 2022-08-12 | ||
| JP2022-128681 | 2022-08-12 |
Publications (1)
| Publication Number | Publication Date |
|---|---|
| WO2024034305A1 true WO2024034305A1 (ja) | 2024-02-15 |
Family
ID=89851417
Family Applications (1)
| Application Number | Title | Priority Date | Filing Date |
|---|---|---|---|
| PCT/JP2023/025307 Ceased WO2024034305A1 (ja) | 2022-08-12 | 2023-07-07 | 脈圧測定装置及び脈圧測定方法 |
Country Status (2)
| Country | Link |
|---|---|
| JP (1) | JP7776014B2 (https=) |
| WO (1) | WO2024034305A1 (https=) |
Citations (4)
| Publication number | Priority date | Publication date | Assignee | Title |
|---|---|---|---|---|
| JPH1189806A (ja) * | 1997-09-18 | 1999-04-06 | Matsushita Electric Ind Co Ltd | 非観血式血圧計 |
| JP2006006897A (ja) * | 2004-05-21 | 2006-01-12 | Sony Corp | 血圧測定方法及び装置 |
| JP2018130319A (ja) * | 2017-02-15 | 2018-08-23 | 国立大学法人 東京大学 | 血圧測定装置、血圧測定方法及び血圧測定プログラム |
| US20220233079A1 (en) * | 2021-01-25 | 2022-07-28 | Samsung Electronics Co., Ltd. | Apparatus and method for estimating blood pressure |
-
2023
- 2023-07-07 WO PCT/JP2023/025307 patent/WO2024034305A1/ja not_active Ceased
- 2023-07-07 JP JP2024540317A patent/JP7776014B2/ja active Active
Patent Citations (4)
| Publication number | Priority date | Publication date | Assignee | Title |
|---|---|---|---|---|
| JPH1189806A (ja) * | 1997-09-18 | 1999-04-06 | Matsushita Electric Ind Co Ltd | 非観血式血圧計 |
| JP2006006897A (ja) * | 2004-05-21 | 2006-01-12 | Sony Corp | 血圧測定方法及び装置 |
| JP2018130319A (ja) * | 2017-02-15 | 2018-08-23 | 国立大学法人 東京大学 | 血圧測定装置、血圧測定方法及び血圧測定プログラム |
| US20220233079A1 (en) * | 2021-01-25 | 2022-07-28 | Samsung Electronics Co., Ltd. | Apparatus and method for estimating blood pressure |
Non-Patent Citations (2)
| Title |
|---|
| NATARAJAN KEERTHANA, BLOCK ROBERT C., YAVARIMANESH MOHAMMAD, CHANDRASEKHAR ANAND, MESTHA LALIT K., INAN OMER T., HAHN JIN-OH, MUKK: "Photoplethysmography Fast Upstroke Time Intervals Can Be Useful Features for Cuff-Less Measurement of Blood Pressure Changes in Humans", IEEE TRANSACTIONS ON BIOMEDICAL ENGINEERING, IEEE, USA, vol. 69, no. 1, 1 January 2022 (2022-01-01), USA, pages 53 - 62, XP093139920, ISSN: 0018-9294, DOI: 10.1109/TBME.2021.3087105 * |
| OMATA, KUMIKO ET AL.: "Effects of hand skin temperature and blood pressure against accelerated pulse waves and pulse wave velocity", NIHON RINSHO SEIRI GAKKAI ZASSHI - JAPANESE JOURNAL OF CLINICALPHYSIOLOGY, NIHON RINSHO SEIRI GAKKAI, TOKYO, JP, vol. 46, no. 2, 1 May 2016 (2016-05-01), JP , pages 99 - 100, XP009552916, ISSN: 0286-7052 * |
Also Published As
| Publication number | Publication date |
|---|---|
| JPWO2024034305A1 (https=) | 2024-02-15 |
| JP7776014B2 (ja) | 2025-11-26 |
Similar Documents
| Publication | Publication Date | Title |
|---|---|---|
| JP6662459B2 (ja) | 血圧状態測定装置 | |
| JP6672489B2 (ja) | 個人健康データ収集 | |
| US20150366469A1 (en) | System for measurement of cardiovascular health | |
| EP3030145B1 (en) | Monitoring system and method for monitoring the hemodynamic status of a subject | |
| TWI623298B (zh) | 穿戴式生理量測儀 | |
| US7641614B2 (en) | Wearable blood pressure sensor and method of calibration | |
| CN105342591B (zh) | 用于测量连续无创血压(cNIBP)的体佩式系统 | |
| IL259841A (en) | Observational heart failure monitoring system | |
| JP2018501016A (ja) | ウェアラブル血行動態センサ | |
| WO2014022906A1 (en) | Mobile device system for measurement of cardiovascular health | |
| JPWO2018043638A1 (ja) | 血圧推定装置 | |
| WO2013165474A1 (en) | Continuously wearable non-invasive apparatus for detecting abnormal health conditions | |
| KR20190105421A (ko) | 광혈류 측정기 기반의 인체착용형 혈압 측정장치 및 혈압 측정방법 | |
| TWM542444U (zh) | 穿戴式多功能脈搏波診斷與分析裝置 | |
| TWM528727U (zh) | 穿戴式生理量測儀 | |
| US20250072836A1 (en) | Pulse wave signal processor, physiological information measurement device, and contact-pressure abnormality determination method | |
| CN121152597A (zh) | 基于脉搏形态特征确定血压的系统和方法 | |
| US20240423547A1 (en) | Blood pressure estimation method and biological information measurement system | |
| JP7675335B2 (ja) | 血行動態推定方法 | |
| JP7776014B2 (ja) | 脈圧測定装置及び脈圧測定方法 | |
| JP7708307B2 (ja) | 末梢血圧推定方法および生体情報測定システム | |
| CN121099945A (zh) | 基于脉搏相对时序确定血压的系统、可穿戴设备和方法 | |
| RU2853903C1 (ru) | Система (варианты) и способ измерения артериального давления на основе множества устройств | |
| JP7689658B2 (ja) | 血管機能推定方法 | |
| JP7790584B2 (ja) | 血管内皮機能評価システム、及び血管内皮機能評価装置 |
Legal Events
| Date | Code | Title | Description |
|---|---|---|---|
| 121 | Ep: the epo has been informed by wipo that ep was designated in this application |
Ref document number: 23852288 Country of ref document: EP Kind code of ref document: A1 |
|
| ENP | Entry into the national phase |
Ref document number: 2024540317 Country of ref document: JP Kind code of ref document: A |
|
| NENP | Non-entry into the national phase |
Ref country code: DE |
|
| 122 | Ep: pct application non-entry in european phase |
Ref document number: 23852288 Country of ref document: EP Kind code of ref document: A1 |