WO2024029005A1 - 解析装置及び光ファイバセンシング方法 - Google Patents
解析装置及び光ファイバセンシング方法 Download PDFInfo
- Publication number
- WO2024029005A1 WO2024029005A1 PCT/JP2022/029795 JP2022029795W WO2024029005A1 WO 2024029005 A1 WO2024029005 A1 WO 2024029005A1 JP 2022029795 W JP2022029795 W JP 2022029795W WO 2024029005 A1 WO2024029005 A1 WO 2024029005A1
- Authority
- WO
- WIPO (PCT)
- Prior art keywords
- optical fiber
- section
- analysis
- frequency modulation
- optical
- Prior art date
- Legal status (The legal status is an assumption and is not a legal conclusion. Google has not performed a legal analysis and makes no representation as to the accuracy of the status listed.)
- Ceased
Links
Images




Classifications
-
- G—PHYSICS
- G01—MEASURING; TESTING
- G01D—MEASURING NOT SPECIALLY ADAPTED FOR A SPECIFIC VARIABLE; ARRANGEMENTS FOR MEASURING TWO OR MORE VARIABLES NOT COVERED IN A SINGLE OTHER SUBCLASS; TARIFF METERING APPARATUS; MEASURING OR TESTING NOT OTHERWISE PROVIDED FOR
- G01D5/00—Mechanical means for transferring the output of a sensing member; Means for converting the output of a sensing member to another variable where the form or nature of the sensing member does not constrain the means for converting; Transducers not specially adapted for a specific variable
- G01D5/26—Mechanical means for transferring the output of a sensing member; Means for converting the output of a sensing member to another variable where the form or nature of the sensing member does not constrain the means for converting; Transducers not specially adapted for a specific variable characterised by optical transfer means, i.e. using infrared, visible, or ultraviolet light
-
- G—PHYSICS
- G01—MEASURING; TESTING
- G01D—MEASURING NOT SPECIALLY ADAPTED FOR A SPECIFIC VARIABLE; ARRANGEMENTS FOR MEASURING TWO OR MORE VARIABLES NOT COVERED IN A SINGLE OTHER SUBCLASS; TARIFF METERING APPARATUS; MEASURING OR TESTING NOT OTHERWISE PROVIDED FOR
- G01D5/00—Mechanical means for transferring the output of a sensing member; Means for converting the output of a sensing member to another variable where the form or nature of the sensing member does not constrain the means for converting; Transducers not specially adapted for a specific variable
- G01D5/26—Mechanical means for transferring the output of a sensing member; Means for converting the output of a sensing member to another variable where the form or nature of the sensing member does not constrain the means for converting; Transducers not specially adapted for a specific variable characterised by optical transfer means, i.e. using infrared, visible, or ultraviolet light
- G01D5/32—Mechanical means for transferring the output of a sensing member; Means for converting the output of a sensing member to another variable where the form or nature of the sensing member does not constrain the means for converting; Transducers not specially adapted for a specific variable characterised by optical transfer means, i.e. using infrared, visible, or ultraviolet light with attenuation or whole or partial obturation of beams of light
- G01D5/34—Mechanical means for transferring the output of a sensing member; Means for converting the output of a sensing member to another variable where the form or nature of the sensing member does not constrain the means for converting; Transducers not specially adapted for a specific variable characterised by optical transfer means, i.e. using infrared, visible, or ultraviolet light with attenuation or whole or partial obturation of beams of light the beams of light being detected by photocells
- G01D5/353—Mechanical means for transferring the output of a sensing member; Means for converting the output of a sensing member to another variable where the form or nature of the sensing member does not constrain the means for converting; Transducers not specially adapted for a specific variable characterised by optical transfer means, i.e. using infrared, visible, or ultraviolet light with attenuation or whole or partial obturation of beams of light the beams of light being detected by photocells influencing the transmission properties of an optical fibre
Definitions
- the present disclosure relates to an analysis device for an optical fiber sensing device using OFDR (Optical Frequency Domain Reflectometry) and a sensing method thereof.
- OFDR Optical Frequency Domain Reflectometry
- FIG. 1 is a diagram explaining the sensing principle using OFDR.
- OFDR employs frequency swept light as probe light. Then, by Fourier transforming the waveform r( ⁇ ) (FIG. 1(A)) of the Rayleigh backscattered light for the probe light of the optical fiber, the spectrum S( ⁇ ) (FIG. 1(B)) can be analyzed ( For example, see Non-Patent Document 1).
- the spectrum S( ⁇ ) of the backscattered light changes with respect to the strain and temperature of the optical fiber (spectral shift). Therefore, by detecting how much the reference spectrum S ref obtained in the reference measurement has moved at each measurement time (spectral shift ⁇ ), the amount of change in strain and temperature of the optical fiber can be calculated as shown in the following equation. can do.
- ⁇ is the spectral shift
- ⁇ 0 is the center frequency of the probe light
- ⁇ is the strain
- T is the temperature.
- Optical fiber sensing devices using OFDR have a basic problem: optical frequency modulation caused by vibrations in front of the analysis position changes the distance to the analysis position, making it difficult to obtain a consistent optical spectrum and making correct vibration analysis difficult. be.
- FIG. 2 is a diagram explaining the basic problem.
- FIG. 2A shows the waveform r( ⁇ ) of Rayleigh backscattered light for the probe light of the optical fiber. Normally, vibrations occur in optical fibers. Therefore, the position of the waveform r( ⁇ ) to be analyzed changes over time due to the vibration (frequency offset 21) of the optical fiber before the analysis position (interval from time ⁇ 1 to ⁇ 2 ) (probe light incident end side). , the period from time ⁇ 1 to ⁇ 2 includes a waveform r( ⁇ ) that is not subject to analysis.
- Non-Patent Document 2 discloses a method for alleviating the influence of positional deviation due to expansion of the analysis length. This method utilizes the fact that, with respect to the frequency offset 21, if the sensor length (the interval from time ⁇ 1 to ⁇ 2 ) is sufficiently long, positional deviation can be suppressed (it has resistance to vibration). However, this method poses a new problem in that increasing the analysis length degrades the spatial resolution of strain analysis.
- Non-Patent Document 3 discloses a method of correcting positional deviation by signal processing.
- This method is a signal processing method that estimates the distance offset by cross-correlating the loss distribution waveforms of the vibration sensors and tracks the position of the vibration sensor to be analyzed.
- this method poses a new problem in that the signal load for cross-correlation is large.
- the present invention provides an analysis device and an optical fiber sensing method for an optical fiber sensing device that can suppress the influence of positional deviation due to vibration with a small processing load without deteriorating the spatial resolution.
- the purpose is to
- an optical fiber sensing device and a method thereof according to the present invention calculate the amount of optical frequency modulation of each section of the optical fiber from the spectral shift of the section, and each section We decided to correct the positional deviation of the analysis position using the cumulative value of the amount of optical frequency modulation.
- the analysis device for an optical fiber sensing device is an analysis device included in an optical fiber sensing device using OFDR, and includes: calculating the amount of optical frequency modulation for each section from the spectral shift measured for each section of the optical fiber; calculating a cumulative value by accumulating the optical frequency modulation amounts of the sections located closer to the proximal end than the analytical position of the optical fiber; and correcting the analytical position based on the cumulative value.
- the optical fiber sensing method is an optical fiber sensing method using OFDR, measuring the spectral shift for each section of optical fiber; calculating an optical frequency modulation amount for each section from the spectral shift; A cumulative value is calculated by accumulating the optical frequency modulation amount of the section located closer to the proximal end than the analysis position of the optical fiber, and the analysis position is corrected based on the cumulative value. shall be.
- the optical fiber sensing device assumes that the cumulative strain in each section is the amount of expansion and contraction of the optical fiber due to vibration, and measures the amount of optical frequency modulation by dividing the optical fiber into multiple sections, which are positioned in front of the analysis position.
- the positional deviation of the analysis position is corrected using the cumulative value of the optical frequency modulation amount of each section. Therefore, the present invention can provide an analysis device and an optical fiber sensing method for an optical fiber sensing device that can suppress the influence of positional deviation due to vibration with a small processing load without deteriorating the spatial resolution.
- Calculating the cumulative value means accumulating the optical frequency modulation amount from the section at the near end to the section immediately before the analysis position, or from any section to the section immediately before the analysis position.
- the optical frequency modulation amount may be accumulated.
- the present invention is a program for causing a computer to function as the analysis device.
- analysis device can also be realized by a computer and a program, and the program can be recorded on a recording medium or provided through a network.
- the present invention can provide an analysis device and an optical fiber sensing method for an optical fiber sensing device that can suppress the influence of positional deviation due to vibration with a small processing load without deteriorating the spatial resolution.
- FIG. 1 is a diagram illustrating an optical fiber sensing device according to the present invention.
- FIG. 2 is a diagram illustrating an optical fiber sensing method according to the present invention.
- FIG. 3 is a diagram illustrating the principle of the optical fiber sensing method according to the present invention. It is a figure explaining the effect of the optical fiber sensing method concerning the present invention.
- 1 is a diagram illustrating an optical fiber sensing device according to the present invention. It is a figure explaining the effect of the optical fiber sensing method concerning the present invention. 1 is a diagram illustrating an optical fiber sensing device according to the present invention.
- FIG. 3 is a diagram illustrating the optical fiber sensing device 301 of this embodiment.
- the optical fiber sensing device 301 is a sensing system that includes a measuring device 11 and an analyzing device 12.
- the measurement device 11 is an OFDR that inputs the probe light whose frequency has been swept once into the optical fiber 13 and obtains the spectrum of the Rayleigh backscattered light in the optical fiber 13.
- the end connected to the measuring device 11 may be referred to as a "near end”
- the other end may be referred to as a "far end”.
- the analysis device 12 obtains the spectrum shift ⁇ from the temporal fluctuation of the spectrum obtained by the measurement device 11. Then, the analysis device 12 divides the optical fiber 13 into a plurality of sections #i (“i” is a section number and is an integer from 0 to N) in the longitudinal direction, and divides the optical fiber 13 into sections #i for each section.
- the optical frequency modulation amount f(x i , t) of the section is calculated from the spectral shift ⁇ (x i , t), and the cumulative value f offset (t) of the optical frequency modulation amount of each section located in front of the analysis position is calculated. Use this to correct the positional deviation of the analysis position. The details of the positional deviation correction of the analysis position performed by the analysis device 12 will be described below.
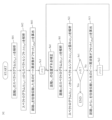
- FIG. 4 is a diagram illustrating an optical fiber sensing method performed by the analysis device 12.
- the analysis device 12 is measuring the spectral shift ⁇ (x i , t) for each section #i of the optical fiber 13 using the measuring device 11 (steps S01, S02, Si1, Si2); calculating an optical frequency modulation amount f(x i , t) for each section from the spectral shift; calculating a cumulative value f offset (t) by accumulating the optical frequency modulation amount of the section located closer to the proximal end than the analysis position of the optical fiber 13 (step S03, step Si3); Correcting the analysis position x i based on the above (step Sa1) I do.
- FIG. 5 is an image diagram illustrating positional deviation correction of the analysis position in the present optical fiber sensing method.
- the optical fiber 13 will be considered by dividing it into a plurality of sections #i (i is an integer from 0 to N).
- x i is the length of section #i
- t is time
- ⁇ (x i , t) is the amount of strain in the optical fiber 13 in section #i.
- the length x i is set longer than the spatial resolution L of strain that can be detected by the measuring device 11 .
- This optical fiber sensing method analyzes the amount of optical frequency modulation f(x i , t) from the amount of strain ⁇ (x i , t) in each section #i, and calculates the amount of probe light propagated from the near end to section #i. It is utilized that the frequency modulation amount is given by the accumulation of optical frequency modulation amounts from sections #0 to #i. Note that in this optical fiber sensing method, the amount of strain ⁇ is expressed by a spectral shift ⁇ (x i , t).
- Step S01 The analysis device 12 acquires a spectrogram S(x 0 , t, ⁇ ) from the return light from section #0 (position at distance x 0 from the near end) among the backscattered lights acquired by the measurement device 11. do. ⁇ is the optical frequency. [Step S02] Then, the analysis device 12 analyzes the spectral shift ⁇ (x 0 , t) from the spectrogram S(x 0 ,t, ⁇ ). Note that the method for analyzing the spectral shift ⁇ from the spectrogram S may be the method disclosed in Non-Patent Document 1.
- FIG. 6 is a diagram illustrating step Sa1.
- the analysis device 12 corrects the positional deviation of the vibration analysis position (distance x i-1 ; distance x 0 after step S03, distance x i-1 after step Si3) using the following equation. That is, the analysis device 12 uses the accumulated optical frequency modulation amount f offset (t) from sections #0 to #i-1 to correct the positional deviation of the vibration analysis position.
- the analysis device 12 acquires a spectrogram S(x i , t, ⁇ ) from the return light from section #i (position at a distance x i from the near end) out of the backscattered light acquired by the measuring device 11. do. ⁇ is the optical frequency.
- the analysis device 12 analyzes the spectral shift ⁇ (x i , t) from the spectrogram S(x i , t, ⁇ ).
- the analysis device 12 may calculate the distortion amount ⁇ (x i , t) for each section from the spectral shift ⁇ (x i , t) for each section #i.
- the amount of strain ⁇ (x i , t) may be calculated only for the desired analysis position.
- the distortion amount ⁇ (x i , t) is calculated using equation (A2) described in Appendix A at the position x i where the positional deviation has been corrected.
- step Si3 the section number is incremented by one in step Sc2, and the process returns to step Sa1, where the positional deviation of the vibration analysis position (distance x i-1 ) is corrected using equation (3).
- FIG. 7 is a diagram explaining the experimental system.
- the optical fiber 13 was divided into two sections: an optical fiber 13a at the near end and an optical fiber 13b at the far end.
- the length of the optical fiber 13a is 60 m, and the length of the optical fiber 13b is 160 m.
- a 30 Hz sine wave vibration was applied only to the optical fiber 13a.
- the spatial resolution L of the measuring device 11 is 66 cm.
- FIG. 8 is a diagram illustrating the effects of the present invention.
- FIG. 8(A) shows the results of strain measurement (comparative example) in the experimental system of FIG. 7 in which positional deviation correction was not performed by the analyzer 12.
- strain ⁇ can be measured correctly over a distance of about 0 to 30 m, but measurement errors occur after that.
- the spatial resolution of the measuring device 11 has the ability to withstand the amount of accumulated frequency modulation when the probe light propagates up to a distance of approximately 0 to 30 m, but it has no ability to withstand the amount of accumulated frequency modulation at distances beyond that. Not enough. In particular, measurement errors occur frequently near the time when the positional deviation is maximum or when the sinusoidal distortion becomes zero.
- the positional deviation is corrected in both the section of the optical fiber 13a and the section of the optical fiber 13b to which no vibration is applied, and the strain ⁇ is correctly measured.
- the strain ⁇ gives the probe light a phase change ⁇ .
- the time differential of the phase change ⁇ is the optical frequency modulation amount f.
- a sinusoidal distortion was applied, so the amount of optical frequency modulation (positional deviation) becomes maximum at the time when the distortion becomes zero (the time differential of the sine wave becomes maximum at the zero point). when passing).
- the experimental results certainly show this situation, with measurement errors occurring near the time when the distortion becomes zero.
- the optical frequency modulation amount f due to the strain ⁇ is accumulated as the probe light propagates. For this reason, strain ⁇ can be accurately measured up to a distance of about 0 to 30 m, but after that, the cumulative value of the optical frequency modulation amount exceeds the spatial resolution of the measuring device 11, and measurement errors begin to occur. (end of supplement)
- the optical fiber sensing method according to the present invention requires less signal processing load (differentiation and addition) than the conventional method (cross-correlation), and measures vibration distribution without degrading the spatial resolution of strain analysis. is possible.
- the optical fiber sensing method according to the above can calculate the frequency offset f offset (t) for an arbitrary interval (x i to x j ) as explained in equation (2). Therefore, it is also possible to analyze the amount of positional deviation by accumulating the optical frequency modulation amount f(x i , t) from a section at any point, not just the near end, to section #N-1 immediately before the analysis position. Therefore, the optical fiber sensing method according to the present invention can improve the accuracy and convenience of strain measurement.
- the analysis device 12 can also be realized by a computer and a program, and the program can be recorded on a recording medium or provided through a network.
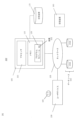
- FIG. 9 shows a block diagram of system 100.
- System 100 includes computer 105 connected to network 135.
- the network 135 is a data communication network.
- Network 135 may be a private network or a public network, such as (a) a personal area network covering, for example, a room; (b) a local area network, e.g., covering a building; (c) a local area network, e.g. (d) a metropolitan area network, which covers, for example, a city; (e) a wide network, which covers an area that spans, for example, urban, regional, or national boundaries or (f) the Internet. Communication occurs via electronic and optical signals via network 135.
- Computer 105 includes a processor 110 and a memory 115 connected to processor 110. Although computer 105 is depicted herein as a stand-alone device, it is not so limited, but rather may be connected to other devices not shown in a distributed processing system.
- Processor 110 is an electronic device comprised of logic circuitry that responds to and executes instructions.
- Memory 115 is a tangible computer-readable storage medium on which a computer program is encoded.
- memory 115 stores data and instructions, or program codes, readable and executable by processor 110 to control the operation of processor 110.
- Memory 115 may be implemented as random access memory (RAM), a hard drive, read only memory (ROM), or a combination thereof.
- One of the components of memory 115 is program module 120.
- Program module 120 includes instructions for controlling processor 110 to perform the processes described herein. Although operations are described herein as being performed by computer 105 or a method or process or subprocess thereof, those operations are actually performed by processor 110.
- module is used herein to refer to a functional operation that can be implemented either as a stand-alone component or as an integrated arrangement of multiple subcomponents. Accordingly, program module 120 may be implemented as a single module or as multiple modules operating in concert with each other. Further, although program modules 120 are described herein as being installed in memory 115 and thus being implemented in software, program modules 120 may be implemented in hardware (e.g., electronic circuitry), firmware, software, or any combination thereof. It is possible to implement either of these methods.
- Storage device 140 is a tangible computer readable storage medium that stores program modules 120 .
- Examples of storage devices 140 include compact disks, magnetic tape, read-only memory, optical storage media, memory units composed of a hard drive or multiple parallel hard drives, and Universal Serial Bus (USB) flash drives. It will be done.
- storage 140 may be random access memory or other type of electronic storage device located in a remote storage system, not shown, and connected to computer 105 via network 135.
- System 100 further includes a data source 150A and a data source 150B, collectively referred to herein as data sources 150, and communicatively connected to network 135.
- data sources 150 may include any number of data sources, ie, one or more data sources.
- Data sources 150 include unstructured data and may include social media.
- System 100 further includes a user device 130 operated by user 101 and connected to computer 105 via network 135.
- User device 130 may include an input device, such as a keyboard or voice recognition subsystem, for allowing user 101 to convey information and command selections to processor 110.
- User device 130 further includes a display device or an output device such as a printer or a speech synthesizer.
- a cursor control such as a mouse, trackball, or touch-sensitive screen, allows user 101 to manipulate a cursor on the display to convey additional information and command selections to processor 110.
- Processor 110 outputs results 122 of execution of program module 120 to user device 130.
- processor 110 may provide output to storage 125, such as a database or memory, or via network 135 to a remote device not shown.
- the program module 120 may be a program that executes the flowchart in FIG. System 100 can be operated as analysis device 12.
- various inventions can be formed by appropriately combining the plurality of components disclosed in the above embodiments. For example, some components may be deleted from all the components shown in the embodiments. Furthermore, components from different embodiments may be combined as appropriate.
Landscapes
- Physics & Mathematics (AREA)
- General Physics & Mathematics (AREA)
- Optical Transform (AREA)
Abstract
本発明は、空間分解能を劣化させることなく、少ない処理負荷で振動による位置ずれの影響を抑制できる光ファイバセンシング装置の解析装置及び光ファイバセンシング方法を提供することを目的とする。 本発明に係る解析回路12は、測定装置11を利用して光ファイバ13のセクション#i毎にスペクトルシフトΔν(xi,t)を測定すること(ステップS01、S02、Si1、Si2)、前記スペクトルシフトから前記セクション毎に光周波数変調量f(xi,t)を計算すること、光ファイバ13の解析位置よりも近端側に位置する前記セクションの前記光周波数変調量を累積して累積値foffset(t)を計算すること(ステップS03、ステップSi3)、及び前記累積値に基づいて前記解析位置xiの補正すること(ステップSa1)を行う。
Description
本開示は、OFDR(Optical Frequency Domain Reflectometry)を用いた光ファイバセンシング装置の解析装置及びそのセンシング方法に関する。
図1は、OFDRを用いたセンシング原理を説明する図である。OFDRは、周波数掃引光をプローブ光として採用する。そして、光ファイバのプローブ光に対するレイリー後方散乱光の波形r(τ)(図1(A))をフーリエ変換することでスペクトルS(ν)(図1(B))を解析することができる(例えば、非特許文献1を参照。)。
後方散乱光のスペクトルS(ν)は光ファイバの歪みや温度に対して変動する(スペクトルシフト)。このため、参照測定で得られた参照スペクトルSrefが各測定時においてどれだけ移動したか(スペクトルシフトΔν)を検出することで、次式のように光ファイバの歪みや温度の変化量を算出することができる。

ここで、Δνはスペクトルシフト、ν0はプローブ光の中心周波数、εは歪み、Tは温度である。
M. Froggatt and J. Moore, "High-spatial-resolution distributed strain measurement in optical fiber with Rayleigh scatter," Appl. Opt., vol. 37, no. 10, pp. 1735-1740, 1998.
Okamoto, Tatsuya, Daisuke Iida, and Hiroyuki Oshida. "Vibration-induced beat frequency offset compensation in distributed acoustic sensing based on optical frequency domain reflectometry". Journal of Lightwave Technology 37.18 (2019): 4896-4901.
Okamoto, Tatsuya, Daisuke Iida, and Hiroyuki Oshida. "Investigation of tolerance of OFDR-based DAS to vibration-induced beat frequency offset"., 2020 Optical Fiber Communications Conference and Exhibition (OFC). IEEE, 2020.
OFDRによる光ファイバセンシング装置には、解析しようとする解析位置より手前の振動による光周波数変調が解析位置の距離を変化させるため、一貫した光スペクトルが得にくく、正しい振動解析が困難という基本課題がある。
図2は、基本課題を説明する図である。図2(A)は、光ファイバのプローブ光に対するレイリー後方散乱光の波形r(τ)である。通常、光ファイバには振動が発生している。このため、解析位置(時間τ1からτ2の区間)より手前(プローブ光入射端側)の光ファイバの振動(周波数オフセット21)により解析したい波形r(τ)の位置が時間的に変動し、時間τ1からτ2の区間に解析対象外の波形r(τ)が含まれることになる。つまり、時刻ごとに解析する波形波形r(τ)が変化するため、波形r(τ)をフーリエ変換したスペクトルS(ν)の波形も光スペクトル構造が変化し、スペクトルシフト量(歪み量)を計算することが困難になる(図2(B))。
この基本課題に対し、非特許文献2は、解析長さの拡大による位置ずれの影響緩和する方法を開示する。この方法は、周波数オフセット21に対して、センサー長さ(時間τ1からτ2の区間)が十分長ければ、位置ずれを抑えることができる(振動に対する耐力をもつ)ことを利用している。しかし、この方法は、解析長さを拡大すれば歪み解析の空間分解能が劣化するという新たな課題が発生する。
また、この基本課題に対し、非特許文献3は、位置ずれ補正を信号処理で行う方法を開示する。この方法は、振動センサーの損失分布波形の相互相関で距離オフセットを推定し、解析したい振動センサーの位置を追跡する信号処理である。しかし、この方法は、相互相関のための信号負荷が大きいという新たな課題が発生する。
そこで、本発明は、前記課題を解決するために、空間分解能を劣化させることなく、少ない処理負荷で振動による位置ずれの影響を抑制できる光ファイバセンシング装置の解析装置及び光ファイバセンシング方法を提供することを目的とする。
上記目的を達成するために、本発明に係る光ファイバセンシング装置及びその方法は、光ファイバのセクションごとのスペクトルシフトから当該セクションの光周波数変調量を求め、解析位置よりも手前に位置する各セクションの光周波数変調量の累積値を用いて解析位置の位置ずれ補正を行うこととした。
具体的には、本発明に係る光ファイバセンシング装置の解析装置は、OFDRを用いた光ファイバセンシング装置が備える解析装置であって、
光ファイバのセクション毎に測定されたスペクトルシフトから前記セクション毎に光周波数変調量を計算すること、
前記光ファイバの解析位置よりも近端側に位置する前記セクションの前記光周波数変調量を累積して累積値を計算すること、及び
前記累積値に基づいて前記解析位置を補正すること
を行う。
光ファイバのセクション毎に測定されたスペクトルシフトから前記セクション毎に光周波数変調量を計算すること、
前記光ファイバの解析位置よりも近端側に位置する前記セクションの前記光周波数変調量を累積して累積値を計算すること、及び
前記累積値に基づいて前記解析位置を補正すること
を行う。
また、本発明に係る光ファイバセンシング方法は、OFDRを用いた光ファイバセンシング方法であって、
光ファイバのセクション毎にスペクトルシフトを測定すること、
前記スペクトルシフトから前記セクション毎に光周波数変調量を計算すること、
前記光ファイバの解析位置よりも近端側に位置する前記セクションの前記光周波数変調量を累積して累積値を計算すること、及び
前記累積値に基づいて前記解析位置の補正を行うこと
を特徴とする。
光ファイバのセクション毎にスペクトルシフトを測定すること、
前記スペクトルシフトから前記セクション毎に光周波数変調量を計算すること、
前記光ファイバの解析位置よりも近端側に位置する前記セクションの前記光周波数変調量を累積して累積値を計算すること、及び
前記累積値に基づいて前記解析位置の補正を行うこと
を特徴とする。
光ファイバセンシング装置は、各セクションでの歪の積算が振動による光ファイバの伸縮量であるとし、光ファイバを複数のセクションに分けて光周波数変調量を測定し、解析位置よりも手前に位置する各セクションの光周波数変調量の累積値で解析位置の位置ずれ補正する。このため、本発明は、空間分解能を劣化させることなく、少ない処理負荷で振動による位置ずれの影響を抑制できる光ファイバセンシング装置の解析装置及び光ファイバセンシング方法を提供することができる。
前記累積値を計算することは、前記近端の前記セクションから前記解析位置直前の前記セクションまでの前記光周波数変調量を累積すること、あるいは任意の前記セクションから前記解析位置直前の前記セクションまでの前記光周波数変調量を累積することとしてもよい。
本発明は、前記解析装置としてコンピュータを機能させるためのプログラムである。
なお、前記解析装置は、コンピュータとプログラムによっても実現でき、プログラムを記録媒体に記録することも、ネットワークを通して提供することも可能である。
なお、上記各発明は、可能な限り組み合わせることができる。
本発明は、空間分解能を劣化させることなく、少ない処理負荷で振動による位置ずれの影響を抑制できる光ファイバセンシング装置の解析装置及び光ファイバセンシング方法を提供することができる。
添付の図面を参照して本発明の実施形態を説明する。以下に説明する実施形態は本発明の実施例であり、本発明は、以下の実施形態に制限されるものではない。なお、本明細書及び図面において符号が同じ構成要素は、相互に同一のものを示すものとする。
(実施形態1)
図3は、本実施形態の光ファイバセンシング装置301を説明する図である。光ファイバセンシング装置301は、測定装置11と解析装置12を備えるセンシングシステムである。測定装置11は、周波数を1回掃引したプローブ光を光ファイバ13へ入力し、光ファイバ13におけるレイリー後方散乱光のスペクトルを取得するOFDRである。
本明細書では、光ファイバ13の両端のうち、測定装置11に接続される端を「近端」、他端を「遠端」と記載することがある。
図3は、本実施形態の光ファイバセンシング装置301を説明する図である。光ファイバセンシング装置301は、測定装置11と解析装置12を備えるセンシングシステムである。測定装置11は、周波数を1回掃引したプローブ光を光ファイバ13へ入力し、光ファイバ13におけるレイリー後方散乱光のスペクトルを取得するOFDRである。
本明細書では、光ファイバ13の両端のうち、測定装置11に接続される端を「近端」、他端を「遠端」と記載することがある。
解析装置12は、測定装置11が得た前記スペクトルの時間変動からスペクトルシフトΔνを取得する。そして、解析装置12は、光ファイバ13を長手方向に複数のセクション#i(“i”はセクション番号であり、0からNまでの整数である。)に区分し、光ファイバ13のセクションごとのスペクトルシフトΔν(xi,t)から当該セクションの光周波数変調量f(xi,t)を求め、解析位置よりも手前に位置する各セクションの光周波数変調量の累積値foffset(t)を用いて解析位置の位置ずれ補正を行う。
以下に、解析装置12が行う解析位置の位置ずれ補正の詳細を説明する。
以下に、解析装置12が行う解析位置の位置ずれ補正の詳細を説明する。
図4は、解析装置12が行う光ファイバセンシング方法を説明する図である。
解析装置12は、
測定装置11を利用して光ファイバ13のセクション#i毎にスペクトルシフトΔν(xi,t)を測定すること(ステップS01、S02、Si1、Si2)、
前記スペクトルシフトから前記セクション毎に光周波数変調量f(xi,t)を計算すること、
光ファイバ13の解析位置よりも近端側に位置する前記セクションの前記光周波数変調量を累積して累積値foffset(t)を計算すること(ステップS03、ステップSi3)、及び
前記累積値に基づいて前記解析位置xiの補正すること(ステップSa1)
を行う。
解析装置12は、
測定装置11を利用して光ファイバ13のセクション#i毎にスペクトルシフトΔν(xi,t)を測定すること(ステップS01、S02、Si1、Si2)、
前記スペクトルシフトから前記セクション毎に光周波数変調量f(xi,t)を計算すること、
光ファイバ13の解析位置よりも近端側に位置する前記セクションの前記光周波数変調量を累積して累積値foffset(t)を計算すること(ステップS03、ステップSi3)、及び
前記累積値に基づいて前記解析位置xiの補正すること(ステップSa1)
を行う。
図5は、本光ファイバセンシング方法における解析位置の位置ずれ補正を説明するイメージ図である。光ファイバ13を複数のセクション#i(iは0からNまでの整数)に分けて検討する。xiはセクション#iの長さ、tは時刻、ε(xi,t)はセクション#iにおける光ファイバ13の歪量である。長さxiは測定装置11が検出可能な歪の空間分解能Lより長く設定する。
本光ファイバセンシング方法は、各セクション#iの歪量ε(xi,t)から光周波数変調量f(xi,t)を解析し、近端からセクション#iまで伝搬したプローブ光の光周波数変調量は、セクション#0から#iまでの光周波数変調量の蓄積で与えられることを利用する。なお、本光ファイバセンシング方法は、歪量εをスペクトルシフトΔν(xi,t)で表現する。
[ステップS01]
解析装置12は、測定装置11が取得した後方散乱光のうち、セクション#0(近端からの距離がx0の位置)からの戻り光からスペクトルグラムS(x0,t,ν)を取得する。νは光周波数である。
[ステップS02]
そして、解析装置12は、スペクトルグラムS(x0,t,ν)からスペクトルシフトΔν(x0,t)を解析する。なお、スペクトルグラムSからスペクトルシフトΔνを解析する手法は非特許文献1に開示されるような手法でよい。
[ステップS03]
解析装置12は、Δν(x0,t)から次式で光周波数変調量f(x0,t)を算出する。なお、歪量εと位相変化量θとの関係は付録Aにて説明する。

さらに、解析装置12は、セクション#0(距離x0)を往復伝搬したプローブ光のビート周波数オフセットfoffset(t)を算出する。

式(2)は、距離xiからxjまで伝搬したプローブ光の周波数変調量であるから、セクション#0における周波数オフセットは、
foffset(t)=2f(x0,t)
である。
[ステップSc1]
セクション番号を0から1とする。
[ステップSa1]
図6は、ステップSa1を説明する図である。解析装置12は、振動解析位置(距離xiー1;ステップS03の後であれば距離x0、ステップSi3の後であれば距離xiー1)の位置ずれを次式によって補正する。

つまり、解析装置12は、セクション#0~#i-1までの光周波数変調量の蓄積foffset(t)を用いて、振動解析位置の位置ずれ補正を行う。
[ステップSi1]
解析装置12は、測定装置11が取得した後方散乱光のうち、セクション#i(近端からの距離がxiの位置)からの戻り光からスペクトルグラムS(xi,t,ν)を取得する。νは光周波数である。
[ステップSi2]
そして、解析装置12は、スペクトルグラムS(xi,t,ν)からスペクトルシフトΔν(xi,t)を解析する。
ここで、解析装置12は、セクション#i毎のスペクトルシフトΔν(xi,t)からセクション毎の歪量ε(xi,t)を計算してもよい。歪量ε(xi,t)は所望の解析位置についてのみ算出すればよい。具体的には、歪量ε(xi,t)は、位置ずれを補正した位置xiにおいて付録Aに記載の式(A2)を用いて算出する。
[ステップSi3]
式(2)を用いて、距離x0からxiを往復伝搬した光のビート周波数オフセットfoffset(t)を算出する。
なお、i=Nとなっている場合、本ステップを行わずに終了する。
解析装置12は、測定装置11が取得した後方散乱光のうち、セクション#0(近端からの距離がx0の位置)からの戻り光からスペクトルグラムS(x0,t,ν)を取得する。νは光周波数である。
[ステップS02]
そして、解析装置12は、スペクトルグラムS(x0,t,ν)からスペクトルシフトΔν(x0,t)を解析する。なお、スペクトルグラムSからスペクトルシフトΔνを解析する手法は非特許文献1に開示されるような手法でよい。
[ステップS03]
解析装置12は、Δν(x0,t)から次式で光周波数変調量f(x0,t)を算出する。なお、歪量εと位相変化量θとの関係は付録Aにて説明する。
foffset(t)=2f(x0,t)
である。
[ステップSc1]
セクション番号を0から1とする。
[ステップSa1]
図6は、ステップSa1を説明する図である。解析装置12は、振動解析位置(距離xiー1;ステップS03の後であれば距離x0、ステップSi3の後であれば距離xiー1)の位置ずれを次式によって補正する。
[ステップSi1]
解析装置12は、測定装置11が取得した後方散乱光のうち、セクション#i(近端からの距離がxiの位置)からの戻り光からスペクトルグラムS(xi,t,ν)を取得する。νは光周波数である。
[ステップSi2]
そして、解析装置12は、スペクトルグラムS(xi,t,ν)からスペクトルシフトΔν(xi,t)を解析する。
ここで、解析装置12は、セクション#i毎のスペクトルシフトΔν(xi,t)からセクション毎の歪量ε(xi,t)を計算してもよい。歪量ε(xi,t)は所望の解析位置についてのみ算出すればよい。具体的には、歪量ε(xi,t)は、位置ずれを補正した位置xiにおいて付録Aに記載の式(A2)を用いて算出する。
[ステップSi3]
式(2)を用いて、距離x0からxiを往復伝搬した光のビート周波数オフセットfoffset(t)を算出する。
なお、i=Nとなっている場合、本ステップを行わずに終了する。
ステップSi3の後、ステップSc2でセクション番号を1つカウントアップしてステップSa1に戻り、振動解析位置(距離xi-1)の位置ずれを式(3)によって補正する。
[実施例]
図7は、実験系を説明する図である。光ファイバ13について、近端側を光ファイバ13a、遠端を光ファイバ13bの2つの区間に分けた。光ファイバ13aの長さは60m、光ファイバ13bの長さは160mである。光ファイバ13aのみに30Hzの正弦波の振動を与えた。
測定装置11の空間分解能Lは66cmである。
図8は、本発明の効果を説明する図である。図8(A)は、図7の実験系において、解析装置12で位置ずれ補正を行わなかった歪測定の結果(比較例)である。図8(B)は、図7の実験系において、解析装置12で位置ずれ補正を行った歪測定の結果(実施例)である。
比較例では、距離0~30m程度までは正しく歪εが測定できているが、それ以降で測定エラーが発生している。これは次を意味している。測定装置11の空間分解能は、プローブ光が距離0~30m程度まで伝搬したときの蓄積周波数変調量に対しては耐力があるが、それ以降の距離での蓄積周波数変調量に対しては耐力が不十分である。特に位置ずれが最大となる時刻、又は正弦波状の歪みがゼロとなる時刻近傍において、測定エラーが頻発している。
一方、実施例では、光ファイバ13aの区間及び振動を与えていない光ファイバ13bの区間のいずれにおいても位置ずれが補正され、歪εが正しく測定されている。
(補足)
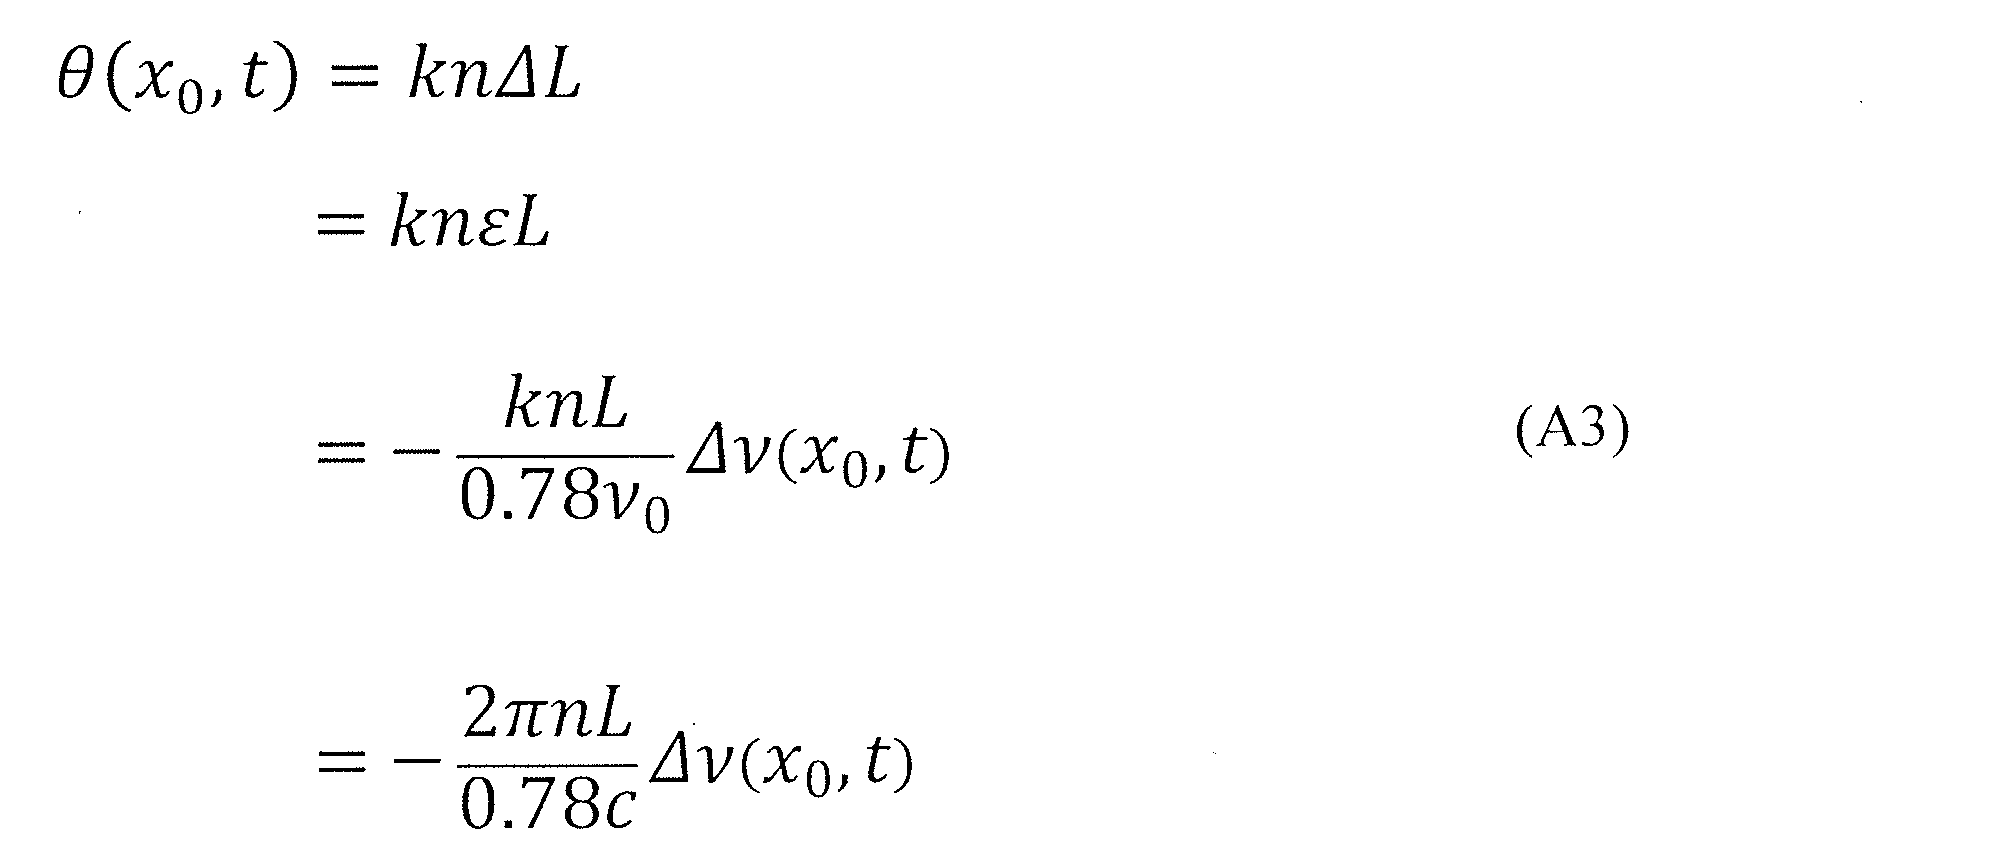
式(A3)のように、歪εはプローブ光に位相変化θを与える。位相変化θの時間微分が光周波数変調量fである。本実験では正弦波状の歪みを加えたので、光周波数変調量(位置ずれ量)が最大となるのは歪みがゼロとなる時刻である(正弦波の時間微分が最大となるのはゼロ点を通過する時)。実験結果は確かにその様子を表しており、歪みがゼロとなる時刻近傍で測定エラーが発生している。
歪εによる光周波数変調量fはプローブ光の伝搬とともに蓄積されていく。このため、距離0~30m程度までは正しく歪εを測定できるが、それ以降では光周波数変調量の累積値が測定装置11の空間分解能を超えてしまい、測定エラーが発生するようになる。
(補足終了)
図7は、実験系を説明する図である。光ファイバ13について、近端側を光ファイバ13a、遠端を光ファイバ13bの2つの区間に分けた。光ファイバ13aの長さは60m、光ファイバ13bの長さは160mである。光ファイバ13aのみに30Hzの正弦波の振動を与えた。
測定装置11の空間分解能Lは66cmである。
図8は、本発明の効果を説明する図である。図8(A)は、図7の実験系において、解析装置12で位置ずれ補正を行わなかった歪測定の結果(比較例)である。図8(B)は、図7の実験系において、解析装置12で位置ずれ補正を行った歪測定の結果(実施例)である。
比較例では、距離0~30m程度までは正しく歪εが測定できているが、それ以降で測定エラーが発生している。これは次を意味している。測定装置11の空間分解能は、プローブ光が距離0~30m程度まで伝搬したときの蓄積周波数変調量に対しては耐力があるが、それ以降の距離での蓄積周波数変調量に対しては耐力が不十分である。特に位置ずれが最大となる時刻、又は正弦波状の歪みがゼロとなる時刻近傍において、測定エラーが頻発している。
一方、実施例では、光ファイバ13aの区間及び振動を与えていない光ファイバ13bの区間のいずれにおいても位置ずれが補正され、歪εが正しく測定されている。
(補足)
式(A3)のように、歪εはプローブ光に位相変化θを与える。位相変化θの時間微分が光周波数変調量fである。本実験では正弦波状の歪みを加えたので、光周波数変調量(位置ずれ量)が最大となるのは歪みがゼロとなる時刻である(正弦波の時間微分が最大となるのはゼロ点を通過する時)。実験結果は確かにその様子を表しており、歪みがゼロとなる時刻近傍で測定エラーが発生している。
歪εによる光周波数変調量fはプローブ光の伝搬とともに蓄積されていく。このため、距離0~30m程度までは正しく歪εを測定できるが、それ以降では光周波数変調量の累積値が測定装置11の空間分解能を超えてしまい、測定エラーが発生するようになる。
(補足終了)
[効果]
本発明に係る光ファイバセンシング方法は、図8で説明したように、信号処理の負荷(微分と足し算)が従来(相互相関)より少なく、歪み解析の空間分解能を劣化させることなく振動分布を測定が可能である。
本発明に係る光ファイバセンシング方法は、図8で説明したように、信号処理の負荷(微分と足し算)が従来(相互相関)より少なく、歪み解析の空間分解能を劣化させることなく振動分布を測定が可能である。
上記実施形態では、近端のセクション#0から解析位置直前のセクション#N-1までの光周波数変調量f(xi,t)を累積し、位置補正を行うことを説明したが、本発明に係る光ファイバセンシング方法は、式(2)で説明したように、任意の区間(xi~xj)についての周波数オフセットfoffset(t)を計算できる。このため、近端に限らず任意地点のセクションから解析位置直前のセクション#N-1までの光周波数変調量f(xi,t)を累積して位置ずれ量を解析することもできる。従って、本発明に係る光ファイバセンシング方法は、歪測定の精度とともに利便性も高めることができる。
(実施形態2)
解析装置12はコンピュータとプログラムによっても実現でき、プログラムを記録媒体に記録することも、ネットワークを通して提供することも可能である。
図9は、システム100のブロック図を示している。システム100は、ネットワーク135へと接続されたコンピュータ105を含む。
解析装置12はコンピュータとプログラムによっても実現でき、プログラムを記録媒体に記録することも、ネットワークを通して提供することも可能である。
図9は、システム100のブロック図を示している。システム100は、ネットワーク135へと接続されたコンピュータ105を含む。
ネットワーク135は、データ通信ネットワークである。ネットワーク135は、プライベートネットワーク又はパブリックネットワークであってよく、(a)例えば或る部屋をカバーするパーソナル・エリア・ネットワーク、(b)例えば或る建物をカバーするローカル・エリア・ネットワーク、(c)例えば或るキャンパスをカバーするキャンパス・エリア・ネットワーク、(d)例えば或る都市をカバーするメトロポリタン・エリア・ネットワーク、(e)例えば都市、地方、又は国家の境界をまたいでつながる領域をカバーするワイド・エリア・ネットワーク、又は(f)インターネット、のいずれか又はすべてを含むことができる。通信は、ネットワーク135を介して電子信号及び光信号によって行われる。
コンピュータ105は、プロセッサ110、及びプロセッサ110に接続されたメモリ115を含む。コンピュータ105が、本明細書においてはスタンドアロンのデバイスとして表されているが、そのように限定されるわけではなく、むしろ分散処理システムにおいて図示されていない他のデバイスへと接続されてよい。
プロセッサ110は、命令に応答し且つ命令を実行する論理回路で構成される電子デバイスである。
メモリ115は、コンピュータプログラムがエンコードされた有形のコンピュータにとって読み取り可能な記憶媒体である。この点に関し、メモリ115は、プロセッサ110の動作を制御するためにプロセッサ110によって読み取り可能及び実行可能なデータ及び命令、すなわちプログラムコードを記憶する。メモリ115を、ランダムアクセスメモリ(RAM)、ハードドライブ、読み出し専用メモリ(ROM)、又はこれらの組み合わせにて実現することができる。メモリ115の構成要素の1つは、プログラムモジュール120である。
プログラムモジュール120は、本明細書に記載のプロセスを実行するようにプロセッサ110を制御するための命令を含む。本明細書において、動作がコンピュータ105或いは方法又はプロセス若しくはその下位プロセスによって実行されると説明されるが、それらの動作は、実際にはプロセッサ110によって実行される。
用語「モジュール」は、本明細書において、スタンドアロンの構成要素又は複数の下位の構成要素からなる統合された構成のいずれかとして具現化され得る機能的動作を指して使用される。したがって、プログラムモジュール120は、単一のモジュールとして、或いは互いに協調して動作する複数のモジュールとして実現され得る。さらに、プログラムモジュール120は、本明細書において、メモリ115にインストールされ、したがってソフトウェアにて実現されるものとして説明されるが、ハードウェア(例えば、電子回路)、ファームウェア、ソフトウェア、又はこれらの組み合わせのいずれかにて実現することが可能である。
プログラムモジュール120は、すでにメモリ115へとロードされているものとして示されているが、メモリ115へと後にロードされるように記憶装置140上に位置するように構成されてもよい。記憶装置140は、プログラムモジュール120を記憶する有形のコンピュータにとって読み取り可能な記憶媒体である。記憶装置140の例として、コンパクトディスク、磁気テープ、読み出し専用メモリ、光記憶媒体、ハードドライブ又は複数の並列なハードドライブで構成されるメモリユニット、並びにユニバーサル・シリアル・バス(USB)フラッシュドライブが挙げられる。あるいは、記憶装置140は、ランダムアクセスメモリ、或いは図示されていない遠隔のストレージシステムに位置し、且つネットワーク135を介してコンピュータ105へと接続される他の種類の電子記憶デバイスであってよい。
システム100は、本明細書においてまとめてデータソース150と称され、且つネットワーク135へと通信可能に接続されるデータソース150A及びデータソース150Bを更に含む。実際には、データソース150は、任意の数のデータソース、すなわち1つ以上のデータソースを含むことができる。データソース150は、体系化されていないデータを含み、ソーシャルメディアを含むことができる。
システム100は、ユーザ101によって操作され、且つネットワーク135を介してコンピュータ105へと接続されるユーザデバイス130を更に含む。ユーザデバイス130として、ユーザ101が情報及びコマンドの選択をプロセッサ110へと伝えることを可能にするためのキーボード又は音声認識サブシステムなどの入力デバイスが挙げられる。ユーザデバイス130は、表示装置又はプリンタ或いは音声合成装置などの出力デバイスを更に含む。マウス、トラックボール、又はタッチ感応式画面などのカーソル制御部が、さらなる情報及びコマンドの選択をプロセッサ110へと伝えるために表示装置上でカーソルを操作することをユーザ101にとって可能にする。
プロセッサ110は、プログラムモジュール120の実行の結果122をユーザデバイス130へと出力する。あるいは、プロセッサ110は、出力を例えばデータベース又はメモリなどの記憶装置125へともたらすことができ、或いはネットワーク135を介して図示されていない遠隔のデバイスへともたらすことができる。
例えば、図4のフローチャートを行うプログラムをプログラムモジュール120としてもよい。システム100を解析装置12として動作させることができる。
用語「・・・を備える」又は「・・・を備えている」は、そこで述べられている特徴、完全体、工程、又は構成要素が存在することを指定しているが、1つ以上の他の特徴、完全体、工程、又は構成要素、或いはそれらのグループの存在を排除してはいないと、解釈されるべきである。用語「a」及び「an」は、不定冠詞であり、したがって、それを複数有する実施形態を排除するものではない。
(他の実施形態)
なお、この発明は上記実施形態に限定されるものではなく、この発明の要旨を逸脱しない範囲で種々変形して実施可能である。要するにこの発明は、上位実施形態そのままに限定されるものではなく、実施段階ではその要旨を逸脱しない範囲で構成要素を変形して具体化できる。
なお、この発明は上記実施形態に限定されるものではなく、この発明の要旨を逸脱しない範囲で種々変形して実施可能である。要するにこの発明は、上位実施形態そのままに限定されるものではなく、実施段階ではその要旨を逸脱しない範囲で構成要素を変形して具体化できる。
また、上記実施形態に開示されている複数の構成要素を適宜な組み合わせにより種々の発明を形成できる。例えば、実施形態に示される全構成要素から幾つかの構成要素を削除してもよい。さらに、異なる実施形態に亘る構成要素を適宜組み合わせてもよい。
[付録A]
歪量ε、スペクトルシフトΔ、及び位相変化量θの関係を説明する。
レイリー後方散乱光のスペクトルシフトの歪み及び温度依存性は次式で与えられる。

光ファイバに温度変化Tがなく歪みεのみが加わる状況を考えるとレイリー後方散乱光のスペクトルシフトΔνは次式で与えられる。

歪みεによって長さLの区間が伸縮量ΔLだけ変化するとき位相変化量θは次式で与えられる。
歪量ε、スペクトルシフトΔ、及び位相変化量θの関係を説明する。
レイリー後方散乱光のスペクトルシフトの歪み及び温度依存性は次式で与えられる。
[定義]
本明細書で使用されるパラメータは次の通りである。
x:光ファイバの長手方向の位置(近端からの距離)
t:時刻
n:光ファイバの屈折率
Δν:スペクトルシフト
ν0:プローブ光の中心光周波数
c:真空中の光速
L:測定装置が検出できる歪の空間分解能
k:波数
T:光ファイバの温度変化
f0:t=0の振動解析位置
γ:OFDR(測定装置)の周波数掃引速度
本明細書で使用されるパラメータは次の通りである。
x:光ファイバの長手方向の位置(近端からの距離)
t:時刻
n:光ファイバの屈折率
Δν:スペクトルシフト
ν0:プローブ光の中心光周波数
c:真空中の光速
L:測定装置が検出できる歪の空間分解能
k:波数
T:光ファイバの温度変化
f0:t=0の振動解析位置
γ:OFDR(測定装置)の周波数掃引速度
11:測定装置
12:解析回路
13:光ファイバ
100:システム
101:ユーザ
105:コンピュータ
110:プロセッサ
115:メモリ
120:プログラムモジュール
122:結果
125:記憶装置
130:ユーザデバイス
135:ネットワーク
140:記憶装置
150:データソース
301:光ファイバセンシング装置
12:解析回路
13:光ファイバ
100:システム
101:ユーザ
105:コンピュータ
110:プロセッサ
115:メモリ
120:プログラムモジュール
122:結果
125:記憶装置
130:ユーザデバイス
135:ネットワーク
140:記憶装置
150:データソース
301:光ファイバセンシング装置
Claims (7)
- OFDRを用いた光ファイバセンシング装置が備える解析装置であって、
光ファイバのセクション毎に測定されたスペクトルシフトから前記セクション毎に光周波数変調量を計算すること、
前記光ファイバの解析位置よりも近端側に位置する前記セクションの前記光周波数変調量を累積して累積値を計算すること、及び
前記累積値に基づいて前記解析位置を補正すること
を行う解析装置。 - 前記累積値を計算することは、前記近端の前記セクションから前記解析位置直前の前記セクションまでの前記光周波数変調量を累積することである請求項1に記載の解析装置。
- 前記累積値を計算することは、任意の前記セクションから前記解析位置直前の前記セクションまでの前記光周波数変調量を累積することである請求項1に記載の解析装置。
- OFDRを用いた光ファイバセンシング方法であって、
光ファイバのセクション毎にスペクトルシフトを測定すること、
前記スペクトルシフトから前記セクション毎に光周波数変調量を計算すること、
前記光ファイバの解析位置よりも近端側に位置する前記セクションの前記光周波数変調量を累積して累積値を計算すること、及び
前記累積値に基づいて前記解析位置の補正を行うこと
を特徴とする光ファイバセンシング方法。 - 前記累積値を計算することは、前記近端の前記セクションから前記解析位置直前の前記セクションまでの前記光周波数変調量を累積することである請求項4に記載の光ファイバセンシング方法。
- 前記累積値を計算することは、任意の前記セクションから前記解析位置直前の前記セクションまでの前記光周波数変調量を累積することである請求項4に記載の光ファイバセンシング方法。
- 請求項1から3のいずれかに記載の解析装置としてコンピュータを機能させるためのプログラム。
Priority Applications (2)
| Application Number | Priority Date | Filing Date | Title |
|---|---|---|---|
| JP2024538589A JP7720014B2 (ja) | 2022-08-03 | 2022-08-03 | 解析装置及び光ファイバセンシング方法 |
| PCT/JP2022/029795 WO2024029005A1 (ja) | 2022-08-03 | 2022-08-03 | 解析装置及び光ファイバセンシング方法 |
Applications Claiming Priority (1)
| Application Number | Priority Date | Filing Date | Title |
|---|---|---|---|
| PCT/JP2022/029795 WO2024029005A1 (ja) | 2022-08-03 | 2022-08-03 | 解析装置及び光ファイバセンシング方法 |
Publications (1)
| Publication Number | Publication Date |
|---|---|
| WO2024029005A1 true WO2024029005A1 (ja) | 2024-02-08 |
Family
ID=89848918
Family Applications (1)
| Application Number | Title | Priority Date | Filing Date |
|---|---|---|---|
| PCT/JP2022/029795 Ceased WO2024029005A1 (ja) | 2022-08-03 | 2022-08-03 | 解析装置及び光ファイバセンシング方法 |
Country Status (2)
| Country | Link |
|---|---|
| JP (1) | JP7720014B2 (ja) |
| WO (1) | WO2024029005A1 (ja) |
Citations (2)
| Publication number | Priority date | Publication date | Assignee | Title |
|---|---|---|---|---|
| US20200264018A1 (en) * | 2017-10-02 | 2020-08-20 | Intuitive Surgical Operations, Inc. | An optical fiber with microgratings and methods and apparatus for making and using same |
| US20210348971A1 (en) * | 2020-05-07 | 2021-11-11 | Ut-Battelle, Llc | Post-processing method to extend the functional range of optical backscatter reflectometry in extreme environments |
-
2022
- 2022-08-03 JP JP2024538589A patent/JP7720014B2/ja active Active
- 2022-08-03 WO PCT/JP2022/029795 patent/WO2024029005A1/ja not_active Ceased
Patent Citations (2)
| Publication number | Priority date | Publication date | Assignee | Title |
|---|---|---|---|---|
| US20200264018A1 (en) * | 2017-10-02 | 2020-08-20 | Intuitive Surgical Operations, Inc. | An optical fiber with microgratings and methods and apparatus for making and using same |
| US20210348971A1 (en) * | 2020-05-07 | 2021-11-11 | Ut-Battelle, Llc | Post-processing method to extend the functional range of optical backscatter reflectometry in extreme environments |
Non-Patent Citations (2)
| Title |
|---|
| OKAMOTO TATSUYA; IIDA DAISUKE; OSHIDA HIROYUKI: "Investigation of Tolerance of OFDR-Based DAS to Vibration-Induced Beat Frequency Offset", 2020 OPTICAL FIBER COMMUNICATIONS CONFERENCE AND EXHIBITION (OFC), OSA, 8 March 2020 (2020-03-08), pages 1 - 3, XP033767774, DOI: 10.1364/OFC.2020.W2A.16 * |
| OKAMOTO TATSUYA; IIDA DAISUKE; OSHIDA HIROYUKI: "Vibration-Induced Beat Frequency Offset Compensation in Distributed Acoustic Sensing Based on Optical Frequency Domain Reflectometry", JOURNAL OF LIGHTWAVE TECHNOLOGY, IEEE, USA, vol. 37, no. 18, 15 September 2019 (2019-09-15), USA, pages 4896 - 4901, XP011746248, ISSN: 0733-8724, DOI: 10.1109/JLT.2019.2933643 * |
Also Published As
| Publication number | Publication date |
|---|---|
| JPWO2024029005A1 (ja) | 2024-02-08 |
| JP7720014B2 (ja) | 2025-08-07 |
Similar Documents
| Publication | Publication Date | Title |
|---|---|---|
| Zhao et al. | Performance investigation of OFDR sensing system with a wide strain measurement range | |
| CN110579177B (zh) | 基于相对相位变化的光频域反射分布式传感解调方法 | |
| JP5012804B2 (ja) | 光ファイバ特性分布センサ | |
| JP4917640B2 (ja) | 光リフレクトメトリ測定方法および装置 | |
| CN107167166B (zh) | 在干涉型传感系统中运动补偿的方法及装置 | |
| CN103196584B (zh) | 测量光纤中温度和应力的方法、以及布里渊光时域反射仪 | |
| JP6645102B2 (ja) | 計測装置、計測システム、計測方法、及びプログラム | |
| JP2018146371A (ja) | 温度・歪センシング装置及び温度・歪センシング方法 | |
| WO2016029110A1 (en) | Method and apparatus for multiple localized interferometric measurements | |
| CN115164955B (zh) | 一种双马赫-曾德尔干涉仪的反馈环路控制方法及装置 | |
| Suo et al. | Study on sliding-window length based on Rayleigh backscattering spectrum correlation in distributed optical-fiber strain measurement | |
| JP7554801B2 (ja) | Ofdrシステム | |
| WO2024029005A1 (ja) | 解析装置及び光ファイバセンシング方法 | |
| JP7691003B2 (ja) | 判定装置、判定方法、およびプログラム | |
| Stewart et al. | Spectral profile tracking of multiplexed fiber Bragg grating sensors | |
| JP7643571B2 (ja) | 接続損失差測定方法、装置及びプログラム | |
| EP4206624B1 (en) | Vibration distribution measuring device and method of same | |
| JP7679945B2 (ja) | レイリー強度パターン計測装置およびレイリー強度パターン計測方法 | |
| US10386265B2 (en) | Estimating method, information processing device, and non-transitory computer-readable recording medium storing estimating program | |
| CN106918293B (zh) | 数据处理装置及数据处理方法 | |
| JP7831617B2 (ja) | 光ファイバの歪み又は温度を解析する装置及び方法 | |
| JP4607923B2 (ja) | ファイバブラッググレーティング素子反射光波長計測処理装置及び処理方法 | |
| JP7406768B2 (ja) | 光ファイバケーブルセンシング装置、光ファイバケーブルセンシング方法、及びプログラム | |
| JP7691029B2 (ja) | 光ファイバセンシング装置及び光ファイバセンシング方法 | |
| Suo et al. | A new quality evaluation parameter for Rayleigh backscattering spectrum and its adaptive subset window algorithm in distributed fiber strain measurement |
Legal Events
| Date | Code | Title | Description |
|---|---|---|---|
| 121 | Ep: the epo has been informed by wipo that ep was designated in this application |
Ref document number: 22953994 Country of ref document: EP Kind code of ref document: A1 |
|
| WWE | Wipo information: entry into national phase |
Ref document number: 2024538589 Country of ref document: JP |
|
| NENP | Non-entry into the national phase |
Ref country code: DE |
|
| 122 | Ep: pct application non-entry in european phase |
Ref document number: 22953994 Country of ref document: EP Kind code of ref document: A1 |