WO2024024596A1 - 特性予測装置、特性予測方法及びプログラム - Google Patents
特性予測装置、特性予測方法及びプログラム Download PDFInfo
- Publication number
- WO2024024596A1 WO2024024596A1 PCT/JP2023/026453 JP2023026453W WO2024024596A1 WO 2024024596 A1 WO2024024596 A1 WO 2024024596A1 JP 2023026453 W JP2023026453 W JP 2023026453W WO 2024024596 A1 WO2024024596 A1 WO 2024024596A1
- Authority
- WO
- WIPO (PCT)
- Prior art keywords
- design
- characteristic
- value
- peripheral
- conditions
- Prior art date
- Legal status (The legal status is an assumption and is not a legal conclusion. Google has not performed a legal analysis and makes no representation as to the accuracy of the status listed.)
- Ceased
Links
Images






Classifications
-
- G—PHYSICS
- G06—COMPUTING OR CALCULATING; COUNTING
- G06F—ELECTRIC DIGITAL DATA PROCESSING
- G06F30/00—Computer-aided design [CAD]
- G06F30/20—Design optimisation, verification or simulation
-
- G—PHYSICS
- G16—INFORMATION AND COMMUNICATION TECHNOLOGY [ICT] SPECIALLY ADAPTED FOR SPECIFIC APPLICATION FIELDS
- G16C—COMPUTATIONAL CHEMISTRY; CHEMOINFORMATICS; COMPUTATIONAL MATERIALS SCIENCE
- G16C60/00—Computational materials science, i.e. ICT specially adapted for investigating the physical or chemical properties of materials or phenomena associated with their design, synthesis, processing, characterisation or utilisation
-
- G—PHYSICS
- G16—INFORMATION AND COMMUNICATION TECHNOLOGY [ICT] SPECIALLY ADAPTED FOR SPECIFIC APPLICATION FIELDS
- G16C—COMPUTATIONAL CHEMISTRY; CHEMOINFORMATICS; COMPUTATIONAL MATERIALS SCIENCE
- G16C20/00—Chemoinformatics, i.e. ICT specially adapted for the handling of physicochemical or structural data of chemical particles, elements, compounds or mixtures
- G16C20/30—Prediction of properties of chemical compounds, compositions or mixtures
-
- G—PHYSICS
- G16—INFORMATION AND COMMUNICATION TECHNOLOGY [ICT] SPECIALLY ADAPTED FOR SPECIFIC APPLICATION FIELDS
- G16C—COMPUTATIONAL CHEMISTRY; CHEMOINFORMATICS; COMPUTATIONAL MATERIALS SCIENCE
- G16C20/00—Chemoinformatics, i.e. ICT specially adapted for the handling of physicochemical or structural data of chemical particles, elements, compounds or mixtures
- G16C20/70—Machine learning, data mining or chemometrics
-
- G—PHYSICS
- G16—INFORMATION AND COMMUNICATION TECHNOLOGY [ICT] SPECIALLY ADAPTED FOR SPECIFIC APPLICATION FIELDS
- G16C—COMPUTATIONAL CHEMISTRY; CHEMOINFORMATICS; COMPUTATIONAL MATERIALS SCIENCE
- G16C20/00—Chemoinformatics, i.e. ICT specially adapted for the handling of physicochemical or structural data of chemical particles, elements, compounds or mixtures
- G16C20/80—Data visualisation
Definitions
- the present disclosure relates to a characteristic prediction device, a characteristic prediction method, and a program.
- Patent Document 1 discloses an invention that predicts the physical properties of a composition composed of a plurality of materials, and displays the feature values of a specific material included in the composition in association with the predicted values of the physical properties. .
- the present disclosure aims to visualize the relationship between the design value and characteristic value of a target substance so that it can be easily understood.
- the present disclosure includes the configuration shown below.
- a reference design determining unit configured to determine reference design conditions representing design conditions for a target substance manufactured using two or more materials; a peripheral design generation unit configured to generate a plurality of peripheral design conditions in which one design value is varied with respect to the reference design condition; a characteristic prediction unit configured to predict two or more characteristic values under each of the peripheral design conditions; a visualization unit configured to arrange a symbol corresponding to the peripheral design condition in a color representation according to the second characteristic value on a plane having the design value and the first characteristic value as axes; and,
- a characteristic prediction device comprising:
- a reference design determining unit configured to determine reference design conditions representing design conditions for a target substance manufactured using two or more materials; a peripheral design generation unit configured to generate a plurality of peripheral design conditions in which two design values are varied with respect to the reference design condition; a characteristic prediction unit configured to predict one or more characteristic values under each of the peripheral design conditions; A visualization unit configured to arrange a symbol corresponding to the peripheral design condition in a color representation according to the characteristic value on a plane having the first design value and the second design value as axes. and, A characteristic prediction device comprising:
- the characteristic prediction device is configured to predict two or more of the characteristic values
- the visualization unit is configured to place a symbol in which regions expressed in colors corresponding to each of the characteristic values are combined at coordinates corresponding to the peripheral design condition. Characteristic prediction device.
- the characteristic prediction device is configured to determine, as the reference design condition, the peripheral design condition corresponding to the symbol selected from the symbols displayed by the visualization unit,
- the visualization unit is configured to rearrange the symbol corresponding to the peripheral design condition generated based on the reference design condition on the plane when the reference design condition is newly selected. Characteristic prediction device.
- the characteristic prediction device is configured to determine the reference design conditions by editing the peripheral design conditions corresponding to the symbol displayed by the visualization unit,
- the visualization unit is configured to rearrange the symbol corresponding to the peripheral design condition generated based on the reference design condition on the plane when the reference design condition is newly selected. Characteristic prediction device.
- the peripheral design generation unit is configured to generate the peripheral design conditions by varying the design value in a range between a predetermined upper limit value and a predetermined lower limit value and within a predetermined width. Characteristic prediction device.
- the characteristic prediction device is configured to predict the characteristic value using a machine learning model in which the design value is an explanatory variable and the characteristic value is an objective variable. Characteristic prediction device.
- the computer is A procedure for determining reference design conditions representing design conditions for a target substance manufactured using two or more materials; a step of generating a plurality of peripheral design conditions in which one design value is varied with respect to the reference design condition; a procedure for predicting two or more characteristic values under each of the peripheral design conditions; a step of arranging a symbol corresponding to the peripheral design condition in a color representation according to the second characteristic value on a plane having the design value and the first characteristic value as axes; A characteristic prediction method that performs
- the computer is A procedure for determining reference design conditions representing design conditions for a target substance manufactured using two or more materials; a step of generating a plurality of peripheral design conditions in which the design value of 2 is varied with respect to the reference design condition; a procedure for predicting one or more characteristic values under each of the peripheral design conditions; a step of arranging a symbol corresponding to the peripheral design condition in a color representation according to the characteristic value on a plane having the first design value and the second design value as axes; A characteristic prediction method that performs
- a procedure for determining reference design conditions representing design conditions for a target substance manufactured using two or more materials a step of generating a plurality of peripheral design conditions in which one design value is varied with respect to the reference design condition; a procedure for predicting two or more characteristic values under each of the peripheral design conditions; a step of arranging a symbol corresponding to the peripheral design condition in a color representation according to the second characteristic value on a plane having the design value and the first characteristic value as axes; A program to run.
- a procedure for determining reference design conditions representing design conditions for a target substance manufactured using two or more materials a step of generating a plurality of peripheral design conditions in which the design value of 2 is varied with respect to the reference design condition; a procedure for predicting one or more characteristic values under each of the peripheral design conditions; a step of arranging a symbol corresponding to the peripheral design condition in a color representation according to the characteristic value on a plane having the first design value and the second design value as axes; A program to run.
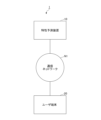
- FIG. 1 is a block diagram showing an example of the overall configuration of a design support system.
- FIG. 2 is a block diagram showing an example of the hardware configuration of a computer.
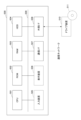
- FIG. 3 is a block diagram showing an example of the functional configuration of the design support system.
- FIG. 4 is a flowchart showing an example of the processing procedure of the characteristic prediction method.
- FIG. 5 is a diagram showing an example of reference design data.
- FIG. 6 is a diagram showing an example of a reference design input screen.
- FIG. 7 is a flowchart illustrating an example of a procedure for peripheral design generation processing.
- FIG. 8 is a diagram showing a first example of peripheral design conditions.
- FIG. 9 is a diagram showing a second example of peripheral design conditions.
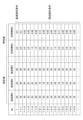
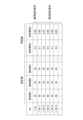
- FIG. 10 is a diagram showing a first example of characteristic prediction results.
- FIG. 11 is a diagram showing a second example of the characteristic prediction results.
- FIG. 12 is a diagram showing a third example of the characteristic prediction results.
- FIG. 13 is a diagram showing a first example of the characteristic prediction screen.
- FIG. 14 is a diagram showing a second example of the characteristic prediction screen.
- FIG. 15 is a diagram showing a third example of the characteristic prediction screen.
- FIG. 16(A) is a diagram illustrating an example of a symbol displaying two predicted values.
- FIG. 16(B) is a diagram showing an example of a symbol displaying two predicted values.
- FIG. 16(C) is a diagram illustrating an example of symbols displaying three predicted values.
- FIG. 16(D) is a diagram showing an example of symbols displaying four predicted values.
- FIG. 17 is a diagram showing a fourth example of the characteristic prediction results.
- FIG. 18 is a diagram showing an example of a reference design editing screen.
- XAI Artificial Intelligence
- SHAP Shape Additive Explanations
- LIME Large Scalable Model-agnostic Explanations
- One embodiment of the present disclosure is a design support system that supports the design of a substance manufactured using a plurality of substances.
- the substance to be designed will be referred to as the "target substance”
- the substance used to manufacture the target substance will be referred to as the "material substance”.
- target substance in this embodiment is a resin, an alloy, or the like.
- materials in this embodiment include monomers, polymers, additives, and the like.
- the target substance and the material substance are not limited to these, and any substance can be applied as long as it is manufactured using a plurality of substances.
- the design support system in this embodiment includes a plurality of design conditions (hereinafter also referred to as "peripheral design conditions") in which one or more design values are varied among the design conditions (hereinafter also referred to as “standard design conditions") of the target substance. ) and displays the relationship between the varied design value and one or more characteristic values predicted under each peripheral design condition.
- the design conditions for the target substance include the blending amount, molecular weight, and physical property values (eg, polymerization degree and glass transition point, etc.) of each material, as well as manufacturing conditions (eg, processing temperature, processing time, etc.).
- the design support system in this embodiment can display the relationship between the design value and the characteristic value even when a plurality of design values are varied or a plurality of characteristic values are predicted. Therefore, according to the design support system of this embodiment, it is possible to easily grasp the tendency of change in characteristic values due to variation of design values.
- the design support system in this embodiment predicts one characteristic value for peripheral design conditions in which two design values among the reference design conditions are varied
- the design support system predicts the characteristic Plot symbols represented by color representations according to their values. Therefore, according to the design support system in this embodiment, even when a plurality of design values are varied, it is possible to easily grasp the change tendency of the characteristic values.
- the design support system in this embodiment predicts two characteristic values for peripheral design conditions in which one design value among the standard design conditions is varied
- the design support system in this embodiment predicts the Symbols expressed in color according to the second characteristic value are plotted on a plane whose axis is . Therefore, according to the design support system of this embodiment, even when a plurality of characteristic values are predicted, it is possible to easily grasp the change tendency of the characteristic values.
- the design support system in this embodiment predicts two characteristic values for peripheral design conditions in which two design values among the standard design conditions are varied, A symbol is plotted on a plane, which is a combination of regions expressed in colors according to each characteristic value. Therefore, according to the design support system of this embodiment, even when a plurality of characteristic values are predicted for design conditions in which a plurality of design values are varied, it is possible to easily grasp the change tendency of the characteristic values. .
- the design support system in this embodiment determines new reference design conditions based on the displayed prediction results, and determines one or more peripheral design conditions for which one or more design values have been changed with respect to the new reference design conditions. Characteristic values can be predicted. Therefore, according to the design support system of this embodiment, it is possible to repeatedly search for peripheral design conditions that can obtain even better prediction results, using the design conditions that have yielded good prediction results as reference design conditions. Therefore, according to the design support system in this embodiment, it is possible to efficiently determine the design conditions for the target substance.
- FIG. 1 is a block diagram showing an example of the overall configuration of a design support system in this embodiment.
- the design support system 1 in this embodiment includes a characteristic prediction device 10 and a user terminal 20.
- the characteristic prediction device 10 and the user terminal 20 are connected to enable data communication via a communication network N1 such as a LAN (Local Area Network) or the Internet.
- a communication network N1 such as a LAN (Local Area Network) or the Internet.
- the property prediction device 10 is an information processing device such as a personal computer, workstation, or server that visualizes the relationship between the design value and the property value of the target substance in response to a request from the user terminal 20.
- the property prediction device 10 receives basic design conditions regarding the target substance to be designed from the user terminal 20.
- the property prediction device 10 predicts property values under peripheral design conditions generated based on basic design conditions, and generates information (hereinafter also referred to as "visualization information") for visualizing the relationship between the design values and property values of the target substance. ) is transmitted to the user terminal 20.
- the user terminal 20 is an information processing terminal such as a personal computer, a tablet terminal, or a smartphone operated by a user.
- the user terminal 20 transmits the design conditions of the target substance to be designed to the property prediction device 10 in response to the user's operation.
- the user terminal 20 displays the relationship between the design value and the characteristic value of the target substance to the user based on the visualization information received from the characteristic prediction device 10.
- the overall configuration of the design support system 1 shown in FIG. 1 is one example, and there may be various system configuration examples depending on the use and purpose.
- the characteristic prediction device 10 may be realized by a plurality of computers, or may be realized as a cloud computing service.
- the design support system 1 may be realized by a stand-alone information processing device that has the functions that the characteristic prediction device 10 and the user terminal 20 should each have.
- FIG. 2 is a block diagram showing an example of the hardware configuration of the computer 500 in this embodiment.
- the computer 500 includes a CPU (Central Processing Unit) 501, a ROM (Read Only Memory) 502, a RAM (Random Access Memory) 503, an HDD (Hard Disk Drive) 504, an input device 505, It has a display device 506, a communication I/F (Interface) 507, and an external I/F 508.
- CPU501, ROM502, and RAM503 form what is called a computer.
- Each piece of hardware in the computer 500 is interconnected via a bus line 509. Note that the input device 505 and the display device 506 may be connected to an external I/F 508 for use.
- the CPU 501 is an arithmetic unit that realizes control and functions of the entire computer 500 by reading programs and data from a storage device such as the ROM 502 or the HDD 504 onto the RAM 503 and executing processing.
- the ROM 502 is an example of a nonvolatile semiconductor memory (storage device) that can retain programs and data even when the power is turned off.
- the ROM 502 functions as a main storage device that stores various programs, data, etc. necessary for the CPU 501 to execute various programs installed on the HDD 504 .
- the ROM 502 stores data such as boot programs such as the BIOS (Basic Input/Output System) and EFI (Extensible Firmware Interface) that are executed when the computer 500 is started, OS (Operating System) settings, and network settings. is stored.
- BIOS Basic Input/Output System
- EFI Extensible Firmware Interface
- the RAM 503 is an example of a volatile semiconductor memory (storage device) whose programs and data are erased when the power is turned off.
- the RAM 503 is, for example, DRAM (Dynamic Random Access Memory) or SRAM (Static Random Access Memory).
- the RAM 503 provides a work area where various programs installed on the HDD 504 are expanded when the CPU 501 executes them.
- the HDD 504 is an example of a nonvolatile storage device that stores programs and data.
- the programs and data stored in the HDD 504 include an OS, which is basic software that controls the entire computer 500, and applications that provide various functions on the OS.
- the computer 500 may use a storage device (for example, SSD: Solid State Drive) that uses flash memory as a storage medium.
- SSD Solid State Drive
- the input device 505 is a touch panel used by the user to input various signals, operation keys or buttons, a keyboard or mouse, a microphone for inputting sound data such as voice, or the like.
- the display device 506 is composed of a display such as a liquid crystal or organic EL (Electro-Luminescence) that displays a screen, a speaker that outputs sound data such as audio, and the like.
- a display such as a liquid crystal or organic EL (Electro-Luminescence) that displays a screen
- a speaker that outputs sound data such as audio, and the like.
- the communication I/F 507 is an interface that connects to a communication network and allows the computer 500 to perform data communication.
- the external I/F 508 is an interface with an external device.
- the external device includes a drive device 510 and the like.
- the drive device 510 is a device for setting the recording medium 511.
- the recording medium 511 here includes a medium that records information optically, electrically, or magnetically, such as a CD-ROM, a flexible disk, and a magneto-optical disk. Further, the recording medium 511 may include a semiconductor memory or the like that electrically records information, such as a ROM or a flash memory. Thereby, the computer 500 can read and/or write to the recording medium 511 via the external I/F 508.
- the various programs installed on the HDD 504 are, for example, when the distributed recording medium 511 is set in the drive device 510 connected to the external I/F 508, and the various programs recorded on the recording medium 511 are read by the drive device 510. It is installed by Alternatively, various programs to be installed on the HDD 504 may be installed by being downloaded from a network different from the communication network via the communication I/F 507.
- FIG. 3 is a block diagram showing an example of the functional configuration of the design support system 1 in this embodiment.
- the characteristic prediction device 10 in this embodiment includes a model storage section 100, a reference design determination section 101, a peripheral design generation section 102, a characteristic prediction section 103, and a visualization section 104.
- the reference design determination unit 101, peripheral design generation unit 102, characteristic prediction unit 103, and visualization unit 104 are realized by the processing that the CPU 501 executes from the program loaded from the HDD 504 onto the RAM 503 shown in FIG.
- the model storage unit 100 is realized by the HDD 504 shown in FIG.
- the model storage unit 100 stores learned characteristic prediction models.
- the property prediction model is a machine learning model that uses each design value in the design conditions of the target substance as an explanatory variable and the characteristic value of the target substance as an objective variable.
- An example of a machine learning model is a regression model.
- the structure of the machine learning model is, for example, a random forest or a deep neural network.
- the reference design determining unit 101 receives design conditions selected according to user operations from the user terminal 20.
- the reference design determination unit 101 determines the received design conditions as reference design conditions.
- the peripheral design generation unit 102 generates a plurality of peripheral design conditions in which one or more design values are varied with respect to the reference design conditions.
- the peripheral design generation unit 102 generates peripheral design conditions by varying the design values of the reference design conditions according to variation conditions set in advance for each design value.
- the variable conditions may be arbitrarily settable according to user operations.
- the characteristic prediction unit 103 predicts one or more characteristic values for each peripheral design condition.
- the characteristic prediction unit 103 calculates one or more characteristic values by inputting the design values of the peripheral design conditions into the learned characteristic prediction model stored in the model storage unit 100.
- the visualization unit 104 generates visualization information for visualizing the relationship between the design value and the characteristic value of the target substance.
- the visualization unit 104 transmits the generated visualization information to the user terminal 20.
- the visualization unit 104 visualizes the relationship between the design value and the characteristic value by arranging symbols expressed in colors according to the characteristic value on a plane having the design value or the characteristic value as an axis.
- the design value or characteristic value expressed on the axis of the plane and the characteristic value expressed in color can be arbitrarily selected.
- the user terminal 20 in this embodiment includes a reference design input section 201, a reference design input section 202, and a result display section 203.
- the reference design input unit 201, reference design input unit 202, and result display unit 203 are realized by the processing that the CPU 501 executes from the program loaded from the HDD 504 onto the RAM 503 shown in FIG.
- the reference design input unit 201 receives input of reference design data in response to user operations.
- the reference design data is data representing reference design conditions that are candidates for standard design conditions.
- the number of reference design conditions included in the reference design data may be one or more.
- the reference design input unit 201 displays the received reference design data on the display device 506.
- the reference design input unit 202 accepts selection of reference design conditions in response to user operations. When selecting a reference design condition for the first time, the reference design input unit 202 selects the reference design condition from the reference design data received by the reference design input unit 201. When selecting a reference design condition for the second time or later, the reference design input unit 202 selects the reference design condition from the peripheral design conditions included in the prediction results displayed by the result display unit 203.
- the result display unit 203 receives visualization information from the characteristic prediction device 10.
- the result display unit 203 displays the relationship between the design value and the characteristic value in the peripheral design conditions on the display device 506 based on the received visualization information.
- FIG. 4 is a flowchart showing an example of the processing procedure of the characteristic prediction method in this embodiment.
- step S1 the reference design input unit 201 included in the user terminal 20 receives input of reference design data in response to a user's operation.
- the reference design input unit 201 displays the received reference design data on the display device 506.
- FIG. 5 is a diagram showing an example of reference design data.
- the reference design data includes a plurality of reference design conditions representing design conditions of the target substance.
- the blending amount of the materials used to manufacture the target substance is used as the design condition.
- the reference design data is input and displayed on the reference design input screen displayed on the display device 506.
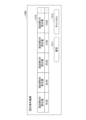
- the reference design input screen is a screen for accepting input of reference design data and displaying reference design conditions included in the reference design data.
- FIG. 6 is a diagram showing an example of a reference design input screen in this embodiment.
- the reference design input screen 1000 in this embodiment includes a file input field 1010, a file reference button 1011, a confirm button 1012, a clear button 1013, and a reference design condition display field 1020.
- the user can input reference design data by dragging and dropping the reference design data into the file input field 1010.
- the user may input reference design data by pressing the file reference button 1011 and selecting the reference design data on the displayed file selection screen.
- the contents of the reference design data included in the reference design data are displayed in a selectable manner in the reference design condition display field 1020.
- reference design conditions are displayed in a table format in a reference design condition display column 1020, and a selection column 1021 is displayed for each reference design condition.
- the reference design condition selected in the selection field 1021 is selected as the reference design condition.
- the user presses the clear button 1013 the reference design conditions displayed in the reference design condition display field 1020 are cleared.
- step S2 the reference design input unit 202 included in the user terminal 20 receives selection of reference design conditions according to the user's operation.
- the reference design input unit 202 transmits the selected reference design conditions to the characteristic prediction device 10.
- the reference design determining unit 101 receives reference design conditions from the user terminal 20.
- the reference design determination unit 101 sends the received reference design conditions to the peripheral design generation unit 102.
- step S3 the peripheral design generation unit 102 included in the characteristic prediction device 10 receives the reference design conditions from the reference design determination unit 101.
- the peripheral design generation unit 102 receives a selection of one or more design values to be changed and one or more characteristic values to be predicted, in response to the user's operation. Selection of design values and characteristic values is performed on a characteristic prediction screen displayed on display device 506.
- step S4 the peripheral design generation unit 102 included in the characteristic prediction device 10 generates a plurality of peripheral design conditions in which one or more design values to be varied are varied with respect to the reference design condition.
- the peripheral design generation unit 102 sends the plurality of generated peripheral design conditions to the characteristic prediction unit 103.
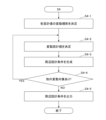
- FIG. 7 is a flowchart illustrating an example of the procedure of peripheral design generation processing in this embodiment.
- the peripheral design generation unit 102 determines variation conditions for each design value of the design conditions.
- the fluctuation conditions may be set in advance for each design value, or may be arbitrarily set according to the user's operation.
- the fluctuation conditions in this embodiment include an upper limit value, a lower limit value, a fluctuation width, and the like.
- the variation condition indicates that the design value to be varied is varied in a range of a predetermined lower limit value or more and a predetermined upper limit value or less by a predetermined variation width unit.
- step S4-2 the peripheral design generation unit 102 selects a design value to be varied (hereinafter also referred to as a "variable design value”) from one or more design values selected as variables.
- a design value to be varied hereinafter also referred to as a "variable design value”
- the criteria for selecting a variable design value from the design values to be varied are arbitrary. For example, the name of the design value, the order in which it was selected as a variable target, etc. may be anything.
- step S4-3 the peripheral design generation unit 102 generates peripheral design conditions by varying the variable design values according to the variable conditions with respect to the reference design conditions. At this time, the design values other than the variable design values are fixed. That is, a plurality of peripheral design conditions are generated that differ only in variable design values from the standard design conditions.
- the peripheral design generation unit 102 If there are already generated peripheral design conditions, the peripheral design generation unit 102 generates peripheral design conditions by varying the variable design values for each of the generated peripheral design conditions according to the variable conditions.
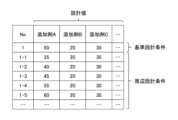
- FIG. 8 is a diagram showing an example of peripheral design conditions in which one design value is varied with respect to the standard design conditions.
- the example in Fig. 8 is an example in which the reference design condition (No. 1) shown in Fig. 5 is selected as the standard design condition, and the "mixing amount of additive A", which is an example of the design value, is selected as the variable design value. It is.
- the multiple peripheral design conditions No. 1-1 to 1-5), only the blended amount of additive A varies with respect to the standard design condition (No. 1). , other design values are fixed.
- step S4-4 the peripheral design generation unit 102 determines whether there is a design value that has not been selected as a fluctuation design value (in other words, for which peripheral design conditions have not been generated) among the design values selected as fluctuation targets. Determine whether or not. If there is a design value that has not been selected as a variable design value (YES), the peripheral design generation unit 102 returns the process to step S4-2. If all the design values have been selected as variable design values (NO), the peripheral design generation unit 102 advances the process to step S4-5.
- a design value that has not been selected as a fluctuation design value in other words, for which peripheral design conditions have not been generated
- step S4-2 which is executed again, the peripheral design generation unit 102 selects a new variable design value from among the design values selected as variables that have not been selected as variable design values. Thereafter, steps S4-3 to S4-4 are executed again for the selected new variation design value.
- FIG. 9 is a diagram showing an example of peripheral design conditions in which two design values are varied with respect to the standard design conditions.
- the reference design condition (No. 1) shown in FIG. In this example is selected as the variation design value.
- the plurality of peripheral design conditions (No. 1-1-1 to 1-3-5) are different from the standard design condition (No. 1) in terms of the amount of additive A blended.
- Peripheral design conditions (No. 1-1-1 to 1-1-5) where only the amount of additive B changed (No. 1-2-1 to 1-2-5)
- surrounding design conditions No. 1-3-1 to 1-3-5
- step S4-5 the peripheral design generation unit 102 sends the peripheral design conditions generated in step S4-3 to the characteristic prediction unit 103. Note that when step S4-3 is executed multiple times, all peripheral design conditions generated each time are sent to the characteristic prediction unit 103.
- step S5 the characteristic prediction unit 103 included in the characteristic prediction device 10 receives a plurality of peripheral design conditions from the peripheral design generation unit 102.
- the characteristic prediction unit 103 reads out the learned characteristic prediction model from the model storage unit 100.
- the characteristic prediction unit 103 predicts one or more characteristic values to be predicted for each peripheral design condition.
- the characteristic prediction unit 103 calculates one or more characteristic values by inputting the design values of each peripheral design condition into a learned characteristic prediction model. Then, the characteristic prediction unit 103 sends the prediction result to the visualization unit 104.
- the prediction result includes peripheral design conditions and characteristic values predicted under the peripheral design conditions.
- FIG. 10 is a diagram showing an example of the prediction result of predicting the characteristic value 2 under each peripheral design condition shown in FIG. 8. As shown in FIG. 10, "Material property 1" and “Material property 2", which are examples of characteristic values, are predicted for each peripheral design condition (No. 1-1 to 1-5).
- FIG. 11 is a diagram showing an example of a prediction result of predicting one characteristic value under each peripheral design condition shown in FIG. 9. As shown in FIG. 11, "material property 1", which is an example of a characteristic value, is predicted for each peripheral design condition (No. 1-1-1 to 1-3-5).
- FIG. 12 is a diagram showing an example of the prediction result of predicting the characteristic value 2 under each peripheral design condition shown in FIG. 9. As shown in Figure 12, for each peripheral design condition (No. 1-1-1 to 1-3-5), "Material property 1" and “Material property 2", which are examples of characteristic values, are predicted. has been done.
- step S6 the visualization unit 104 included in the characteristic prediction device 10 receives the prediction result from the characteristic prediction unit 103. Next, the visualization unit 104 generates visualization information for visualizing the relationship between the design value and the characteristic value of the target substance. Subsequently, the visualization unit 104 transmits visualization information to the user terminal 20.
- the result display unit 203 receives visualization information from the characteristic prediction device 10.
- the result display unit 203 visualizes the relationship between the design value and the characteristic value of the target substance based on the visualization information. Specifically, the result display unit 203 displays the relationship between the design value and the characteristic value of the target substance on a characteristic prediction screen displayed on the display device 506.
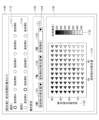
- FIG. 13 is a diagram showing a first example of a characteristic prediction screen in this embodiment.
- the first example of the characteristic prediction screen is a characteristic prediction screen when two characteristic values are predicted under peripheral design conditions in which one design value is varied with respect to the standard design condition.
- the characteristic prediction screen 1100 in the first example has a design value selection field 1110, an axis setting field 1120, and a graph display field 1130.
- the design value selection field 1110 has a first selection field 1111 and a second selection field 1112.
- variable design values among the design conditions are displayed in a selectable manner.
- a list of each design value is displayed in the first selection field 1111 and the second selection field 1112 so that each design value can be exclusively selected using radio buttons.
- the first selection field 1111 and the second selection field 1112 may be displayed, for example, as a drop-down list or a list box with variable design values as options.
- the axis setting field 1120 has an X-axis setting field 1121, a Y-axis setting field 1122, a Z-axis setting field 1123, and an axis addition button 1124.
- the design values selected in the design value selection field 1110 are displayed in a selectable manner.
- the design value or predictable characteristic value selected in the design value selection field 1110 is displayed in a selectable manner.
- the Z-axis setting column 1123 predictable characteristic values are displayed in a selectable manner.
- the characteristic prediction screen in this embodiment in the X-axis setting field 1121, the Y-axis setting field 1122, and the Z-axis setting field 1123, selected design values or predictable characteristic values are displayed so as to be selectable in a drop-down list.
- the X-axis setting field 1121, the Y-axis setting field 1122, and the Z-axis setting field 1123 may be displayed, for example, as a list box with selected design values or predictable characteristic values as options.
- the first example of the characteristic prediction screen is a display example when characteristic value 2 is predicted under peripheral design conditions in which design value 1 is varied.
- the X-axis is the "mixing amount of additive A" which is an example of the design value
- the Y-axis is the "material property 1" which is an example of the first characteristic value
- the Z-axis is the “Material property 2” is an example of the characteristic value of “Material property 2”.
- the graph display field 1130 has a plane having an X-axis 1131 and a Y-axis 1132, and a Z-axis 1133 represented by a color bar.
- symbols corresponding to the prediction results regarding each peripheral design condition are arranged at coordinates corresponding to the X axis 1131 and Y axis 1132 in a color representation corresponding to the value of the Z axis 1133.
- the color expression representing the value of the Z-axis may be color, grayscale, or a pattern expressed in binary values.
- hue, brightness, and saturation may be changed according to the characteristic value.
- two colors separated by 180 degrees on the hue wheel may be associated with the minimum and maximum values of the characteristic value, and each symbol may be expressed with a hue at an angle corresponding to the predicted characteristic value.
- the brightness may be changed according to the characteristic value.
- the minimum value (0) and maximum value (255) of brightness may be made to correspond to the minimum value and maximum value of characteristic value, and each symbol may be expressed with brightness according to the predicted characteristic value.
- reference design conditions and peripheral design conditions are displayed in a distinguishable manner.
- the symbols corresponding to the standard design conditions are displayed with thick lines around the outer periphery.
- the method of distinguishing between the standard design conditions and the surrounding design conditions is not limited to this, but any method can be used as long as it is visible to the user, such as a difference in the color of the symbol, a difference in the shape, a difference in the size, etc. But that's fine.
- the symbols corresponding to the prediction results under each peripheral design condition are arranged so as to draw a line graph on the XY plane.
- the user can grasp the tendency of change in the characteristic value of 2 due to variation of the design value.
- FIG. 14 is a diagram showing a second example of the characteristic prediction screen in this embodiment.
- the second example of the characteristic prediction screen is a characteristic prediction screen when one characteristic value is predicted under peripheral design conditions in which two design values are varied with respect to the standard design condition.
- the second example of the characteristic prediction screen is a display example when one characteristic value is predicted under peripheral design conditions in which two design values are varied.
- the X-axis 1131 is an example of the first design value, which is the "additive A content”
- the Y-axis 1132 is an example of the second design value, which is the "additive B content.”
- the Z-axis 1133 is "material property 1" which is an example of the characteristic value.
- FIG. 15 is a diagram showing a third example of the characteristic prediction screen in this embodiment.
- the third example of the characteristic prediction screen is a characteristic prediction screen when the characteristic value of 2 is predicted under peripheral design conditions in which the design value of 2 is varied with respect to the standard design condition.
- the third example of the characteristic prediction screen is a display example when characteristic value 2 is predicted under peripheral design conditions in which design value 2 is varied.
- the X-axis 1131 is an example of the first design value, which is the "additive A content”
- the Y-axis 1132 is an example of the second design value, which is the "additive B content.”
- the Z1 axis 1133-1 is "material property 1" which is an example of the first characteristic value
- the Z2 axis 1133-2 is “material property 2" which is an example of the second characteristic value.
- the Z2 axis is displayed by pressing the axis addition button 1124.
- the Z axis in the first example and the second example becomes the Z1 axis.
- the Z3 axis, Z4 axis, etc. may be added by further pressing the axis addition button 1124.
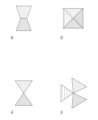
- FIG. 16 is a diagram showing an example of symbols in the third example.
- the symbol in the third example is a symbol in which regions expressed in colors corresponding to respective characteristic values are combined. It is preferable that the symbols in the third example have each area formed in the same shape and arranged point-symmetrically.
- FIGS. 16(A) and 16(B) are examples of symbols that display two predicted values.
- each area is formed of a triangle, and the areas are arranged facing each other left and right.
- each area is formed of a rectangle (trapezoid) and is arranged facing each other in the left and right directions.
- FIG. 16(C) is an example of a symbol displaying three predicted values.
- each region is formed of a triangle, and the symbols are arranged so that the angle between the center line and the adjacent triangle is 120°.
- FIG. 16(D) is an example of a symbol displaying four predicted values.
- each region is formed of a triangle, and the symbols are arranged vertically and horizontally.
- the symbols in the third example are not limited to the example shown in FIG. 16.
- the symbols in the third example only need to be represented in a form that allows the balance of colors and shapes of regions corresponding to each characteristic value to be easily understood.
- step S7 the visualization unit 104 included in the characteristic prediction device 10 determines whether the user has finished searching. If the search is completed (YES), the visualization unit 104 ends the characteristic prediction method. If the search is not completed (NO), the visualization unit 104 returns the process to step S2.
- the determination as to whether the search has ended is made based on whether or not the user has performed an operation on the prediction result displayed by the visualization unit 104.
- the visualization unit 104 determines that the search has not ended. If the user does not perform an operation to select a new reference design condition based on the prediction result, the visualization unit 104 determines that the search has ended.
- step S2 which is executed again, the reference design determining unit 101 determines new reference design conditions in accordance with the user's operation. Thereafter, steps S3 to S7 are executed again for the determined new reference design conditions.
- FIG. 17 is a diagram showing an example of a prediction result obtained by selecting a new reference design condition from the prediction result and predicting the characteristic value of 2 based on the new reference design condition.
- the peripheral design conditions No. 1-23 are selected as the new standard design conditions from the prediction results, and the "mixing amount of additive C", which is an example of the design value, is selected as the variable design value.
- the multiple peripheral design conditions No. 1-23-1 to 1-23-5
- the standard design condition No. 1-23-5
- Only the blending amount varies, and the other design values are fixed.
- "material physical property 1" and “material physical property 2”, which are examples of characteristic values are predicted.
- a design condition editing screen for editing each design value of the peripheral design conditions is displayed on the display device 506 of the user terminal 20.
- the design condition editing screen is displayed after specifying the peripheral design conditions to be edited. For example, by selecting each symbol displayed in the graph display column 1130 of the characteristic prediction screen 1100, a design condition editing screen for editing each design value of the peripheral design condition corresponding to the symbol is displayed.
- FIG. 18 is a diagram showing an example of a design condition editing screen in this modification.
- the design condition editing screen 1200 in this modification includes a design condition editing field 1210, a confirm button 1211, and a cancel button 1212.
- each design value of the peripheral design condition to be edited is displayed in an editable format.
- each design value of the peripheral design conditions is displayed in a table format, and each design value is displayed so as to be directly editable.
- the confirm button 1211 becomes available for pressing.
- the reference design input unit 202 accepts the peripheral design conditions edited in the design condition editing field 1210 as new basic design conditions.
- the cancel button 1212 the result display section 203 closes the design condition editing screen 1200.
- peripheral design conditions are generated in which one or more design values are varied with respect to new reference design conditions, and prediction results including each peripheral design condition and one or more characteristic values predicted for each peripheral design condition are generated. Displayed on characteristic prediction screen 1100.
- the design support system of this embodiment when two characteristic values are predicted for a plurality of peripheral design conditions in which one design value among the reference design conditions is varied, the design support system uses the changed design value and one of the characteristic values as an axis. A symbol expressed in a color according to the other characteristic value is plotted on a plane. Therefore, according to the design support system of this embodiment, even when a plurality of characteristic values are predicted, it is possible to easily grasp the change tendency of the characteristic values.
- the design support system in this embodiment selects a desired design condition from the displayed prediction results, sets the selected design condition as a new reference design condition, and sets the desired design condition for the peripheral design condition in which the desired design value is varied.
- the prediction result of predicting the characteristic value can be redisplayed. Therefore, according to the design support system of this embodiment, it is possible to repeatedly search for design conditions surrounding the design conditions for which a good prediction result has been obtained, and it is possible to efficiently determine the design conditions for the target substance.
- processing circuit refers to a processor programmed to execute each function by software, such as a processor implemented by an electronic circuit, or a processor designed to execute each function explained above. This includes devices such as ASICs (Application Specific Integrated Circuits), DSPs (Digital Signal Processors), FPGAs (Field Programmable Gate Arrays), and conventional circuit modules.
- ASICs Application Specific Integrated Circuits
- DSPs Digital Signal Processors
- FPGAs Field Programmable Gate Arrays
- Design support system 10 Characteristic prediction device 101 Reference design determination unit 102 Peripheral design generation unit 103 Characteristic prediction unit 104 Visualization unit 20 User terminal 201 Reference design input unit 202 Reference design input unit 203 Result display unit
Landscapes
- Engineering & Computer Science (AREA)
- Theoretical Computer Science (AREA)
- Physics & Mathematics (AREA)
- Computing Systems (AREA)
- General Physics & Mathematics (AREA)
- General Engineering & Computer Science (AREA)
- Geometry (AREA)
- Evolutionary Computation (AREA)
- Computer Hardware Design (AREA)
- Life Sciences & Earth Sciences (AREA)
- Bioinformatics & Cheminformatics (AREA)
- Bioinformatics & Computational Biology (AREA)
- Management, Administration, Business Operations System, And Electronic Commerce (AREA)
Abstract
Description
前記基準設計条件に対して、1の設計値を変動させた複数の周辺設計条件を生成するように構成されている周辺設計生成部と、
前記周辺設計条件それぞれにおける2以上の特性値を予測するように構成されている特性予測部と、
前記設計値と第1の前記特性値とを軸とする平面に、第2の前記特性値に応じた色表現で、前記周辺設計条件に対応するシンボルを配置するように構成されている可視化部と、
を備える特性予測装置。
前記基準設計条件に対して、2の設計値を変動させた複数の周辺設計条件を生成するように構成されている周辺設計生成部と、
前記周辺設計条件それぞれにおける1以上の特性値を予測するように構成されている特性予測部と、
第1の前記設計値と第2の前記設計値とを軸とする平面に、前記特性値に応じた色表現で、前記周辺設計条件に対応するシンボルを配置するように構成されている可視化部と、
を備える特性予測装置。
前記特性予測部は、2以上の前記特性値を予測するように構成されており、
前記可視化部は、前記特性値それぞれに応じた色表現で表された領域が結合したシンボルを、前記周辺設計条件に対応する座標に配置するように構成されている、
特性予測装置。
前記シンボルは、各領域が同一形状で形成され、点対称に配置されている、
特性予測装置。
前記基準設計決定部は、前記可視化部により表示された前記シンボルから選択された前記シンボルに対応する前記周辺設計条件を前記基準設計条件として決定するように構成されており、
前記可視化部は、前記基準設計条件が新たに選択されたとき、当該基準設計条件に基づいて生成された前記周辺設計条件に対応する前記シンボルを前記平面に再配置するように構成されている、
特性予測装置。
前記基準設計決定部は、前記可視化部により表示された前記シンボルに対応する前記周辺設計条件を編集することで前記基準設計条件を決定するように構成されており、
前記可視化部は、前記基準設計条件が新たに選択されたとき、当該基準設計条件に基づいて生成された前記周辺設計条件に対応する前記シンボルを前記平面に再配置するように構成されている、
特性予測装置。
前記周辺設計生成部は、前記設計値を所定の上限値と所定の下限値の範囲かつ所定の幅で変動させることで、前記周辺設計条件を生成するように構成されている、
特性予測装置。
前記特性予測部は、前記設計値を説明変数とし、前記特性値を目的変数とする機械学習モデルを用いて、前記特性値を予測するように構成されている、
特性予測装置。
2以上の材料物質を用いて製造される目的物質における設計条件を表す基準設計条件を決定する手順と、
前記基準設計条件に対して、1の設計値を変動させた複数の周辺設計条件を生成する手順と、
前記周辺設計条件それぞれにおける2以上の特性値を予測する手順と、
前記設計値と第1の前記特性値とを軸とする平面に、第2の前記特性値に応じた色表現で、前記周辺設計条件に対応するシンボルを配置する手順と、
を実行する特性予測方法。
2以上の材料物質を用いて製造される目的物質における設計条件を表す基準設計条件を決定する手順と、
前記基準設計条件に対して、2の設計値を変動させた複数の周辺設計条件を生成する手順と、
前記周辺設計条件それぞれにおける1以上の特性値を予測する手順と、
第1の前記設計値と第2の前記設計値とを軸とする平面に、前記特性値に応じた色表現で、前記周辺設計条件に対応するシンボルを配置する手順と、
を実行する特性予測方法。
2以上の材料物質を用いて製造される目的物質における設計条件を表す基準設計条件を決定する手順と、
前記基準設計条件に対して、1の設計値を変動させた複数の周辺設計条件を生成する手順と、
前記周辺設計条件それぞれにおける2以上の特性値を予測する手順と、
前記設計値と第1の前記特性値とを軸とする平面に、第2の前記特性値に応じた色表現で、前記周辺設計条件に対応するシンボルを配置する手順と、
を実行させるためのプログラム。
2以上の材料物質を用いて製造される目的物質における設計条件を表す基準設計条件を決定する手順と、
前記基準設計条件に対して、2の設計値を変動させた複数の周辺設計条件を生成する手順と、
前記周辺設計条件それぞれにおける1以上の特性値を予測する手順と、
第1の前記設計値と第2の前記設計値とを軸とする平面に、前記特性値に応じた色表現で、前記周辺設計条件に対応するシンボルを配置する手順と、
を実行させるためのプログラム。
従来、材料開発は技術者の経験や勘等に基づいて行われてきた。近年、機械学習等を活用して材料開発を効率化する技術が利用されている。一方、機械学習による予測結果から材料又は配合を選定する際に、最終的な判断は専門の技術者が行う必要がある。そのため、機械学習の予測結果について、その材料又は配合が選定された理由を示す情報も必要となる。
本実施形態における設計支援システムの全体構成を、図1を参照しながら説明する。図1は、本実施形態における設計支援システムの全体構成の一例を示すブロック図である。
本実施形態における設計支援システム1のハードウェア構成を、図2を参照しながら説明する。
本実施形態における特性予測装置10及びユーザ端末20は、例えばコンピュータにより実現される。図2は、本実施形態におけるコンピュータ500のハードウェア構成の一例を示すブロック図である。
本実施形態における設計支援システムの機能構成を、図3を参照しながら説明する。図3は本実施形態における設計支援システム1の機能構成の一例を示すブロック図である。
図3に示されているように、本実施形態における特性予測装置10は、モデル記憶部100、基準設計決定部101、周辺設計生成部102、特性予測部103及び可視化部104を備える。
図3に示されているように、本実施形態におけるユーザ端末20は、参照設計入力部201、基準設計入力部202及び結果表示部203を備える。
本実施形態における設計支援システム1が実行する特性予測方法の処理手順を、図4から図17を参照しながら説明する。図4は、本実施形態における特性予測方法の処理手順の一例を示すフローチャートである。
本実施形態における参照設計入力画面について、図6を参照しながら説明する。図6は、本実施形態における参照設計入力画面の一例を示す図である。
本実施形態における周辺設計生成処理(図4のステップS4)について、図7を参照しながら詳細に説明する。図7は、本実施形態における周辺設計生成処理の手順の一例を示すフローチャートである。
図13は、本実施形態における特性予測画面の第1の例を示す図である。特性予測画面の第1の例は、基準設計条件に対して、1の設計値を変動させた周辺設計条件における2の特性値を予測したときの特性予測画面である。
図14は、本実施形態における特性予測画面の第2の例を示す図である。特性予測画面の第2の例は、基準設計条件に対して、2の設計値を変動させた周辺設計条件における1の特性値を予測したときの特性予測画面である。
図15は、本実施形態における特性予測画面の第3の例を示す図である。特性予測画面の第3の例は、基準設計条件に対して、2の設計値を変動させた周辺設計条件における2の特性値を予測したときの特性予測画面である。
実施形態における設計支援システム1では、予測結果に含まれる周辺設計条件から新たな基準設計条件を選択する構成を説明した。変形例における設計支援システム1では、予測結果に含まれる周辺設計条件の各設計値を編集することで新たな基準設計条件を選択する構成を説明する。
本変形例における設計条件編集画面について、図18を参照しながら説明する。図18は、本変形例における設計条件編集画面の一例を示す図である。
本実施形態における設計支援システムは、基準設計条件のうち2つの設計値を変動させた複数の周辺設計条件について1つの特性値を予測した場合、変動させた設計値を軸とする平面に、予測値に応じた色表現で表されたシンボルをプロットする。したがって、本実施形態における設計支援システムによれば、複数の設計値を変動させた場合であっても、特性値の変化傾向を容易に把握することができる。
上記で説明した実施形態の各機能は、一又は複数の処理回路によって実現することが可能である。ここで、本明細書における「処理回路」とは、電子回路により実装されるプロセッサのようにソフトウェアによって各機能を実行するようプログラミングされたプロセッサや、上記で説明した各機能を実行するよう設計されたASIC(Application Specific Integrated Circuit)、DSP(Digital Signal Processor)、FPGA(Field Programmable Gate Array)や従来の回路モジュール等の機器を含むものとする。
10 特性予測装置
101 基準設計決定部
102 周辺設計生成部
103 特性予測部
104 可視化部
20 ユーザ端末
201 参照設計入力部
202 基準設計入力部
203 結果表示部
Claims (12)
- 2以上の材料物質を用いて製造される目的物質における設計条件を表す基準設計条件を決定するように構成されている基準設計決定部と、
前記基準設計条件に対して、1の設計値を変動させた複数の周辺設計条件を生成するように構成されている周辺設計生成部と、
前記周辺設計条件それぞれにおける2以上の特性値を予測するように構成されている特性予測部と、
前記設計値と第1の前記特性値とを軸とする平面に、第2の前記特性値に応じた色表現で、前記周辺設計条件に対応するシンボルを配置するように構成されている可視化部と、
を備える特性予測装置。 - 2以上の材料物質を用いて製造される目的物質における設計条件を表す基準設計条件を決定するように構成されている基準設計決定部と、
前記基準設計条件に対して、2の設計値を変動させた複数の周辺設計条件を生成するように構成されている周辺設計生成部と、
前記周辺設計条件それぞれにおける1以上の特性値を予測するように構成されている特性予測部と、
第1の前記設計値と第2の前記設計値とを軸とする平面に、前記特性値に応じた色表現で、前記周辺設計条件に対応するシンボルを配置するように構成されている可視化部と、
を備える特性予測装置。 - 請求項2に記載の特性予測装置であって、
前記特性予測部は、2以上の前記特性値を予測するように構成されており、
前記可視化部は、前記特性値それぞれに応じた色表現で表された領域が結合したシンボルを、前記周辺設計条件に対応する座標に配置するように構成されている、
特性予測装置。 - 請求項3に記載の特性予測装置であって、
前記シンボルは、各領域が同一形状で形成され、点対称に配置されている、
特性予測装置。 - 請求項1から4のいずれかに記載の特性予測装置であって、
前記基準設計決定部は、前記可視化部により表示された前記シンボルから選択された前記シンボルに対応する前記周辺設計条件を前記基準設計条件として決定するように構成されており、
前記可視化部は、前記基準設計条件が新たに選択されたとき、当該基準設計条件に基づいて生成された前記周辺設計条件に対応する前記シンボルを前記平面に再配置するように構成されている、
特性予測装置。 - 請求項1から4のいずれかに記載の特性予測装置であって、
前記基準設計決定部は、前記可視化部により表示された前記シンボルに対応する前記周辺設計条件を編集することで前記基準設計条件を決定するように構成されており、
前記可視化部は、前記基準設計条件が新たに選択されたとき、当該基準設計条件に基づいて生成された前記周辺設計条件に対応する前記シンボルを前記平面に再配置するように構成されている、
特性予測装置。 - 請求項1から6のいずれかに記載の特性予測装置であって、
前記周辺設計生成部は、前記設計値を所定の上限値と所定の下限値の範囲かつ所定の変動幅で変動させることで、前記周辺設計条件を生成するように構成されている、
特性予測装置。 - 請求項1から7のいずれかに記載の特性予測装置であって、
前記特性予測部は、前記設計値を説明変数とし、前記特性値を目的変数とする機械学習モデルを用いて、前記特性値を予測するように構成されている、
特性予測装置。 - コンピュータが、
2以上の材料物質を用いて製造される目的物質における設計条件を表す基準設計条件を決定する手順と、
前記基準設計条件に対して、1の設計値を変動させた複数の周辺設計条件を生成する手順と、
前記周辺設計条件それぞれにおける2以上の特性値を予測する手順と、
前記設計値と第1の前記特性値とを軸とする平面に、第2の前記特性値に応じた色表現で、前記周辺設計条件に対応するシンボルを配置する手順と、
を実行する特性予測方法。 - コンピュータが、
2以上の材料物質を用いて製造される目的物質における設計条件を表す基準設計条件を決定する手順と、
前記基準設計条件に対して、2の設計値を変動させた複数の周辺設計条件を生成する手順と、
前記周辺設計条件それぞれにおける1以上の特性値を予測する手順と、
第1の前記設計値と第2の前記設計値とを軸とする平面に、前記特性値に応じた色表現で、前記周辺設計条件に対応するシンボルを配置する手順と、
を実行する特性予測方法。 - コンピュータに、
2以上の材料物質を用いて製造される目的物質における設計条件を表す基準設計条件を決定する手順と、
前記基準設計条件に対して、1の設計値を変動させた複数の周辺設計条件を生成する手順と、
前記周辺設計条件それぞれにおける2以上の特性値を予測する手順と、
前記設計値と第1の前記特性値とを軸とする平面に、第2の前記特性値に応じた色表現で、前記周辺設計条件に対応するシンボルを配置する手順と、
を実行させるためのプログラム。 - コンピュータに、
2以上の材料物質を用いて製造される目的物質における設計条件を表す基準設計条件を決定する手順と、
前記基準設計条件に対して、2の設計値を変動させた複数の周辺設計条件を生成する手順と、
前記周辺設計条件それぞれにおける1以上の特性値を予測する手順と、
第1の前記設計値と第2の前記設計値とを軸とする平面に、前記特性値に応じた色表現で、前記周辺設計条件に対応するシンボルを配置する手順と、
を実行させるためのプログラム。
Priority Applications (5)
| Application Number | Priority Date | Filing Date | Title |
|---|---|---|---|
| US18/994,924 US20260023893A1 (en) | 2022-07-27 | 2023-07-19 | Property prediction device, property prediction method, and program |
| JP2023566968A JP7428303B1 (ja) | 2022-07-27 | 2023-07-19 | 特性予測装置、特性予測方法及びプログラム |
| EP23846327.7A EP4564358A1 (en) | 2022-07-27 | 2023-07-19 | Characteristics prediction device, characteristics prediction method, and program |
| CN202380052605.2A CN119547144A (zh) | 2022-07-27 | 2023-07-19 | 特性预测装置、特性预测方法及程序 |
| JP2024005123A JP2024039063A (ja) | 2022-07-27 | 2024-01-17 | 物質の製造方法 |
Applications Claiming Priority (2)
| Application Number | Priority Date | Filing Date | Title |
|---|---|---|---|
| JP2022-119644 | 2022-07-27 | ||
| JP2022119644 | 2022-07-27 |
Publications (1)
| Publication Number | Publication Date |
|---|---|
| WO2024024596A1 true WO2024024596A1 (ja) | 2024-02-01 |
Family
ID=89706268
Family Applications (1)
| Application Number | Title | Priority Date | Filing Date |
|---|---|---|---|
| PCT/JP2023/026453 Ceased WO2024024596A1 (ja) | 2022-07-27 | 2023-07-19 | 特性予測装置、特性予測方法及びプログラム |
Country Status (5)
| Country | Link |
|---|---|
| US (1) | US20260023893A1 (ja) |
| EP (1) | EP4564358A1 (ja) |
| JP (2) | JP7428303B1 (ja) |
| CN (1) | CN119547144A (ja) |
| WO (1) | WO2024024596A1 (ja) |
Citations (5)
| Publication number | Priority date | Publication date | Assignee | Title |
|---|---|---|---|---|
| WO2020100310A1 (ja) * | 2018-11-16 | 2020-05-22 | 良徳 若林 | 化合物設計支援方法、化合物設計支援装置、及びプログラム |
| US20210097211A1 (en) * | 2018-04-09 | 2021-04-01 | Covestro Llc | Techniques to custom design products |
| JP2022082064A (ja) * | 2020-11-20 | 2022-06-01 | 富士通株式会社 | 混合物物性特定方法、混合物物性特定装置、及び混合物物性特定プログラム |
| JP2022119644A (ja) | 2021-02-04 | 2022-08-17 | 株式会社デンソー | クラッチ装置 |
| JP2022128962A (ja) | 2021-02-24 | 2022-09-05 | 株式会社Screenホールディングス | シリンジ保持具および液体吐出装置 |
-
2023
- 2023-07-19 EP EP23846327.7A patent/EP4564358A1/en active Pending
- 2023-07-19 US US18/994,924 patent/US20260023893A1/en active Pending
- 2023-07-19 CN CN202380052605.2A patent/CN119547144A/zh active Pending
- 2023-07-19 WO PCT/JP2023/026453 patent/WO2024024596A1/ja not_active Ceased
- 2023-07-19 JP JP2023566968A patent/JP7428303B1/ja active Active
-
2024
- 2024-01-17 JP JP2024005123A patent/JP2024039063A/ja active Pending
Patent Citations (5)
| Publication number | Priority date | Publication date | Assignee | Title |
|---|---|---|---|---|
| US20210097211A1 (en) * | 2018-04-09 | 2021-04-01 | Covestro Llc | Techniques to custom design products |
| WO2020100310A1 (ja) * | 2018-11-16 | 2020-05-22 | 良徳 若林 | 化合物設計支援方法、化合物設計支援装置、及びプログラム |
| JP2022082064A (ja) * | 2020-11-20 | 2022-06-01 | 富士通株式会社 | 混合物物性特定方法、混合物物性特定装置、及び混合物物性特定プログラム |
| JP2022119644A (ja) | 2021-02-04 | 2022-08-17 | 株式会社デンソー | クラッチ装置 |
| JP2022128962A (ja) | 2021-02-24 | 2022-09-05 | 株式会社Screenホールディングス | シリンジ保持具および液体吐出装置 |
Also Published As
| Publication number | Publication date |
|---|---|
| JP2024039063A (ja) | 2024-03-21 |
| JPWO2024024596A1 (ja) | 2024-02-01 |
| US20260023893A1 (en) | 2026-01-22 |
| JP7428303B1 (ja) | 2024-02-06 |
| EP4564358A1 (en) | 2025-06-04 |
| CN119547144A (zh) | 2025-02-28 |
Similar Documents
| Publication | Publication Date | Title |
|---|---|---|
| JP7571056B2 (ja) | ディープラーニングのためのビジュアルプログラミング | |
| TWI460648B (zh) | 基於視覺化一資料集之合適度而分級視覺化類型 | |
| US11681505B2 (en) | Systems and methods for facilitating generation and deployment of machine learning software applications | |
| EP2564299B1 (en) | Spin control user interface for selecting options | |
| WO2019109485A1 (zh) | 基于eCharts工具的图表制作方法、装置、设备及介质 | |
| CN114253433A (zh) | 一种动态元素控制方法、电子设备和计算机可读存储介质 | |
| CN118012307A (zh) | 一种可视化数据驾驶舱配置方法 | |
| CN113626032B (zh) | 列表页的配置方法、装置及存储介质 | |
| US20140359475A1 (en) | Dynamic Panel of Inlined Control Settings | |
| US20230205393A1 (en) | Dynamic visualization of an object tracked by an object tracking system in a graphical user interface | |
| JP7428303B1 (ja) | 特性予測装置、特性予測方法及びプログラム | |
| CN112214978A (zh) | 一种数据处理方法及相关设备 | |
| CN117348919A (zh) | 信息配置方法、装置、计算机设备和存储介质 | |
| CN117369792A (zh) | 一种可视化界面实现可配置模板的系统及方法 | |
| US20190146457A1 (en) | System and method for finite element analysis of parts having variable spatial density graded regions produced via 3d printers | |
| CN118916112A (zh) | 页面切换方法、装置、设备、存储介质和程序产品 | |
| CN118838586A (zh) | 可视化编程的操作方法、装置、设备、介质及程序产品 | |
| WO2024038716A1 (ja) | 材料設計装置、材料設計方法及びプログラム | |
| CN110850993B (zh) | 键盘灯效设置方法、计算机装置和计算机可读存储介质 | |
| US12147645B2 (en) | Logical structure-based document navigation | |
| US12566534B2 (en) | Information processing apparatus, program, and input support method | |
| CN110689924A (zh) | 一种基于多种敲除类型的敲除策略筛选方法及系统 | |
| CN110968201B (zh) | 键盘按键固件生成方法、计算机装置和计算机可读存储介质 | |
| CN113039586B (zh) | 基于视口位置的内容动画定制 | |
| CN119414997A (zh) | 业务信息显示方法、装置、设备、可读存储介质 |
Legal Events
| Date | Code | Title | Description |
|---|---|---|---|
| WWE | Wipo information: entry into national phase |
Ref document number: 2023566968 Country of ref document: JP |
|
| 121 | Ep: the epo has been informed by wipo that ep was designated in this application |
Ref document number: 23846327 Country of ref document: EP Kind code of ref document: A1 |
|
| WWE | Wipo information: entry into national phase |
Ref document number: 202380052605.2 Country of ref document: CN |
|
| WWE | Wipo information: entry into national phase |
Ref document number: 18994924 Country of ref document: US |
|
| WWE | Wipo information: entry into national phase |
Ref document number: 2023846327 Country of ref document: EP |
|
| NENP | Non-entry into the national phase |
Ref country code: DE |
|
| WWP | Wipo information: published in national office |
Ref document number: 202380052605.2 Country of ref document: CN |
|
| ENP | Entry into the national phase |
Ref document number: 2023846327 Country of ref document: EP Effective date: 20250227 |
|
| WWP | Wipo information: published in national office |
Ref document number: 2023846327 Country of ref document: EP |
|
| WWP | Wipo information: published in national office |
Ref document number: 18994924 Country of ref document: US |