WO2024019308A1 - 제조 설계를 위한 의사 결정 시스템 - Google Patents
제조 설계를 위한 의사 결정 시스템 Download PDFInfo
- Publication number
- WO2024019308A1 WO2024019308A1 PCT/KR2023/007191 KR2023007191W WO2024019308A1 WO 2024019308 A1 WO2024019308 A1 WO 2024019308A1 KR 2023007191 W KR2023007191 W KR 2023007191W WO 2024019308 A1 WO2024019308 A1 WO 2024019308A1
- Authority
- WO
- WIPO (PCT)
- Prior art keywords
- design
- requirements
- decision
- making system
- processing unit
- Prior art date
- Legal status (The legal status is an assumption and is not a legal conclusion. Google has not performed a legal analysis and makes no representation as to the accuracy of the status listed.)
- Ceased
Links
Images



Classifications
-
- G—PHYSICS
- G06—COMPUTING OR CALCULATING; COUNTING
- G06Q—INFORMATION AND COMMUNICATION TECHNOLOGY [ICT] SPECIALLY ADAPTED FOR ADMINISTRATIVE, COMMERCIAL, FINANCIAL, MANAGERIAL OR SUPERVISORY PURPOSES; SYSTEMS OR METHODS SPECIALLY ADAPTED FOR ADMINISTRATIVE, COMMERCIAL, FINANCIAL, MANAGERIAL OR SUPERVISORY PURPOSES, NOT OTHERWISE PROVIDED FOR
- G06Q10/00—Administration; Management
- G06Q10/06—Resources, workflows, human or project management; Enterprise or organisation planning; Enterprise or organisation modelling
- G06Q10/063—Operations research, analysis or management
- G06Q10/0633—Workflow analysis
-
- G—PHYSICS
- G06—COMPUTING OR CALCULATING; COUNTING
- G06Q—INFORMATION AND COMMUNICATION TECHNOLOGY [ICT] SPECIALLY ADAPTED FOR ADMINISTRATIVE, COMMERCIAL, FINANCIAL, MANAGERIAL OR SUPERVISORY PURPOSES; SYSTEMS OR METHODS SPECIALLY ADAPTED FOR ADMINISTRATIVE, COMMERCIAL, FINANCIAL, MANAGERIAL OR SUPERVISORY PURPOSES, NOT OTHERWISE PROVIDED FOR
- G06Q10/00—Administration; Management
- G06Q10/06—Resources, workflows, human or project management; Enterprise or organisation planning; Enterprise or organisation modelling
-
- G—PHYSICS
- G06—COMPUTING OR CALCULATING; COUNTING
- G06Q—INFORMATION AND COMMUNICATION TECHNOLOGY [ICT] SPECIALLY ADAPTED FOR ADMINISTRATIVE, COMMERCIAL, FINANCIAL, MANAGERIAL OR SUPERVISORY PURPOSES; SYSTEMS OR METHODS SPECIALLY ADAPTED FOR ADMINISTRATIVE, COMMERCIAL, FINANCIAL, MANAGERIAL OR SUPERVISORY PURPOSES, NOT OTHERWISE PROVIDED FOR
- G06Q10/00—Administration; Management
- G06Q10/06—Resources, workflows, human or project management; Enterprise or organisation planning; Enterprise or organisation modelling
- G06Q10/063—Operations research, analysis or management
- G06Q10/0631—Resource planning, allocation, distributing or scheduling for enterprises or organisations
-
- G—PHYSICS
- G06—COMPUTING OR CALCULATING; COUNTING
- G06Q—INFORMATION AND COMMUNICATION TECHNOLOGY [ICT] SPECIALLY ADAPTED FOR ADMINISTRATIVE, COMMERCIAL, FINANCIAL, MANAGERIAL OR SUPERVISORY PURPOSES; SYSTEMS OR METHODS SPECIALLY ADAPTED FOR ADMINISTRATIVE, COMMERCIAL, FINANCIAL, MANAGERIAL OR SUPERVISORY PURPOSES, NOT OTHERWISE PROVIDED FOR
- G06Q50/00—Information and communication technology [ICT] specially adapted for implementation of business processes of specific business sectors, e.g. utilities or tourism
- G06Q50/04—Manufacturing
-
- G—PHYSICS
- G06—COMPUTING OR CALCULATING; COUNTING
- G06Q—INFORMATION AND COMMUNICATION TECHNOLOGY [ICT] SPECIALLY ADAPTED FOR ADMINISTRATIVE, COMMERCIAL, FINANCIAL, MANAGERIAL OR SUPERVISORY PURPOSES; SYSTEMS OR METHODS SPECIALLY ADAPTED FOR ADMINISTRATIVE, COMMERCIAL, FINANCIAL, MANAGERIAL OR SUPERVISORY PURPOSES, NOT OTHERWISE PROVIDED FOR
- G06Q50/00—Information and communication technology [ICT] specially adapted for implementation of business processes of specific business sectors, e.g. utilities or tourism
- G06Q50/10—Services
Definitions
- the present invention relates to a decision-making system for manufacturing design, and in particular, to a decision-making system that provides visual information to enable users to compare various design alternatives in accordance with their requirements in manufacturing design.
- Workflow technology refers to a business process automation technology that transfers documents, information, tasks, etc. from one user (application) to another user for processing according to a series of business procedure rules.
- the data-based service workflow creation procedure is as follows. First, determine the data source and method of collecting that data source. Decide how to process the collected data and decide the analysis method (for example, analysis using machine learning, prediction, knowledge inference, etc.). Decide how to service the analyzed results.
- the workflow creation procedure is completed by configuring the engine(s) required to execute this workflow and defining the linkage method between engines.
- frameworks in manufacturing design typically rely on the judgment of experienced users to quantify value/quality (e.g., TRIZ).
- Other frameworks rely on describing problems in "design equations" that require a high level of technical and mathematical expertise.
- the present invention is intended to solve the above problems and provides a decision-making system that provides visual information so that various design alternatives can be compared in accordance with the requirements of users in manufacturing design.
- a decision-making system includes an input/output unit that receives input requirements and outputs a result according to the input requirements; a storage unit for storing individual design alternatives; a processing unit that combines the requirements and the design alternatives, quantifies dependencies between the requirements and design characteristics, and provides an interaction matrix; and a graph generator that generates a satisfaction graph to visually express whether or not the requirements are met for each configuration of the design alternatives based on the interaction matrix.
- processing unit may provide a preconditioned interaction matrix.
- processing unit may construct the design alternative according to the preconditioned interaction matrix, quantify the range of assumptions, and provide a conditioned interaction matrix.
- the processor may perform external quantification of design characteristics and perform deterministic univariate design prior to providing the conditioned interaction instructions.
- processing unit may perform external quantification of design characteristics and perform statistical univariate design before providing the conditioned interaction instructions.
- the processing unit may, prior to providing the conditioned interaction action, perform external quantification of design characteristics, perform statistical multivariate design, and then convert data from the statistical multivariate design characteristics to statistical univariate design characteristics. You can perform dimensionality reduction.
- the graph generator can generate a satisfaction graph so that users (decision makers) can select a design that best meets customer needs and provide multiple design designs.
- the decision-making system according to the present invention as described above can provide visual information so that various design alternatives can be compared in accordance with the requirements of users in manufacturing design.
- FIG. 1 is a block diagram briefly illustrating the configuration of a decision-making system according to an embodiment of the present invention.
- Figure 2 is a flowchart illustrating a decision-making workflow method according to an embodiment of the present invention.
- Figure 3 is a flowchart illustrating a data processing method to provide design alternatives for the decision-making system of the present invention.
- FIG. 4 is a flowchart for explaining the data processing method of the framework of FIG. 3.
- Figure 5 is a diagram for explaining the interaction matrix of the present invention.
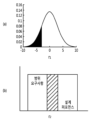
- Figure 6 is a diagram for explaining the satisfaction graph of the present invention.
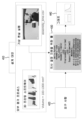
- Figure 7 is a diagram briefly showing an example of use of the decision-making system of the present invention.
- FIG. 8 is a diagram for explaining the GUI of FIG. 7.
- FIG. 1 is a block diagram briefly illustrating the configuration of a decision-making system according to an embodiment of the present invention.
- the decision-making system 100 may include an input/output unit 110, a storage unit 120, a processing unit 130, and a graph generating unit 140.
- the input/output unit 110 may receive input requirements and output results according to the input requirements.
- requirements may refer to a set of criteria that must be achieved in design. These requirements may be the delivery date required by the customer or the size of the part as required by the manufacturing system.
- Storage unit 120 may store individual design alternatives.
- the design alternative may be a collection of individual designs for assembly.
- Each design proposal may include detailed characteristics.
- the detailed characteristic may be the number of parts.
- the processing unit 130 may combine the input requirements and stored design alternatives to quantify the dependency of the requirements and design characteristics and provide an interaction matrix.
- This processing unit 130 may include a decision support framework for extracting the most desired design alternative through integration of Design for Assembly (DfA), Design for Additive Manufacturing (DfAM), and Axiomatic Design (AD) theories.
- the framework may refer to an assembly-level design framework that includes DfAM-related constraints and human aspects based on axiomatic design (AD).
- the processing unit 130 may provide a preconditioned interaction matrix. At this time, the processing unit 130 may configure the design alternative according to the preconditioned interaction matrix, quantify the range of assumptions, and provide the conditioned interaction matrix.
- the graph generator 140 may generate a satisfaction graph based on the interaction matrix to visually express whether or not requirements are met for each configuration of design alternatives.
- the decision-making system 100 can support decision-making by presenting various alternatives according to users' requirements and comparing these alternatives. To this end, the decision-making system 100 checks whether design alternatives are appropriately configured according to requirements through an interaction matrix and provides the final result to the user in the form of a satisfaction graph, so that the user (decision maker) can use the final result as a customer customer. It allows users to choose the design that best meets their needs, but rather than suggesting just one design, it provides multiple designs to support decision-making so that users can choose the design alternative that satisfies them the most.
- Figure 2 is a flowchart illustrating a decision-making workflow method according to an embodiment of the present invention.
- the processing unit 130 configures design characteristics based on a set of pre-stored design alternatives. can do.
- the dependency of requirements and design characteristics is quantified to provide an interaction matrix (S220).
- the graph generator 140 generates a satisfaction graph based on the interaction matrix, and the generated satisfaction graph can be displayed through the input/output unit 110 (S230).
- the graph generator 140 allows the user (decision maker) to select the design that best meets customer needs, but can generate a satisfaction graph to provide multiple designs rather than suggesting just one design. there is.
- Figure 3 is a flowchart illustrating a data processing method to provide design alternatives for the decision-making system of the present invention.
- the decision-making system 100 can perform an automated decision-making workflow for each design alternative according to requirements.
- the processing unit 130 configures a design alternative (S310). At this time, design characteristics are configured. To this end, the processing unit 130 may compare individual design alternatives stored in the storage unit 120 to form design alternatives.
- deterministic univariate design characteristics can be expressed in values as ranges. For example, the cost may be listed as $9 to $10.
- statistical univariate design characteristics may be displayed as data in a table file. For example, it may be displayed as assembly_time.csv.
- statistical multivariate design characteristics may be displayed as data in a table file.
- tolerance.csv which contains the forms x, y, and z.
- L 1 is the sum of distances (1+2+3)
- L 2 is the Euclidean distance
- L ⁇ corresponds to the maximum max (input).
- L 1 considers all small dimensions
- L 2 ignores small numbers
- L 3 only considers the maximum. This affects the extent to which non-maximum errors are taken into account. In some cases, only component assembly errors (L-infinity) are considered, and in other cases, minor errors are important (L-1). This choice becomes more important the higher the dimension, as shown in [Table 2]. For example, if the error consists of multiple points: It can mean.
- standards can be used to (1) scale distance and angle so that they can be combined, and (2) adjust the importance of distance and relative angle when accounting for error. for example, , where w 2 is large, distance is less important and angles are more emphasized.
- the characteristics of requirements and design alternatives can be provided as an interaction matrix through the univariate designed data framework (S340).
- the graph generator 140 generates a satisfaction graph based on the interaction matrix (S350).
- deterministic design characteristics can be expressed as a uniform distribution
- statistical design characteristics can be expressed as an empirical distribution.
- FIG. 4 is a flowchart for explaining the data processing method of the framework of FIG. 3.
- the framework allows requirements to have the same data characteristics and processing processes as design alternatives. However, in the case of requirements, they indicate what the design alternative must achieve. At this time, the interaction matrix serves to quantify the characteristics of design alternatives and the dependency of requirements. Therefore, assumptions are needed to simplify the workflow process, and the interaction matrix quantifies the extent of these assumptions.
- nFR Non-Functional Requirements
- CN can be defined as MN (Manufacturing Process Needs).
- DfA assembly
- DfAM AM productivity
- nFR1 - Assembly time is a critical factor accounting for the majority of manufacturing costs in the supply chain, and implementation of DfA rules can reduce product assembly time by 50-75%, resulting in financial benefits for the industrial sector.
- Displacement error via nFR2-Virtual Reality is a useful metric for evaluating various combinations of component integrated assemblies. Examples of such combinations include: i) assessing design complexity, ii) quantifying assembly errors during manual assembly, iii) providing a controlled environment for assembly line workers, and iv) accelerating the assembly learning process at product launch. You can provide a way for people to interact with the assembly before.
- nFR3-enabled volumes should properly manage the build orientation of parts in an assembly when 3D printing. This means that as the number of integrated components increases, the support volume also increases due to the larger expected footprint. This in turn can make removal of the support parts more difficult.
- nFR1 and nFR2 are directly related to the user aspect of assembly design due to the extensive involvement of users in DfA within manual assembly.
- nFRs are in the same top hierarchy before determining the design scope.
- nFR1 increases, nFR2 decreases, so they can be viewed as dependent and mutually inclusive. However, this may not necessarily be true, so to avoid this, we can verify independence by performing an experiment consisting of four different 2D tables.
- post-processing should be considered to enable removal of supports.
- the corresponding DPs are assembly alternative (DP1), number of edges and connectors (DP2), and assembly direction (DP3).
- DP1 and DP2 can be further decomposed.
- nFR can select the most appropriate distribution for each system range.
- the system range of nFR1 can be interpreted as a gamma distribution.
- the random variable can be said to be the waiting time until the nth assembly is assembled.
- lognormal is chosen as the most appropriate distribution to avoid negative terms.
- kstest indicates goodness of fit through p-value as shown in [Table 3]. All p-values comply with experimental data (i.e. p-value>0.05).
- DR design range
- nFR design range
- LESS level
- MODERATE level
- MORE level
- Each level represents the importance of a particular nFR
- level selection facilitates matching the machine shop's capabilities to manufacture a particular assembly design. For example, if the customer wants to assemble the product quickly, he or she can choose nFR1 as LESS and find a machine shop that can meet the customer's needs in a timely manner.
- all DRs of nFR are related to the performed experiments (i.e., nFR1 and It can be selected based on the characteristics of the hook type (i.e. nFR2) and hook type (i.e. nFR3).
- MODERATE DR is set to the means of gamma and lognormal distribution modes for nFR1 and nFR2, respectively. Accordingly, the MODERATE DR of nFR1 is 0 ⁇ 55.561s and nFR2 is 0 ⁇ 13.33mm.
- the DRs of LESS and MORE are set to account for quantification at lower and larger values, respectively, which can also be adjusted by the user based on experimental results. It should be noted that the weighting coefficients that are characteristic of AD theory are not needed because the tuning DR already shows which nFR is more important.
- nFR1 and nFR2 can be known experimentally, but in the case of nFR3, the system range for each assembly is set between the minimum and maximum values of the identified support volume as shown in [Table 4].
- nFR3 is assumed to be uniformly distributed.
- the DR of nFR3 is selected based on the value of the assembly type.
- Figure 5 is a diagram for explaining the interaction matrix of the present invention.
- preconditioned interaction matrix (a) represents the interaction strength between requirements and design characteristics.
- nFR1 and nFR2 are orthogonal to each other before constructing the interaction matrix. Basically, this can be proven individually through the correlation matrix generated between nFR1 and nFR2 for each edge of the 2D table and each L1-norm of the displacement error. L1-norm was used because L1-norm is more robust against outliers than L2-norm.
- nFR3 can now be added to the design matrix because it is independent of nFR1 and nFR2. Therefore, this highest level design matrix can easily consider all assemblies for AM, as shown in Table 5.
- Assumption (b) is applied by setting to store both the highest elements of rows and columns. Setting large values to 0 results in greater inaccuracy, so the user is informed of this process. Users can correct or accept this error. During this process, users can further decompose requirements and design characteristics. For example, separation costs can be divided into purchase costs and maintenance costs.
- DfA includes part processing and insertion time, so nFR1 can be decomposed into part processing time (nFR11) and insertion time (nFR12).
- the corresponding DP refers to the number of parts (DP11) and number of interfaces (DP12) in [Table 6]. Since nFR11 and DP12 are orthogonal, AD-1 can be proven here.
- nFR2 human fatigue
- nFR22 DfA complexity
- DP21 time to day
- DP22 time to day
- DP22 number of human subjects
- the conditioned interaction matrix (c) has exactly one value in each row and column.
- Figure 6 is a diagram for explaining the satisfaction graph of the present invention.
- the satisfaction graph expresses “how well” a particular design configuration meets the requirements, with the shaded area representing the probability that the requirements will be met.
- the first-price requirement is the area (r 1 ) ahead of A that satisfies the requirement criteria. In other words, the lower the cost than the required standard, the better.
- Scope requirements are created with overlapping elements so that the requirements' criteria can be met simultaneously. Generally, when two distributions are given, the overlapping area is used.
- the shaded area (r 2 ) represents the probability of a specific design configuration meeting the requirements, and the larger the area, the better the result. These values can also be provided as numbers.
- Figure 7 is a diagram briefly showing an example of use of the decision-making system of the present invention.
- the decision-making system may provide a GUI 430, a tool for decision support, according to design alternatives 410 and requirements 420 and display a satisfaction graph 440 for each alternative.
- the requirements characteristic [1.1] field can be added.
- design characteristic [1.1] field may be added.
- the field is deterministic a range is provided, if the field is statistical a data file can be uploaded.
- estimated costs and assembly times may be provided.
- a preconditioned interaction matrix may be provided to the user.
- the user can be warned about which value will be 0 and at the same time, the large value can be displayed with emphasis.
- the input characteristics can be reconstructed. That is, a process of further decomposing the characteristics may be performed.
- manufacturing cost material cost/labor cost.
- the interaction value causing the error must be checked and the user must decide whether to allow it or not.
- a satisfaction graph is displayed to the user.
- FIG. 8 is a diagram for explaining the GUI of FIG. 7.
- the decision-making system may provide a GUI 500 for decision-making support. You must first select the assembly type, which allows you to select each nFR with the desired level of DR.
- GUI 500 calculates the probability density of nFR and the information content of that particular hook type. Additionally, the probability density and information content of all hook types are displayed and calculated by pressing Update(510).
- Every requirements profile and design alternative includes a list of characteristics.
- Processing unit 140 Graph generation unit
Landscapes
- Business, Economics & Management (AREA)
- Engineering & Computer Science (AREA)
- Human Resources & Organizations (AREA)
- Economics (AREA)
- Strategic Management (AREA)
- Tourism & Hospitality (AREA)
- Theoretical Computer Science (AREA)
- General Business, Economics & Management (AREA)
- General Physics & Mathematics (AREA)
- Physics & Mathematics (AREA)
- Marketing (AREA)
- Entrepreneurship & Innovation (AREA)
- Health & Medical Sciences (AREA)
- General Health & Medical Sciences (AREA)
- Primary Health Care (AREA)
- Educational Administration (AREA)
- Quality & Reliability (AREA)
- Operations Research (AREA)
- Game Theory and Decision Science (AREA)
- Development Economics (AREA)
- Manufacturing & Machinery (AREA)
- Management, Administration, Business Operations System, And Electronic Commerce (AREA)
Abstract
본 발명의 의사 결정 시스템은 요구 사항을 입력 받고, 입력된 요구 사항에 따른 결과물을 출력하는 입출력부, 개별적인 설계 대안들을 저장하는 저장부, 상기 요구 사항과 설계 대안을 결합하여 요구 사항과 설계 특성의 종속성을 수량화하여 상호작용 행렬을 제공하는 처리부 및, 상호작용 행렬에 근거하여 설계 대안의 구성마다 요구 사항의 충족여부가 시각적으로 표현되도록 만족도 그래프를 생성하는 그래프 생성부를 포함한다. 이에 따라, 제조 설계에 있어서 사용자들의 요구 사항에 맞춰 다양한 설계 대안을 비교할 수 있도록 시각적 정보를 제공할 수 있다.
Description
본 발명은 제조 설계를 위한 의사 결정 시스템에 관한 것으로서, 특히, 제조 설계에 있어서 사용자들의 요구 사항에 맞춰 다양한 설계 대안을 비교할 수 있도록 시각적 정보를 제공하는 의사 결정 시스템에 관한 것이다.
워크플로우 기술이란, 문서, 정보, 태스크 등을 일련의 업무절차 규칙에 의한 처리를 위해 한 사용자(어플리케이션)에서 다른 사용자로 전달하는 비즈니스 프로세스의 자동화 기술을 의미한다. 특히 데이터기반 서비스 워크플로우 생성절차는 다음과 같다. 먼저, 데이터 소스와 그 데이터 소스 수집방법을 결정한다. 수집된 데이터의 처리방법을 결정하고 분석방법을 결정한다(예를 들어, 기계학습, 예측, 지식추론 등에 의한 분석). 분석된 결과를 서비스하기 위한 방법을 결정한다. 이 해당 워크플로우를 실행하기 위해 필요한 엔진(들)을 구성하고 엔진 간의 연계방법을 정의함으로써 워크플로우 생성 절차가 마무리된다.
최근에, 제조 설계에서도 워크플로우 기술을 적용하여 사용자의 요구 사항에 따른 설계 대안을 제공하는 기술들이 개발되었다. 그러나, 사용자의 요구사항이 제대로 반영되었는지 확인할 방법이 없다는 문제점이 있다.
더구나, 제조 설계의 프레임워크는 일반적으로 경험이 풍부한 사용자의 판단에 의존하여 가치/품질을 수량화한다(예: TRIZ). 다른 프레임워크는 높은 수준의 기술 및 수학적 전문 지식이 필요한 "설계 방정식"으로 문제를 설명하는 데 의존한다. 여기서 실제 데이터에서 확률 분포까지 가치와 성능을 정량화하여 이러한 책임의 요구 사항과 가능한 인적 오류를 줄이기 위한 기술의 개발이 시급한 실정이다.
본 발명은 상기와 같은 문제점을 해결하기 위한 것으로서, 제조 설계에 있어서 사용자들의 요구 사항에 맞춰 다양한 설계 대안을 비교할 수 있도록 시각적 정보를 제공하는 의사 결정 시스템을 제공하는 것이다.
상기와 같은 목적을 달성하기 위하여, 본 발명의 일 실시예에 따른 의사 결정 시스템은 요구 사항을 입력 받고, 입력된 요구 사항에 따른 결과물을 출력하는 입출력부; 개별적인 설계 대안들을 저장하는 저장부; 상기 요구 사항과 상기 설계 대안을 결합하여 상기 요구 사항과 설계 특성의 종속성을 수량화하여 상호작용 행렬을 제공하는 처리부; 및, 상기 상호작용 행렬에 근거하여 상기 설계 대안의 구성마다 상기 요구 사항의 충족여부가 시각적으로 표현되도록 만족도 그래프를 생성하는 그래프 생성부;를 포함할 수 있다.
또한, 상기 처리부는, 전제조건화된 상호작용 행렬을 제공할 수 있다.
또한, 상기 처리부는, 상기 전제조건화된 상호작용 행렬에 따른 상기 설계 대안을 구성하되, 가정의 범위를 수량화하고, 조건화된 상호작용 행렬을 제공할 수 있다.
또한, 상기 처리부는, 상기 조건화된 상호작용 행령을 제공하기 전에, 설계 특성의 외부 정량화를 수행하고, 결정론적 단변량 설계를 수행할 수 있다.
또한, 상기 처리부는, 상기 조건화된 상호작용 행령을 제공하기 전에, 설계 특성의 외부 정량화를 수행하고, 통계론적 단변량 설계를 수행할 수 있다.
또한, 상기 처리부는, 상기 조건화된 상호작용 행령을 제공하기 전에, 설계 특성의 외부 정량화를 수행하고, 통계론적 다변량 설계를 수행한 후 상기 통계론적 다변량 설계 특성에서 통계적 단변량 설계 특성으로 데이터를 변환하는 차원축소를 수행할 수 있다.
또한, 상기 그래프 생성부는, 사용자(의사결정권자)가 고객들 요구에 가장 부합하는 디자인을 선택할 수 있도록 하되, 여러 디자인 설계를 제공하도록 만족도 그래프를 생성할 수 있다.
상기와 같은 본 발명에 따른 의사 결정 시스템은 제조 설계에 있어서 사용자들의 요구 사항에 맞춰 다양한 설계 대안을 비교할 수 있도록 시각적 정보를 제공할 수 있다.
이에, 사용자는 설계 대안이 요구 사항을 얼마나 잘 충족하는지 시각적 정보로 표현되기 때문에 요구 사항에 대한 검증이 편리하게 이루어질 수 있다. 나아가, 요구사항에 따른 설계 대안이 하나 이상 제공되어 더 나은 대안을 선택할 수 있는 이점이 있다.
도 1은 본 발명의 일 실시예에 따른 의사 결정 시스템의 구성을 간략하게 나타내는 블록도이다.
도 2는 본 발명의 일 실시예에 따른 의사 결정 워크플로우 방법을 설명하기 위한 흐름도이다.
도 3은 본 발명의 의사 결정 시스템의 설계 대안을 제공하기 위한 데이터 처리 방법을 설명하기 위한 흐름도이다.
도 4는 도 3의 프레임워크의 데이터 처리 방법을 설명하기 위한 흐름도이다.
도 5는 본 발명의 상호작용 행렬을 설명하기 위한 도면이다.
도 6은 본 발명의 만족도 그래프를 설명하기 위한 도면이다.
도 7은 본 발명의 의사 결정 시스템의 사용 예를 간략하게 나타내는 도면이다.
도 8은 도 7의 GUI를 설명하기 위한 도면이다.
이하에서 본 발명의 기술적 사상을 명확화하기 위하여 첨부된 도면을 참조하여 본 발명의 바람직한 실시예를 상세하게 설명하도록 한다. 본 발명을 설명함에 있어서, 관련된 공지 기능 또는 구성요소에 대한 구체적인 설명이 본 발명의 요지를 불필요하게 흐릴 수 있다고 판단되는 경우 그 상세한 설명을 생략할 것이다. 도면들 중 실질적으로 동일한 기능구성을 갖는 구성요소들에 대하여는 비록 다른 도면상에 표시되더라도 가능한 한 동일한 참조번호들 및 부호들을 부여하였다. 설명의 편의를 위하여 필요한 경우에는 장치와 방법을 함께 서술하도록 한다.
도 1은 본 발명의 일 실시예에 따른 의사 결정 시스템의 구성을 간략하게 나타내는 블록도이다.
도 1을 참조하면, 의사 결정 시스템(100)은 입출력부(110), 저장부(120), 처리부(130) 및 그래프 생성부(140)를 포함할 수 있다.
입출력부(110)는 요구 사항을 입력 받고, 입력된 요구 사항에 따른 결과물을 출력할 수 있다. 여기서, 요구 사항은 설계에 있어서 달성되어야 하는 기준들의 집합을 의미할 수 있다. 이러한 요구 사항은 고객으로부터 요구되는 납품 기일 또는 제조 시스템의 요구 사항인 부품의 크기일 수 있다.
저장부(120)는 개별적인 설계 대안들을 저장할 수 있다. 여기서, 설계 대안은 조립을 위한 개별적인 설계안들의 집합일 수 있다. 각 설계안에는 세부적인 특성이 포함될 수 있다. 여기서, 세부적인 특성은 부품 수일 수 있다. 이러한 설계 대안들은 서로 비교되어 저장될 수 있다.
처리부(130)는 입력된 요구 사항과 저장된 설계 대안을 결합하여 요구 사항과 설계 특성의 종속성을 수량화하여 상호작용 행렬을 제공할 수 있다. 이러한 처리부(130)는 DfA(Design for Assembly), DfAM(Design for Additive Manufacturing) 및 AD(Axiomatic Design) 이론의 통합을 통해 가장 원하는 설계 대안을 추출하기 위한 의사 결정 지원 프레임워크를 포함할 수 있다. 여기서, 프레임워크는 공리적 설계(AD)를 기반으로 하는 DfAM 관련 제약 및 인간 측면을 포함하는 어셈블리 수준 설계 프레임워크를 의미할 수 있다.
또한, 처리부(130)는 전제조건화된 상호작용 행렬을 제공할 수 있다. 이때, 처리부(130)는 전제조건화된 상호작용 행렬에 따른 상기 설계 대안을 구성하되, 가정의 범위를 수량화하고, 조건화된 상호작용 행렬을 제공할 수 있다.
그래프 생성부(140)는 상호작용 행렬에 근거하여 설계 대안의 구성마다 요구 사항의 충족여부가 시각적으로 표현되도록 만족도 그래프를 생성할 수 있다.
결국, 의사 결정 시스템(100)은 사용자들의 요구 사항에 맞춰서 다양한 대안을 제시하고 이들 대안들을 비교하여 의사결정을 지원할 수 있다. 이를 위해, 의사 결정 시스템(100)은 상호작용 행렬을 통해 요구사항에 따라 설계 대안이 적합하게 구성되었는지 확인하고 최종 결과는 만족도 그래프 형태로 사용자에게 제공함으로써 최종 결과물을 가지고 사용자(의사결정권자)가 고객들 요구에 가장 부합하는 디자인을 선택할 수 있도록 하되, 어느 하나의 디자인 설계를 제안하는 것이 아니고 여러 디자인 설계를 제공하여 사용자가 가장 만족하는 설계 대안을 선택할 수 있도록 의사결정을 지원할 수 있다.
도 2는 본 발명의 일 실시예에 따른 의사 결정 워크플로우 방법을 설명하기 위한 흐름도이다.
도 1 및 도 2을 참조하면, 의사결정 시스템(100)은 입출력부(110)를 통해 요구 사항이 입력되면(S210), 처리부(130)는 기저장된 설계 대안의 집합에 근거하여 설계 특성을 구성할 수 있다. 입력된 요구 사항과 저장된 설계 대안을 결합하여 요구 사항과 설계 특성의 종속성을 수량화하여 상호작용 행렬을 제공한다(S220). 이후, 그래프 생성부(140)는 상호작용 행렬에 근거하여 만족도 그래프를 생성하고, 생성된 만족도 그래프는 입출력부(110)를 통해 표시될 수 있다(S230).
이때, 그래프 생성부(140)는 사용자(의사결정권자)가 고객들 요구에 가장 부합하는 디자인을 선택할 수 있도록 하되, 어느 하나의 디자인 설계를 제안하는 것이 아니고 여러 디자인 설계를 제공하도록 만족도 그래프를 생성할 수 있다.
도 3은 본 발명의 의사 결정 시스템의 설계 대안을 제공하기 위한 데이터 처리 방법을 설명하기 위한 흐름도이다.
도 1 및 도 3을 참조하면, 의사결정 시스템(100)은 요구 사항에 따른 설계 대안별 자동화 의사결정 워크 플로우를 수행할 수 있다.
입출력부(110)를 통해 요구 사항이 입력되면, 처리부(130)는 설계 대안을 구성한다(S310). 이때, 설계 특성을 구성한다. 이를 위해 처리부(130)는 저장부(120)에 저장된 개별적인 설계 대안들을 서로 비교하여 설계 대안을 구성할 수 있다.
이후, 설계 특성의 외부 정량화를 수행한다(S320). 즉, 조립 시간을 측정하기 위한 실험 및 비용을 결정하기 위한 평가를 수행할 수 있다.
그리고, 결정론적 단변량 설계 특성(Deterministic Uni-variate Characteristic)을 구성한다(S331). 여기서, 결정론적 단변량 설계 특성은 범위로 값이 표시될 수 있다. 예를 들어, 비용은 $9~10로 표시될 수 있다.
통계적 단변량 설계 특성(Statistical Uni-variate Characteristic)을 구성한다(S333). 여기서, 통계적 단변량 설계 특성은 테이블 파일로 데이터가 표시될 수 있다. 예를 들어, assembly_time.csv로 표시될 수 있다.
통계적 다변량 설계 특성(Statistical variate Characteristic)을 구성한다(S335). 여기서, 통계적 다변량 설계 특성은 테이블 파일로 데이터가 표시될 수 있다. 예를 들어, x, y, z형태가 포함된 tolerance.csv로 표시될 수 있다.
통계적 다변량 설계 특성에서 통계적 단변량 설계 특성으로 데이터를 변환하는 차원 축소를 수행한다(S337). 즉, 프레임워크는 데이터를 단변량 형식으로 처리한다. 의사 결정에서 |X|(Norms)은 각 변수의 가중치에 영향을 미치기 때문에 중요하다. 예를 들어, (1,2,3)과 같이 3D 거리  로 주어진 어셈블리 오류의 예를 고려한다면, 이것을 하나의 숫자로 줄여야 한다. 이때, 선택한 표준은 작은 값이 최종 값에 기여하는 정도를 결정한다.
거기에는 3개의 인기 있는 표준 함수 L1, L2 및 L∞가 있다. 여기서, L1은 거리의 합(1+2+3), L2는 유클리드 거리  , L∞는 최대 max(입력)에 해당한다.
| Input | L1 | L2 | L∞ |
| (1,2,3) | 7 | 3.74 | 3 |
[표 1]은 결과 |X|(Norms)을 나타낸다.
직관은 L1은 모든 작은 차원을 고려하고 L2는 작은 숫자를 무시하며 L3은 최대값만 고려한다. 이는 비최대 오류를 고려하는 정도에 영향을 준다. 어떤 경우에는 부품의 조립 오류(L-infinity)만 고려하고 다른 경우에는 사소한 오류가 중요하다(L-1).이러한 선택은 [표 2]와 같이 차원이 높을수록 더 중요해진다. 예를 들어, 오차가 여러 점으로 구성된 경우  를 의미할 수 있다.
| Input | L1
(all errors are considered) |
L2
(small errors are almost ignored) |
L∞
(only max is considered) |
| (1,1,1,1,1,1,1,1,3) | 11 | 4.1 | 3 |
| (3,3,3) | 9 | 5.196 | 3 |
다른 예로써, |X|(Norms)은 직접 추가할 수 없는 차원을 결합할 수 있다. 측정에 각도 어셈블리 오류를 추가하면 3개의 거리와 3개의 각도가 있다.

이 경우 표준을 사용하여 (1) 거리와 각도를 스케일링하여 결합할 수 있도록 하고 (2) 오차를 설명할 때 거리와 상대적인 각도의 중요성을 조정할 수 있다. 예를 들어,  , 여기서 w2가 크면 거리가 덜 중요하고 각도가 더 강조된다.
요구 사항과 설계 대안의 특성들은 단변량 설계된 데이터들이 프레임워크를 통해 상호작용 행렬로 제공될 수 있다(S340).
그리고, 그래프 생성부(140)는 상호작용 행렬에 근거하여 만족도 그래프를 생성한다(S350). 이때, 결정론적 설계 특성은 균등 분포로 나타낼 수 있고, 통계적 설계 특성은 경험적 분포로 나타낼 수 있다.
도 4는 도 3의 프레임워크의 데이터 처리 방법을 설명하기 위한 흐름도이다.
프레임워크를 통해 요구사항은 설계 대안과 동일한 데이터 특성과 처리 과정을 가질 수 있다. 다만, 요구 사항의 경우 설계 대안이 달성해야 하는 사항을 나타낸다. 이때, 상호작용 행렬은 설계 대안의 특성과 요구 사항의 종속성을 수량화하는 역할을 수행한다. 이에, 워크플로우 프로세스를 단순화하기 위해 가정이 필요하며, 상호작용 행렬은 이러한 가정의 범위를 수량화한다.
이를 위해 공리적 설계(AD) 기반의 DfAM 결정 프레임워크를 상세하게 설명한다.
우선, 실험적인 설계 대안 요소와 데이터 기반 분포를 제공할 수 있다. 이 전에 도메인별 정의를 명확하게 한다.
설계 요구사항으로, 그 중 하나는 FR을 주요 요소로 간주하는 최종 사용자이고 다른 하나는 소위 nFR(Non-Functional Requirements)을 통해 정보를 전달하는 조립 또는 제조 관점이다. nFR은 명시적으로 식별되어야 한다. 이에, FR 대신 nFR을 추출하는 것으로 구성되지만 수학적으로 FR과 nFR은 두 공리에서 동일한 역할을 하나, 각각의 영역에서 개념적으로는 다르다. 한편, 설계 과정에서 모든 주요 CN을 특성화하면 문제의 중요한 구성 요소가 간과되지 않도록 보장할 수 있다.
본 실시예에서는 CN을 MN(Manufacturing Process Needs)으로 정의할 수 있다.
제조 요구 사항(S343)
조립(DfA)과 AM 생산성(DfAM)을 별도로 개선하기 위해 MN에서 추출한 nFR이 있다. 어셈블리 복잡성을 평가하기 위해 부품 및 패스너의 수, 취급 및 삽입 문제가 DfA 측면에서 고려된다. 또한 수동 및 자동 조립 유형이 모두 있음을 인정해야 한다. 본 발명은 소량 제조에서 어셈블리 생산성을 개선하고 어셈블리 설계의 인간적 측면을 입증하기 위해 수동 어셈블리에 중점을 둔다.
따라서 DfA 생산성을 향상시키기 위해 Assembly time-nFR1과 Displacement error-nFR2를 기반으로 간단한 2D 테이블의 설계 대안을 제시하고 평가한다. AM 생산성을 개선하기 위해 DfAM 제약 조건 하에서 어셈블리 설계의 지원 볼륨 nFR3도 고려될 수 있다.
비기능 요구 사항(nFR)(S345)
nFR1-조립 시간은 공급망에서 제조 비용의 대부분을 차지하는 중요한 요소이며, DfA 규칙의 구현을 통해 제품 조립 시간을 50-75%로 단축하여 산업 부문에 재정적 이익을 줄 수 있다.
nFR2-가상 현실(VR)을 통한 변위 오류는 부품 통합 어셈블리의 다양한 조합을 평가하는 데 유용한 매트릭이다. 이러한 조합의 예를 들면, i) 설계 복잡성 평가, ii) 수동 조립 중 조립 오류를 정량화하기 위해, iii) 조립 라인 작업자에게 통제된 환경을 제공하기 위해, iv) 조립 학습 과정을 가속화하기 위해 제품 출시 전에 조립품과 사람들의 상호 작용 방법을 제공할 수 있다.
nFR3-지원 볼륨은 3D 프린팅 시 어셈블리에 있는 부품의 빌드 방향을 적절하게 관리해야 한다. 즉, 통합 부품 수가 증가함에 따라 더 큰 예상 면적으로 인해 지원 볼륨도 증가한다. 차례로 지지 부품의 제거를 더욱 어렵게 만들 수 있다.
다시 말해서, nFR1 및 nFR2는 수동 조립 내의 DfA에서 사용자가 광범위하게 관여하기 때문에 어셈블리 설계의 사용자 측면과 직접 관련된다.
그럼에도 불구하고 nFR이 설계 범위를 결정하기 전에 동일한 최상위 계층 구조에 있음을 나타내도록 강조해야 한다. 예를 들어, nFR1이 증가하면 nFR2가 감소하므로 종속적이며 상호 포괄적인 것으로 볼 수 있다. 그러나 반드시 사실이 아닐 수도 있으므로, 이를 피하기 위해 4개의 서로 다른 2D 테이블로 구성된 실험을 수행하여 독립성을 검증할 수 있다.
다음은, 방법론 내에서 DfAM 관련 제약 조건을 설명한다.
DfAM 관련 제약 및 가정
기능 영역(FR)에서는 nFR과 함께 허용 가능한 디자인을 제한하는 제약 조건이 있다. 그러나 제약 조건은 nFR과 달리 독립적이지 않을 것으로 예상되므로 상호 독립성을 입증할 필요가 없다.
이 과정에서 설계 대안 중 인간적인 측면을 다루는 것이기 때문에 주요 제약은 어셈블리의 조립 시간과 조립 비용을 일정하게 유지하는 것이다. 통합된 부품의 수가 증가함에 따라 지지 체적도 증가하여 조립 비용이 많이 들기 때문에 이 가정은 유효하다. 반면에 통합되지 않은 부품이 많은 경우, 조립 시간과 관련된 비용이 그에 따라 많이 발생한다. 따라서, 언급한 두 가지 시나리오를 기반으로 구축 시간 및 비용의 결과는 동일하다고 가정한다.
이러한 제약 조건은 어셈블리 부품의 조립 방향에 직접적으로 영향을 받으므로 조립 방향은 부품이 지지 구조의 최소 부피를 갖는 방식으로 제어될 수 있다.
또한, 지지대를 제거할 수 있도록 후처리를 고려해야 한다.
nFR2에 따라 특정 설계의 어셈블러 협업을 설명하기 위해 너트가 있는 볼트와 같은 삽입 부품은 변위 오류로 이어지지 않기 때문에 고려하지 않는다고 가정한다.
한편, 용접으로 접합하는 부품은 잔류응력에 의해 휘어질 수 있기 때문에, 조립시 뭉쳐지지 않은 부품은 지그나 홀더를 사용해도 휘어지기 쉽다. 이러한 오류도 사람이 조립하는 과정에서 발생하는 것으로 간주된다.
지그재그와 PV에 의한 FR-DP 분해(S347, S349)
다음은 연결된 DP를 식별한다. 여기서 지그재그 방법을 사용하여 FR과 DP 사이를 매핑할 수 있다.
해당 DP는 어셈블리 대안(DP1), 모서리 및 커넥터 수(DP2), 조립 방향(DP3)이다. 여기서, DP1과 DP2는 더 분해될 수 있다.
PV의 경우 공정 매개변수가 산업용 L-PBF에서 대부분 고정되어 있기 때문에 모든 DP가 이미 최적화된 공정 매개변수를 통해 달성될 수 있다고 말하는 것은 유효한 가정이다. 따라서 DP-PV 관계에서 구한 설계행렬도 AD-1을 따른다고 가정할 수 있다.
nFR은 각 시스템 범위에 대해 가장 적합한 분포를 선택할 수 있다. 예를 들어, nFR1의 시스템 범위는 감마 분포로 해석될 수 있다. 감마 분포의 관점에서 확률 변수는 n번째 어셈블리가 조립될 때까지의 대기 시간이라고 말할 수 있다. nFR2의 경우, 음의 항을 피하기 위해 로그 정규가 가장 적합한 분포로 선택된다.
한편, Kolmogorov-Smirnov 검정(kstest)을 통해 감마 및 대수 정규 분포의 적합도를 확인할 수 있다. kstest는 [표 3]과 같이 p-값을 통해 적합도를 나타낸다. 모든 p-값은 실험 데이터를 준수한다(즉, p-값>0.05).
| nFR_distribution | Unconsol | Half-consol |
| nFR1_gamma | 0.5690 | 0.2200 |
| nFR2_lognorm | 0.9996 | 0.9840 |
설계자는 지정된 nFR을 충족하기 위해 설계 범위(DR)를 선택할 수 있다. DR은 LESS, MODERATE 및 MORE와 같은 3가지 레벨로 선택할 수 있다. 각 레벨은 특정 nFR의 중요성을 나타내며 레벨 선택은 특정 어셈블리 설계를 제조하기 위한 기계 공장의 기능을 일치시키는 것을 용이하게 한다. 예를 들어 고객이 제품을 빨리 조립하기를 원하면 nFR1을 LESS로 선택하고 적시에 고객의 요구를 충족시킬 수 있는 기계 공장을 찾을 수 있다.여기서, nFR의 모든 DR은 수행된 실험(즉, nFR1 및 nFR2)과 후크 유형(즉, nFR3)의 특성을 기반으로 선택될 수 있다.
실시예에서, nFR1 및 nFR2 각각에 대해 MODERATE DR을 감마 및 대수정규 분포 모드의 수단으로 설정한다. 이에, nFR1의 MODERATE DR은 0~55.561s이고 nFR2는 0~13.33mm이다. LESS 및 MORE의 DR은 각각 더 낮은 값과 더 큰 값에서 정량화를 설명하도록 설정되며, 이는 실험 결과를 기반으로 사용자가 조정할 수도 있다. AD 이론의 특징인 가중 계수는 튜닝 DR이 이미 어느 nFR이 더 중요한지를 보여주기 때문에 필요하지 않다는 점을 유의해야 한다.
한편, nFR1과 nFR2의 시스템 범위는 실험적으로 알 수 있지만, nFR3의 경우 각 어셈블리에 대한 시스템 범위는 [표 4]과 같이 식별된 지지체적의 최소값과 최대값 사이로 설정된다.
| nFR3_uniform | Unconsol | Half-consol | Consol |
|
System Ranges
(mm3) |
11114.568~16755.150 | 19932.250~48762.273 | 31741.781~43171.249 |
연속 균일 분포는 설계 범위에 걸쳐 동일한 결과 확률을 나타내므로 nFR3이 균일 분포한다고 가정한다. nFR3의 DR은 어셈블리 유형의 값에 따라 선택된다.
도 5는 본 발명의 상호작용 행렬을 설명하기 위한 도면이다.
도 5를 참조하면, 첫째, 설계 특성, 둘째, 요구 사항, 셋째, 전제 조건화된 상호작용 행렬(ⓐ)은 요구 사항과 설계 특성 간의 상호작용 강도를 나타낸다. 다르게는, 전제 조건화된 상호작용 행렬은 요구 사항과 설계 특성 간의 종속성을 나타낸다. 즉, 하나를 변경하면 다른 하나가 이어서 크게 변경된다. 예를 들어, (1, a) = 1 강한 종속성을 나타내고, (1, b) = 0.1로 약한 의존성을 나타낸다.
여기서, 상호작용 행렬을 구성하기 전에 nFR1과 nFR2가 서로 직교함을 증명할 수 있다. 기본적으로 이것은 nFR1과 nFR2 사이에 생성된 상관 행렬을 통해 2D 테이블의 각 가장자리와 변위 오류의 각 L1-norm을 통해 개별적으로 입증될 수 있다. L1-norm은 L2-norm보다 outlier에 대해 더 강력하기 때문에 L1-norm이 사용되었다.
(식 1)

nFR1과 nFR2의 독립성을 나타낼 수 있는  임을 알 수 있다.
DfA 및 DfAM 생산성을 구분했기 때문에 이제 nFR3은 nFR1 및 nFR2와 독립적이기 때문에 디자인 매트릭스에 추가할 수 있다. 따라서 최고 수준의 이 설계 매트릭스는 [표 5]와 같이 AM에 대한 모든 어셈블리를 쉽게 고려할 수 있다.

가정(ⓑ)은 행과 열의 가장 높은 요소를 모두 저장하도록 설정하여 적용된다. 큰 값을 0으로 설정하면 부정확성이 더 커지기 때문에 사용자에게 이 프로세스가 공지된다. 사용자는 이 오류를 수정하거나 수락할 수 있다. 이 과정에서 사용자는 요구 사항 및 설계 특성을 추가로 분해할 수 있다. 예를 들어, 분리비는 구매비와 유지비로 나뉠 수 있다.
실시예로, DfA에는 부품 처리 및 삽입 시간이 포함되므로 nFR1은 부품 처리 시간(nFR11)과 삽입 시간(nFR12)으로 분해할 수 있다. 해당 DP는 [표 6]의 부품 수(DP11)와 인터페이스 수(DP12)를 의미한다. nFR11과 DP12가 직교하므로 여기에서 AD-1이 증명될 수 있다.

nFR2의 경우 인간의 피로도(nFR21)와 DfA 복잡도(nFR22)와 주간(DP21), 인간 피험자 수(DP22)와 같은 각각의 DP로 더 분해가 가능하다. 작업의 수는 각각 사람 수 및 낮과 관련이 없으며 AD-1도 준수하는 디자인 매트릭스가 결합되지 않는다.
즉, 상호작용 행렬을 구성하기 위한 체계적인 접근은 분리 설계(식 2)를 초래할 수 있다.
(식 2)

그리고, 조건화된 상호작용 행렬(ⓒ)은 각 행과 열에 정확히 하나의 값을 갖는다.
도 6은 본 발명의 만족도 그래프를 설명하기 위한 도면이다.
도 6을 참조하면, 만족도 그래프는 특정 설계 구성이 요구 사항을 “얼마나 잘” 충족하는지 표현하며, 음영 처리된 영역은 요구 사항이 충족될 확률을 나타낸다.
(a)는 통계적 설계 매개변수에 대한 만족도 그래프를 나타내고, (b)는 범위 매개변수, 즉 결정론적 설계 특성에 대한 만족도 그래프를 나타낸다.
일가 요구 사항은 요구 사항의 기준을 충족하는 갑보다 앞의 영역(r1)이 된다. 즉, 필요한 기준보다 비용이 낮을수록 좋음을 의미한다.
범위 요구 사항은 요구 사항의 기준들을 동시에 충족할 수 있도록 겹치는 영영이 생성된다. 일반적으로 두 개의 분포가 주어질 때 겹치는 영역이 사용된다.
음영 처리된 영역(r2)은 요구 사항을 충족하는 특정 설계 구성의 확률을 의미하며, 영역이 넓을수록 좋은 결과를 의미한다. 이러한 값은 수치로도 제공될 수 있다.
도 7은 본 발명의 의사 결정 시스템의 사용 예를 간략하게 나타내는 도면이다.
도 7을 참조하면, 의사 결정 시스템은 설계 대안(410)과 요구 사항(420)에 따라 의사 결정 지원을 위한 툴인 GUI(430)를 제공하여 대안별 만족도 그래프(440)을 표시할 수 있다.
이를 위해, 사용자로부터 여러 요구 사항 프로필([0.1])이 입력되면, 요구 사항 특성 [1.1] 필드가 추가될 수 있다.
예를 들어 가격 및 납품 기일, 그리고, 세부 값을 입력 받을 수 있다.
고객 1은 가격 =$8, 납품 기일 = 4주로 입력 받고,
고객 2는 가격 = $12, 납품 기일 = 2주로 입력 받을 수 있다.
이때, 프로필이 여러 개 있지만 한 번에 하나만 활성화가 가능하다.
예를 들어, 고객 1 또는 고객 2 중 하나만 선택되어 활성화가 가능하다.
사용자로부터 여러 설계 대안([0.2])이 입력되면, 설계 특성 [1.1] 필드가 추가될 수 있다.
필드가 결정적이면 범위가 제공되며, 필드가 통계적인 경우에는 데이터 파일이 업로드될 수 있다.
예를 들어, 예상 비용 및 조립 시간이 제공될 수 있다.
설계 대안 1은 부품 수 = 15 내지 28, 조립 시간 = assembly_time1.csv
설계 대안 2는 부품 수 = 5 내지 7, 조립 시간 = assembly_time2.csv
사용자에게 전제조건화된 상호작용 행렬이 제공될 수 있다.
이때, 사용자에게 어떤 값이 0이 될 것인지에 대해 경고를 받은 동시에 큰 값이 강조되어 표시될 수 있다.
이에 따라 사용자는 가정을 수용하고 예상되는 결과 오류를 확인할 수 있다.
이때, 입력 특성을 재구성 할 수 있다. 즉, 특성을 추가로 분해하는 과정이 수행될 수 있다. 예를 들어, 제조원가 = 재료비/인건비 일 수 있다.
다만, 이 프로세스에 대한 설명은 이 문서의 범위에서 벗어날 수 있다.
오류를 초래하는 상호작용 값을 확인하고 사용자는 이를 허용할지 여부를 결정해야 한다.
이후, 사용자에게 만족도 그래프를 표시한다.
다양한 설계 대안과 요구 사항 프로필을 전환하여 전반적인 통찰력을 추출할 수 있다.
도 8은 도 7의 GUI를 설명하기 위한 도면이다.
도 7 및 도 8을 참조하면, 의사 결정 시스템은 의사 결정 지원을 위한 GUI(500)를 제공할 수 있다. 먼저 어셈블리 유형을 선택해야 원하는 수준의 DR이 있는 각 nFR을 선택할 수 있다.
GUI(500)는 nFR의 확률 밀도와 해당 특정 후크 유형의 정보 콘텐츠를 계산한다. 또한 모든 후크 유형의 확률 밀도 및 정보 콘텐츠는 Update(510)를 누르면 표시되고 계산된다.
비교를 위해 다음은 DR{nFR1}=LESS, DR{nFR2}=MODERATE 및 DR{nFR3}=MORE일 때 각 hook 유형의 정보 목차 내용과 확률 밀도 플롯의 요약을 보여준다. 이때, 여러 요구 사항 프로필과 설계 대안이 있다는 점에 유의하여야 한다. 모든 요구 사항 프로필 및 설계 대안에는 특성 목록이 포함되어 있다.
이러한 특성은 여러 형태 중 하나로 표현될 수 있다. 예를 들어 범위나 분포로 표현될 수 있다. 특히, 다변수 특성의 경우 정규화 전략을 지정해야 한다.
지금까지 본 발명에 대하여 도면에 도시된 바람직한 실시예들을 중심으로 상세히 살펴보았다. 이러한 실시예들은 이 발명을 한정하려는 것이 아니라 예시적인 것에 불과하며, 한정적인 관점이 아니라 설명적인 관점에서 고려되어야 한다. 본 발명의 진정한 기술적 보호범위는 전술한 설명이 아니라 첨부된 특허청구범위의 기술적 사상에 의해서 정해져야 할 것이다. 비록 본 명세서에 특정한 용어들이 사용되었으나 이는 단지 본 발명의 개념을 설명하기 위한 목적에서 사용된 것이지 의미한정이나 특허청구범위에 기재된 본 발명의 범위를 제한하기 위하여 사용된 것은 아니다. 본 발명의 각 단계는 반드시 기재된 순서대로 수행되어야 할 필요는 없고, 병렬적, 선택적 또는 개별적으로 수행될 수 있다. 본 발명이 속하는 기술 분야에서 통상의 지식을 가진 자는 특허청구범위에서 청구하는 본 발명의 본질적인 기술사상에서 벗어나지 않는 범위에서 다양한 변형 형태 및 균등한 타 실시예가 가능하다는 점을 이해할 것이다. 균등물은 현재 공지된 균등물뿐만 아니라 장래에 개발될 균등물 즉 구조와 무관하게 동일한 기능을 수행하도록 발명된 모든 구성요소를 포함하는 것으로 이해되어야 한다.
(부호의 설명)
100: 의사 결정 시스템
110: 입출력부 120: 저장부
130: 처리부 140: 그래프 생성부
Claims (7)
- 요구 사항을 입력 받고, 입력된 요구 사항에 따른 결과물을 출력하는 입출력부;개별적인 설계 대안들을 저장하는 저장부;상기 요구 사항과 상기 설계 대안을 결합하여 상기 요구 사항과 설계 특성의 종속성을 수량화하여 상호작용 행렬을 제공하는 처리부; 및,상기 상호작용 행렬에 근거하여 상기 설계 대안의 구성마다 상기 요구 사항의 충족여부가 시각적으로 표현되도록 만족도 그래프를 생성하는 그래프 생성부;를 포함하는 의사 결정 시스템.
- 제1항에 있어서,상기 처리부는,전제조건화된 상호작용 행렬을 제공하는 것을 특징으로 하는 의사 결정 시스템.
- 제2항에 있어서,상기 처리부는,상기 전제조건화된 상호작용 행렬에 따른 상기 설계 대안을 구성하되, 가정의 범위를 수량화하고, 조건화된 상호작용 행렬을 제공하는 것을 특징으로 하는 의사 결정 시스템.
- 제3항에 있어서,상기 처리부는,상기 조건화된 상호작용 행령을 제공하기 전에, 설계 특성의 외부 정량화를 수행하고, 결정론적 단변량 설계를 수행하는 것을 특징으로 하는 의사 결정 시스템.
- 제3항에 있어서,상기 처리부는,상기 조건화된 상호작용 행령을 제공하기 전에, 설계 특성의 외부 정량화를 수행하고, 통계론적 단변량 설계를 수행하는 것을 특징으로 하는 의사 결정 시스템.
- 제3항에 있어서,상기 처리부는,상기 조건화된 상호작용 행령을 제공하기 전에, 설계 특성의 외부 정량화를 수행하고, 통계론적 다변량 설계를 수행한 후 상기 통계론적 다변량 설계 특성에서 통계적 단변량 설계 특성으로 데이터를 변환하는 차원축소를 수행하는 것을 특징으로 하는 의사 결정 시스템.
- 제1항에 있어서,상기 그래프 생성부는,사용자(의사결정권자)가 고객들 요구에 가장 부합하는 디자인을 선택할 수 있도록 하되, 여러 디자인 설계를 제공하도록 만족도 그래프를 생성하는 것을 특징으로 하는 의사 결정 시스템.
Applications Claiming Priority (2)
| Application Number | Priority Date | Filing Date | Title |
|---|---|---|---|
| KR1020220089360A KR20240012003A (ko) | 2022-07-20 | 2022-07-20 | 제조 설계를 위한 의사 결정 시스템 |
| KR10-2022-0089360 | 2022-07-20 |
Publications (1)
| Publication Number | Publication Date |
|---|---|
| WO2024019308A1 true WO2024019308A1 (ko) | 2024-01-25 |
Family
ID=89618100
Family Applications (1)
| Application Number | Title | Priority Date | Filing Date |
|---|---|---|---|
| PCT/KR2023/007191 Ceased WO2024019308A1 (ko) | 2022-07-20 | 2023-05-25 | 제조 설계를 위한 의사 결정 시스템 |
Country Status (2)
| Country | Link |
|---|---|
| KR (1) | KR20240012003A (ko) |
| WO (1) | WO2024019308A1 (ko) |
Citations (4)
| Publication number | Priority date | Publication date | Assignee | Title |
|---|---|---|---|---|
| KR20030049923A (ko) * | 2001-12-17 | 2003-06-25 | 엘지전자 주식회사 | 소비자 요구사항을 반영한 제품 제조방법 |
| JP2010506253A (ja) * | 2006-09-29 | 2010-02-25 | フィッシャー−ローズマウント システムズ, インコーポレイテッド | 多変量統計解析を用いたプロセスの監視および診断 |
| JP5651895B2 (ja) * | 2010-04-09 | 2015-01-14 | 日本電気株式会社 | 公理的サービス設計方法、装置、プログラム |
| KR102151432B1 (ko) * | 2020-02-10 | 2020-09-03 | 국방과학연구소 | 의사결정 지원 시뮬레이션 장치 및 방법 |
-
2022
- 2022-07-20 KR KR1020220089360A patent/KR20240012003A/ko active Pending
-
2023
- 2023-05-25 WO PCT/KR2023/007191 patent/WO2024019308A1/ko not_active Ceased
Patent Citations (4)
| Publication number | Priority date | Publication date | Assignee | Title |
|---|---|---|---|---|
| KR20030049923A (ko) * | 2001-12-17 | 2003-06-25 | 엘지전자 주식회사 | 소비자 요구사항을 반영한 제품 제조방법 |
| JP2010506253A (ja) * | 2006-09-29 | 2010-02-25 | フィッシャー−ローズマウント システムズ, インコーポレイテッド | 多変量統計解析を用いたプロセスの監視および診断 |
| JP5651895B2 (ja) * | 2010-04-09 | 2015-01-14 | 日本電気株式会社 | 公理的サービス設計方法、装置、プログラム |
| KR102151432B1 (ko) * | 2020-02-10 | 2020-09-03 | 국방과학연구소 | 의사결정 지원 시뮬레이션 장치 및 방법 |
Non-Patent Citations (1)
| Title |
|---|
| RANSIKARBUM KASIN, PITAKASO RAPEEPAN, KIM NAMHUN, MA JUNGMOK: "Multicriteria decision analysis framework for part orientation analysis in additive manufacturing", JOURNAL OF COMPUTATIONAL DESIGN AND ENGINEERING, SOCIETY OF CAD/CAM ENGINEERS, vol. 8, no. 4, 8 July 2021 (2021-07-08), pages 1141 - 1157, XP093130031, ISSN: 2288-5048, DOI: 10.1093/jcde/qwab037 * |
Also Published As
| Publication number | Publication date |
|---|---|
| KR20240012003A (ko) | 2024-01-29 |
Similar Documents
| Publication | Publication Date | Title |
|---|---|---|
| US5828969A (en) | Process for use with aircraft repairs | |
| US10068317B2 (en) | Metadata-driven method and apparatus for constraining solution space in image processing techniques | |
| EP0818727A2 (en) | Design part reusing method in configuration tool | |
| CN110972519B (zh) | 信息提供系统和信息提供方法 | |
| CN113408862A (zh) | 运维排班方法、设备以及存储介质 | |
| Krishnan et al. | Combinatorial testing: learnings from our experience | |
| CN104932875A (zh) | 图像处理装置、管理系统及管理方法 | |
| JP2023012312A (ja) | 報告書作成支援システム、報告書作成装置、報告書作成方法およびプログラム | |
| JP2020166782A (ja) | 情報提供システム及び情報提供方法 | |
| CN115063101B (zh) | 基于案例库的结构数据生成方法、系统、装置及存储介质 | |
| US20030225611A1 (en) | Electronic source inspection process | |
| TWI297440B (en) | A mechanism for inter-fab mask process management | |
| JP2022108053A (ja) | クリティカルポイント監視装置、クリティカルポイント監視システム、クリティカルポイント監視方法、及びプログラム | |
| KR20240012003A (ko) | 제조 설계를 위한 의사 결정 시스템 | |
| US7123975B2 (en) | Manufacturing management system and method | |
| CN114365170B (zh) | 市场系统 | |
| KR102863816B1 (ko) | Erp 시스템과 연계된 와이어 하네스 검사공정 통합 관리 방법 | |
| JP3908069B2 (ja) | ジョブネットの関連近傍ジョブネットの導出及びその表示方法 | |
| US20040019510A1 (en) | Production management system, program, information storage medium and method of production control | |
| JP2006110007A (ja) | 医用画像通信システム用の装置間接続確認装置とその装置間接続確認方法 | |
| CN114722422B (zh) | 一种基于营销现场作业平台的合约管控方法及系统 | |
| US20260087789A1 (en) | Method, learning model evaluation system, and program | |
| CN111209888A (zh) | 一种人机界面视觉识别系统及方法 | |
| JPH0988339A (ja) | デジタルカメラによる建設工事の監理記録方法 | |
| US20240303608A1 (en) | Machine learning-based recruitment system and method |
Legal Events
| Date | Code | Title | Description |
|---|---|---|---|
| 121 | Ep: the epo has been informed by wipo that ep was designated in this application |
Ref document number: 23843165 Country of ref document: EP Kind code of ref document: A1 |
|
| NENP | Non-entry into the national phase |
Ref country code: DE |
|
| 122 | Ep: pct application non-entry in european phase |
Ref document number: 23843165 Country of ref document: EP Kind code of ref document: A1 |