WO2023235136A1 - Apparatus and method for improved inspection and/or maintenance management - Google Patents
Apparatus and method for improved inspection and/or maintenance management Download PDFInfo
- Publication number
- WO2023235136A1 WO2023235136A1 PCT/US2023/021992 US2023021992W WO2023235136A1 WO 2023235136 A1 WO2023235136 A1 WO 2023235136A1 US 2023021992 W US2023021992 W US 2023021992W WO 2023235136 A1 WO2023235136 A1 WO 2023235136A1
- Authority
- WO
- WIPO (PCT)
- Prior art keywords
- episode
- computer device
- data
- actions
- metrics
- Prior art date
- Legal status (The legal status is an assumption and is not a legal conclusion. Google has not performed a legal analysis and makes no representation as to the accuracy of the status listed.)
- Ceased
Links
Classifications
-
- G—PHYSICS
- G06—COMPUTING OR CALCULATING; COUNTING
- G06N—COMPUTING ARRANGEMENTS BASED ON SPECIFIC COMPUTATIONAL MODELS
- G06N3/00—Computing arrangements based on biological models
- G06N3/02—Neural networks
- G06N3/04—Architecture, e.g. interconnection topology
- G06N3/047—Probabilistic or stochastic networks
-
- G—PHYSICS
- G06—COMPUTING OR CALCULATING; COUNTING
- G06N—COMPUTING ARRANGEMENTS BASED ON SPECIFIC COMPUTATIONAL MODELS
- G06N3/00—Computing arrangements based on biological models
- G06N3/02—Neural networks
- G06N3/04—Architecture, e.g. interconnection topology
- G06N3/045—Combinations of networks
- G06N3/0455—Auto-encoder networks; Encoder-decoder networks
-
- G—PHYSICS
- G06—COMPUTING OR CALCULATING; COUNTING
- G06N—COMPUTING ARRANGEMENTS BASED ON SPECIFIC COMPUTATIONAL MODELS
- G06N3/00—Computing arrangements based on biological models
- G06N3/02—Neural networks
- G06N3/04—Architecture, e.g. interconnection topology
- G06N3/0464—Convolutional networks [CNN, ConvNet]
-
- G—PHYSICS
- G06—COMPUTING OR CALCULATING; COUNTING
- G06N—COMPUTING ARRANGEMENTS BASED ON SPECIFIC COMPUTATIONAL MODELS
- G06N3/00—Computing arrangements based on biological models
- G06N3/02—Neural networks
- G06N3/04—Architecture, e.g. interconnection topology
- G06N3/0475—Generative networks
-
- G—PHYSICS
- G06—COMPUTING OR CALCULATING; COUNTING
- G06N—COMPUTING ARRANGEMENTS BASED ON SPECIFIC COMPUTATIONAL MODELS
- G06N3/00—Computing arrangements based on biological models
- G06N3/02—Neural networks
- G06N3/08—Learning methods
- G06N3/092—Reinforcement learning
-
- G—PHYSICS
- G06—COMPUTING OR CALCULATING; COUNTING
- G06N—COMPUTING ARRANGEMENTS BASED ON SPECIFIC COMPUTATIONAL MODELS
- G06N7/00—Computing arrangements based on specific mathematical models
- G06N7/01—Probabilistic graphical models, e.g. probabilistic networks
-
- G—PHYSICS
- G06—COMPUTING OR CALCULATING; COUNTING
- G06Q—INFORMATION AND COMMUNICATION TECHNOLOGY [ICT] SPECIALLY ADAPTED FOR ADMINISTRATIVE, COMMERCIAL, FINANCIAL, MANAGERIAL OR SUPERVISORY PURPOSES; SYSTEMS OR METHODS SPECIALLY ADAPTED FOR ADMINISTRATIVE, COMMERCIAL, FINANCIAL, MANAGERIAL OR SUPERVISORY PURPOSES, NOT OTHERWISE PROVIDED FOR
- G06Q10/00—Administration; Management
- G06Q10/06—Resources, workflows, human or project management; Enterprise or organisation planning; Enterprise or organisation modelling
-
- G—PHYSICS
- G06—COMPUTING OR CALCULATING; COUNTING
- G06Q—INFORMATION AND COMMUNICATION TECHNOLOGY [ICT] SPECIALLY ADAPTED FOR ADMINISTRATIVE, COMMERCIAL, FINANCIAL, MANAGERIAL OR SUPERVISORY PURPOSES; SYSTEMS OR METHODS SPECIALLY ADAPTED FOR ADMINISTRATIVE, COMMERCIAL, FINANCIAL, MANAGERIAL OR SUPERVISORY PURPOSES, NOT OTHERWISE PROVIDED FOR
- G06Q10/00—Administration; Management
- G06Q10/20—Administration of product repair or maintenance
-
- G—PHYSICS
- G06—COMPUTING OR CALCULATING; COUNTING
- G06Q—INFORMATION AND COMMUNICATION TECHNOLOGY [ICT] SPECIALLY ADAPTED FOR ADMINISTRATIVE, COMMERCIAL, FINANCIAL, MANAGERIAL OR SUPERVISORY PURPOSES; SYSTEMS OR METHODS SPECIALLY ADAPTED FOR ADMINISTRATIVE, COMMERCIAL, FINANCIAL, MANAGERIAL OR SUPERVISORY PURPOSES, NOT OTHERWISE PROVIDED FOR
- G06Q50/00—Information and communication technology [ICT] specially adapted for implementation of business processes of specific business sectors, e.g. utilities or tourism
- G06Q50/06—Energy or water supply
-
- G—PHYSICS
- G06—COMPUTING OR CALCULATING; COUNTING
- G06Q—INFORMATION AND COMMUNICATION TECHNOLOGY [ICT] SPECIALLY ADAPTED FOR ADMINISTRATIVE, COMMERCIAL, FINANCIAL, MANAGERIAL OR SUPERVISORY PURPOSES; SYSTEMS OR METHODS SPECIALLY ADAPTED FOR ADMINISTRATIVE, COMMERCIAL, FINANCIAL, MANAGERIAL OR SUPERVISORY PURPOSES, NOT OTHERWISE PROVIDED FOR
- G06Q50/00—Information and communication technology [ICT] specially adapted for implementation of business processes of specific business sectors, e.g. utilities or tourism
- G06Q50/08—Construction
-
- G—PHYSICS
- G06—COMPUTING OR CALCULATING; COUNTING
- G06Q—INFORMATION AND COMMUNICATION TECHNOLOGY [ICT] SPECIALLY ADAPTED FOR ADMINISTRATIVE, COMMERCIAL, FINANCIAL, MANAGERIAL OR SUPERVISORY PURPOSES; SYSTEMS OR METHODS SPECIALLY ADAPTED FOR ADMINISTRATIVE, COMMERCIAL, FINANCIAL, MANAGERIAL OR SUPERVISORY PURPOSES, NOT OTHERWISE PROVIDED FOR
- G06Q50/00—Information and communication technology [ICT] specially adapted for implementation of business processes of specific business sectors, e.g. utilities or tourism
- G06Q50/40—Business processes related to the transportation industry
-
- H—ELECTRICITY
- H04—ELECTRIC COMMUNICATION TECHNIQUE
- H04L—TRANSMISSION OF DIGITAL INFORMATION, e.g. TELEGRAPHIC COMMUNICATION
- H04L67/00—Network arrangements or protocols for supporting network services or applications
- H04L67/01—Protocols
- H04L67/12—Protocols specially adapted for proprietary or special-purpose networking environments, e.g. medical networks, sensor networks, networks in vehicles or remote metering networks
Definitions
- Embodiments can be structured as a computer program encoded on a non-transitory computer storage medium that can define at least one deep reinforcement learning algorithm, which can be run by at least one processor of a computer system to help in selecting improved inspection and maintenance planning actions by interacting with a pre-defined infrastructure environment model while also allowing for adaptive actions and state/model updates.
- Other embodiments include communication systems or computer devices that can provide graphical user interfaces and other output to help schedule maintenance work on infrastructure (e.g., roadways, bridges, etc.) or other physical assets (e.g., airplanes, fleets of airplanes, wind turbines, power generation and transmission infrastructure, etc.).
- Another embodiment includes a process for utilization of such systems on one or more computer devices.
- I&M Inspection and Maintenance
- the I&M planning problem can typically be addressed using conventional methods such as threshold-based formulations with reliability analysis principles e.g., in (Saydam & Frangopol, 2014; Bocchini & Frangopol, 2011; Bismut & Straub, 2021), decision tree analysis, e.g., in (Straub & Faber, 2005), application of renewal theory, e.g., in (Grail, et al., 2002; Rackwitz, et al., 2005), utilization of stochastic optimal control, e.g., in (Madanat, 1993; Ellis, et al., 1995; Papakonstantinou & Shinozuka, 2014; Papakonstantinou, et al., 2018).
- reliability analysis principles e.g., in (Saydam & Frangopol, 2014; Bocchini & Frangopol, 2011; Bismut & Straub, 2021
- decision tree analysis e.g., in (Straub & Faber, 2005)
- Embodiments can utilize a Markov Decision Process (MDP) and/or partially observable Markov decision process (POMDP) in conjunction with the multi-agent DRL approach to allow for adaptive evaluation and prioritization in the presence of noisy real-time data or other ambiguous data (e.g., submitted evaluation report data that may include subjective information or subjective ratings, time series data from multi-modal sensors that may have limited reliability or precision, etc.).
- MDP Markov Decision Process
- POMDP partially observable Markov decision process
- the POMDP formulation becomes MDP, thus, it can similarly be utilized for maintenance prioritization and scheduling process.
- the POMDP framework can be defined by 7 elements that include 5, A, P, , and y, where S, A and are sets of states, actions, and possible observations, respectively, P is the model of transitions, O is an observation model, C are cost functions and y is a discount factor.
- the decision-maker also referred to as an “agent” starts at a state, s t at a time step, /.
- the agent takes an action receives a cost, transitions to the next state, and receives an observation, based on the observation probability model, Due to partial observability, the agent can only form a belief about its state, where is a probability distribution over S of all possible discrete states.
- a Bayesian update can be used to calculate the belief where probabilities form the belief vector bt of length and the denominator of is the standard normalizing constant.
- the pre-defined goal for an agent is to choose actions at each time step that minimize its expected future discounted cumulative cost, defined by the value or action-value function, the value function can be defined as:
- Embodiments of reinforcement learning (RL) that can be utilized in embodiments of our apparatus, device, or process can be defined as a computational framework for evaluating and automating goal-directed learning and decision-making for solving MDP/POMDP problems applying the above noted (PO)MDP framework.
- Embodiments of our RL algorithm can be defined so that it can be combined with deep neural network parametrizations.
- the methods for solving RL problems can be majorly classified as value-based or policy- based learning.
- Value-based methods learn the state or state-action value function and act upon it by selecting the optimal action in each given state.
- policy-based learning policy is directly learned using a separate function approximator (usually a neural network).
- the policy gradient method is customarily used for learning policies in policy-based methods and the policy gradient can be estimated in a multi-agent actor-critic setting as: where, state vector for component system, is an action vector for agents (no. of agents and no.
- the policy neural network parameter vector is the importance sampling weight, is a dimensional vector of agents’ behavior policies, p is the -dimensional state distribution under these policies, and is the advantage function defined as Advantage can be seen as a zero-mean measure, estimating how advantageous each action is.
- Advantage function can be further approximated as in (Mnih, et al., 2016; Andriotis & Papakonstantinou, 2019), which reduces the need of action-value function by using only value function with one step look ahead, similar to the TD-leaming, as: where, are the weight parameters of the critic neural network.
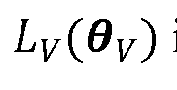
- the mean squared error is considered as a loss function for the critic neural network: where, is a critic loss function and its gradient can be estimated for updating as:
- Both actor and critic neural networks will be trained using the batch sampling from a buffer memory, storing the agent's experience tuples.
- Embodiments can be configured to define a process for planning that can be well-suited for large multi-component systems.
- Embodiments can define a framework that also considers the presence of constraints through state augmentation and Lagrange multipliers. Further, embodiments can use a sparse parametrization of the actor-neural network without parameter sharing between agents (e.g., each component can have its own actor neural network).
- embodiments can be configured to allow for separate critic networks and even sparser actor parametrizations.
- Some embodiments can employ a fully decentralized logic along the lines of centralized training and decentralized execution, postulating that state accessibility for each actor neural network is restricted to its corresponding component.
- Component actions, as well as various possible sub-system actions, are assumed conditionally independent given their own state, thus the policy and its gradient now become:
- each control unit can be considered an autonomous agent that only utilizes component-state information to decide about its actions, guided also by the system advantage function.
- embodiments of this aspect can include corresponding techniques, apparatus, and computer programs, designed to execute the actions of the methods that are encoded on a non- transitory computer storage medium (e.g. flash memory, a solid state drive, other memory device on which an application or program can be stored such that at least one processor can run the program or application to perform at least one method defined by the code of the program or application).
- a computer device running such a program or application can be configured for performing the actions of one or more defined methods.
- the described DRL framework can have multiple states as input, and these states can directly be obtained from said sensors or from storage devices.
- These inputs can take the form of vector values, matrices, and images representing the health and other metrics (e.g., condition states, age, time, temperature, budget, etc.) of a said infrastructure system.
- these inputs can be discrete or continuous values that are processed and directly be used as input features.
- these inputs can be raw vector values, matrices, and images that require additional processing.
- the embodiments with raw inputs can be processed using regression techniques, machine learning, autoencoders, variational autoencoders, fully connected neural networks, convolutional neural networks, transformers, and other forms.
- the said multi-agent DRL framework can incorporate multiple types of outputs, discrete or continuous values.
- the discrete values may represent the categorized inspection and maintenance prioritization selection or other aggregated action information
- the continuous output may represent specific adaptive control related to the asset type (e.g., appropriate rotation of solar panels for maximum output based on solar angle, movement of wind turbine blades for maximum efficiency based on wind direction, etc.).
- Some embodiments may incorporate various computational environments in relation to the state-action interaction of an asset, these can range from actual environment, stochastic models, black-box models, dynamic Bayesian networks, random fields/random processes, etc. Some embodiments can include the cases where the underlying asset deterioration model is unknown and/or ambiguous, which can simultaneously be updated from the data using regression techniques, Bayesian techniques, machine learning, etc. These deterioration models can incorporate various factors relating to various hazards, fatigue, temperature fluctuations, rare loading events (e.g., earthquakes, hurricanes, cyclones, etc.), and many others.
- various computational environments in relation to the state-action interaction of an asset, these can range from actual environment, stochastic models, black-box models, dynamic Bayesian networks, random fields/random processes, etc.
- Some embodiments can include the cases where the underlying asset deterioration model is unknown and/or ambiguous, which can simultaneously be updated from the data using regression techniques, Bayesian techniques, machine learning, etc. These deterioration models can
- inventions may include joint optimization of asset and sensor management in the context of structural health monitoring, for example, optimal sensor location, sensor replacement, etc., along with maintenance prioritization and scheduling of the asset components.
- Embodiments can utilize a single computer device, a network of devices, or multiple networks of devices.
- a system can utilize one or more servers that host a service that receive data from one or more sensors and other data from one or more other computer devices or servers to generation of graphical user interface displays or other output to facilitate inspection and maintenance management planning for various physical assets (e.g., roadways and bridges, airplanes, a fleet of vehicles or airplanes, power generation and distribution equipment, etc.).
- various physical assets e.g., roadways and bridges, airplanes, a fleet of vehicles or airplanes, power generation and distribution equipment, etc.
- a communication apparatus can include a computer device having a processor connected to a non-transitory computer readable medium.
- the computer device can be configured to:
- Embodiments of the communication apparatus can be provided so that the computer device is configured to generate a graphical user interface (GUI) to display at least one graphical element based on data obtained after the convergence condition is detected.
- GUI graphical user interface
- the computer device can be a server that is configured to receive sensor data and/or record data from at least one of (i) at least one user device communicatively connectable to the computer device, (ii) at least one sensor, and (iii) a record storage device communicatively connectable to the computer device.
- Some embodiments can be adapted so the server receives data from all of these devices. Other embodiments can be configured so that the server only receives data from one or two of these three elements.
- the computer device can be a management device that is communicatively connectable to a user device to generate a GUI for display of at least one graphical element at a user device based on data obtained after the convergence condition is detected.
- the pre-selected number of actors can include decentralized actors with centralized input or decentralized input for the episode.
- the advantage function can be calculated based on system type, component type, and/or action type.
- Embodiments of the communication apparatus can include other elements.
- the computer device can include the record storage device, at least one sensor and/or at least one user device communicatively connectable to the computer device.
- Embodiments of the apparatus can also include other features or elements.
- a process for maintenance prioritization and scheduling is also provided.
- Embodiments of the process can include:
- Embodiments of the process can also include other steps or features.
- the process can also include generating a GUI to display at least one graphical element based on data obtained after the convergence condition is detected and/or providing data to at least one user device for generation of the GUI.
- the process can be performed by a management device that is communicatively connectable to a user device to generate the GUI in some embodiments.
- embodiments of the process can include receiving sensor data and/or record data from at least one of: (i) at least one user device communicatively connectable to the computer device; (ii) at least one sensor; and (iii) a record storage device communicatively connectable to the computer device.
- Such embodiments can only use one of these items, any combination of two of these items, or all three of these items.
- Some embodiments can be adapted so that the pre-selected number of actors include decentralized actors with centralized input or decentralized input for the episode. Also (or alternatively), the advantage function can be calculated based on system type, component type, and/or action type.
- a non-transitory computer readable medium having code stored thereon that defines a method that is performable by a computer device when a processor of the computer device runs the code is also provided.
- the method that can be performed when the computer device runs the code can include:
- the computer device can be a management device that is communicatively connectable to a user device to generate a GUI.
- the method defined by the code that can be performed when a device runs the code can also include generating GUI data for display of at least one graphical element in a GUI based on data obtained after the convergence condition is detected.
- Figure l is a block diagram of an exemplary embodiment of a communication system that can utilize one or more exemplary embodiments of a computer device along with one or more exemplary computer programs that can be configured to define at least one method to be performed when a device or apparatus runs the code of one or more computer programs.
- the actions taken by the apparatus or computer device can be steps of the methods, encoded on computer storage device(s), to perform an embodiment of the process for maintenance prioritization and scheduling.
- Figure 2 is a block diagram of an exemplary embodiment of a computer device 11 that can be utilized in the exemplary embodiment of a computer system shown in Figure 2.
- Figure 3 is a flow chart illustrating exemplary steps that can be performed when implementing a first exemplary embodiment of a process for inspection and maintenance prioritization and scheduling.
- Figure 4 is a diagram representing the first exemplary embodiment with raw inputs which shows data processing unit and the deep reinforcement learning framework.
- Figure 5 is a flow chart illustrating the first exemplary embodiment of a process for inspection and maintenance prioritization and scheduling that can be performed by an exemplary embodiment of the communication system shown in Figure 1 and/or a computer device 11 of the communication system shown in Figure 2.
- Figure 6 is a flow chart illustrating exemplary steps of the first exemplary embodiment of a process for inspection and maintenance prioritization and scheduling that can be performed by an exemplary embodiment of the communication system shown in Figure 1 and/or a computer device 11 of the communication system shown in Figure 1 that illustrates how the state and action parameters can be accounted for when performing the embodiment of the process.
- Figure 7 is a graph illustrating an exemplary observation probability calculation for an actual CCI of 55 that can be used when implementing the exemplary embodiment of the process steps of the exemplary embodiment of the process for maintenance prioritization and scheduling shown in Figure 6.
- Figure 8 is a graph illustrating simulation results from utilization of a first exemplary embodiment of a communication apparatus that was adapted to utilize an exemplary embodiment of a prioritization and scheduling process.
- Figure 9 is a graph illustrating computed transition probabilities for pavements supporting the heavier traffic loads in the Example described subsequently, generated from utilization of a first exemplary embodiment of a communication apparatus that was adapted to utilize an exemplary embodiment of a prioritization and scheduling process.
- Figure 10 is a graph illustrating deck transition probabilities.
- Figure 11 depicts an exemplary model for an exemplary set of roadways and bridges.
- Figure 12 is a graph illustrating a comparison of cost projections to compare baseline results with results obtained via use of an exemplary embodiment.
- Figure 13 is a histogram illustrating a comparison of different cost constituents to compare baseline results with results obtained via use of an exemplary embodiment.
- Figure 14 is an exemplary visual display that can be generated to provide results of a network condition state evolution for inspection and maintenance prioritization with time and scheduling scheme that can be generated by an exemplary embodiment of the proposed DRL framework in conjunction with the communication system and/or computer device that can utilize one or more embodiments of inspection and maintenance prioritization and scheduling process.
- a communication system 1 can include a network 3 that includes a number of computer devices 11.
- the computer devices 11 can include a management device 5 and a record storage device 7.
- the management device 5 and record storage device 7 can each be configured as a server or other type of computer device that can be configured as a communication device that hosts one or more services.
- the record storage device 7 can include non-transitory memory that stores sensor data and/or asset evaluation data (e.g., evaluation forms, etc.) that may be communicated to the record storage device by one or more sensors 6 and one or more user devices 8.
- the record storage device 7 can be configured to provide this data or a portion of this data to the management device 5.
- the management device 5 can also include non-transitory memory that stores sensor data and/or asset evaluation data (e.g., evaluation forms, etc.) that may be communicated to the management device 5 by one or more sensors 6 and one or more user devices 8.
- the management device 5 can receive such data so the record storage device 7 is not needed.
- the management device can receive such data and also communicate with the record storage device 7 to receive additional data.
- the management device 5 may not receive any data from the sensors 6 or user devices 8. Instead, such data may be received by the management device 5 via the record storage device 7.
- the user devices 8 can be a type of computer device 11 configured as a communication device such as a personal computer (PC), a laptop computer, a smart phone, a tablet, or other type of communication terminal.
- the sensors 6 can be sensors configured to monitor one or more conditions of an asset, such as a road, bridge, airplane component, electricity power, generation or transmission component, or other type of physical asset of a plurality of physical assets that may require different levels of maintenance to preserve the asset and maintain the asset’s functionality to a desired level (e.g., to keep the asset functionality above a pre-selected failure threshold, outside of a pre-selected non-working threshold, or within a pre-selected safety threshold, etc.).
- an asset such as a road, bridge, airplane component, electricity power, generation or transmission component, or other type of physical asset of a plurality of physical assets that may require different levels of maintenance to preserve the asset and maintain the asset’s functionality to a desired level (e.g., to keep the asset functionality above a pre-selected failure threshold, outside
- Each computer device 11 of the system 1 can include hardware.
- the hardware can include a processor 11p that is connected to non-transitory memory 11m and at least one transceiver 11t.
- the memory 11m can store at least one application 11a thereon and one or more data-stores 11ds thereon.
- the data-stores 11ds can include fdes, sensor data, evaluation data, measurement data, databases, or other types of data or files.
- the transceiver 11t can include one or more transceivers for communications with other devices.
- the transceiver 11t can include, for example, a Wi-Fi transceiver, a local area network card, an Ethernet transceiver (e.g., an Ethernet card and interface), a Bluetooth transceiver, a near field communication transceiver, a cellular network transceiver, or other type of communication transceiver.
- Each computer device 11 can include or be communicatively connected to one or more output devices 11o and one or more input devices 11i.
- Input/output devices such as a touch screen display can be considered an input device 11i and/or an output device 11o.
- Examples of input devices can include a touch screen display, a microphone, a button, keyboard, stylus, pointer device.
- Examples of an output device 11o can include a display, touch screen display, monitor, printer, or speaker.
- Sensors 6 can include computer devices 11 or can be configured to communicate data to one or more computer devices 11.
- sensors can include temperature sensors, pressure sensors, acoustic sensing, infrared/thermal imaging sensors, ground penetrating radar, coring and chipping sensors, potentiometers, thermocouples, half-cell potential tests, composition detectors, or other types of detectors or condition detection mechanisms.
- the sensors 6 can provide data to the record storage device 7 and/or management device 5 or can provide data to one or more user devices 8, which can forward that data, portions of that data, or computer device data that is based on the received sensor data to the record storage device 7 and/or management device 5.
- Examples of such data can include visual inspection reports or report data, image data, raw sensor data, time series data, portions of the sensor data that fall within a pre-selected set of criteria, or user device data that is based on the sensor data (e.g., sensor data after it has been filtered or otherwise analyzed for providing to the management device 5 and/or record storage device 7).
- the management device 5 can communicate with the record storage device 7 to receive data and/or files stored in the memory of the record storage device 7. This data can be to supplement data already stored in memory of the management device 5 (e.g., as one or more data stores) or can be the data the management device may use to evaluate the performance of an embodiment of the maintenance prioritization and scheduling process. In other embodiments, the management device 5 can receive data from the user devices 8 and sensors 6 and store that in its memory for access and use in performance of an embodiment of the maintenance prioritization and scheduling process.
- the communication system 1 can also include other components.
- the communication system can include access points, routers, gateways, session border controllers, or other types of network elements (e.g., intra-network communication nodes, internetwork communication nodes, base stations, other servers that host other services etc ).
- the communication system 1 can also be configured so one or more user devices 8, the management device 5 or the record storage device 7 can receive data from one or more cloud- based services or other communication devices 1.
- the management device 5 can be a cloud-based device that can communicate with other devices (e.g., record storage device 7, user devices 8, and/or sensors 6) via at least one internet connection or cloud-based communication connection.
- the network 1 can include the network environment of the management device 5 and the one or more networks of the record storage device 7 and/or user devices 8 (e.g., one or more local area networks (LANs), an enterprise network, etc.).
- LANs local area networks
- embodiments of the system 1 and computer devices 11 can be configured to perform an embodiment of a maintenance prioritization and scheduling process.
- the implementation of this process can be defined by code of an application stored in the memory of the management device 5 or a user device 8, for example.
- An embodiment of the code of the application that can be run on such a computer device can be referred to herein as a Deep Decentralized Multi-agent Actor-Critic, or DDMAC-CTDE.
- embodiments can utilize a partially observable Markov Decision Process (POMDP) and a multi-agent Deep Reinforcement Learning (DRL) approach to allow for adaptive evaluation and prioritization in the presence of noisy real-time data or other noisy data (e.g., submitted evaluation report data that may include subjective information or subjective ratings, sensor data that may have limited reliability or precision, etc.).
- POMDP partially observable Markov Decision Process
- DRL Deep Reinforcement Learning
- the POMDP framework can be defined by elements that include S, A, P, O, C, and y, where S, A and are sets of states, actions, and possible observations, respectively, P is the model of transitions, O is an observation model, C are cost functions and y is a discount factor.
- the decision-maker also referred to as an “agent” starts at a state, at a time step, takes an action receives a cost, transitions to the next state, and receives an observation, based on the observation probability model Due to partial observability, the agent can only form a belief about its state, where is a probability distribution over S of all possible discrete states.
- a Bayesian update can be used to calculate the belief where probabilities for all , form the belief vector of length and the denominator of is the standard normalizing constant. (Eq. 9 is the same as the above Eq. 1).
- the pre-defined goal for an agent is to choose actions at each time step that minimize its expected future discounted cumulative cost, defined by the value or action-value function, which can be defined as:
- Embodiments of reinforcement learning can be defined as a computational framework for evaluating and automating goal-directed learning and decision-making for solving POMDP problems applying the above noted POMDP framework.
- Embodiments of our RL algorithm can be defined in the code of an application 11app stored on memory 11m.
- the methods for solving RL problems can be classified as value-based or policy-based learning.
- Value-based methods learn the state or state-action value function and act upon it by selecting the optimal action in each given state.
- policy-based learning policy is directly learned using a separate function approximator (usually a neural network).
- the policy gradient method is customarily used for learning policies in policy-based methods and the policy gradient, can be estimated in a multi-agent actor-critic setting as: where, state vector for m-component system, s an action vector for //-agents (no. of agents and no.
- the policy neural network parameter vector is the importance sampling weight, dimensional vector of agents’ behavior policies, p is the ///-dimensional state distribution under these policies, and is the advantage function defined as Advantage can be seen as a zero mean measure i.e., estimating how advantageous each action is.
- Advantage function can be further approximated as in (Mnih, et al., 2016; Andriotis & Papakonstantinou, 2019), which reduces the need of action-value function by using only value function with one step look ahead, similar to the TD-leaming, as: where, are the weight parameters of the critic neural network.
- the mean squared error is considered as a loss function for the critic neural network: where, is a critic loss function and its gradient can be estimated for updating as:
- Both actor and critic neural networks will be trained using batch sampling from a buffer memory, storing the agent's experience tuples.
- embodiments can be configured to allow for separate critic networks and even sparser actor parametrizations.
- Some embodiments can employ a fully decentralized logic along the lines of centralized training and decentralized execution, thus, an exemplary embodiment of the process can be termed as DDMAC-CTDE, postulating that state accessibility for each actor neural network is restricted to its corresponding component.
- Component actions, as well as various possible sub-system actions, can be assumed conditionally independent given their own state, such that the policy and its gradient are:
- each control unit can be considered an autonomous agent that only utilizes component-state information to decide about its actions, guided also by the system advantage function.
- Figure 3 represents the steps for the DDMAC-CTDE embodiment.
- the objective in life-cycle management engineering problems is to obtain optimal sequential decisions based on an optimal policy which can incorporate the notions of resource scarcity, risks, and other constraints that need to be satisfied over the life-cycle.
- This goal of the decision-maker may be interpreted as determining an optimum policy that minimizes the entire cumulative future operational costs and risks given the constraints: where is the cost incurred at time t by taking action a t . transitioning from state and taking an observation and are the discount factors for cost, deterministic constraint, and probabilistic constraints, respectively; is an initial belief; and T is the length of the planning horizon; are the deterministic and probabilistic constraints, respectively; are their respective auxiliary costs; and are real-valued scalars.
- the policy function belongs to a space, which contains all possible policies that are admissible under the existing constraints of the problem. is a subset of which is the policy space of the unconstrained problem.
- the constraint structure in (Eq. 17) is adaptable to a wide variety of constraint types important to inspection and maintenance management problems.
- Deterministic constraint metrics may be used to simulate a wide range of fixed resource allocation and control action availability problems, such as those with budget restrictions.
- probabilistic constraints in the form of (Eq. 17) may be used to represent constraints that need to be satisfied in expectation, such as risk-based or performance-based constraints (e.g., setting goals for good/poor condition levels and many others).
- FIG. 3 illustrates an example implementation of the above noted process that can be defined by code of an application stored in the memory of a computer device 11 (e.g., the management device 5).
- actor and critic network weights are first initialized along with the Lagrange multipliers as coefficients of probabilistic constraint metrics, noted above, then we start the episode with inputs such as current beliefs on condition states (for first time step, the starting state), model parameters, and deterministic constraint metrics.
- actions can be sampled from actor neural network output and/or via uniform random sampling. Further, observations can be sampled from pre-defined observation probability model. Now, with all the information on current beliefs, and sampled actions and observations, the metrics like total cost, probabilistic constraints and next step beliefs can be estimated. Thereafter, the experience is stored This can include the current beliefs, defined deterministic constraint metrics, costs, probabilistic constraint metrics. The stored experience can also include the next step beliefs, deterministic constraint metrics or other parameters.
- the collected experience data can be stored in the memory 11m of the management device 5, for example. The process for experience generation and storage can be repeated until a pre-selected episode ends.
- Figure 3 illustrates another flow chart showing the iterative nature of this process and how different stations, belief states, costs, actions, and observations can be accounted for as discussed above with reference to Figure 3.
- Figure 7 illustrates a calculation of observation probabilities using a normal distribution curve, which can help in estimating the belief state of the asset used in Figure 5.
- Figure 5 illustrates a flow chart of the system’s utilization of sensor data from structural health monitoring (e.g., time series response, image based, etc.) and other forms of data (e.g., inspection record data, maintenance action records, etc.) to perform an embodiment of the maintenance prioritization and scheduling process.
- data can be obtained and fed into a pre-determined deterioration model (e g , deterministic models, stochastic models, black box models, dynamic Bayesian networks, and many others).
- a pre-determined deterioration model e.g , deterministic models, stochastic models, black box models, dynamic Bayesian networks, and many others.
- model uncertainty can be tackled via model updating techniques (e.g., Bayesian model updating, machine learning techniques, etc.) with the help of incoming data.
- inventions may include joint optimization of asset and sensor management in the context of structural health monitoring, for example, optimal sensor location, sensor replacement, etc., along with maintenance prioritization and scheduling of the asset components.
- the incoming sensor data may be raw, which can take the form of vector values, matrices, and images representing the health and other metrics (e.g., time-series data, condition states, age, time, temperature, budget, etc.) for the assets and can be obtained from sensors, inspection records, etc.
- the raw input data may need an additional processing step.
- the data processing can be performed using regression techniques, matrix decomposition, machine learning, autoencoders, variational autoencoders, fully connected neural networks, convolutional neural networks, transformers, and other forms. It is represented as a data processing unit, shown in Figure 4, which takes the raw data as input, and using one of the mentioned techniques, we get the processed data/features as output that can be used in the DRL framework as represented in Figure 4.
- the data can be used in a computer device (e.g., management device 5) so the embodiment is run to perform the optimization to evaluate the data as discussed above with reference to Figure 3.
- the evaluated data can be provided for use in generation of one or more outputs as shown in Figure 6, for example.
- the outputs can include a graphical illustration or a display providable in a Graphical User Interface (GUI) that can show the evolution of condition states based on the corresponding actions recommendations from the proposed DRL framework for different assets.
- GUI Graphical User Interface
- outputs can include graphs that can illustrate different asset risk profiles for current assets and projections to facilitate a review of the assets and maintenance scheduling to account for the illustrated risks and asset conditions determined by the computer device running the DDMAC-CTDE code.
- graphical illustrations included in Figures 6 and 7 can be generated as output to a user via an output device 11o (e.g., display or printer).
- the graphical illustrations can help identify different assets, current conditions for those assets and risk estimations associated with those assets to indicate a maintenance priority to address a pre-selected set of risk criteria.
- an existing transportation network from Hampton Roads, Virginia, USA is considered as an example to demonstrate the efficacy of an embodiment of the proposed framework.
- the considered network of assets includes 85 pavement and 11 bridge components.
- Various indicators can describe the pavement condition, e.g., Pavement Condition Index (PCI), Critical Condition Index (CCI), International Roughness Index (IRI), and Load Related Distress Index (LDR), among many others.
- PCI Pavement Condition Index
- CCI Critical Condition Index
- IRI International Roughness Index
- LDR Load Related Distress Index
- CCI ranges from 0-100
- IRI were used in this example as they offered a joint quantification of condition, as per structural distresses and ride quality, respectively.
- a non- stationary CCI model was used in this embodiment as a modified version based on a Virginia Department of Transportation (VDOT) report.
- VDOT Virginia Department of Transportation
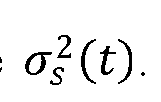
- a gamma process was utilized, with its mean being in time equal to the modified mean CCI predictions and a relevant model variance. The details are provided below on how to obtain CCI transition probabilities for this example.
- DJ is gamma distribution density function
- the gamma process is parametrized here by a non-negative time varying scale parameter function g(t) and a non-negative time-varying shape parameter function
- the relevant parameters are estimated in time based on the mean DI prediction model and the model variance
- the relationship between the gamma process parameter functions is given as:
- the CCI values were discretized into 6 condition states, with 6 being the intact state, as shown in Table 2. These discretized condition states were adapted from prescribed VDOT maintenance guidelines. Further, 4 maintenance actions are adopted (Do-Nothing, Minor Repair, Major Repair, Reconstruction). There are various guidelines for pavement maintenance action from different agencies.
- the maintenance actions used in this example represent category of actions, i.e., Minor Repair includes crack filling, moderate patching, etc., these actions can improve the CCT and IRT states but do not affect the rate of deterioration.
- Major Repair includes heavy patching, full depth patching, milling and overlay, etc., and can improve condition states and reduce the deterioration rate by 5 years.
- Reconstruction actions can reset the pavement to an intact condition. Maintenance actions taken at any given time can simultaneously improve both CCI and IRI indices. Table 18 provides examples of activities for these actions.
- the observation uncertainty for CCI is modeled by the likelihood functions p(o t
- Three distributions are considered in this embodiment to function as a likelihood function, corresponding to no- inspection, low- and high-fidelity inspections, respectively.
- Tables 6 and 7 below provide observational probabilities for given CCI states corresponding to the three cases used in this Example.
- the IRI in m/km
- the IRI transition probability model is stationary. In this case too, three different inspection activities were assumed, and the measurement errors associated with the respective inspection technologies were also considered according to no-inspection, low-, and high-fidelity inspection cases.
- Tables 8-11 below provide the Do-Nothing, Minor Repair, Major Repair, and Reconstruction transition probabilities, respectively, for the 5 IRI states in this example. Further, the observation probabilities for different inspections technique based on their fidelity levels are shown in Table 12. Table 8
- s t ) given state s t for high fidelity inspection techniques for decks.
- For deck inspections there is a variety of destructive and nondestructive inspection techniques that can be used for bridge decks, such as visual inspections, acoustic sensing, infrared/thermal imaging, ground penetrating radar, coring and chipping, and half-cell potential tests, among many others.
- inspection techniques are herein characterized as uninformative, low-fidelity, and high-fidelity inspection techniques, respectively, similar to the pavements.
- Tables 16 and 17 provide observation probabilities for low- and high-fidelity inspection techniques for decks, respectively.
- Tables 19 and 20 below provide the maintenance actions durations in days for pavement and bridge components respectively, to use in this example.
- Pavement maintenance action durations in days per lane mile Pavement maintenance action durations in days per lane mile.
- the Hampton Roads transportation network in Virginia, USA is considered as a reference example, which includes original topology and average daily traffic data of the network.
- the topology includes various pavement sections along with 11 main bridges. Each bridge is bidirectional, with the same number of lanes as in the original network, illustrated in Figure 11.
- Different decks, types I-III are categorized based on their relative sizes and traffic consideration in descending order. Type I bridges are large bridges typically having a length of more than 2 miles with the highest volume of traffic; type II bridges range between 0.4-2 miles with intermediate traffic volume; and type III bridges usually have lengths less than 0.4 miles and have the lowest traffic volume as shown in Table 21.
- the Great Bridge bypass which should be of type II based on the size, but as it is on a secondary highway with no nearby interstates or high traffic volume highway, it is categorized as type III. Even though we have different traffic volumes for different types of bridges mainly due to their sizes, the volume per lane-mile is considered the same as these bridges are essential and lie on the interstate or primary highway routes. Further, we also determine the user delay costs associated with maintenance actions using bridge size and traffic flow. Similarly, the network has 85 pavement components categorized as type T-TIT. Type I pavements are interstate highways, with bidirectional traffic having four lanes in each direction, constituting the class of highest vehicular miles.
- Type II are primary highways with a bidirectional medium level of traffic, having two lanes in each direction.
- type III are secondary highways with low-level bidirectional traffic and one lane in each direction. The deterioration rate of pavements is selected based on these classes, as high-volume roads have a higher rate than low- volume ones in this example.
- Risk is defined as an expected cumulative discounted failure state cost over the life cycle.
- the risk cost can include multiple parts: (1) accruable cost, which is taken as two times the rebuilding cost of the bridge, and (2) instantaneous cost, which is considered here as ten times the rebuilding cost of the bridge.
- the total risk is estimated using (i) the risk of individual bridge failures (for all network bridges), and (ii) the system-level risk, defined based on the connecting bridges over James River and York River.
- the system risk has 3 failure modes, i.e., (A) the bridge over York River fails, (B) the 3 bridges over James River fail, and (C) modes A and B occur simultaneously.
- VDOT also aims to achieve ‘no’ CCI lower than 35 for the interstate system.
- the above constraints can be defined to be satisfied in an expectation sense (i.e., probabilistic constraints). Therefore, the last constraint can be modified here from 0 to 2%.
- the embodiment of this example evaluated a 96-component network based on the Hampton Road network shown in Figure 11, which had a total number of ⁇ 2x lO 24X possible system states at any given time instant. 10 actions per component were considered which make the total number of available actions equal to 10 96 for the entire network at each time step.
- the network algorithm training was performed for 1.3xl0 6 episodes.
- a condition-based maintenance (CBM) policy i.e., (i) a condition-based maintenance (CBM) policy, and (ii) a policy baseline following VDOT guidelines.
- CBM policy is heuristically optimized to find the relevant thresholds based on the condition of each component type, i.e., bridge, interstate, primary, and secondary pavements.
- the policy involves the full suite of 10 actions at every even time step. However, at every odd year, action 6 is taken for every component, i.e., Do-Nothing and high-fidelity-inspection.
- the VDOT policy baseline was approximated from a VDOT 2016 publication for pavement components.
- Figure 14 illustrates actions generated by one of the instances of the optimum policy and the evolution of component belief states is shown with contours.
- Figure 13 is an example of graphics and display elements that can be generated by use of an embodiment of the apparatus to display the graphics and/or display elements of a graphical user interface (GUI) of a display device (e g., output device 11o) to help visualize options for use in selecting and prioritizing maintenance activities.
- GUI graphical user interface
- Figure 14 displays the discounted budget usage over time and the 5-year budget discounted for every cycle.
- the budget is a deterministic constraint that the agents are not allowed to exceed, a requirement that is satisfied by the obtained solution.
- the evolution of the total risk cost associated with individual bridges and the 3 modes of system risk is also presented.
- the cost distribution among different types of pavements and bridges is shown in a pie chart.
- Plots with control actions can represent the actions taken over time.
- the evolution of contour plots in the case of pavements shows current beliefs for both CCI and IRI states, and the current belief states at each step for two bridge decks are also shown.
- control actions were compatible with belief states.
- the agents initially choose Do-Nothing actions since the belief states for both pavements and bridges initiate in the intact condition. As the conditions gradually worsen, more interventions are considered.
- the Do-Nothing action is optimal for pavements, as pavements do not contribute to disconnection risks, while any action without inspection can be optimal for bridges.
- the agents maintain and inspect type I bridges more systematically. This is because type I bridges have their individual failure risk as well as mode B and mode C system failure risks associated with them.
- embodiments of our process, communication apparatus, communication system 1, and computer device 11 can be adapted to meet a particular set of design criteria.
- the particular type of sensors or other hardware can be adjusted to meet a particular set of design criteria.
- a particular feature described, either individually or as part of an embodiment can be combined with other individually described features, or parts of other embodiments.
- the elements and acts of the various embodiments described herein can therefore be combined to provide further embodiments.
Landscapes
- Engineering & Computer Science (AREA)
- Physics & Mathematics (AREA)
- Theoretical Computer Science (AREA)
- Business, Economics & Management (AREA)
- General Physics & Mathematics (AREA)
- Health & Medical Sciences (AREA)
- General Health & Medical Sciences (AREA)
- Human Resources & Organizations (AREA)
- Economics (AREA)
- Computing Systems (AREA)
- Software Systems (AREA)
- Strategic Management (AREA)
- General Engineering & Computer Science (AREA)
- Mathematical Physics (AREA)
- Data Mining & Analysis (AREA)
- Evolutionary Computation (AREA)
- Artificial Intelligence (AREA)
- General Business, Economics & Management (AREA)
- Biophysics (AREA)
- Computational Linguistics (AREA)
- Biomedical Technology (AREA)
- Life Sciences & Earth Sciences (AREA)
- Tourism & Hospitality (AREA)
- Molecular Biology (AREA)
- Marketing (AREA)
- Entrepreneurship & Innovation (AREA)
- Quality & Reliability (AREA)
- Operations Research (AREA)
- Probability & Statistics with Applications (AREA)
- Primary Health Care (AREA)
- Computational Mathematics (AREA)
- Development Economics (AREA)
- Mathematical Optimization (AREA)
- Pure & Applied Mathematics (AREA)
- Algebra (AREA)
- Public Health (AREA)
- Water Supply & Treatment (AREA)
- Mathematical Analysis (AREA)
- Educational Administration (AREA)
- Game Theory and Decision Science (AREA)
Abstract
Description









Claims
Priority Applications (2)
| Application Number | Priority Date | Filing Date | Title |
|---|---|---|---|
| US18/853,426 US12346795B2 (en) | 2022-05-31 | 2023-05-12 | Apparatus and method for improved inspection and/or maintenance management |
| US19/210,306 US20250278611A1 (en) | 2022-05-31 | 2025-05-16 | Apparatus and method for improved inspection and/or maintenance management |
Applications Claiming Priority (2)
| Application Number | Priority Date | Filing Date | Title |
|---|---|---|---|
| US202263347192P | 2022-05-31 | 2022-05-31 | |
| US63/347,192 | 2022-05-31 |
Related Child Applications (2)
| Application Number | Title | Priority Date | Filing Date |
|---|---|---|---|
| US18/853,426 A-371-Of-International US12346795B2 (en) | 2022-05-31 | 2023-05-12 | Apparatus and method for improved inspection and/or maintenance management |
| US19/210,306 Continuation US20250278611A1 (en) | 2022-05-31 | 2025-05-16 | Apparatus and method for improved inspection and/or maintenance management |
Publications (1)
| Publication Number | Publication Date |
|---|---|
| WO2023235136A1 true WO2023235136A1 (en) | 2023-12-07 |
Family
ID=89025460
Family Applications (1)
| Application Number | Title | Priority Date | Filing Date |
|---|---|---|---|
| PCT/US2023/021992 Ceased WO2023235136A1 (en) | 2022-05-31 | 2023-05-12 | Apparatus and method for improved inspection and/or maintenance management |
Country Status (2)
| Country | Link |
|---|---|
| US (2) | US12346795B2 (en) |
| WO (1) | WO2023235136A1 (en) |
Families Citing this family (1)
| Publication number | Priority date | Publication date | Assignee | Title |
|---|---|---|---|---|
| CN120525294B (en) * | 2025-07-23 | 2025-10-14 | 中国人民解放军海军航空大学 | Aircraft fleet support task scheduling state transfer method and device |
Citations (1)
| Publication number | Priority date | Publication date | Assignee | Title |
|---|---|---|---|---|
| WO2021105246A1 (en) * | 2019-11-26 | 2021-06-03 | Basf Se | Forecasting industrial aging processes with machine learning methods |
-
2023
- 2023-05-12 WO PCT/US2023/021992 patent/WO2023235136A1/en not_active Ceased
- 2023-05-12 US US18/853,426 patent/US12346795B2/en active Active
-
2025
- 2025-05-16 US US19/210,306 patent/US20250278611A1/en active Pending
Patent Citations (1)
| Publication number | Priority date | Publication date | Assignee | Title |
|---|---|---|---|---|
| WO2021105246A1 (en) * | 2019-11-26 | 2021-06-03 | Basf Se | Forecasting industrial aging processes with machine learning methods |
Non-Patent Citations (4)
| Title |
|---|
| ADRIAN CHOW: "Solving Continuous Control using Deep Reinforcement Learning (Policy-Based Methods)", 9 January 2021 (2021-01-09), Retrieved from the Internet <URL:https://ahtchow.medium.com/solving-continuous-control-using-deep-reinforcement-learning-policy-based-methods-64a871832496> * |
| ANDRIOTIS C.P.; PAPAKONSTANTINOU K.G.: "Deep reinforcement learning driven inspection and maintenance planning under incomplete information and constraints", RELIABILITY ENGINEERING AND SYSTEM SAFETY., ELSEVIER APPLIED SCIENCE., GB, vol. 212, 11 March 2021 (2021-03-11), GB , XP086568568, ISSN: 0951-8320, DOI: 10.1016/j.ress.2021.107551 * |
| LEITE ABE, CANDADAI MADHAVUN, IZQUIERDO EDUARDO J.: "Reinforcement learning beyond the Bellman equation: Exploring critic objectives using evolution", THE 2020 CONFERENCE ON ARTIFICIAL LIFE, MIT PRESS, CAMBRIDGE, MA, 1 January 2020 (2020-01-01) - 18 July 2020 (2020-07-18), Cambridge, MA, pages 441 - 449, XP093116275, DOI: 10.1162/isal_a_00338 * |
| MORATO P.G., PAPAKONSTANTINOU K.G., ANDRIOTIS C.P., NIELSEN J.S., RIGO P.: "Optimal inspection and maintenance planning for deteriorating structural components through dynamic Bayesian networks and Markov decision processes", STRUCTURAL SAFETY, ELSEVIER, AMSTERDAM, NL, vol. 94, 1 January 2022 (2022-01-01), AMSTERDAM, NL , pages 102140, XP093116280, ISSN: 0167-4730, DOI: 10.1016/j.strusafe.2021.102140 * |
Also Published As
| Publication number | Publication date |
|---|---|
| US12346795B2 (en) | 2025-07-01 |
| US20250111207A1 (en) | 2025-04-03 |
| US20250278611A1 (en) | 2025-09-04 |
Similar Documents
| Publication | Publication Date | Title |
|---|---|---|
| CN114297036B (en) | Data processing method, device, electronic equipment and readable storage medium | |
| Kankanala et al. | AdaBoost $^{+} $: An ensemble learning approach for estimating weather-related outages in distribution systems | |
| Ziari et al. | Prediction of pavement performance: Application of support vector regression with different kernels | |
| US9811778B2 (en) | Social collaboration in probabilistic prediction | |
| Cai et al. | Assessment and modelling of uncertainty in precipitation forecasts from TIGGE using fuzzy probability and Bayesian theory | |
| Saifullah et al. | Multi-agent deep reinforcement learning with centralized training and decentralized execution for transportation infrastructure management | |
| US20240242600A1 (en) | Infrastructure Sensor Processing | |
| US20250278611A1 (en) | Apparatus and method for improved inspection and/or maintenance management | |
| Jato-Espino et al. | Decision support model for the selection of asphalt wearing courses in highly trafficked roads | |
| CN106447103A (en) | Deep learning based QoS prediction method of Web service | |
| Wu et al. | Exploring factors affecting transport infrastructure performance: Data-driven versus knowledge-driven approaches | |
| Saifullah et al. | Deep reinforcement learning-based life-cycle management of deteriorating transportation systems | |
| CN106980874B (en) | A kind of multi-time Scales dimension data fusion method towards distribution big data | |
| Lai et al. | Fine‐scale simulation of spatial population distribution by coupling GA–ABM and big data: A case study of Dongguan, China | |
| US20230052540A1 (en) | Trend-informed demand forecasting | |
| CN119599211A (en) | A Power Grid Fault Prediction and Risk Assessment Method Based on Deep Learning | |
| Aman et al. | Influence-driven model for time series prediction from partial observations | |
| Mohammed Abdelkader et al. | Condition prediction of concrete bridge decks using Markov chain Monte Carlo-based method | |
| Bhattacharya et al. | Deep reinforcement learning-driven life-cycle management of bridge and pavement systems | |
| Jiang et al. | Predicting the pavement performance: A comparison on traditional and multivariate time series model | |
| Berardinelli et al. | An advanced highway asset management system | |
| CN121119452B (en) | Method for evaluating subway travel behavior toughness in stormy weather by considering influence of built environment | |
| CN121029391B (en) | Cloud edge end collaborative multi-mode data distributed management method | |
| Pospisil et al. | Business process simulation for predictions | |
| Terceno et al. | ECONOMIC-FINANCIAL FORECASTING MODEL OF BUSINESSES USING FUZZY RELATIONS. |
Legal Events
| Date | Code | Title | Description |
|---|---|---|---|
| 121 | Ep: the epo has been informed by wipo that ep was designated in this application |
Ref document number: 23816555 Country of ref document: EP Kind code of ref document: A1 |
|
| WWE | Wipo information: entry into national phase |
Ref document number: 18853426 Country of ref document: US |
|
| NENP | Non-entry into the national phase |
Ref country code: DE |
|
| WWP | Wipo information: published in national office |
Ref document number: 18853426 Country of ref document: US |
|
| 122 | Ep: pct application non-entry in european phase |
Ref document number: 23816555 Country of ref document: EP Kind code of ref document: A1 |
|
| WWG | Wipo information: grant in national office |
Ref document number: 18853426 Country of ref document: US |