WO2023233901A1 - 脈波信号処理装置、生体情報計測装置、及び押圧力異常判定方法 - Google Patents
脈波信号処理装置、生体情報計測装置、及び押圧力異常判定方法 Download PDFInfo
- Publication number
- WO2023233901A1 WO2023233901A1 PCT/JP2023/017001 JP2023017001W WO2023233901A1 WO 2023233901 A1 WO2023233901 A1 WO 2023233901A1 JP 2023017001 W JP2023017001 W JP 2023017001W WO 2023233901 A1 WO2023233901 A1 WO 2023233901A1
- Authority
- WO
- WIPO (PCT)
- Prior art keywords
- pulse wave
- light
- pressing force
- signal processing
- biological information
- Prior art date
- Legal status (The legal status is an assumption and is not a legal conclusion. Google has not performed a legal analysis and makes no representation as to the accuracy of the status listed.)
- Ceased
Links
Images


Classifications
-
- A—HUMAN NECESSITIES
- A61—MEDICAL OR VETERINARY SCIENCE; HYGIENE
- A61B—DIAGNOSIS; SURGERY; IDENTIFICATION
- A61B5/00—Measuring for diagnostic purposes; Identification of persons
- A61B5/02—Detecting, measuring or recording for evaluating the cardiovascular system, e.g. pulse, heart rate, blood pressure or blood flow
- A61B5/024—Measuring pulse rate or heart rate
- A61B5/02416—Measuring pulse rate or heart rate using photoplethysmograph signals, e.g. generated by infrared radiation
-
- A—HUMAN NECESSITIES
- A61—MEDICAL OR VETERINARY SCIENCE; HYGIENE
- A61B—DIAGNOSIS; SURGERY; IDENTIFICATION
- A61B5/00—Measuring for diagnostic purposes; Identification of persons
- A61B5/68—Arrangements of detecting, measuring or recording means, e.g. sensors, in relation to patient
- A61B5/6801—Arrangements of detecting, measuring or recording means, e.g. sensors, in relation to patient specially adapted to be attached to or worn on the body surface
- A61B5/6813—Specially adapted to be attached to a specific body part
- A61B5/6825—Hand
- A61B5/6826—Finger
-
- A—HUMAN NECESSITIES
- A61—MEDICAL OR VETERINARY SCIENCE; HYGIENE
- A61B—DIAGNOSIS; SURGERY; IDENTIFICATION
- A61B5/00—Measuring for diagnostic purposes; Identification of persons
- A61B5/68—Arrangements of detecting, measuring or recording means, e.g. sensors, in relation to patient
- A61B5/6801—Arrangements of detecting, measuring or recording means, e.g. sensors, in relation to patient specially adapted to be attached to or worn on the body surface
- A61B5/6843—Monitoring or controlling sensor contact pressure
-
- A—HUMAN NECESSITIES
- A61—MEDICAL OR VETERINARY SCIENCE; HYGIENE
- A61B—DIAGNOSIS; SURGERY; IDENTIFICATION
- A61B5/00—Measuring for diagnostic purposes; Identification of persons
- A61B5/72—Signal processing specially adapted for physiological signals or for diagnostic purposes
- A61B5/7235—Details of waveform analysis
- A61B5/7239—Details of waveform analysis using differentiation including higher order derivatives
-
- A—HUMAN NECESSITIES
- A61—MEDICAL OR VETERINARY SCIENCE; HYGIENE
- A61B—DIAGNOSIS; SURGERY; IDENTIFICATION
- A61B5/00—Measuring for diagnostic purposes; Identification of persons
- A61B5/72—Signal processing specially adapted for physiological signals or for diagnostic purposes
- A61B5/7235—Details of waveform analysis
- A61B5/7264—Classification of physiological signals or data, e.g. using neural networks, statistical classifiers, expert systems or fuzzy systems
-
- A—HUMAN NECESSITIES
- A61—MEDICAL OR VETERINARY SCIENCE; HYGIENE
- A61B—DIAGNOSIS; SURGERY; IDENTIFICATION
- A61B2560/00—Constructional details of operational features of apparatus; Accessories for medical measuring apparatus
- A61B2560/04—Constructional details of apparatus
- A61B2560/0462—Apparatus with built-in sensors
-
- A—HUMAN NECESSITIES
- A61—MEDICAL OR VETERINARY SCIENCE; HYGIENE
- A61B—DIAGNOSIS; SURGERY; IDENTIFICATION
- A61B2562/00—Details of sensors; Constructional details of sensor housings or probes; Accessories for sensors
- A61B2562/02—Details of sensors specially adapted for in-vivo measurements
- A61B2562/0233—Special features of optical sensors or probes classified in A61B5/00
-
- A—HUMAN NECESSITIES
- A61—MEDICAL OR VETERINARY SCIENCE; HYGIENE
- A61B—DIAGNOSIS; SURGERY; IDENTIFICATION
- A61B5/00—Measuring for diagnostic purposes; Identification of persons
- A61B5/02—Detecting, measuring or recording for evaluating the cardiovascular system, e.g. pulse, heart rate, blood pressure or blood flow
- A61B5/021—Measuring pressure in heart or blood vessels
Definitions
- the present invention relates to a pulse wave signal processing device, a biological information measuring device, and a pressing force abnormality determination method.
- Pulse waves propagating in arteries are used as an index for estimating a person's health condition.
- the pulse wave changes according to changes in blood flow at the measurement location.
- a wristwatch-type pulse wave signal processing device incorporating a pressure sensor is known to determine whether the pressing force is appropriate (Patent Document 1). This pulse wave signal processing device causes the display device to display the current level of pressing force detected by the pressure sensor. If the pressing force value is outside the appropriate range, the pulse wave signal processing device is vibrated to notify the user.
- a conventional pulse wave signal processing device is equipped with a pressure sensor to determine whether the pressing force is appropriate. As pulse wave signal processing devices become smaller, it may become difficult to attach a pressure sensor. In addition, since the mounting position of the pressure sensor is different from the mounting position of the light emitting element and light receiving element, even if the pressing force value at the pressure sensor position is appropriate, the pressing force at the mounting position of the light emitting element and light receiving element is It doesn't necessarily mean it's appropriate.
- a pulse wave feature calculation unit that calculates a pulse wave feature related to the steepness of the rise of the pulse wave measured by the photoplethysmogram sensor; Based on the value of the pulse wave feature calculated by the pulse wave feature calculation unit, it is determined whether the pressing force, which is the pressure with which the photoelectric pulse wave sensor is pressed against the measurement site, is within an appropriate range.
- a pulse wave signal processing device is provided, which includes a pressure determination section that performs the following steps.
- the above-mentioned pulse wave signal processing device, and the photoelectric pulse wave sensor that measures the pulse wave of the measured site and inputs the measurement result to the pulse wave signal processing device includes at least one light-emitting element and a light-receiving element that detects light output from the at least one light-emitting element that is reflected at the measured site or transmitted through the measured site.
- a biological information measuring device is provided.
- a pulse wave feature related to the steepness of the rise of the pulse wave measured by a photoplethysmogram sensor in contact with the measurement area is calculated, There is provided a pressing force abnormality determination method for determining whether or not a pressing force, which is the pressure with which the photoelectric pulse wave sensor is pressed against the measured region, is abnormal based on the value of the pulse wave feature obtained by calculation. Ru.
- FIG. 1 is a block diagram of a pulse wave signal processing device according to a first embodiment, and a schematic diagram of a biological information measuring device equipped with the pulse wave signal processing device.
- FIG. 2 is a graph showing an example of a pulse wave, a velocity pulse wave, and an acceleration pulse wave.
- FIG. 3 is a graph showing an example of a pulse wave and an accelerated pulse wave.
- 4A, FIG. 4B, FIG. 4C, and FIG. 4D show the results when the height from the heart to the measured part (finger) is changed, and when the measured part is adjusted to the chest height.
- FIG. 12 is a graph showing the relationship between the value of a pulse wave feature obtained from a pulse wave measured when the vicinity of the elbow on a certain side is cooled, and the systolic blood pressure measured at the wrist.
- FIG. 5 is a graph showing an example of the time change in the amount of light received by the light receiving element when near-infrared light is output from the light emitting element with the photoplethysmographic sensor in contact with the measurement target area. be.
- FIG. 6 is a graph showing the waveform shape of a pulse wave for approximately one beat when the pressing force of the photoplethysmogram sensor against the measurement site is within an appropriate range and when it is excessive.
- FIG. 7 is a graph showing a temporal change in the elapsed time from the peak of the a-wave to the peak of the b-wave of the pulse wave shown in FIG.
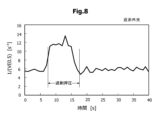
- FIG. 8 is a graph showing a temporal change in the pulse wave feature amount "1/(VE0.5)" calculated from the pulse wave shown in FIG.
- FIG. 9 is a graph showing a temporal change in the pulse wave feature amount "a/S” calculated from the pulse wave shown in FIG.
- FIG. 10 is a graph showing a temporal change in the pulse wave feature amount "(ab)/(ad)" calculated from the pulse wave shown in FIG.
- FIG. 11 is a flowchart showing the procedure of the pressing force abnormality determination method according to the first embodiment.
- FIG. 12 is a block diagram of a pulse wave signal processing device according to the second embodiment and a schematic diagram of a biological information measuring device including the pulse wave signal processing device.
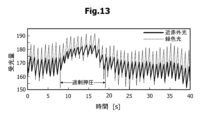
- Figure 13 shows the temporal change in the amount of light received by the light receiving element when near-infrared light and green light are output from the two light emitting elements with the photoplethysmogram sensor in contact with the measurement target area. It is a graph showing an example.
- FIG. 14 is a graph showing the waveform shape of a pulse wave caused by approximately one beat of green light when the pressing force of the photoplethysmogram sensor against the measurement site is within an appropriate range and when it is excessive.
- FIG. 15 is a graph showing a temporal change in the pulse wave feature amount "ab time" calculated from the pulse wave shown in FIG. 13.
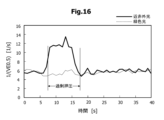
- FIG. 16 is a graph showing a temporal change in the pulse wave feature amount "1/(VE0.5)” calculated from the pulse wave shown in FIG. 13.
- FIG. 17 is a graph showing a temporal change in the pulse wave feature amount "a/S” calculated from the pulse wave shown in FIG. 13.
- FIG. 18 is a graph showing a temporal change in the pulse wave feature amount "(ab)/(ad)” calculated from the pulse wave shown in FIG. 13.
- FIG. 19 is a graph showing a pulse wave feature amount "ab time” calculated based on pulse waves acquired from a plurality of subjects.
- FIG. 20 is a graph showing a pulse wave feature amount "1/(VE0.5)” calculated based on pulse waves acquired from a plurality of subjects.
- FIG. 21 is a graph showing the pulse wave feature amount "a/S” calculated based on pulse waves acquired from a plurality of subjects.
- FIG. 22 is a graph showing the pulse wave feature amount "(ab)/(ad)" calculated based on pulse waves obtained from a plurality of subjects.
- FIG. 23 is a block diagram of a pulse wave signal processing device according to a modification of the second embodiment, and a schematic diagram of a biological information measuring device including the pulse wave signal processing device.
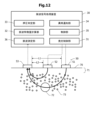
- FIG. 24 is a perspective view and a block diagram of a portion of the biological information measuring device according to the third embodiment.
- Pulse waves are used to measure various biological information. For example, it is used to measure pulse rate and oxygen saturation. In addition, it is also used to measure autonomic nervous function based on variations in pulse intervals, and to measure respiration rate based on baseline variations in pulse waves and pulse interval variations. Furthermore, a technique for estimating blood pressure from the waveform shape of a pulse wave has also been developed. Pulse waves are classified into pressure pulse waves (piezoelectric pulse waves) measured using a piezoelectric sensor or the like, and volume pulse waves (photoplethysm waves) measured using a photoplethysmographic sensor.
- pressure pulse waves piezoelectric pulse waves
- volume pulse waves photoplethysm waves
- the pulse wave signal processing device is applicable to both piezoelectric pulse waves and photoelectric pulse waves. More information can be obtained from photoplethysmography than from piezoelectric plethysmography.
- a photoplethysmogram will be explained as an example.
- FIG. 1 is a block diagram of a pulse wave signal processing device 30 according to the first embodiment, and a schematic diagram of a biological information measuring device equipped with the pulse wave signal processing device 30.
- the biological information measuring device includes a pulse wave signal processing device 30 and a photoelectric pulse wave sensor 50.
- Photoplethysmographic sensor 50 includes a light emitting element 51 and a light receiving element 53.
- the pulse wave signal processing device 30 includes a light emission control section 31, a pulse wave feature calculation section 32, a pressure determination section 33, an abnormality notification section 34, a control section 35, and a pulse wave measurement section 36.
- the light emitting element 51 and the light receiving element 53 are used in contact with the user's body surface 70.
- the light emitting element 51 irradiates measurement light toward the body surface 70 .
- the irradiated light is absorbed, reflected, or scattered (hereinafter sometimes simply referred to as "reflection") by the epidermal region 71, arterioles 72, and capillaries 73 within the body surface 70.
- a part of the reflected light enters the light receiving element 53.
- the arteriole 72 is a thin blood vessel with a diameter of, for example, 20 ⁇ m or more and 200 ⁇ m or less, and exists between the artery and the capillary blood vessel 73.
- a plurality of capillaries 73 branch from the arteriole 72.
- the capillary blood vessel 73 is a thin blood vessel with a diameter of about 10 ⁇ m, for example, and connects an artery and a vein.
- a plurality of capillaries 73 are distributed in an area shallower than the area where arterioles 72 are distributed. Note that the arrows shown in FIG.
- the light emitting element 51 outputs measurement light under the control of the light emission control section 31.
- a signal indicating the intensity of light measured by the light-receiving element 53 is input to the pulse wave feature calculation section 32.
- a signal indicating the intensity of light detected by the light receiving element 53 will be referred to as a "pulse wave signal".
- Arterial blood contains hemoglobin, and hemoglobin has the property of absorbing light for measurement. The amount of blood flow changes as the heart beats, and the amount of light absorbed changes in accordance with the change in blood flow. Therefore, the intensity of the pulse wave signal changes as the heart beats.
- the light emitting element 51 for example, one that outputs light in a wavelength range from blue to near infrared (a wavelength range of 450 nm or more and 950 nm or less) is used.
- a light emitting diode (LED), a vertical cavity surface emitting laser (VCSEL), or the like is used.
- VCSEL vertical cavity surface emitting laser
- PD photodiode
- a phototransistor or the like is used as the light receiving element 53.
- Light with wavelengths shorter than 450 nm can damage living tissues. In wavelengths longer than 950 nm, the absorbance of hemoglobin decreases. Therefore, it is preferable to use light in a wavelength range of 450 nm or more and 950 nm or less to obtain the pulse wave signal. Furthermore, an inexpensive Si photodiode can be used as the light receiving element 53 to detect light in this wavelength range.
- the control unit 35 controls the start and end of measurement, controls the display of measurement results, etc.
- the light emission control unit 31 controls pulsed light emission of the light emitting element 51.
- the light emitting element 51 is caused to emit pulsed light at a predetermined frequency of 100 Hz or more and 1000 Hz or less.
- the pulse wave measurement unit 36 generates a pulse wave waveform (hereinafter sometimes simply referred to as a "pulse wave") from the measurement result (pulse wave signal) input from the light receiving element 53.
- the pulse wave measurement unit 36 generates a pulse wave by reading the measured value of light intensity from the light receiving element 53 at a predetermined sampling rate in synchronization with the pulsed light emission of the light emitting element 51.
- the pulse wave feature calculation unit 32 calculates a pulse wave feature (hereinafter referred to as pulse wave feature) from the pulse wave generated by the pulse wave measurement unit 36.
- pulse wave feature a pulse wave feature
- the pulse wave is separated into individual beats, and the pulse wave feature quantity is determined from the pulse wave with each individual beat.
- Biological information is reflected in the pulse wave feature amount. Therefore, these biological information can be estimated from the pulse wave feature amount obtained by the pulse wave signal processing device 30.
- the pulse wave feature amount determined from the pulse wave actually measured using the photoplethysmographic sensor 50 is easily influenced by the pressing force of pressing the photoplethysmographic sensor 50 against the living body. Therefore, when estimating various biological information from pulse wave feature amounts, if the pressing force is not within an appropriate range, the reliability of the estimation results will decrease.
- the pressure determining unit 33 determines whether the pressing force of the light emitting element 51 and the light receiving element 53 against the body surface 70 is appropriate based on the pulse wave feature calculated by the pulse wave feature calculating unit 32.
- the abnormality notification unit 34 notifies the user of the abnormality of the pressing force. For example, an abnormality in the pressing force is notified by sound, vibration, light, etc.
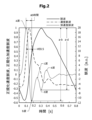
- FIG. 2 is a graph showing an example of a pulse wave, a velocity pulse wave, and an acceleration pulse wave.
- the pulse wave feature calculation unit 32 performs first-order differentiation and second-order differentiation of the pulse wave.
- the waveforms obtained by first-order differentiation and second-order differentiation of a pulse wave are referred to as a velocity pulse wave and an acceleration pulse wave, respectively.
- the velocity pulse wave is determined by numerically differentiating the intensity of the pulse wave, which is distributed discretely at time intervals corresponding to the sampling rate, by the time interval corresponding to the sampling rate.
- the acceleration pulse wave is determined by numerically differentiating the magnitude of the velocity pulse wave.
- the horizontal axis of Figure 2 represents time in units [s]
- the left vertical axis represents the magnitude of the velocity pulse wave and acceleration pulse wave normalized so that the maximum value is 1
- the right vertical axis represents the pulse wave. represents the size of in arbitrary units.
- a solid line, a long broken line, and a short broken line in the graph shown in FIG. 2 indicate a pulse wave, a velocity pulse wave, and an acceleration pulse wave, respectively.
- five peaks appear in an accelerated pulse wave within one beat.
- the 1st, 2nd, 3rd, 4th, and 5th peaks within one beat are called a wave, b wave, c wave, d wave, and e wave, respectively.
- FIG. 3 is a graph showing an example of a pulse wave and an accelerated pulse wave.
- the horizontal axis represents time, the left vertical axis represents the magnitude of the pulse wave in arbitrary units, and the right vertical axis represents the magnitude of the accelerated pulse wave in arbitrary units.
- 5 scales on the horizontal axis corresponds to 0.2 s.
- the ratio of the amplitude S of the pulse wave to the peak value a of the a wave of the accelerated pulse wave is denoted as "a/S”. Note that the amplitude S of the pulse wave corresponds to the difference between the minimum value and the maximum value after the waveform is corrected so that the minimum values of two consecutive pulse waves have the same magnitude.
- peripheral blood pressure blood pressure in peripheral arterioles and capillaries
- Peripheral blood pressure is sometimes used to mean blood pressure at the wrist or ankle measured with a cuff-type blood pressure monitor, but blood pressure measured at the wrist or ankle is a value measured in a large artery (such as the radial artery). This is different from the blood pressure measured in arterioles and capillaries in this specification.
- the pressure within the blood vessels decreases. The degree to which blood pressure decreases varies depending on the area to be measured, the user's blood vessel condition (arteriosclerosis condition, etc.), mental condition (autonomic nerve condition), environment (temperature, noise, etc.), type of clothing, etc.
- peripheral blood pressure has a positive correlation with blood pressure measured with a cuff-type sphygmomanometer in the upper arm or wrist under conditions where blood vessels are healthy and vascular resistance does not change.
- peripheral blood pressure decreases. Note that when peripheral blood vessels constrict and vascular resistance increases, blood pressure in the upper arm or wrist may increase.
- pulse wave feature quantities that reflect the above two features.
- VE0.5 full width at half maximum of the first upward peak of the velocity pulse wave
- a/S accelerated pulse wave
- pulse wave feature amounts are referred to as “peripheral blood pressure index.”
- the following feature quantities are available as pulse wave feature quantities that have characteristics similar to peripheral blood pressure indicators. ⁇ Reciprocal of the elapsed time from the peak of the A wave to the peak of the B wave (hereinafter referred to as "1/(ab time)”)
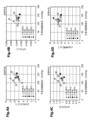
- FIG. 4A, FIG. 4B, FIG. 4C, and FIG. 4D show the results when the height from the heart to the measured part (finger) is changed, and when the measured part is adjusted to the chest height.
- 12 is a graph showing the relationship between the value of a pulse wave feature obtained from a pulse wave measured when the vicinity of the elbow on a certain side is cooled, and the systolic blood pressure measured at the wrist.
- near-infrared light was used to measure the pulse wave. The near-infrared light penetrates not only into the shallow region where the capillaries 73 shown in FIG. 1 are distributed, but also into the deep region where the arterioles 72 are distributed. Therefore, fluctuations in blood flow in both arterioles 72 and capillaries 73 are reflected in the measured pulse waves.
- the distance L1 means the straight-line distance from the light emitting location of the light emitting element 51 to the light receiving location of the light receiving element 53.
- the distance L1 becomes shorter, the amount of light received that is reflected from the body surface 70 of the measurement site in a very shallow region becomes relatively strong compared to the amount of light that is received that is reflected from a deep region. Therefore, the influence of blood flow in the arterioles 72 is less likely to appear on the pulse wave. Conversely, if the distance L1 becomes longer, the amount of light received by the light receiving element 53 will decrease. In order to ensure that the influence of the blood flow in the arteriole 72 is reflected in the pulse wave and to ensure a sufficient amount of light reception, it is preferable that the distance L1 be 5 mm or more and 20 mm or less.
- the horizontal axis of each graph from FIG. 4A to FIG. 4D represents the systolic blood pressure at the wrist in units of [mmHg].
- the vertical axis in FIG. 4A represents the pulse wave feature amount “1/(VE0.5)” in units [s ⁇ 1 ].
- the vertical axis in FIG. 4B represents the pulse wave feature amount "a/S” in arbitrary units.
- the vertical axis in FIG. 4C represents the pulse wave feature amount "(ab)/(ad)" dimensionlessly.
- the vertical axis in FIG. 4D represents the pulse wave feature amount 1/(ab time) in units of [s ⁇ 1 ].
- the results of measurements for three subjects A, B, and C are shown using triangular symbols, square symbols, and circle symbols, respectively.
- the three hollow symbols shown for each subject are pulse wave feature values obtained from pulse waves obtained by setting the height of the measurement site (finger) to the height of the belly button, chest, and face. shows the value of The value of the pulse wave feature value decreases in the order of height of the measurement site: abdomen, chest, and face.
- the black filled symbol for each subject indicates the value of the pulse wave feature obtained from the pulse wave obtained with the height of the measurement site set to chest height and the area near the elbow cooled. There is.
- each of the four pulse wave features has a generally positive correlation with the systolic blood pressure at the wrist when the height of the measurement site is changed, although the degree differs depending on the subject. .
- pulse wave feature quantities "1/(VE0.5)", “a/S”, and “(a-b)/(a-d)"
- cooling the elbow reduces the pulse wave feature quantity, and A tendency for systolic blood pressure to increase is confirmed. These trends are consistent with the characteristics of peripheral blood pressure described above. Note that the pulse wave feature amount "1/(ab time)" may increase when the elbow is cooled depending on the subject.
- the pulse wave feature values “1/(VE0.5)”, “a/S”, “(a-b)/(a-d)”, and “1/(ab time)” are the rise of the pulse wave. Depends on steepness. These feature amounts are not easily affected by the intensity of the pulse wave signal.
- the peak value a of the a wave and the peak value b, d of the b wave of the accelerated pulse wave which is the basis for calculating the pulse wave feature quantities "a/S” and "(a-b)/(a-d)”
- the peak value d of the wave and the amplitude S of the pulse wave each vary depending on the intensity of the pulse wave signal, but by taking the ratio of these, the influence of the intensity can be almost eliminated.
- FIG. 5 shows the amount of light received by the light receiving element 53 over time when near-infrared light is output from the light emitting element 51 with the photoplethysmographic sensor 50 (FIG. 1) in contact with the measurement target area. It is a graph showing an example of change (photoplethysmogram). The horizontal axis represents time in units [s], and the vertical axis represents the amount of received light on an arbitrary scale. A pulse wave appears in which the amount of light received increases and decreases with each beat.
- the generally known shape of a pulse wave is a triangular shape that is convex toward the top, but in FIG. 5, the top and bottom are reversed, and a triangular waveform that is convex toward the bottom is shown.
- the pressing force of the photoplethysmogram sensor 50 against the measurement site was made excessive. It can be seen that when the pressing force becomes excessive, the average value of the amount of light received increases and the amplitude of the pulse wave decreases. The increase in the average value of the amount of received light is due to the fact that the pressing force became excessive and blood flow was obstructed.
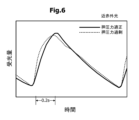
- FIG. 6 is a graph showing the waveform shape of a pulse wave for approximately one beat when the pressing force of the photoplethysmographic sensor 50 against the measurement site is within the appropriate range and when it is excessive.
- the horizontal axis represents time, and the vertical axis represents the amount of received light.
- the thick solid line and broken line in the graph indicate the pulse waves when the pressing force is within the appropriate range and when the pressing force is excessive, respectively.
- the waveforms are corrected so that their minimum values are approximately equal and their amplitudes are approximately equal. It can be seen that when the pressing force becomes excessive, the pulse wave rises more steeply than when the pressing force is normal. In this way, when the pressing force becomes excessive, the waveform shape of the pulse wave changes. It is possible to determine whether the pressing force is within an appropriate range based on a change in the steepness of the rise of the pulse wave.
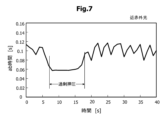
- FIG. 7 is a graph showing temporal changes in the elapsed time from the peak of the a-wave to the peak of the b-wave of the pulse wave shown in FIG. 5 (hereinafter referred to as the pulse wave feature quantity "ab time”).
- the horizontal axis represents time in units [s]
- the vertical axis represents the magnitude of the pulse wave feature amount "ab time” in units [s]. It can be seen that the "ab time” becomes shorter during the period when the pressing force is excessive. By detecting variations in this "ab time", it is possible to determine whether the pressing force is abnormal.
- the "ab time” is used as the pulse wave feature for determining abnormality in the pressing force.
- a determination threshold can be set in advance, and it can be determined that the pressing force is abnormal when the "ab time” is less than or equal to the determination threshold.
- the reciprocal of the pulse wave feature quantity "ab time” can be used to determine whether the pressing force is abnormal, and to determine that the pressing force is abnormal when the reciprocal of the "ab time” is greater than or equal to the determination threshold. be.
- FIG. 8 shows the pulse wave feature values “1/(VE0.5),” “a/S,” and “(ab)/” calculated from the pulse wave shown in FIG. 5, respectively.
- (ad)'' is a graph showing changes over time.
- the horizontal axis represents time in units of [s].
- the vertical axis in FIG. 8 represents the pulse wave feature amount "1/(VE0.5)” in units [s -1 ]
- the vertical axis in FIG. 9 represents the pulse wave feature amount "a/S” in arbitrary units.
- the vertical axis in FIG. 10 represents the pulse wave feature amount "(ab)/(ad)" dimensionlessly. It can be seen that all the pulse wave feature values are larger during the period when the pressing force is excessive than during the period when the pressing force is appropriate.
- pulse wave feature quantities are related to the steepness of the rise of the pulse wave. The reason why these feature amounts become large during a period when the pressing force is excessive can be explained as follows.
- the pulse wave feature values "1/(VE0.5)", “a/S”, and “(a-b)/(a-d)" become large, so for example, A threshold value is set, and when these pulse wave feature values are equal to or greater than the determination threshold value, it can be determined that the pressing force is abnormal.
- FIG. 11 is a flowchart showing the procedure of the pressing force abnormality determination method according to the first embodiment. Each procedure shown in FIG. 11 is executed by the pulse wave feature calculation unit 32 (FIG. 1).
- the pulse wave feature calculation unit 32 acquires a pulse wave signal from the light receiving element 53 (step S1). Thereafter, the pulse wave is first differentiated to obtain a velocity pulse wave, and the pulse wave is second differentiated to obtain an accelerated pulse wave (step S2). Based on the pulse wave, velocity pulse wave, and acceleration pulse wave, a pulse wave feature quantity is calculated for each heartbeat and stored (step S3). For example, the pulse wave feature amount "ab time” shown in FIG. 7, the pulse wave feature amount "1/(VE0.5)" shown in FIG. 8, the pulse wave feature amount "a/S” shown in FIG. 9, At least one of the pulse wave feature quantities "(ab)/(ad)" shown in FIG. 10 is calculated and stored.
- step S4 Based on the calculated pulse wave feature amount, it is determined whether the pressing force is abnormal (step S4). For example, by comparing the magnitude of the calculated pulse wave feature amount with a determination threshold value, it is determined whether the pressing force is abnormal (step S4). Note that, as the value of the pulse wave feature amount, an average value over a certain time or an average value over a certain number of beats of the values of the pulse wave feature amount calculated for each of a plurality of heartbeats up to the present time may be used.
- step S5 various biological information such as blood pressure is obtained based on the pulse wave, velocity pulse wave, and acceleration pulse wave.
- the peak time of the waveform of each beat is calculated, the peak time difference between beats is calculated, the pulse rate is calculated for each beat, and the autonomic nervous function is determined from the time series data of the pulse rate using the maximum entropy method etc. It is also possible.
- the procedure from step S1 to step S5 is repeated until the user performs a termination operation (step S7).
- the abnormality notification unit 34 (FIG. 1) is operated to notify the user of the abnormality (step S6), and the process ends.
- step S6 when the pressing force is abnormal, the user is notified of the abnormality (step S6), so the user is informed that the reliability of the calculated values of various indicators related to biological information will decrease due to the abnormal pressing force. You can know what you are doing. Furthermore, the user can adjust the pressing force so that it becomes normal.
- the first embodiment since information for determining whether the pressing force is abnormal is acquired from the pulse wave, there is no need to mount a pressure sensor for measuring the pressing force in the biological information measuring device. Therefore, it is possible to reduce the size and cost of the biological information measuring device.
- Another method for determining whether or not the pressing force is abnormal without using a pressure sensor is to determine whether or not the pressing force is abnormal based on the absolute value of the amount of light received by the light receiving element 53 (FIG. 1). It is possible. However, the absolute value of the amount of received light varies depending on the blood circulation state of the area to be measured. For example, when blood circulation is poor, the amount of light received increases. Furthermore, the absolute value of the amount of light received varies depending on the part to be measured. For example, the ventral side of the distal phalanx of the finger has a higher density of blood vessels than the dorsal side, middle phalanx, proximal phalanx, back of the hand, and wrist.
- the absolute value of the amount of light received varies depending on the blood vessel density of the measurement site. Furthermore, the absolute value of the amount of light received varies depending on the color of the skin. For example, if your skin has a lot of melanin and is dark, the amount of light it receives will decrease.
- the absolute value of the amount of received light is affected by various factors other than the pressing force, so the method of determining whether the pressing force is abnormal based on the absolute value of the amount of received light has poor accuracy. descend.
- the absolute value of the amount of light received is not used to determine whether the pressing force is normal, the influence of various factors that affect the intensity of the light receiving material is eliminated, and the determination accuracy is increased. It is possible to maintain
- at least one of "S” and “(a-b)/(a-d)” is used, other pulse wave feature amounts that are affected by the steepness of the rise of the pulse wave may be used.
- the measurement value of the pulse wave feature amount using near-infrared light is used to determine the abnormality of the pressing force, but when the pressing force becomes excessive, the pulse wave feature amount changes.
- Light may also be used as measurement light. Red light may be used in addition to near-infrared light. For example, light in a wavelength range of 600 nm or more and 950 nm or less may be used as the measurement light.
- step S4 if it is determined in step S4 (FIG. 11) that the pressing force is abnormal, the user is notified of the abnormality in the pressing force in step S6 (FIG. 11).
- step S6 displays various biological information calculated from pulse waves, such as pulse wave rate, oxygen saturation, autonomic nervous function, respiratory rate, blood pressure, vascular resistance, blood flow, peripheral blood pressure index, hemodynamics, blood sugar level, etc. , it may be possible to notify that the reliability of these measured values is low because the pressing force is abnormal. Furthermore, it is preferable to notify the user to reduce the pressing force.
- FIG. 12 is a block diagram of a pulse wave signal processing device 30 according to the second embodiment, and a schematic diagram of a biological information measuring device equipped with the pulse wave signal processing device 30.
- a photoplethysmographic sensor 50 includes one light emitting element 51 and one light receiving element 53.
- the photoplethysmographic sensor 50 of the biological information measuring device according to the second embodiment includes, in addition to the light emitting element 51, another light emitting element 52.
- the two light emitting elements 51 and 52 output light of mutually different wavelengths.
- one light emitting element 51 outputs near-infrared light with a wavelength of 850 nm or more and 950 nm or less
- the other light emitting element 52 outputs green light with a wavelength of 500 nm or more and 550 nm or less.
- a light emitting element that outputs light with a wavelength included in the wavelength range from blue to yellowish green may be used.
- the light emitting element 52 is arranged closer to the light emitting element 51 when viewed from the light receiving element 53.
- the distance from the light receiving element 53 to the light emitting element 52 is denoted as L2.
- Near-infrared light has less biological absorption than green light. Therefore, they penetrate deeper into the living body.
- the arrow pointing from the light-emitting element 52 to the light-receiving element 53 indicates that information regarding the blood flow in the capillaries 73 is reflected in the amount of light received by the light-receiving element 53, and information regarding the blood flow in the arterioles 72 is substantially reflected in the amount of light received by the light-receiving element 53. It expresses that it is not reflected.
- the distance L1 is preferably 5 mm or more and 20 mm or less.
- the distance L2 is preferably 1 mm or more and 3 mm or less in order to efficiently acquire information in a shallow region from the body surface 70.
- the light emission control unit 31 causes the two light emitting elements 51 and 52 to emit light at different timings.
- the pulse wave measurement unit 36 synchronizes the timing of receiving the received light intensity signal from the light receiving element 53 with the timing of light emission of the light emitting elements 51 and 52, thereby detecting pulse waves caused by near-infrared light and pulse waves caused by green light. Separate and obtain.
- FIG. 13 shows the amount of light received by the light-receiving element 53 when the light-emitting elements 51 and 52 output near-infrared light and green light, respectively, with the photoplethysmographic sensor 50 in contact with the site to be measured.
- 2 is a graph showing an example of a change over time.
- the horizontal axis represents time in units [s], and the vertical axis represents the amount of received light on an arbitrary scale.
- the thick solid line and broken line in the graph shown in FIG. 13 indicate the time change in the amount of received light (photoplethysmogram) when near-infrared light and green light are used as measurement light, respectively.
- the photoplethysmogram when near-infrared light is used as the measurement light is the same as the photoplethysmogram shown in FIG. 5.
- the average value of the amount of received light increases in the pulse wave generated by green light, as well as the pulse wave generated by near-infrared light, and the amplitude of the pulse wave decreases. It can be seen that is getting smaller.
- the increase in the average value of the amount of received light is due to the fact that the pressing force became excessive and blood flow was obstructed.
- FIG. 14 is a graph showing the waveform shape of a pulse wave caused by approximately one beat of green light when the pressing force of the photoplethysmographic sensor 50 against the measurement site is within the appropriate range and when it is excessive.
- the horizontal axis represents time, and the vertical axis represents the amount of received light.
- the thick solid line and broken line in the graph indicate the waveforms of the pulse wave when the pressing force is within the appropriate range and when it is excessive, respectively. It can be seen that changes due to changes in pressing force of pulse waves due to green light are smaller than changes due to changes in pressing force of pulse waves due to near-infrared light (FIG. 6). For example, the difference in the steepness of the rise of the waveform when the pressing force is appropriate and when the pressing force is excessive is smaller than when near-infrared light is used.
- FIG. 15 is a graph showing temporal changes in the pulse wave feature amount "ab time” calculated from the pulse wave shown in FIG. 13.
- the horizontal axis represents time in the unit [s]
- the vertical axis represents the pulse wave feature amount "ab time” in the unit [s].
- the thick solid line and broken line in the graph of FIG. 15 indicate the "ab time” calculated based on the pulse waves generated by near-infrared light and green light, respectively.
- the "ab time” calculated based on the pulse wave with green light is different from the "ab time” calculated based on the pulse wave with near-infrared light, and there is no noticeable change when the pressing force is excessive. Not confirmed.
- FIG. 16 shows the pulse wave feature values “1/(VE0.5)”, “a/S”, and “(ab)/” calculated from the pulse wave shown in FIG. 13, respectively.
- (ad)'' is a graph showing changes over time.
- the horizontal axis represents time in units of [s].
- the vertical axis in FIG. 16 represents the pulse wave feature amount "1/(VE0.5)” in units [s -1 ]
- the vertical axis in FIG. 17 represents the pulse wave feature amount "a/S” in arbitrary units.
- the vertical axis in FIG. 18 represents the pulse wave feature amount "(ab)/(ad)" dimensionlessly. Thick solid lines and broken lines in the graphs of FIGS.
- These pulse wave feature values calculated based on pulse waves using green light do not change significantly even when the pressing force becomes excessive compared to pulse wave feature values calculated based on pulse waves using near-infrared light. can not see. This is because, as shown in FIG. 14, the change in the pulse waveform when the pressing force is excessive is small.
- the pulse wave feature amount due to near-infrared light changes greatly, but the pulse wave feature amount due to green light changes significantly. I can't see any changes. That is, when the pressing force becomes excessive, the difference between the pulse wave feature amount by near-infrared light and the pulse wave feature amount by green light becomes larger than when the pressing force is within the appropriate range.
- the pressing force determination unit 33 (FIG. 12) compares the pulse wave feature amount using near-infrared light and the pulse wave feature amount using green light, and determines whether the pressing force is abnormal based on the comparison result between the two. .
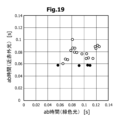
- FIGS. 19, 20, 21, and 22 show pulse wave feature quantities "ab time”, “1/(VE0.5)", and "a/ It is a graph showing "S" and "(ab)/(ad)".
- the horizontal axis of each graph represents the pulse wave feature amount calculated based on the pulse wave caused by green light
- the vertical axis represents the pulse wave feature amount calculated based on the pulse wave caused by infrared light.
- Hollow circles indicate pulse wave features based on pulse waves acquired when the pressing force is within an appropriate range
- filled-in circles indicate pulse wave features based on pulse waves acquired when the pressing force is excessive.
- the pulse wave feature values based on the figure are shown below.
- the pulse wave feature quantity "ab time” was almost the same when using near-infrared light and when using green light; '' is shorter than the pulse wave feature quantity ⁇ ab time'' due to green light for many subjects.
- the pulse wave feature amount "ab time” by near-infrared light is 0.06 s or less for all subjects for whom excessive pressing force was confirmed.
- the pulse wave feature amount "ab time” measured using near-infrared light is independent of the subject and can be said to be preferable as an index used to determine an abnormality in the pressing force.
- the pulse wave feature value "1/(VE0.5)” is almost the same when near-infrared light is used and when green light is used; It can be seen that for many subjects, the feature amount "1/(VE0.5)” is larger than the pulse wave feature amount "1/(VE0.5)” due to green light.
- the pulse wave feature value ⁇ 1/(VE0.5)'' by near-infrared light is larger than the pulse wave feature value ⁇ 1/(VE0.5)'' by green light. , some subjects with almost the same results were also confirmed.
- the pulse wave feature amount “a/S” shown in FIG. 21 and the pulse wave feature amount “(a-b)/(a-d)” shown in FIG. 22 are also the same as the pulse wave feature amount “1” shown in FIG. /(VE0.5)".
- the distribution of feature amounts shown in FIGS. 19, 20, and 22 can be explained as follows.
- the arterioles 72 will also be compressed and blood flow will be obstructed. Therefore, the difference between the pulse wave feature amount due to near-infrared light and the pulse wave feature amount due to green light becomes small. It is considered that the subject is in this state when the pressing force becomes excessive and the pulse wave feature amount due to near-infrared light and the pulse wave feature amount due to green light are approximately the same magnitude.
- the pulse wave feature value "ab time” using near-infrared light was determined for all subjects when the pressing force was excessive and when the pressing force was within the appropriate range. is smaller than the value. Therefore, when the determination threshold is set to a certain value and the measured value of the pulse wave feature amount "ab time” becomes equal to or less than the determination threshold, it can be determined that the pressing force is excessive.
- an estimation formula can be created in advance such that the degree of excessive pressing force increases as the pulse wave feature quantity "ab time” becomes shorter, and the excessive pressing force can be determined based on the measured value of the pulse wave feature quantity "ab time". It may also be possible to estimate the degree of
- abnormalities in the pressing force are determined by comparing the measured value of the pulse wave feature amount using near-infrared light and the measured value of the pulse wave feature amount using green light, so that the determination accuracy can be improved. can.
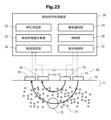
- FIG. 23 is a block diagram of a pulse wave signal processing device according to a modification of the second embodiment, and a schematic diagram of a biological information measuring device including the pulse wave signal processing device.
- one light receiving element 53 detects light output from two light emitting elements 51 and 52 that output light of different wavelengths and reflected at a measurement site.
- the photoplethysmographic sensor 50 includes two light receiving elements 53 and 54. The light output from one light emitting element 51 and reflected at the measured site is detected by one light receiving element 53, and the light output from the other light emitting element 52 and reflected at the measured site is detected by the other light receiving element 54. do.
- An optical filter is arranged on the light-receiving surface of one of the light-receiving elements 53, which transmits the light output from the light-emitting element 51 and blocks light in other wavelength ranges.
- An optical filter is arranged on the light receiving surface of the other light receiving element 54, which transmits the light output from the light emitting element 52 and blocks light in other wavelength ranges.
- the preferable ranges of the distance L1 from the light receiving element 53 to the light emitting element 51 and the distance L2 from the light receiving element 54 to the light emitting element 52 are the preferable ranges of the distances L1 and L2 in the biological information measuring device according to the second embodiment (FIG. 12), respectively. Same as range.
- a plurality of light receiving elements 53 and 54 may be arranged for a plurality of light emitting elements 51 and 52, respectively.
- FIG. 24 is a perspective view of a portion of the biological information measuring device and a block diagram of the pulse wave signal processing device 30 according to the third embodiment.
- Two light emitting elements 51 and 52 and one light receiving element 53 are attached to the inner surface of the annular mounting member 60.
- the attachment member 60 is used by being attached to a user's finger.
- the mounting member 60 is prepared in a plurality of sizes depending on the thickness of the user's fingers.
- the light emitting elements 51 and 52 output light toward the finger.
- the light receiving element 53 is attached at a position where the light reflected inside the finger is incident.
- the mounting member 60 further incorporates a light emission control section 31, a pulse wave measurement section 36, and a communication section 55.
- the light emission control section 31, the pulse wave measurement section 36, and the communication section 55 may be configured as one integrated circuit.
- the mounting member 60, the light emitting elements 51 and 52, the light receiving element 53, the light emission control section 31, the pulse wave measurement section 36, and the communication section 55 attached thereto will be referred to as a "ring device 61.”
- the functions of the pulse wave signal processing device 30 are realized by a ring device 61, a portable information terminal 62, and a server 63.
- the information terminal 62 for example, a smartphone, a tablet terminal, a notebook computer, etc. are used.
- the information terminal 62 includes a communication section 37, a control section 35, and an abnormality notification section 34.
- the server 63 includes a communication section 38, a pulse wave feature calculation section 32, and a pressure determination section 33.
- Data communication is performed between the communication unit 55 of the ring device 61 and the communication unit 37 of the information terminal 62, and between the communication unit 37 of the information terminal 62 and the communication unit 38 of the server 63.
- short-range wireless communication systems of various standards are used, for example.
- a communication network such as the Internet is used for communication between the information terminal 62 and the server 63.
- the light emission control unit 31 controls pulsed light emission of the light emitting elements 51 and 52.
- the pulse wave measuring section 36 reads the signal from the light receiving element 53.
- the light emission control section 31 of the ring device 61 receives a command from the control section 35 of the information terminal 62, and causes the light emitting elements 51 and 52 to emit light based on the received command.
- the pulse wave measurement unit 36 reads out the intensity signal of the light received from the light receiving element 53 and transmits it to the server 63 via the information terminal 62 .
- the pulse wave feature calculation unit 32 and the pressure determination unit 33 of the server 63 calculate the pulse wave feature based on the pulse wave and determine the pressure. Determine whether the pressure is abnormal.
- the press determination unit 33 transmits the determination result to the control unit 35 of the information terminal 62.
- the control unit 35 receives the determination result that the pressing force is abnormal, it controls the abnormality notification unit 34 to notify the user that the pressing force is abnormal.
- a gap will occur between the photoplethysmogram sensor 50 and the skin, making it impossible to stably measure the pulse wave signal. If the ring size is too small, the pressing force of the photoplethysmographic sensor 50 against the skin becomes excessive, reducing the reliability of the biological information estimation result.
- a method of selecting a ring device 61 of an appropriate size from ring devices 61 of a plurality of sizes will be described.
- the user sequentially wears a plurality of ring devices 61 of different sizes and operates the photoplethysmogram sensor 50 and the pulse wave signal processing device 30. It is preferable to select a ring device 61 of a slightly larger size, for example, one or two steps larger than the size of the ring device 61 when the pressing force was determined to be excessive, as the ring device 61 of the optimum size. By selecting a size one or two steps larger than the size for which the pressing force has been determined to be excessive, it is possible to avoid selecting a ring device 61 of an inappropriate size.
- fingers have relatively thin epidermis, they are suitable for acquiring pulse waves using the photoplethysmogram sensor 50. Furthermore, since the capillary path is less complicated than that of the face, the value of the pulse wave feature value is likely to be stable. Therefore, the reliability of various biological information obtained from pulse waves increases. Furthermore, when using the biological information measuring device continuously or intermittently, even if the ring device 61 is worn on the finger for a long time, an excellent effect can be obtained in that discomfort and discomfort are small.
- a ring device 61 of an appropriate size can be selected from a plurality of ring devices 61 of different sizes. By selecting the ring device 61 of an appropriate size, it becomes possible to stably measure the pulse wave and increase the reliability of the biological information estimation results.
- Part or all of the functions of the server 63 may be realized by the information terminal 62. Further, part of the functions of the information terminal 62 may be realized by the ring device 61.
- the function of the abnormality notification section 34 may be realized by the ring device 61.
- a vibration generator may be mounted on the mounting member 60, and when it is determined that the pressing force is abnormal, the vibration generator may be operated to vibrate the mounting member 60.
- the pressing force determining unit 33 creates in advance an estimation formula such that the degree of excessive pressing force increases as the pulse wave feature quantity "ab time" (FIG. 19) becomes shorter. It is preferable to have a function of estimating the degree of excessive pressing force from the measured value of the pulse wave feature quantity "ab time” and notifying the degree of excessive force.
- the abnormality notification unit 34 instructs the user to bend and straighten the fingers.
- the pressing force determining unit 33 determines whether the size of the ring device 61 is appropriate based on changes in the degree of excessive pressing force when the user is stretching and bending the finger, and the abnormality notification unit 34 determines whether the size of the ring device 61 is appropriate. Notify the user of the determination result. Thereby, it becomes possible to select a ring device 61 of an appropriate size with high precision using a simple method.
- the ring device 61 of the biological information measuring device according to the third embodiment is worn on a finger, but instead of the ring device 61, a device shaped to be worn on a part other than the finger may be used.
- a device shaped to be worn on a part other than the finger may be used.
- it may be a wearable device that is worn on the wrist, neck, face, ear, or the like.
- the biological information measuring device does not necessarily have to be wearable, and may be a device that measures biological information by pressing a finger against the photoplethysmographic sensor 50 as necessary.
- the biological information measuring device may be a portable device such as a smartphone, or a fixed device.
- the pulse wave signal processing device 30 determines whether the pressing force is within an appropriate range. It is preferable to determine whether or not this is the case.
- the photoelectric pulse wave sensor section of the biological information measuring device is a wearable device, when the wearable device is worn, the pulse wave signal processing device 30 determines whether the pressing force is within an appropriate range. It's good to do that.
- the wearable device is a wristband-type or wristwatch-type device that is worn on the wrist
- the pulse wave is measured when the wearable device is worn, and if it is determined that the pressing force is abnormal, the abnormality notification unit 34 It is a good idea to notify the person to loosen their belt.
- Pulse wave signal processing device 31 Light emission control section 32 Pulse wave feature calculation section 33 Pressure determination section 34 Abnormality notification section 35 Control section 36 Pulse wave measuring section 37, 38 Communication section 50 Photoelectric pulse wave sensor 51, 52 Light emitting element 53, 54 Light receiving element 55 Communication section 56 Control section 60 Mounting member 61 Ring device 62 Information terminal 63 Server 70 Body surface 71 Epidermal region 72 Arteriole 73 Capillary blood vessel
Landscapes
- Health & Medical Sciences (AREA)
- Life Sciences & Earth Sciences (AREA)
- Engineering & Computer Science (AREA)
- Physics & Mathematics (AREA)
- Biophysics (AREA)
- General Health & Medical Sciences (AREA)
- Veterinary Medicine (AREA)
- Public Health (AREA)
- Animal Behavior & Ethology (AREA)
- Surgery (AREA)
- Molecular Biology (AREA)
- Medical Informatics (AREA)
- Heart & Thoracic Surgery (AREA)
- Pathology (AREA)
- Biomedical Technology (AREA)
- Artificial Intelligence (AREA)
- Physiology (AREA)
- Signal Processing (AREA)
- Psychiatry (AREA)
- Computer Vision & Pattern Recognition (AREA)
- Cardiology (AREA)
- Evolutionary Computation (AREA)
- Mathematical Physics (AREA)
- Fuzzy Systems (AREA)
- Measuring Pulse, Heart Rate, Blood Pressure Or Blood Flow (AREA)
Priority Applications (3)
| Application Number | Priority Date | Filing Date | Title |
|---|---|---|---|
| CN202380043487.9A CN119343086A (zh) | 2022-06-01 | 2023-05-01 | 脉搏波信号处理装置、生物体信息测量装置以及按压力异常判定方法 |
| JP2024524257A JP7835285B2 (ja) | 2022-06-01 | 2023-05-01 | 脈波信号処理装置、生体情報計測装置、及び押圧力異常判定方法 |
| US18/950,638 US20250072836A1 (en) | 2022-06-01 | 2024-11-18 | Pulse wave signal processor, physiological information measurement device, and contact-pressure abnormality determination method |
Applications Claiming Priority (2)
| Application Number | Priority Date | Filing Date | Title |
|---|---|---|---|
| JP2022-089610 | 2022-06-01 | ||
| JP2022089610 | 2022-06-01 |
Related Child Applications (1)
| Application Number | Title | Priority Date | Filing Date |
|---|---|---|---|
| US18/950,638 Continuation US20250072836A1 (en) | 2022-06-01 | 2024-11-18 | Pulse wave signal processor, physiological information measurement device, and contact-pressure abnormality determination method |
Publications (1)
| Publication Number | Publication Date |
|---|---|
| WO2023233901A1 true WO2023233901A1 (ja) | 2023-12-07 |
Family
ID=89026396
Family Applications (1)
| Application Number | Title | Priority Date | Filing Date |
|---|---|---|---|
| PCT/JP2023/017001 Ceased WO2023233901A1 (ja) | 2022-06-01 | 2023-05-01 | 脈波信号処理装置、生体情報計測装置、及び押圧力異常判定方法 |
Country Status (4)
| Country | Link |
|---|---|
| US (1) | US20250072836A1 (https=) |
| JP (1) | JP7835285B2 (https=) |
| CN (1) | CN119343086A (https=) |
| WO (1) | WO2023233901A1 (https=) |
Cited By (1)
| Publication number | Priority date | Publication date | Assignee | Title |
|---|---|---|---|---|
| WO2025253862A1 (ja) * | 2024-06-06 | 2025-12-11 | 株式会社村田製作所 | 低押圧力通知装置 |
Families Citing this family (1)
| Publication number | Priority date | Publication date | Assignee | Title |
|---|---|---|---|---|
| CN119279550B (zh) * | 2024-12-13 | 2025-09-12 | 成都维客昕微电子有限公司 | 一种可穿戴设备佩戴环境检测方法及系统 |
Citations (5)
| Publication number | Priority date | Publication date | Assignee | Title |
|---|---|---|---|---|
| JP2004313409A (ja) * | 2003-04-15 | 2004-11-11 | Omron Healthcare Co Ltd | 脈波測定装置および脈波測定装置制御プログラム |
| JP2013202059A (ja) * | 2012-03-27 | 2013-10-07 | Seiko Epson Corp | 脈拍計及びプログラム |
| JP2014068836A (ja) * | 2012-09-28 | 2014-04-21 | Bifristec Kk | 検体情報検出ユニット、並びに電動歯ブラシ装置、及び電動シェーバー装置 |
| JP2020010881A (ja) * | 2018-07-19 | 2020-01-23 | 日本電気株式会社 | 検出装置、ウェアラブルセンシングデバイス、検出方法、およびプログラム |
| CN210249821U (zh) * | 2019-04-22 | 2020-04-07 | 深圳驰越科技有限公司 | 一种指压式血压心率测量器 |
-
2023
- 2023-05-01 CN CN202380043487.9A patent/CN119343086A/zh active Pending
- 2023-05-01 WO PCT/JP2023/017001 patent/WO2023233901A1/ja not_active Ceased
- 2023-05-01 JP JP2024524257A patent/JP7835285B2/ja active Active
-
2024
- 2024-11-18 US US18/950,638 patent/US20250072836A1/en active Pending
Patent Citations (5)
| Publication number | Priority date | Publication date | Assignee | Title |
|---|---|---|---|---|
| JP2004313409A (ja) * | 2003-04-15 | 2004-11-11 | Omron Healthcare Co Ltd | 脈波測定装置および脈波測定装置制御プログラム |
| JP2013202059A (ja) * | 2012-03-27 | 2013-10-07 | Seiko Epson Corp | 脈拍計及びプログラム |
| JP2014068836A (ja) * | 2012-09-28 | 2014-04-21 | Bifristec Kk | 検体情報検出ユニット、並びに電動歯ブラシ装置、及び電動シェーバー装置 |
| JP2020010881A (ja) * | 2018-07-19 | 2020-01-23 | 日本電気株式会社 | 検出装置、ウェアラブルセンシングデバイス、検出方法、およびプログラム |
| CN210249821U (zh) * | 2019-04-22 | 2020-04-07 | 深圳驰越科技有限公司 | 一种指压式血压心率测量器 |
Cited By (1)
| Publication number | Priority date | Publication date | Assignee | Title |
|---|---|---|---|---|
| WO2025253862A1 (ja) * | 2024-06-06 | 2025-12-11 | 株式会社村田製作所 | 低押圧力通知装置 |
Also Published As
| Publication number | Publication date |
|---|---|
| CN119343086A (zh) | 2025-01-21 |
| JPWO2023233901A1 (https=) | 2023-12-07 |
| US20250072836A1 (en) | 2025-03-06 |
| JP7835285B2 (ja) | 2026-03-25 |
Similar Documents
| Publication | Publication Date | Title |
|---|---|---|
| KR101040653B1 (ko) | 비접촉 광용적맥파 측정장치와 이를 이용한 산소포화도 측정장치 및 혈압 측정장치 | |
| CN106231995B (zh) | 脉搏波传播时间测量装置及生命体状态推定装置 | |
| JP6662459B2 (ja) | 血圧状態測定装置 | |
| CN105078438B (zh) | 脉搏周期检测设备和方法和可穿戴电子设备 | |
| JP6729704B2 (ja) | 血圧推定装置 | |
| CN112040846A (zh) | 基于光电体积描记(ppg)信号估计血压和动脉硬化度的方法 | |
| JP2018501016A (ja) | ウェアラブル血行動態センサ | |
| JP2015503933A (ja) | 身体に装着可能な脈拍計/酸素濃度計 | |
| WO2014089665A1 (en) | System for measurement of cardiovascular health | |
| US20250072836A1 (en) | Pulse wave signal processor, physiological information measurement device, and contact-pressure abnormality determination method | |
| KR20190105421A (ko) | 광혈류 측정기 기반의 인체착용형 혈압 측정장치 및 혈압 측정방법 | |
| JP2006239114A (ja) | カフレス電子血圧計 | |
| CN110192846B (zh) | 可穿戴设备 | |
| KR20190030152A (ko) | 생체정보 측정 장치 및 방법 | |
| US20220087609A1 (en) | In-ear biometric monitoring using photoplethysmography (ppg) | |
| JP7133576B2 (ja) | 位相差法による連続血圧測定システム | |
| JP6626408B2 (ja) | 血流量測定装置および血流量測定方法 | |
| KR20200129811A (ko) | 혈압 측정 시스템 및 이를 이용한 혈압 측정 방법 | |
| US20240423547A1 (en) | Blood pressure estimation method and biological information measurement system | |
| US20240366097A1 (en) | Hemodynamic state estimation method | |
| JP2004081285A (ja) | 携帯型血圧測定装置 | |
| JP7776014B2 (ja) | 脈圧測定装置及び脈圧測定方法 | |
| JP7708307B2 (ja) | 末梢血圧推定方法および生体情報測定システム | |
| JP7790584B2 (ja) | 血管内皮機能評価システム、及び血管内皮機能評価装置 | |
| JP2000225097A (ja) | 携帯型血圧計 |
Legal Events
| Date | Code | Title | Description |
|---|---|---|---|
| 121 | Ep: the epo has been informed by wipo that ep was designated in this application |
Ref document number: 23815662 Country of ref document: EP Kind code of ref document: A1 |
|
| ENP | Entry into the national phase |
Ref document number: 2024524257 Country of ref document: JP Kind code of ref document: A |
|
| WWE | Wipo information: entry into national phase |
Ref document number: 202380043487.9 Country of ref document: CN |
|
| NENP | Non-entry into the national phase |
Ref country code: DE |
|
| WWP | Wipo information: published in national office |
Ref document number: 202380043487.9 Country of ref document: CN |
|
| 122 | Ep: pct application non-entry in european phase |
Ref document number: 23815662 Country of ref document: EP Kind code of ref document: A1 |