WO2023218962A1 - 電力系統計画運用装置、及び電力系統計画運用方法 - Google Patents
電力系統計画運用装置、及び電力系統計画運用方法 Download PDFInfo
- Publication number
- WO2023218962A1 WO2023218962A1 PCT/JP2023/016462 JP2023016462W WO2023218962A1 WO 2023218962 A1 WO2023218962 A1 WO 2023218962A1 JP 2023016462 W JP2023016462 W JP 2023016462W WO 2023218962 A1 WO2023218962 A1 WO 2023218962A1
- Authority
- WO
- WIPO (PCT)
- Prior art keywords
- typhoon
- countermeasure
- power
- data
- reliability
- Prior art date
- Legal status (The legal status is an assumption and is not a legal conclusion. Google has not performed a legal analysis and makes no representation as to the accuracy of the status listed.)
- Ceased
Links
Images












Classifications
-
- G—PHYSICS
- G06—COMPUTING OR CALCULATING; COUNTING
- G06Q—INFORMATION AND COMMUNICATION TECHNOLOGY [ICT] SPECIALLY ADAPTED FOR ADMINISTRATIVE, COMMERCIAL, FINANCIAL, MANAGERIAL OR SUPERVISORY PURPOSES; SYSTEMS OR METHODS SPECIALLY ADAPTED FOR ADMINISTRATIVE, COMMERCIAL, FINANCIAL, MANAGERIAL OR SUPERVISORY PURPOSES, NOT OTHERWISE PROVIDED FOR
- G06Q50/00—Information and communication technology [ICT] specially adapted for implementation of business processes of specific business sectors, e.g. utilities or tourism
- G06Q50/06—Energy or water supply
-
- H—ELECTRICITY
- H02—GENERATION; CONVERSION OR DISTRIBUTION OF ELECTRIC POWER
- H02J—ELECTRIC POWER NETWORKS; CIRCUIT ARRANGEMENTS OR SYSTEMS FOR SUPPLYING OR DISTRIBUTING ELECTRIC POWER; SYSTEMS FOR STORING ELECTRIC ENERGY
- H02J13/00—Circuit arrangements for providing remote monitoring or remote control of equipment in a power distribution network
-
- H—ELECTRICITY
- H02—GENERATION; CONVERSION OR DISTRIBUTION OF ELECTRIC POWER
- H02J—ELECTRIC POWER NETWORKS; CIRCUIT ARRANGEMENTS OR SYSTEMS FOR SUPPLYING OR DISTRIBUTING ELECTRIC POWER; SYSTEMS FOR STORING ELECTRIC ENERGY
- H02J13/00—Circuit arrangements for providing remote monitoring or remote control of equipment in a power distribution network
- H02J13/12—Monitoring network conditions, e.g. electrical magnitudes or operational status
-
- H—ELECTRICITY
- H02—GENERATION; CONVERSION OR DISTRIBUTION OF ELECTRIC POWER
- H02J—ELECTRIC POWER NETWORKS; CIRCUIT ARRANGEMENTS OR SYSTEMS FOR SUPPLYING OR DISTRIBUTING ELECTRIC POWER; SYSTEMS FOR STORING ELECTRIC ENERGY
- H02J3/00—Circuit arrangements for AC mains or AC distribution networks
-
- H—ELECTRICITY
- H02—GENERATION; CONVERSION OR DISTRIBUTION OF ELECTRIC POWER
- H02J—ELECTRIC POWER NETWORKS; CIRCUIT ARRANGEMENTS OR SYSTEMS FOR SUPPLYING OR DISTRIBUTING ELECTRIC POWER; SYSTEMS FOR STORING ELECTRIC ENERGY
- H02J3/00—Circuit arrangements for AC mains or AC distribution networks
- H02J3/001—Arrangements for handling faults or abnormalities, e.g. emergencies or contingencies
- H02J3/0012—Arrangements for handling faults or abnormalities, e.g. emergencies or contingencies characterised by the contingency detection means in AC networks, e.g. using phasor measurement units [PMU], synchrophasors or contingency analysis
-
- H—ELECTRICITY
- H02—GENERATION; CONVERSION OR DISTRIBUTION OF ELECTRIC POWER
- H02J—ELECTRIC POWER NETWORKS; CIRCUIT ARRANGEMENTS OR SYSTEMS FOR SUPPLYING OR DISTRIBUTING ELECTRIC POWER; SYSTEMS FOR STORING ELECTRIC ENERGY
- H02J3/00—Circuit arrangements for AC mains or AC distribution networks
- H02J3/001—Arrangements for handling faults or abnormalities, e.g. emergencies or contingencies
- H02J3/00125—Transmission line or load transient problems, e.g. overvoltage, resonance or self-excitation of inductive loads
-
- H—ELECTRICITY
- H02—GENERATION; CONVERSION OR DISTRIBUTION OF ELECTRIC POWER
- H02J—ELECTRIC POWER NETWORKS; CIRCUIT ARRANGEMENTS OR SYSTEMS FOR SUPPLYING OR DISTRIBUTING ELECTRIC POWER; SYSTEMS FOR STORING ELECTRIC ENERGY
- H02J3/00—Circuit arrangements for AC mains or AC distribution networks
- H02J3/18—Arrangements for adjusting, eliminating or compensating reactive power in networks
-
- H—ELECTRICITY
- H02—GENERATION; CONVERSION OR DISTRIBUTION OF ELECTRIC POWER
- H02J—ELECTRIC POWER NETWORKS; CIRCUIT ARRANGEMENTS OR SYSTEMS FOR SUPPLYING OR DISTRIBUTING ELECTRIC POWER; SYSTEMS FOR STORING ELECTRIC ENERGY
- H02J3/00—Circuit arrangements for AC mains or AC distribution networks
- H02J3/38—Arrangements for feeding a single network from two or more generators or sources in parallel; Arrangements for feeding already energised networks from additional generators or sources in parallel
- H02J3/46—Controlling the sharing of generated power between the generators, sources or networks
-
- H—ELECTRICITY
- H02—GENERATION; CONVERSION OR DISTRIBUTION OF ELECTRIC POWER
- H02J—ELECTRIC POWER NETWORKS; CIRCUIT ARRANGEMENTS OR SYSTEMS FOR SUPPLYING OR DISTRIBUTING ELECTRIC POWER; SYSTEMS FOR STORING ELECTRIC ENERGY
- H02J2103/00—Details of circuit arrangements for mains or AC distribution networks
- H02J2103/30—Simulating, planning, modelling, reliability check or computer assisted design [CAD] of electric power networks
-
- H—ELECTRICITY
- H02—GENERATION; CONVERSION OR DISTRIBUTION OF ELECTRIC POWER
- H02J—ELECTRIC POWER NETWORKS; CIRCUIT ARRANGEMENTS OR SYSTEMS FOR SUPPLYING OR DISTRIBUTING ELECTRIC POWER; SYSTEMS FOR STORING ELECTRIC ENERGY
- H02J2103/00—Details of circuit arrangements for mains or AC distribution networks
- H02J2103/30—Simulating, planning, modelling, reliability check or computer assisted design [CAD] of electric power networks
- H02J2103/35—Grid-level management of power transmission or distribution systems, e.g. load flow analysis or active network management
Definitions
- the present invention relates to a power system planning and operating device and a power system planning and operating method.
- Patent Document 1 describes a weather data observation meter installed at various locations on a power distribution line to actually measure weather data;
- the management server includes a management server that receives data, and a damage history database in which a history of past damage details is recorded together with the damage location and the weather conditions at that time, and the management server has a damage prediction target area that sets a damage prediction target area.
- a setting means a typhoon information acquisition means for acquiring typhoon information from a typhoon information transmission source, and the setting by taking into account the typhoon information acquired by the typhoon information acquisition means and the weather data actually measured by the weather data observation device.
- a typhoon damage prediction support system is described, which is characterized by comprising: a damage content prediction means for predicting damage details based on the damage history database; and a damage content recording means for recording the predicted damage details.
- Patent Document 1 With the technology of Patent Document 1, it is possible to reduce the damage caused by a typhoon by optimizing the response after an accident, but it is possible to reduce the damage caused by a typhoon by optimizing the response after an accident. cannot be taught.
- the purpose of the present invention is to provide a power system planning and operating device that can reduce social costs such as damage to overhead lines caused by a typhoon and improve resilience even before an accident caused by a typhoon and the accompanying power outage occur;
- the objective is to provide a method for power system planning and operation.
- the power system planning and operation device of the present invention calculates power generation for each typhoon countermeasure case based on typhoon information data including at least course information and wind speed of the typhoon, and grid operation countermeasure candidate data including power plant output information.
- a typhoon countermeasure candidate calculation unit that calculates typhoon countermeasure candidate calculation result data including changed values of the output of the typhoon countermeasure candidate; and a typhoon countermeasure candidate calculation unit that calculates the typhoon countermeasure candidate calculation result data, the typhoon countermeasure candidate calculation result data, system data indicating the system configuration, damage cost data due to power outage, and weights for the effects of power outage.
- a reliability economy index value calculation unit that calculates reliability economy index value calculation result data, which is an index value of reliability economy, from reliability economy index data indicating reliability economy index value, and said reliability economy index value calculation result data.
- a typhoon countermeasure decision unit that obtains typhoon countermeasure decision result data from the system.
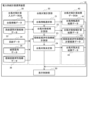
- FIG. 1 is a diagram showing a functional configuration of a power system planning and operation device according to a first embodiment
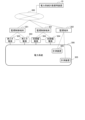
- FIG. 1 is a diagram showing a power system planning and operating system to which the power system planning and operating device of Example 1 is applied
- FIG. 1 is a diagram illustrating a hardware configuration of a power system planning and operating device according to a first embodiment
- FIG. It is a diagram showing the configuration of a typhoon countermeasure calculation program. It is a figure showing the composition of typhoon information data of typhoon countermeasure calculation input data DB.
- FIG. 1 is a diagram showing a functional configuration of a power system planning and operation device according to a first embodiment
- FIG. 1 is a diagram showing a power system planning and operating system to which the power system planning and operating device of Example 1 is applied
- FIG. 1 is a diagram illustrating a hardware configuration of a power system planning and operating device according to a first embodiment
- FIG. It is a diagram showing the configuration of a typho
- 3 is a diagram showing that the probability of occurrence is expressed by a probability distribution function of the probability of collapse of a steel tower with respect to wind speed. It is a figure showing the composition of grid operation countermeasure candidate data of typhoon countermeasure calculation input data DB. It is a figure showing the structure of damage cost data of typhoon countermeasure calculation input data DB. It is a figure showing the composition of reliability economic efficiency index data of typhoon countermeasure calculation input data DB. It is a figure showing the composition of typhoon countermeasure candidate calculation result data of typhoon countermeasure calculation result data DB. It is a figure showing the composition of reliability economic efficiency index value calculation result data of typhoon countermeasure calculation result data DB.
- FIG. 2 is a diagram illustrating a processing flow of a typhoon countermeasure calculation unit of the power system planning and operation device.
- FIG. 3 is a diagram illustrating an example of a display output by a display control unit to a display unit. It is a figure which shows the other example of a display which a display control part outputs to a display part.
- FIG. 2 is a diagram showing the functional configuration of a power system planning and operation device and the functional configuration of a central power dispatch command system in Example 2.
- FIG. 18 is a diagram illustrating a power system planning and operating system according to a second embodiment to which the power system planning and operating device and the central power supply command system described in FIG. 17 are applied.
- FIG. FIG. 3 is a diagram showing a functional configuration of a power system planning and operating device in Example 3;
- FIG. 3 is a diagram showing the structure of candidate data for system improvement measures when the type of system improvement measure is transmission line expansion.
- FIG. 7 is a diagram showing the structure of candidate data for system improvement measures when the type of system improvement measure is substation expansion. It is a figure which shows the structure of system improvement measure candidate data when the system improvement measure type is phase adjustment equipment expansion.
- FIG. 3 is a diagram showing a functional configuration of a power system planning and operating device in Example 3
- FIG. 3 is a diagram showing the structure of candidate data for system improvement measures when the type of system improvement measure is transmission line expansion.
- FIG. 7 is a diagram showing the structure of candidate data for system improvement measures when the type of system improvement measure is substation expansion. It
- FIG. 3 is a diagram illustrating typhoon countermeasure candidate calculation result data that is stored for each typhoon countermeasure case and stores information on system maintenance measures and system operation measures.
- FIG. 7 is a diagram illustrating other typhoon countermeasure candidate calculation result data that is stored for each typhoon countermeasure case and stores information on system maintenance measures and system operation measures.
- FIG. 3 is a diagram showing a hardware configuration of a power system planning and operating device according to a third embodiment.
- FIG. 7 is a diagram showing the functional configuration of a power system planning operation device and the central power dispatch command system in Example 4.
- FIG. 24 is a diagram showing a power system planning and operating system according to a fifth embodiment to which the power system planning and operating device and system planning system described in FIG. 24 are applied.
- FIG. 1 is a diagram showing the relationship between the power system diagram and the predicted course of the typhoon when a typhoon is approaching.
- the power system diagram in FIG. 1 shows a map of power plants, substations, and power transmission lines that connect them. As a typhoon passes, power transmission towers may collapse, cutting off power transmission and causing power outages.
- the power system planning and operating device 10 predicts power transmission interruption due to the collapse of a power transmission tower based on the storm area and maximum wind speed of the predicted course of the typhoon, and changes system operation such as changing the power transmission route or power plant output. Prevent power outages.
- the power system planning and operation device 10 Predict power transmission interruptions at predetermined intervals and change system operation.
- the solid line circle is a storm area
- the broken line circle is a forecast circle.
- the power system planning operation device 10 may be able to change the system operation so that the output of the B power plant and the A power plant is replaced by increasing the output of another power plant.
- the power system planning operation device 10 may be able to change the system operation so that the output of the B power plant and the A power plant is replaced by increasing the output of another power plant.
- the impact of a power outage varies depending on the region.
- the number of power plants is large, the number of combinations of conditions for changing system operation becomes large.
- the power system planning and operation device 10 calculates reliability economic index values for a plurality of system operation candidates, and obtains typhoon countermeasure results based on the index values.
- the power system planning and operation device 10 calculates the results of typhoon countermeasures based on the path of past typhoons, including the expansion of power system transmission lines, substations, phase adjustment equipment, etc. , optimize the expansion of substations, phase adjustment equipment, etc.
- FIG. 2 is a diagram showing the functional configuration of the power system planning and operation device 10 in the first embodiment.
- the power system planning operation device 10 obtains typhoon countermeasures using a typhoon countermeasure calculation input data DB30, which is a database (hereinafter referred to as DB) that stores calculation input data for typhoon countermeasures due to typhoons, and the typhoon countermeasure calculation input data DB30.
- the typhoon countermeasure calculation unit 20, the typhoon countermeasure calculation result data DB 40 that stores the typhoon countermeasures obtained by the typhoon countermeasure calculation unit 20, and the display control when displaying the typhoon countermeasure results on the display unit 105 (FIG. 4) to be described later. It consists of a display control section 50.
- the typhoon countermeasure calculation unit 20 selects typhoon information using the typhoon countermeasure calculation input data DB 30, calculates typhoon countermeasure candidates for the selected typhoon information, and calculates reliability economic efficiency index values for the calculated typhoon countermeasure candidates. is calculated, typhoon countermeasures are determined based on the calculated reliability economy index value, and the typhoon countermeasure results are stored in the typhoon countermeasure calculation result data DB 40.
- the typhoon countermeasure calculation input data DB 30 stores typhoon information data 31, grid operation countermeasure candidate data 33, grid data 34, damage cost data 35, and reliability economic efficiency index data 36.
- the typhoon information data 31 which will be described in detail later with reference to FIG. 6, is information indicating the predicted course and scale (maximum wind speed, etc.) of the typhoon that has occurred.
- the grid operation countermeasure candidate data 33 which will be described in detail later with reference to FIG. 8, is information indicating candidates for operational changes in response to typhoon damage at facilities such as power plants in the grid.
- the system data 34 includes system configuration, line impedance (R + j This data is necessary for state estimation and time-series change calculations.
- the damage cost data 35 which will be described in detail later with reference to FIG. 9, is information indicating costs etc. associated with a power outage at a substation.
- the reliability economy index data 36 which will be described in detail later with reference to FIG. 10, is information indicating the weight of each type of reliability economy.
- the typhoon countermeasure calculation unit 20 which will be described later, scores important facilities that need to avoid power outages as much as possible to maintain society as reliability economic index data 36, and quantifies reliability economic index values for typhoon countermeasure candidates. Calculate accurately.
- the typhoon countermeasure calculation result data DB 40 stores typhoon information selection result data 41, typhoon countermeasure candidate calculation result data 42, reliability economic index value calculation result data 43, and typhoon countermeasure determination result data 44.
- the typhoon information selection result data 41 is typhoon information from which the power system planning and operation device 10 of the embodiment has determined typhoon countermeasure candidates.
- the typhoon countermeasure candidate calculation result data 42 which will be described in detail later with reference to FIG. 11, is information indicating the calculation results of typhoon countermeasures determined by the power system planning and operation device 10 of the embodiment.
- the reliability economic efficiency index value calculation result data 43 which will be described in detail later in FIG. This information is associated with the typhoon countermeasure candidate calculation result data 42.
- the typhoon countermeasure decision result data 44 which will be described in detail later with reference to FIG. This is information on the selection results of typhoon countermeasure cases. This makes it possible to compare the calculation results of the reliability and economy index values for the typhoon countermeasure cases, and to easily confirm the selection results and reasons for selection.
- the information stored in the typhoon countermeasure calculation result data DB 40 includes not only data as calculation results but also data at the time of intermediate processing, and can be used as appropriate.
- the typhoon countermeasure calculation unit 20 is a processing unit that calculates typhoon countermeasures, and is composed of a typhoon information selection unit 21, a typhoon countermeasure candidate calculation unit 22, a reliability economy index value calculation unit 23, and a typhoon countermeasure determination unit 24.
- the processing contents of the typhoon countermeasure calculation unit 20 will be explained in detail with reference to FIG. 14.
- the typhoon information selection unit 21 selects typhoon information for which typhoon countermeasures are required from the typhoon information data 31 and outputs the selection result to the typhoon information selection result data 41.
- the typhoon countermeasure candidate calculation unit 22 calculates typhoon countermeasure candidates related to grid operation based on the typhoon information selected by the typhoon information selection unit 21 and using the grid operation countermeasure candidate data 33. Output as .
- the reliability economic efficiency index value calculation unit 23 uses the system data 34, damage cost data 35, and reliability economic efficiency index data 36 to calculate the reliability of the typhoon countermeasure candidates related to system operation calculated by the typhoon countermeasure candidate calculation unit 22.
- the economical index value is calculated and output as reliability economical index value calculation result data 43.
- the typhoon countermeasure determination unit 24 determines typhoon countermeasures related to system operation based on the reliability economic efficiency index value calculated by the reliability economic efficiency index value calculation unit 23, and outputs it as typhoon countermeasure determination result data 44.
- the display control unit 50 processes various data handled by the power system planning and operation device 10 into an easily viewable format and displays the data.
- the display control unit 50 also reflects input results from input means such as a mouse and a keyboard on the display screen.
- FIG. 3 is a diagram showing a power system planning and operating system to which the power system planning and operating device 10 of the first embodiment is applied.
- the power system planning and operation device 10 includes a supervisory control terminal 301 that monitors and controls a synchronous machine power source 304 such as thermal power generation, nuclear power generation, and hydroelectric power generation connected to the power system 306, and a renewable energy power source such as solar power generation and wind power generation. 303 and a monitoring terminal 302 that monitors a measuring device 305 that measures the power flow distribution within the power system 306. Obtain the output and power transmission status.
- a supervisory control terminal 301 that monitors and controls a synchronous machine power source 304 such as thermal power generation, nuclear power generation, and hydroelectric power generation connected to the power system 306, and a renewable energy power source such as solar power generation and wind power generation.
- a monitoring terminal 302 that monitors a measuring device 305 that measures the power flow distribution within the power system 306. Obtain the output and power transmission status.
- the power system planning and operation device 10 includes a computer and information processing unit including a display unit 105, an input unit 103 such as a keyboard and a mouse, a communication unit 104, a CPU (Central Processing Unit) 101, a memory 102, and a storage device connected by a bus line 91. device or computer server.
- a computer and information processing unit including a display unit 105, an input unit 103 such as a keyboard and a mouse, a communication unit 104, a CPU (Central Processing Unit) 101, a memory 102, and a storage device connected by a bus line 91. device or computer server.
- the storage device includes a typhoon countermeasure calculation input data DB 30 that stores typhoon information data 31, grid operation countermeasure candidate data 33, grid data 34, damage cost data 35, and reliability economic index data 36 as a database, and typhoon information selection result data.
- 41 includes a typhoon countermeasure calculation result data DB 40 that stores typhoon countermeasure candidate calculation result data 42, reliability economic efficiency index value calculation result data 43, and typhoon countermeasure determination result data 44 as a database, and a typhoon countermeasure calculation program 20P.
- the CPU 101 executes a predetermined computer program of a typhoon countermeasure calculation program 20P, which will be described later in FIG. 23, realizes the functions of the typhoon countermeasure determining unit 24 and the display control unit 50.
- the display unit 105 is configured as a display device. Further, the display unit 105 may be configured to use a printer device, an audio output device, or the like instead of or in addition to the display device. In addition, the display unit 105 of the power system planning and operation device 10 displays a simple screen just for rewriting each program and database, and displays the obtained typhoon countermeasure candidate results on a display device connected to the network 300. You may also do so.
- the input unit 103 is configured to include at least one of a keyboard switch, a pointing device such as a mouse, a touch panel, a voice instruction device, and the like.
- the communication unit 104 includes a circuit and a communication protocol for connecting to the network 300.
- the memory 102 is composed of a RAM (Random Access Memory), and stores the computer program read out from the typhoon countermeasure calculation unit 20, and temporarily stores calculation result data, image data, etc. required for each process.
- the screen data stored in memory 102 is sent to display unit 105 and displayed. An example of the displayed screen will be described later.
- the memory 102 stores temporary calculation data such as image data for display, typhoon information selection result data 41, typhoon countermeasure candidate calculation result data 42, reliability economic index value calculation result data 43, typhoon countermeasure decision result data 44, etc. and the calculation result data is temporarily stored. Further, the CPU 101 (display control unit 50) generates necessary image data and displays it on the display unit 105 (for example, a display screen).
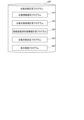
- FIG. 5 is a diagram showing the configuration of the typhoon countermeasure calculation program 20P.
- the typhoon countermeasure calculation program 20P stores a typhoon information selection program 21P, a typhoon countermeasure candidate calculation program 22P, a reliability economic index value calculation program 23P, a typhoon countermeasure determination program 24P, and a display program 50P.
- the typhoon information selection program 21P is a program that selects typhoon information from the typhoon information data 31 and stores it in the typhoon information selection result data 41, and is executed by the CPU 101 to realize the typhoon information selection section 21.
- the typhoon countermeasure candidate calculation program 22P calculates typhoon countermeasure candidates related to grid operation using the grid operation countermeasure candidate data 33 for the typhoon information selected by the typhoon information selection unit 21, and stores the calculated typhoon countermeasure candidates as typhoon countermeasure candidate calculation result data 42.
- This program is executed by the CPU 101 to implement the typhoon countermeasure candidate calculation unit 22.
- the reliability economic efficiency index value calculation program 23P calculates the reliability of typhoon countermeasure candidates related to system operation calculated by the typhoon countermeasure candidate calculation unit 22 using the system data 34, damage cost data 35, and reliability economic index data 36. This is a program that calculates an economical index value and stores it as reliability economical index value calculation result data 43, and is executed by the CPU 101 to realize the reliability economical index value calculation section 23.
- the reliability economic index value refers to the number of times, time, or expected value of power shortage that power supply shortages occur when measures are implemented as typhoon countermeasure candidates.
- the typhoon countermeasure determination program 24P is a program that determines typhoon countermeasures related to system operation based on the reliability economic efficiency index value calculated by the reliability economic efficiency index value calculation unit 23, and stores it as typhoon countermeasure determination result data 44. , is executed by the CPU 101 to realize the typhoon countermeasure determination unit 24.
- the display program 50P is a program that appropriately processes and displays various data handled by the power system planning and operation device 10 in an easy-to-read format, and also reflects input results from input means such as a mouse and a keyboard on the display screen. is executed to realize the display control unit 50.
- FIG. 6 is a diagram showing the structure of the typhoon information data 31 of the typhoon countermeasure calculation input data DB 30.
- the typhoon information data 31 indicates the scale of the typhoon and the expected typhoon damage for each predicted course of the typhoon.
- the types of typhoon damage may include information such as collapse of steel towers and lightning strikes due to flooding associated with typhoons.
- the typhoon information data 31 includes, for each typhoon case 311, the scale of the typhoon at the predicted course date and time 312, the typhoon's center position 313, central pressure 314, maximum wind speed 315, storm area radius 316, and strong wind area radius 317. , and the typhoon damage expected to be caused by the typhoon at the date and time 312 of the predicted course, damage equipment 318, damage details 319, and damage occurrence probability 320.
- typhoon case 311 and typhoon case CT1 when the expected course date and time 312 is 18:00 on MM month DD of YYYY, the center position 313 is N1 latitude and E1 east longitude, the central pressure 314 is 1000 hPa, and the maximum wind speed is 315. is 30 m/s, the radius of the storm area 316 is 50 km, and the radius of the strong wind area 317 is 300 km, indicating that there is no damaged equipment 318, damage details 319, and occurrence probability 320 caused by the typhoon on the date and time.
- the center position 313 is N2 north latitude and east longitude E2
- the central pressure 314 is 950 hPa
- the maximum wind speed 315 is 40 m/s
- the storm area radius 316 is 70 km
- the strong wind area radius 317 is 400 km
- the damaged equipment 318 is the power transmission line L21
- the damage details 319 are cut off
- the probability of occurrence 320 is 0.05, indicating that typhoon damage is expected.
- the wind speed is the 10-minute average wind speed
- the maximum wind speed is the maximum value of the 10-minute average wind speed.
- the instantaneous wind speed is a value obtained by averaging the measured values of the anemometer (at 0.25 second intervals) for 3 seconds (the average of 12 measured values)
- the maximum instantaneous wind speed is the maximum value of the instantaneous wind speed.
- the wind speed is also defined as the Japan Meteorological Agency, but is not limited thereto.
- the maximum wind speed may be the wind speed.
- typhoon prediction data is used to evaluate each risk up to a future time section, and the total risk until the typhoon passes is evaluated.
- the occurrence probability 320 of power transmission line interruption damage will be explained.
- the probability of collapse of structures such as power transmission towers is almost 0 until a certain wind speed is reached, and the probability of collapse increases rapidly when the wind speed exceeds the design standard wind speed with a design margin. It is true. Therefore, as shown in FIG. 7, the occurrence probability 320 is expressed as a probability distribution function (also called a fragility curve) in which the horizontal axis represents the wind speed relative to the steel tower and the vertical axis represents the probability of collapse.
- the wind speed at the tower location is predicted from the predicted course of the typhoon, and the probability of tower collapse is calculated from the fragility curve in Figure 7.
- the probability of occurrence of power interruption damage to a power transmission line is the probability that any one of the towers included in the power transmission line will collapse. In this way, the probability of occurrence of power line interruption damage is calculated.
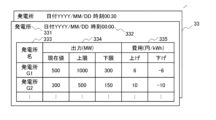
- FIG. 8 is a diagram showing the structure of the grid operation countermeasure candidate data 33 of the typhoon countermeasure calculation input data DB 30.
- the grid operation countermeasure candidate data 33 is information indicating candidates for operational changes in response to typhoon damage in the grid operation countermeasure type, which is the equipment of the grid.
- FIG. 8 shows a case where the power plant operation is changed every predetermined date and time as the type of system operation countermeasure.
- the grid operation countermeasure candidate data 33 for a predetermined grid operation countermeasure type includes the power plant name 333, the output 334 of the power plant (current value, output upper limit value, output lower limit value) for each date and time 332 (date and time). ), and the cost 335 (increase/decrease) for changing the output of the power plant.
- Fig. 8 when the system operation measure type 331 is a power plant and the date and time 332 is 00:00 on the DD day of the MM month of YYYY, the current output of the power plant G1 is 500 MW, the output upper limit is 1000 MW, and the output lower limit is 00:00.
- the figure shows that 300MW, the cost of increasing output is 6 yen/kWh, and the cost of decreasing output is -6 yen/kWh.
- FIG. 8 shows the grid operation countermeasure candidate data 33 when the grid operation countermeasure type 331 is a power plant. This may include starting or stopping substations, changing substation taps, turning on or opening substation phase adjustment equipment, turning on or opening power transmission lines, or other system operation measures.
- the grid operation countermeasure candidate data 33 allows concrete typhoon countermeasure candidates related to grid operation. In addition, it is possible to quantitatively and accurately calculate reliability and economic index values such as costs for typhoon countermeasure candidates. These index values are evaluated in all time sections from the time the typhoon approaches to the time the typhoon passes.
- FIG. 9 is a diagram showing the structure of the damage cost data 35 of the typhoon countermeasure calculation input data DB 30.
- the damage cost data 35 is information indicating costs associated with a power outage at a substation.
- the damage cost data 35 includes a substation name 351 and a cost 352 associated with a power outage at the substation.
- FIG. 9 shows that at a substation whose substation name 351 is substation S1, a power outage will cause damage at a cost 352 of 4000 yen/kWh.
- the damage cost data 35 may be costs for each individual consumer, costs for each consumer type (general household, factory, office, hospital, etc.), or other types. Also good. That is, the damage cost data 35 is at least one of the power outage cost for each substation, the power outage cost for each customer, and the power outage cost for each customer type.
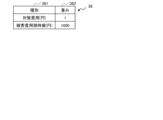
- FIG. 10 is a diagram showing the structure of the reliability economic index data 36 of the typhoon countermeasure calculation input data DB 30.
- the reliability economy index data 36 is information indicating the weight of each type of reliability economy.
- the reliability economy index data 36 includes a reliability economy index type 361 and a weighting coefficient 362 for each index.
- the reliability economy index data 36 includes a reliability economy index type 361 and a weighting coefficient 362 for each index.
- the type 361 of the reliability economic index value may be LOLP (Loss Of Load Probability), LOLE (Loss Of Load Expectation), EUE (Expected Suiteved Energy), or VOLL (Value Of Lost Load).
- indicators related to system stability synchronous stability, voltage stability, frequency stability, overload, etc. (generator step-out or not, maximum internal phase difference angle of the generator, PV curve load margin up to the nose point, short circuit capacity, short circuit capacity ratio (SCR: Short Circuit Ratio), maximum frequency reduction value, RoCoF (Rate Of Change Of Frequency), transmission line overload rate, transmission line overload amount)
- SCR Short Circuit Ratio
- RoCoF Rate Of Change Of Frequency
- transmission line overload rate transmission line overload amount
- It may also be an economic indicator such as GDP lost due to power outages, or it may be possible to score important government offices and hospitals that need to avoid power outages as much as possible in order to maintain social functions.
- reliability economy index data 36 it is possible to quantitatively calculate reliability economy index values for typhoon countermeasure candidates.
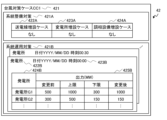
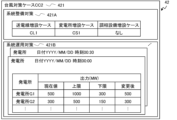
- FIG. 11 is a diagram showing the structure of the typhoon countermeasure candidate calculation result data 42 of the typhoon countermeasure calculation result data DB 40.
- the typhoon countermeasure candidate calculation result data 42 is information indicating the calculation result of typhoon countermeasures for each typhoon countermeasure case name 421.
- the typhoon countermeasure candidate calculation result data 42 includes information on system operation countermeasures 421B and power outage mitigation countermeasures 421C.
- the grid operation countermeasures stored in the grid operation countermeasure candidate data 33 are stored for each grid operation countermeasure type 422B.
- the system operation measure type 422B is a power plant operation change
- the power plant name 424B the output value before change (current value), output upper limit value, and output for each date and time 423B (date and time).
- Information 425B about the lower limit value and the changed output value is stored.
- the typhoon countermeasure case name 421 is "typhoon countermeasure case CC1.”
- the system operation countermeasure 421B changes the output of power station G1 at 00:00 on the MM month DD day of YYYY from 500 MW to 1000 MW, and the power generation This indicates that the output of Station G2 will be changed from 300MW to 150MW.
- the power outage mitigation measures 421C of the typhoon countermeasure candidate calculation result data 42 are stored for each power outage mitigation measure stored in the system operation countermeasure candidate data 33.
- the power outage mitigation measure type 422C indicates the deployment of a power supply vehicle to the substation and a change in operational output
- the name of the substation to be deployed 424C and the relevant substation are displayed for each date and time 423C (date and time).
- the output value before change (current value), the output upper limit value, the output lower limit value, the output value after change, and information 425C about future reinforcement plans for the deployment of power supply vehicles are stored.
- the output of substation CS1 at 00:00 on DD, MM, YYYY is 30 MW, and the output can be increased to 100 MW in the future. , indicating that an additional 200 MW of reinforcements are planned.
- Typhoon countermeasure case CC1 in Figure 11 includes both system operation countermeasures 421B (i.e., changes in power plant operation) and power outage mitigation countermeasures 421C (i.e., deployment of power supply vehicles to substations and changes in operational output) as typhoon countermeasures. This is a case where the above is carried out, but each may be carried out independently.
- the system operation countermeasure type 422B power plant operation change in FIG. 11
- measures to alleviate power outages may include other countermeasures such as demand response and controlling the charging and discharging of electric vehicles.
- each typhoon countermeasure candidate can be made concrete.
- reliability economic efficiency index values (reliability economy index values) for typhoon countermeasure candidates can be calculated quantitatively and with high precision.
- FIG. 12 is a diagram showing the structure of the reliability economic index value calculation result data 43 of the typhoon countermeasure calculation result data DB 40.
- the reliability economy index value calculation result data 43 is information indicating the reliability economy index value calculation result for each typhoon countermeasure, and is associated with the typhoon countermeasure candidate calculation result data 42.
- the reliability economy index value calculation result data 43 includes a typhoon case name 431 corresponding to the typhoon case stored in the typhoon information selection result data 41 (see FIG. 4), and typhoon countermeasure candidate calculation result data 42 (see FIG. 11).
- the typhoon countermeasure case name 432 corresponding to the typhoon countermeasure case (typhoon countermeasure case name 421) stored in The information includes the expected damage cost value 434 and the index value 435 of reliability and economic efficiency when implementing the relevant typhoon countermeasure case.
- the countermeasure cost 433 per time when implementing a typhoon countermeasure case is added to the cost 335 of the grid operation countermeasure candidate data 33 corresponding to the grid operation countermeasure to be implemented in the relevant typhoon countermeasure case 421. Calculated by multiplying the difference values before and after. Additionally, additional costs incurred due to deployment of power supply vehicles to substations, etc. will also be added.
- the expected damage cost value 434 per typhoon countermeasure case is calculated as follows. First, system stability (synchronization stability performance, voltage stability, frequency stability, overload, etc.).
- the cost 352 stored in the damage cost data 35 is determined assuming that a power outage will occur in the analysis target area.
- the frequency decreases, calculate the amount of load (substation) interruption by simulating the operation of an Under Frequency Relay (UFR), and assume that a power outage will occur due to the substation being interrupted in the analysis target area.
- the cost 352 stored in the damage cost data 35 is determined.
- the cost 352 stored in the damage cost data 35 (FIG. 9) is determined assuming that a power outage occurs due to a substation connected to a lower level of the transmission line where the overload occurs. Furthermore, by multiplying the obtained damage cost by the probability of equipment damage occurring in the typhoon case, an expected damage cost value 434 for each time the typhoon countermeasure case is implemented is determined.
- the index value 435 of the reliability economy when implementing a typhoon countermeasure case is, for example, the countermeasure cost 433 per time corresponding to the typhoon case with the relevant typhoon case name 431 and the typhoon countermeasure case with the relevant typhoon countermeasure case name 432.
- the expected damage cost value 434 is calculated as a weighted sum (weighted average value) of the weighting coefficients 362 stored in the corresponding reliability economic index data 36.
- the countermeasure cost as a result of implementing typhoon countermeasure case CC1 with typhoon countermeasure case name 432 for typhoon case CT1 with typhoon case name 431 is 50 million yen/time, and the expected damage cost is 0.01. This shows that the cost is 100 million yen/time, and the reliability economic index value is 150.
- the calculation of countermeasure cost 433 per typhoon countermeasure case, expected damage cost per typhoon countermeasure case 434, and reliability economy index value 435 when implementing typhoon countermeasure case is as follows. Each may be determined by a method other than the above.
- the countermeasure cost 433 per typhoon countermeasure case and the expected damage cost 434 per typhoon countermeasure case are calculated based on a specific number of hours (for example, when a typhoon makes landfall on the Japanese mainland). It may also be a case of limiting to time only.
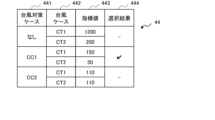
- FIG. 13 is a diagram showing the structure of the typhoon countermeasure determination result data 44 of the typhoon countermeasure calculation result data DB 40.
- the typhoon countermeasure decision result data 44 includes information that displays a list of reliability economic index values (reliability economic index values) for each typhoon countermeasure case, and information on the selection results of the typhoon countermeasure cases.
- the typhoon countermeasure decision result data 44 includes the typhoon countermeasure case name 441 and typhoon case name 442 corresponding to the typhoon countermeasure case name 432 stored in the reliability economic index value calculation result data 43 (FIG. 12). It is composed of information on the typhoon case and the selection results 444 as typhoon countermeasures for the index value 435 of reliability economy.
- the typhoon countermeasure case with the smallest sum of the index values 443 of the reliability economy for the typhoon cases of each typhoon case 442 in the typhoon countermeasure with the typhoon countermeasure case name 441 is selected.
- FIG. 13 shows that CC1 has been selected as the typhoon countermeasure case.
- typhoon countermeasures may be selected using methods other than those described above.
- typhoon countermeasure decision result data 44 it is possible to compare each typhoon countermeasure case (none, CC1, CC2, etc.) and the calculation results of reliability economic index values for each typhoon case, making it easy to understand the selection results and reasons for selection. It can be confirmed. In addition, since it is possible to select typhoon countermeasures that reduce countermeasure costs and damage costs, it is possible to reduce social costs and improve power resilience.
- step S1 the typhoon information selection unit 21 of the typhoon countermeasure calculation unit 20 uses the typhoon information data 31 to select typhoon information stored in the typhoon information data 31 (see FIG. 6), and converts the selection result into the typhoon information. It is output as selection result data 41.
- step S2 the typhoon information selection unit 21 of the typhoon countermeasure calculation unit 20 uses the typhoon information selection result data 41 and the grid operation countermeasure candidate data 33 to calculate countermeasure candidates related to grid operation for the typhoon selected in step S1. Then, it is output as typhoon countermeasure candidate calculation result data 42 (see FIG. 11).
- step S3 the reliability economic efficiency index value calculation unit 23 of the typhoon countermeasure calculation unit 20 uses the typhoon countermeasure candidate calculation result data 42, the system data 34, the damage cost data 35, and the reliability economic efficiency index data 36 to The reliability economy index value for the typhoon countermeasure candidate calculated by the countermeasure candidate calculation unit 22 is calculated and outputted as reliability economy index value calculation result data 43 (see FIG. 12).
- step S4 the typhoon countermeasure determination unit 24 of the typhoon countermeasure calculation unit 20 determines whether or not there is a typhoon countermeasure candidate that was not selected in step S2, regarding the typhoon information selected in step S1. If there are unselected typhoon countermeasure candidates (YES in S4), the process returns to step S2. If there are no unselected typhoon countermeasure candidates (NO in S4), the process advances to step S5.
- step S5 the typhoon countermeasure determining unit 24 determines whether there is any typhoon information that was not selected in step S1. If unselected typhoon information exists (S5: YES), the process returns to step S1. If there is no unselected typhoon information (NO in S5), the process advances to step S6.
- step S6 the typhoon countermeasure determination unit 24 determines typhoon countermeasures using the reliability economy index value calculation result data 43, and outputs it as typhoon countermeasure determination result data 44 (see FIG. 13).
- the typhoon countermeasure calculation unit 20 calculates the reliability economic index value calculated from the typhoon information data, system operation countermeasure candidate data, damage cost data, system data, and reliability economic index data. Since it is possible to select typhoon countermeasures that reduce countermeasure costs and damage costs, it is possible to both reduce social costs and improve power resilience.
- FIGS. 15 and 16 a display example outputted to the display unit 105 by the display control unit 50 (see FIG. 2) of the typhoon countermeasure calculation unit 20 is shown in FIGS. 15 and 16.
- FIG. 15 displays typhoon cases 53 and typhoon contents 54 in the typhoon information, typhoon countermeasure candidate cases 55 and typhoon countermeasure candidate contents 56 in the typhoon countermeasure candidates. These display data items can be freely selected by the user. In addition, the display in FIG. 15 also displays a system diagram 51 and a legend 52, making it easy for the user to understand the positions of typhoon countermeasure candidates.
- FIG. 16 is another example of display content.
- FIG. 16 displays a typhoon countermeasure case 57, a date 59, a time 510, a content 511, a reliability economic index value calculation result 512, and a typhoon countermeasure decision result 513 for the system operation countermeasure.
- These display data items can be freely selected by the user.
- the display in FIG. 16 also displays a system diagram 51 and a legend 52, making it easy for the user to understand the location of typhoon countermeasures.
- the power system planning operation device 10 transmits the typhoon countermeasure decision result data 44 (see FIG. 13) to the central dispatch dispatch system (EMS), and the central dispatch dispatch system calculates the adjustment power operation cost.
- EMS central dispatch dispatch system
- FIG. 17 is a diagram showing the functional configuration of the power system planning and operation device 10 and the central power dispatch command system 60 in the second embodiment.
- the power system planning and operating device 10 in FIG. 17 includes a typhoon countermeasure transmitting unit 25 that transmits typhoon countermeasure determination result data 44 determined by the typhoon countermeasure determining unit 24 to the central power dispatch command system 60 in the power system planning and operating device 10 in FIG.
- the difference is that we added .
- the other configuration of the power system planning and operation device 10 is the same as that in FIG. 2, so the description thereof will be omitted here.
- the central power supply command system 60 includes a database that stores typhoon countermeasure decision result data 44, supply and demand planning data 81, procurement adjustment power data 82, and operation adjustment power determination result data 72, and an operation adjustment power determination unit 71.
- the typhoon countermeasure determination result data 44 is information transmitted from the typhoon countermeasure transmitter 25 of the power system planning and operation device 10.
- the supply and demand plan data 81 is information regarding power generation plans and supply and demand plans provided from power generation companies and retailers to general power transmission and distribution companies.
- the procurement adjustment power data 82 is information on adjustment power procured in the supply and demand adjustment market.
- the operation adjustment power determination result data 72 is information regarding the determination result of the adjustment power to be operated.
- the operation adjustment power determination unit 71 determines the adjustment power to be operated using the typhoon countermeasure determination result data 44, the supply and demand plan data 81, and the procurement adjustment power data 82, and outputs the operation adjustment power determination result data 72.
- the operation adjustment capacity determination unit 71 predicts the imbalance of power generation and load from the supply and demand planning data 81, and calculates the adjustment capacity stored in the procurement adjustment capacity data 82 and the typhoon countermeasure decision result data 44. From among the power plant output changes that are available, the power plant output changes that can adjust the imbalance are determined by merit order. Note that the method for determining the operational adjustment capacity may be other than the above-mentioned method.
- FIG. 18 is a diagram showing a power system planning and operating system according to a second embodiment to which the power system planning and operating device 10 and the central power dispatch command system 60 described in FIG. 17 are applied.
- the power system planning and operating system in FIG. 18 differs from the power system planning and operating system in FIG.
- the power system planning and operating device 10 is configured to be able to send and receive data to and from the central power dispatch system 60 via the network 300, but the power system planning and operating system 10 is an internal device of the central power dispatch system 60, and Data may also be sent and received via a communication network.
- the typhoon countermeasure decision result data 44 is sent to the central power dispatch command system 60; It may also be a power supply command system, market management system, etc.
- Example 3 in contrast to Example 1, a case will be explained in which statistical data of past typhoons, etc., instead of actual typhoon prediction data, are input and utilized for strengthening substations, power transmission lines, etc.
- FIG. 19 is a diagram showing the functional configuration of the power system planning and operation device 10 in the third embodiment.
- the power system planning and operation device 10 described in FIG. Understand the weaknesses of the system.
- the typhoon countermeasure calculation input data DB 30 records grid maintenance countermeasure candidate data 32, details of which will be described later, and the typhoon countermeasure candidate calculation section 22 calculates the grid maintenance countermeasure candidate data 32 for the typhoon information selected by the typhoon information selection section 21.
- the difference is that typhoon countermeasure candidates related to grid operation are calculated using the system operation countermeasure candidate data 33 and output as typhoon countermeasure candidate calculation result data 42 (see FIG. 11).
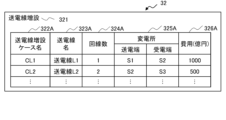
- FIG. 20A shows the structure of the system maintenance measure candidate data 32 when the system maintenance measure type 321 is transmission line extension.
- the system improvement measure candidate data 32 includes the transmission line name 323A (transmission line L1, L2, etc.), the number of circuits 324A (1, 2, etc.) of the transmission line, the transmission line in the transmission line expansion case name 322A.
- the substation name 325A of the power transmission end and the power reception end of , and the information of the cost 326A for expanding the power transmission line are stored.
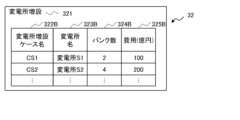
- FIG. 20B shows the structure of the system maintenance measure candidate data 32 when the system maintenance measure type 321 is substation expansion.
- the system maintenance measure candidate data 32 includes the substation expansion case name 322B (CS1, CS2, etc.), the relevant substation name 323B (substation S1, S2, etc.), the number of transformer banks 324B of the relevant substation, the relevant Stores information on the cost of 325B for expanding the substation.
- the substation expansion case whose substation expansion case name 322B in FIG. 20B is CS1 indicates that a substation S1 with two banks will be expanded at a cost of 10 billion yen.
- FIG. 20C shows the configuration of the system maintenance countermeasure candidate data 32 when the grid maintenance countermeasure type 321 is expansion of phase adjustment equipment.
- the system maintenance countermeasure candidate data 32 includes the phase equipment expansion case (CY1, CY2, etc.) in the phase modifier expansion case name 322C, the phase modifier equipment name (phase modifier Y1, Y2, etc.) in the phase modifier equipment name 323C, Information about the number of phase modifiers 324C, the name of the substation where the phase modifier is added 325C, and the cost 326C required for adding the phase modifier is stored.
- phase equipment expansion case CY1, CY2, etc.
- phase modifier equipment name phase modifier Y1, Y2, etc.
- Information about the number of phase modifiers 324C the name of the substation where the phase modifier is added 325C
- the cost 326C required for adding the phase modifier is stored.
- phase modifier expansion case whose phase modifier expansion case name 322C in FIG. 20C is CY1 indicates that one phase modifier facility Y1 will be added to the substation S1 at a cost of 50 million yen.
- the phase adjustment equipment includes a power capacitor (SC: Static Condensor), a shunt reactor (ShR: Shunt Reactor), and the like.
- System maintenance measure type 321 refers to system maintenance measures other than the addition of transmission lines, substations, and phase adjustment equipment, such as high voltage direct current (HVDC) equipment, synchronous phase modifiers, and static var compensators (SVC). :Static Var Compensator), self-excited SVC, SVG (Static Var Generator), STATCOM (STATic synchronous COMPensator), phase shifter, or other system maintenance measures.
- HVDC high voltage direct current
- SVC static var compensators
- typhoon countermeasure candidates related to grid maintenance can be specified. Furthermore, reliability and economic efficiency index values for typhoon countermeasure candidates can be calculated quantitatively and with high precision.
- the power transmission line expansion case name 422A when the grid maintenance measure type of the grid improvement measure candidate data 32 is transmission line expansion when the grid maintenance measure type of the grid improvement measure candidate data 32 is transmission line expansion
- a substation expansion case name 423A when the system maintenance measure type is substation expansion when the system maintenance measure type is substation expansion
- a phase adjusting equipment expansion case name 424 when the system maintenance measure type is phase adjusting equipment expansion when the system maintenance measure type is phase adjusting equipment expansion.
- the grid operation countermeasures stored in the grid operation countermeasure candidate data 33 are stored for each grid operation countermeasure type 422B.
- the grid operation countermeasure type 422B is a change in the operation of a power plant
- the power plant name 424B, the output value before the change, and the output upper limit of the power plant are specified for each date and time 423B (date and time).
- Information 425B of the value, output lower limit value, and changed output value is stored.
- the system maintenance countermeasure candidate data 32 of the transmission line expansion case CL1 and the substation expansion case CS1 are stored. However, this is different from FIG. 21A.
- typhoon countermeasure case CC1 Figure 21A
- system operation measures are implemented as typhoon countermeasures
- typhoon countermeasure case CC2 Figure 21B
- system maintenance measures are implemented as typhoon countermeasures. It goes without saying that both operational measures and system maintenance measures may be taken.
- the grid maintenance measure type may be another system maintenance measure described in the explanation of the grid maintenance countermeasure candidate data 32, and the grid operation countermeasure type may be another system described in the explanation of the grid operation countermeasure candidate data 33. It may also be an operational measure.
- typhoon countermeasure candidates can be made concrete.
- reliability economic efficiency index values reliability economy index values
- FIG. 22 is a diagram showing the hardware configuration of the power system planning and operation device 10 according to the third embodiment.
- the power system planning and operation device 10 of FIG. 4 differs in that the typhoon countermeasure calculation input data DB 30 includes grid maintenance countermeasure candidate data 32 and is stored in the storage device as a database.
- the other configurations are the same as the configuration in FIG. 4, so their description will be omitted.
- the power system planning and operating device 10 transmits the typhoon countermeasure decision result data 44 to the central dispatch dispatch system (EMS), thereby reducing the adjustment power operation cost and improving power resilience in the central dispatch dispatch system.
- EMS central dispatch dispatch system
- FIG. 23 is a diagram showing the functional configuration of the power system planning and operation device 10 and the central power dispatch command system 60 in the fourth embodiment.
- the power system planning and operating device 10 in FIG. 23 sends typhoon countermeasure decision result data 44 determined by the typhoon countermeasure determining unit 24 to the central power dispatch command system 60 to the power system planning and operating device 10 in FIG. 2 in FIG.
- the difference is that a transmitter 25 is added.
- the other configurations of the power system planning and operation device 10 are the same as those shown in FIG. 2, so the description thereof will be omitted here.
- the central power supply command system 60 is the same as the central power supply command system 60 described in FIG. 17, the description thereof will be omitted here.
- the fourth embodiment in addition to suppressing supply and demand and frequency fluctuations due to imbalances in power generation and demand, it is possible to operate a regulating power that can reduce the regulating power operation cost and improve power resilience.
- the power system planning operation device 10 transmits typhoon countermeasure decision result data 44 to the system planning system, thereby reducing system planning costs and improving power resilience in the system planning system. explain.
- FIG. 24 is a diagram showing the functional configuration of the power system planning operation device 10 and the functional configuration of the system planning system 1100 in the fifth embodiment.
- the power system planning and operating device 10 in FIG. 24 includes a typhoon countermeasure transmitting unit 25 that transmits typhoon countermeasure determination result data 44 determined by the typhoon countermeasure determining unit 24 to the grid planning system 1100 in the power system planning and operating device 10 in FIG.
- the addition is different.
- the other configurations of the power system planning and operation device 10 are the same as those shown in FIG. 19, so the description thereof will be omitted here.
- the system planning system 1100 includes a database that stores typhoon countermeasure decision result data 44, supply and demand plan data 1301, and system data 34, a system equipment plan determining section 1201, a system work stoppage plan determining section 1202, and a system operation plan determining section. 1203, and a database that stores system equipment plan determination result data 1401, system work stoppage plan determination result data 1402, and system operation plan determination result data 1403.
- the typhoon countermeasure determination result data 44 is information transmitted from the typhoon countermeasure transmitter 25 of the power system planning and operation device 10.
- the supply and demand plan data 1301 is information regarding power generation plans and supply and demand plans provided from power generation companies and retailers to general power transmission and distribution companies.
- the system data 34 includes system configuration, line impedance (R + j This data is necessary for state estimation and time-series change calculations.
- the system equipment plan determination result data 1401 is information regarding the determination result of the equipment plan regarding the system maintenance measures explained in the system maintenance countermeasure candidate data 32.
- the system work stoppage plan decision result data 1402 is information regarding the decision result of a work stoppage plan for equipment related to system maintenance measures.
- the system operation plan determination result data 1403 is information regarding the determination results of equipment operation plans regarding system maintenance measures.
- the system equipment plan determining unit 1201 uses the typhoon countermeasure decision result data 44, the supply and demand plan data 81, and the system data 34 to determine the equipment plan regarding system maintenance measures such as the explanation of the grid improvement measure candidate data 32, and determines the system equipment plan.
- Plan decision result data 1401 is output.
- the method for determining the equipment plan is, for example, to find an equipment plan that can maintain system stability as explained in the N-1 standard and reliability/economic index value calculation result data 43 and has a low equipment expansion cost. Note that the method for determining the equipment plan may be a method other than the above.
- the system work stoppage plan determination unit 1202 uses the system equipment plan determination result data 1401 to determine a work stoppage plan for equipment related to system maintenance measures, and outputs system work stoppage plan determination result data 1402.
- a method for determining the work stoppage plan for example, a work stoppage plan that can maintain system stability and that has low work stoppage costs as explained in the N-1 standard and the reliability economic index value calculation result data 43 is determined. Note that the method for determining the work stoppage plan may be other than the above.
- the system operation plan determining unit 1203 uses the system work stoppage plan determination result data 1402 to determine an equipment operation plan related to system maintenance measures, and outputs the system operation plan determination result data 1403.
- a method for determining the operation plan for example, an operation plan that can maintain system stability as explained in the N-1 standard and the reliability economic index value calculation result data 43 and that has low operation costs is determined. Note that the method for determining the operation plan may be a method other than the above.
- FIG. 25 is a diagram showing a power system planning and operating system according to a fifth embodiment to which the power system planning and operating device 10 and the system planning system 1100 described in FIG. 24 are applied.
- the power system planning and operation system of FIG. 25 differs in that the central power dispatch control system 60 of the power system planning and operation system of FIG. .
- the power system planning and operation device 10 is configured to be able to send and receive data to and from the system planning system 1100 via the network 300, but the power system planning and operation device 10 is an internal device of the system planning system 1100, and the internal communication network Data may also be sent and received via.
- the system planning system 1100 is used as an example of the transmission destination of the typhoon countermeasure decision result data 44, but there are other systems such as a system stabilization system, a main power supply command system, a system power supply command system, a market management system, etc. But it's okay.
- the present invention is not limited to the above-described embodiments, and includes various modifications.
- the above embodiments have been described in detail to explain the present invention in an easy-to-understand manner, and are not necessarily limited to those having all the configurations described.
Landscapes
- Engineering & Computer Science (AREA)
- Power Engineering (AREA)
- Business, Economics & Management (AREA)
- Health & Medical Sciences (AREA)
- Economics (AREA)
- Primary Health Care (AREA)
- Tourism & Hospitality (AREA)
- General Health & Medical Sciences (AREA)
- Human Resources & Organizations (AREA)
- Marketing (AREA)
- Public Health (AREA)
- Strategic Management (AREA)
- Water Supply & Treatment (AREA)
- Physics & Mathematics (AREA)
- General Business, Economics & Management (AREA)
- General Physics & Mathematics (AREA)
- Theoretical Computer Science (AREA)
- Supply And Distribution Of Alternating Current (AREA)
- Management, Administration, Business Operations System, And Electronic Commerce (AREA)
- Remote Monitoring And Control Of Power-Distribution Networks (AREA)
Abstract
Description
まず、図1により、実施形態の電力系統計画運用装置10の処理概要を説明する。
電力系統計画運用装置10は、台風による台風対策の計算入力データを記憶するデータベース(以下、DBと記す)である台風対策計算入力データDB30と、台風対策計算入力データDB30を用いて台風対策を求める台風対策計算部20と、台風対策計算部20で求めた台風対策を記憶する台風対策計算結果データDB40と、台風対策結果を後記する表示部105(図4)に表示する際の表示制御を行う表示制御部50と、から構成する。
また、電力系統計画運用装置10の表示部105は、各プログラムやデータベースの書き換えを行うためだけの簡単な画面表示を行い、求めた台風対策の候補結果を、ネットワーク300に接続するディスプレイ装置に表示するようにしても良い。
台風対策計算プログラム20Pは、台風情報選択プログラム21P、台風対策候補計算プログラム22P、信頼度経済性指標値計算プログラム23P、台風対策決定プログラム24Pと表示プログラム50Pを格納している。
送電鉄塔のような構造物の倒壊は、ある一定の風速に達するまで倒壊する確率はほぼ0であり、設計基準風速に設計余裕を見込んだ風速を超えると急激に倒壊確率が上昇するのが一般的である。そこで、図7に示すように、発生確率320は、横軸に鉄塔に対する風速、縦軸に倒壊確率を取った確率分布関数(フラジリティ曲線、フラジリティカーブとも呼ばれる)で示される。
具体的には、図9では、変電所名351が変電所S1の変電所では、停電によって費用352が4000円/kWhの被害が生じることを示している。
具体的には、図10では、信頼度経済性指標の種別361として対策費用と被害費用期待値があり、対策費用の重み362が1、被害費用期待値の重み362が1000であることを示している。
詳しくは、系統運用対策種別422Bが発電所の運用変更の場合、日時423B(日付と時刻)毎に、発電所名424B、当該発電所の変更前出力値(現在値)及び出力上限値及び出力下限値及び変更後出力値の情報425Bが記憶されている。なお、図11では、台風対策ケース名421は、「台風対策ケースCC1」である。
詳しくは、停電量緩和対策種別422Cが変電所への電源車の配備と運用出力の変更を示す変電所の場合、日時423C(日付と時刻)毎に、配備する変電所名424C、当該変電所の電源車配備の変更前出力値(現在値)及び出力上限値及び出力下限値及び変更後出力値、今後の増援予定の情報425Cが記憶されている。
まず、当該台風ケースにおいて発生する設備被害内容及び当該台風対策ケース名432の台風対策ケース(台風対策ケースCC1やCC2等)において実施する系統運用対策を模擬した系統解析によって、系統安定性(同期安定性、電圧安定性、周波数安定性、過負荷等)を評価する。
また、図15の表示には、系統図51や凡例52が併せて表示されており、利用者が台風対策候補の位置を理解しやすい表示形式となっている。
また、図16の表示にも、系統図51や凡例52が併せて表示されており、利用者が台風対策の位置を理解しやすい表示形式となっている。
調達調整力データ82は、需給調整市場で調達した調整力の情報である。
運用調整力決定結果データ72は、運用する調整力の決定結果に関する情報である。
図18の電力系統計画運用システムは、図3の電力系統計画運用システムに、ネットワーク300を介して電力系統計画運用装置10に接続する中央給電指令システム60を追加したことが異なる。
まず、系統整備対策候補データ32の詳細を、図20A、図20B、図20Cにより説明する。
この場合、系統整備対策候補データ32は、送電線増設ケース名322Aにおける、当該送電線名323A(送電線L1、L2等)、当該送電線の回線数324A(1、2等)、当該送電線の送電端及び受電端の変電所名325A、当該送電線の増設にかかる費用326Aの情報を記憶する。
この場合、系統整備対策候補データ32は、変電所増設ケース名322B(CS1、CS2等)における、当該変電所名323B(変電所S1、S2等)、当該変電所の変圧器バンク数324B、当該変電所の増設にかかる費用325Bの情報を記憶する。
この場合、系統整備対策候補データ32は、調相設備増設ケース名322Cにおける相設備増設ケース(CY1、CY2等)、当該調相設備名323Cにおける調相設備名(調相Y1、Y2等)、当該調相設備数324C、当該調相設備を増設する変電所名325C、当該調相設備の増設にかかる費用326Cの情報を記憶する。
図4の電力系統計画運用装置10とは、台風対策計算入力データDB30が系統整備対策候補データ32を含みデータベースとして記憶装置に記憶する点が異なる。他の構成は、図4の構成と同じため、説明は省略する。
図25の電力系統計画運用システムは、図18の電力系統計画運用システムの中央給電指令システム60を、ネットワーク300を介して電力系統計画運用装置10に接続する系統計画システム1100に替えたことが異なる。
20 台風対策計算部
21 台風情報選択部
22 台風対策候補計算部
23 信頼度経済性指標値計算部
24 台風対策決定部
25 台風対策送信部
30 台風対策計算入力データDB
31 台風情報データ
32 系統整備対策候補データ
33 系統運用対策候補データ
34 系統データ
35 被害費用データ
36 信頼度経済性指標データ
40 台風対策計算結果データDB
41 台風情報選択結果データ
42 台風対策候補計算結果データ
43 信頼度経済性指標値計算結果データ
44 台風対策決定結果データ
50 表示制御部
60 中央給電指令システム
435 信頼度経済性の指標値
1100 系統計画システム
Claims (13)
- 台風における少なくとも進路情報と風速を含む台風情報データと発電所の出力情報を含む系統運用対策候補データとから台風対策ケース毎の発電所の出力の変更値を含む台風対策候補計算結果データを求める台風対策候補計算部と、
前記台風対策候補計算結果データと系統構成を示す系統データと停電に伴う被害費用データと停電の影響に対する重みを示す信頼度経済性指標データとから信頼度経済性の指標値である信頼度経済性指標値計算結果データを求める信頼度経済性指標値計算部と、
前記信頼度経済性指標値計算結果データから台風対策決定結果データを求める台風対策決定部と、
を備えることを特徴とする電力系統計画運用装置。 - 請求項1に記載の電力系統計画運用装置において、
前記台風情報データは、過去の台風の進路情報と風速である
ことを特徴とする電力系統計画運用装置。 - 請求項1に記載の電力系統計画運用装置において、
前記台風対策候補計算部は、風速と送電鉄塔の倒壊確率の関係を示す確率分布関数を用いて、台風による送電鉄塔の倒壊確率から送電線の遮断確率を求め、発電所の出力の変更値から成る前記台風対策候補計算結果データを求める
ことを特徴とする電力系統計画運用装置。 - 請求項1に記載の電力系統計画運用装置において、
前記系統運用対策候補データは、発電所の出力変更と発電所起動停止と変電所タップ変更と調相設備投入開放と送電線投入開放の少なくともいずれか一つの系統運用対策、及びその運用費用を含む
ことを特徴とする電力系統計画運用装置。 - 請求項1に記載の電力系統計画運用装置において、
前記被害費用データは、変電所毎の停電費用と需要家毎の停電費用と需要家種別毎の停電費用の少なくともいずれか1つである
ことを特徴とする電力系統計画運用装置。 - 請求項1に記載の電力系統計画運用装置において、
前記信頼度経済性指標データは対策費用と被害費用期待値のそれぞれの重みを示す
ことを特徴とする電力系統計画運用装置。 - 請求項1に記載の電力系統計画運用装置において、
前記台風対策候補計算結果データは、少なくとも系統整備対策に対する増設内容と系統運用対策に対する運用変更内容のいずれかを含む
ことを特徴とする電力系統計画運用装置。 - 請求項1に記載の電力系統計画運用装置において、
前記信頼度経済性指標値計算結果データは、前記台風対策ケースと前記台風対策ケースに対する前記台風対策ケースの対策費用と前記台風対策ケースにおける被害費用期待値と信頼度経済性の指標値を含む
ことを特徴とする電力系統計画運用装置。 - 請求項1に記載の電力系統計画運用装置において、
前記台風対策決定部は、前記台風対策ケースにおける信頼度経済性の指標値の和が最小となる台風対策ケースを台風対策の選択結果とする
ことを特徴とする電力系統計画運用装置。 - 請求項1に記載の電力系統計画運用装置において、
前記電力系統計画運用装置で求めた台風対策決定結果データを中央給電指令システムと系統計画システムと系統安定化システムと基幹給電指令システムと系統給電指令システムと市場管理システムのいずれかを送信する台風対策送信部
を備えることを特徴とする電力系統計画運用装置。 - 請求項1に記載の電力系統計画運用装置において、
前記電力系統計画運用装置は、中央給電指令システムと系統計画システムと系統安定化システムと基幹給電指令システムと系統給電指令システムと市場管理システムのいずれかシステムの内部装置である
ことを特徴とする電力系統計画運用装置。 - 電力系統の電力系統計画運用方法であって、
台風における少なくとも進路情報と風速を含む台風情報データと系統運用対策候補データと系統整備対策候補データとから台風対策ケース毎の対策候補計算結果データを求める台風対策候補計算ステップと、
前記対策候補計算結果データと系統構成を示す系統データと停電に伴う被害費用データと停電の影響に対する重みを示す信頼度経済性指標データとから信頼度経済性の指標値である信頼性経済性指標計算結果データを求める信頼度経済性指標値計算ステップと、
前記信頼性経済性指標計算結果データから台風対策決定結果データを求める台風対策決定ステップと、を含む電力系統計画運用方法。 - 請求項12に記載の電力系統計画運用方法において、
前記系統整備対策候補データは送電線増設と変電所増設と調相設備増設と直流設備増設と同期調相機増設と静止型無効電力補償装置増設と自励式SVC増設とSVG増設とSTATCOM増設と位相調整器増設のいずれか一つ以上の系統整備対策及びその増設費用を含む
ことを特徴とする電力系統計画運用方法。
Priority Applications (1)
| Application Number | Priority Date | Filing Date | Title |
|---|---|---|---|
| US18/860,074 US20250286373A1 (en) | 2022-05-11 | 2023-04-26 | Planned power system operation device and planned power system operation method |
Applications Claiming Priority (2)
| Application Number | Priority Date | Filing Date | Title |
|---|---|---|---|
| JP2022-078134 | 2022-05-11 | ||
| JP2022078134A JP7744293B2 (ja) | 2022-05-11 | 2022-05-11 | 電力系統計画運用装置、及び電力系統計画運用方法 |
Publications (1)
| Publication Number | Publication Date |
|---|---|
| WO2023218962A1 true WO2023218962A1 (ja) | 2023-11-16 |
Family
ID=88730409
Family Applications (1)
| Application Number | Title | Priority Date | Filing Date |
|---|---|---|---|
| PCT/JP2023/016462 Ceased WO2023218962A1 (ja) | 2022-05-11 | 2023-04-26 | 電力系統計画運用装置、及び電力系統計画運用方法 |
Country Status (3)
| Country | Link |
|---|---|
| US (1) | US20250286373A1 (ja) |
| JP (1) | JP7744293B2 (ja) |
| WO (1) | WO2023218962A1 (ja) |
Citations (2)
| Publication number | Priority date | Publication date | Assignee | Title |
|---|---|---|---|---|
| WO2016006254A1 (ja) * | 2014-07-11 | 2016-01-14 | パナソニックIpマネジメント株式会社 | 対リスク準備装置、対リスク準備方法、及び、対リスク準備システム |
| JP2020107294A (ja) * | 2018-12-26 | 2020-07-09 | 株式会社日立製作所 | 想定故障分析装置および想定故障分析方法 |
Family Cites Families (1)
| Publication number | Priority date | Publication date | Assignee | Title |
|---|---|---|---|---|
| JP7611769B2 (ja) * | 2021-05-27 | 2025-01-10 | 株式会社日立製作所 | 電力系統計画運用装置、方法及びシステム |
-
2022
- 2022-05-11 JP JP2022078134A patent/JP7744293B2/ja active Active
-
2023
- 2023-04-26 WO PCT/JP2023/016462 patent/WO2023218962A1/ja not_active Ceased
- 2023-04-26 US US18/860,074 patent/US20250286373A1/en active Pending
Patent Citations (2)
| Publication number | Priority date | Publication date | Assignee | Title |
|---|---|---|---|---|
| WO2016006254A1 (ja) * | 2014-07-11 | 2016-01-14 | パナソニックIpマネジメント株式会社 | 対リスク準備装置、対リスク準備方法、及び、対リスク準備システム |
| JP2020107294A (ja) * | 2018-12-26 | 2020-07-09 | 株式会社日立製作所 | 想定故障分析装置および想定故障分析方法 |
Also Published As
| Publication number | Publication date |
|---|---|
| JP2023167169A (ja) | 2023-11-24 |
| JP7744293B2 (ja) | 2025-09-25 |
| US20250286373A1 (en) | 2025-09-11 |
Similar Documents
| Publication | Publication Date | Title |
|---|---|---|
| Hamidieh et al. | Microgrids and resilience: A review | |
| JP6348862B2 (ja) | 系統安定化制御装置および電力系統制御システム | |
| US20140156031A1 (en) | Adaptive Stochastic Controller for Dynamic Treatment of Cyber-Physical Systems | |
| US10355478B2 (en) | System and method for asset health monitoring using multi-dimensional risk assessment | |
| Su et al. | Grid-enhancing technologies for clean energy systems | |
| JP7558365B2 (ja) | 優先度算出装置および優先度算出プログラム | |
| JPWO2016002339A1 (ja) | 電圧安定度監視装置および方法 | |
| US12518325B2 (en) | Electric power system planning operation device, method, and system | |
| Skok et al. | Applications based on PMU technology for improved power system utilization | |
| Rong et al. | Resilience-oriented restoration strategy by offshore wind power considering risk | |
| CN113919528A (zh) | 一种洪涝灾害下的配电网维护方法 | |
| WO2023218962A1 (ja) | 電力系統計画運用装置、及び電力系統計画運用方法 | |
| Li et al. | Investigation of automated corrective actions for special protection schemes | |
| Sedighizadeh et al. | Non-Transmission Expansion Alternatives for Southwest Power Pool | |
| Castillo Aguirre et al. | Benefit analysis in power generation dispatch using dynamic line ratings on transmission lines | |
| KR102796721B1 (ko) | 전력 계통 관성 감시 시스템 및 그에 따른 운영방법 | |
| Esobinenwu | Comparative Study on Determination of Voltage Stability Limits of the 330kV Nigerian Power Grid Using Four Prediction Optimizers | |
| Hillberg et al. | Flexibility to support the future power systems | |
| Winter | European wind integration study (EWIS). Towards a successful integration of large scale wind power into European electricity grids. Final report | |
| EP4704281A1 (en) | Computer-implemented method, system and computer program product for optimizing an electric power distribution network | |
| Vaishnavi et al. | Grid Sustainability Assessment under N-1 Contingency Condition: A Case Study of Specific Event | |
| Wang et al. | Risk Assessment of Coupled Gas-Electricity Systems Under Extreme Weather | |
| JP2025182540A (ja) | 停電レジリエンス評価装置、停電レジリエンス評価方法、およびプログラム | |
| Verma | Smart Grid Technologies for Enhanced Power System Efficiency and Reliability | |
| BİLGEN | PMU BASED ONLINE GRID VOLTAGE STABILITY ASSESSMENT |
Legal Events
| Date | Code | Title | Description |
|---|---|---|---|
| 121 | Ep: the epo has been informed by wipo that ep was designated in this application |
Ref document number: 23803441 Country of ref document: EP Kind code of ref document: A1 |
|
| WWE | Wipo information: entry into national phase |
Ref document number: 18860074 Country of ref document: US |
|
| NENP | Non-entry into the national phase |
Ref country code: DE |
|
| 122 | Ep: pct application non-entry in european phase |
Ref document number: 23803441 Country of ref document: EP Kind code of ref document: A1 |
|
| WWP | Wipo information: published in national office |
Ref document number: 18860074 Country of ref document: US |