WO2023148795A1 - リソース管理装置及びリソース管理方法 - Google Patents
リソース管理装置及びリソース管理方法 Download PDFInfo
- Publication number
- WO2023148795A1 WO2023148795A1 PCT/JP2022/003706 JP2022003706W WO2023148795A1 WO 2023148795 A1 WO2023148795 A1 WO 2023148795A1 JP 2022003706 W JP2022003706 W JP 2022003706W WO 2023148795 A1 WO2023148795 A1 WO 2023148795A1
- Authority
- WO
- WIPO (PCT)
- Prior art keywords
- container
- resource
- node
- usage
- management device
- Prior art date
- Legal status (The legal status is an assumption and is not a legal conclusion. Google has not performed a legal analysis and makes no representation as to the accuracy of the status listed.)
- Ceased
Links
Images






Classifications
-
- G—PHYSICS
- G06—COMPUTING OR CALCULATING; COUNTING
- G06F—ELECTRIC DIGITAL DATA PROCESSING
- G06F9/00—Arrangements for program control, e.g. control units
- G06F9/06—Arrangements for program control, e.g. control units using stored programs, i.e. using an internal store of processing equipment to receive or retain programs
- G06F9/46—Multiprogramming arrangements
- G06F9/50—Allocation of resources, e.g. of the central processing unit [CPU]
-
- G—PHYSICS
- G06—COMPUTING OR CALCULATING; COUNTING
- G06F—ELECTRIC DIGITAL DATA PROCESSING
- G06F9/00—Arrangements for program control, e.g. control units
- G06F9/06—Arrangements for program control, e.g. control units using stored programs, i.e. using an internal store of processing equipment to receive or retain programs
- G06F9/46—Multiprogramming arrangements
- G06F9/50—Allocation of resources, e.g. of the central processing unit [CPU]
- G06F9/5005—Allocation of resources, e.g. of the central processing unit [CPU] to service a request
- G06F9/5011—Allocation of resources, e.g. of the central processing unit [CPU] to service a request the resources being hardware resources other than CPUs, Servers and Terminals
-
- G—PHYSICS
- G06—COMPUTING OR CALCULATING; COUNTING
- G06F—ELECTRIC DIGITAL DATA PROCESSING
- G06F9/00—Arrangements for program control, e.g. control units
- G06F9/06—Arrangements for program control, e.g. control units using stored programs, i.e. using an internal store of processing equipment to receive or retain programs
- G06F9/46—Multiprogramming arrangements
- G06F9/50—Allocation of resources, e.g. of the central processing unit [CPU]
- G06F9/5061—Partitioning or combining of resources
- G06F9/5077—Logical partitioning of resources; Management or configuration of virtualized resources
-
- G—PHYSICS
- G06—COMPUTING OR CALCULATING; COUNTING
- G06F—ELECTRIC DIGITAL DATA PROCESSING
- G06F2209/00—Indexing scheme relating to G06F9/00
- G06F2209/50—Indexing scheme relating to G06F9/50
- G06F2209/5019—Workload prediction
-
- G—PHYSICS
- G06—COMPUTING OR CALCULATING; COUNTING
- G06F—ELECTRIC DIGITAL DATA PROCESSING
- G06F2209/00—Indexing scheme relating to G06F9/00
- G06F2209/50—Indexing scheme relating to G06F9/50
- G06F2209/503—Resource availability
Definitions
- the present disclosure relates to a resource management device and resource management method.
- a node is a computer on which one OS (Operating System) operates.
- a container uses computer resources (hereinafter referred to as “resources”) possessed by a node to execute an application.
- resources hereinafter referred to as “resources”.
- a node has finite resources. For this reason, it is useful to determine the containers that a node has so that the total resources used by one or more containers are no greater than the total resources that the node has.
- Patent Document 1 There is a method for determining whether a container can be implemented (see Patent Document 1, for example).
- the method disclosed in Patent Document 1 manages the usage status of each resource in one or more containers, and based on the usage status of each resource, Determines the container that the node has.
- the resource usage status indicates the temporal change in the amount of resources used by the container in the past. Resource usage may fluctuate over time.
- Fluctuations in resource usage may vary from container to container.
- the time at which the usage amount of each resource peaks (hereinafter referred to as "peak time") may differ for each container.
- peak time may differ for each container, if the containers included in the node are determined based on the peak value of the usage amount of each resource, many of the resources included in the node may become redundant.
- peak times may overlap in all the containers provided in the node or in some of the containers provided in the node, depending on the fluctuations in the amount of use of each resource.
- the nodes included in the nodes are determined based on the usage status of each resource.
- the nodes included in the nodes are not determined based on the fluctuations in the amount of usage of each resource.
- many of the resources possessed by the node are left over, or a situation arises in which the total amount of resources used by all containers provided by the node in the future becomes greater than the total resources possessed by the node.
- An object of the present invention is to obtain a resource management device and a resource management method capable of suppressing the following.
- a resource management device includes a data acquisition unit that acquires monitoring data indicating temporal changes in usage of resources that have been used in the past by each of one or more containers that the node has, among the resources that the node has. , from each monitoring data acquired by the data acquisition unit, predict the time change of the usage amount of the resource that each container will use in the future, and from the prediction result of the time change, the total future use of one or more containers and a prediction unit that calculates a time change in resource usage. In addition, if the change in total resource usage over time calculated by the prediction unit includes a timing at which the total resource usage is greater than the total resource of the node, the resource management device A container deletion unit is provided for deleting any one of one or more containers.
- the present disclosure it is possible to suppress the total amount of resources used by all containers provided in the node to be less than or equal to the total resource of the node, while suppressing the surplus of resources in the node.
- FIG. 1 is a configuration diagram showing a node 2 including a resource management device 12 according to Embodiment 1;
- FIG. 1 is a configuration diagram showing a resource management device 12 according to Embodiment 1;
- FIG. 2 is a hardware configuration diagram showing hardware of a resource management device 12 according to Embodiment 1.
- FIG. 2 is a hardware configuration diagram of a computer when the resource management device 12 is realized by software, firmware, or the like;
- FIG. 4 is a flowchart showing a resource management method, which is a processing procedure of the resource management device 12;
- FIG. 10 is a configuration diagram showing a resource management device 12 according to Embodiment 2; 2 is a hardware configuration diagram showing hardware of a resource management device 12 according to Embodiment 2.
- FIG. FIG. 11 is a configuration diagram showing a resource management device 12 according to Embodiment 3;
- FIG. 11 is a hardware configuration diagram showing hardware of a resource management device 12 according to Embodiment 3;
- FIG. 10 is an explanatory diagram showing an example in which the prediction unit 36 extracts partial data from each of the monitoring data MD 1 to MD N when the node 2 is in the same operating state.
- FIG. 1 is a configuration diagram showing a node 2 including a resource management device 12 according to Embodiment 1.
- FIG. 2 is a configuration diagram showing the resource management device 12 according to the first embodiment.
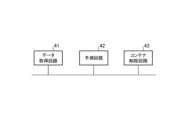
- FIG. 3 is a hardware configuration diagram showing hardware of the resource management device 12 according to the first embodiment.
- N is an integer of 1 or more.
- Node 2 is connected to container distribution server 1 via a network.
- the node 2 is a computer on which one OS (Operating System) operates.
- the node 2 includes containers 11-1 to 11-N distributed from the container distribution server 1 and a resource management device 12, respectively.
- the node 2 includes an OS 13 and a container runtime 14 respectively.
- the node 2 shown in FIG. 1 has a resource management device 12 . However, this is only an example, and the resource management device 12 may be provided outside the node 2 .
- a resource on which the application operates is a resource virtually separated from the resource managed by the OS 13 .
- the virtual separation of resources is performed by the container runtime 14 using functions held by the OS 13 .
- Resources include, for example, a CPU (Central Processing Unit) of the node 2, a memory of the node 2, a storage of the node 2, a network connected to the node 2, or an external device connected to the node 2.
- External devices include, for example, printers, communication devices, and sensors.
- the resource management device 12 includes a data acquisition section 31 , a prediction section 32 and a container deletion section 33 .
- the OS 13 is located between the application program and the hardware and manages the resources that the node 2 has. Also, the OS 13 provides a standard interface for application programs.
- the data acquisition unit 31 is implemented by, for example, a data acquisition circuit 41 shown in FIG.
- the data acquisition unit 31 outputs monitoring data MD n to the prediction unit 32 .
- the prediction unit 32 is implemented by, for example, a prediction circuit 42 shown in FIG.
- the prediction unit 32 acquires the monitoring data MD n from the data acquisition unit 31 .
- the prediction unit 32 predicts, from the monitoring data MD n , the temporal change in the usage of resources that the container 11-n will use in the future.
- the prediction unit 32 calculates the time change of the total resource usage amount to be used by the containers 11-1 to 11-N in the future from the prediction result of the time change.
- the container deletion unit 33 is realized by, for example, the container deletion circuit 43 shown in FIG.
- the container deletion unit 33 determines whether or not the change over time of the total resource usage calculated by the prediction unit 32 includes a timing when the total resource usage exceeds the total resources of the node 2. determine whether If the container deletion unit 33 determines that the timing is included, it deletes one of the containers 11-1 to 11-N. If the container deletion unit 33 determines that the timing is not included, it deletes none of the containers 11-1 to 11-N.
- each of the data acquisition unit 31, the prediction unit 32, and the container deletion unit 33 which are components of the resource management device 12, is implemented by dedicated hardware as shown in FIG. . That is, it is assumed that the resource management device 12 is realized by the data acquisition circuit 41, the prediction circuit 42, and the container deletion circuit 43.
- FIG. Each of the data acquisition circuit 41, the prediction circuit 42, and the container deletion circuit 43 is, for example, a single circuit, a composite circuit, a programmed processor, a parallel programmed processor, an ASIC (Application Specific Integrated Circuit), an FPGA (Field-Programmable Gate Array), or a combination thereof.
- the components of the resource management device 12 are not limited to those realized by dedicated hardware, and the resource management device 12 may be realized by software, firmware, or a combination of software and firmware. good too.
- Software or firmware is stored as a program in a computer's memory.
- a computer means hardware that executes a program, and includes, for example, a CPU, a central processing unit, a processing unit, an arithmetic unit, a microprocessor, a microcomputer, a processor, or a DSP (Digital Signal Processor).
- FIG. 4 is a hardware configuration diagram of a computer when the resource management device 12 is realized by software, firmware, or the like.
- the memory 51 stores a program for causing a computer to execute respective processing procedures in the data acquisition unit 31 , the prediction unit 32 , and the container deletion unit 33 .
- the processor 52 of the computer executes the program stored in the memory 51 .
- FIG. 3 shows an example in which each component of the resource management device 12 is realized by dedicated hardware
- FIG. 4 shows an example in which the resource management device 12 is realized by software, firmware, or the like.
- this is only an example, and some components of the resource management device 12 may be implemented by dedicated hardware, and the remaining components may be implemented by software, firmware, or the like.
- FIG. 5 is a flowchart showing a resource management method, which is a processing procedure of the resource management device 12.
- the node 2 has containers 11-1 to 11-N distributed from the container distribution server 1.
- FIG. Here, for the sake of simplification of explanation, when one of the containers 11-1 to 11-N is delivered from the container delivery server 1, it is determined whether or not the delivered container is to be installed in the node 2. A description of the determination process will be given later.
- the resource usage of the node 2 is, for example, the CPU usage of the node 2, the memory usage of the node 2, the storage usage of the node 2, and the bandwidth usage of the network connected to the node 2. rate, or the usage rate of the equipment connected to the node 2.
- the data acquisition unit 31 outputs monitoring data MD n to the prediction unit 32 .
- the prediction unit 32 predicts, from the monitoring data MD n , the temporal change in the amount of resources used by the container 11-n in the future (step ST2 in FIG. 5).
- the prediction processing of the prediction unit 32 will be specifically described below.
- the prediction unit 32 calculates, from the monitoring data MD n , the resource usage amount u n (t) at a certain time t and the resource usage amount u n ( t+ ⁇ ).
- the prediction unit 32 calculates an autocorrelation function R n ( ⁇ ) for the resource usage from the resource usage u n (t) and the resource usage u n (t+ ⁇ ).
- the processing of calculating the autocorrelation function R n ( ⁇ ) itself is a known technique, and detailed description thereof will be omitted.
- the prediction unit 32 calculates M autocorrelation functions R n ( ⁇ ) by changing the delay time ⁇ .
- M is an integer of 2 or more.
- the prediction unit 32 selects the autocorrelation function with the highest positive correlation among the M autocorrelation functions R n,m ( ⁇ ) as the cycle p n of the resource usage amount used by the container 11-n in the past. Identify the lag time ⁇ of R n,m ( ⁇ ).
- the prediction unit 32 predicts the time change in the amount of resources used by the container 11-n in the future based on the time change in the amount used within the period pn .
- the prediction unit 32 predicts that the container 11-n is j cycles before the current time t 0 (t 0 ⁇ p nj )) to (j ⁇ 1) cycles before (t 0 ⁇ p n ⁇ (j ⁇ 1)), the container 11-n changes the amount of usage of the resources used until the current time t 0 to the time (t 0 +p ( n ⁇ (i ⁇ 1))) to the time (t 0 +p n ⁇ i) i cycles ahead.
- Each of i and j is an integer of 1 or more.
- the time change of the amount is predicted as the time change of the usage amount of the resource used by the container 11-n from the current time t0 to the time one cycle ahead.
- the prediction unit 32 predicts the temporal change in resource usage for one cycle.
- this is only an example, and the prediction unit 32 may predict the time change of resource usage for a plurality of cycles based on the time change of usage within the cycle pn .
- the prediction unit 32 calculates M autocorrelation functions R n,m ( ⁇ ) by changing the delay time ⁇ .
- the change width of the delay time ⁇ is set to a granularity that allows specifying the cycle pn of the usage amount.
- the sampling frequency for monitoring changes in resource usage over time is set so that the assumed maximum value of the change frequency of the resource usage used by the container 11-n is sufficiently below the Nyquist frequency.
- the prediction unit 32 predicts that the container 11- n It predicts time-varying usage of resources to be used in the future. However, there are cases where the amount of resources used by the container 11-n in the past does not have periodicity. When there is no periodicity in resource usage, each of the M autocorrelation functions R n,1 ( ⁇ ) to R n,M ( ⁇ ) is approximately zero. If there is no periodicity in the amount of resource usage, the prediction unit 32 predicts the amount of resource usage that the container 11-n will use in the future based on the peak value of the resource usage that the container 11-n has used in the past. Anticipate change. In other words, the prediction unit 32 predicts that the usage amount of the resource that the container 11-n will use in the future will have a continuous peak value of the usage amount of the resource that has been used in the past.
- the prediction unit 32 calculates the time change of the total resource usage amount to be used by the containers 11-1 to 11-N in the future from the time change prediction result (step ST3 in FIG. 5). The calculation processing of the prediction unit 32 will be specifically described below.
- the prediction unit 32 compares the cycles p 1 to p N of the resource usage amounts that the containers 11-1 to 11- N have used in the past, and finds the longest cycle p Identify max .
- the container associated with the longest period p max is the container 11-1.
- the prediction unit 32 calculates the total resource usage amount u total (t), which is the sum of the resource usage amounts u 1 (t) to u N (t), as shown in the following equation (1).
- utotal (t) u1 (t)+...+ uN (t) (1)
- the prediction unit 32 calculates the total resource usage u total (t), which is the sum of the resource usages u 1 (t) to u 3 (t).
- the prediction unit 32 outputs the total resource usage amount u total (t) to the container deletion unit 33 as a time change of the total resource usage amount.
- the total resource usage u total (t) is the usage of resources u 1 (t) to u 3 (t) from the current time t 0 to time t 0 +p 1 ).
- the total resource usage u total (t) is the usage of resources u 1 ( t ) to u 3 ( It may be the sum of t).
- k is an integer of 2 or more.
- the container deletion unit 33 acquires the total resource usage amount u total (t) from the prediction unit 32 . For example, the container deletion unit 33 determines whether or not there is a timing when the total resource usage u total (t) exceeds the threshold Th between the current time t 0 and time t 0 +p 1 .
- the threshold Th indicates the total resources that the node 2 has.
- the threshold Th may be stored in the internal memory of the container deletion unit 33 or given from the outside of the resource management device 12 .
- step ST4 in FIG. 5: YES If there is a timing when the total resource usage amount u total (t) exceeds the threshold Th between the current time t 0 and the time t 0 +p 1 (step ST4 in FIG. 5: YES ), it is determined that the total resource usage amount u total (t) includes a resource usage amount that is greater than the total resource of the node 2 . If there is no timing at which the total resource usage amount u total (t) exceeds the threshold Th between the current time t 0 and the time t 0 +p 1 (step ST4 in FIG. 5: NO ), it is determined that the total resource usage amount u total (t) does not include a resource usage amount that is greater than the total resource of the node 2 .
- the container deletion unit 33 determines that the total resource usage amount u total (t) includes a resource usage amount that is greater than the total resource usage of the node 2, the containers 11-1 to 11- One of the containers in N is deleted (step ST5 in FIG. 5).
- the container deletion processing of the container deletion unit 33 will be specifically described below.
- the container deletion unit 33 determines that the total resource usage amount u total (t) includes a resource usage amount that is greater than the total resource usage of the node 2, the resource usage amount of the node 2 At time Tim, which is the timing when the amount of resources used by container 11-n exceeds the total resources of container 11-n, u n (Tim) of resources used by container 11-n is specified.
- the container deletion unit 33 selects the largest resource usage amount u max (Tim) among the resource usage amounts u 1 (Tim) to u N (Tim) used by the containers 11-1 to 11-N. Identify.
- the container deletion unit 33 deletes the container associated with the largest resource usage u max (Tim) among the containers 11-1 to 11-N.
- the container deletion unit 33 Even if the container related to the largest resource usage u max (Tim) is deleted, if the total resource usage u total (Tim) is greater than the threshold Th, the container deletion unit 33 further deletes the second largest resource Delete the container related to the usage of .
- the container deletion unit 33 deletes containers in descending order of resource usage until the total resource usage u total (Tim) becomes equal to or less than the threshold Th. If the container deletion unit 33 determines that the timing does not exist, the container deletion processing is not performed. In the resource management device 12 shown in FIG. 2, the container deletion unit 33 deletes the container. However, this is only an example, and the container deletion unit 33 may request the container runtime 14 to delete the container, and the container runtime 14 may delete the container.
- the container deletion unit 33 determines the container to be deleted based on the resource usage amount u n (Tim) at the time Tim.
- Tim resource usage amount
- the container deletion unit 33 deletes the container 11-1 to 11-N from the container distribution server 1 to the node 2 based on the time tdn when each of the containers 11-1 to 11-N is distributed.
- a target container may be determined.
- the container deletion unit 33 determines the container whose delivery time tdn to the node 2 is closest to the current time t0 among the containers 11-1 to 11-N as the container to be deleted.
- the container deletion unit 33 determines the container to be deleted based on the resource usage amount u n (Tim) at the time Tim.
- the container deletion unit 33 may determine the container to be deleted based on the operation priority wn of the container 11-n, for example.
- the container deletion unit 33 determines the container with the lowest operation priority wn among the containers 11-1 to 11-N as the container to be deleted.
- the operation priority w n of the container 11-n may be stored in the internal memory of the container deletion unit 33 or given from the outside of the resource management device 12.
- the container deletion unit 33 performs weighted addition of the resource usage amount u n (Tim) at the time Tim, the time td n delivered to the node 2, and the operation priority w n of the container 11-n. By doing so, the cost CST n of the container 11-n is calculated.
- the cost CST n increases as the resource usage u n (Tim) increases, the time td n delivered to the node 2 is closest to the current time t 0 , and the operation priority w n decreases.
- the container deletion unit 33 may determine the container with the largest cost CST n among the containers 11-1 to 11-N as the container to be deleted.
- a data acquisition unit 31 that acquires monitoring data indicating changes over time, and from the respective monitoring data acquired by the data acquisition unit 31, predict changes over time in usage amounts of resources that the containers 11-n will use in the future, and predict changes over time.
- the resource management device 12 is configured to include a prediction unit 32 that calculates a temporal change in the total resource usage amount to be used by the containers 11-1 to 11-N in the future from the prediction result. In addition, the resource management device 12 determines that the time change of the total resource usage calculated by the prediction unit 32 includes the timing when the total resource usage exceeds the total resource of the node 2.
- the resource management device 12 keeps the total amount of resource usage by the containers 11-1 to 11-N included in the node 2 below the total resource of the node 2 while suppressing surplus resources of the node 2. can be done.
- the node 2 shown in FIG. 1 comprises containers 11-1 to 11-N.
- the node 2 may receive a new container 11-(N+1) different from the containers 11-1 to 11-N from the container distribution server 1, and may be provided with the containers 11-1 to 11-(N+1). If the new container 11-(N+1) is a container that the node 2 has not provided in the past, the data acquisition unit 31 of the resource management device 12 receives the new container 11-(N+1) from the container distribution server 1. Get the projected usage of a resource used by .
- the container deletion unit 33 adds the time average value of the total resource usage amount by the containers 11-1 to 11-N and the planned usage amount of the resource to be used by the new container 11-(N+1).
- the container deletion unit 33 determines whether or not the addition result of the time average value and the planned usage amount is equal to or less than the total resources possessed by the node 2 . If the result of the addition is equal to or less than the total resources of node 2, container deletion unit 33 outputs a permission command to container runtime 14 to permit provision of a new container 11-(N+1). As a result, the container runtime 14 causes the node 2 to have the container 11-(N+1) in addition to the containers 11-1 to 11-N. If the addition result is greater than the total resources of the node 2, the container deletion unit 33 outputs to the container runtime 14 a disapproval command indicating that provision of the new container 11-(N+1) is not permitted. This causes the container runtime 14 to ensure that node 2 only has containers 11-1 through 11-N.
- the prediction unit 32 predicts that the container 11-(N+1) will You may make it predict the time change of the usage amount of the resource to be used. Then, the prediction unit 32 calculates the time change of the total resource usage that the containers 11-1 to 11-(N+1) will use in the future.
- the container deletion unit 33 calculates the total resource usage calculated by the prediction unit 32. If the change in time does not include the timing at which the total resource usage exceeds the total resources possessed by node 2, provision of a new container 11-(N+1) is permitted. Output a permission command to the container runtime 14 .
- the container runtime 14 causes the node 2 to have the container 11-(N+1) in addition to the containers 11-1 to 11-N. If the change in the total resource usage over time calculated by the prediction unit 32 includes the timing at which the total resource usage exceeds the total resources of the node 2, the container deletion unit 33 , outputs to the container runtime 14 a disapproval command indicating that provision of the new container 11-(N+1) is not permitted. This causes the container runtime 14 to ensure that node 2 only has containers 11-1 through 11-N.
- the prediction unit 32 calculates the time change of the total resource usage to be used by the containers 11-1 to 11-N in the future.
- this is only an example, and the change over time of the total resource usage amount that some of the containers 11-1 to 11-N will use in the future may be calculated. Specifically, it is as follows.
- the prediction unit 32 detects a container whose resource usage amount is not periodic among the containers 11-1 to 11-N. For a container with no periodicity in resource usage, each of the M autocorrelation functions R n,1 ( ⁇ ) to R n,M ( ⁇ ) becomes approximately 0 even if the delay time ⁇ is changed.
- the prediction unit 32 calculates the total resource usage of the future usage of the containers other than one of the H containers. In order not to include it in the amount, a correlation coefficient C between the usage amounts of resources used in the past by each of the H containers is calculated.
- H is an integer of 2 or more, and H ⁇ N.
- containers with no periodicity in resource usage are, for example, the containers 11-1 and 11-2. and the amount of resource used by the container 11-2 in the past.
- the processing of calculating the correlation coefficient C1-2 itself is a known technique, and detailed description thereof will be omitted.
- the prediction unit 32 identifies the container with the highest peak value of resource usage in the past among the containers 11-1 and 11-2. . For example, if the container with the highest peak value is the container 11-1, the prediction unit 32 identifies the resource usage amount u 1 (t) as the time change in the resource usage amount to be used by the container 11-1 in the future. do.
- the resource usage amount u 1 (t) is a continuous peak value of the resource usage amount used by the container 11-1 in the past.
- the prediction unit 32 does not specify the usage amount u 2 (t) of resources to be used in the future by the container 11-2 other than the container with the highest peak value.
- the prediction unit 32 When calculating the total resource usage u total (t), the prediction unit 32 adds the resource usage u 1 (t) that the container 11-1 will use in the future to the total resource usage u total (t). Include, but do not include the resource usage u 2 (t) that the container 11-2 will use in the future. If the correlation coefficient C1-2 between the resource usage amount used in the past by the container 11-1 and the resource usage amount used in the past by the container 11-2 is a negative correlation, the container 11- 1 and the container 11-2 are unlikely to use resources at the same timing. Therefore, the prediction unit 32 does not include the usage amount u 2 (t) of resources that the container 11-2 will use in the future in the total resource usage amount u total (t).
- the containers 11-1 and 11-2 have no periodicity in resource usage.
- containers 11-1 to 11-3 are containers that do not have periodicity in resource usage.
- the prediction unit 32 calculates the correlation coefficient C 1-2 between the amount of resource used by the container 11-1 in the past and the amount of resource used by the container 11-2 in the past.
- a correlation coefficient C2-3 between the amount of resource used in the past by the container 11-2 and the amount of resource used in the past by the container 11-3.
- the prediction unit 32 also calculates a correlation coefficient C 3-1 between the amount of resource used in the past by the container 11-3 and the amount of resource used in the past by the container 11-1. If each of the correlation coefficients C 1-2 , C 2-3 , and C 3-1 is a negative correlation, the prediction unit 32 determines the number of resources used in the past among the containers 11-1 to 11-3. Identify containers with the highest peak usage. For example, if the container with the highest peak value is the container 11-1, the prediction unit 32 identifies the resource usage amount u 1 (t) as the time change in the resource usage amount to be used by the container 11-1 in the future. do. The resource usage amount u 1 (t) is a continuous peak value of the resource usage amount used by the container 11-1 in the past.
- the prediction unit 32 does not specify the usage amounts u 2 (t) and u 3 (t) of resources to be used in the future by the containers 11-2 and 11-3, which are containers other than the container with the highest peak value.
- the prediction unit 32 adds the resource usage u 1 (t) that the container 11-1 will use in the future to the total resource usage u total (t). Include, but do not include the usage amounts u 2 (t) and u 3 (t) of the resources that will be used in the future by the containers 11-2 and 11-3, respectively.
- Device 12 will be described.
- FIG. 7 is a configuration diagram showing the resource management device 12 according to the second embodiment.
- the same reference numerals as those in FIG. 2 denote the same or corresponding parts, so description thereof will be omitted.
- FIG. 8 is a hardware configuration diagram showing hardware of the resource management device 12 according to the second embodiment.
- the resource management device 12 shown in FIG. 7 includes a data acquisition unit 31 , a learning model 34 , a prediction unit 35 and a container deletion unit 33 .
- the configuration of the node 2 including the resource management device 12 shown in FIG. 7 is the same as the configuration of the node 2 including the resource management device 12 shown in FIG. The figure is FIG.
- the learning model 34 is implemented by, for example, a learning circuit 44 shown in FIG.
- the learning model 34 is provided with monitoring data MD n indicating temporal changes in the amount of resource used by the container 11-n in the past, and the amount of resource used in the future by the container 11-n. Output prediction results that show changes over time.
- the prediction unit 35 is realized by, for example, a prediction circuit 45 shown in FIG.
- the prediction unit 35 supplies the monitoring data MD n to the learning model 34, and obtains from the learning model 34 a prediction result indicating the temporal change in the usage amount of the resource that the container 11-n will use in the future.
- the prediction unit 35 calculates the time change of the total resource usage amount to be used by the containers 11-1 to 11-N in the future from the prediction result of the time change.
- the learning model 34 is provided outside the prediction unit 35 . However, this is only an example, and the prediction unit 35 may incorporate the learning model 34 .
- each of the data acquisition unit 31, the learning model 34, the prediction unit 35, and the container deletion unit 33, which are components of the resource management device 12, is implemented by dedicated hardware as shown in FIG. I assume. That is, it is assumed that the resource management device 12 is implemented by the data acquisition circuit 41, the learning circuit 44, the prediction circuit 45, and the container deletion circuit 43.
- FIG. Each of the data acquisition circuit 41, the learning circuit 44, the prediction circuit 45, and the container removal circuit 43 may be, for example, a single circuit, multiple circuits, programmed processors, parallel programmed processors, ASICs, FPGAs, or combinations thereof. applicable.
- the components of the resource management device 12 are not limited to those realized by dedicated hardware, and the resource management device 12 may be realized by software, firmware, or a combination of software and firmware. good too.
- the resource management device 12 is realized by software, firmware, etc.
- a program for causing a computer to execute respective processing procedures in the data acquisition unit 31, the learning model 34, the prediction unit 35, and the container deletion unit 33 is shown in FIG. is stored in the memory 51 shown in FIG.
- the processor 52 shown in FIG. 4 executes the program stored in the memory 51 .
- FIG. 8 shows an example in which each component of the resource management device 12 is implemented by dedicated hardware
- FIG. 4 shows an example in which the resource management device 12 is implemented by software, firmware, or the like.
- this is only an example, and some components of the resource management device 12 may be implemented by dedicated hardware, and the remaining components may be implemented by software, firmware, or the like.
- the operation of the resource management device 12 shown in FIG. 7 will be described. Since it is the same as the resource management device 12 shown in FIG. 2 except for the learning model 34 and the prediction unit 35, only the operations of the learning model 34 and the prediction unit 35 will be described here.
- the prediction unit 35 gives the monitoring data MD n to the learning model 34 .
- the learning model 34 When the learning model 34 is given monitoring data MD n , it outputs output data OD n indicating a prediction result corresponding to the monitoring data MD n .
- the prediction unit 35 acquires output data OD n indicating the prediction result from the learning model 34 . Similar to the prediction unit 32 shown in FIG. 2, the prediction unit 35 calculates the time change of the total resource usage to be used by the containers 11-1 to 11-N in the future from the prediction results indicated by the output data ODn .
- the prediction unit 35 outputs the total resource usage amount u total (t) to the container deletion unit 33 as the time change of the total resource usage amount.
- the learning model 34 is provided with learning data GD n indicating the temporal change in the amount of usage of the resource that -n will be used in the future. Then, the learning model 34 sets the weighting coefficients of the neural network so that the output data ODn indicating the prediction result when the monitoring data MDn is given becomes the time change of the usage indicated by the learning data GDn . Updating.
- monitoring data MD n ' may be provided to the learning model 34 in addition to the monitoring data MD n and learning data GD n during learning.
- the monitoring data MD n ' indicates temporal changes in the amount of resource used in the past by a container different from the container 11-n among the containers 11-1 to 11-N.
- the learning model 34 uses a neural network so that the output data ODn indicating the prediction result when the monitoring data MDn and the monitoring data MDn ' are given becomes the time change of the usage indicated by the learning data GDn . Update network weighting factors.
- the prediction unit 35 supplies the monitoring data MD n and the monitoring data MD n ′ to the learning model 34 and acquires the output data OD n indicating the prediction result from the learning model 34 .
- the prediction unit 35 provides the learning model 34 with the monitoring data MD n and the monitoring data MD n ′ rather than providing the learning model 34 with only the monitoring data MD n. 34 may provide highly accurate prediction results.
- Embodiment 3 resource management is performed in which the prediction unit 36 extracts part of the data when the node 2 is in the same state from each of the monitoring data MD 1 to MD N acquired by the data acquisition unit 31. Device 12 will be described.
- FIG. 9 is a configuration diagram showing the resource management device 12 according to the third embodiment.
- the same reference numerals as those in FIGS. 2 and 7 denote the same or corresponding parts, so description thereof will be omitted.
- FIG. 10 is a hardware configuration diagram showing hardware of the resource management device 12 according to the third embodiment.
- the resource management device 12 shown in FIG. 9 includes a data acquisition section 31 , a prediction section 36 and a container deletion section 33 .
- the configuration of the node 2 including the resource management device 12 shown in FIG. 9 is similar to the configuration of the node 2 including the resource management device 12 shown in FIG. 2, and the configuration showing the node 2 including the resource management device 12 shown in FIG. The figure is FIG.
- the prediction unit 36 is realized by, for example, a prediction circuit 46 shown in FIG.
- the prediction unit 36 extracts some data from each of the monitoring data MD 1 to MD N when the state of the node 2 is the same.
- Some data when the state of node 2 is the same include, for example, some data when the movement state of node 2 is the same, and some data when the operation state of node 2 is the same. There is some data, or some data when the state of other systems connected to node 2 is in the same state.
- the state of movement of the node 2 includes, for example, a state in which the node 2 is moving at high speed, a state in which the node 2 is moving at a medium speed, a state in which the node 2 is moving at a low speed, or a state in which the node 2 is moving There is a state of suspension.
- the states in which the node 2 is in the same operating state include, for example, the starting state in which the node 2 is started, the normal state in which the node 2 has completed starting, and the state in which the node 2 is operating in the safe mode. There is a certain safe mode state, a sleep state in which the operation of node 2 is dormant, or a termination state in which the operation of node 2 is terminated.
- the states of other systems connected to the node 2 include, for example, movement states of other systems or operating states of other systems. Other systems include, for example, a communication system connected to node 2 or an in-vehicle system connected to node 2 .
- the prediction unit 36 predicts the temporal change in the usage of resources that the containers 11-n will use in the future from the partial data of each. Similar to the prediction unit 32 shown in FIG. 2, the prediction unit 36 calculates the time change of the total resource usage amount to be used by the containers 11-1 to 11-N in the future from the prediction result of the time change.
- each of the data acquisition unit 31, the prediction unit 36, and the container deletion unit 33 which are components of the resource management device 12, is implemented by dedicated hardware as shown in FIG. . That is, it is assumed that the resource management device 12 is implemented by the data acquisition circuit 41, the prediction circuit 46, and the container deletion circuit 43.
- FIG. Each of the data acquisition circuit 41, the prediction circuit 46, and the container removal circuit 43 may be, for example, a single circuit, multiple circuits, a programmed processor, a parallel programmed processor, an ASIC, an FPGA, or a combination thereof. do.
- the components of the resource management device 12 are not limited to those realized by dedicated hardware, and the resource management device 12 may be realized by software, firmware, or a combination of software and firmware. good too.
- the resource management device 12 is implemented by software, firmware, or the like, a program for causing a computer to execute each processing procedure in the data acquisition unit 31, the prediction unit 36, and the container deletion unit 33 is stored in the memory 51 shown in FIG. Stored. Then, the processor 52 shown in FIG. 4 executes the program stored in the memory 51 .
- FIG. 10 shows an example in which each component of the resource management device 12 is implemented by dedicated hardware
- FIG. 4 shows an example in which the resource management device 12 is implemented by software, firmware, or the like.
- this is only an example, and some components of the resource management device 12 may be implemented by dedicated hardware, and the remaining components may be implemented by software, firmware, or the like.
- the prediction unit 36 extracts some data from each of the monitoring data MD 1 to MD N when the state of the node 2 is the same. That is, from each of the monitoring data MD 1 to MD N , the predicting unit 36 obtains, as part of the data when the state of the node 2 is the same, for example, when the movement state of the node 2 is the same. Extract some data, some data when the operating state of node 2 is in the same state, or some data when other systems connected to node 2 are in the same state .
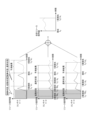
- 11 is an explanatory diagram showing an example in which the prediction unit 36 extracts some data from each of the monitoring data MD 1 to MD N when the node 2 is in the same operating state.
- data when the operating state of the node 2 is normal is extracted from each of the monitoring data MD 1 to MD 3 .
- the prediction unit 36 predicts temporal changes in the amount of resources used by the container 11-n in the future, from some data included in the monitoring data MD n .
- part of the data is data when the operating state of node 2 is the normal state. Since the prediction processing itself of the prediction unit 36 is the same as the prediction processing of the prediction unit 32 shown in FIG. 2, detailed description thereof will be omitted. Similar to the prediction unit 32 shown in FIG. 2, the prediction unit 36 calculates the time change of the total resource usage amount to be used by the containers 11-1 to 11-N in the future from the prediction result of the time change.
- the prediction unit 36 predicts temporal changes in the amount of resources used in the future by the containers 11-n from some data when the node 2 is in the same state. Therefore, the prediction accuracy may be higher than that of the prediction unit 32 shown in FIG.
- the prediction unit 36 extracts some data from each of the monitoring data MD 1 to MD N when the state of the node 2 is the same.
- the prediction unit 36 may extract some data from each of the monitoring data MD 1 to MD N when the environment of the node 2 is the same.
- the partial data when the environment of the node 2 is the same is, for example, the partial data when the environment of the weather around the node 2 is the same, or the environment of the resource usage time is the same. There is some data when it is the environment.
- Environments related to the weather around the node 2 include, for example, an environment with fine weather, an environment with rainy weather, an environment with cloudy weather, and an environment with snowy weather.
- Environments related to resource usage time include, for example, an environment in which the resource usage time is included in the morning time zone, an environment in which the resource usage time is included in the afternoon time zone, and an environment in which the resource usage time is included in the evening time zone. environment, or an environment where resource usage time is included in the night time zone.
- the prediction unit 36 predicts the temporal change in the amount of resources that the container 11-n will use in the future, from part of the data included in the monitoring data MDn .
- the present disclosure is suitable for resource management devices and resource management methods.
- Container distribution server 2 nodes, 11-1 to 11-N containers, 12 resource management device, 13 OS, 14 container runtime, 31 data acquisition unit, 32 prediction unit, 33 container deletion unit, 34 learning model, 35 prediction unit , 36 prediction unit, 41 data acquisition circuit, 42 prediction circuit, 43 container deletion circuit, 44 learning circuit, 45 prediction circuit, 46 prediction circuit, 51 memory, 52 processor.
Landscapes
- Engineering & Computer Science (AREA)
- Software Systems (AREA)
- Theoretical Computer Science (AREA)
- Physics & Mathematics (AREA)
- General Engineering & Computer Science (AREA)
- General Physics & Mathematics (AREA)
- Debugging And Monitoring (AREA)
- Management, Administration, Business Operations System, And Electronic Commerce (AREA)
Abstract
Description
一方、それぞれのリソースの使用量の変動状況によっては、ノードが備えた全てのコンテナ、あるいは、ノードが備えた一部のコンテナにおいて、ピーク時刻が重なることもある。ピーク時刻が重なる場合に、或る任意の時刻におけるそれぞれのリソースの使用量に基づいて、ノードが備えるコンテナを決定してしまうと、将来、ノードが備えた全てのコンテナによるリソースの使用量の合計が、ノードが有するリソースの合計よりも多くなってしまうことがある。
特許文献1に開示されている方法では、それぞれのリソースの利用状況に基づいて、ノードが備えるノードを決定している。しかしながら、それぞれのリソースの使用量の変動状況に基づいて、ノードが備えるノードを決定するものではないという課題があった。このため、ノードが有するリソースの多くが余ってしまう状況、又は、将来、ノードが備えた全てのコンテナによるリソースの使用量の合計が、ノードが有するリソースの合計よりも多くなってしまう状況を生じてしまうことがある。
図1は、実施の形態1に係るリソース管理装置12を含むノード2を示す構成図である。
図2は、実施の形態1に係るリソース管理装置12を示す構成図である。
図3は、実施の形態1に係るリソース管理装置12のハードウェアを示すハードウェア構成図である。
図1において、コンテナ配信サーバ1は、コンテナ11-n(n=1,・・・,N)をノード2に配信するためのサーバである。Nは、1以上の整数である。
ノード2は、1つのOS(Operating System)が動作する計算機である。
ノード2は、コンテナ配信サーバ1から配信されたコンテナ11-1~11-N及びリソース管理装置12のそれぞれを備えている。
また、ノード2は、OS13及びコンテナランタイム14のそれぞれを備えている。
図1に示すノード2は、リソース管理装置12を備えている。しかし、これは一例に過ぎず、リソース管理装置12は、ノード2の外部に設けられていてもよい。
リソースの仮想的な分離は、コンテナランタイム14によって、OS13が保持している機能を用いて行われる。
リソースとしては、例えば、ノード2が有するCPU(Central Processing Unit)、ノード2が有するメモリ、ノード2が有するストレージ、ノード2と接続されているネットワーク、又は、ノード2と接続されている外部の機器がある。外部の機器としては、例えば、プリンタ、通信装置、又は、センサがある。
OS13は、アプリケーションプログラムとハードウェアとの中間に位置し、ノード2が有するリソースの管理を行う。また、OS13は、アプリケーションプログラムに対する標準的なインタフェースを提供する。
コンテナランタイム14は、OS13が保持している機能を用いて、ノード2が有するリソースを仮想的に分離する。
また、コンテナランタイム14は、仮想的に分離したリソースをコンテナ11-n(n=1,・・・,N)に提供する。
さらに、コンテナランタイム14は、コンテナ11-nが過去に使用したリソースの使用量の時間変化を示すモニタリングデータMDnをリソース管理装置12のデータ取得部31に出力する。
データ取得部31は、コンテナランタイム14から、ノード2が有するリソースの中で、コンテナ11-n(n=1,・・・,N)が過去に使用したリソースの使用量の時間変化を示すモニタリングデータMDnを取得する。
データ取得部31は、モニタリングデータMDnを予測部32に出力する。
予測部32は、データ取得部31から、モニタリングデータMDnを取得する。
予測部32は、モニタリングデータMDnから、コンテナ11-nが将来使用するリソースの使用量の時間変化を予測する。
予測部32は、時間変化の予測結果から、コンテナ11-1~11-Nが将来使用する合計のリソース使用量の時間変化を算出する。
コンテナ削除部33は、予測部32により算出された合計のリソース使用量の時間変化の中に、合計のリソース使用量が、ノード2が有するリソースの合計よりも多くなるタイミングが含まれているか否かを判定する。
コンテナ削除部33は、当該タイミングが含まれていると判定すれば、コンテナ11-1~11-Nの中のいずれかのコンテナを削除する。
コンテナ削除部33は、当該タイミングが含まれていないと判定すれば、コンテナ11-1~11-Nの中のいずれのコンテナも削除しない。
データ取得回路41、予測回路42及びコンテナ削除回路43のそれぞれは、例えば、単一回路、複合回路、プログラム化したプロセッサ、並列プログラム化したプロセッサ、ASIC(Application Specific Integrated Circuit)、FPGA(Field-Programmable Gate Array)、又は、これらを組み合わせたものが該当する。
ソフトウェア又はファームウェアは、プログラムとして、コンピュータのメモリに格納される。コンピュータは、プログラムを実行するハードウェアを意味し、例えば、CPU、中央処理装置、処理装置、演算装置、マイクロプロセッサ、マイクロコンピュータ、プロセッサ、あるいは、DSP(Digital Signal Processor)が該当する。
リソース管理装置12が、ソフトウェア又はファームウェア等によって実現される場合、データ取得部31、予測部32及びコンテナ削除部33におけるそれぞれの処理手順をコンピュータに実行させるためのプログラムがメモリ51に格納される。そして、コンピュータのプロセッサ52がメモリ51に格納されているプログラムを実行する。
図5は、リソース管理装置12の処理手順であるリソース管理方法を示すフローチャートである。
ノード2は、コンテナ配信サーバ1から配信されたコンテナ11-1~11-Nを備えている。
ここでは、説明の簡単化のため、コンテナ配信サーバ1から、コンテナ11-1~11-Nのうちのいずれかのコンテナが配信された時点で、配信されたコンテナをノード2に実装させるか否かの判定処理についての説明は後述する。
ノード2が有するリソースの使用量は、例えば、ノード2が有するCPUの使用率、ノード2が有するメモリの使用量、ノード2が有するストレージの使用量、ノード2と接続されているネットワークの帯域使用率、又は、ノード2と接続されている機器の使用率である。
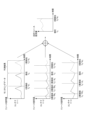
図6は、コンテナ11-n(n=1,2,3)に係るモニタリングデータと予測部32の予測結果と合計リソース使用量とを示す説明図である。
データ取得部31は、モニタリングデータMDnを予測部32に出力する。
予測部32は、モニタリングデータMDnから、コンテナ11-nが将来使用するリソースの使用量の時間変化を予測する(図5のステップST2)。
以下、予測部32の予測処理を具体的に説明する。
予測部32は、コンテナ11-nが過去に使用したリソースの使用量の周期pnとして、M個の自己相関関数Rn,m(τ)の中で、正の相関が最も高い自己相関関数Rn,m(τ)の遅れ時間τを特定する。
予測部32は、周期pn内の使用量の時間変化に基づいて、コンテナ11-nが将来使用するリソースの使用量の時間変化を予測する。
図6の例では、予測部32は、コンテナ11-n(n=1,2,3)が現在の時刻t0よりも1周期前の時刻から現在の時刻t0までに使用したリソースの使用量の時間変化を、コンテナ11-nが現在の時刻t0から1周期先の時刻までに使用するリソースの使用量の時間変化として予測している。
ここでは、予測部32が、1周期分のリソースの使用量の時間変化を予測している。しかし、これは一例に過ぎず、予測部32が、周期pn内の使用量の時間変化に基づいて、複数周期分のリソースの使用量の時間変化を予測するようにしてもよい。
しかしながら、コンテナ11-nが過去に使用したリソースの使用量に周期性が無い場合もある。リソースの使用量に周期性が無い場合、M個の自己相関関数Rn,1(τ)~Rn,M(τ)のそれぞれが概ね0になる。
予測部32は、リソースの使用量に周期性が無ければ、コンテナ11-nが過去に使用したリソースの使用量のピーク値に基づいて、コンテナ11-nが将来使用するリソースの使用量の時間変化を予測する。
即ち、予測部32は、コンテナ11-nが将来使用するリソースの使用量が、過去に使用したリソースの使用量のピーク値が連続するものと予測する。
以下、予測部32の算出処理を具体的に説明する。
予測部32は、コンテナ11-1が将来使用するリソースの使用量の中で、現在の時刻t0から1周期先の時刻t0+p1までに使用するリソースの使用量u1(t)を特定する。t0≦t≦t0+p1=t0+pmaxである。
予測部32は、コンテナ11-n(n=2,・・・,N)が将来使用するリソースの使用量の中で、現在の時刻t0から時刻t0+p1までに使用するリソースの使用量un(t)を特定する。
utotal(t)=u1(t)+・・・+uN(t) (1)
図6の例では、予測部32が、リソースの使用量u1(t)~u3(t)の合計である合計リソース使用量utotal(t)を算出している。
予測部32は、合計のリソース使用量の時間変化として、合計リソース使用量utotal(t)をコンテナ削除部33に出力する。
図2に示すリソース管理装置12では、合計リソース使用量utotal(t)が、現在の時刻t0から時刻t0+p1までに使用するリソースの使用量u1(t)~u3(t)の合計である。しかし、これは一例に過ぎず、合計リソース使用量utotal(t)が、現在の時刻t0から時刻t0+k×p1までに使用するリソースの使用量u1(t)~u3(t)の合計であってもよい。kは、2以上の整数である。
コンテナ削除部33は、例えば、現在の時刻t0から時刻t0+p1までの間に、合計リソース使用量utotal(t)が閾値Thよりも多くなるタイミングがあるか否かを判定する。閾値Thは、ノード2が有するリソースの合計を示すものである。閾値Thは、コンテナ削除部33の内部メモリに格納されていてもよいし、リソース管理装置12の外部から与えられたものであってもよい。
コンテナ削除部33は、現在の時刻t0から時刻t0+p1までの間に、合計リソース使用量utotal(t)が閾値Thよりも多くなるタイミングがなければ(図5のステップST4:NOの場合)、合計リソース使用量utotal(t)の中に、ノード2が有するリソースの合計よりも多くなるリソース使用量が含まれていないと判定する。
以下、コンテナ削除部33のコンテナ削除処理を具体的に説明する。
コンテナ削除部33は、コンテナ11-1~11-Nのそれぞれが使用するリソースの使用量u1(Tim)~uN(Tim)の中で、最も大きなリソースの使用量umax(Tim)を特定する。
コンテナ削除部33は、コンテナ11-1~11-Nの中で、最も大きなリソースの使用量umax(Tim)に係るコンテナを削除する。
コンテナ削除部33は、合計リソース使用量utotal(Tim)が閾値Th以下になるまで、リソースの使用量が大きい順にコンテナを削除する。
コンテナ削除部33は、当該タイミングが存在しないと判定すれば、コンテナの削除処理を行わない。
図2に示すリソース管理装置12では、コンテナ削除部33が、コンテナを削除している。しかし、これは一例に過ぎず、コンテナ削除部33が、コンテナの削除をコンテナランタイム14に依頼し、コンテナランタイム14が、コンテナを削除するようにしてもよい。
そして、コンテナ削除部33は、コンテナ11-1~11-Nの中で、コストCSTnが最大のコンテナを削除対象のコンテナに決定するようにしてもよい。
新たなコンテナ11-(N+1)が、ノード2が過去に備えたことがないコンテナであれば、リソース管理装置12のデータ取得部31は、コンテナ配信サーバ1から、新たなコンテナ11-(N+1)が使用するリソースの予定使用量を取得する。
コンテナ削除部33は、コンテナ11-1~11-Nによる合計のリソース使用量の時間平均値と、新たなコンテナ11-(N+1)が使用するリソースの予定使用量とを加算する。
そして、コンテナ削除部33は、時間平均値と予定使用量との加算結果が、ノード2が有するリソースの合計以下であるか否かを判定する。
コンテナ削除部33は、加算結果が、ノード2が有するリソースの合計以下であれば、新たなコンテナ11-(N+1)を備えることを許可する旨を示す許可指令をコンテナランタイム14に出力する。これにより、コンテナランタイム14は、ノード2がコンテナ11-1~11-Nを備えるほかに、コンテナ11-(N+1)を備えるようにする。
コンテナ削除部33は、加算結果が、ノード2が有するリソースの合計よりも多ければ、新たなコンテナ11-(N+1)を備えることを許可しない旨を示す不許可指令をコンテナランタイム14に出力する。これにより、コンテナランタイム14は、ノード2がコンテナ11-1~11-Nのみを備えるようにする。
そして、予測部32は、コンテナ11-1~11-(N+1)が将来使用する合計のリソース使用量の時間変化を算出する
コンテナ削除部33は、予測部32により算出された合計のリソース使用量の時間変化の中に、合計のリソース使用量が、ノード2が有するリソースの合計よりも多くなるタイミングが含まれていなければ、新たなコンテナ11-(N+1)を備えることを許可する旨を示す許可指令をコンテナランタイム14に出力する。これにより、コンテナランタイム14は、ノード2がコンテナ11-1~11-Nを備えるほかに、コンテナ11-(N+1)を備えるようにする。
コンテナ削除部33は、予測部32により算出された合計のリソース使用量の時間変化の中に、合計のリソース使用量が、ノード2が有するリソースの合計よりも多くなるタイミングが含まれていれば、新たなコンテナ11-(N+1)を備えることを許可しない旨を示す不許可指令をコンテナランタイム14に出力する。これにより、コンテナランタイム14は、ノード2がコンテナ11-1~11-Nのみを備えるようにする。
具体的には以下の通りである。
予測部32は、リソースの使用量に周期性が無いコンテナがH個存在している場合、H個のコンテナのうち、1つのコンテナ以外のコンテナが将来使用するリソースの使用量を合計のリソース使用量に含めないようにするため、H個のコンテナのそれぞれが過去に使用したリソースの使用量の間の相関係数Cを算出する。Hは、2以上の整数であり、H≦Nである。
コンテナ11-1~11-Nの中で、リソースの使用量に周期性が無いコンテナが、例えば、コンテナ11-1,11-2であるとすれば、コンテナ11-1が過去に使用したリソースの使用量と、コンテナ11-2が過去に使用したリソースの使用量との間の相関係数C1-2を算出する。相関係数C1-2の算出処理自体は、公知の技術であるため詳細な説明を省略する。
予測部32は、例えば、ピーク値が最も高いコンテナがコンテナ11-1であれば、コンテナ11-1が将来使用するリソースの使用量の時間変化として、リソースの使用量u1(t)を特定する。リソースの使用量u1(t)は、コンテナ11-1が過去に使用したリソースの使用量のピーク値が連続しているものである。
予測部32は、ピーク値が最も高いコンテナ以外のコンテナであるコンテナ11-2が将来使用するリソースの使用量u2(t)については特定しない。
予測部32は、合計リソース使用量utotal(t)を算出する際、合計リソース使用量utotal(t)の中に、コンテナ11-1が将来使用するリソースの使用量u1(t)を含めるが、コンテナ11-2が将来使用するリソースの使用量u2(t)を含めない。
コンテナ11-1が過去に使用したリソースの使用量と、コンテナ11-2が過去に使用したリソースの使用量との間の相関係数C1-2が負の相関であれば、コンテナ11-1とコンテナ11-2とが同じタイミングでリソースを使用する可能性が低い。このため、予測部32は、コンテナ11-2が将来使用するリソースの使用量u2(t)を合計リソース使用量utotal(t)に含めていない。
この場合、予測部32は、コンテナ11-1が過去に使用したリソースの使用量と、コンテナ11-2が過去に使用したリソースの使用量との間の相関係数C1-2を算出し、コンテナ11-2が過去に使用したリソースの使用量と、コンテナ11-3が過去に使用したリソースの使用量との間の相関係数C2-3を算出する。
また、予測部32は、コンテナ11-3が過去に使用したリソースの使用量と、コンテナ11-1が過去に使用したリソースの使用量との間の相関係数C3-1を算出する。
予測部32は、相関係数C1-2,C2-3,C3-1のそれぞれが負の相関であれば、コンテナ11-1~11-3の中で、過去に使用したリソースの使用量のピーク値が最も高いコンテナを特定する。
予測部32は、例えば、ピーク値が最も高いコンテナがコンテナ11-1であれば、コンテナ11-1が将来使用するリソースの使用量の時間変化として、リソースの使用量u1(t)を特定する。リソースの使用量u1(t)は、コンテナ11-1が過去に使用したリソースの使用量のピーク値が連続しているものである。
予測部32は、ピーク値が最も高いコンテナ以外のコンテナであるコンテナ11-2,11-3のそれぞれが将来使用するリソースの使用量u2(t),u3(t)については特定しない。
予測部32は、合計リソース使用量utotal(t)を算出する際、合計リソース使用量utotal(t)の中に、コンテナ11-1が将来使用するリソースの使用量u1(t)を含めるが、コンテナ11-2,11-3のそれぞれが将来使用するリソースの使用量u2(t),u3(t)を含めない。
実施の形態2では、予測部35が、学習モデル34から、コンテナ11-n(n=1,・・・,N)が将来使用するリソースの使用量の時間変化の予測結果を取得するリソース管理装置12について説明する。
図8は、実施の形態2に係るリソース管理装置12のハードウェアを示すハードウェア構成図である。図8において、図3と同一符号は同一又は相当部分を示すので説明を省略する。
図7に示すリソース管理装置12は、データ取得部31、学習モデル34、予測部35及びコンテナ削除部33を備えている。
図7に示すリソース管理装置12を含むノード2の構成は、図2に示すリソース管理装置12を含むノード2の構成と同様であり、図7に示すリソース管理装置12を含むノード2を示す構成図は、図1である。
学習モデル34は、学習時において、コンテナ11-n(n=1,・・・,N)が過去に使用したリソースの使用量の時間変化を示すモニタリングデータMDnと、コンテナ11-nが将来使用するリソースの使用量の時間変化を示す学習データGDnとが与えられる。そして、学習モデル34は、コンテナ11-nが将来使用するリソースの使用量の時間変化を学習する。
学習モデル34は、推論時において、コンテナ11-nが過去に使用したリソースの使用量の時間変化を示すモニタリングデータMDnが与えられたとき、コンテナ11-nが将来使用するリソースの使用量の時間変化を示す予測結果を出力する。
予測部35は、データ取得部31から、モニタリングデータMDn(n=1,・・・,N)を取得する。
予測部35は、モニタリングデータMDnを学習モデル34に与え、学習モデル34から、コンテナ11-nが将来使用するリソースの使用量の時間変化を示す予測結果を取得する。
予測部35は、図2に示す予測部32と同様に、時間変化の予測結果から、コンテナ11-1~11-Nが将来使用する合計のリソース使用量の時間変化を算出する。
図7に示すリソース管理装置12では、学習モデル34が予測部35の外部に設けられている。しかし、これは一例に過ぎず、予測部35が、学習モデル34を内蔵していてもよい。
データ取得回路41、学習回路44、予測回路45及びコンテナ削除回路43のそれぞれは、例えば、単一回路、複合回路、プログラム化したプロセッサ、並列プログラム化したプロセッサ、ASIC、FPGA、又は、これらを組み合わせたものが該当する。
リソース管理装置12が、ソフトウェア又はファームウェア等によって実現される場合、データ取得部31、学習モデル34、予測部35及びコンテナ削除部33におけるそれぞれの処理手順をコンピュータに実行させるためのプログラムが図4に示すメモリ51に格納される。そして、図4に示すプロセッサ52がメモリ51に格納されているプログラムを実行する。
学習モデル34が、例えば、ニューラルネットワークを備える学習モデルであれば、学習モデル34は、モニタリングデータMDnが与えられたときの、予測結果を示す出力データODnが、学習データGDnが示す使用量の時間変化となるように、ニューラルネットワークの重み係数を更新する。
予測部35は、モニタリングデータMDnを学習モデル34に与える。
学習モデル34は、モニタリングデータMDnが与えられると、モニタリングデータMDnに対応する予測結果を示す出力データODnを出力する。
予測部35は、学習モデル34から、予測結果を示す出力データODnを取得する。
予測部35は、図2に示す予測部32と同様に、出力データODnが示す予測結果から、コンテナ11-1~11-Nが将来使用する合計のリソース使用量の時間変化を算出する。
予測部35は、合計のリソース使用量の時間変化として、合計リソース使用量utotal(t)をコンテナ削除部33に出力する。
また、図7に示すリソース管理装置12は、コンテナ11-n(n=1,・・・,N)が過去に使用したリソースの使用量に周期性が無くても、モニタリングデータMDnに対応する予測結果を得ることができる。
しかし、これは一例に過ぎず、学習時に、モニタリングデータMDnと学習データGDnとの他に、モニタリングデータMDn’が学習モデル34に与えられるようにしてもよい。モニタリングデータMDn’は、コンテナ11-1~11-Nの中で、コンテナ11-nと異なるコンテナが過去に使用したリソースの使用量の時間変化を示すものである。
学習モデル34は、モニタリングデータMDnとモニタリングデータMDn’とが与えられたときの、予測結果を示す出力データODnが、学習データGDnが示す使用量の時間変化となるように、ニューラルネットワークの重み係数を更新する。
予測部35は、モニタリングデータMDnとモニタリングデータMDn’とを学習モデル34に与え、学習モデル34から、予測結果を示す出力データODnを取得する。
モニタリングデータMDnの時間変化とモニタリングデータMDn’の時間変化とが互いに影響しているような場合がある。このような場合、推論時において、予測部35は、モニタリングデータMDnのみを学習モデル34に与えるよりも、モニタリングデータMDnとモニタリングデータMDn’とを学習モデル34に与える方が、学習モデル34から、精度が高い予測結果が得られることがある。
実施の形態3では、予測部36が、データ取得部31により取得されたモニタリングデータMD1~MDNのそれぞれから、ノード2の状態が同じ状態であるときの一部のデータを抽出するリソース管理装置12について説明する。
図10は、実施の形態3に係るリソース管理装置12のハードウェアを示すハードウェア構成図である。図10において、図3及び図8と同一符号は同一又は相当部分を示すので説明を省略する。
図9に示すリソース管理装置12は、データ取得部31、予測部36及びコンテナ削除部33を備えている。
図9に示すリソース管理装置12を含むノード2の構成は、図2に示すリソース管理装置12を含むノード2の構成と同様であり、図9に示すリソース管理装置12を含むノード2を示す構成図は、図1である。
予測部36は、データ取得部31から、モニタリングデータMDn(n=1,・・・,N)を取得する。
予測部36は、モニタリングデータMD1~MDNのそれぞれから、ノード2の状態が同じ状態であるときの一部のデータを抽出する。
ノード2の状態が同じ状態であるときの一部のデータとしては、例えば、ノード2の移動の状態が同じ状態であるときの一部のデータ、ノード2の稼働状態が同じ状態であるときの一部のデータ、又は、ノード2に接続されている他のシステムの状態が同じ状態であるときの一部のデータがある。
ノード2の稼働状態が同じ状態としては、例えば、ノード2が起動している状態である起動状態、ノード2の起動完了後の状態である通常状態、ノード2がセーフモードで動作している状態であるセーフモード状態、ノード2の動作が休止している状態であるスリープ状態、又は、ノード2の動作が終了している状態である終了状態がある。
ノード2に接続されている他のシステムの状態としては、例えば、他のシステムの移動の状態、又は、他のシステムの稼働状態がある。他のシステムとしては、例えば、ノード2に接続されている通信システム、又は、ノード2に接続されている車載システムがある。
予測部36は、図2に示す予測部32と同様に、時間変化の予測結果から、コンテナ11-1~11-Nが将来使用する合計のリソース使用量の時間変化を算出する。
データ取得回路41、予測回路46及びコンテナ削除回路43のそれぞれは、例えば、単一回路、複合回路、プログラム化したプロセッサ、並列プログラム化したプロセッサ、ASIC、FPGA、又は、これらを組み合わせたものが該当する。
リソース管理装置12が、ソフトウェア又はファームウェア等によって実現される場合、データ取得部31、予測部36及びコンテナ削除部33におけるそれぞれの処理手順をコンピュータに実行させるためのプログラムが図4に示すメモリ51に格納される。そして、図4に示すプロセッサ52がメモリ51に格納されているプログラムを実行する。
予測部36は、モニタリングデータMD1~MDNのそれぞれから、ノード2の状態が同じ状態であるときの一部のデータを抽出する。
即ち、予測部36は、モニタリングデータMD1~MDNのそれぞれから、ノード2の状態が同じ状態であるときの一部のデータとして、例えば、ノード2の移動の状態が同じ状態であるときの一部のデータ、ノード2の稼働状態が同じ状態であるときの一部のデータ、又は、ノード2に接続されている他のシステムの状態が同じ状態であるときの一部のデータを抽出する。
図11は、予測部36が、モニタリングデータMD1~MDNのそれぞれから、ノード2の稼働状態が同じ状態であるときの一部のデータを抽出する例を示す説明図である。
図11の例では、モニタリングデータMD1~MD3のそれぞれから、ノード2の稼働状態が通常状態であるときのデータを抽出している。
予測部36の予測処理自体は、図2に示す予測部32の予測処理と同様であるため詳細な説明を省略する。
予測部36は、図2に示す予測部32と同様に、時間変化の予測結果から、コンテナ11-1~11-Nが将来使用する合計のリソース使用量の時間変化を算出する。
ノード2の環境が同じ環境であるときの一部のデータとしては、例えば、ノード2の周辺の天候に関する環境が同じ環境であるときの一部のデータ、又は、リソースの使用時刻に関する環境が同じ環境であるときの一部のデータがある。
ノード2の周辺の天候に関する環境としては、例えば、天候が晴れである環境、天候が雨である環境、天候が曇りである環境、又は、天候が雪である環境がある。
リソースの使用時刻に関する環境としては、例えば、リソースの使用時刻が朝の時間帯に含まれる環境、リソースの使用時刻が昼の時間帯に含まれる環境、リソースの使用時刻が夕方の時間帯に含まれる環境、又は、リソースの使用時刻が夜の時間帯に含まれる環境がある。
この場合も、予測部36は、モニタリングデータMDnに含まれている一部のデータから、コンテナ11-nが将来使用するリソースの使用量の時間変化を予測する。
Claims (20)
- ノードが有するリソースの中で、前記ノードが備える1つ以上のコンテナのそれぞれが過去に使用したリソースの使用量の時間変化を示すモニタリングデータを取得するデータ取得部と、
前記データ取得部により取得されたそれぞれのモニタリングデータから、それぞれのコンテナが将来使用するリソースの使用量の時間変化を予測し、前記時間変化の予測結果から、前記1つ以上のコンテナが将来使用する合計のリソース使用量の時間変化を算出する予測部と、
前記予測部により算出された合計のリソース使用量の時間変化の中に、前記合計のリソース使用量が、前記ノードが有するリソースの合計よりも多くなるタイミングが含まれていれば、前記1つ以上のコンテナの中のいずれかのコンテナを削除するコンテナ削除部と
を備えたリソース管理装置。 - 前記予測部は、
前記データ取得部により取得されたそれぞれのモニタリングデータから、それぞれのコンテナが過去に使用したリソースの使用量の周期を検出し、前記周期内の使用量の時間変化に基づいて、それぞれのコンテナが将来使用するリソースの使用量の時間変化を予測することを特徴とする請求項1記載のリソース管理装置。 - 前記予測部は、
前記データ取得部により取得されたそれぞれのモニタリングデータから、それぞれのコンテナが過去に使用したリソースの使用量についての自己相関関数として、遅れ時間が互いに異なる複数の自己相関関数を算出し、前記使用量の周期として、前記複数の自己相関関数の中で、正の相関が最も高い自己相関関数の遅れ時間を特定することを特徴とする請求項2記載のリソース管理装置。 - 前記予測部は、
それぞれのコンテナが過去に使用したリソースの使用量に周期性が無ければ、それぞれのコンテナが過去に使用したリソースの使用量のピーク値に基づいて、それぞれのコンテナが将来使用するリソースの使用量の時間変化を予測することを特徴とする請求項1記載のリソース管理装置。 - 前記予測部は、
前記1つ以上のコンテナの中に、過去に使用したリソースの使用量に周期性が無いコンテナが複数存在していれば、当該複数のコンテナのそれぞれが過去に使用したリソースの使用量の間の相関係数を算出し、前記相関係数が負の相関であれば、当該複数のコンテナの中で、過去に使用したリソースの使用量のピーク値が最も高いコンテナを特定し、
前記1つ以上のコンテナが将来使用する合計のリソース使用量の中に、前記特定したコンテナが将来使用するリソースの使用量を含め、当該複数のコンテナのうち、前記特定したコンテナ以外のコンテナが将来使用するリソースの使用量を含めないことを特徴とする請求項4記載のリソース管理装置。 - 前記予測部は、
それぞれのコンテナが過去に使用したリソースの使用量の時間変化を学習モデルに与え、前記学習モデルから、それぞれのコンテナが将来使用するリソースの使用量の時間変化の予測結果を取得することを特徴とする請求項1記載のリソース管理装置。 - 前記予測部は、
それぞれのコンテナが過去に使用したリソースの使用量の時間変化と、それぞれのコンテナと異なるコンテナが過去に使用したリソースの使用量の時間変化とを学習モデルに与え、前記学習モデルから、それぞれのコンテナが将来使用するリソースの使用量の時間変化の予測結果を取得することを特徴とする請求項1記載のリソース管理装置。 - 前記予測部は、
前記データ取得部により取得された1つ以上のモニタリングデータのそれぞれから、前記ノードの状態が同じ状態であるときの一部のデータを抽出し、それぞれの一部のデータから、それぞれのコンテナが将来使用するリソースの使用量の時間変化を予測することを特徴とする請求項1記載のリソース管理装置。 - 前記予測部は、
前記データ取得部により取得された1つ以上のモニタリングデータのそれぞれから、前記ノードの環境が同じ環境であるときの一部のデータを抽出し、それぞれの一部のデータから、それぞれのコンテナが将来使用するリソースの使用量の時間変化を予測することを特徴とする請求項1記載のリソース管理装置。 - 前記予測部は、
前記データ取得部により取得された1つ以上のモニタリングデータのそれぞれから、前記ノードの状態が同じ状態であるときの一部のデータとして、前記ノードの移動の状態が同じ状態であるときの一部のデータを抽出することを特徴とする請求項8記載のリソース管理装置。 - 前記予測部は、
前記データ取得部により取得された1つ以上のモニタリングデータのそれぞれから、前記ノードの状態が同じ状態であるときの一部のデータとして、前記ノードの稼働状態が同じ状態であるときの一部のデータを抽出することを特徴とする請求項8記載のリソース管理装置。 - 前記予測部は、
前記データ取得部により取得された1つ以上のモニタリングデータのそれぞれから、前記ノードの状態が同じ状態であるときの一部のデータとして、前記ノードに接続されている他のシステムの状態が同じ状態であるときの一部のデータを抽出することを特徴とする請求項8記載のリソース管理装置。 - 前記予測部は、
前記データ取得部により取得された1つ以上のモニタリングデータのそれぞれから、前記ノードの環境が同じ環境であるときの一部のデータとして、前記ノードの周辺の天候に関する環境が同じ環境であるときの一部のデータを抽出することを特徴とする請求項9記載のリソース管理装置。 - 前記予測部は、
前記データ取得部により取得された1つ以上のモニタリングデータのそれぞれから、前記ノードの環境が同じ環境であるときの一部のデータとして、リソースの使用時刻に関する環境が同じ環境であるときの一部のデータを抽出することを特徴とする請求項9記載のリソース管理装置。 - 前記コンテナ削除部は、
前記予測部により算出された合計のリソース使用量の時間変化の中に、前記合計のリソース使用量が、前記ノードが有するリソースの合計よりも多くなるタイミングが含まれていれば、前記タイミングでのそれぞれのコンテナのリソース使用量に基づいて、削除対象のコンテナを決定することを特徴とする請求項1記載のリソース管理装置。 - 前記コンテナ削除部は、
前記予測部により算出された合計のリソース使用量の時間変化の中に、前記合計のリソース使用量が、前記ノードが有するリソースの合計よりも多くなるタイミングが含まれていれば、それぞれのコンテナが前記ノードに配信された時刻に基づいて、削除対象のコンテナを決定することを特徴とする請求項1記載のリソース管理装置。 - 前記コンテナ削除部は、
前記予測部により算出された合計のリソース使用量の時間変化の中に、前記合計のリソース使用量が、前記ノードが有するリソースの合計よりも多くなるタイミングが含まれていれば、それぞれのコンテナの動作優先度に基づいて、削除対象のコンテナを決定することを特徴とする請求項1記載のリソース管理装置。 - 前記コンテナ削除部は、
前記予測部により算出された合計のリソース使用量の時間変化の中に、前記合計のリソース使用量が、前記ノードが有するリソースの合計よりも多くなるタイミングが含まれていれば、前記タイミングでのそれぞれのコンテナのリソース使用量と、それぞれのコンテナが前記ノードに配信された時刻と、それぞれのコンテナの動作優先度とに基づいて、削除対象のコンテナを決定することを特徴とする請求項1記載のリソース管理装置。 - ノードが有するリソースの使用量は、前記ノードが有するCPU(Central Processing Unit)の使用率、前記ノードが有するメモリの使用量、前記ノードが有するストレージの使用量、前記ノードと接続されているネットワークの帯域使用率、又は、前記ノードと接続されている機器の使用率であることを特徴とする請求項1から請求項18のうちのいずれか1項記載のリソース管理装置。
- データ取得部が、ノードが有するリソースの中で、前記ノードが備える1つ以上のコンテナのそれぞれが過去に使用したリソースの使用量の時間変化を示すモニタリングデータを取得し、
予測部が、前記データ取得部により取得されたそれぞれのモニタリングデータから、それぞれのコンテナが将来使用するリソースの使用量の時間変化を予測し、前記時間変化の予測結果から、前記1つ以上のコンテナが将来使用する合計のリソース使用量の時間変化を算出し、
コンテナ削除部が、前記予測部により算出された合計のリソース使用量の時間変化の中に、前記合計のリソース使用量が、前記ノードが有するリソースの合計よりも多くなるタイミングが含まれていれば、前記1つ以上のコンテナの中のいずれかのコンテナを削除する
リソース管理方法。
Priority Applications (3)
| Application Number | Priority Date | Filing Date | Title |
|---|---|---|---|
| JP2023578203A JP7459407B2 (ja) | 2022-02-01 | 2022-02-01 | リソース管理装置及びリソース管理方法 |
| US18/728,895 US20250094239A1 (en) | 2022-02-01 | 2022-02-01 | Resource management device and resource management method |
| PCT/JP2022/003706 WO2023148795A1 (ja) | 2022-02-01 | 2022-02-01 | リソース管理装置及びリソース管理方法 |
Applications Claiming Priority (1)
| Application Number | Priority Date | Filing Date | Title |
|---|---|---|---|
| PCT/JP2022/003706 WO2023148795A1 (ja) | 2022-02-01 | 2022-02-01 | リソース管理装置及びリソース管理方法 |
Publications (1)
| Publication Number | Publication Date |
|---|---|
| WO2023148795A1 true WO2023148795A1 (ja) | 2023-08-10 |
Family
ID=87553306
Family Applications (1)
| Application Number | Title | Priority Date | Filing Date |
|---|---|---|---|
| PCT/JP2022/003706 Ceased WO2023148795A1 (ja) | 2022-02-01 | 2022-02-01 | リソース管理装置及びリソース管理方法 |
Country Status (3)
| Country | Link |
|---|---|
| US (1) | US20250094239A1 (ja) |
| JP (1) | JP7459407B2 (ja) |
| WO (1) | WO2023148795A1 (ja) |
Families Citing this family (1)
| Publication number | Priority date | Publication date | Assignee | Title |
|---|---|---|---|---|
| WO2026005424A1 (ko) * | 2024-06-28 | 2026-01-02 | 코드비전 주식회사 | 서버리스 플랫폼에 기반하여 컨테이너 예측을 통한 인공지능 서비스를 제공하는 전자 장치 및 그 동작 방법 |
Citations (2)
| Publication number | Priority date | Publication date | Assignee | Title |
|---|---|---|---|---|
| JP2010011620A (ja) * | 2008-06-26 | 2010-01-14 | Central Res Inst Of Electric Power Ind | 電力系統縮約モデル作成装置、電力系統縮約モデル作成方法および電力系統縮約モデル作成プログラム |
| JP2020144669A (ja) * | 2019-03-07 | 2020-09-10 | 日本電気株式会社 | 情報処理装置、コンテナ配置方法及びコンテナ配置プログラム |
-
2022
- 2022-02-01 JP JP2023578203A patent/JP7459407B2/ja active Active
- 2022-02-01 WO PCT/JP2022/003706 patent/WO2023148795A1/ja not_active Ceased
- 2022-02-01 US US18/728,895 patent/US20250094239A1/en active Pending
Patent Citations (2)
| Publication number | Priority date | Publication date | Assignee | Title |
|---|---|---|---|---|
| JP2010011620A (ja) * | 2008-06-26 | 2010-01-14 | Central Res Inst Of Electric Power Ind | 電力系統縮約モデル作成装置、電力系統縮約モデル作成方法および電力系統縮約モデル作成プログラム |
| JP2020144669A (ja) * | 2019-03-07 | 2020-09-10 | 日本電気株式会社 | 情報処理装置、コンテナ配置方法及びコンテナ配置プログラム |
Also Published As
| Publication number | Publication date |
|---|---|
| JP7459407B2 (ja) | 2024-04-01 |
| US20250094239A1 (en) | 2025-03-20 |
| JPWO2023148795A1 (ja) | 2023-08-10 |
Similar Documents
| Publication | Publication Date | Title |
|---|---|---|
| US10554577B2 (en) | Adaptive resource scheduling for data stream processing | |
| JP5218390B2 (ja) | 自律制御サーバ、仮想サーバの制御方法及びプログラム | |
| US20200219028A1 (en) | Systems, methods, and media for distributing database queries across a metered virtual network | |
| CN111431996B (zh) | 用于资源配置的方法、装置、设备和介质 | |
| WO2017128980A1 (zh) | 云平台中管理资源的方法和装置 | |
| US20160321331A1 (en) | Device and method | |
| CN107608781B (zh) | 一种负载预测方法、装置以及网元 | |
| WO2020172852A1 (en) | Computing resource scheduling method, scheduler, internet of things system, and computer readable medium | |
| CN103136322B (zh) | 用于配置查询的装置和方法 | |
| US9560127B2 (en) | Systems, methods and algorithms for logical movement of data objects | |
| JP2024543115A (ja) | 集積回路の自動並列シミュレーション方法及びシミュレーション装置 | |
| CN115269123A (zh) | 一种容器资源调整方法、装置、电子设备及介质 | |
| CN113961348A (zh) | 一种任务调度方法、装置、设备以及存储介质 | |
| JP2017211928A (ja) | 分散処理制御システム及び分散処理制御方法 | |
| WO2023148795A1 (ja) | リソース管理装置及びリソース管理方法 | |
| CN113535346A (zh) | 线程数量调整的方法、装置、设备及计算机存储介质 | |
| US9412267B2 (en) | Auto-calibration for road traffic prediction | |
| US20090217282A1 (en) | Predicting cpu availability for short to medium time frames on time shared systems | |
| US11847354B2 (en) | Data storage using a sliding window cache in a data grid | |
| CN120104356B (zh) | 资源分配方法、电子设备、存储介质和程序产品 | |
| CN113254191A (zh) | 用于运行应用的方法、电子设备和计算机程序产品 | |
| JP6627475B2 (ja) | 処理リソース制御プログラム、処理リソース制御装置、および処理リソース制御方法 | |
| CN119066095A (zh) | 一种云际分布式缓存数据库自适应调优方法及系统 | |
| JP7457589B2 (ja) | 情報処理装置、情報処理方法、および情報処理システム | |
| CN115237610A (zh) | 一种基于Kubernetes容器云平台的弹性伸缩方法、装置及应用 |
Legal Events
| Date | Code | Title | Description |
|---|---|---|---|
| 121 | Ep: the epo has been informed by wipo that ep was designated in this application |
Ref document number: 22924709 Country of ref document: EP Kind code of ref document: A1 |
|
| WWE | Wipo information: entry into national phase |
Ref document number: 2023578203 Country of ref document: JP |
|
| WWE | Wipo information: entry into national phase |
Ref document number: 18728895 Country of ref document: US |
|
| NENP | Non-entry into the national phase |
Ref country code: DE |
|
| 122 | Ep: pct application non-entry in european phase |
Ref document number: 22924709 Country of ref document: EP Kind code of ref document: A1 |
|
| WWP | Wipo information: published in national office |
Ref document number: 18728895 Country of ref document: US |