WO2023100735A1 - 不確実性推計装置、不確実性推計方法、及びプログラム - Google Patents
不確実性推計装置、不確実性推計方法、及びプログラム Download PDFInfo
- Publication number
- WO2023100735A1 WO2023100735A1 PCT/JP2022/043325 JP2022043325W WO2023100735A1 WO 2023100735 A1 WO2023100735 A1 WO 2023100735A1 JP 2022043325 W JP2022043325 W JP 2022043325W WO 2023100735 A1 WO2023100735 A1 WO 2023100735A1
- Authority
- WO
- WIPO (PCT)
- Prior art keywords
- uncertainty
- food consumption
- environmental load
- food
- consumption
- Prior art date
- Legal status (The legal status is an assumption and is not a legal conclusion. Google has not performed a legal analysis and makes no representation as to the accuracy of the status listed.)
- Ceased
Links
Images










Classifications
-
- G—PHYSICS
- G06—COMPUTING OR CALCULATING; COUNTING
- G06N—COMPUTING ARRANGEMENTS BASED ON SPECIFIC COMPUTATIONAL MODELS
- G06N5/00—Computing arrangements using knowledge-based models
- G06N5/04—Inference or reasoning models
-
- G—PHYSICS
- G06—COMPUTING OR CALCULATING; COUNTING
- G06Q—INFORMATION AND COMMUNICATION TECHNOLOGY [ICT] SPECIALLY ADAPTED FOR ADMINISTRATIVE, COMMERCIAL, FINANCIAL, MANAGERIAL OR SUPERVISORY PURPOSES; SYSTEMS OR METHODS SPECIALLY ADAPTED FOR ADMINISTRATIVE, COMMERCIAL, FINANCIAL, MANAGERIAL OR SUPERVISORY PURPOSES, NOT OTHERWISE PROVIDED FOR
- G06Q10/00—Administration; Management
- G06Q10/06—Resources, workflows, human or project management; Enterprise or organisation planning; Enterprise or organisation modelling
- G06Q10/063—Operations research, analysis or management
-
- Y—GENERAL TAGGING OF NEW TECHNOLOGICAL DEVELOPMENTS; GENERAL TAGGING OF CROSS-SECTIONAL TECHNOLOGIES SPANNING OVER SEVERAL SECTIONS OF THE IPC; TECHNICAL SUBJECTS COVERED BY FORMER USPC CROSS-REFERENCE ART COLLECTIONS [XRACs] AND DIGESTS
- Y02—TECHNOLOGIES OR APPLICATIONS FOR MITIGATION OR ADAPTATION AGAINST CLIMATE CHANGE
- Y02P—CLIMATE CHANGE MITIGATION TECHNOLOGIES IN THE PRODUCTION OR PROCESSING OF GOODS
- Y02P90/00—Enabling technologies with a potential contribution to greenhouse gas [GHG] emissions mitigation
- Y02P90/30—Computing systems specially adapted for manufacturing
Definitions
- the present invention relates to technology for predicting the environmental impact of food consumption.
- Uncertainty is included in environmental load prediction regardless of which method is used, not only in predicting environmental load with a finer time resolution than conventional technology, but also in environmental load prediction in general. In order to judge the reliability of environmental load prediction, it is important to calculate the uncertainty quantitatively. I didn't.
- the present invention has been made in view of the above points, and aims to provide a technology for predicting the environmental load caused by food, which enables quantitative calculation of the uncertainty of the prediction of the environmental load. aim.
- a first estimation unit that estimates the uncertainty of the estimated food consumption
- a second estimating unit that estimates, based on the uncertainty of the food consumption, the uncertainty of the environmental load prediction value predicted using the food consumption model constructed based on the food consumption
- a sex estimator is provided.
- a technology that enables quantitative calculation of the uncertainty of the environmental load prediction.
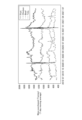
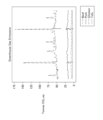
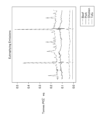
- FIG. 4 is a flowchart showing processing for estimating an environmental load; It is a figure which shows the example of a model building method. It is a figure which shows the example of consumption prediction of food.
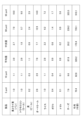
- FIG. 4 is a diagram showing an example of model parameters; It is a flow chart which shows a flow of processing of an environmental load prediction device in a 1st embodiment. It is a block diagram of the environmental load prediction apparatus in 2nd Embodiment. It is a flowchart which shows the flow of a process of the environmental load prediction apparatus in 2nd Embodiment. It is a block diagram of an uncertainty estimation apparatus. It is a figure which shows the hardware configuration example of an apparatus.
- model parameters including temperature, mass sentiment based on text mining [18], economic indicators such as the Nikkei 225 stock index [19], and the coincidence index [20].
- the configuration and operation of the environmental load prediction device 100 according to the first embodiment will be described in detail below.
- FIG. 3 shows a configuration example of the environmental load prediction device 100 in this embodiment.
- the environmental load prediction device 100 includes an input unit 110, a consumption DB (database) 140, a food consumption estimation unit 130, a food consumption future scenario quantitative analysis module 120, an environmental load coefficient DB 160, and an environmental load estimation unit. 150 and an output unit 170 .
- the food consumption future scenario quantitative analysis module 120 also has a food consumption storage unit 121, a model parameter DB 122, a food consumption model building unit 123, a model storage unit 124, and a quantitative scenario input unit 125.
- the environmental load prediction device 100 may also be called an environmental load prediction system. Further, the environmental load prediction device 100 may be composed of one device (computer), or may be composed of a plurality of devices. Further, the environmental load prediction device 100 may be provided with only the food future scenario quantitative analysis module 120 and the other functional units in FIG. 3 may be provided outside the environmental load prediction device 100 . A device including the food future scenario quantitative analysis module 120 may be called a model learning device.
- the consumption DB 140, the environmental load coefficient DB 160, and the model parameter DB 122 in FIG. 3 may be provided outside the environmental load prediction device 100, respectively.
- the input unit 110 inputs data necessary for processing.
- the food consumption estimation unit 130 estimates food consumption using input from the consumption DB 140 .
- the food consumption future scenario quantitative analysis module 120 builds a food consumption model based on daily food consumption and high-resolution model parameters for each of the 40 or more food groups, and stores the food consumption model.
- the environmental load estimation unit 150 uses the model from the model storage unit 124 in the food consumption future scenario quantitative analysis module 120 and the environmental load coefficient obtained from the environmental load coefficient DB 160 to predict the environmental load.
- the output unit 170 outputs daily environmental load predictions based on quantitative food consumption scenarios. The details of each part will be described below.
- the consumption DB 140 is a DB for storing and making available daily consumption data of perishables in a wide range of countries and regions.
- the consumption DB 140 stores consumption data acquired from outside.
- the consumption DB 140 may be a POS service provider's DB, which is provided outside the environmental load prediction apparatus 100 and described below.
- the consumption data in the consumption DB 140 may be any data as long as it is possible to obtain daily information.
- “Real shopper SM" POS (Point of Sales) DB is used.
- This database stores data from Japanese supermarkets, including revenue and sales numbers for fresh foods, including meat, fish, fruits and vegetables, and also handles products that do not have a JAN (Japanese Article Numbering) code. It is preferable to use the 'Real shopper SM' POS-DB, as other supermarket POS databases focused only on the Japanese market contain processed foods.
- JAN Japanese Article Numbering
- the environmental load factor DB 160 stores data based on document [2].
- FIG. 4 shows an example of data (a part of 40 food groups) that is open to the public by Document [2], that is, data stored in the environmental load factor DB 160 .
- the data shown in Figure 4 represent a sample of statistical coefficients for land use, defined as the productive area multiplied by the number of years occupied per functional unit ( m2 years/functional unit). This factor is called the environmental load factor.
- the functional unit is 1 kg.
- API Application Programming Interface
- the food consumption estimation unit 130 and the environmental load estimation unit 150 are provided as APIs.
- the food consumption estimation unit 130 and the environmental load estimation unit 150 are provided as APIs.
- Data used by the food consumption estimation unit 130 is not limited to specific data, but the case of using the POS database of "Real shopper SM" described above will be described here.
- foodstuffs are labeled based on product names.
- the quantity (mass: kg, volume: L) is specified in the product name. If the quantity is specified in the product name, the total consumption ma of the product a is calculated as shown in Equation (1) below.
- a “label” may be called a "name”.
- a “product” may be called a "product”.
- n the number of products sold
- m label (a) the quantity described on the product label.
- the food consumption estimator 130 uses automated scripts to extract daily consumption from hundreds of foods.
- consumption ma is calculated using formula (2) below. If the quantity is not specified on the label of the product, it may be expressed as "no label” or "no name”.
- m a nr n /p n (2)
- r n is the daily total revenue of the sale of product a
- p n is the average unit price (yen/L, Yen/kg) calculated from the labeled products.
- the total consumption of food group (food group) n is calculated by the following formula (3).
- FIG. 5 shows an example of estimated consumption of pork, chicken, beef, and tofu in Japan.
- FIG. 5 shows consumption estimates for the period from June 2019 to June 2021 based on equations (1)-(3).
- the environmental load estimation unit 150 can calculate in (c) , which is the environmental load in index c (which may be called category c, indicator c, etc.) for the consumption of food group n, using the following equation (4).
- FIG. 6 represents the environmental load factor of index c of food group n.
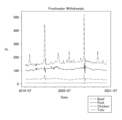
- Figures 6 to 10 show examples of the environmental impact of beef, pork, chicken, and tofu consumption in Japan. Each figure shows the environmental load from June 2019 to June 2021 for five indicators based on equation (4).
- Figure 6 represents the environmental load for greenhouse gas emissions
- Figure 7 represents the environmental load for eutrophic emissions
- Figure 8 represents the environmental load for acid emissions
- Figure 9 represents the environmental load for land use.
- FIG. 10 represents the environmental load for fresh water extraction.
- the total environmental load Ic of N food groups can be calculated as the sum of in (c) for food group n, as shown in Equation (5) below.
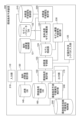
- FIG. 11 is a flow chart showing an algorithm for calculating food consumption and environmental load. A procedure for calculating food consumption and environmental load will be described with reference to FIG.
- the food consumption estimation unit 130 reads the product name of a from the consumption data of the food group n.
- the food consumption estimation unit 130 confirms whether or not the amount is specified for the product name of a, and if Yes, proceeds to S4, and if No, proceeds to S6.
- the food consumption data for each food group calculated by the food consumption estimation unit 130 in the process described above is stored in the food consumption storage unit 121 in the food future scenario quantitative analysis module 120 .
- the food consumption model construction unit 123 constructs a time-dependent model M(t, x 1 , . . . , x j ) of food consumption.
- x 1 to x j represent a finite number of model parameters. Examples of model parameters are described later.
- M(t, x 1 ,..., x j ) is a model that returns food consumption with time t and parameters x 1 ,..., x j as inputs. Depending on the model, there may be no input at time t (parameters x 1 , . . . , x j corresponding to time t are sufficient). Also, M(t, x 1 , . . . , x j ) may be constructed for each food group. Note that the unit of the time t may be any unit, such as a day unit or a month unit, depending on the model. For example, the input parameters may be parameters based on monthly future scenarios, and the output may be daily food consumption. Note that "parameter" may be used to mean the value of a parameter.
- the food consumption model building unit 123 builds the food consumption model M using the food consumption data stored in the food consumption storage unit 121 and the model parameters stored in the model parameter DB 122.
- the constructed model M is stored in the model storage unit 124 .
- FIG. 12 shows an example of a method that can be used to build such a model.
- the past daily temperature data is read from the model parameter DB 122, and the corresponding estimation for each day
- the calculated consumption amount is read from the food consumption amount storage unit 121, and learning is performed based on these past data to generate a model M that inputs temperature and outputs an estimated value of food consumption amount.
- the model M may be a neural network having weights obtained by learning, or a formula having coefficients obtained by learning (eg, formula for multiple regression analysis). Alternatively, it may be in a format other than these.
- the model parameters eg, time series data of past daily temperatures
- the weight of the neural network is set so that the output is the correct amount of food consumption. adjust. For example, an error backpropagation method or the like can be used for weight adjustment.
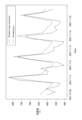
- Figure 13 shows an example of a consumption prediction of chicken consumption from June 28th to July 23rd, 2021, using a food consumption model built using LSTM.
- the environmental load estimation unit 150 uses the food consumption model M (t, x 1 , ..., x j ) constructed by the food consumption model construction unit 123 and the environmental load coefficient k c (n) , Based on (6), the future (future) environmental load of index c at time f is predicted.
- model parameters x 1 to x j are defined at a future time f based on future scenario assumptions.
- the values of model parameters x 1 to x j are, for example, values (predicted values, etc.) at future time f assuming a certain scenario.
- This model parameter is input from the quantitative future scenario input unit 125 .
- M(f, x 1 , . . . , x j ) calculates the predicted value of future food consumption. By multiplying this by the environmental load coefficient kc (n) , the environmental load can be predicted.
- the functional unit for calculating the predicted value of food consumption and the functional unit for estimating the environmental load may be separated.
- Fig. 14 shows the available model parameters and the temporal resolution of the available data. We also compared the temporal resolution of future scenarios in the literature with the temporal resolution of scenarios that could be analyzed using the proposed method.
- the Japan Meteorological Agency [29] publishes daily temperature data, as well as past data up to 1976, which can be used as training data. As future scenarios, for example, to predict future global and regional temperature changes due to climate change, atmospheric GHG concentrations are estimated based on four emission scenarios: RCP8.5, RCP6, RCP4.5 and RCP2.6. A representative concentration pathway (RCP) [30] can be used that defines . These scenarios have been used as the basis for climate simulations that provide monthly temperature forecasts from 2026 to 2100 [31], [32].
- the proposed method according to this embodiment can be used to predict possible changes in consumer behavior and the resulting environmental load based on long-term climate change impacts.
- the proposed method can also be used to model the effects of natural hazards such as typhoons and heat waves that are projected to be susceptible to climate change [33].
- Other weather-related variables such as humidity and rainfall can also be used as model parameters.
- model parameters used during learning and prediction in the present embodiment include at least one of temperature, population, social sentiment by SNS, and economic indicators. may be used.
- FIG. 15 is a flow chart for explaining the flow of the overall processing based on the processing of each unit described above. The flow of processing by the environmental load prediction device 100 will be described with reference to FIG.
- consumption data is input from the consumption DB 140 to the food consumption estimation unit 130.
- the food consumption estimation unit 130 calculates the consumption for each of, for example, 40 food groups in S102, and stores the consumption in the food consumption storage unit 121 in S103.
- the food consumption model construction unit 123 uses the consumption amount stored in the food consumption amount storage unit 121 and the model parameter DB 122 to construct a food consumption model for each food group, for example.
- the food consumption model construction unit 123 stores the food consumption model in the model storage unit 124 .
- quantitative future scenario parameters are input from the quantitative future scenario input unit 125.
- the input future scenario parameters may be passed to the environmental load estimation unit 150 after being stored in the model storage unit 124, or may be passed from the quantitative future scenario input unit 125 to the environmental load estimation unit 150. .
- the parameters of the food consumption model and the future scenario are input from the model storage unit 124 to the environmental load estimation unit 150.
- the food consumption predicted by the food consumption model and the parameters of the future scenario may be input to the environmental load estimation unit 150 .
- the environmental load estimating unit 150 multiplies the predicted value of food consumption obtained by the food consumption model using the parameters of the future scenario by the environmental load factor to perform the environmental load calculation, and in S109, A future predicted value of the environmental load is output via the output unit 170 .
- ⁇ Problems related to the second embodiment> Daily consumption patterns and subsequent environmental impacts are usually highly non-linear. This means that it is necessary to use state-space models, Poisson processes, Hawkes processes, Gaussian processes, deep learning, and other time series analysis regression methods that can capture nonlinear phenomena to make optimal forecasts. do. Note that the prediction method in the technology according to the present invention is not limited to these methods.
- Uncertainty is important in decision-making to assess risk and distinguish the reliability of predictions in various scenarios. For example, communicating uncertainties in climate change mitigation scenarios can increase credibility and improve the reliability of climate information.
- a food consumption model for predicting food consumption is constructed by the method used in the first embodiment.
- the uncertainty about building a model is explained.
- Epistemic uncertainty is the uncertainty of knowledge, the uncertainty due to the lack of knowledge and the fact that the data do not capture all the parameters that define the model output. Often the data at hand are incomplete, noisy, inconsistent, or multimodal.
- FIG. 16 shows a configuration example of the environmental load prediction device 200 in the second embodiment.
- the environmental load prediction device 200 in the second embodiment includes the functions of the environmental load prediction device 100 in the first embodiment.
- functional units denoted by the same reference numerals as in the configuration shown in FIG. 3 have the same functions as functional units denoted by the same reference numerals in the configuration shown in FIG.
- even functional units denoted by the same reference numerals as in the configuration shown in FIG. 3 may operate differently from the first embodiment.
- the environmental load prediction device 200 includes an input unit 110, a food consumption storage unit 121, a model parameter DB 122, a food consumption model construction unit 123, a model storage unit 124, a quantitative scenario input unit 125, and a consumption DB 140. , food consumption estimation unit 130, environmental load coefficient DB 160, environmental load estimation unit 150, consumption amount prediction unit 155, output unit 170, consumption amount uncertainty storage unit 210, consumption amount uncertainty estimation unit 220, model construction uncertainty It has a certainty estimation unit 230 , an environmental load prediction uncertainty estimation unit 240 , and an environmental load factor uncertainty storage unit 250 .
- the environmental load prediction device 200 may also be called an environmental load prediction system. Moreover, the environmental load prediction device 200 may be composed of one device (computer), or may be composed of a plurality of devices. The environmental load prediction device 200 may be called an uncertainty estimation device. Further, information can be exchanged between the two functional units in FIG. 16 as necessary even if they are not connected by a line.
- the consumption DB 140, the environmental load coefficient DB 160, and the model parameter DB 122 in FIG. 16 may each be provided outside the environmental load prediction device 200.
- the consumption uncertainty storage unit 210 stores, for example, information on the cost distribution of labeled (named) products. A standard deviation calculated from the distribution may be stored in the consumption uncertainty storage unit 210 .
- the consumption uncertainty estimation unit 220 estimates the uncertainty of food consumption based on the cost distribution of labeled products. The uncertainty we estimate here comes from unlabeled products.
- the model construction uncertainty estimation unit 230 estimates the uncertainty inherent in the model by a method corresponding to the modeling algorithm.
- a method corresponding to the modeling algorithm As an estimation method, bootstrap method, Monte Carlo dropout method, variational inference, etc. can be used.
- the model storage unit 124 stores the model constructed by the food consumption model construction unit 123 and the model uncertainty information obtained by the model construction uncertainty estimation unit 230 .
- the environmental load factor uncertainty storage unit 250 stores information on the uncertainty of environmental load factors (for example, distribution, dispersion, standard deviation, etc. of errors) based on statistical analysis of life cycle assessment research.
- the consumption prediction unit 155 acquires a food consumption model from the model storage unit 124 and acquires scenario parameters from the quantitative future scenario input unit 125 .
- the environmental load prediction uncertainty estimation unit 240 estimates the environmental load based on at least one of food consumption uncertainty information, model uncertainty information, and environmental load factor uncertainty information. Estimate forecast uncertainty.
- the uncertainty of environmental load prediction caused by the uncertainty of at least one of "food consumption, environmental load factor, and model construction” is quantitatively calculated (e.g. confidence intervals, upper and lower limits of error). This allows, for example, differentiating predictive confidence in environmental load prediction between different food groups. In addition, more accurate risk assessment becomes possible in environmental load prediction.
- the food consumption estimation unit 130 estimates the food consumption using the following formulas (1) and (2).
- the estimated food consumption is stored in the food consumption storage unit 121 . More specifically, it is as follows.
- the data set in this embodiment includes the amount of each product (eg, fish fillet A 200g, shrimp B 100g), daily earnings and number of purchases (number of sales). This is an example of information with a name.
- the dataset also includes unnamed products (unlabeled products), for which only revenue and sales numbers are included for each day.
- the food consumption estimation unit 130 calculates Qn and cn by the following formula (1).
- N is the total number of named products
- s i is the number of units sold of product i
- V i is the number of units sold for product i read from the product name (label).
- Volume and r i is the total daily revenue of product i.
- amount is, for example, weight.
- the food consumption estimating unit 130 calculates the total food consumption Q total per day as the sum of the consumption of named products Q n and the food consumption Q unnamed of unnamed products. More specifically, Q total is calculated by the following formula (2).
- p market is the market share. That is, p market is the ratio of the number of stores in the data sample to the total number of supermarkets in Japan. In the data set [13] used in this embodiment, p market is between 1.0 and 2.5% depending on the time of year.
- the food consumption estimation unit 130 also calculates the food consumption Q unnamed of unnamed products by the following formula (3).
- M in the above formula is the number of unnamed products and cn is the average cost of the named products (average cost per unit mass). Food consumption Qunnamed is estimated by dividing total revenue by cost.
- the value calculated by the food consumption estimation unit 130 is stored in the food consumption storage unit 121.
- the consumption uncertainty estimation unit 220 estimates the uncertainty of the food consumption using Equation (4) described later. More specifically, it is as follows.
- the consumption uncertainty estimation unit 220 uses the error propagation formula shown in Equation (4) below to estimate the food consumption of unnamed products. Calculate the uncertainty ⁇ Q unnamed .
- the uncertainty ⁇ Q unnamed may be referred to as food consumption accuracy.
- ⁇ (c n ) is the standard deviation of the distribution of “cost per unit mass” of named products (labeled products). Note that the standard deviation is an example of statistical information.
- the distribution of "cost per unit mass" of named products is stored in the consumption uncertainty storage unit 210, and the consumption uncertainty estimation unit 220 stores the distribution as Read from the consumption uncertainty storage unit 210 and calculate the standard deviation ⁇ (c n ).
- Data necessary for calculation other than the distribution are stored in, for example, the food consumption storage unit 121, and the consumption uncertainty estimation unit 220 stores the data read from the food consumption storage unit 121 (such as cn ) and Equation (4) is calculated using the standard deviation ⁇ (c n ).
- Uncertainty may be calculated by paying attention to factors other than unnamed products as uncertainty factors. Also, for estimating uncertainty (error), methods other than the method using the error propagation formula may be used.
- the food consumption model building unit 123 builds a food consumption model from the food consumption amount.
- the upper bound may be called the upper bound
- the lower bound may be called the lower bound.
- one model may be constructed as in the first embodiment. Even with one model, the uncertainty of environmental load prediction can be estimated based on the uncertainty of the model or the uncertainty of the environmental load factor, which will be described later.
- the model construction method itself in the food consumption model construction unit 123 may be the same as the method described in the first embodiment.
- the model that uses the upper limit of food consumption is called the model (upper limit)
- the model that uses the lower limit of food consumption is called the model (lower limit).
- the model building uncertainty estimator 230 estimates the bounds of uncertainty (upper and lower bounds) for the modeling method used in the food consumption model builder 123. That is, the uncertainty of the model constructed by the food consumption model construction unit 123 is estimated.
- Any method may be used to estimate the uncertainty of the model, that is, the uncertainty of the values predicted by the model (distribution of predicted values, upper and lower limits of error, etc.).
- methods such as bootstrapping can be used for the modeling method of the state space model.
- Methods such as the Bayesian approach and the Frequentist approach can be used for Gaussian process modeling methods.
- the functions contained in the library eg using posterior probabilities.
- scenario parameters are input from the quantitative future scenario input unit 125 to the consumption forecast unit 155 .
- Scenario parameters are described as parameters based on future scenarios in the first embodiment.
- the consumption prediction unit 155 determines the boundary of the uncertainty of food consumption prediction (e.g., error range, error upper limit and lower bounds).
- the method itself for predicting food consumption (predicting environmental load) from scenario parameters is as described in the first embodiment. That is, by inputting scenario parameter values x 1 , . . . , x j into the food consumption model M (f, x 1 , . It is possible to obtain predictions of food consumption in
- model (upper limit) is used to calculate the predicted value of food consumption
- model (lower limit) is used to calculate the predicted value of food consumption. Note that one model may be used as described above.
- the consumption prediction unit 155 calculates the prediction value of food consumption by the model (upper limit) and the prediction value of food consumption by the model (lower limit) based on the estimation result of the uncertainty of the model calculated in S205. Calculate the uncertainty (range of error) for
- the consumption prediction unit 155 estimates the boundaries of the uncertainty of food consumption prediction (range of error, upper and lower limits of error, etc.).
- the consumption prediction unit 155 sets the upper limit of the predicted value of food consumption to the larger one of E + e and F + f, and sets the lower limit of the predicted value of food consumption to Ee and Ff. As the smaller one, it can be estimated.
- the environmental load estimator 150 converts the prediction of food consumption into the prediction of environmental load using equation (5).
- kc (n) is the environmental load factor.
- the values of the model parameters x 1 -x j are defined at a future time f based on future scenario assumptions.
- the values of model parameters x 1 to x j are, for example, values (predicted values, etc.) at future time f assuming a certain scenario.
- This model parameter is input from the quantitative future scenario input unit 125 .
- the predicted value of the environmental load obtained from the upper limit of the food consumption prediction is set as the upper limit of the environmental load with uncertainty
- the predicted value of the environmental load obtained from the lower limit of the food consumption prediction is set as the uncertainty.
- the uncertainty of environmental load prediction may be estimated as follows.
- the formula for calculating the environmental load is shown in the following formula (6).
- the following formula (6) shows the environmental load due to food consumption of food group (food group) k.
- c i,k is the environmental load factor for index i of food group k.
- the environmental load factor is as described in the first embodiment.
- Q k is the total food consumption of food group k and can be calculated, for example, by equation (2).
- Ik is the environmental load.
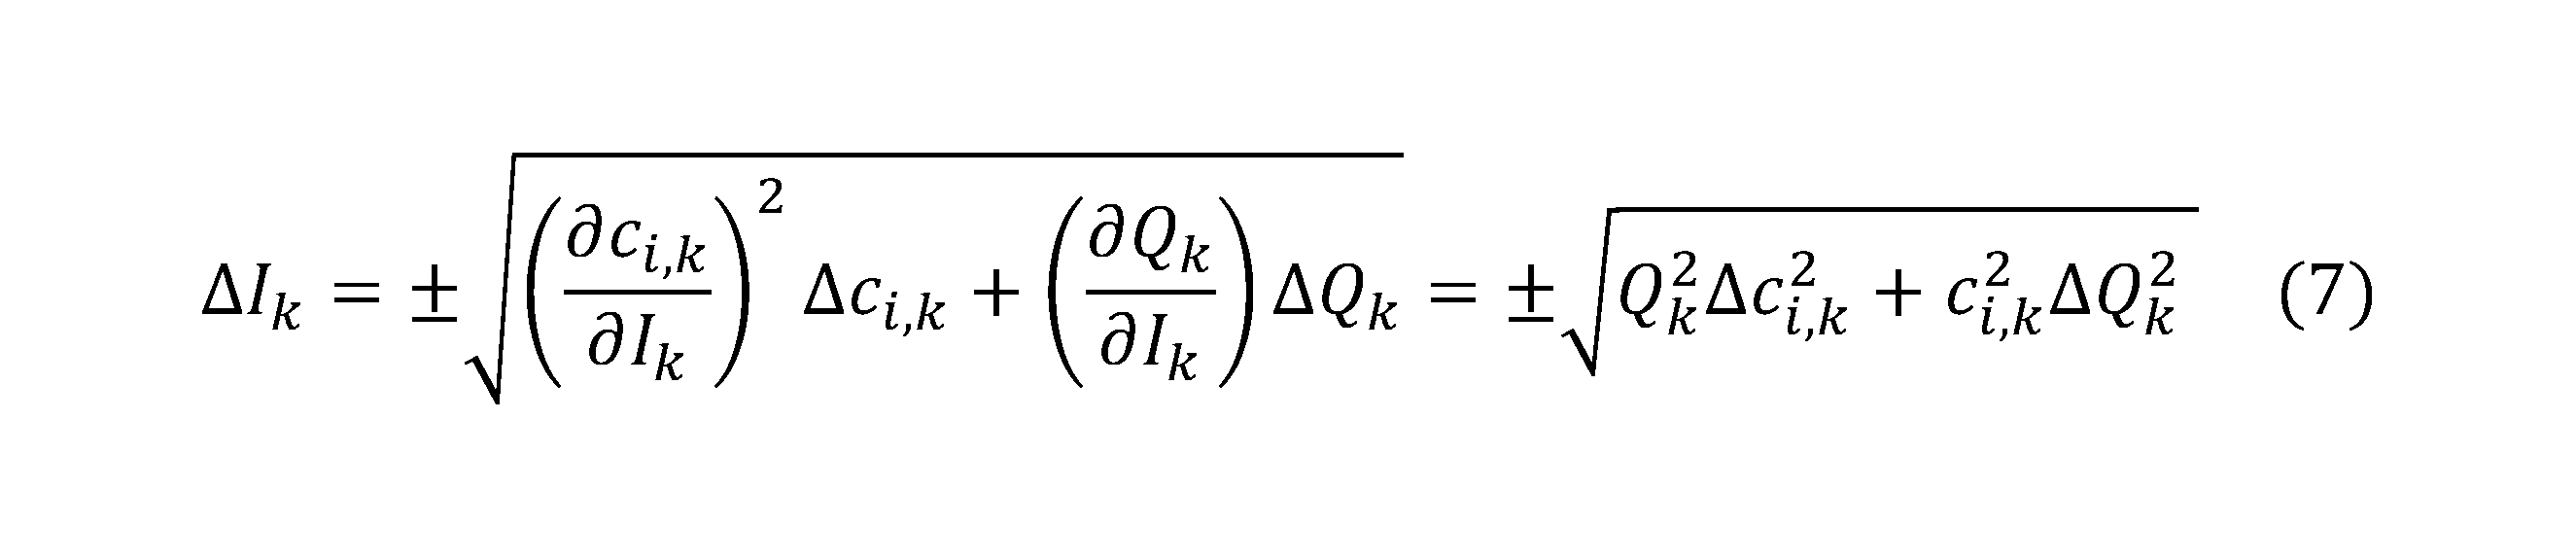
- the environmental load prediction uncertainty estimator 240 calculates the uncertainty of Ik by calculating the following error propagation formula. That is, the + value on the rightmost side calculated in Equation (7) is the upper limit of the uncertainty (error) of I k , and the ⁇ value is the lower limit of the uncertainty (error) of I k .
- Equation (7) ' ⁇ c i,k 2 ' is the variance of the environmental load factor, and ' ⁇ Q k 2 ' is the variance of the food consumption.
- the environmental load factor uncertainty storage unit 250 stores the variance of the environmental load factor
- the environmental load prediction uncertainty estimation unit 240 stores the variance of the environmental load factor from the environmental load factor uncertainty storage unit 250. is used to calculate the uncertainty of Ik .
- the environmental load factor uncertainty storage unit 250 stores the distribution of the environmental load factor
- the environmental load prediction uncertainty estimation unit 240 stores the distribution of the environmental load factor from the environmental load factor uncertainty storage unit 250. , and may be used to calculate the uncertainty of Ik .
- the variance of Q k may be estimated from the uncertainty boundaries (upper and lower limits) of food consumption calculated by Equation (4), or from the standard deviation ⁇ (c n ).
- Q k is the predicted value of food consumption and I k is the predicted value of environmental load. That is, let Q k be M(f, x 1 , . . . , x j ), I k be I c (f), and c i,k be k c(n) .
- the environmental load prediction uncertainty estimating unit 240 can calculate the uncertainty of the predicted value of the environmental load as ⁇ I k using Equation (7).
- the distribution of the environmental load factor used here is as described above.
- the uncertainty boundary of the food consumption prediction estimated by the consumption prediction unit 155 (error range, upper and lower limits of error, etc.) is used. can be estimated using
- the output unit 170 outputs a value ( ⁇ I k ) indicating the uncertainty of the predicted value of the environmental load. Specifically, for example, the output unit 170 outputs the upper and lower limits of the uncertainty (error) of the predicted value of the environmental load.
- an uncertainty estimation device 300 including a first estimation unit 310 and a second estimation unit 320 may be provided.
- the environmental load prediction device 200 is an example of the uncertainty estimation device 300.
- the consumption uncertainty estimation unit 220 corresponds to the first estimation unit 310
- the environmental load prediction uncertainty estimation unit 240 corresponds to the second estimation unit 310.
- the uncertainty estimation device 300 may further include a third estimation section corresponding to the model building uncertainty estimation section 230 .
- the first estimation unit 310 estimates the uncertainty of food consumption estimated by the food consumption estimation unit 130, for example.
- the second estimating unit 320 converts the uncertainty of the environmental load prediction value predicted by the environmental load estimating unit 150 into Estimate based on certainty.
- the environmental load prediction devices 100 and 200 and the uncertainty estimation device 300 can be implemented, for example, by causing a computer to execute a program. This computer may be a physical computer or a virtual machine on the cloud.
- the environmental load prediction devices 100 and 200 and the uncertainty estimation device 300 are collectively called "apparatus".
- the device can be realized by executing a program corresponding to the processing performed by the device using hardware resources such as a CPU and memory built into the computer.
- the above program can be recorded in a computer-readable recording medium (portable memory, etc.), saved, or distributed. It is also possible to provide the above program through a network such as the Internet or e-mail.
- FIG. 19 is a diagram showing a hardware configuration example of the computer.
- the computer of FIG. 19 has a drive device 1000, an auxiliary storage device 1002, a memory device 1003, a CPU 1004, an interface device 1005, a display device 1006, an input device 1007, an output device 1008, etc., which are interconnected by a bus BS. Note that some of these devices may not be provided. For example, the display device 1006 may not be provided when no display is performed.
- a program that implements the processing in the computer is provided by a recording medium 1001 such as a CD-ROM or memory card, for example.
- a recording medium 1001 such as a CD-ROM or memory card
- the program is installed from the recording medium 1001 to the auxiliary storage device 1002 via the drive device 1000 .
- the program does not necessarily need to be installed from the recording medium 1001, and may be downloaded from another computer via the network.
- the auxiliary storage device 1002 stores installed programs, as well as necessary files and data.
- the memory device 1003 reads and stores the program from the auxiliary storage device 1002 when a program activation instruction is received.
- the CPU 1004 implements functions related to the device according to programs stored in the memory device 1003 .
- the interface device 1005 is used as an interface for connecting to the network.
- a display device 1006 displays a GUI (Graphical User Interface) or the like by a program.
- An input device 1007 is composed of a keyboard, a mouse, buttons, a touch panel, or the like, and is used to input various operational instructions.
- the output device 1008 outputs the calculation result.
- time series analysis based on parameters with a time resolution of less than 1 year (a finer time than 1 year is possible) such as temperature, population, social sentiment by SNS, economic index, etc. , can predict future environmental loads.
- the food consumption estimation unit 130 analyzes consumption data sets of thousands of food products, for example, by scripts (programs) for automatic processing, thereby calculating the consumption data for each food group. Quantities can be estimated and predicted, and the environmental impact of each food group can be predicted.
- the technology according to the second embodiment makes it possible to quantitatively indicate uncertainty in environmental load prediction. Quantifying uncertainties in environmental load forecasts can distinguish the reliability between different forecasts and increase the reliability of forecasts when communicating forecasts for more accurate risk assessment.
- the environmental load prediction device according to claim 1 or 2, further comprising an environmental load estimation unit.
- the consumption amount of each food group is estimated using data read from a POS database storing food consumption data, and the estimated consumption amount of each food group is stored in the food consumption storage unit. 4.
- the environmental load prediction device according to any one of items 1 to 3, further comprising a food consumption estimation unit.
- a model building method comprising: building a food consumption model for predicting future food consumption using the consumption and parameters with a temporal resolution of less than one year.
- Appendix 2 This specification discloses at least the following uncertainty estimation device, uncertainty estimation method, and program.
- (Appendix 2) The uncertainty estimation device according to additional item 1, wherein the processor estimates the uncertainty of the food consumption using an error propagation formula.
- Appendix 3) 3. The uncertainty estimation device according to appendix 1 or 2, wherein the processor estimates the uncertainty of the food consumption due to unnamed products based on statistical information of named products.
- (Appendix 4) Further comprising a model building unit for building two food consumption models, a food consumption model corresponding to the upper limit of the uncertainty of the food consumption and a food consumption model corresponding to the lower limit of the uncertainty of the food consumption.
- Item 4. The uncertainty estimation device according to any one of Items 1 to 3.
- (Appendix 5) The uncertainty estimation device according to any one of additional items 1 to 4, wherein the processor estimates the uncertainty of the environmental load prediction value based on the uncertainty of the food consumption model. (Appendix 6)
- the processor estimates the uncertainty of the environmental load prediction value based on the uncertainty of the environmental load factor used to calculate the environmental load prediction value. Uncertainty estimator according to the item.
- Appendix 7 A computer implemented uncertainty estimation method comprising: estimating the uncertainty of the estimated food consumption; and estimating the uncertainty of the environmental load prediction value predicted using the food consumption model constructed based on the food consumption based on the uncertainty of the food consumption.
- Appendix 8 A non-temporary storage medium storing a program for causing a computer to function as each part of the uncertainty estimation device according to any one of additional items 1 to 6.
- Environmental load prediction device 110 Input unit 120 Food consumption future scenario quantitative analysis module 121 Food consumption storage unit 122 Model parameter DB 123 Food consumption model construction unit 124 Model storage unit 125 Quantitative scenario input unit 130 Food consumption estimation unit 140 Consumption DB 150 Environmental load estimation unit 155 Consumption prediction unit 160 Environmental load factor DB 170 Output unit 200 Environmental load prediction device 210 Consumption uncertainty storage unit 220 Consumption uncertainty estimation unit 230 Model building uncertainty estimation unit 240 Environmental load prediction uncertainty estimation unit 250 Environmental load factor uncertainty storage unit 300 uncertainty estimation device 310 first estimation unit 320 second estimation unit 1000 drive device 1001 recording medium 1002 auxiliary storage device 1003 memory device 1004 CPU 1005 interface device 1006 display device 1007 input device 1008 output device
Landscapes
- Engineering & Computer Science (AREA)
- Business, Economics & Management (AREA)
- Human Resources & Organizations (AREA)
- Theoretical Computer Science (AREA)
- Economics (AREA)
- General Physics & Mathematics (AREA)
- Entrepreneurship & Innovation (AREA)
- Physics & Mathematics (AREA)
- Strategic Management (AREA)
- Tourism & Hospitality (AREA)
- Computational Linguistics (AREA)
- Quality & Reliability (AREA)
- Marketing (AREA)
- Game Theory and Decision Science (AREA)
- General Business, Economics & Management (AREA)
- Educational Administration (AREA)
- Development Economics (AREA)
- Artificial Intelligence (AREA)
- Operations Research (AREA)
- Data Mining & Analysis (AREA)
- Evolutionary Computation (AREA)
- Computing Systems (AREA)
- General Engineering & Computer Science (AREA)
- Mathematical Physics (AREA)
- Software Systems (AREA)
- Management, Administration, Business Operations System, And Electronic Commerce (AREA)
Abstract
不確実性推計装置において、推計された食料消費量の不確実性を推計する第1推計部と、前記食料消費量に基づき構築された食料消費モデルを用いて予測された環境負荷予測値の不確実性を、前記食料消費量の不確実性に基づいて推計する第2推計部とを備える。
Description
本発明は、食料消費による環境負荷を予測する技術に関連するものである。
まず、背景技術について説明する。なお、本明細書において参考にする文献については、"[1]"などにより表記し、対応する文献名については最後にまとめて記載した。
気候変動の緊急性が高まる中、地球温暖化による社会のリスクが高まっている。気候変動に強い持続可能な社会を実現するためには、食料及び水の安全保障という人間の基本的ニーズを満たすことを優先しなければならない。
気候変動緩和政策では見落とされることが多いが、食料システムは重大な環境への影響を持つ。世界の食料生産により、2015年には約18Gtの温室効果ガスを排出したと推定されており、これは世界の排出量の34%に相当する[1]。
さらに、農業灌漑は毎年淡水取水の2/3を占め、世界の氷と砂漠のない土地の水の43%を使用している[2]。こうした膨大な資源の投入にもかかわらず、2011年のFAOは、人間が消費するために生産された食料の1/3が無駄になっていると推定している[3]。
環境を犠牲にすることなく食料需要の増大に対応し、気候変動に対応することは、21世紀において人類が直面する最大の課題の一つである[4]。世界の人口が年間8300万人以上増加する中[5]、栄養価の高い食料の需要が高まっている。
グローバル化と可処分所得の増加はまた、資源集約的な西洋食の採用増加につながっている[6]、[7]。この傾向が続けば、食料需要は地球の限界を超えると予測される[8]。将来の農業の拡大と集約化のシナリオを分析すると、生産面での効率性の向上を図っても、増大する世界的な需要を満たしつつ、気候変動緩和目標を達成するには不十分である[9]。気候変動への適応と緩和戦略を前進させるためには、食料消費習慣の変化が不可欠であるとの指摘が増えている[2]、[9]~[12]。
B. Bajzelj et al., "Importance of food-demand management for climate mitigation," Nature Climate Change, vol. 4, no. 10, Art. no. 10, Oct. 2014, doi: 10.1038/nclimate2353.
D. Tilman, C. Balzer, J. Hill, and B. L. Befort, "Global food demand and the sustainable intensification of agriculture," PNAS, vol. 108, no. 50, pp. 20260-20264, Dec. 2011, doi: 10.1073/pnas.1116437108.
気候変動緩和目標の進捗を追跡するためには、食料消費パターンとその結果として生じる環境への影響(負荷)をリアルタイムで定量化し、予測することが必要である。しかし、将来(未来)の食料需要とその環境負荷を予測する研究は少なく、マクロレベルの予測が1年よりも粗い時間分解能で与えられているに過ぎない[8]-[10]、[13]-[17]。
従来の研究では、多重回帰[9]、部分平衡モデル[16]および統合評価モデル[17]を用いて、食料システムの環境負荷の変化を予測していた。これらの従来の方法は、国および世界レベルの人口、GDPおよび平均作物収量などのマクロスケールのパラメータに焦点を当てている。このマクロレベルのデータは編集が難しく、ほとんどのデータは1年よりも粗い時間分解能でしか入手できない。しかし、現在の気候変動緩和目標の緊急性を考えると、環境負荷予測のための時間分解能が1年では不十分である。
また、現在のマクロレベルのアプローチでは、自然災害、国レベルの経済変化、消費者意識の変化、文化的要因などの局所的な現象の、様々な食品群の消費レベルに対する影響、およびその結果として生じる環境への影響(負荷)を予測するには不十分である。
複数の研究において、緩和目標を確実に達成するためには、持続可能な食料システムへの移行のための政策を作成し、その政策を地域レベルでカスタマイズしなければならないことが述べられている[2]、[4]。環境負荷予測を構成食料群に分解することは、文化的な食事の好みと生産制約に特化した国家レベルの戦略を設計するために特に重要である。
上記の点から、従来技術よりも細かな時間分解能で、食料群毎の環境負荷を予測することが望ましい。
従来技術よりも細かな時間分解能で環境負荷を予測することに限らず、環境負荷予測全般において、いずれの手法を用いる場合でも、環境負荷予測には不確実性が含まれる。環境負荷予測の信頼性を判断するためには、不確実性を定量的に算出することが重要であるが、従来技術においては、環境負荷予測の不確実性を定量的に算出することができなかった。
本発明は上記の点に鑑みてなされたものであり、食料による環境負荷を予測する技術において、環境負荷の予測の不確実性を定量的に算出することを可能とする技術を提供することを目的とする。
開示の技術によれば、推計された食料消費量の不確実性を推計する第1推計部と、
前記食料消費量に基づき構築された食料消費モデルを用いて予測された環境負荷予測値の不確実性を、前記食料消費量の不確実性に基づいて推計する第2推計部と
を備える不確実性推計装置が提供される。
前記食料消費量に基づき構築された食料消費モデルを用いて予測された環境負荷予測値の不確実性を、前記食料消費量の不確実性に基づいて推計する第2推計部と
を備える不確実性推計装置が提供される。
開示の技術によれば、食料による環境負荷を予測する技術において、環境負荷の予測の不確実性を定量的に算出することを可能とする技術が提供される。
以下、図面を参照して本発明の実施の形態(本実施の形態)を説明する。以下で説明する実施の形態は一例に過ぎず、本発明が適用される実施の形態は、以下の実施の形態に限られるわけではない。以下では、第1実施形態と第2実施形態を説明する。なお、以下の説明において、「推計」を「推定」に置き換えてもよい。
(第1実施形態の概要)
従来手法では、図1に示すように、環境負荷について、マクロレベルの長期の予測しかできなかった。これに対し、本実施形態では、図2に示すように、時系列モデリングに基づく食料消費モデルを構築することで、様々な食料群それぞれの将来の環境負荷を、従来よりも細かな時間分解能(例えば1日)で予測可能である。このような予測を、後述する環境負荷予測装置100が実行する。
従来手法では、図1に示すように、環境負荷について、マクロレベルの長期の予測しかできなかった。これに対し、本実施形態では、図2に示すように、時系列モデリングに基づく食料消費モデルを構築することで、様々な食料群それぞれの将来の環境負荷を、従来よりも細かな時間分解能(例えば1日)で予測可能である。このような予測を、後述する環境負荷予測装置100が実行する。
食料消費モデルの性能は、温度、テキストマイニングに基づく集団感情[18]、日経225株価指数[19]、一致指数[20]などの経済指標など、を含む高解像度モデルパラメータの導入によって向上させている。モデルパラメータの詳細については後述する。
図2に示すように、環境負荷の将来(未来)予測は、マクロレベルで行うこともできるし、個々の食料群毎に行うこともできる。これにより環境負荷予測を環境負荷削減目標と継続的に比較して、様々な食料群にわたる進捗状況を追跡することができる。
以下、第1実施形態における環境負荷予測装置100の構成と動作について詳細に説明する。
(第1実施形態:装置構成例)
図3に、本実施形態における環境負荷予測装置100の構成例を示す。図3に示すように、環境負荷予測装置100は、入力部110、消費DB(データベース)140、食料消費量推計部130、食料消費未来シナリオ定量分析モジュール120、環境負荷係数DB160、環境負荷推計部150、及び出力部170を有する。
図3に、本実施形態における環境負荷予測装置100の構成例を示す。図3に示すように、環境負荷予測装置100は、入力部110、消費DB(データベース)140、食料消費量推計部130、食料消費未来シナリオ定量分析モジュール120、環境負荷係数DB160、環境負荷推計部150、及び出力部170を有する。
また、食料消費未来シナリオ定量分析モジュール120は、食料消費量格納部121、モデルパラメータDB122、食料消費モデル構築部123、モデル格納部124、定量的シナリオ入力部125を有する。
なお、環境負荷予測装置100を環境負荷予測システムと呼んでもよい。また、環境負荷予測装置100は、1つの装置(コンピュータ)で構成されていてもよいし、複数の装置で構成されていてもよい。また、環境負荷予測装置100には食料未来シナリオ定量分析モジュール120のみが備えられ、図3におけるそれ以外の機能部が環境負荷予測装置100の外部に備えられてもよい。食料未来シナリオ定量分析モジュール120を備える装置をモデル学習装置と呼んでもよい。
また、図3における消費DB140、環境負荷係数DB160、及びモデルパラメータDB122はそれぞれ、環境負荷予測装置100の外部に備えられてもよい。
主要な部位の概要は下記のとおりである。詳細については後述する。
入力部110は、処理に必要なデータを入力する。食料消費量推計部130は、消費DB140からの入力を用いて食料消費量を推計する。食料消費未来シナリオ定量分析モジュール120は、40以上の食料群それぞれにおける日々の食料消費量と高解像度モデルパラメータに基づき、食料消費モデルの構築を行って、当該食料消費モデルを格納する。
環境負荷推計部150は、食料消費未来シナリオ定量分析モジュール120におけるモデル格納部124からのモデルと、環境負荷係数DB160から得られた環境負荷係数とを用いて環境負荷を予測する。出力部170は、定量的な食料消費シナリオに基づく日々の環境負荷予測を出力する。以下、各部の詳細を説明する。
<消費DB140>
消費DB140は、広範囲の国と地域における、生鮮食料の日々の消費データを格納し、利用可能とするためのDBである。消費DB140は、外部から取得した消費データを格納する。あるいは、消費DB140は、環境負荷予測装置100の外部に備えられる、以下で説明するPOSサービス提供者のDBであってもよい。
消費DB140は、広範囲の国と地域における、生鮮食料の日々の消費データを格納し、利用可能とするためのDBである。消費DB140は、外部から取得した消費データを格納する。あるいは、消費DB140は、環境負荷予測装置100の外部に備えられる、以下で説明するPOSサービス提供者のDBであってもよい。
消費DB140の消費データについて、日々の情報を得られるものであれば、どのようなデータであってもよいが、本実施の形態では、一例として、Shopper Insight Corporation[21]によって提供される「Real shopper SM」のPOS(Point of Sales)DBを使用している。
このデータベースは、日本のスーパーマーケットからの、肉、魚、果物および野菜を含む生鮮食料の収益および販売数を含むデータを格納し、JAN(Japanese Article Numbering)コードを持たない製品も扱う。日本市場のみに焦点を当てた他のスーパーマーケットPOSデータベースには加工食品が含まれているため、「Real shopper SM」のPOS-DBを使用することが好ましい。
<環境負荷係数DB160>
文献[2]により、119カ国の38,700の商業的に採算の合う農場にわたって、世界のカロリーとタンパク質消費量の約90%を占める40の食料群のライフサイクル分析(LCA)の結果がまとめられている。具体的には、温室効果ガス(GHG)排出量(kgCO2換算)、土地利用(m2年)、酸性排出量(gSO2換算)、富栄養化排出量(gPO4 3-換算)および淡水採取量(kL換算)に対する環境負荷係数が開示されている。
文献[2]により、119カ国の38,700の商業的に採算の合う農場にわたって、世界のカロリーとタンパク質消費量の約90%を占める40の食料群のライフサイクル分析(LCA)の結果がまとめられている。具体的には、温室効果ガス(GHG)排出量(kgCO2換算)、土地利用(m2年)、酸性排出量(gSO2換算)、富栄養化排出量(gPO4 3-換算)および淡水採取量(kL換算)に対する環境負荷係数が開示されている。
環境負荷係数DB160には、文献[2]に基づくデータが格納されている。図4に、文献[2]により公開されているデータ、つまり、環境負荷係数DB160に格納されるデータの一例(40の食料群のうちの一部)を示す。図4に示すデータは、機能単位当たりの、生産面積に占有年数を乗じたもの(m2年/機能単位)として定義される、土地利用に関する統計的な係数のサンプルを示している。当該係数を環境負荷係数と呼ぶ。機能単位は1kgである。
<API>
日々の消費データのインポートとそれに続く食料消費量の計算、及び環境負荷の計算を自動化するために、API(アプリケーションプログラミングインタフェイス)が備えられている。具体的には、食料消費量推計部130及び環境負荷推計部150がAPIとして提供される。ただし、食料消費量推計部130及び環境負荷推計部150がAPIとして提供されることは一例である。
日々の消費データのインポートとそれに続く食料消費量の計算、及び環境負荷の計算を自動化するために、API(アプリケーションプログラミングインタフェイス)が備えられている。具体的には、食料消費量推計部130及び環境負荷推計部150がAPIとして提供される。ただし、食料消費量推計部130及び環境負荷推計部150がAPIとして提供されることは一例である。
食料消費量推計部130及び環境負荷推計部150の処理を自動化することで、新しい訓練データを時系列分析モデルに入力し、環境負荷予測を継続的に改善することが可能になる。
<食料消費量推計部130>
食料消費量推計部130が利用するデータ(消費DB140のデータ)は特定のデータに限定されないが、ここでは前述した「Real shopper SM」のPOSデータベースを利用する場合について説明する。
食料消費量推計部130が利用するデータ(消費DB140のデータ)は特定のデータに限定されないが、ここでは前述した「Real shopper SM」のPOSデータベースを利用する場合について説明する。
当該POSデータベースでは、食料にはプロダクト(製品、商品、生産物)名に基づいてラベルが付けられている。一部のプロダクトでは、プロダクト名に数量(質量:kg、容積:L)が指定されている。プロダクト名に数量が指定されている場合、そのプロダクトaの総消費量maは下記の式(1)に示すように計算される。「ラベル」を「名前」と呼んでもよい。「プロダクト」を「製品」と呼んでもよい。
ma=nmlabel(a) (1)
ここで、nは販売数、mlabel(a)はプロダクトラベルに記載されている量である。食料消費量推計部130は自動スクリプトを使用して、数百の食料から日々の消費量を抽出する。
ここで、nは販売数、mlabel(a)はプロダクトラベルに記載されている量である。食料消費量推計部130は自動スクリプトを使用して、数百の食料から日々の消費量を抽出する。
プロダクトのラベルに数量が明記されていないプロダクトでは、消費量maは下記の式(2)を用いて計算される。プロダクトのラベルに数量が明記されていないことを「ラベルなし」、「名前なし」と表現してもよい。
ma=nrn/pn (2)
ここで、rnは、プロダクトaの販売の日毎の総収益であり、pnは、ラベル付きプロダクトから計算された平均単価(円/L、円/kg)である。
ここで、rnは、プロダクトaの販売の日毎の総収益であり、pnは、ラベル付きプロダクトから計算された平均単価(円/L、円/kg)である。
食料群(食品グループ)nの総消費量は、次の式(3)により計算される。
Mn=(1/w)Σa
Ama (3)
ここで、Aは食料群nのプロダクト総数である。日本の総消費量を推計するには、MnをPOSデータにおける市場シェア(Shopper Insight Databaseでは1.8%)で分割する。日本における豚肉、鶏肉、牛肉、豆腐の消費量の推定例を図5に示す。図5は、式(1)~式(3)に基づく、2019年6月から2021年6月までの期間の消費量推定値を示す。
ここで、Aは食料群nのプロダクト総数である。日本の総消費量を推計するには、MnをPOSデータにおける市場シェア(Shopper Insight Databaseでは1.8%)で分割する。日本における豚肉、鶏肉、牛肉、豆腐の消費量の推定例を図5に示す。図5は、式(1)~式(3)に基づく、2019年6月から2021年6月までの期間の消費量推定値を示す。
<環境負荷推計部150>
環境負荷推計部150は、食料群nの消費量に対する指標c(カテゴリc、インジケータcなどと呼んでもよい)における環境負荷であるin(c)を、次の式(4)により計算できる。
環境負荷推計部150は、食料群nの消費量に対する指標c(カテゴリc、インジケータcなどと呼んでもよい)における環境負荷であるin(c)を、次の式(4)により計算できる。
in(c)=kn(c)Mn (4)
ここで、kn(c)は食料群nの指標cの環境負荷係数である。日本の牛肉、豚肉、鶏肉、豆腐の消費による環境負荷の例を図6~10に示す。各図は、式(4)に基づく、5つの指標についての、2019年6月から2021年6月までの環境負荷を示す。図6は、温室効果ガス排出についての環境負荷を表し、図7は、富栄養化排出についての環境負荷を表し、図8は、酸性排出についての環境負荷を表し、図9は、土地利用についての環境負荷を表し、図10は、淡水採取についての環境負荷を表す。
ここで、kn(c)は食料群nの指標cの環境負荷係数である。日本の牛肉、豚肉、鶏肉、豆腐の消費による環境負荷の例を図6~10に示す。各図は、式(4)に基づく、5つの指標についての、2019年6月から2021年6月までの環境負荷を示す。図6は、温室効果ガス排出についての環境負荷を表し、図7は、富栄養化排出についての環境負荷を表し、図8は、酸性排出についての環境負荷を表し、図9は、土地利用についての環境負荷を表し、図10は、淡水採取についての環境負荷を表す。
N個の食料群の環境負荷の合計Icは、下記の式(5)に示すように、食料群nについてのin(c)の合計として計算できる。
Ic=Σn
Nin(c) (5)
<食料消費量及び環境負荷の計算のフロー>
図11は、食料消費量及び環境負荷の計算のアルゴリズムを示すフローチャートである。図11を参照して、食料消費量及び環境負荷の計算手順を説明する。
<食料消費量及び環境負荷の計算のフロー>
図11は、食料消費量及び環境負荷の計算のアルゴリズムを示すフローチャートである。図11を参照して、食料消費量及び環境負荷の計算手順を説明する。
S1において、初期化を行う。具体的には、n=1、a=1、Mn=0、Ic=0とする。S2において、食料消費量推計部130は、食料群nの消費データからaのプロダクト名を読み取る。
S3において、食料消費量推計部130は、aのプロダクト名に対して量が特定されているかどうかを確認し、YesであればS4に進み、NoであればS6に進む。
食料消費量推計部130は、S4において、ma=nmlabel(a)を計算し、S5において、Mn=Mn+maとする。食料消費量推計部130は、S6において、ma=nrn/pnを計算し、S7において、Mn=Mn+maとする。
S8において、a=a+1とする。S9において、a≦AがYesであればS2に戻り、NoであればS10に進む。
S10において、環境負荷推計部150は、in(c)=kn(c)Mnを計算する。S11において、環境負荷推計部150は、Ic=Ic+in(c)を計算する。S12において、n=n+1とし、S13においてn≦NがYesであればS2に戻り、Noであれば処理を終了する。
食料消費量推計部130で上記の処理の過程で算出された食料群毎の食料消費量のデータは、食料未来シナリオ定量分析モジュール120における食料消費量格納部121に格納される。
<食料消費モデル構築部123>
食料消費による環境負荷を予測するために、まず、食料消費モデル構築部123が、食料消費量の時間依存モデルM(t,x1,...,xj)を構築する。ここで、x1~xjは、有限個のモデルパラメータを表す。モデルパラメータの例については後述する。
食料消費による環境負荷を予測するために、まず、食料消費モデル構築部123が、食料消費量の時間依存モデルM(t,x1,...,xj)を構築する。ここで、x1~xjは、有限個のモデルパラメータを表す。モデルパラメータの例については後述する。
M(t,x1,...,xj)は、時刻t、及び、パラメータx1,...,xjを入力として食料消費量を返すモデルである。なお、モデルによっては、時刻tの入力がなくてもよい(時刻tに対応するパラメータx1,...,xjがあればよい)。また、M(t,x1,...,xj)は食料群毎に構築されてもよい。なお、時刻tの単位は、日単位、月単位等、モデルによってどのような単位であってもよい。例えば、入力パラメータが月単位の将来シナリオに基づくパラメータであり、出力が日単位の食料消費量となってもよい。なお、「パラメータ」をパラメータの値の意味で使用する場合がある。
食料消費モデル構築部123は、食料消費量格納部121に格納されている食料消費量のデータと、モデルパラメータDB122に格納されているモデルパラメータを用いて、食料消費モデルMを構築する。構築したモデルMはモデル格納部124に格納される。
食料消費モデルの構築には、多くの様々な方法を用いることができる。図12に、このようなモデルを構築するために使用できる方法の例を示す。
簡単な例として、日々の気温の変化に応じた食料群n(例えば「米」)のモデルMを構築する場合、過去の日々の気温のデータをモデルパラメータDB122から読み出し、各日の対応する推計された消費量を食料消費量格納部121から読み出し、これらの過去のデータに基づき学習を行うことで、気温を入力して食料消費量の推定値を出力するモデルMを生成する。
図12に示すように、モデルMは、学習で得られた重みを持つニューラルネットワークであってもよいし、学習で得られた係数を持つ式(例:重回帰分析の式)であってもよいし、これら以外の形式のものであってもよい。一例としてニューラルネットワークであれば、例えば、モデルパラメータ(例:過去の日々の気温の時系列データ)をニューラルネットワークへの入力とし、出力が正解の食料消費量になるように、ニューラルネットワークの重みを調整する。例えば、重み調整には誤差逆伝搬法等を用いることができる。
生成されたモデルMに、例えば、ある将来シナリオ(例:温暖化が大きく進むシナリオ)に基づくパラメータ(将来の時刻、予測気温等)を入力することで、そのシナリオでの将来の日々の食料消費量の予測値を出力することができる。
図13は、LSTMを用いて構築した食料消費モデルにより、2021年の6月28日から7月23日までの鶏肉消費量の消費予測を行った例を示している。
<環境負荷推計部150による環境負荷予測>
環境負荷推計部150は、食料消費モデル構築部123により構築された食料消費モデルM(t,x1,…,xj)、及び環境負荷係数kc(n)を使用して、下記の式(6)により、時刻fの指標cの将来(未来)の環境負荷を予測する。
環境負荷推計部150は、食料消費モデル構築部123により構築された食料消費モデルM(t,x1,…,xj)、及び環境負荷係数kc(n)を使用して、下記の式(6)により、時刻fの指標cの将来(未来)の環境負荷を予測する。
Ic(f)=kc(n)M(f,x1,…,xj) (6)
ここで、モデルパラメータx1~xjの値は、将来のシナリオの仮定に基づいて将来の時刻fで定義される。モデルパラメータx1~xjの値は、例えば、あるシナリオを仮定した将来の時刻fでの値(予測値等)である。このモデルパラメータは、定量的未来シナリオ入力部125から入力される。
ここで、モデルパラメータx1~xjの値は、将来のシナリオの仮定に基づいて将来の時刻fで定義される。モデルパラメータx1~xjの値は、例えば、あるシナリオを仮定した将来の時刻fでの値(予測値等)である。このモデルパラメータは、定量的未来シナリオ入力部125から入力される。
M(f,x1,…,xj)により将来の食料消費量の予測値が計算される。これに環境負荷係数kc(n)をかけることで、環境負荷を予測できる。食料消費量の予測値を計算する機能部と、環境負荷を予測する機能部が分けられていてもよい。
図14は、利用可能性のあるモデルパラメータと利用可能なデータの時間分解能を示している。また、文献に存在する将来シナリオの時間分解能を、提案方法を用いて解析できる可能性のあるシナリオの時間分解能と比較した。
気象庁[29]では毎日の気温データを公開しており、1976年までの過去のデータも公開しているのでそれを訓練データとして使用できる。将来のシナリオとして、例えば、気候変動による将来の地球および地域の気温変化を予測するために、RCP8.5、RCP6、RCP4.5およびRCP2.6という4つの排出シナリオに基づいて大気中のGHG濃度を定義する代表濃度経路(RCP)[30]を用いることができる。これらのシナリオは、2026年から2100年までの月間気温予測を提供する気候シミュレーションの基礎として使用されている[31]、[32]。
本実施の形態に係る提案方法は、長期的な気候変動の影響に基づいて、消費者行動の起こり得る変化とその結果としての環境負荷を予測するために使用できる。また、気候変動の影響を受けやすくなると予測される台風や熱波などの自然災害の影響をモデル化するためにも提案方法を使用できる[33]。湿度や降雨などの他の気象関連変数もモデルパラメータとして用いることができる。
人口は食料消費レベルと直接相関し、既存の研究では食料消費シナリオのキーパラメータとして使用されている[9]、[10]。既存の研究では、1年以下の時間分解能を持つ長期的な人口モデルに焦点を当てていた[34]が、提案方法のアプローチにより、地域の成長と人口減少、季節的な人口移動、人口年齢分布が消費レベルとそれに対応する環境負荷を調査し、予測するのに利用できる。日本の統計局[35]は、地域の人口と年齢分布の月次データを公表している。
また、既存の研究では、GDP、一人当たりのカロリー、及びタンパク質需要の間の相関を示している[10]。GDPは通常毎年発表されるが、日経225や日本の一致指数など、より高い時間分解能を持つ類似の経済指標を用いて、消費による環境負荷の経済状況の影響をモデル化することができる。景気後退と好景気の経済シナリオも、環境負荷を予測するのに利用できる。
なお、本実施の形態で学習時、及び予測時に使用するモデルパラメータは、気温、人口、SNSによる社会感情、及び経済指標のうちの少なくともいずれか1つを含むものであれば、どのようなパラメータを使用してもよい。
(第1実施形態:処理フロー)
図15は、これまでに説明した各部の処理に基づく全体の処理の流れを説明するためのフローチャートである。図15を参照して、環境負荷予測装置100による処理の流れを説明する。
図15は、これまでに説明した各部の処理に基づく全体の処理の流れを説明するためのフローチャートである。図15を参照して、環境負荷予測装置100による処理の流れを説明する。
S101において、食料消費量推計部130に、消費DB140から消費データが入力される。
食料消費量推計部130は、S102において、例えば40の食料群毎の消費量計算を行って、S103において、消費量を食料消費量格納部121に格納する。
S104において、食料消費モデル構築部123が、食料消費量格納部121に格納されている消費量と、モデルパラメータDB122を用いて、例えば食料群毎に、食料消費モデルを構築する。S105において、食料消費モデル構築部123は、食料消費モデルをモデル格納部124に格納する。
S106において、定量的未来シナリオ入力部125から定量的な未来シナリオのパラメータが入力される。入力された未来シナリオのパラメータは、モデル格納部124に格納された後に環境負荷推計部150に渡されてもよいし、定量的未来シナリオ入力部125から環境負荷推計部150に渡されてもよい。
S107において、モデル格納部124から、食料消費モデル、及び未来シナリオのパラメータが環境負荷推計部150に入力される。なお、食料消費モデル、及び未来シナリオのパラメータにより予測された食料消費量が環境負荷推計部150に入力されてもよい。
環境負荷推計部150は、S108において、未来シナリオのパラメータを用いた食料消費モデルにより得られた食料消費量の予測値に環境負荷係数を乗算することにより、環境負荷計算を実施し、S109において、環境負荷の将来の予測値を出力部170を介して出力する。
(第2実施形態)
第1実施形態では、高時間分解能データ(例えば1日あたり1データポイント以上のデータ)を用いて環境負荷を予測する技術について説明した。以下、環境負荷予測の誤差(不確実性)を定量化する技術について、第2実施形態として説明する。
第1実施形態では、高時間分解能データ(例えば1日あたり1データポイント以上のデータ)を用いて環境負荷を予測する技術について説明した。以下、環境負荷予測の誤差(不確実性)を定量化する技術について、第2実施形態として説明する。
<第2実施形態に関わる課題について>
日常の消費パターンとそれに続く環境への負荷(影響)は、通常、非線形である度合いが高い。このことは、状態空間モデル、ポアソン過程、ホークス過程、ガウス過程、ディープラーニングなどの、非線形現象を捉えることができる時系列分析の回帰手法を用いて、最適な予測を行う必要があることを意味する。なお、本発明に係る技術における予測方法は、これらの手法に限定されない。
日常の消費パターンとそれに続く環境への負荷(影響)は、通常、非線形である度合いが高い。このことは、状態空間モデル、ポアソン過程、ホークス過程、ガウス過程、ディープラーニングなどの、非線形現象を捉えることができる時系列分析の回帰手法を用いて、最適な予測を行う必要があることを意味する。なお、本発明に係る技術における予測方法は、これらの手法に限定されない。
不確実性は、リスクを評価し、様々なシナリオにおける予測の信頼性を区別するための意思決定において重要である。例えば、気候変動緩和シナリオにおける不確実性を伝えることにより、信頼性を高め、気候情報の信頼性を高めることができる。
本実施形態でも第1実施形態で使用した方法により、食料消費量を予測する食料消費量モデルを構築する。ここで、モデルを構築すること(モデリング)についての不確実性について説明する。モデリングにおいては、主に、偶然的不確定性(aleatory uncertainty)と認識的不確実性(Epistemic uncertainty)の2種類の不確実性がある。
偶然的不確定性(aleatory uncertainty)は、データの不確実性であり、データ分布に固有の削減できない不確実性である。
認識的不確実性(Epistemic uncertainty)は、知識の不確実性であり、知識不足、及び、モデル出力を定義するパラメータのすべてをデータが捉えていないことによる不確実性である。多くの場合、手元のデータは不完全で、ノイズがあり、不一致であったり、マルチモーダルであったりする。
モデリングには上記のような不確実性があるため、第1実施形態で説明した環境負荷予測技術において、不確実性を定量化して示すことが望ましい。
すなわち、第1実施形態で説明した環境負荷予測技術を現実のシナリオで使用する場合、例えば下記の点で不確実性の定量化が必要である。
・正確なリスク評価
・様々なシナリオでの予測信頼性の把握
・シナリオ伝達における信頼性向上、及び、情報の高信頼化
(第2実施形態:装置構成例)
図16に、第2実施形態における環境負荷予測装置200の構成例を示す。基本的に、第2実施形態における環境負荷予測装置200は、第1実施形態の環境負荷予測装置100の機能を含む。図16において、図3で示した構成と同じ符号を付した機能部は、図3で示した構成における当該符号を付した機能部と同じ機能を含む。ただし、第2実施形態では、図3で示した構成と同じ符号を付した機能部でも、第1実施形態とは異なる動作をする場合もある。
・様々なシナリオでの予測信頼性の把握
・シナリオ伝達における信頼性向上、及び、情報の高信頼化
(第2実施形態:装置構成例)
図16に、第2実施形態における環境負荷予測装置200の構成例を示す。基本的に、第2実施形態における環境負荷予測装置200は、第1実施形態の環境負荷予測装置100の機能を含む。図16において、図3で示した構成と同じ符号を付した機能部は、図3で示した構成における当該符号を付した機能部と同じ機能を含む。ただし、第2実施形態では、図3で示した構成と同じ符号を付した機能部でも、第1実施形態とは異なる動作をする場合もある。
図3に示すように、環境負荷予測装置200は、入力部110、食料消費量格納部121、モデルパラメータDB122、食料消費モデル構築部123、モデル格納部124、定量的シナリオ入力部125、消費DB140、食料消費量推計部130、環境負荷係数DB160、環境負荷推計部150、消費量予測部155、出力部170、消費量不確実性格納部210、消費量不確実性推計部220、モデル構築不確実性推計部230、環境負荷予測不確実性推計部240、環境負荷係数不確実性格納部250を有する。
なお、環境負荷予測装置200を環境負荷予測システムと呼んでもよい。また、環境負荷予測装置200は、1つの装置(コンピュータ)で構成されていてもよいし、複数の装置で構成されていてもよい。環境負荷予測装置200を、不確実性推計装置と呼んでもよい。また、図16の2つの機能部間において、線で結ばれていなくても、必要に応じて情報のやり取りが可能である。
また、図16における消費DB140、環境負荷係数DB160、及びモデルパラメータDB122はそれぞれ、環境負荷予測装置200の外部に備えられてもよい。
第1実施形態における構成(図3)に対して追加された主な機能部についての機能の概要は下記のとおりである。
消費量不確実性格納部210は、例えば、ラベル付けされた(名前付きの)製品のコスト分布の情報を格納する。当該分布から計算される標準偏差が消費量不確実性格納部210に格納されていてもよい。
消費量不確実性推計部220は、ラベル付けされた製品のコスト分布に基づいて、食料消費量の不確実性を推計する。ここで推計する不確実性は、ラベル付けされていない製品に起因して生じるものである。
モデル構築不確実性推計部230は、モデルに固有の不確実性をモデリングアルゴリズムに対応した手法で推計する。推計方法として、ブートストラップ法、モンテカルロドロップアウト法、変分推論などを使用できる。
モデル格納部124は、食料消費モデル構築部123で構築されたモデルと、モデル構築不確実性推計部230により得られたモデルの不確実性の情報が格納される。
環境負荷係数不確実性格納部250は、ライフサイクルアセスメント研究の統計解析に基づく、環境負荷係数の不確実性に関する情報(例えば、誤差についての、分布、分散、標準偏差など)を格納する。
消費量予測部155は、モデル格納部124から食料消費モデルを取得するとともに、定量的未来シナリオ入力部125からシナリオパラメータを取得する。
環境負荷予測不確実性推計部240は、食料消費量の不確実性の情報、モデルの不確実性の情報、環境負荷係数の不確実性の情報のうちの少なくとも1つに基づいて、環境負荷予測の不確実性を推計する。
第2実施形態に係る手法により、「食料消費量、環境負荷係数、及び、モデル構築」のうちの少なくとも1つの不確実性によって発生する環境負荷予測の不確実性を定量的な値(例:信頼性区間、誤差の上限及び下限)として示すことができる。これにより、例えば、異なる食品群間で環境負荷予測における予測信頼度を区別できる。また、環境負荷予測において、より正確なリスク評価が可能になる。
<不確実性について>
環境負荷予測における不確実性には、例えば、下記の3つの要因がある。
環境負荷予測における不確実性には、例えば、下記の3つの要因がある。
・データセットにおけるラベルのない製品(Qunnamed)の存在によるモデルへの入力(消費量Qtotal)の不確実性
・環境負荷係数(ci,k)の統計的不確実性
・モデルの不確実性
モデルの不確実性については、下記の2つがある。
・環境負荷係数(ci,k)の統計的不確実性
・モデルの不確実性
モデルの不確実性については、下記の2つがある。
・不完全なモデル構築によるモデルにおける認識的不確実性(Epistemic uncertainty)
・消費パターンに固有のランダム性による、削減できない偶然的不確定性(aleatory uncertainty)
(第2実施形態:処理フロー)
次に、図17に示すフローの手順に沿って、第2実施形態における環境負荷予測装置200の処理を説明する。以下で説明する式の番号は、第2実施形態での式として、(1)から開始することとしている。
・消費パターンに固有のランダム性による、削減できない偶然的不確定性(aleatory uncertainty)
(第2実施形態:処理フロー)
次に、図17に示すフローの手順に沿って、第2実施形態における環境負荷予測装置200の処理を説明する。以下で説明する式の番号は、第2実施形態での式として、(1)から開始することとしている。
<S201>
S201において、食料消費量推計部130に、消費DB140から消費データが入力される。
S201において、食料消費量推計部130に、消費DB140から消費データが入力される。
<S202>
S202において、食料消費量推計部130は、下記の式(1)と式(2)を用いて、食料消費量を推計する。推計された食料消費量は食料消費量格納部121に格納する。より具体的には下記のとおりである。
S202において、食料消費量推計部130は、下記の式(1)と式(2)を用いて、食料消費量を推計する。推計された食料消費量は食料消費量格納部121に格納する。より具体的には下記のとおりである。
本実施形態におけるデータセットには、個々の製品の量(例:フィッシュフィレA 200g、エビB 100g)と、1日の収益と購入数(売上数)が含まれている。これは名前がある場合の情報の例である。当該データセットには名前のない製品(ラベルのない製品)も含まれており、これらについては、各日における、収益と売上数のみが含まれる。
カテゴリごとに、全ての製品が名前付き製品と名前なし製品に分けられる。1日当たりの食料消費量と平均コストをそれぞれQn、cnとすると、食料消費量推計部130は、Qn、cnを下記の式(1)により計算する。

次に、食料消費量推計部130は、1日当たりの食料消費量の合計値Qtotalを、名前付きの製品の消費量Qnと名前なしの製品の食料消費量Qunnamedの合計として計算する。より具体的には、下記の式(2)によりQtotalを計算する。

また、食料消費量推計部130は、名前なしの製品の食料消費量Qunnamedを、下記の式(3)により計算する。

食料消費量推計部130により計算された値は、食料消費量格納部121に格納される。
<S203>
S203において、消費量不確実性推計部220は、後述の式(4)を用いて、食料消費量の不確実性を推計する。より具体的には下記のとおりである。
S203において、消費量不確実性推計部220は、後述の式(4)を用いて、食料消費量の不確実性を推計する。より具体的には下記のとおりである。
cnとriとの間の相関を無視することとして、消費量不確実性推計部220は、下記の式(4)に示す誤差伝搬式を用いて、名前なし製品による、食料消費量の不確実性ΔQunnamedを計算する。不確実性ΔQunnamedを、食料消費量の精度と呼んでもよい。

例えば、名前付き製品(ラベル付き製品)の「単位質量あたりのコスト」の分布が、消費量不確実性格納部210に格納されており、消費量不確実性推計部220は、当該分布を、消費量不確実性格納部210から読み出して標準偏差σ(cn)を計算する。分布以外の計算に必要なデータは、例えば、食料消費量格納部121に格納されており、消費量不確実性推計部220は、食料消費量格納部121から読み出したデータ(cn等)と標準偏差σ(cn)を用いて、式(4)を計算する。
なお、不確実性の要因として、名前なし製品に着目することは一例である。不確実性の要因として、名前なし製品以外のものに着目して、不確実性(誤差)を計算してもよい。また、不確実性(誤差)の推計については、誤差伝搬式を使用する方法以外の方法を使用してもよい。
<S204>
S204において、食料消費モデル構築部123は、食料消費量から食料消費モデルを構築する。ここでは、食料消費量の不確実性(誤差と呼んでもよい)の上限(upper bound)を用いたモデルと、食料消費の不確実性の下限(lower bound)を用いたモデルの2つのモデル(モデル1、モデル2)を構築する。上限を上界と呼んでもよいし、下限を下界と呼んでもよい。なお、第1実施形態と同様に、1つのモデルを構築することとしてもうよい。1つのモデルでも、後述するモデルの不確実性あるいは環境負荷係数の不確実性に基づき、環境負荷予測の不確実性を推計できる。
S204において、食料消費モデル構築部123は、食料消費量から食料消費モデルを構築する。ここでは、食料消費量の不確実性(誤差と呼んでもよい)の上限(upper bound)を用いたモデルと、食料消費の不確実性の下限(lower bound)を用いたモデルの2つのモデル(モデル1、モデル2)を構築する。上限を上界と呼んでもよいし、下限を下界と呼んでもよい。なお、第1実施形態と同様に、1つのモデルを構築することとしてもうよい。1つのモデルでも、後述するモデルの不確実性あるいは環境負荷係数の不確実性に基づき、環境負荷予測の不確実性を推計できる。
食料消費モデル構築部123におけるモデル構築方法自体は、第1実施形態で説明した方法と同じでよい。
第2実施形態においては、S202において計算した食料消費量と、S203において計算した食料消費量についての不確実性を用いて、上述したとおり、2つのモデルを構築する。例えば、ある食料(食料グループ(食品群)でもよいし、食料カテゴリでもよい)のある時期の食料消費量がAであるとし、不確実性(誤差)が±aであるとすると、モデル構築で使用する食料消費量として、モデル1の構築には「A+a」を使用し、モデル2の構築には「A-a」を使用する。
以降の説明において、食料消費量の上限を使用したモデルをモデル(上限)と呼び、食料消費量の下限を使用したモデルをモデル(下限)と呼ぶことにする。
<S205>
S205において、モデル構築不確実性推計部230が、食料消費モデル構築部123で使用されるモデリング方法に対する不確実性の境界(上限と下限)を推計する。つまり、食料消費モデル構築部123で構築されたモデルの不確実性を推計する。
S205において、モデル構築不確実性推計部230が、食料消費モデル構築部123で使用されるモデリング方法に対する不確実性の境界(上限と下限)を推計する。つまり、食料消費モデル構築部123で構築されたモデルの不確実性を推計する。
モデルの不確実性、すなわち、モデルにより予測される値の不確実性(予測値の分布、誤差の上限と下限など)の推計方法としてはどのような方法を使用してもよい。
例えば、ディープラーニング(LSTM、CNN、RNN、...)のモデリング方法に対しては、モンテカルロドロップアウト、ベイズ推定、マルコフチェーンモンテカルロ、変分ベイズ、変分推論などの手法を使用できる。
また、状態空間モデルのモデリング方法に対しては、ブートストラップなどの手法を使用できる。ガウス過程のモデリング方法に対しては、ベイズアプローチ、頻度主義(Frequentist)アプローチなどの手法を使用できる。Prophetのモデリング方法に対しては、ライブラリに含まれる機能(例えば事後確率を使用するもの)を使用できる。
<S206>
S206において、定量的未来シナリオ入力部125からシナリオパラメータを消費量予測部155に入力する。シナリオパラメータは、第1実施形態において、将来シナリオに基づくパラメータとして説明したものである。
S206において、定量的未来シナリオ入力部125からシナリオパラメータを消費量予測部155に入力する。シナリオパラメータは、第1実施形態において、将来シナリオに基づくパラメータとして説明したものである。
<S207>
S207において、消費量予測部155は、食料消費モデル構築部123で使用されるモデリング方法に適したシナリオパラメータから、食料消費量の予測の不確実性の境界(例:誤差の範囲、誤差の上限と下限など)を推計する。
S207において、消費量予測部155は、食料消費モデル構築部123で使用されるモデリング方法に適したシナリオパラメータから、食料消費量の予測の不確実性の境界(例:誤差の範囲、誤差の上限と下限など)を推計する。
シナリオパラメータから、食料消費量の予測(環境負荷の予測)を行う方法自体は、第1実施形態で説明したとおりである。つまり、食料消費モデル構築部123により構築された食料消費モデルM(f,x1,…,xj)に、シナリオパラメータの値x1,…,xjを入力することで、将来の時刻fでの食料消費量の予測値を得ることができる。
ここでは、モデル(上限)を用いて、食料消費量の予測値を算出し、モデル(下限)を用いて、食料消費量の予測値を算出する。なお、前述のように1つのモデルを用いてもよい。
また、消費量予測部155は、S205で算出した、モデルの不確実性の推計結果により、モデル(上限)による食料消費量の予測値と、モデル(下限)による食料消費量の予測値のそれぞれについての、不確実性(誤差の範囲)を算出する。
以上の結果から、消費量予測部155は、食料消費量の予測の不確実性の境界(誤差の範囲、誤差の上限と下限など)を推計する。
例えば、モデル(上限)による食料消費量の予測値がEでありその不確実性が±eであるとし、モデル(下限)による食料消費量の予測値がFでありその不確実性が±fであるとすると、消費量予測部155は、食料消費量の予測値の上限を、E+eとF+fのうちの大きいほうとし、食料消費量の予測値の下限を、E-eとF-fのうちの小さいほうとして、推計することができる。
<S208、S209>
環境負荷推計部150は、式(5)を用いて、食料消費量の予測を環境負荷の予測に変換する。
環境負荷推計部150は、式(5)を用いて、食料消費量の予測を環境負荷の予測に変換する。

ここで、S207で計算した、食料消費量の予測の上限と下限を使用することで、環境負荷の予測値の不確実性の推計結果を得ることができる。
例えば、食料消費量の予測の上限から得られた環境負荷の予測値を、不確実性を持つ環境負荷の上限とし、食料消費量の予測の下限から得られた環境負荷の予測値を、不確実性を持つ環境負荷の下限とし、これらの値を、環境負荷予測における不確実性の上限と下限として出力部170から出力することとしてもよい。
また、下記のようにして、環境負荷予測の不確実性を推計してもよい。、
ここで、後述する式(7)を説明するために、環境負荷の計算式を下記の式(6)に示す。下記の式(6)は、食料グループ(食料群)kの食料消費量による環境負荷を示す。
ここで、後述する式(7)を説明するために、環境負荷の計算式を下記の式(6)に示す。下記の式(6)は、食料グループ(食料群)kの食料消費量による環境負荷を示す。

環境負荷予測不確実性推計部240は、下記の誤差伝搬式を計算することにより、Ikの不確実性を算出する。つまり、式(7)において計算される最右辺の+の値がIkの不確実性(誤差)の上限であり、-の値がIkの不確実性(誤差)の下限である。
環境負荷係数の分散については、どのような方法で求めてもよい。例えば、環境負荷係数不確実性格納部250に環境負荷係数の分散が格納されており、環境負荷予測不確実性推計部240は、環境負荷係数不確実性格納部250から、環境負荷係数の分散を読み出すことにより、Ikの不確実性の算出に使用する。また、環境負荷係数不確実性格納部250に環境負荷係数の分布が格納されており、環境負荷予測不確実性推計部240は、環境負荷係数不確実性格納部250から、環境負荷係数の分布を読み出すことにより分散を計算し、Ikの不確実性の算出に使用することとしてもよい。
また、Qkの分散については、例えば、式(4)により算出した食料消費量の不確実性の境界(上限、下限)から推計してもよいし、標準偏差σ(cn)から推計してもよい。
ここで、Qkは、食料消費量の予測値であり、Ikは環境負荷の予測値であるとする。つまり、QkはM(f,x1,…,xj)であり、IkはIc(f)であり、ci,kはkc(n)であるとする。
この場合、環境負荷予測不確実性推計部240は、式(7)により、環境負荷の予測値の不確実性をΔIkとして算出できる。ここで使用する環境負荷係数の分散については、上述のとおりである。
食料消費量の予測の分散については、例えば、S207において、消費量予測部155が推計した、食料消費量の予測の不確実性の境界(誤差の範囲、誤差の上限と下限など)を使用して推計することができる。
出力部170は、環境負荷の予測値の不確実性を示す値(ΔIk)を出力する。具体的には、例えば、出力部170は、環境負荷の予測値の不確実性(誤差)の上限と下限を出力する。
(他の構成例)
図16に示した構成は一例に過ぎない。例えば、図18に示すように、第1推計部310と第2推計部320を備える不確実性推計装置300が提供されてもよい。なお、環境負荷予測装置200は、不確実性推計装置300の例であり、消費量不確実性推計部220が第1推計部310に対応し、環境負荷予測不確実性推計部240が第2推計部320に対応する。不確実性推計装置300には、更に、モデル構築不確実性推計部230に対応する第3推計部が備えられてもよい。
図16に示した構成は一例に過ぎない。例えば、図18に示すように、第1推計部310と第2推計部320を備える不確実性推計装置300が提供されてもよい。なお、環境負荷予測装置200は、不確実性推計装置300の例であり、消費量不確実性推計部220が第1推計部310に対応し、環境負荷予測不確実性推計部240が第2推計部320に対応する。不確実性推計装置300には、更に、モデル構築不確実性推計部230に対応する第3推計部が備えられてもよい。
例えば、第1推計部310は、例えば食料消費量推計部130により推計された食料消費量の不確実性を推計する。第2推計部320は、例えば、当該食料消費量に基づき構築された食料消費モデルを用いて、環境負荷推計部150により予測された環境負荷予測値の不確実性を、上記食料消費量の不確実性に基づいて推計する。
(ハードウェア構成例)
環境負荷予測装置100、200、及び不確実性推計装置300は、例えば、コンピュータにプログラムを実行させることにより実現できる。このコンピュータは、物理的なコンピュータであってもよいし、クラウド上の仮想マシンであってもよい。環境負荷予測装置100、200、及び不確実性推計装置300を総称して「装置」と呼ぶ。
環境負荷予測装置100、200、及び不確実性推計装置300は、例えば、コンピュータにプログラムを実行させることにより実現できる。このコンピュータは、物理的なコンピュータであってもよいし、クラウド上の仮想マシンであってもよい。環境負荷予測装置100、200、及び不確実性推計装置300を総称して「装置」と呼ぶ。
すなわち、当該装置は、コンピュータに内蔵されるCPUやメモリ等のハードウェア資源を用いて、当該装置で実施される処理に対応するプログラムを実行することによって実現することが可能である。上記プログラムは、コンピュータが読み取り可能な記録媒体(可搬メモリ等)に記録して、保存したり、配布したりすることが可能である。また、上記プログラムをインターネットや電子メール等、ネットワークを通して提供することも可能である。
図19は、上記コンピュータのハードウェア構成例を示す図である。図19のコンピュータは、それぞれバスBSで相互に接続されているドライブ装置1000、補助記憶装置1002、メモリ装置1003、CPU1004、インタフェース装置1005、表示装置1006、入力装置1007、出力装置1008等を有する。なお、これらのうち、一部の装置を備えないこととしてもよい。例えば、表示を行わない場合、表示装置1006を備えなくてもよい。
当該コンピュータでの処理を実現するプログラムは、例えば、CD-ROM又はメモリカード等の記録媒体1001によって提供される。プログラムを記憶した記録媒体1001がドライブ装置1000にセットされると、プログラムが記録媒体1001からドライブ装置1000を介して補助記憶装置1002にインストールされる。但し、プログラムのインストールは必ずしも記録媒体1001より行う必要はなく、ネットワークを介して他のコンピュータよりダウンロードするようにしてもよい。補助記憶装置1002は、インストールされたプログラムを格納すると共に、必要なファイルやデータ等を格納する。
メモリ装置1003は、プログラムの起動指示があった場合に、補助記憶装置1002からプログラムを読み出して格納する。CPU1004は、メモリ装置1003に格納されたプログラムに従って、当該装置に係る機能を実現する。インタフェース装置1005は、ネットワークに接続するためのインタフェースとして用いられる。表示装置1006はプログラムによるGUI(Graphical User Interface)等を表示する。入力装置1007はキーボード及びマウス、ボタン、又はタッチパネル等で構成され、様々な操作指示を入力させるために用いられる。出力装置1008は演算結果を出力する。
(実施の形態のまとめ、効果)
第1及び第2実施形態に係る技術により、気温、人口、SNSによる社会感情、経済指標など、1年未満の時間分解能(1年よりも細かい時間分可能)を持つパラメータに基づく時系列分析により、将来の環境負荷を予測することができる。
第1及び第2実施形態に係る技術により、気温、人口、SNSによる社会感情、経済指標など、1年未満の時間分解能(1年よりも細かい時間分可能)を持つパラメータに基づく時系列分析により、将来の環境負荷を予測することができる。
また、第1及び第2実施形態では、食料消費量推計部130が、例えば自動処理のためのスクリプト(プログラム)により、何千もの食料プロダクトの消費データセットを分析することにより食料群毎に消費量を推計及び予測でき、食料群毎の環境負荷の予測を行うことができる。
すなわち、従来は、1年よりも大きな期間での時間分解能でしか環境負荷予測を行うことができなかったが、本実施の形態に係る技術により、より細かい(例えば1日の)時間分解能での環境負荷予測を行うことができる。局所的現象を捉える様々なパラメータを用いて、食料群毎に環境負荷予測を行うことができるので、気候変動緩和目標を達成するための的を絞った、局所的現象を考慮した政策計画(ポリシープランニング)が可能になる。
また、特に第2実施形態に係る技術により、環境負荷予測における不確実性を定量的に示すことが可能となる。環境負荷予測における不確実性を定量的に示すことで、より正確なリスク評価のために予測を伝達する際に、異なる予測間の信頼性を区別し、予測の信頼性を高めることができる。
(付記1)
本明細書には、少なくとも下記各項の環境負荷予測装置、モデル構築方法、及びプログラムが開示されている。
(第1項)
食料の消費量を格納するように構成された食料消費量格納部と、
前記消費量と、1年未満の時間分解能を持つパラメータとを用いて、将来の食料消費量を予測するための食料消費モデルを構築するように構成された食料消費モデル構築部と
を備える環境負荷予測装置。
(第2項)
前記パラメータは、気温、人口、SNSによる社会感情、及び経済指標のうちの少なくともいずれか1つを含む
第1項に記載の環境負荷予測装置。
(第3項)
将来のシナリオに基づくパラメータを入力とした前記食料消費モデルから出力される将来の食料消費量の予測値と、環境負荷係数とを用いて、将来の環境負荷の予測値を算出するように構成された環境負荷推計部
を更に備える第1項又は第2項に記載の環境負荷予測装置。
(第4項)
食料の消費データを格納したPOSデータベースから読み出したデータを用いて、食料群毎の消費量を推計し、推計した食料群毎の消費量を前記食料消費量格納部に格納するように構成された食料消費量推計部
を更に備える第1項ないし第3項のうちいずれか1項に記載の環境負荷予測装置。
(第5項)
環境負荷予測装置が実行するモデル構築方法であって、
食料の消費量を格納する食料消費量格納部から前記消費量を読み出すステップと、
前記消費量と、1年未満の時間分解能を持つパラメータとを用いて、将来の食品消費量を予測するための食料消費モデルを構築するステップ
を備えるモデル構築方法。
(第6項)
コンピュータを、第1項ないし第4項のうちいずれか1項に記載の環境負荷予測装置における各部として機能させるためのプログラム。
本明細書には、少なくとも下記各項の環境負荷予測装置、モデル構築方法、及びプログラムが開示されている。
(第1項)
食料の消費量を格納するように構成された食料消費量格納部と、
前記消費量と、1年未満の時間分解能を持つパラメータとを用いて、将来の食料消費量を予測するための食料消費モデルを構築するように構成された食料消費モデル構築部と
を備える環境負荷予測装置。
(第2項)
前記パラメータは、気温、人口、SNSによる社会感情、及び経済指標のうちの少なくともいずれか1つを含む
第1項に記載の環境負荷予測装置。
(第3項)
将来のシナリオに基づくパラメータを入力とした前記食料消費モデルから出力される将来の食料消費量の予測値と、環境負荷係数とを用いて、将来の環境負荷の予測値を算出するように構成された環境負荷推計部
を更に備える第1項又は第2項に記載の環境負荷予測装置。
(第4項)
食料の消費データを格納したPOSデータベースから読み出したデータを用いて、食料群毎の消費量を推計し、推計した食料群毎の消費量を前記食料消費量格納部に格納するように構成された食料消費量推計部
を更に備える第1項ないし第3項のうちいずれか1項に記載の環境負荷予測装置。
(第5項)
環境負荷予測装置が実行するモデル構築方法であって、
食料の消費量を格納する食料消費量格納部から前記消費量を読み出すステップと、
前記消費量と、1年未満の時間分解能を持つパラメータとを用いて、将来の食品消費量を予測するための食料消費モデルを構築するステップ
を備えるモデル構築方法。
(第6項)
コンピュータを、第1項ないし第4項のうちいずれか1項に記載の環境負荷予測装置における各部として機能させるためのプログラム。
(付記2)
本明細書には、少なくとも下記各項の不確実性推計装置、不確実性推計方法、及びプログラムが開示されている。
(付記項1)
メモリと、
前記メモリに接続された少なくとも1つのプロセッサと、
を含み、
前記プロセッサは、
推計された食料消費量の不確実性を推計し、
前記食料消費量に基づき構築された食料消費モデルを用いて予測された環境負荷予測値の不確実性を、前記食料消費量の不確実性に基づいて推計する
不確実性推計装置。
(付記項2)
前記プロセッサは、誤差伝搬式を用いて、前記食料消費量の不確実性を推計する
付記項1に記載の不確実性推計装置。
(付記項3)
前記プロセッサは、名前なしの製品に起因する前記食料消費量の不確実性を、名前ありの製品の統計情報に基づいて推計する
付記項1又は2に記載の不確実性推計装置。
(付記項4)
前記食料消費量の不確実性における上限に対応する食料消費モデルと、前記食料消費量の不確実性における下限に対応する食料消費モデルの2つの食料消費モデルを構築するモデル構築部を更に備える
付記項1ないし3のうちいずれか1項に記載の不確実性推計装置。
(付記項5)
前記プロセッサは、前記食料消費モデルについての不確実性に基づいて、前記環境負荷予測値の不確実性を推計する
付記項1ないし4のうちいずれか1項に記載の不確実性推計装置。
(付記項6)
前記プロセッサは、前記環境負荷予測値を算出するために使用される環境負荷係数の不確実性に基づいて、前記環境負荷予測値の不確実性を推計する
付記項1ないし5のうちいずれか1項に記載の不確実性推計装置。
(付記項7)
コンピュータが実行する不確実性推計方法であって、
推計された食料消費量の不確実性を推計するステップと、
前記食料消費量に基づき構築された食料消費モデルを用いて予測された環境負荷予測値の不確実性を、前記食料消費量の不確実性に基づいて推計するステップと
を備える不確実性推計方法。
(付記項8)
コンピュータを、付記項1ないし6のうちいずれか1項に記載の不確実性推計装置における各部として機能させるためのプログラムを記憶した非一時的記憶媒体。
本明細書には、少なくとも下記各項の不確実性推計装置、不確実性推計方法、及びプログラムが開示されている。
(付記項1)
メモリと、
前記メモリに接続された少なくとも1つのプロセッサと、
を含み、
前記プロセッサは、
推計された食料消費量の不確実性を推計し、
前記食料消費量に基づき構築された食料消費モデルを用いて予測された環境負荷予測値の不確実性を、前記食料消費量の不確実性に基づいて推計する
不確実性推計装置。
(付記項2)
前記プロセッサは、誤差伝搬式を用いて、前記食料消費量の不確実性を推計する
付記項1に記載の不確実性推計装置。
(付記項3)
前記プロセッサは、名前なしの製品に起因する前記食料消費量の不確実性を、名前ありの製品の統計情報に基づいて推計する
付記項1又は2に記載の不確実性推計装置。
(付記項4)
前記食料消費量の不確実性における上限に対応する食料消費モデルと、前記食料消費量の不確実性における下限に対応する食料消費モデルの2つの食料消費モデルを構築するモデル構築部を更に備える
付記項1ないし3のうちいずれか1項に記載の不確実性推計装置。
(付記項5)
前記プロセッサは、前記食料消費モデルについての不確実性に基づいて、前記環境負荷予測値の不確実性を推計する
付記項1ないし4のうちいずれか1項に記載の不確実性推計装置。
(付記項6)
前記プロセッサは、前記環境負荷予測値を算出するために使用される環境負荷係数の不確実性に基づいて、前記環境負荷予測値の不確実性を推計する
付記項1ないし5のうちいずれか1項に記載の不確実性推計装置。
(付記項7)
コンピュータが実行する不確実性推計方法であって、
推計された食料消費量の不確実性を推計するステップと、
前記食料消費量に基づき構築された食料消費モデルを用いて予測された環境負荷予測値の不確実性を、前記食料消費量の不確実性に基づいて推計するステップと
を備える不確実性推計方法。
(付記項8)
コンピュータを、付記項1ないし6のうちいずれか1項に記載の不確実性推計装置における各部として機能させるためのプログラムを記憶した非一時的記憶媒体。
以上、本実施の形態について説明したが、本発明はかかる特定の実施形態に限定されるものではなく、特許請求の範囲に記載された本発明の要旨の範囲内において、種々の変形・変更が可能である。
[参考文献]
[1] M. Crippa, E. Solazzo, D. Guizzardi, F. Monforti-Ferrario, F. N. Tubiello, and A. Leip, "Food systems are responsible for a third of global anthropogenic GHG emissions," Nat Food, vol. 2, no. 3, pp. 198-209, Mar. 2021, doi: 10.1038/s43016-021-00225-9.
[2] J. Poore and T. Nemecek, "Reducing food's environmental impacts through producers and consumers," Science, vol. 360, no. 6392, pp. 987-992, Jun. 2018, doi: 10.1126/science.aaq0216.
[3] FAO, "Global Food Losses and Food Waste." Food and Agriculture Organization of the United Nations, 2011. [Online]. Available: http://www.fao.org/3/i2697e/i2697e.pdf
[4] A. Chaudhary, D. Gustafson, and A. Mathys, "Multi-indicator sustainability assessment of global food systems," Nature Communications, vol. 9, no. 1, Art. no. 1, Feb. 2018, doi: 10.1038/s41467-018-03308-7.
[5] United Nations, "World Population Prospects: 2017 Revision." 2017. [Online]. Available: https://www.un.org/development/desa/pd/sites/www.un.org.development.desa.pd/files/files/documents/2020/Jan/un_2017_world_population_prospects-2017_revision_databooklet.pdf
[6] P. Pingali, "Westernization of Asian diets and the transformation of food systems: Implications for research and policy," Food Policy, vol. 32, no. 3, pp. 281-298, Jun. 2007, doi: 10.1016/j.foodpol.2006.08.001.
[7] B. M. Popkin, "Global nutrition dynamics: the world is shifting rapidly toward a diet linked with noncommunicable diseases," The American Journal of Clinical Nutrition, vol. 84, no. 2, pp. 289-298, Aug. 2006, doi: 10.1093/ajcn/84.2.289.
[8] T. Hasegawa, P. Havlik, S. Frank, A. Palazzo, and H. Valin, "Tackling food consumption inequality to fight hunger without pressuring the environment," Nature Sustainability, vol. 2, no. 9, Art. no. 9, Sep. 2019, doi: 10.1038/s41893-019-0371-6.
[9] B. Bajzelj et al., "Importance of food-demand management for climate mitigation," Nature Climate Change, vol. 4, no. 10, Art. no. 10, Oct. 2014, doi: 10.1038/nclimate2353.
[10] D. Tilman, C. Balzer, J. Hill, and B. L. Befort, "Global food demand and the sustainable intensification of agriculture," PNAS, vol. 108, no. 50, pp. 20260-20264, Dec. 2011, doi: 10.1073/pnas.1116437108.
[11] M. Borucke et al., "Accounting for demand and supply of the biosphere's regenerative capacity: The National Footprint Accounts' underlying methodology and framework," Ecological Indicators, vol. 24, pp. 518-533, Jan. 2013, doi: 10.1016/j.ecolind.2012.08.005.
[12] V. Masson-Delmotte et al., "IPCC: Climate Change 2021: The Physical Science Basis. Contribution of Working Group I to the Sixth Assessment Report of the Intergovernmental Panel on Climate Change." 2021. [Online]. Available: https://www.ipcc.ch/report/ar6/wg1/
[13] E. Stehfest et al., "Key determinants of global land-use projections," Nature Communications, vol. 10, no. 1, Art. no. 1, May 2019, doi: 10.1038/s41467-019-09945-w.
[14] K. Winkler, R. Fuchs, M. Rounsevell, and M. Herold, "Global land use changes are four times greater than previously estimated," Nature Communications, vol. 12, no. 1, Art. no. 1, May 2021, doi: 10.1038/s41467-021-22702-2.
[15] N. Alexandratos and J. Bruinsma, Eds., World agriculture towards 2030/2050: the 2012 revision. 2012. doi: 10.22004/ag.econ.288998.
[16] P. Havlik et al., "Climate change mitigation through livestock system transitions," PNAS, vol. 111, no. 10, pp. 3709-3714, Mar. 2014, doi: 10.1073/pnas.1308044111.
[17] PBL, "IMAGE - Integrated Model to Assess the Global Environment," PBL Netherlands Environmental Assessment Agency, Nov. 12, 2020. https://www.pbl.nl/en/image/about-image (accessed Sep. 03, 2021).
[18] Y. Sano, H. Takayasu, S. Havlin, and M. Takayasu, "Identifying long-term periodic cycles and memories of collective emotion in online social media," PLOS ONE, vol. 14, no. 3, p. e0213843, Mar. 2019, doi: 10.1371/journal.pone.0213843.
[19] Nikkei Inc., "Nikkei Stock Average (Nikkei 225)." 2021. [Online]. Available: https://indexes.nikkei.co.jp/en/nkave/index/profile?idx=nk225
[20] Cabinet Office, Government of Japan, "Indexes of Business Conditions." 2021. [Online]. Available: https://www.esri.cao.go.jp/en/stat/di/di-e.html
[21] Shopper Insight, "Real Shopper SM," 2021. [Online]. Available: http://shopperinsight.co.jp/service/
[22] "The Advantages & Disadvantages of a Multiple Regression Model," Sciencing. https://sciencing.com/advantages-disadvantages-multiple-regression-model-12070171.html (accessed Aug. 27, 2021).
[23] K. Bailey, "Gaussian Processes: An Introduction." 2018. [Online]. Available: http://katbailey.github.io/gp_talk/Gaussian_Processes.pdf
[24] "Pros and Cons of ARIMA Forecasting." [Online]. Available: http://www.ecostat.unical.it/tarsitano/didattica/SeStoCor/SeStor%2027.3/08notes5GOOD.pdf
[25] E. Stenberg, "On the Autoregressive Conditional Heteroskedasticity Models." Department of Statistics, Uppsala University, 2016. [Online]. Available: https://www.diva-portal.org/smash/get/diva2:933131/FULLTEXT01.pdf
[26] "Weaknesses of ARCH Models." 2014. [Online]. Available: http://www.science.unitn.it/AnalisiInfoTLC/SSP/SSP14_15/WEBSITE/courses/Ssp1415_2014/Slides_Sources/27_20_2014-12-15/lecture20Prev.pdf
[27] E. Zivot, "Vector Autoregressive Models for Multivariate Time Series." University of Washington, 2005.
[28] "5 Types of LSTM Recurrent Neural Networks and What to Do With Them | Exxact Blog." https://www.exxactcorp.com/blog/Deep-Learning/5-types-of-lstm-recurrent-neural-networks-and-what-to-do-with-them (accessed Aug. 27, 2021).
[29] 気象庁, 過去の気象データ検索. 2021. [Online]. Available: https://www.data.jma.go.jp/obd/stats/etrn/index.php
[30] D. P. van Vuuren et al., "The representative concentration pathways: an overview," Climatic Change, vol. 109, no. 1, p. 5, Aug. 2011, doi: 10.1007/s10584-011-0148-z.
[31] K. E. Taylor, R. J. Stouffer, and G. A. Meehl, "An Overview of CMIP5 and the Experiment Design," Bulletin of the American Meteorological Society, vol. 93, no. 4, pp. 485-498, Apr. 2012, doi: 10.1175/BAMS-D-11-00094.1.
[32] C. Navarro-Racines, J. Tarapues, P. Thornton, A. Jarvis, and J. Ramirez-Villegas, "High-resolution and bias-corrected CMIP5 projections for climate change impact assessments," Scientific Data, vol. 7, no. 1, Art. no. 1, Jan. 2020, doi: 10.1038/s41597-019-0343-8.
[33] IPCC, "Summary for Policymakers. In: Global Warming of 1.5℃," 2018, [Online]. Available: https://www.ipcc.ch/site/assets/uploads/sites/2/2019/05/SR15_SPM_version_report_LR.pdf
[34] S. E. Vollset et al., "Fertility, mortality, migration, and population scenarios for 195 countries and territories from 2017 to 2100: a forecasting analysis for the Global Burden of Disease Study," The Lancet, vol. 396, no. 10258, pp. 1285-1306, Oct. 2020, doi: 10.1016/S0140-6736(20)30677-2.
[35] 総務省統計局, 人口推計. 2020. [Online]. Available: https://www.stat.go.jp/data/jinsui/index.html
本特許出願は2021年12月1日に出願した国際特許出願PCT/JP2021/044115に基づきその優先権を主張するものであり、国際特許出願PCT/JP2021/044115の全内容を本願に援用する。
[1] M. Crippa, E. Solazzo, D. Guizzardi, F. Monforti-Ferrario, F. N. Tubiello, and A. Leip, "Food systems are responsible for a third of global anthropogenic GHG emissions," Nat Food, vol. 2, no. 3, pp. 198-209, Mar. 2021, doi: 10.1038/s43016-021-00225-9.
[2] J. Poore and T. Nemecek, "Reducing food's environmental impacts through producers and consumers," Science, vol. 360, no. 6392, pp. 987-992, Jun. 2018, doi: 10.1126/science.aaq0216.
[3] FAO, "Global Food Losses and Food Waste." Food and Agriculture Organization of the United Nations, 2011. [Online]. Available: http://www.fao.org/3/i2697e/i2697e.pdf
[4] A. Chaudhary, D. Gustafson, and A. Mathys, "Multi-indicator sustainability assessment of global food systems," Nature Communications, vol. 9, no. 1, Art. no. 1, Feb. 2018, doi: 10.1038/s41467-018-03308-7.
[5] United Nations, "World Population Prospects: 2017 Revision." 2017. [Online]. Available: https://www.un.org/development/desa/pd/sites/www.un.org.development.desa.pd/files/files/documents/2020/Jan/un_2017_world_population_prospects-2017_revision_databooklet.pdf
[6] P. Pingali, "Westernization of Asian diets and the transformation of food systems: Implications for research and policy," Food Policy, vol. 32, no. 3, pp. 281-298, Jun. 2007, doi: 10.1016/j.foodpol.2006.08.001.
[7] B. M. Popkin, "Global nutrition dynamics: the world is shifting rapidly toward a diet linked with noncommunicable diseases," The American Journal of Clinical Nutrition, vol. 84, no. 2, pp. 289-298, Aug. 2006, doi: 10.1093/ajcn/84.2.289.
[8] T. Hasegawa, P. Havlik, S. Frank, A. Palazzo, and H. Valin, "Tackling food consumption inequality to fight hunger without pressuring the environment," Nature Sustainability, vol. 2, no. 9, Art. no. 9, Sep. 2019, doi: 10.1038/s41893-019-0371-6.
[9] B. Bajzelj et al., "Importance of food-demand management for climate mitigation," Nature Climate Change, vol. 4, no. 10, Art. no. 10, Oct. 2014, doi: 10.1038/nclimate2353.
[10] D. Tilman, C. Balzer, J. Hill, and B. L. Befort, "Global food demand and the sustainable intensification of agriculture," PNAS, vol. 108, no. 50, pp. 20260-20264, Dec. 2011, doi: 10.1073/pnas.1116437108.
[11] M. Borucke et al., "Accounting for demand and supply of the biosphere's regenerative capacity: The National Footprint Accounts' underlying methodology and framework," Ecological Indicators, vol. 24, pp. 518-533, Jan. 2013, doi: 10.1016/j.ecolind.2012.08.005.
[12] V. Masson-Delmotte et al., "IPCC: Climate Change 2021: The Physical Science Basis. Contribution of Working Group I to the Sixth Assessment Report of the Intergovernmental Panel on Climate Change." 2021. [Online]. Available: https://www.ipcc.ch/report/ar6/wg1/
[13] E. Stehfest et al., "Key determinants of global land-use projections," Nature Communications, vol. 10, no. 1, Art. no. 1, May 2019, doi: 10.1038/s41467-019-09945-w.
[14] K. Winkler, R. Fuchs, M. Rounsevell, and M. Herold, "Global land use changes are four times greater than previously estimated," Nature Communications, vol. 12, no. 1, Art. no. 1, May 2021, doi: 10.1038/s41467-021-22702-2.
[15] N. Alexandratos and J. Bruinsma, Eds., World agriculture towards 2030/2050: the 2012 revision. 2012. doi: 10.22004/ag.econ.288998.
[16] P. Havlik et al., "Climate change mitigation through livestock system transitions," PNAS, vol. 111, no. 10, pp. 3709-3714, Mar. 2014, doi: 10.1073/pnas.1308044111.
[17] PBL, "IMAGE - Integrated Model to Assess the Global Environment," PBL Netherlands Environmental Assessment Agency, Nov. 12, 2020. https://www.pbl.nl/en/image/about-image (accessed Sep. 03, 2021).
[18] Y. Sano, H. Takayasu, S. Havlin, and M. Takayasu, "Identifying long-term periodic cycles and memories of collective emotion in online social media," PLOS ONE, vol. 14, no. 3, p. e0213843, Mar. 2019, doi: 10.1371/journal.pone.0213843.
[19] Nikkei Inc., "Nikkei Stock Average (Nikkei 225)." 2021. [Online]. Available: https://indexes.nikkei.co.jp/en/nkave/index/profile?idx=nk225
[20] Cabinet Office, Government of Japan, "Indexes of Business Conditions." 2021. [Online]. Available: https://www.esri.cao.go.jp/en/stat/di/di-e.html
[21] Shopper Insight, "Real Shopper SM," 2021. [Online]. Available: http://shopperinsight.co.jp/service/
[22] "The Advantages & Disadvantages of a Multiple Regression Model," Sciencing. https://sciencing.com/advantages-disadvantages-multiple-regression-model-12070171.html (accessed Aug. 27, 2021).
[23] K. Bailey, "Gaussian Processes: An Introduction." 2018. [Online]. Available: http://katbailey.github.io/gp_talk/Gaussian_Processes.pdf
[24] "Pros and Cons of ARIMA Forecasting." [Online]. Available: http://www.ecostat.unical.it/tarsitano/didattica/SeStoCor/SeStor%2027.3/08notes5GOOD.pdf
[25] E. Stenberg, "On the Autoregressive Conditional Heteroskedasticity Models." Department of Statistics, Uppsala University, 2016. [Online]. Available: https://www.diva-portal.org/smash/get/diva2:933131/FULLTEXT01.pdf
[26] "Weaknesses of ARCH Models." 2014. [Online]. Available: http://www.science.unitn.it/AnalisiInfoTLC/SSP/SSP14_15/WEBSITE/courses/Ssp1415_2014/Slides_Sources/27_20_2014-12-15/lecture20Prev.pdf
[27] E. Zivot, "Vector Autoregressive Models for Multivariate Time Series." University of Washington, 2005.
[28] "5 Types of LSTM Recurrent Neural Networks and What to Do With Them | Exxact Blog." https://www.exxactcorp.com/blog/Deep-Learning/5-types-of-lstm-recurrent-neural-networks-and-what-to-do-with-them (accessed Aug. 27, 2021).
[29] 気象庁, 過去の気象データ検索. 2021. [Online]. Available: https://www.data.jma.go.jp/obd/stats/etrn/index.php
[30] D. P. van Vuuren et al., "The representative concentration pathways: an overview," Climatic Change, vol. 109, no. 1, p. 5, Aug. 2011, doi: 10.1007/s10584-011-0148-z.
[31] K. E. Taylor, R. J. Stouffer, and G. A. Meehl, "An Overview of CMIP5 and the Experiment Design," Bulletin of the American Meteorological Society, vol. 93, no. 4, pp. 485-498, Apr. 2012, doi: 10.1175/BAMS-D-11-00094.1.
[32] C. Navarro-Racines, J. Tarapues, P. Thornton, A. Jarvis, and J. Ramirez-Villegas, "High-resolution and bias-corrected CMIP5 projections for climate change impact assessments," Scientific Data, vol. 7, no. 1, Art. no. 1, Jan. 2020, doi: 10.1038/s41597-019-0343-8.
[33] IPCC, "Summary for Policymakers. In: Global Warming of 1.5℃," 2018, [Online]. Available: https://www.ipcc.ch/site/assets/uploads/sites/2/2019/05/SR15_SPM_version_report_LR.pdf
[34] S. E. Vollset et al., "Fertility, mortality, migration, and population scenarios for 195 countries and territories from 2017 to 2100: a forecasting analysis for the Global Burden of Disease Study," The Lancet, vol. 396, no. 10258, pp. 1285-1306, Oct. 2020, doi: 10.1016/S0140-6736(20)30677-2.
[35] 総務省統計局, 人口推計. 2020. [Online]. Available: https://www.stat.go.jp/data/jinsui/index.html
本特許出願は2021年12月1日に出願した国際特許出願PCT/JP2021/044115に基づきその優先権を主張するものであり、国際特許出願PCT/JP2021/044115の全内容を本願に援用する。
100 環境負荷予測装置
110 入力部
120 食料消費未来シナリオ定量分析モジュール
121 食料消費量格納部
122 モデルパラメータDB
123 食料消費モデル構築部
124 モデル格納部
125 定量的シナリオ入力部
130 食料消費量推計部
140 消費DB
150 環境負荷推計部
155 消費量予測部
160 環境負荷係数DB
170 出力部
200 環境負荷予測装置
210 消費量不確実性格納部
220 消費量不確実性推計部
230 モデル構築不確実性推計部
240 環境負荷予測不確実性推計部
250 環境負荷係数不確実性格納部
300 不確実性推計装置
310 第1推計部
320 第2推計部
1000 ドライブ装置
1001 記録媒体
1002 補助記憶装置
1003 メモリ装置
1004 CPU
1005 インタフェース装置
1006 表示装置
1007 入力装置
1008 出力装置
110 入力部
120 食料消費未来シナリオ定量分析モジュール
121 食料消費量格納部
122 モデルパラメータDB
123 食料消費モデル構築部
124 モデル格納部
125 定量的シナリオ入力部
130 食料消費量推計部
140 消費DB
150 環境負荷推計部
155 消費量予測部
160 環境負荷係数DB
170 出力部
200 環境負荷予測装置
210 消費量不確実性格納部
220 消費量不確実性推計部
230 モデル構築不確実性推計部
240 環境負荷予測不確実性推計部
250 環境負荷係数不確実性格納部
300 不確実性推計装置
310 第1推計部
320 第2推計部
1000 ドライブ装置
1001 記録媒体
1002 補助記憶装置
1003 メモリ装置
1004 CPU
1005 インタフェース装置
1006 表示装置
1007 入力装置
1008 出力装置
Claims (8)
- 推計された食料消費量の不確実性を推計する第1推計部と、
前記食料消費量に基づき構築された食料消費モデルを用いて予測された環境負荷予測値の不確実性を、前記食料消費量の不確実性に基づいて推計する第2推計部と
を備える不確実性推計装置。 - 前記第1推計部は、誤差伝搬式を用いて、前記食料消費量の不確実性を推計する
請求項1に記載の不確実性推計装置。 - 前記第1推計部は、名前なしの製品に起因する前記食料消費量の不確実性を、名前ありの製品の統計情報に基づいて推計する
請求項1に記載の不確実性推計装置。 - 前記食料消費量の不確実性における上限に対応する食料消費モデルと、前記食料消費量の不確実性における下限に対応する食料消費モデルの2つの食料消費モデルを構築するモデル構築部を更に備える
請求項1に記載の不確実性推計装置。 - 前記第2推計部は、前記食料消費モデルについての不確実性に基づいて、前記環境負荷予測値の不確実性を推計する
請求項1に記載の不確実性推計装置。 - 前記第2推計部は、前記環境負荷予測値を算出するために使用される環境負荷係数の不確実性に基づいて、前記環境負荷予測値の不確実性を推計する
請求項1に記載の不確実性推計装置。 - コンピュータが実行する不確実性推計方法であって、
推計された食料消費量の不確実性を推計するステップと、
前記食料消費量に基づき構築された食料消費モデルを用いて予測された環境負荷予測値の不確実性を、前記食料消費量の不確実性に基づいて推計するステップと
を備える不確実性推計方法。 - コンピュータを、請求項1ないし6のうちいずれか1項に記載の不確実性推計装置における各部として機能させるためのプログラム。
Applications Claiming Priority (2)
| Application Number | Priority Date | Filing Date | Title |
|---|---|---|---|
| JPPCT/JP2021/044115 | 2021-12-01 | ||
| PCT/JP2021/044115 WO2023100292A1 (ja) | 2021-12-01 | 2021-12-01 | 環境負荷予測装置、モデル構築方法、及びプログラム |
Publications (1)
| Publication Number | Publication Date |
|---|---|
| WO2023100735A1 true WO2023100735A1 (ja) | 2023-06-08 |
Family
ID=86611794
Family Applications (2)
| Application Number | Title | Priority Date | Filing Date |
|---|---|---|---|
| PCT/JP2021/044115 Ceased WO2023100292A1 (ja) | 2021-12-01 | 2021-12-01 | 環境負荷予測装置、モデル構築方法、及びプログラム |
| PCT/JP2022/043325 Ceased WO2023100735A1 (ja) | 2021-12-01 | 2022-11-24 | 不確実性推計装置、不確実性推計方法、及びプログラム |
Family Applications Before (1)
| Application Number | Title | Priority Date | Filing Date |
|---|---|---|---|
| PCT/JP2021/044115 Ceased WO2023100292A1 (ja) | 2021-12-01 | 2021-12-01 | 環境負荷予測装置、モデル構築方法、及びプログラム |
Country Status (1)
| Country | Link |
|---|---|
| WO (2) | WO2023100292A1 (ja) |
-
2021
- 2021-12-01 WO PCT/JP2021/044115 patent/WO2023100292A1/ja not_active Ceased
-
2022
- 2022-11-24 WO PCT/JP2022/043325 patent/WO2023100735A1/ja not_active Ceased
Non-Patent Citations (3)
| Title |
|---|
| PLEVIN RICHARD J., JONES ANDREW D., TORN MARGARET S., GIBBS HOLLY K.: "Greenhouse Gas Emissions from Biofuels’ Indirect Land Use Change Are Uncertain but May Be Much Greater than Previously Estimated", ENVIRONMENTAL SCIENCE & TECHNOLOGY, AMERICAN CHEMICAL SOCIETY, US, vol. 44, no. 21, 1 November 2010 (2010-11-01), US , pages 8015 - 8021, XP093070121, ISSN: 0013-936X, DOI: 10.1021/es101946t * |
| ROGISSART LUCILE, FOUCHEROT CLAUDINE, BELLASSEN VALENTIN: "Estimating greenhouse gas emissions from food consumption: methods and results", [RESEARCH REPORT] INCONNU., 1 February 2019 (2019-02-01), XP093070116, Retrieved from the Internet <URL:https://hal.archives-ouvertes.fr/hal-02119577> * |
| YOSHIKAWA NAOKI, KOJI AMANO , KOJI SHIMADA: "Scenario analysis of environmental load accompanying food consumption in Japan considering changes in population and household structure", JOURNAL OF ENVIRONMENTAL INFORMATION SCIENCE, vol. 25, 1 January 2011 (2011-01-01), pages 125 - 130, XP093070114 * |
Also Published As
| Publication number | Publication date |
|---|---|
| WO2023100292A1 (ja) | 2023-06-08 |
Similar Documents
| Publication | Publication Date | Title |
|---|---|---|
| Xu et al. | Scrap steel price forecasting with neural networks for east, north, south, central, northeast, and southwest China and at the national level | |
| Xu et al. | Wholesale food price index forecasts with the neural network | |
| Verstraete et al. | A data-driven framework for predicting weather impact on high-volume low-margin retail products | |
| Custódio et al. | Comparing modern and traditional modeling methods for predicting soil moisture in IoT-based irrigation systems | |
| Ray et al. | A random forest-convolutional neural network deep learning model for predicting the wholesale price index of potato in India | |
| Ferencek et al. | Data quality assessment in product failure prediction models | |
| Nicholson et al. | Setting priorities to address the research gaps between agricultural systems analysis and food security outcomes in low-and middle-income countries | |
| Sagala et al. | House price prediction using linier regression | |
| Jewel et al. | Comparative analysis of machine learning models for accurate retail sales demand forecasting | |
| Osman et al. | Predictive analysis of Somalia’s economic indicators using advanced machine learning models | |
| Kailash et al. | Machine Learning Algorithms for Predicting Customers' Lifetime Value: A Systematic Evaluation | |
| Tierney et al. | Multivariate Bayesian dynamic modeling for causal prediction | |
| Venkateswara Rao et al. | Regression based price prediction of staple food materials using multivariate models | |
| Priyadarshi et al. | Analyzing the post-harvest supply chain enablers of vertical integration for rural employability and marketability | |
| Manjunatha et al. | Trivariate-ARMA–GARCH type–Vine Copula model for time series forecasting | |
| WO2023100292A1 (ja) | 環境負荷予測装置、モデル構築方法、及びプログラム | |
| Jacob et al. | Real-estate housing market analytics and prediction using big data for post pandemic era | |
| Agapitos et al. | Evolving seasonal forecasting models with genetic programming in the context of pricing weather-derivatives | |
| Andrée et al. | Machine learning imputation of high frequency price surveys in Papua New Guinea | |
| Hossain et al. | A comparative study of various statistical and machine learning models for predicting restaurant demand in Bangladesh | |
| Bhaskara et al. | Predicting Prices of Cash Crop using Machine Learning. | |
| Allais et al. | Capturing structural changes in French meat and fish demand over the period 1991–2002 | |
| Martínez‐Victoria et al. | Risk and return efficiency of manufacturing firms: Integrating corporate social responsibility performance | |
| Anwar et al. | Advanced Data Analytical Methods for Citrus Crop Yield Forecasting | |
| Sufi et al. | Systematic literature review (SLR) on the application of regression techniques in hospitality management. |
Legal Events
| Date | Code | Title | Description |
|---|---|---|---|
| 121 | Ep: the epo has been informed by wipo that ep was designated in this application |
Ref document number: 22901168 Country of ref document: EP Kind code of ref document: A1 |
|
| NENP | Non-entry into the national phase |
Ref country code: DE |
|
| 122 | Ep: pct application non-entry in european phase |
Ref document number: 22901168 Country of ref document: EP Kind code of ref document: A1 |
|
| NENP | Non-entry into the national phase |
Ref country code: JP |