WO2023095417A1 - 画像のコントラスト強調方法及び情報処理装置 - Google Patents
画像のコントラスト強調方法及び情報処理装置 Download PDFInfo
- Publication number
- WO2023095417A1 WO2023095417A1 PCT/JP2022/033761 JP2022033761W WO2023095417A1 WO 2023095417 A1 WO2023095417 A1 WO 2023095417A1 JP 2022033761 W JP2022033761 W JP 2022033761W WO 2023095417 A1 WO2023095417 A1 WO 2023095417A1
- Authority
- WO
- WIPO (PCT)
- Prior art keywords
- image
- data
- machine learning
- unit
- contrast enhancement
- Prior art date
- Legal status (The legal status is an assumption and is not a legal conclusion. Google has not performed a legal analysis and makes no representation as to the accuracy of the status listed.)
- Ceased
Links
Images







Classifications
-
- G—PHYSICS
- G09—EDUCATION; CRYPTOGRAPHY; DISPLAY; ADVERTISING; SEALS
- G09G—ARRANGEMENTS OR CIRCUITS FOR CONTROL OF INDICATING DEVICES USING STATIC MEANS TO PRESENT VARIABLE INFORMATION
- G09G5/00—Control arrangements or circuits for visual indicators common to cathode-ray tube indicators and other visual indicators
- G09G5/36—Control arrangements or circuits for visual indicators common to cathode-ray tube indicators and other visual indicators characterised by the display of a graphic pattern, e.g. using an all-points-addressable [APA] memory
-
- G—PHYSICS
- G06—COMPUTING OR CALCULATING; COUNTING
- G06T—IMAGE DATA PROCESSING OR GENERATION, IN GENERAL
- G06T5/00—Image enhancement or restoration
- G06T5/90—Dynamic range modification of images or parts thereof
- G06T5/92—Dynamic range modification of images or parts thereof based on global image properties
-
- G—PHYSICS
- G06—COMPUTING OR CALCULATING; COUNTING
- G06T—IMAGE DATA PROCESSING OR GENERATION, IN GENERAL
- G06T5/00—Image enhancement or restoration
- G06T5/60—Image enhancement or restoration using machine learning, e.g. neural networks
-
- G—PHYSICS
- G09—EDUCATION; CRYPTOGRAPHY; DISPLAY; ADVERTISING; SEALS
- G09G—ARRANGEMENTS OR CIRCUITS FOR CONTROL OF INDICATING DEVICES USING STATIC MEANS TO PRESENT VARIABLE INFORMATION
- G09G5/00—Control arrangements or circuits for visual indicators common to cathode-ray tube indicators and other visual indicators
-
- G—PHYSICS
- G06—COMPUTING OR CALCULATING; COUNTING
- G06T—IMAGE DATA PROCESSING OR GENERATION, IN GENERAL
- G06T2207/00—Indexing scheme for image analysis or image enhancement
- G06T2207/20—Special algorithmic details
- G06T2207/20081—Training; Learning
-
- G—PHYSICS
- G06—COMPUTING OR CALCULATING; COUNTING
- G06T—IMAGE DATA PROCESSING OR GENERATION, IN GENERAL
- G06T2207/00—Indexing scheme for image analysis or image enhancement
- G06T2207/20—Special algorithmic details
- G06T2207/20084—Artificial neural networks [ANN]
-
- G—PHYSICS
- G09—EDUCATION; CRYPTOGRAPHY; DISPLAY; ADVERTISING; SEALS
- G09G—ARRANGEMENTS OR CIRCUITS FOR CONTROL OF INDICATING DEVICES USING STATIC MEANS TO PRESENT VARIABLE INFORMATION
- G09G2320/00—Control of display operating conditions
- G09G2320/02—Improving the quality of display appearance
- G09G2320/0233—Improving the luminance or brightness uniformity across the screen
-
- G—PHYSICS
- G09—EDUCATION; CRYPTOGRAPHY; DISPLAY; ADVERTISING; SEALS
- G09G—ARRANGEMENTS OR CIRCUITS FOR CONTROL OF INDICATING DEVICES USING STATIC MEANS TO PRESENT VARIABLE INFORMATION
- G09G2320/00—Control of display operating conditions
- G09G2320/06—Adjustment of display parameters
- G09G2320/066—Adjustment of display parameters for control of contrast
Definitions
- the present disclosure relates to an image contrast enhancement method and an information processing apparatus.
- Patent Document 1 A method of evaluating luminance unevenness of a display device that displays an image is known (for example, Patent Document 1).
- Contrast enhancement is performed to make the features caused by display defects clearer in the evaluation of display defects such as luminance unevenness.
- simply enhancing the contrast does not make the features caused by display defects clearer. Therefore, there has been a demand for an image contrast enhancement method capable of setting more appropriate parameters for sharpening features caused by display defects.
- the present disclosure has been made in view of the above problems, and aims to provide an image contrast enhancement method and an information processing apparatus capable of setting more appropriate parameters for making features caused by display defects clearer. aim.
- An image contrast enhancement method is a contrast enhancement method for an image obtained by imaging an image display surface of a display device, the information processing device comprising a step of performing contrast enhancement on the image,
- a graph showing the relationship between the value before contrast enhancement and the value after contrast enhancement of the gradation value of the included pixel is a curve having two inflection points.
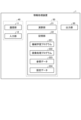
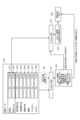
- FIG. 1 is a block diagram showing the main configuration of an information processing apparatus.
- FIG. 2 is a block diagram showing the main functional configuration of the information processing device.
- FIG. 3 is a diagram showing classification of images in the determination processing by the determination unit and a schematic example of images of each classification.
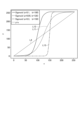
- FIG. 4 is a graph showing the relationship between the gradation values of pixels before contrast enhancement and the gradation values of pixels after contrast enhancement.
- FIG. 5 is a block diagram showing an example of a more specific functional configuration example of the determination unit.
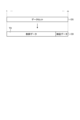
- FIG. 6 is a schematic diagram showing the concept of holdout verification.
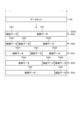
- FIG. 7 is a schematic diagram showing the concept of cross-validation.
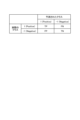
- FIG. 8 is a diagram showing, in the form of a table, an idea about the accuracy of determination using machine learning.
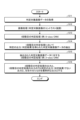
- FIG. 9 is a flow chart showing the flow of machine learning to which multi-step processing is applied.
- FIG. 10 is a diagram showing the flow of machine learning to which multi-stage processing is applied.
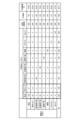
- FIG. 11 is a diagram showing the correspondence relationship between the actual class of verification data included in the reference data and the output (predicted class) of the first verification process by the process of step S3 described with reference to FIG. is.
- FIG. 12 shows the actual class of verification data included in the "reference data corresponding to a specific output" input to the machine learning unit in the process of step S6 described with reference to FIG. 9, and the process of step S6.
- FIG. 10 is a diagram showing the correspondence relationship with the output (predicted class) of the second verification process (first time) by .
- FIG. 13 shows the actual class of the verification data extracted in the process of step S4 described with reference to FIG. It is a figure which shows the correspondence with the output (predicted class) of a process (2nd time).
- FIG. 14 is a diagram showing the correspondence relationship between the actual classes of verification data included in the reference data and the final output (predicted classes) obtained by the processing in step S8 described with reference to FIG. is.
- FIG. 15 is a flowchart showing the flow of determination processing by a machine learning unit in which multi-step processing is applied to image data classification determination using machine learning.
- FIG. 16 is a graph showing the relationship between the gradation values of pixels before contrast enhancement and the gradation values of pixels after contrast enhancement.
- FIG. 17 is a diagram showing the relationship between the distribution of gradation values of an image of a display panel with "diagonal unevenness” and the distribution of gradation values of an image of a "non-defective" display panel.
- FIG. 18 is a diagram showing the difference between Formula (1) and Formula (2) and the relationship between the graph corresponding to Formula (2) and gain_1, gain_2, Inflection_1, Inflection_2, height_1, and height_2.
- FIG. 19 is a diagram showing an image of a display panel classified as "non-defective” and an example of application of image processing to the image.
- FIG. 20 is a diagram showing an image of a display panel corresponding to both "scanning line defect" and “signal line defect” and an example of application of image processing to the image.
- FIG. 21 is a diagram showing an image captured of a display panel classified as "oblique unevenness” and an example of application of image processing to the image.
- FIG. 22 is a diagram showing an image captured of a display panel classified as "white unevenness” and an example of applying image processing to the image.
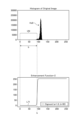
- FIG. 23 is a diagram showing the relationship between a histogram showing the distribution of gradation values of pixels included in an image of the display panel and the position (b) of the point of inflection.
- FIG. 1 is a block diagram showing the main configuration of the information processing device 1.
- the information processing device 1 includes a communication section 11 , an input section 12 , a calculation section 21 , a storage section 22 and an output section 30 .
- the communication unit 11 communicates with external devices.
- the communication unit 11 has, for example, a circuit that functions as a NIC (Network Interface Controller).
- the communication unit 11 outputs data received from an external device to the calculation unit 21 .
- the communication section 11 transmits the data to the external device.
- the external device may be, for example, a stationary information processing device such as a server different from the information processing device 1 or a PC (Personal Computer), or a mobile terminal such as a smartphone.
- the information processing apparatus according to another form not exemplified here may be used.
- the input unit 12 has an interface that allows data to be input.
- the interface is, for example, a USB (Universal Serial Bus) or a bus interface compatible with other standards, but is not limited to these, and specific standards can be changed as appropriate.
- An external device is connected to the bus interface, for example, via a cable for inputting data from the external device.
- Input devices such as a keyboard and a mouse for the operator to operate the information processing apparatus 1 may be further connected to the bus interface.
- At least one of the communication unit 11 and the input unit 12 functions as an acquisition unit 40 .
- the arithmetic unit 21 has an arithmetic circuit that functions as a CPU (Central Processing Unit).
- the calculation unit 21 reads out the software program and data referred to during execution processing of the software program from the storage unit 22 and performs calculation processing corresponding to various functions provided by the information processing apparatus 1 .
- program, etc. refers to a software program read and executed by the computing unit 21 and data referred to when the software program is executed.
- the storage unit 22 has a storage device that stores programs and the like.
- the storage device includes, for example, one or more of solid state drives (SSD: Solid State Drive), hard disk drives (HDD: Hard Disk Drive), and other rewritable storage devices. It may also include a non-rewritable storage device.
- FIG. 1 shows a machine learning program 221, an image processing program 222, reference data 223, and setting data 224 as programs and the like stored in the storage unit 22.
- the calculation unit 21 and the storage unit 22 that stores programs and the like read by the calculation unit 21 function as a processing unit 50 .
- the machine learning program 221 is a program or the like for performing machine learning.
- the output unit 30 outputs according to the processing content of the processing unit 50 .
- the output unit 30 is, for example, a monitor that displays an image, but is not limited to this.
- the output unit 30 may further include a configuration that performs output in another form, such as a speaker that outputs audio, and when the communication unit 11 transmits data to an external device, the communication unit 11 It can be said that it functions as the output unit 30 .
- the input unit 12 conforms to a standard that allows bi-directional data transmission, the input unit 12 also functions as the output unit 30 .
- FIG. 2 is a block diagram showing the main functional configuration of the information processing device 1.
- the information processing device 1 functions as an acquisition unit 40 , a processing unit 50 and an output unit 30 .
- the acquisition unit 40 acquires the determination target image data 100 .
- the communication unit 11 can acquire the determination target image data 100 from an external device through communication.
- the input unit 12 can acquire determination target image data 100 input from an external device.
- the processing unit 50 functions as an image processing unit 51 and a determination unit 60.
- the image processing unit 51 performs image processing on the determination target image data 100 .
- a program or the like for the calculation unit 21 to function as the image processing unit 51 is an image processing program 222 .
- the determination unit 60 performs determination processing for classifying images using a neural network NN.
- a machine learning program 221 is a program or the like for the operation unit 21 to function as the determination unit 60 .
- An image to be determined by the determination unit 60 is an image obtained by reading image data included in the determination target image data 100 .
- the output unit 30 outputs the results of the determination processing by the determination unit 60.
- the output unit 30 performs display output indicating the result of determination processing by the determination unit 60 .
- FIG. 3 is a diagram showing the classification of images in the determination processing by the determination unit 60 and a schematic example of images of each classification. As shown in FIG. 3, the image is classified into, for example, non-defective product, defective circuit, defective signal line, defective scanning line, oblique unevenness, vertical stripe, cluster, or white unevenness by the determination processing by the determination unit 60. .
- oblique unevenness refers to a defect in which an area with a luminance difference with respect to the surroundings appears to extend in the shape of a long axis. Although it is written as "diagonal", it also includes cases where it extends horizontally or vertically with respect to the screen.
- a vertical stripe refers to a defect in which a luminance difference appears to occur corresponding to a divided block of a signal line or the like.
- a cluster refers to a defect that is found concentrated in an area where point defects exist.
- White unevenness refers to a defect in which an area that is brighter/darker than the surrounding area appears to occur irregularly when in-plane uniform gradation display is performed. The present invention is not limited to detection of these types of unevenness per se, and failure modes not included in the above may be further defined.
- the determination target image data 100 includes a plurality of image data.
- the image data is image data obtained by imaging the image display surface of the display panel displaying a white or halftone solid image.
- the state in which a white solid image is displayed refers to the state in which all the pixels perform display output with the maximum white gradation value.
- a state in which a halftone solid image is displayed means a state in which display output is performed with a gradation value in which all pixels are less than the maximum gradation value and exceed the minimum gradation value.
- the display panel is, for example, an OLED (Organic Light Emitting Diode) display panel, but is not limited to this, and may be a display panel of another type.
- Each of the plurality of image data included in the determination target image data 100 is obtained by capturing an image display surface of a different display panel.
- the determination processing performed by the determination unit 60 in the embodiment is for confirming whether or not a plurality of display panels, which are imaged when the determination target image data 100 is generated, can perform display output with the expected quality. This process is intended to automatically inspect products.
- a display panel when simply referred to as a display panel, it refers to one of a plurality of display panels that have been imaged when generating the determination target image data 100 .
- an image when simply described as an image, it means an image obtained by reading image data, unless otherwise specified.
- the determination target image data 100 and the reference data 223 are either an image obtained by cutting an image captured in the state of the Mother Glass substrate for each panel, or an image captured for each panel after cutting the Mother Glass substrate for each panel. It's okay.
- the images of the image data included in the determination target image data 100 and the reference data 223 are grayscale or black and white images.
- the image processing unit 51 which will be described later, may sequentially perform grayscale processing based on each primary color.
- a good product is one that can be displayed and output with the expected quality. That is, the display panel on which the image determined to be non-defective is captured is a non-defective product.
- a circuit defect refers to a characteristic display defect caused by a defect in part or all of the drive circuit that supplies video signals and scanning signals to the pixels that make up the display screen.
- FIG. 3 shows a model example in which part or all of an image is a black area BA that is extremely dark or a white area WA that is too bright for white or halftone solid image display as the characteristic display defect.
- a circuit failure occurs in the display panel on which the image determined as the circuit failure is captured.
- a signal line defect refers to a characteristic display defect caused by a defect in a portion of a plurality of signal lines that transmit image signals to a plurality of pixels provided on a display panel.
- a black area BA that is extremely dark for white or halftone solid image display or a white area WA that is too bright occurs linearly along the longitudinal direction of the rectangular image.
- a model example is shown. Further, in the rightmost schematic example, a black area BA is generated along the direction perpendicular to the longitudinal direction.
- a scanning line defect refers to a characteristic display defect caused by a defective part of a plurality of scanning lines that transmit drive signals to a plurality of pixels provided on a display panel.
- a black area BA that is extremely dark as a white or halftone solid image display, or a dark area GA that is brighter than the black area BA but darker than its surroundings is a rectangular image. shows a schematic example of linearly occurring along the direction orthogonal to the longitudinal direction of the .
- the determination target image data 100 is an image that falls under any of the classifications described with reference to FIG.
- the reference data 223 is prepared in advance on the assumption that images of image data included in the determination target image data 100 are classified.
- the reference data 223 is, for example, image data obtained by imaging the image display surface of a display panel that corresponds to one of the classifications shown in FIG. 3 and whose classification has been determined in advance.
- the image data included in the reference data 223 is added with information that can specify which classification it belongs to when read by the calculation unit 21 .
- the image processing unit 51 individually performs image processing on a plurality of image data included in the determination target image data 100 . Specifically, the image processing unit 51 performs a process of enhancing the contrast of the image.
- FIG. 4 is a graph showing the relationship between the gradation values of pixels before contrast enhancement and the gradation values of pixels after contrast enhancement.
- the gradation value of each of a plurality of pixels included in the image before being processed by the image processing unit 51 is represented by 8 bits, the gradation value ranges from 0 to Takes any value in the range of 255. If the contrast is not changed by image processing by the image processing unit 51, the determination target image data 100 has no difference in the gradation values of the pixels before and after the contrast enhancement, as shown in the graph L4 shown in FIG. .
- the gradation value after contrast enhancement is indicated by the vertical axis in FIG.
- the image processing unit 51 changes the gradation value of each of the plurality of pixels included in the image so that the relationship between before and after contrast enhancement can be represented, for example, by one of the graphs L1, L2, and L3 shown in FIG. to enhance the contrast of the image.
- Graphs L1, L2, and L3 are sigmoid curves represented by the sigmoid function shown in Equation (1).
- y in Expression (1) indicates the gradation value of the pixel after image processing by the image processing unit 51 .
- x in equation (1) indicates the gradation value of the pixel before image processing by the image processing unit 51 .
- Equation (1) indicates the value of x corresponding to the point of inflection of the sigmoid curve, that is, x among the coordinates (x, y) at which the slope of the sigmoid curve is the largest. With b in between, the sigmoid curve is downwardly convex when x ⁇ b, and is upwardly convex when x>b.
- a in Equation (1) is a coefficient corresponding to the magnitude of the slope of the sigmoid curve. Note that exp[ ] in Equation (1) and Equation (2) to be described later indicates an exponential function.
- the description of the embodiment, formula (1), and formula (2) to be described later assume that the image of the image data included in the reference data 223 and the determination target image data 100 is an 8-bit image. That is, in the description of the embodiment and formulas (1) and (2), it is assumed that the maximum gradation value of the pixels included in the image is 255.
- the numerical value "255" described as the numerator of formulas (1) and (2) assumes the highest grayscale value of pixels included in an 8-bit image.
- images that can be handled by the information processing apparatus 1 are not limited to 8-bit images.
- the information processing device 1 can handle r-bit images. r is any natural number.
- the highest grayscale value for an r-bit image is 2 r ⁇ 1.
- the image handled by the information processing device 1 is an r-bit image
- the numerical value "255" described as the numerator of the equations (1) and (2) is replaced with "2 r -1". be.
- the image of the image data included in the reference data 223 of the embodiment is previously subjected to image processing by the image processing unit 51 .
- FIG. 5 is a block diagram showing an example of a more specific functional configuration example of the determination unit 60.
- the determination unit 60 includes a machine learning unit 70 , a verification unit 61 and a restrictive classification processing unit 62 .
- the machine learning section 70 performs machine learning according to a predetermined algorithm.
- CNN Convolutional Neural Network
- the machine learning unit 70 includes a feature extraction unit 71 and an identification unit 72.
- the processing included in CNN is roughly divided into two processings.
- One of the two processes is extraction of the feature amount of an image to be processed using CNN, and is performed by the feature amount extraction unit 71 .
- the other one of the two processes is the process of obtaining the output of the neural network NN from the input of the data indicating the feature amount of the image.
- the output of the neural network NN is a probability value (in the range 0 to 1) falling within each of the categories described with reference to FIG.
- the feature quantity extraction unit 71 includes a convolution processing unit 711 and a pooling processing unit 712 .
- the convolution processing unit 711 performs convolution processing on the image.
- the convolution processing here is the same as the convolution processing employed in general CNN.
- each gradation value of a plurality of pixels included in an image is regarded as a matrix value.
- the two-dimensional image can be regarded as a matrix with p rows and q columns.
- Each tone value of a plurality of pixels of the two-dimensional image can be regarded as a matrix component. Assuming that the matrix is ⁇ and the component of the matrix ⁇ is ⁇ , the component at the e-th position in the X direction and the f-th position in the Y direction in the matrix ⁇ can be expressed as ⁇ ef .
- a reference matrix called a kernel or filter is set as a matrix separate from the two-dimensional image described above.
- the reference matrix is hereinafter referred to as a kernel.
- the number of rows of the kernel is smaller than the number of rows of the image to be convolved (for example, the two-dimensional image described above).
- the number of columns of the kernel is smaller than the number of columns of the image to be convolved (for example, the two-dimensional image described above).
- the matrix elements included in the kernel are predetermined weighting number values (generally integers).
- the convolution processing unit 711 treats one of the images included in the determination target image data 100 as a matrix, and performs extraction processing of extracting a part of the matrix corresponding to the number of rows and columns of the kernel. That is, the part can be regarded as a matrix having the same number of rows and columns as the kernel.
- the convolution processing unit 711 performs multiplication processing to obtain a matrix product obtained by multiplying the part and the kernel.
- the convolution processing unit 711 performs addition processing for obtaining one value by adding the values of the components included in the product of the matrices.
- the convolution processing unit 711 treats the one value as one feature amount.
- the convolution processing unit 711 sets a plurality of ranges to be subjected to extraction processing in one image regarded as a matrix.
- the convolution processing unit 711 performs extraction processing, multiplication processing, and addition processing on each range to obtain the feature amount of each range.
- one image is converted into data (first feature amount matrix) in which values indicating feature amounts are arranged in a matrix. More specifically, padding (complementation of pixels) or the like may be performed during the extraction process, but since this is well known, a detailed description thereof will be omitted here.
- the pooling processing unit 712 performs pooling processing on the image on which the convolution processing has been performed by the convolution processing unit 711 .
- the pooling process referred to here is the same as the pooling process employed in general CNN.
- the components of the first feature matrix obtained by the convolution process described above are divided into multiple groups. For example, assume that the first feature matrix is a matrix with 10 rows and 10 columns. Here, when the first feature amount matrix is segmented for each range of 2 rows and 2 columns, a 5 ⁇ 5 range can be set for the first feature amount matrix. Here each range is considered a separate group.
- the components of the first feature amount matrix obtained by the convolution process can be divided into a plurality of groups based on such a concept. The pooling process derives one value for each group. Methods for deriving the one value include, for example, maximum value pooling, average value pooling, and the like.
- Maximum value pooling is a method of deriving the maximum value among matrix elements included in a group.
- Mean pooling is a method of deriving the mean of the matrix elements included in a group.
- the second feature amount matrix is regarded as data representing the feature amount of one image (for example, one of a plurality of images included in the determination target image data 100) regarded as a matrix by the convolution processing unit 711. be able to.
- the processing of the convolution processing unit 711 and the pooling processing unit 712 for one image may be performed once or more, and may be repeated a predetermined number of times.
- the processing performed by the feature amount extraction unit 71 may further include an operation that is the reverse of the convolution processing (deconvolution) and an operation that is the reverse of the pooling processing (unpooling).
- the identification unit 72 includes a neural network generation unit 721 and a probability conversion unit 722.
- the neural network generator 721 generates a neural network NN.
- the probability conversion unit 722 performs arithmetic processing to convert the output of the neural network NN generated by the neural network generation unit 721 into a probability value (a value within the range of 0 to 1).
- the inputs to the neural network NN when CNN is adopted are the components of the matrix (second feature matrix) obtained as the output of the pooling process described above.
- the number of elements included in the matrix corresponds to the number of input nodes of the neural network NN.
- a neural network NN is similar to a neural network in general machine learning and includes one or more fully connected layers. In the fully connected layer, weighting processing is performed on the input. In general, among the one or more fully connected layers of the neural network NN, the number of biases of the fully connected layer (final stage) closest to the output side is the type of discrimination performed using the neural network NN (for example, , the number of classifications described with reference to FIG. 3).
- the output of a neural network NN can take any value (number greater than 1). Therefore, in order to treat the output of the neural network NN as "a value indicating likelihood that can be used to determine which class it belongs to", calculation by the probability conversion unit 722 is performed.
- the calculation by the probability conversion unit 722 is, for example, calculation using a Softmax function, but is not limited to this and can be changed as appropriate.
- the verification unit 61 gives the machine learning by the machine learning unit 70 a validation function.
- the verification unit 61 suppresses over-learning in machine learning, and makes it easier to improve the accuracy of determination by machine learning.
- Examples of verification functions by the verification unit 61 include holdout verification, cross-validation, and the like.
- FIG. 6 is a schematic diagram showing the concept of holdout verification.
- a data set DS including m pieces of image data is indicated by a rectangle. 6 and 7, from the first image data to the m-th image data among m pieces of image data from one end side to the other end side in the longitudinal direction along the longitudinal direction of the rectangle. Assume they are lined up in order. m is a natural number.
- the data set DS is divided into teacher data TD and verification data CD, as shown in FIG.
- the teacher data TD is used as teacher data in machine learning.
- the verification data CD is used as verification data in machine learning.
- One data set DS includes multiple image data corresponding to one decision result by machine learning.
- the "non-defective" data set DS for explaining FIG. 3 includes m image data obtained by individually imaging the image display surfaces of m display panels corresponding to the "non-defective".
- n pieces of image data are extracted from the m pieces of image data and used as teacher data TD, and the determination unit 60 performs machine learning using the teacher data TD.
- n is a natural number less than m.
- the determination unit 60 after learning with the teacher data TD determines the verification data CD which is (mn) pieces of image data excluding the teacher data TD in the data set DS.
- the verification data CD is a part of the data set DS and includes only image data corresponding to one decision result by machine learning. Therefore, ideally, the determination unit 60 after learning with the teacher data TD determines that all image data included in the verification data CD are image data corresponding to the one determination result. However, in practice, part of the verification data CD may be determined to be image data corresponding to other determination results. Therefore, the determination unit 60 after machine learning using the teacher data TD determines the verification data CD to verify the determination accuracy of the determination unit 60, and further enhance the determination accuracy based on the learning using the teacher data TD. It is done so that it can be done.
- the verification unit 61 divides the data set DS into the teacher data TD and the verification data CD, and the learning of the machine learning unit 70 with the teacher data TD and the judgment accuracy based on the verification data CD. verification and
- FIG. 7 is a schematic diagram showing the concept of cross-validation.
- the verification unit 61 treats the data set DS as a data set DSS1, as shown in FIG. 7, for example.
- Data set DSS1 includes data sets DSa, DSb, DSc, DSd and DSe.
- Data set DSa is data obtained by dividing data set DS into verification data CD1 and teacher data TD1.
- Data set DSb is data obtained by dividing data set DS into verification data CD2 and teacher data TD21 and TD22.
- Data set DSc is data obtained by dividing data set DS into verification data CD3 and teacher data TD31 and TD32.
- Data set DSd is data obtained by dividing data set DS into verification data CD4 and teacher data TD41 and TD42.
- Data set DSe is data obtained by dividing data set DS into verification data CD5 and teacher data TD5.
- Teacher data TD1, TD21, TD22, TD31, TD32, TD41, TD42, and TD5 are used as teacher data in machine learning.
- Verification data CD1, CD2, CD3, CD4, and CD5 are used as verification data in machine learning.
- the verification data CD1, the verification data CD2, the verification data CD3, the verification data CD4, and the verification data CD5 each include different image data.
- cross-validation sets a plurality of patterns (for example, data sets DSa, DSb, DSc, DSd, and DSe) regarding which part of the m pieces of image data included in the data set DS is regarded as verification data.
- the holdout verification (see FIG. 6) is repeated by the number of the plurality of patterns.
- the verification unit 61 that performs cross-validation is employed in the embodiment, it is not limited to this, and the specific verification algorithm performed by the verification unit 61 can be changed as appropriate.
- the reference data 223 of the embodiment includes multiple data sets corresponding to the number of classifications described with reference to FIG. Specifically, the reference data 223 includes data sets DS1, DS2, DS3, DS4, DS5, DS6, DS7 and DS8 (see FIG. 10).
- the data set DS1 is a data set DS including m image data obtained by individually imaging the image display surfaces of m display panels corresponding to "non-defective products”.
- the data set DS2 is a data set DS including m image data obtained by individually imaging the image display surfaces of the m display panels corresponding to "oblique unevenness".
- the data set DS3 is a data set DS including m image data obtained by individually imaging the image display surfaces of the m display panels corresponding to the "signal line defect”.
- the data set DS4 is a data set DS including m image data obtained by individually imaging the image display surfaces of m display panels corresponding to "scanning line defects”.
- the data set DS5 is a data set DS including m image data obtained by individually imaging the image display surfaces of the m display panels corresponding to "circuit failure”.
- the data set DS6 is a data set DS including m image data obtained by individually imaging the image display surfaces of the m display panels corresponding to the "vertical stripes”.
- the data set DS7 is a data set DS including m image data obtained by individually imaging the image display surfaces of the m display panels corresponding to the "cluster”.
- the data set DS8 is a data set DS including m image data obtained by individually imaging the image display surfaces of the m display panels corresponding to "white unevenness”.
- the verification unit 61 of the embodiment performs cross-validation individually on each of the data sets DS1, DS2, DS3, DS4, DS5, DS6, DS7 and DS8.
- Fig. 8 is a table showing the concept of the accuracy of judgment using machine learning. Those with a condition where 1 (Positive) is given when an image "corresponds to an image in which a specific target is captured", and -1 (Negative) is given when "it does not correspond to an image in which a specific target is captured”. and Under this condition, all images are considered to be images that can give a rating of 1 or -1.
- machine learning it is possible to obtain an output indicating whether or not an image based on input data (feature amount) "corresponds to an image in which a specific target is captured”.
- the machine learning unit 70 outputs the result of determination as to whether or not the image corresponds to an image in which a specific target is captured.
- the machine learning unit 70 of the embodiment in response to the input of the determination target image data 100 or the verification data (for example, verification data CD etc.)
- the resulting image falls under any of the following categories: "good product”, “diagonal unevenness”, “signal line failure”, “scanning line failure”, “circuit failure”, “vertical stripes”, “cluster” or “white unevenness”.
- an image determined to fall under a category other than "non-defective" can be said to be an image determined to be "non-defective”.
- the "actual class” column shown in Fig. 8 shows the results of the visual inspection by the inspector. For example, an image in which a specific target is actually captured is an image corresponding to an image in which a specific target is captured, and 1 is given. In addition, an image ⁇ not capturing a specific target'' is an image ⁇ does not correspond to an image capturing a specific target'' and is given -1.
- the "predicted class” shown in FIG. 8 indicates the result of determination using machine learning. That is, 1 is given to an image that is determined to be an image in which a specific target is captured. In addition, ⁇ 1 is given to an image that is determined as “not corresponding to an image in which a specific object is imaged” in the determination.
- the value indicating the accuracy rate is the value of (TP+TN)/(TP+TN+FN+FP).
- the value indicating the recall is the value of TP/(TP+FN).
- the value indicating the matching rate is the value of TP/(TP+FP).
- a value indicating the false positive rate is the value of FP/(TN+FP). If Q is the detection rate and R is the precision rate, the F value is 2 ⁇ Q ⁇ R/(Q+R).
- the limited classification processing unit 62 performs multi-stage processing.
- the multi-stage processing referred to here means extracting, from the plurality of images, some of the input data corresponding to some of the judgment results indicated by the output of the machine learning unit 70 for the plurality of input data, and extracting It refers to a process of inputting the part of the input data thus obtained to the machine learning unit 70 and causing the machine learning part 70 to further determine which of the part of the determination result is.
- the determination target image data 100 includes a plurality of image data (for example, 1600 image data).
- a plurality of image data for example, 1600 image data.
- the limited classification processing unit 62 extracts the partial image data from the plurality of image data.
- the limited classification processing unit 62 inputs the extracted part of the input data to the machine learning unit 70 again, and causes the machine learning unit 70 to output the determination again.
- the classification by the judgment is limited to a part of the classification (for example, "non-defective item" or "diagonal unevenness").
- simply inputting the part of the input data to the machine learning unit 70 causes the part of the input data to be processed again by the convolution processing unit 711 and the pooling processing unit 712 .
- the data to be used may be used as it is, and the processing by the convolution processing unit 711 and the pooling processing unit 712 may not be repeated.
- FIG. 9 and 10 The flow of machine learning by the machine learning unit 70 to which the multi-stage processing by the restrictive classification processing unit 62 is applied will be described below with reference to FIGS. 9 and 10.
- FIG. 9 and 10 The processing flow described with reference to FIGS. 9 and 10 is the processing flow of supervised learning using the image data included in the reference data 223 as teacher data.
- FIG. 9 is a flow chart showing the flow of machine learning to which multi-stage processing is applied.
- FIG. 10 is a diagram showing the flow of machine learning to which multi-stage processing is applied.
- the reference data 223 is acquired (step S1).
- the computing unit 21 that is executing the machine learning program 221 reads the reference data 223 from the storage unit 22 .
- part of the image data included in the reference data 223 is used as teacher data, and the other part is used as verification data.
- TD a portion treated as teacher data
- CD a portion treated as verification data
- step S2 the first stage of machine learning processing is performed by the machine learning unit 70 (step S2).
- the processing of step S2 is machine learning processing using teacher data included in data sets DS1, DS2, DS3, DS4, DS5, DS6, DS7, and DS8 included in reference data 223.
- FIG. In the machine learning process, for example, when the data indicating the feature amount of the image of the verification data included in the reference data 223 is input to the neural network NN, the image of the data is the eight types described with reference to FIG. This is a machine learning process for determining a weighting value in a neuron of the neural network NN for the purpose of allowing the machine learning unit 70 to determine which of the classifications it is.
- the first-stage machine learning process is described as "8-class CNN" and is labeled with step ST1.
- step S3 the first stage verification process is performed (step S3).
- the calculation unit 21 inputs the verification data included in the data sets DS1, DS2, DS3, DS4, DS5, DS6, DS7, and DS8 included in the reference data 223 to the machine learning unit 70, step This is the process of obtaining the output of the machine learning unit 70 in which the machine learning by the process of S2 is reflected. That is, the process of step S3 is a process of obtaining an output indicating which of the eight classifications described with reference to FIG. The output obtained by the process of step S3 is indicated as output OP1 in FIG.
- the limited classification processing unit 62 extracts verification data for which a specific output (verification result) was obtained in the first-stage verification process (step S4).
- the verification data extracted in the process of step S4 is part of the verification data handled as input to the machine learning unit 70 in the process of step S3, and is one of the eight classifications described with reference to FIG. It is the verification data obtained with the output indicating that it is determined to be part of the classification (for example, “non-defective product” or “oblique unevenness”).
- the “specific output” refers to the output indicating that it has been determined to be the partial classification.
- step S5 the second-stage machine learning process is performed using the image data corresponding to the specific output among the image data contained in the reference data 223 (step S5).
- Image data corresponding to a specific output among the image data contained in the reference data 223 or “reference data corresponding to a specific output” are part of the reference data 223, and " A data set (for example, data set DS1 and data set DS2) including image data corresponding to a part of classification (for example, "non-defective product" or "oblique unevenness") treated as "specific output”.
- the process of step S5 is a machine learning process using teacher data included in the above-described "reference data corresponding to a specific output”.
- the image of the data is the eight types described with reference to FIG.
- a machine learning process that determines weight values in neurons of the neural network NN for the purpose of allowing the machine learning unit 70 to determine which of the partial classifications corresponding to the "specific output" among the classifications. be.
- the second-stage machine learning process is described as "2-class CNN" and is labeled with step ST2.
- step S6 the second-stage verification process (first time) is performed (step S6).
- the calculation unit 21 inputs the verification data included in the above-described "reference data corresponding to the specific output” to the machine learning unit 70, and the machine learning reflected by the process of step S5 is performed.
- This is processing for obtaining the output of the learning unit 70 . That is, in the process of step S6, the image of the verification data included in the above-described "reference data corresponding to a specific output" is classified by the machine learning unit 70 into the eight types described with reference to FIG. This is the process of obtaining an output that is determined to be any of the partial classifications that correspond to the "specific output” in the process of S4.
- step S7 feedback to the machine learning by the process of step S5 may be performed based on the output obtained by the process of step S6. That is, based on the process of step S6, the accuracy of machine learning may be improved by the process of step S5.
- step S7 After the process of step S7, the output obtained in the second stage verification process (second time) and the output other than the specific output (verification result) among the outputs obtained in the first stage verification process are combined.
- a process is performed to make the object the final output (step S8).
- the calculation unit 21 receives the output obtained in the process of step S7 and the verification data that was not extracted by the process of step S4 among the outputs obtained in the process of step S3.
- the obtained output and are integrated, and the integrated output is used as the final output of the machine learning unit 70 .
- the output obtained by the process of step S8 is shown as output OP3 in FIG.
- steps S2 to S7 are repeated according to the number of data sets generated by cross-validation.
- the number of data sets is 5 because the data sets DSa, .
- each data set DS of the data sets DS1, DS2, is taken as an example in which 200 are treated as training data and 200 are treated as verification data (the number of objects to be judged). Also, the "number of correct answers" in the tables of FIGS. 11 to 14 corresponds to TP in FIG. Also, “prediction accuracy” in the tables of FIGS. 11 to 14 is the ratio of the number of correct answers to the number of verification data corresponding to each classification (the number of actual classes), and corresponds to the above-described recall rate.
- FIG. 11 shows the correspondence relationship between the actual class of verification data included in the reference data 223 and the output (predicted class) of the first verification process by the process of step S3 described with reference to FIG. It is a diagram.
- FN 44/200
- whose actual class is "non-defective” but whose predicted class is other than “non-defective” will be described.
- those whose predicted class was "diagonal unevenness" (21/44) accounted for nearly half of the FNs, which was significant compared to the number of each of the other classes in the FNs. to big.
- a TP whose actual class matches the predicted class will be described.
- the TP (111/200) of "oblique unevenness” is significantly smaller than the TPs of other classifications.
- FN 89/200 in which the actual class is "diagonal unevenness” but the predicted class is other than "diagonal unevenness” will be described. Of those FNs, more than half of the FNs (62/89) were assigned the predicted class of "good", significantly greater than the number of each of the other categories in the FNs. .
- FIG. 12 shows the actual class of verification data included in the “reference data corresponding to a specific output” input to the machine learning unit 70 in the process of step S6 described with reference to FIG. It is a figure which shows the correspondence with the output (predicted class) of the 2nd verification process (1st time) by a process.
- FIG. 11 and FIG. 12 by limiting the actual class and the predicted class to "non-defective product" and "diagonal unevenness", the degree of matching between the actual class and the predicted class is be heightened.
- 156/200 of both the actual class and the predicted class are "non-defective", which is 78.0% when converted to prediction accuracy.
- FIG. 11 shows the example shown in FIG. 11
- the actual class and the predicted class are both “non-defective” at 180/200, which is 90.0% when converted to prediction accuracy.
- the actual class and the predicted class are both "oblique unevenness" at 111/200, which is 55.5% when converted to prediction accuracy.
- the actual class and the predicted class are both "non-defective" at 160/200, which is 80.0% when converted to prediction accuracy.
- FIG. 13 shows the actual class of the verification data extracted in the process of step S4 described with reference to FIG. 9 and input to the machine learning unit 70 in the process of step S7, and the second It is a figure which shows the correspondence with the output (predicted class) of verification processing (2nd time).
- the degree of matching between the actual class and the predicted class is be heightened.
- 156/200 of both the actual class and the predicted class are "non-defective", which is 78.0% when converted to prediction accuracy.
- FIG. 11 shows the example shown in FIG. 11
- FIG. 14 shows the correspondence relationship between the actual classes of verification data included in the reference data 223 and the final outputs (predicted classes) obtained by the processing of step S8 described with reference to FIG. It is a diagram.
- the table shown in FIG. 14 is obtained by updating some of the various values contained in the table shown in FIG. 11 with the values contained in the table shown in FIG. By updating the part of the values, among the values shown in FIG. TP (140) of "diagonal unevenness" and FN of "diagonal unevenness", i.e., the actual class is "diagonal unevenness” but the predicted class is "non-defective product". ' (33) is reflected.
- the final output obtained by the process of step S8 has higher prediction accuracy of "non-defective product” and "diagonal unevenness” than the output of the first verification process. rising. Therefore, even when looking at overall prediction accuracy using machine learning, the final output obtained by the process of step S8 naturally has higher prediction accuracy than the output of the first verification process.
- the prediction accuracy that is, the match between the actual class and the predicted class can be improved. You can increase the degree.
- the multi-stage processing by the limited classification processing unit 62 can be applied not only to machine learning but also to image data classification determination using machine learning.
- the flow of determination processing by the machine learning unit 70 in which multi-stage processing is applied to image data classification determination using machine learning will be described below with reference to FIG. 15 .
- Image data classification determination using machine learning is performed after machine learning described with reference to FIGS. 9 to 14 .
- FIG. 10 the flow of input of the determination target image data 100 based on FIG. 15 is indicated by broken lines.
- FIG. 15 is a flow chart showing the flow of determination processing by the machine learning unit 70 in which multi-stage processing is applied to image data classification determination using machine learning.
- acquisition of determination target image data 100 is performed (step S11).
- the acquisition unit 40 acquires the determination target image data 100 from an external device, and outputs the determination target image data 100 to the calculation unit 21 .
- step S12 image processing is performed by the image processing unit 51 (step S12). Specifically, as described with reference to FIG. 4 , the image processing unit 51 performs image processing for further enhancing the contrast of the image data included in the determination target image data 100 .
- step S13 the machine learning unit 70 performs the first stage of determination processing.
- the calculation unit 21 inputs the image data included in the determination target image data 100 to the machine learning unit 70, and the machine learning unit 70 reflects the machine learning described with reference to FIG. This is the process to get the output. That is, the process of step S13 determines which of the eight types of classification described with reference to FIG. This is the process to get the output.
- the limited classification processing unit 62 extracts the determination target image data 100 for which a specific output (determination result) was obtained in the first-stage determination process (step S14).
- the verification data extracted in the process of step S14 is part or all of the image data included in the determination target image data 100 handled as input to the machine learning unit 70 in the process of step S13. This is the image data for which an output was obtained indicating that it was determined to be in some of the eight types of classification (for example, "non-defective product" or "oblique unevenness”).
- the “specific output” refers to the output indicating that it has been determined to be the partial classification.
- step S15 the machine learning unit 70 classifies the images of the image data from which the specific output (determination result) extracted in the process of step S14 into the eight types described with reference to FIG. Among them, this is a process of obtaining an output indicating which of the partial classifications corresponding to the "specific output" is determined in the process of step S14.
- step S15 After the process of step S15, the output obtained in the second stage determination process and the output other than the specific output (verification result) among the outputs obtained in the first stage determination process are finally combined. Then, a process for producing an output is performed (step S16).
- the calculation unit 21 receives the output obtained in the process of step S15 and the image data that was not extracted by the process of step S14 among the outputs obtained in the process of step S13. The obtained output and , are integrated, and the integrated output is used as the final output of the machine learning unit 70 .
- Classification accuracy can be further improved in the same manner as described with reference to .
- graphs L1, L2, and L3 are illustrated as graphs showing the relationship between tone values before and after contrast enhancement, but the relationship between tone values before and after contrast enhancement is limited to these graphs. It is not something that can be done.
- FIG. 16 is a graph showing the relationship between the gradation values of pixels before contrast enhancement and the gradation values of pixels after contrast enhancement.
- the image processing unit 51 changes the gradation value of each of the plurality of pixels included in the image so that the relationship between before and after contrast enhancement can be expressed as one of the graphs L11, L12, and L13 shown in FIG. 16, for example. By doing so, the contrast of the image may be further emphasized.
- the image processing performed by the image processing unit 51 in the processing of step S12 is not limited to the one corresponding to the above equation (1).
- a more advanced concept of contrast enhancement performed by the image processing unit 51 will be described below. The relationship between the distribution of the gradation values of the captured image and the relationship will be described with reference to FIG. 17 .
- FIG. 17 is a diagram showing the relationship between the distribution of gradation values of an image of an "oblique" display panel and the distribution of gradation values of an image of a "non-defective" display panel.
- the histogram Hs1 is a histogram showing the gradation values of the pixels included in one image of the display panel with "oblique unevenness".
- the histograms referred to in the description of the embodiments, including the histogram Hs1 indicate the range of gradation values of pixels included in an image (range from 0 to the maximum value that can be represented by the number of bits of the gradation value) along the horizontal axis. , the number of pixels of each gradation value is shown in the direction of the vertical axis.
- the histogram Hs2 is a histogram indicating the gradation values of pixels included in one image of a "non-defective" display panel.
- Histogram Hs3 is a histogram showing the gradation values of pixels included in one image obtained by imaging a display panel that is a "non-defective" display panel and is different from that of histogram Hs2.
- Each histogram shown in FIG. 17 is a histogram showing the gradation values of the image before image processing by the image processing unit 51 is performed.
- the distribution of the gradation values of an image of a "good" display panel displaying a white or halftone solid image shows the most frequent appearance of the gradation values.
- the histogram corresponding to .
- the fluctuation range of the gradation value of the peak of the histogram is roughly the number of bits of the pixel (the lowest gradation value that the pixel can take). It is often less than 10% of the difference from the highest gradation value). For example, if the bit number of a pixel is 8 bits, the gradation value takes values from 0 to 255.
- the fluctuation range of the gradation value of the peak of the histogram rarely exceeds 25.
- the gradation value is relatively low with respect to the gradation value corresponding to the peak of the histogram corresponding to the most frequent appearance of the gradation value.
- the number of pixels with gradation values included in the low gradation value band F11 is significantly generated to such an extent that it cannot be ignored.
- pixels included in the high gradation value band F12 which is relatively high with respect to the gradation value corresponding to the histogram peak, are on the opposite side of the histogram peak to the low gradation value band F11. In the case of a display panel in which there is little or no oblique unevenness that is visually recognized with relatively higher luminance than the surroundings, pixels included in the high gradation value band F12 are generated.
- the difference between the histogram Hs1 and the histogram Hs2 is that the histogram Hs1 has a significant number of pixels included in the low tone value band F11, while the histogram Hs2 has few or no pixels included in the low tone value band F21.
- the "base of the histogram" such as the low gradation value bands F11, F21, F31 and the high gradation value bands F12, F22, F32 is, for example, a gradation value within 30% of the number of bits of pixels centered on the peak of the histogram. fit in the range.
- FIG. 17 for the purpose of showing that the low gradation value band F11 and the low gradation value band F21 are substantially the same gradation value band, the lowest gradation value of the low gradation value band F11 and the low gradation value A broken line F1a connecting the lowest gradation value of the tone value band F21 and a broken line F1b connecting the highest gradation value of the low gradation value band F11 and the highest gradation value of the low gradation value band F21 are illustrated.
- the lowest gradation value of the high gradation value band F12 and the lowest gradation value of the high gradation value band F22 are shown.
- dashed line F2a connecting the gradation values and a dashed line F2b connecting the highest gradation value of the high gradation value band F12 and the highest gradation value of the high gradation value band F22 are shown.
- Dashed lines F1a, F1b, F2a, and F2b run substantially along the vertical axis of the graph.
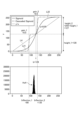
- the image processing unit 51 may perform contrast enhancement based on the following equation (2) instead of the above equation (1). Contrast enhancement based on equation (2) makes it easier to clearly distinguish whether or not pixels included in the above-described "histogram foot" are significantly present, compared to equation (1).
- gain_1, gain_2, Inflection_1, Inflection_2, and height_1 of formula (2) will be described with reference to FIG.
- FIG. 18 is a diagram showing the difference between formula (1) and formula (2) and the relationship between the graph corresponding to formula (2) and gain_1, gain_2, Inflection_1, Inflection_2, height_1, and height_2.
- a graph L21 shown in FIG. 18 is a graph showing the relationship between the gradation values before and after contrast enhancement based on Equation (1), and is a graph corresponding to Equation (1).
- Graph L22 is a graph showing the relationship between tone values before and after contrast enhancement based on equation (2), and is a graph corresponding to equation (2).
- the graph L22 has two inflection points.
- One of the two inflection points is located at Inflection_1 along the horizontal axis.
- the other of the two inflection points is located at Inflection_2 in the horizontal axis direction.
- the values of Inflection_1 and Inflection_2 reflect the setting of the two inflection points in contrast enhancement based on equation (2).
- Inflection_2 is greater than Inflection_1.
- gain_1 indicates the magnitude of the slope of one of the two points of inflection.
- gain_2 indicates the magnitude of the slope of the other of the two inflection points.
- gain_1 and gain_2 are values similar to a described above.
- height_1 indicates the upper limit of the gradation value after contrast enhancement by one of the two inflection points and the lower limit of the gradation value after contrast enhancement by the other of the two inflection points. Note that the lower limit of the gradation value after contrast enhancement by one of the two inflection points is zero. Also, the upper limit value of the gradation value after contrast enhancement by the other of the two inflection points is the maximum gradation value of the pixel. Inflection_1, Inflection_2, and height_1 take values that can be taken by the gradation value of the pixel, and are generally integers of 0 or more.
- gain_1 0.5
- gain_2 0.5
- Inflection_1 90
- Inflection_2 13
- height_1 128.
- a histogram Hs4 shown in FIG. 18 is a histogram of an image of a display panel classified as "non-defective". As shown in FIG. 18, an image of a display panel classified as a “non-defective product” is captured within a gradation value range whose lower limit is the gradation value corresponding to the value of Inflection_1 and whose upper limit is the gradation value corresponding to the value of Inflection_2. Inflection_1 and Inflection_2 are desirably set so that the gradation value range is such that the peaks of the histogram of the resulting image are sufficiently contained.
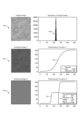
- FIG. 19 is a diagram showing an image of a display panel classified as "non-defective" and an example of application of image processing to the image.
- An unprocessed image Be1 shown in FIG. 19 is an image before image processing by the image processing unit 51.
- FIG. The histogram Hs5 is a histogram showing the distribution of gradation values of pixels included in the unprocessed image Be1.
- the gradation values of the pixels included in the pre-processing image Be1 are the gradation values before contrast enhancement, and contrast enhancement is performed by the image processing unit 51 so that the relationship between before and after contrast enhancement shown in graph L21 is obtained. This is a broken image.
- the post-processing image Af12 uses the gradation values of the pixels included in the pre-processing image Be1 as the gradation values before contrast enhancement, and contrast enhancement is performed by the image processing unit 51 so that the relationship before and after contrast enhancement shown in the graph L31 is obtained.
- This is a broken image.
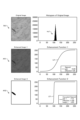
- FIG. 20 is a diagram showing an image of a display panel corresponding to both "scanning line defect" and "signal line defect” and an example of application of image processing to the image.
- An unprocessed image Be2 shown in FIG. 20 is an image before image processing by the image processing unit 51 .
- the histogram Hs6 is a histogram showing the distribution of gradation values of pixels included in the unprocessed image Be2.
- the post-processing image Af21 the gradation values of the pixels included in the pre-processing image Be2 are used as the gradation values before contrast enhancement, and contrast enhancement is performed by the image processing unit 51 so that the relationship before and after contrast enhancement shown in the graph L21 is obtained. This is a broken image.
- the post-processing image Af22 uses the gradation values of the pixels included in the pre-processing image Be2 as the gradation values before contrast enhancement, and contrast enhancement is performed by the image processing unit 51 so that the relationship before and after contrast enhancement shown in the graph L41 is obtained.
- This is a broken image.
- the post-processing image Af21 shown in FIG. 20 is dark overall, and it is more difficult to confirm the black area BA indicating the scanning line defect compared to the pre-processing image Be2 before contrast enhancement.
- the post-processing image Af22 is brighter as a whole, making it easier to confirm the black area BA indicating the scanning line defect.
- the processed image Af22 is in a state in which it is possible to sufficiently confirm the white area WA indicating the signal line failure.
- equation (2) functions substantially the same as equation (1).
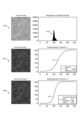
- FIG. 21 is a diagram showing an image captured of a display panel classified as "oblique unevenness" and an example of applying image processing to the image.
- An unprocessed image Be3 shown in FIG. 21 is an image before image processing by the image processing unit 51 .
- the histogram Hs7 is a histogram showing the distribution of the gradation values of the pixels included in the unprocessed image Be3.
- the post-processing image Af31 uses the gradation values of the pixels included in the pre-processing image Be3 as the gradation values before contrast enhancement, and contrast enhancement is performed by the image processing unit 51 so that the relationship before and after contrast enhancement shown in the graph L21 is obtained. This is a broken image.
- the post-processing image Af32 uses the gradation values of the pixels included in the pre-processing image Be3 as the gradation values before contrast enhancement, and contrast enhancement is performed by the image processing unit 51 so that the relationship before and after contrast enhancement shown in the graph L51 is obtained.
- This is a broken image.
- FIG. 22 is a diagram showing an image captured of a display panel classified as "white unevenness" and an example of applying image processing to the image.
- An unprocessed image Be4 shown in FIG. 22 is an image before image processing by the image processing unit 51 .
- the histogram Hs8 is a histogram showing the distribution of the gradation values of the pixels included in the unprocessed image Be4.
- the post-processing image Af41 uses the gradation values of the pixels included in the pre-processing image Be4 as the gradation values before contrast enhancement, and contrast enhancement is performed by the image processing unit 51 so that the relationship before and after contrast enhancement shown in the graph L21 is obtained. This is a broken image.
- the post-processing image Af42 uses the gradation values of the pixels included in the pre-processing image Be4 as the gradation values before contrast enhancement, and contrast enhancement is performed by the image processing unit 51 so that the relationship before and after contrast enhancement shown in the graph L61 is obtained.
- This is a broken image.
- FIG. 23 is a diagram showing the relationship between the histogram Hs9 showing the distribution of the gradation values of the pixels included in the captured image of the display panel and the position (b) of the point of inflection.
- the histogram Hs9 is a histogram of an image of a display panel classified as "oblique unevenness”.
- a range UN shown in FIG. 23 is a gradation value range of pixels having less than 2000 pixels, starting with the number of pixels having lower gradation values.
- the width of the gradation values in the range UN with the lowest gradation value (0) of the pixel as the origin in the horizontal direction, that is, the maximum value of the gradation values in the range UN is set as the value of b.
- the inflection point of the graph can be more preferably set when formula (1) is employed for contrast enhancement of an image from which a histogram from which UN is derived (for example, histogram Hs9) is derived.
- formula (2) is employed for image contrast enhancement
- the highest value of the gradation values in the range UN may be set as the value of Inflection_1.
- the fact that the number of pixels included in the range UN is less than 2000 is merely an example and is not limited to this.
- the number of pixels included in the range UN is desirably determined as a ratio (for example, 15%) to the number of pixels in the image obtained by imaging the display panel.
- an information processing apparatus for example, information processing apparatus 1 generates an image based on training data (for example, reference data 223) that includes image data corresponding to the j types of classification prepared in advance. includes a first machine learning step (for example, step S2) for performing machine learning for determining to which of the j kinds of classifications is applied.
- the information processing apparatus generates teacher data (for example, data sets DS1, DS2), a second machine learning step (for example, step S5) for performing machine learning for determining to which of the k types of classification the image belongs.
- j and k are two or more natural numbers.
- k is smaller than j.
- teacher data eg, data sets DS1 and DS2 of the reference data 223) used in the second machine learning step (eg, step S5) is used in the first machine learning step (eg, step S2) It is a part of teacher data (for example, reference data 223). Thereby, the teacher data used in the first machine learning step and the second machine learning step can be shared.
- the information processing apparatus performs a second inspection after the second machine learning step to determine which of the k types of classification the image data extracted in the first extraction step corresponds to.
- a step eg, step S7 is included. From these, it is possible to confirm the classification accuracy when an image classified as one of the k types in the first machine learning step is reclassified after the second machine learning. Therefore, by reflecting the classification result of the second inspection step, the classification accuracy of the k types of classification can be further improved compared to the case of only the first machine learning step.
- the information processing device eg, information processing device 1
- a second extraction step (eg, step S14) of extracting the data of
- the method according to the embodiment includes a second determination step (for example, step S15) in which the information processing apparatus determines to which of the k types of classification the image data extracted in the second extraction step belongs. .
- step S15 the image classification accuracy can be further improved for the k types of classification among the j types. Therefore, images on the display device can be classified with higher accuracy.
- a machine for determining which of the k types of classification the image belongs to based on a part of the teacher data (for example, the data sets DS1 and DS2 of the reference data 223) including the data of the image corresponding to do the learning.
- j and k are natural numbers of 2 or more.
- k is smaller than j.
- a curve containing one of the two inflection points (eg, Inflection_1) and a curve containing the other of the two inflection points (eg, Inflection_2) are sigmoid curves. Therefore, the gradation value of the contrast-enhanced image increases stepwise across each inflection point, and a contrast-enhanced image having three gradation levels of gradation values as a whole is obtained.
- one of the two inflection points (for example, Inflection_1) is included in the image (for example, the image of the image data included in the determination target image data 100 or the reference data 223) in the graph (for example, the graph L31).
- the other of the two inflection points (for example, Inflection_2) is located at the most frequent gradation value of the pixels included in the image in the graph. It is located at a tone value higher than the value. Therefore, by contrast enhancement, pixels with gradation values lower than the most frequent gradation value and pixels with gradation values higher than the most frequent gradation value of the pixels included in the imaged pixels of the non-defective display device are increased. can be made clear.
- the information processing apparatus 1 of the embodiment can perform contrast enhancement of an image captured on the image display surface of the display device (for example, an image of image data included in the determination target image data 100 or the reference data 223). processing equipment.
- the information processing apparatus 1 includes an image processing section (for example, the image processing section 51) that performs contrast enhancement.
- a graph showing the relationship between the pre-contrast enhancement value and the post-contrast enhancement value of the gradation value of a pixel included in the image is a curve having two inflection points (eg, Inflection_1, Inflection_2).
- the second inspection step and the second determination step for the types less than j among the j types may be performed multiple times.
- classification limited to k different types from j types is performed.
- one of the second inspection steps (or second determination steps) performed multiple times targets k types out of j types, and the other one targets h types out of j types.
- the number of classifications may be different in each of the second inspection step and the second determination step that are performed.
- the teacher data used in the second machine learning step is part of the teacher data used in the first machine learning step, but the teacher data used in the first machine learning step and teacher data used in the second machine learning step may be separate.
- the determination target image data 100 and the reference data 223 include a plurality of image data captured using a device called a large-format lighting inspection device capable of capturing images of a plurality of display panels at once.
- a device called a large-format lighting inspection device capable of capturing images of a plurality of display panels at once.
- the image obtained by imaging the image display surface of the display device may be an image obtained by imaging the image display surface of the display device other than the display panel only, such as an image obtained by imaging the image display surface of a smartphone.
- CNN is adopted, but this is only a specific example of a machine learning algorithm and is not limited to this.
- Machine learning based on other machine learning algorithms may be employed instead of CNN in the above-described embodiments.
Landscapes
- Engineering & Computer Science (AREA)
- Physics & Mathematics (AREA)
- General Physics & Mathematics (AREA)
- Theoretical Computer Science (AREA)
- Computer Hardware Design (AREA)
- Image Analysis (AREA)
Abstract
Description


21 演算部
22 記憶部
30 出力部
40 取得部
50 処理部
51 画像処理部
60 判定部
62 限定分類処理部
70 機械学習部
100 判定対象画像データ
221 機械学習プログラム
222 画像処理プログラム
223 参照データ
224 設定データ
NN ニューラルネットワーク
Claims (4)
- 表示装置の画像表示面を撮像した画像のコントラスト強調方法であって、
情報処理装置が、前記画像のコントラスト強調を行うステップを含み、
前記画像に含まれる画素の階調値のコントラスト強調前の値とコントラスト強調後の値との関係を示すグラフが2つの変曲点を有する曲線である、
画像のコントラスト強調方法。 - 前記2つの変曲点の一方を含む曲線及び前記2つの変曲点の他方を含む曲線は、シグモイド曲線である、
請求項1に記載の画像のコントラスト強調方法。 - 前記2つの変曲点の一方は、前記グラフにおいて前記画像に含まれる複数の画素の最頻階調値よりも低い階調値の位置にあり、
前記2つの変曲点の他方は、前記グラフにおいて前記画像に含まれる複数の画素の最頻階調値よりも高い階調値の位置にある、
請求項1又は2に記載の画像のコントラスト強調方法。 - 表示装置の画像表示面を撮像した画像のコントラスト強調を行う情報処理装置であって、
コントラスト強調を行う画像処理部を備え、
前記画像に含まれる画素の階調値のコントラスト強調前の値とコントラスト強調後の値との関係を示すグラフが2つの変曲点を有する曲線である、
情報処理装置。
Priority Applications (3)
| Application Number | Priority Date | Filing Date | Title |
|---|---|---|---|
| CN202280077007.6A CN118339607A (zh) | 2021-11-25 | 2022-09-08 | 图像的对比度增强方法及信息处理装置 |
| JP2023563525A JPWO2023095417A1 (ja) | 2021-11-25 | 2022-09-08 | |
| KR1020247015971A KR20240074005A (ko) | 2021-11-25 | 2022-09-08 | 화상의 콘트라스트 강조 방법 및 정보 처리 장치 |
Applications Claiming Priority (2)
| Application Number | Priority Date | Filing Date | Title |
|---|---|---|---|
| JP2021-191230 | 2021-11-25 | ||
| JP2021191230 | 2021-11-25 |
Publications (1)
| Publication Number | Publication Date |
|---|---|
| WO2023095417A1 true WO2023095417A1 (ja) | 2023-06-01 |
Family
ID=86539155
Family Applications (1)
| Application Number | Title | Priority Date | Filing Date |
|---|---|---|---|
| PCT/JP2022/033761 Ceased WO2023095417A1 (ja) | 2021-11-25 | 2022-09-08 | 画像のコントラスト強調方法及び情報処理装置 |
Country Status (4)
| Country | Link |
|---|---|
| JP (1) | JPWO2023095417A1 (ja) |
| KR (1) | KR20240074005A (ja) |
| CN (1) | CN118339607A (ja) |
| WO (1) | WO2023095417A1 (ja) |
Citations (5)
| Publication number | Priority date | Publication date | Assignee | Title |
|---|---|---|---|---|
| US20050099546A1 (en) * | 2003-11-10 | 2005-05-12 | Huaya Microelectronics (Shanghai) Inc. | Chrominance control unit and method for video images |
| JP2006238412A (ja) * | 2005-01-25 | 2006-09-07 | Sharp Corp | 輝度レベル変換装置、輝度レベル変換方法、固体撮像装置、輝度レベル変換プログラム、および記録媒体 |
| JP2009253636A (ja) * | 2008-04-04 | 2009-10-29 | Sony Corp | 画像処理装置と画像処理方法および撮像装置 |
| JP2010010754A (ja) * | 2008-06-24 | 2010-01-14 | Sanyo Electric Co Ltd | 表示装置 |
| US20190318460A1 (en) * | 2016-12-22 | 2019-10-17 | Huawei Technologies Co., Ltd. | Method and apparatus for generating high dynamic range image |
Family Cites Families (5)
| Publication number | Priority date | Publication date | Assignee | Title |
|---|---|---|---|---|
| US8355595B2 (en) * | 2007-05-15 | 2013-01-15 | Xerox Corporation | Contrast enhancement methods and apparatuses |
| JP2009180583A (ja) | 2008-01-30 | 2009-08-13 | Fujifilm Corp | ディスプレイの輝度ムラ評価方法および装置 |
| JP5950654B2 (ja) * | 2012-03-30 | 2016-07-13 | キヤノン株式会社 | 画像表示装置及びその制御方法 |
| JP6275174B2 (ja) * | 2015-03-10 | 2018-02-07 | キヤノン株式会社 | 画像処理方法、画像処理装置、および、撮像装置 |
| CN107393504B (zh) * | 2017-09-11 | 2020-02-14 | 青岛海信电器股份有限公司 | 基于rgbw面板的图像调节方法及装置 |
-
2022
- 2022-09-08 KR KR1020247015971A patent/KR20240074005A/ko active Pending
- 2022-09-08 JP JP2023563525A patent/JPWO2023095417A1/ja active Pending
- 2022-09-08 WO PCT/JP2022/033761 patent/WO2023095417A1/ja not_active Ceased
- 2022-09-08 CN CN202280077007.6A patent/CN118339607A/zh active Pending
Patent Citations (5)
| Publication number | Priority date | Publication date | Assignee | Title |
|---|---|---|---|---|
| US20050099546A1 (en) * | 2003-11-10 | 2005-05-12 | Huaya Microelectronics (Shanghai) Inc. | Chrominance control unit and method for video images |
| JP2006238412A (ja) * | 2005-01-25 | 2006-09-07 | Sharp Corp | 輝度レベル変換装置、輝度レベル変換方法、固体撮像装置、輝度レベル変換プログラム、および記録媒体 |
| JP2009253636A (ja) * | 2008-04-04 | 2009-10-29 | Sony Corp | 画像処理装置と画像処理方法および撮像装置 |
| JP2010010754A (ja) * | 2008-06-24 | 2010-01-14 | Sanyo Electric Co Ltd | 表示装置 |
| US20190318460A1 (en) * | 2016-12-22 | 2019-10-17 | Huawei Technologies Co., Ltd. | Method and apparatus for generating high dynamic range image |
Also Published As
| Publication number | Publication date |
|---|---|
| KR20240074005A (ko) | 2024-05-27 |
| CN118339607A (zh) | 2024-07-12 |
| JPWO2023095417A1 (ja) | 2023-06-01 |
Similar Documents
| Publication | Publication Date | Title |
|---|---|---|
| CN110274908B (zh) | 缺陷检查装置、缺陷检查方法以及计算机可读记录介质 | |
| CN110148130B (zh) | 用于检测零件缺陷的方法和装置 | |
| CN118644483B (zh) | 一种柔性电路板瑕疵检测方法及系统 | |
| JP6798619B2 (ja) | 情報処理装置、情報処理プログラム及び情報処理方法 | |
| WO2019117065A1 (ja) | データ生成装置、データ生成方法及びデータ生成プログラム | |
| CN117314826B (zh) | 一种显示屏的性能检测方法 | |
| CN115115644A (zh) | 一种基于人工智能的车辆焊接缺陷检测方法 | |
| CN113469921B (zh) | 图像缺陷修复方法、系统、计算机设备及存储介质 | |
| KR20210098997A (ko) | 자동화된 실시간 하이 다이나믹 레인지 콘텐츠 검토 시스템 | |
| CN119722664B (zh) | 一种基于虚拟现实技术的印刷线路板缺陷检测系统 | |
| Margraf et al. | An evolutionary learning approach to self-configuring image pipelines in the context of carbon fiber fault detection | |
| CN113870342A (zh) | 外观缺陷检测方法、智能终端以及存储装置 | |
| US11488342B1 (en) | Material map identification and augmentation | |
| CN117975175A (zh) | 一种基于机器视觉的塑料管道外观缺陷检测方法 | |
| CN110188693B (zh) | 改进的复杂环境车辆特征提取和停车判别方法 | |
| JP2001307087A (ja) | 循環的対話型画像分析のための手順、並びに、その手順を実行するためのコンピュータ・システム及びコンピュータ・プログラム | |
| US20130259373A1 (en) | Image processing device capable of determining types of images accurately | |
| WO2023095417A1 (ja) | 画像のコントラスト強調方法及び情報処理装置 | |
| WO2023095416A1 (ja) | 表示装置の検査方法及び情報処理装置 | |
| JP7302410B2 (ja) | 画像認識装置、画像認識システム、画像認識方法及びプログラム | |
| JP7336033B2 (ja) | データ増強基盤事物分析モデル学習装置及び方法 | |
| JPWO2019220608A1 (ja) | 情報処理装置、情報処理方法および情報処理プログラム | |
| CN116310276B (zh) | 目标检测方法、装置、电子设备及存储介质 | |
| CN118155203A (zh) | 一种多级过滤的生鲜食物分拣方法 | |
| Nurhadi et al. | Pattern Classification Sign Language Using Features Descriptors And Machine Learning |
Legal Events
| Date | Code | Title | Description |
|---|---|---|---|
| 121 | Ep: the epo has been informed by wipo that ep was designated in this application |
Ref document number: 22898202 Country of ref document: EP Kind code of ref document: A1 |
|
| WWE | Wipo information: entry into national phase |
Ref document number: 2023563525 Country of ref document: JP |
|
| ENP | Entry into the national phase |
Ref document number: 20247015971 Country of ref document: KR Kind code of ref document: A |
|
| WWE | Wipo information: entry into national phase |
Ref document number: 202280077007.6 Country of ref document: CN |
|
| NENP | Non-entry into the national phase |
Ref country code: DE |
|
| 122 | Ep: pct application non-entry in european phase |
Ref document number: 22898202 Country of ref document: EP Kind code of ref document: A1 |
|
| 122 | Ep: pct application non-entry in european phase |
Ref document number: 22898202 Country of ref document: EP Kind code of ref document: A1 |
|
| WWR | Wipo information: refused in national office |
Ref document number: 1020247015971 Country of ref document: KR |