WO2023004438A2 - Fret-based assays - Google Patents
Fret-based assays Download PDFInfo
- Publication number
- WO2023004438A2 WO2023004438A2 PCT/US2022/074087 US2022074087W WO2023004438A2 WO 2023004438 A2 WO2023004438 A2 WO 2023004438A2 US 2022074087 W US2022074087 W US 2022074087W WO 2023004438 A2 WO2023004438 A2 WO 2023004438A2
- Authority
- WO
- WIPO (PCT)
- Prior art keywords
- red
- protein
- fret
- compound
- moiety
- Prior art date
Links
- 238000003556 assay Methods 0.000 title description 126
- 150000001875 compounds Chemical class 0.000 claims abstract description 228
- 108090000623 proteins and genes Proteins 0.000 claims abstract description 169
- 102000004169 proteins and genes Human genes 0.000 claims abstract description 166
- 238000000034 method Methods 0.000 claims abstract description 114
- 235000018102 proteins Nutrition 0.000 claims description 160
- 102100026126 Proline-tRNA ligase Human genes 0.000 claims description 121
- 210000004027 cell Anatomy 0.000 claims description 109
- 108010042589 prolyl T RNA synthetase Proteins 0.000 claims description 109
- 239000003446 ligand Substances 0.000 claims description 96
- 239000003112 inhibitor Substances 0.000 claims description 84
- 150000003839 salts Chemical class 0.000 claims description 84
- 230000027455 binding Effects 0.000 claims description 81
- 239000000203 mixture Substances 0.000 claims description 64
- 229960002429 proline Drugs 0.000 claims description 63
- 239000000523 sample Substances 0.000 claims description 60
- ONIBWKKTOPOVIA-UHFFFAOYSA-N Proline Natural products OC(=O)C1CCCN1 ONIBWKKTOPOVIA-UHFFFAOYSA-N 0.000 claims description 59
- ONIBWKKTOPOVIA-BYPYZUCNSA-N L-Proline Chemical compound OC(=O)[C@@H]1CCCN1 ONIBWKKTOPOVIA-BYPYZUCNSA-N 0.000 claims description 57
- 208000037265 diseases, disorders, signs and symptoms Diseases 0.000 claims description 52
- 229910052760 oxygen Inorganic materials 0.000 claims description 48
- 238000012360 testing method Methods 0.000 claims description 46
- 229910052799 carbon Inorganic materials 0.000 claims description 40
- 229910052717 sulfur Inorganic materials 0.000 claims description 33
- 208000035475 disorder Diseases 0.000 claims description 27
- 229940024606 amino acid Drugs 0.000 claims description 25
- 235000001014 amino acid Nutrition 0.000 claims description 25
- 102000004190 Enzymes Human genes 0.000 claims description 24
- 108090000790 Enzymes Proteins 0.000 claims description 24
- 150000001413 amino acids Chemical group 0.000 claims description 22
- 125000003161 (C1-C6) alkylene group Chemical group 0.000 claims description 21
- GNBHRKFJIUUOQI-UHFFFAOYSA-N fluorescein Chemical group O1C(=O)C2=CC=CC=C2C21C1=CC=C(O)C=C1OC1=CC(O)=CC=C21 GNBHRKFJIUUOQI-UHFFFAOYSA-N 0.000 claims description 21
- WEJVZSAYICGDCK-UHFFFAOYSA-N Alexa Fluor 430 Chemical compound CC[NH+](CC)CC.CC1(C)C=C(CS([O-])(=O)=O)C2=CC=3C(C(F)(F)F)=CC(=O)OC=3C=C2N1CCCCCC(=O)ON1C(=O)CCC1=O WEJVZSAYICGDCK-UHFFFAOYSA-N 0.000 claims description 18
- WHVNXSBKJGAXKU-UHFFFAOYSA-N Alexa Fluor 532 Chemical compound [H+].[H+].CC1(C)C(C)NC(C(=C2OC3=C(C=4C(C(C(C)N=4)(C)C)=CC3=3)S([O-])(=O)=O)S([O-])(=O)=O)=C1C=C2C=3C(C=C1)=CC=C1C(=O)ON1C(=O)CCC1=O WHVNXSBKJGAXKU-UHFFFAOYSA-N 0.000 claims description 18
- ZAINTDRBUHCDPZ-UHFFFAOYSA-M Alexa Fluor 546 Chemical compound [H+].[Na+].CC1CC(C)(C)NC(C(=C2OC3=C(C4=NC(C)(C)CC(C)C4=CC3=3)S([O-])(=O)=O)S([O-])(=O)=O)=C1C=C2C=3C(C(=C(Cl)C=1Cl)C(O)=O)=C(Cl)C=1SCC(=O)NCCCCCC(=O)ON1C(=O)CCC1=O ZAINTDRBUHCDPZ-UHFFFAOYSA-M 0.000 claims description 18
- IGAZHQIYONOHQN-UHFFFAOYSA-N Alexa Fluor 555 Chemical compound C=12C=CC(=N)C(S(O)(=O)=O)=C2OC2=C(S(O)(=O)=O)C(N)=CC=C2C=1C1=CC=C(C(O)=O)C=C1C(O)=O IGAZHQIYONOHQN-UHFFFAOYSA-N 0.000 claims description 18
- MJKVTPMWOKAVMS-UHFFFAOYSA-N 3-hydroxy-1-benzopyran-2-one Chemical compound C1=CC=C2OC(=O)C(O)=CC2=C1 MJKVTPMWOKAVMS-UHFFFAOYSA-N 0.000 claims description 16
- 239000012112 Alexa Fluor 633 Substances 0.000 claims description 16
- 238000000799 fluorescence microscopy Methods 0.000 claims description 16
- 238000012546 transfer Methods 0.000 claims description 15
- 238000013537 high throughput screening Methods 0.000 claims description 14
- HQCYVSPJIOJEGA-UHFFFAOYSA-N methoxycoumarin Chemical compound C1=CC=C2OC(=O)C(OC)=CC2=C1 HQCYVSPJIOJEGA-UHFFFAOYSA-N 0.000 claims description 14
- MHMNJMPURVTYEJ-UHFFFAOYSA-N fluorescein-5-isothiocyanate Chemical compound O1C(=O)C2=CC(N=C=S)=CC=C2C21C1=CC=C(O)C=C1OC1=CC(O)=CC=C21 MHMNJMPURVTYEJ-UHFFFAOYSA-N 0.000 claims description 13
- 238000002866 fluorescence resonance energy transfer Methods 0.000 claims description 13
- 206010028980 Neoplasm Diseases 0.000 claims description 12
- 125000002947 alkylene group Chemical group 0.000 claims description 12
- 239000008194 pharmaceutical composition Substances 0.000 claims description 12
- 125000004169 (C1-C6) alkyl group Chemical group 0.000 claims description 11
- 201000011510 cancer Diseases 0.000 claims description 11
- 230000002401 inhibitory effect Effects 0.000 claims description 11
- 230000003993 interaction Effects 0.000 claims description 11
- 239000012099 Alexa Fluor family Substances 0.000 claims description 10
- 239000012103 Alexa Fluor 488 Substances 0.000 claims description 9
- 239000012110 Alexa Fluor 594 Substances 0.000 claims description 9
- 102000052866 Amino Acyl-tRNA Synthetases Human genes 0.000 claims description 9
- 108700028939 Amino Acyl-tRNA Synthetases Proteins 0.000 claims description 9
- 230000007423 decrease Effects 0.000 claims description 9
- XLXOKMFKGASILN-UHFFFAOYSA-N rhodamine red-X Chemical compound C=12C=CC(=[N+](CC)CC)C=C2OC2=CC(N(CC)CC)=CC=C2C=1C1=CC=C(S(=O)(=O)NCCCCCC(O)=O)C=C1S([O-])(=O)=O XLXOKMFKGASILN-UHFFFAOYSA-N 0.000 claims description 9
- MPLHNVLQVRSVEE-UHFFFAOYSA-N texas red Chemical compound [O-]S(=O)(=O)C1=CC(S(Cl)(=O)=O)=CC=C1C(C1=CC=2CCCN3CCCC(C=23)=C1O1)=C2C1=C(CCC1)C3=[N+]1CCCC3=C2 MPLHNVLQVRSVEE-UHFFFAOYSA-N 0.000 claims description 9
- QWZHDKGQKYEBKK-UHFFFAOYSA-N 3-aminochromen-2-one Chemical compound C1=CC=C2OC(=O)C(N)=CC2=C1 QWZHDKGQKYEBKK-UHFFFAOYSA-N 0.000 claims description 8
- 239000012109 Alexa Fluor 568 Substances 0.000 claims description 8
- 239000012116 Alexa Fluor 680 Substances 0.000 claims description 8
- DHMQDGOQFOQNFH-UHFFFAOYSA-N Glycine Chemical compound NCC(O)=O DHMQDGOQFOQNFH-UHFFFAOYSA-N 0.000 claims description 8
- 239000003937 drug carrier Substances 0.000 claims description 8
- 125000006583 (C1-C3) haloalkyl group Chemical group 0.000 claims description 7
- 239000012115 Alexa Fluor 660 Substances 0.000 claims description 7
- 230000003247 decreasing effect Effects 0.000 claims description 7
- 108010092115 glutamyl-prolyl-tRNA synthetase Proteins 0.000 claims description 7
- JGVWCANSWKRBCS-UHFFFAOYSA-N tetramethylrhodamine thiocyanate Chemical compound [Cl-].C=12C=CC(N(C)C)=CC2=[O+]C2=CC(N(C)C)=CC=C2C=1C1=CC=C(SC#N)C=C1C(O)=O JGVWCANSWKRBCS-UHFFFAOYSA-N 0.000 claims description 7
- 125000006273 (C1-C3) alkyl group Chemical group 0.000 claims description 6
- 208000023275 Autoimmune disease Diseases 0.000 claims description 6
- WHUUTDBJXJRKMK-VKHMYHEASA-N L-glutamic acid Chemical compound OC(=O)[C@@H](N)CCC(O)=O WHUUTDBJXJRKMK-VKHMYHEASA-N 0.000 claims description 6
- KDXKERNSBIXSRK-YFKPBYRVSA-N L-lysine Chemical compound NCCCC[C@H](N)C(O)=O KDXKERNSBIXSRK-YFKPBYRVSA-N 0.000 claims description 6
- COLNVLDHVKWLRT-QMMMGPOBSA-N L-phenylalanine Chemical compound OC(=O)[C@@H](N)CC1=CC=CC=C1 COLNVLDHVKWLRT-QMMMGPOBSA-N 0.000 claims description 6
- KDXKERNSBIXSRK-UHFFFAOYSA-N Lysine Natural products NCCCCC(N)C(O)=O KDXKERNSBIXSRK-UHFFFAOYSA-N 0.000 claims description 6
- 239000004472 Lysine Substances 0.000 claims description 6
- 208000030852 Parasitic disease Diseases 0.000 claims description 6
- COLNVLDHVKWLRT-UHFFFAOYSA-N phenylalanine Natural products OC(=O)C(N)CC1=CC=CC=C1 COLNVLDHVKWLRT-UHFFFAOYSA-N 0.000 claims description 6
- 229960005190 phenylalanine Drugs 0.000 claims description 6
- WHUUTDBJXJRKMK-UHFFFAOYSA-N Glutamic acid Natural products OC(=O)C(N)CCC(O)=O WHUUTDBJXJRKMK-UHFFFAOYSA-N 0.000 claims description 5
- AGPKZVBTJJNPAG-WHFBIAKZSA-N L-isoleucine Chemical compound CC[C@H](C)[C@H](N)C(O)=O AGPKZVBTJJNPAG-WHFBIAKZSA-N 0.000 claims description 5
- 108010004469 allophycocyanin Proteins 0.000 claims description 5
- 235000013922 glutamic acid Nutrition 0.000 claims description 5
- 239000004220 glutamic acid Substances 0.000 claims description 5
- 229960000310 isoleucine Drugs 0.000 claims description 5
- AGPKZVBTJJNPAG-UHFFFAOYSA-N isoleucine Natural products CCC(C)C(N)C(O)=O AGPKZVBTJJNPAG-UHFFFAOYSA-N 0.000 claims description 5
- 238000000386 microscopy Methods 0.000 claims description 5
- 239000004475 Arginine Substances 0.000 claims description 4
- 239000004471 Glycine Substances 0.000 claims description 4
- ODKSFYDXXFIFQN-BYPYZUCNSA-P L-argininium(2+) Chemical compound NC(=[NH2+])NCCC[C@H]([NH3+])C(O)=O ODKSFYDXXFIFQN-BYPYZUCNSA-P 0.000 claims description 4
- ZDXPYRJPNDTMRX-VKHMYHEASA-N L-glutamine Chemical compound OC(=O)[C@@H](N)CCC(N)=O ZDXPYRJPNDTMRX-VKHMYHEASA-N 0.000 claims description 4
- HNDVDQJCIGZPNO-YFKPBYRVSA-N L-histidine Chemical compound OC(=O)[C@@H](N)CC1=CN=CN1 HNDVDQJCIGZPNO-YFKPBYRVSA-N 0.000 claims description 4
- 102000007399 Nuclear hormone receptor Human genes 0.000 claims description 4
- 108020005497 Nuclear hormone receptor Proteins 0.000 claims description 4
- 208000036142 Viral infection Diseases 0.000 claims description 4
- 239000012190 activator Substances 0.000 claims description 4
- ODKSFYDXXFIFQN-UHFFFAOYSA-N arginine Natural products OC(=O)C(N)CCCNC(N)=N ODKSFYDXXFIFQN-UHFFFAOYSA-N 0.000 claims description 4
- 235000009697 arginine Nutrition 0.000 claims description 4
- 239000002537 cosmetic Substances 0.000 claims description 4
- HNDVDQJCIGZPNO-UHFFFAOYSA-N histidine Natural products OC(=O)C(N)CC1=CN=CN1 HNDVDQJCIGZPNO-UHFFFAOYSA-N 0.000 claims description 4
- 230000009385 viral infection Effects 0.000 claims description 4
- MTCFGRXMJLQNBG-REOHCLBHSA-N (2S)-2-Amino-3-hydroxypropansäure Chemical compound OC[C@H](N)C(O)=O MTCFGRXMJLQNBG-REOHCLBHSA-N 0.000 claims description 3
- DCXYFEDJOCDNAF-UHFFFAOYSA-N Asparagine Natural products OC(=O)C(N)CC(N)=O DCXYFEDJOCDNAF-UHFFFAOYSA-N 0.000 claims description 3
- 108090000045 G-Protein-Coupled Receptors Proteins 0.000 claims description 3
- 102000003688 G-Protein-Coupled Receptors Human genes 0.000 claims description 3
- 208000026350 Inborn Genetic disease Diseases 0.000 claims description 3
- XUJNEKJLAYXESH-REOHCLBHSA-N L-Cysteine Chemical compound SC[C@H](N)C(O)=O XUJNEKJLAYXESH-REOHCLBHSA-N 0.000 claims description 3
- QNAYBMKLOCPYGJ-REOHCLBHSA-N L-alanine Chemical compound C[C@H](N)C(O)=O QNAYBMKLOCPYGJ-REOHCLBHSA-N 0.000 claims description 3
- DCXYFEDJOCDNAF-REOHCLBHSA-N L-asparagine Chemical compound OC(=O)[C@@H](N)CC(N)=O DCXYFEDJOCDNAF-REOHCLBHSA-N 0.000 claims description 3
- CKLJMWTZIZZHCS-REOHCLBHSA-N L-aspartic acid Chemical compound OC(=O)[C@@H](N)CC(O)=O CKLJMWTZIZZHCS-REOHCLBHSA-N 0.000 claims description 3
- ROHFNLRQFUQHCH-YFKPBYRVSA-N L-leucine Chemical compound CC(C)C[C@H](N)C(O)=O ROHFNLRQFUQHCH-YFKPBYRVSA-N 0.000 claims description 3
- FFEARJCKVFRZRR-BYPYZUCNSA-N L-methionine Chemical compound CSCC[C@H](N)C(O)=O FFEARJCKVFRZRR-BYPYZUCNSA-N 0.000 claims description 3
- AYFVYJQAPQTCCC-GBXIJSLDSA-N L-threonine Chemical compound C[C@@H](O)[C@H](N)C(O)=O AYFVYJQAPQTCCC-GBXIJSLDSA-N 0.000 claims description 3
- QIVBCDIJIAJPQS-VIFPVBQESA-N L-tryptophane Chemical compound C1=CC=C2C(C[C@H](N)C(O)=O)=CNC2=C1 QIVBCDIJIAJPQS-VIFPVBQESA-N 0.000 claims description 3
- OUYCCCASQSFEME-QMMMGPOBSA-N L-tyrosine Chemical compound OC(=O)[C@@H](N)CC1=CC=C(O)C=C1 OUYCCCASQSFEME-QMMMGPOBSA-N 0.000 claims description 3
- KZSNJWFQEVHDMF-BYPYZUCNSA-N L-valine Chemical compound CC(C)[C@H](N)C(O)=O KZSNJWFQEVHDMF-BYPYZUCNSA-N 0.000 claims description 3
- ROHFNLRQFUQHCH-UHFFFAOYSA-N Leucine Natural products CC(C)CC(N)C(O)=O ROHFNLRQFUQHCH-UHFFFAOYSA-N 0.000 claims description 3
- MTCFGRXMJLQNBG-UHFFFAOYSA-N Serine Natural products OCC(N)C(O)=O MTCFGRXMJLQNBG-UHFFFAOYSA-N 0.000 claims description 3
- AYFVYJQAPQTCCC-UHFFFAOYSA-N Threonine Natural products CC(O)C(N)C(O)=O AYFVYJQAPQTCCC-UHFFFAOYSA-N 0.000 claims description 3
- 239000004473 Threonine Substances 0.000 claims description 3
- 102000040945 Transcription factor Human genes 0.000 claims description 3
- 108091023040 Transcription factor Proteins 0.000 claims description 3
- QIVBCDIJIAJPQS-UHFFFAOYSA-N Tryptophan Natural products C1=CC=C2C(CC(N)C(O)=O)=CNC2=C1 QIVBCDIJIAJPQS-UHFFFAOYSA-N 0.000 claims description 3
- KZSNJWFQEVHDMF-UHFFFAOYSA-N Valine Natural products CC(C)C(N)C(O)=O KZSNJWFQEVHDMF-UHFFFAOYSA-N 0.000 claims description 3
- 235000004279 alanine Nutrition 0.000 claims description 3
- 229960001230 asparagine Drugs 0.000 claims description 3
- 235000009582 asparagine Nutrition 0.000 claims description 3
- 235000003704 aspartic acid Nutrition 0.000 claims description 3
- OQFSQFPPLPISGP-UHFFFAOYSA-N beta-carboxyaspartic acid Natural products OC(=O)C(N)C(C(O)=O)C(O)=O OQFSQFPPLPISGP-UHFFFAOYSA-N 0.000 claims description 3
- 235000018417 cysteine Nutrition 0.000 claims description 3
- XUJNEKJLAYXESH-UHFFFAOYSA-N cysteine Natural products SCC(N)C(O)=O XUJNEKJLAYXESH-UHFFFAOYSA-N 0.000 claims description 3
- 238000012632 fluorescent imaging Methods 0.000 claims description 3
- 208000016361 genetic disease Diseases 0.000 claims description 3
- ZDXPYRJPNDTMRX-UHFFFAOYSA-N glutamine Natural products OC(=O)C(N)CCC(N)=O ZDXPYRJPNDTMRX-UHFFFAOYSA-N 0.000 claims description 3
- 235000004554 glutamine Nutrition 0.000 claims description 3
- 208000027866 inflammatory disease Diseases 0.000 claims description 3
- 208000030159 metabolic disease Diseases 0.000 claims description 3
- 229930182817 methionine Natural products 0.000 claims description 3
- 238000004611 spectroscopical analysis Methods 0.000 claims description 3
- OUYCCCASQSFEME-UHFFFAOYSA-N tyrosine Natural products OC(=O)C(N)CC1=CC=C(O)C=C1 OUYCCCASQSFEME-UHFFFAOYSA-N 0.000 claims description 3
- 239000004474 valine Substances 0.000 claims description 3
- 208000035143 Bacterial infection Diseases 0.000 claims description 2
- 208000024172 Cardiovascular disease Diseases 0.000 claims description 2
- 108010078791 Carrier Proteins Proteins 0.000 claims description 2
- 108010001857 Cell Surface Receptors Proteins 0.000 claims description 2
- 206010017533 Fungal infection Diseases 0.000 claims description 2
- 102000004310 Ion Channels Human genes 0.000 claims description 2
- 108010006519 Molecular Chaperones Proteins 0.000 claims description 2
- 208000031888 Mycoses Diseases 0.000 claims description 2
- 208000012902 Nervous system disease Diseases 0.000 claims description 2
- 101710184528 Scaffolding protein Proteins 0.000 claims description 2
- 101710172711 Structural protein Proteins 0.000 claims description 2
- 208000022362 bacterial infectious disease Diseases 0.000 claims description 2
- 125000001188 haloalkyl group Chemical group 0.000 claims description 2
- 239000003550 marker Substances 0.000 claims description 2
- 108020004017 nuclear receptors Proteins 0.000 claims description 2
- 125000006239 protecting group Chemical group 0.000 claims description 2
- 230000004845 protein aggregation Effects 0.000 claims description 2
- 229920000180 alkyd Polymers 0.000 claims 1
- 102000006240 membrane receptors Human genes 0.000 claims 1
- 239000000700 radioactive tracer Substances 0.000 abstract description 77
- 238000002877 time resolved fluorescence resonance energy transfer Methods 0.000 abstract description 33
- IAZDPXIOMUYVGZ-UHFFFAOYSA-N Dimethylsulphoxide Chemical compound CS(C)=O IAZDPXIOMUYVGZ-UHFFFAOYSA-N 0.000 description 207
- 238000001327 Förster resonance energy transfer Methods 0.000 description 156
- 239000000370 acceptor Substances 0.000 description 102
- OKKJLVBELUTLKV-UHFFFAOYSA-N Methanol Chemical compound OC OKKJLVBELUTLKV-UHFFFAOYSA-N 0.000 description 90
- 235000002639 sodium chloride Nutrition 0.000 description 89
- XLYOFNOQVPJJNP-UHFFFAOYSA-N water Chemical compound O XLYOFNOQVPJJNP-UHFFFAOYSA-N 0.000 description 68
- 125000001475 halogen functional group Chemical group 0.000 description 67
- 229910001868 water Inorganic materials 0.000 description 66
- 239000007787 solid Substances 0.000 description 63
- -1 tRNAPro) Chemical compound 0.000 description 62
- BDAGIHXWWSANSR-UHFFFAOYSA-N methanoic acid Natural products OC=O BDAGIHXWWSANSR-UHFFFAOYSA-N 0.000 description 51
- 244000045947 parasite Species 0.000 description 51
- 238000004895 liquid chromatography mass spectrometry Methods 0.000 description 49
- WEVYAHXRMPXWCK-UHFFFAOYSA-N Acetonitrile Chemical compound CC#N WEVYAHXRMPXWCK-UHFFFAOYSA-N 0.000 description 47
- 241000223960 Plasmodium falciparum Species 0.000 description 47
- 238000001644 13C nuclear magnetic resonance spectroscopy Methods 0.000 description 41
- 238000002372 labelling Methods 0.000 description 41
- 239000000243 solution Substances 0.000 description 41
- 231100000673 dose–response relationship Toxicity 0.000 description 39
- 238000003818 flash chromatography Methods 0.000 description 39
- 238000005160 1H NMR spectroscopy Methods 0.000 description 38
- 102100029895 Bromodomain-containing protein 4 Human genes 0.000 description 38
- 101710126815 Bromodomain-containing protein 4 Proteins 0.000 description 38
- PEDCQBHIVMGVHV-UHFFFAOYSA-N Glycerine Chemical compound OCC(O)CO PEDCQBHIVMGVHV-UHFFFAOYSA-N 0.000 description 38
- LVASCWIMLIKXLA-CABCVRRESA-N 7-bromo-6-chloro-3-[3-[(2r,3s)-3-hydroxypiperidin-2-yl]-2-oxopropyl]quinazolin-4-one Chemical compound O[C@H]1CCCN[C@@H]1CC(=O)CN1C(=O)C2=CC(Cl)=C(Br)C=C2N=C1 LVASCWIMLIKXLA-CABCVRRESA-N 0.000 description 36
- 239000000758 substrate Substances 0.000 description 33
- 230000000694 effects Effects 0.000 description 31
- JGFZNNIVVJXRND-UHFFFAOYSA-N N,N-Diisopropylethylamine (DIPEA) Chemical compound CCN(C(C)C)C(C)C JGFZNNIVVJXRND-UHFFFAOYSA-N 0.000 description 30
- 239000003814 drug Substances 0.000 description 29
- 229950010152 halofuginone Drugs 0.000 description 29
- HEDRZPFGACZZDS-MICDWDOJSA-N Trichloro(2H)methane Chemical compound [2H]C(Cl)(Cl)Cl HEDRZPFGACZZDS-MICDWDOJSA-N 0.000 description 28
- FAPWRFPIFSIZLT-UHFFFAOYSA-M Sodium chloride Chemical compound [Na+].[Cl-] FAPWRFPIFSIZLT-UHFFFAOYSA-M 0.000 description 26
- 238000002474 experimental method Methods 0.000 description 26
- RAXXELZNTBOGNW-UHFFFAOYSA-N 1H-imidazole Chemical compound C1=CNC=N1 RAXXELZNTBOGNW-UHFFFAOYSA-N 0.000 description 25
- OSWFIVFLDKOXQC-UHFFFAOYSA-N 4-(3-methoxyphenyl)aniline Chemical compound COC1=CC=CC(C=2C=CC(N)=CC=2)=C1 OSWFIVFLDKOXQC-UHFFFAOYSA-N 0.000 description 25
- 201000010099 disease Diseases 0.000 description 25
- 235000019253 formic acid Nutrition 0.000 description 25
- 229940013688 formic acid Drugs 0.000 description 25
- 238000004448 titration Methods 0.000 description 25
- 238000011282 treatment Methods 0.000 description 25
- 239000013078 crystal Substances 0.000 description 24
- 150000003384 small molecules Chemical class 0.000 description 24
- YMWUJEATGCHHMB-UHFFFAOYSA-N Dichloromethane Chemical compound ClCCl YMWUJEATGCHHMB-UHFFFAOYSA-N 0.000 description 23
- 229940088598 enzyme Drugs 0.000 description 23
- 230000005284 excitation Effects 0.000 description 23
- 238000011002 quantification Methods 0.000 description 23
- 230000002441 reversible effect Effects 0.000 description 23
- 125000000217 alkyl group Chemical group 0.000 description 22
- 238000006243 chemical reaction Methods 0.000 description 22
- 238000011161 development Methods 0.000 description 22
- QTBSBXVTEAMEQO-UHFFFAOYSA-N Acetic acid Chemical compound CC(O)=O QTBSBXVTEAMEQO-UHFFFAOYSA-N 0.000 description 21
- 125000004432 carbon atom Chemical group C* 0.000 description 20
- 239000013592 cell lysate Substances 0.000 description 20
- 238000010494 dissociation reaction Methods 0.000 description 20
- 230000005593 dissociations Effects 0.000 description 20
- 125000005647 linker group Chemical group 0.000 description 20
- 238000005259 measurement Methods 0.000 description 20
- 239000000126 substance Substances 0.000 description 20
- 238000006073 displacement reaction Methods 0.000 description 19
- IJGRMHOSHXDMSA-UHFFFAOYSA-N Atomic nitrogen Chemical compound N#N IJGRMHOSHXDMSA-UHFFFAOYSA-N 0.000 description 18
- KDLHZDBZIXYQEI-UHFFFAOYSA-N Palladium Chemical compound [Pd] KDLHZDBZIXYQEI-UHFFFAOYSA-N 0.000 description 18
- 210000004369 blood Anatomy 0.000 description 18
- 239000008280 blood Substances 0.000 description 18
- 239000006166 lysate Substances 0.000 description 18
- 102000003964 Histone deacetylase Human genes 0.000 description 17
- 108090000353 Histone deacetylase Proteins 0.000 description 17
- 238000012512 characterization method Methods 0.000 description 17
- 239000003153 chemical reaction reagent Substances 0.000 description 17
- 229940079593 drug Drugs 0.000 description 17
- 201000004792 malaria Diseases 0.000 description 17
- IPEHBUMCGVEMRF-UHFFFAOYSA-N pyrazinecarboxamide Chemical compound NC(=O)C1=CN=CC=N1 IPEHBUMCGVEMRF-UHFFFAOYSA-N 0.000 description 17
- 230000005764 inhibitory process Effects 0.000 description 16
- 239000011780 sodium chloride Substances 0.000 description 16
- 230000014509 gene expression Effects 0.000 description 15
- XEKOWRVHYACXOJ-UHFFFAOYSA-N Ethyl acetate Chemical compound CCOC(C)=O XEKOWRVHYACXOJ-UHFFFAOYSA-N 0.000 description 14
- 108010029485 Protein Isoforms Proteins 0.000 description 14
- 102000001708 Protein Isoforms Human genes 0.000 description 14
- 239000000872 buffer Substances 0.000 description 14
- 238000001514 detection method Methods 0.000 description 14
- 239000007788 liquid Substances 0.000 description 14
- 125000002496 methyl group Chemical group [H]C([H])([H])* 0.000 description 14
- 238000013459 approach Methods 0.000 description 13
- 235000011187 glycerol Nutrition 0.000 description 13
- 125000001072 heteroaryl group Chemical group 0.000 description 13
- 238000000338 in vitro Methods 0.000 description 13
- 238000002360 preparation method Methods 0.000 description 13
- 125000000999 tert-butyl group Chemical group [H]C([H])([H])C(*)(C([H])([H])[H])C([H])([H])[H] 0.000 description 13
- XKRFYHLGVUSROY-UHFFFAOYSA-N Argon Chemical compound [Ar] XKRFYHLGVUSROY-UHFFFAOYSA-N 0.000 description 12
- LFQSCWFLJHTTHZ-UHFFFAOYSA-N Ethanol Chemical compound CCO LFQSCWFLJHTTHZ-UHFFFAOYSA-N 0.000 description 12
- 238000004458 analytical method Methods 0.000 description 12
- 230000000875 corresponding effect Effects 0.000 description 12
- 230000004927 fusion Effects 0.000 description 12
- 230000012010 growth Effects 0.000 description 12
- 238000011534 incubation Methods 0.000 description 12
- 238000000746 purification Methods 0.000 description 12
- 230000035945 sensitivity Effects 0.000 description 12
- 239000002253 acid Substances 0.000 description 11
- 238000007792 addition Methods 0.000 description 11
- 102000037865 fusion proteins Human genes 0.000 description 11
- 108020001507 fusion proteins Proteins 0.000 description 11
- 239000013642 negative control Substances 0.000 description 11
- 230000003389 potentiating effect Effects 0.000 description 11
- JKMHFZQWWAIEOD-UHFFFAOYSA-N 2-[4-(2-hydroxyethyl)piperazin-1-yl]ethanesulfonic acid Chemical compound OCC[NH+]1CCN(CCS([O-])(=O)=O)CC1 JKMHFZQWWAIEOD-UHFFFAOYSA-N 0.000 description 10
- 239000007995 HEPES buffer Substances 0.000 description 10
- TWRXJAOTZQYOKJ-UHFFFAOYSA-L Magnesium chloride Chemical compound [Mg+2].[Cl-].[Cl-] TWRXJAOTZQYOKJ-UHFFFAOYSA-L 0.000 description 10
- 241000283973 Oryctolagus cuniculus Species 0.000 description 10
- 230000015556 catabolic process Effects 0.000 description 10
- 230000001413 cellular effect Effects 0.000 description 10
- 238000006731 degradation reaction Methods 0.000 description 10
- VHJLVAABSRFDPM-QWWZWVQMSA-N dithiothreitol Chemical compound SC[C@@H](O)[C@H](O)CS VHJLVAABSRFDPM-QWWZWVQMSA-N 0.000 description 10
- 238000004020 luminiscence type Methods 0.000 description 10
- 230000003071 parasitic effect Effects 0.000 description 10
- 125000002924 primary amino group Chemical group [H]N([H])* 0.000 description 10
- 238000011865 proteolysis targeting chimera technique Methods 0.000 description 10
- 229940124823 proteolysis targeting chimeric molecule Drugs 0.000 description 10
- 239000011541 reaction mixture Substances 0.000 description 10
- 108010026668 snake venom protein C activator Proteins 0.000 description 10
- 229940124597 therapeutic agent Drugs 0.000 description 10
- 239000007983 Tris buffer Substances 0.000 description 9
- 230000001086 cytosolic effect Effects 0.000 description 9
- 238000005516 engineering process Methods 0.000 description 9
- 125000005843 halogen group Chemical group 0.000 description 9
- 239000003276 histone deacetylase inhibitor Substances 0.000 description 9
- 229910052757 nitrogen Inorganic materials 0.000 description 9
- 239000003921 oil Substances 0.000 description 9
- 235000019198 oils Nutrition 0.000 description 9
- 230000036515 potency Effects 0.000 description 9
- 238000012216 screening Methods 0.000 description 9
- 239000000725 suspension Substances 0.000 description 9
- 239000012131 assay buffer Substances 0.000 description 8
- 238000010256 biochemical assay Methods 0.000 description 8
- 230000002860 competitive effect Effects 0.000 description 8
- JGQPZPLJOBHHBK-UFXYQILXSA-N dBET6 Chemical compound Cc1sc-2c(c1C)C(=N[C@@H](CC(=O)NCCCCCCCCNC(=O)COc1cccc3C(=O)N(C4CCC(=O)NC4=O)C(=O)c13)c1nnc(C)n-21)c1ccc(Cl)cc1 JGQPZPLJOBHHBK-UFXYQILXSA-N 0.000 description 8
- 238000012417 linear regression Methods 0.000 description 8
- 239000000463 material Substances 0.000 description 8
- 238000003752 polymerase chain reaction Methods 0.000 description 8
- 229920006395 saturated elastomer Polymers 0.000 description 8
- DTQVDTLACAAQTR-UHFFFAOYSA-N trifluoroacetic acid Substances OC(=O)C(F)(F)F DTQVDTLACAAQTR-UHFFFAOYSA-N 0.000 description 8
- LENZDBCJOHFCAS-UHFFFAOYSA-N tris Chemical compound OCC(N)(CO)CO LENZDBCJOHFCAS-UHFFFAOYSA-N 0.000 description 8
- 238000010200 validation analysis Methods 0.000 description 8
- 241000588724 Escherichia coli Species 0.000 description 7
- 238000005481 NMR spectroscopy Methods 0.000 description 7
- 239000007832 Na2SO4 Substances 0.000 description 7
- 241000224016 Plasmodium Species 0.000 description 7
- PMZURENOXWZQFD-UHFFFAOYSA-L Sodium Sulfate Chemical compound [Na+].[Na+].[O-]S([O-])(=O)=O PMZURENOXWZQFD-UHFFFAOYSA-L 0.000 description 7
- YXFVVABEGXRONW-UHFFFAOYSA-N Toluene Chemical compound CC1=CC=CC=C1 YXFVVABEGXRONW-UHFFFAOYSA-N 0.000 description 7
- ZMANZCXQSJIPKH-UHFFFAOYSA-N Triethylamine Chemical compound CCN(CC)CC ZMANZCXQSJIPKH-UHFFFAOYSA-N 0.000 description 7
- 239000003430 antimalarial agent Substances 0.000 description 7
- 230000001580 bacterial effect Effects 0.000 description 7
- 239000003795 chemical substances by application Substances 0.000 description 7
- 150000002148 esters Chemical class 0.000 description 7
- 125000001301 ethoxy group Chemical group [H]C([H])([H])C([H])([H])O* 0.000 description 7
- 235000019439 ethyl acetate Nutrition 0.000 description 7
- 125000001495 ethyl group Chemical group [H]C([H])([H])C([H])([H])* 0.000 description 7
- 238000009472 formulation Methods 0.000 description 7
- 239000000499 gel Substances 0.000 description 7
- 125000004051 hexyl group Chemical group [H]C([H])([H])C([H])([H])C([H])([H])C([H])([H])C([H])([H])C([H])([H])* 0.000 description 7
- 239000012139 lysis buffer Substances 0.000 description 7
- OKKJLVBELUTLKV-VMNATFBRSA-N methanol-d1 Chemical compound [2H]OC OKKJLVBELUTLKV-VMNATFBRSA-N 0.000 description 7
- 239000001301 oxygen Substances 0.000 description 7
- 230000007170 pathology Effects 0.000 description 7
- 239000000546 pharmaceutical excipient Substances 0.000 description 7
- 229920001223 polyethylene glycol Polymers 0.000 description 7
- 238000002415 sodium dodecyl sulfate polyacrylamide gel electrophoresis Methods 0.000 description 7
- 229910052938 sodium sulfate Inorganic materials 0.000 description 7
- 125000001424 substituent group Chemical group 0.000 description 7
- 238000003786 synthesis reaction Methods 0.000 description 7
- 239000003981 vehicle Substances 0.000 description 7
- 101150067361 Aars1 gene Proteins 0.000 description 6
- CSCPPACGZOOCGX-UHFFFAOYSA-N Acetone Chemical compound CC(C)=O CSCPPACGZOOCGX-UHFFFAOYSA-N 0.000 description 6
- 108020004414 DNA Proteins 0.000 description 6
- ISWSIDIOOBJBQZ-UHFFFAOYSA-N Phenol Chemical compound OC1=CC=CC=C1 ISWSIDIOOBJBQZ-UHFFFAOYSA-N 0.000 description 6
- 229920001213 Polysorbate 20 Polymers 0.000 description 6
- HEMHJVSKTPXQMS-UHFFFAOYSA-M Sodium hydroxide Chemical compound [OH-].[Na+] HEMHJVSKTPXQMS-UHFFFAOYSA-M 0.000 description 6
- 150000001217 Terbium Chemical class 0.000 description 6
- 230000009471 action Effects 0.000 description 6
- OIRDTQYFTABQOQ-KQYNXXCUSA-N adenosine group Chemical group [C@@H]1([C@H](O)[C@H](O)[C@@H](CO)O1)N1C=NC=2C(N)=NC=NC12 OIRDTQYFTABQOQ-KQYNXXCUSA-N 0.000 description 6
- 229940033495 antimalarials Drugs 0.000 description 6
- 229910052786 argon Inorganic materials 0.000 description 6
- 230000008901 benefit Effects 0.000 description 6
- 210000004899 c-terminal region Anatomy 0.000 description 6
- 238000005119 centrifugation Methods 0.000 description 6
- 239000001064 degrader Substances 0.000 description 6
- 238000010790 dilution Methods 0.000 description 6
- 239000012895 dilution Substances 0.000 description 6
- 230000006870 function Effects 0.000 description 6
- 125000004438 haloalkoxy group Chemical group 0.000 description 6
- 238000001727 in vivo Methods 0.000 description 6
- 239000004615 ingredient Substances 0.000 description 6
- 239000000256 polyoxyethylene sorbitan monolaurate Substances 0.000 description 6
- 235000010486 polyoxyethylene sorbitan monolaurate Nutrition 0.000 description 6
- 108090000765 processed proteins & peptides Proteins 0.000 description 6
- 230000002829 reductive effect Effects 0.000 description 6
- 230000004044 response Effects 0.000 description 6
- 239000011734 sodium Substances 0.000 description 6
- FVAUCKIRQBBSSJ-UHFFFAOYSA-M sodium iodide Chemical compound [Na+].[I-] FVAUCKIRQBBSSJ-UHFFFAOYSA-M 0.000 description 6
- FYSNRJHAOHDILO-UHFFFAOYSA-N thionyl chloride Chemical compound ClS(Cl)=O FYSNRJHAOHDILO-UHFFFAOYSA-N 0.000 description 6
- 230000036962 time dependent Effects 0.000 description 6
- 210000001519 tissue Anatomy 0.000 description 6
- VZCYOOQTPOCHFL-UHFFFAOYSA-N trans-butenedioic acid Natural products OC(=O)C=CC(O)=O VZCYOOQTPOCHFL-UHFFFAOYSA-N 0.000 description 6
- 238000001262 western blot Methods 0.000 description 6
- OISVCGZHLKNMSJ-UHFFFAOYSA-N 2,6-dimethylpyridine Chemical compound CC1=CC=CC(C)=N1 OISVCGZHLKNMSJ-UHFFFAOYSA-N 0.000 description 5
- 102000001805 Bromodomains Human genes 0.000 description 5
- 108050009021 Bromodomains Proteins 0.000 description 5
- 208000035473 Communicable disease Diseases 0.000 description 5
- RTZKZFJDLAIYFH-UHFFFAOYSA-N Diethyl ether Chemical compound CCOCC RTZKZFJDLAIYFH-UHFFFAOYSA-N 0.000 description 5
- 238000002965 ELISA Methods 0.000 description 5
- 108010015514 Glutamate-tRNA ligase Proteins 0.000 description 5
- 108010024124 Histone Deacetylase 1 Proteins 0.000 description 5
- 102100039996 Histone deacetylase 1 Human genes 0.000 description 5
- VEXZGXHMUGYJMC-UHFFFAOYSA-N Hydrochloric acid Chemical compound Cl VEXZGXHMUGYJMC-UHFFFAOYSA-N 0.000 description 5
- CPELXLSAUQHCOX-UHFFFAOYSA-N Hydrogen bromide Chemical compound Br CPELXLSAUQHCOX-UHFFFAOYSA-N 0.000 description 5
- 102000003960 Ligases Human genes 0.000 description 5
- 108090000364 Ligases Proteins 0.000 description 5
- VYPSYNLAJGMNEJ-UHFFFAOYSA-N Silicium dioxide Chemical compound O=[Si]=O VYPSYNLAJGMNEJ-UHFFFAOYSA-N 0.000 description 5
- 108010003723 Single-Domain Antibodies Proteins 0.000 description 5
- 229930006000 Sucrose Natural products 0.000 description 5
- CZMRCDWAGMRECN-UGDNZRGBSA-N Sucrose Chemical compound O[C@H]1[C@H](O)[C@@H](CO)O[C@@]1(CO)O[C@@H]1[C@H](O)[C@@H](O)[C@H](O)[C@@H](CO)O1 CZMRCDWAGMRECN-UGDNZRGBSA-N 0.000 description 5
- PZBFGYYEXUXCOF-UHFFFAOYSA-N TCEP Chemical compound OC(=O)CCP(CCC(O)=O)CCC(O)=O PZBFGYYEXUXCOF-UHFFFAOYSA-N 0.000 description 5
- 108020004566 Transfer RNA Proteins 0.000 description 5
- 102000006275 Ubiquitin-Protein Ligases Human genes 0.000 description 5
- 108010083111 Ubiquitin-Protein Ligases Proteins 0.000 description 5
- 238000011948 assay development Methods 0.000 description 5
- QVGXLLKOCUKJST-UHFFFAOYSA-N atomic oxygen Chemical compound [O] QVGXLLKOCUKJST-UHFFFAOYSA-N 0.000 description 5
- 239000012267 brine Substances 0.000 description 5
- 238000000576 coating method Methods 0.000 description 5
- 238000013461 design Methods 0.000 description 5
- 238000009509 drug development Methods 0.000 description 5
- 239000000839 emulsion Substances 0.000 description 5
- 239000000284 extract Substances 0.000 description 5
- 229960002989 glutamic acid Drugs 0.000 description 5
- ZNNLBTZKUZBEKO-UHFFFAOYSA-N glyburide Chemical compound COC1=CC=C(Cl)C=C1C(=O)NCCC1=CC=C(S(=O)(=O)NC(=O)NC2CCCCC2)C=C1 ZNNLBTZKUZBEKO-UHFFFAOYSA-N 0.000 description 5
- 238000002868 homogeneous time resolved fluorescence Methods 0.000 description 5
- 239000012535 impurity Substances 0.000 description 5
- 208000015181 infectious disease Diseases 0.000 description 5
- 239000000543 intermediate Substances 0.000 description 5
- 230000000670 limiting effect Effects 0.000 description 5
- 210000004185 liver Anatomy 0.000 description 5
- 229910001629 magnesium chloride Inorganic materials 0.000 description 5
- 230000002438 mitochondrial effect Effects 0.000 description 5
- 239000013641 positive control Substances 0.000 description 5
- 239000000047 product Substances 0.000 description 5
- 108700005622 proline transport Proteins 0.000 description 5
- 125000001500 prolyl group Chemical group [H]N1C([H])(C(=O)[*])C([H])([H])C([H])([H])C1([H])[H] 0.000 description 5
- 244000000040 protozoan parasite Species 0.000 description 5
- 229960005206 pyrazinamide Drugs 0.000 description 5
- 238000011160 research Methods 0.000 description 5
- HPALAKNZSZLMCH-UHFFFAOYSA-M sodium;chloride;hydrate Chemical compound O.[Na+].[Cl-] HPALAKNZSZLMCH-UHFFFAOYSA-M 0.000 description 5
- 239000011550 stock solution Substances 0.000 description 5
- 239000005720 sucrose Substances 0.000 description 5
- 239000003826 tablet Substances 0.000 description 5
- 230000000699 topical effect Effects 0.000 description 5
- 230000036967 uncompetitive effect Effects 0.000 description 5
- 239000011534 wash buffer Substances 0.000 description 5
- YBJHBAHKTGYVGT-ZKWXMUAHSA-N (+)-Biotin Chemical compound N1C(=O)N[C@@H]2[C@H](CCCCC(=O)O)SC[C@@H]21 YBJHBAHKTGYVGT-ZKWXMUAHSA-N 0.000 description 4
- ZYJPUMXJBDHSIF-NSHDSACASA-N (2s)-2-[(2-methylpropan-2-yl)oxycarbonylamino]-3-phenylpropanoic acid Chemical compound CC(C)(C)OC(=O)N[C@H](C(O)=O)CC1=CC=CC=C1 ZYJPUMXJBDHSIF-NSHDSACASA-N 0.000 description 4
- RYHBNJHYFVUHQT-UHFFFAOYSA-N 1,4-Dioxane Chemical compound C1COCCO1 RYHBNJHYFVUHQT-UHFFFAOYSA-N 0.000 description 4
- 102100033793 ALK tyrosine kinase receptor Human genes 0.000 description 4
- 101710168331 ALK tyrosine kinase receptor Proteins 0.000 description 4
- 125000000882 C2-C6 alkenyl group Chemical group 0.000 description 4
- 125000003601 C2-C6 alkynyl group Chemical group 0.000 description 4
- KXDHJXZQYSOELW-UHFFFAOYSA-M Carbamate Chemical compound NC([O-])=O KXDHJXZQYSOELW-UHFFFAOYSA-M 0.000 description 4
- IAZDPXIOMUYVGZ-WFGJKAKNSA-N Dimethyl sulfoxide Chemical compound [2H]C([2H])([2H])S(=O)C([2H])([2H])[2H] IAZDPXIOMUYVGZ-WFGJKAKNSA-N 0.000 description 4
- KCXVZYZYPLLWCC-UHFFFAOYSA-N EDTA Chemical compound OC(=O)CN(CC(O)=O)CCN(CC(O)=O)CC(O)=O KCXVZYZYPLLWCC-UHFFFAOYSA-N 0.000 description 4
- 206010016654 Fibrosis Diseases 0.000 description 4
- MUBZPKHOEPUJKR-UHFFFAOYSA-N Oxalic acid Chemical compound OC(=O)C(O)=O MUBZPKHOEPUJKR-UHFFFAOYSA-N 0.000 description 4
- 229910019142 PO4 Inorganic materials 0.000 description 4
- 108010004478 Phenylalanine-tRNA Ligase Proteins 0.000 description 4
- 102100029354 Phenylalanine-tRNA ligase, mitochondrial Human genes 0.000 description 4
- 241000224017 Plasmodium berghei Species 0.000 description 4
- 239000002202 Polyethylene glycol Substances 0.000 description 4
- 208000035999 Recurrence Diseases 0.000 description 4
- 238000012300 Sequence Analysis Methods 0.000 description 4
- UIIMBOGNXHQVGW-UHFFFAOYSA-M Sodium bicarbonate Chemical compound [Na+].OC([O-])=O UIIMBOGNXHQVGW-UHFFFAOYSA-M 0.000 description 4
- 108010090804 Streptavidin Proteins 0.000 description 4
- NINIDFKCEFEMDL-UHFFFAOYSA-N Sulfur Chemical compound [S] NINIDFKCEFEMDL-UHFFFAOYSA-N 0.000 description 4
- 229910052771 Terbium Inorganic materials 0.000 description 4
- 108010029287 Threonine-tRNA ligase Proteins 0.000 description 4
- 102100028196 Threonine-tRNA ligase 2, cytoplasmic Human genes 0.000 description 4
- 238000002835 absorbance Methods 0.000 description 4
- 239000004480 active ingredient Substances 0.000 description 4
- 125000003275 alpha amino acid group Chemical group 0.000 description 4
- 125000003118 aryl group Chemical group 0.000 description 4
- 201000008680 babesiosis Diseases 0.000 description 4
- 230000015572 biosynthetic process Effects 0.000 description 4
- 239000007853 buffer solution Substances 0.000 description 4
- 125000003178 carboxy group Chemical group [H]OC(*)=O 0.000 description 4
- 239000000969 carrier Substances 0.000 description 4
- 238000012054 celltiter-glo Methods 0.000 description 4
- 230000005754 cellular signaling Effects 0.000 description 4
- 229940125782 compound 2 Drugs 0.000 description 4
- 230000001419 dependent effect Effects 0.000 description 4
- 239000003085 diluting agent Substances 0.000 description 4
- 239000000539 dimer Substances 0.000 description 4
- 239000002552 dosage form Substances 0.000 description 4
- 238000000295 emission spectrum Methods 0.000 description 4
- 230000001973 epigenetic effect Effects 0.000 description 4
- 230000004761 fibrosis Effects 0.000 description 4
- 229960004580 glibenclamide Drugs 0.000 description 4
- 125000005842 heteroatom Chemical group 0.000 description 4
- 229940121372 histone deacetylase inhibitor Drugs 0.000 description 4
- 238000003018 immunoassay Methods 0.000 description 4
- 230000003834 intracellular effect Effects 0.000 description 4
- 229910052747 lanthanoid Inorganic materials 0.000 description 4
- 150000002602 lanthanoids Chemical class 0.000 description 4
- VZCYOOQTPOCHFL-UPHRSURJSA-N maleic acid Chemical compound OC(=O)\C=C/C(O)=O VZCYOOQTPOCHFL-UPHRSURJSA-N 0.000 description 4
- 229910052751 metal Inorganic materials 0.000 description 4
- 239000002184 metal Substances 0.000 description 4
- 230000004048 modification Effects 0.000 description 4
- 238000012986 modification Methods 0.000 description 4
- 230000035772 mutation Effects 0.000 description 4
- VLKZOEOYAKHREP-UHFFFAOYSA-N n-Hexane Chemical class CCCCCC VLKZOEOYAKHREP-UHFFFAOYSA-N 0.000 description 4
- BWHMMNNQKKPAPP-UHFFFAOYSA-L potassium carbonate Chemical compound [K+].[K+].[O-]C([O-])=O BWHMMNNQKKPAPP-UHFFFAOYSA-L 0.000 description 4
- 238000003118 sandwich ELISA Methods 0.000 description 4
- 239000002904 solvent Substances 0.000 description 4
- 238000010186 staining Methods 0.000 description 4
- 239000011593 sulfur Substances 0.000 description 4
- 230000001225 therapeutic effect Effects 0.000 description 4
- 230000014616 translation Effects 0.000 description 4
- 201000008827 tuberculosis Diseases 0.000 description 4
- 238000012070 whole genome sequencing analysis Methods 0.000 description 4
- GECIDMICWWDIBO-UHFFFAOYSA-N (2,5-dioxopyrrolidin-1-yl) 3',6'-dihydroxy-3-oxospiro[2-benzofuran-1,9'-xanthene]-5-carboxylate Chemical compound C=1C(O)=CC=C2C=1OC1=CC(O)=CC=C1C2(C1=CC=2)OC(=O)C1=CC=2C(=O)ON1C(=O)CCC1=O GECIDMICWWDIBO-UHFFFAOYSA-N 0.000 description 3
- ZQEBQGAAWMOMAI-ZETCQYMHSA-N (2s)-1-[(2-methylpropan-2-yl)oxycarbonyl]pyrrolidine-2-carboxylic acid Chemical compound CC(C)(C)OC(=O)N1CCC[C@H]1C(O)=O ZQEBQGAAWMOMAI-ZETCQYMHSA-N 0.000 description 3
- QJCNLJWUIOIMMF-YUMQZZPRSA-N (2s,3s)-3-methyl-2-[(2-methylpropan-2-yl)oxycarbonylamino]pentanoic acid Chemical compound CC[C@H](C)[C@@H](C(O)=O)NC(=O)OC(C)(C)C QJCNLJWUIOIMMF-YUMQZZPRSA-N 0.000 description 3
- 125000006559 (C1-C3) alkylamino group Chemical group 0.000 description 3
- 125000006698 (C1-C3) dialkylamino group Chemical group 0.000 description 3
- 125000006274 (C1-C3)alkoxy group Chemical group 0.000 description 3
- DICWIJISMKZDDY-VIFPVBQESA-N 1-o-tert-butyl 2-o-(2,5-dioxopyrrolidin-1-yl) (2s)-pyrrolidine-1,2-dicarboxylate Chemical compound CC(C)(C)OC(=O)N1CCC[C@H]1C(=O)ON1C(=O)CCC1=O DICWIJISMKZDDY-VIFPVBQESA-N 0.000 description 3
- VDABVNMGKGUPEY-UHFFFAOYSA-N 6-carboxyfluorescein succinimidyl ester Chemical compound C=1C(O)=CC=C2C=1OC1=CC(O)=CC=C1C2(C1=C2)OC(=O)C1=CC=C2C(=O)ON1C(=O)CCC1=O VDABVNMGKGUPEY-UHFFFAOYSA-N 0.000 description 3
- 241000223836 Babesia Species 0.000 description 3
- WPTTVJLTNAWYAO-KPOXMGGZSA-N Bardoxolone methyl Chemical compound C([C@@]12C)=C(C#N)C(=O)C(C)(C)[C@@H]1CC[C@]1(C)C2=CC(=O)[C@@H]2[C@@H]3CC(C)(C)CC[C@]3(C(=O)OC)CC[C@]21C WPTTVJLTNAWYAO-KPOXMGGZSA-N 0.000 description 3
- WVDDGKGOMKODPV-UHFFFAOYSA-N Benzyl alcohol Chemical compound OCC1=CC=CC=C1 WVDDGKGOMKODPV-UHFFFAOYSA-N 0.000 description 3
- 239000002126 C01EB10 - Adenosine Substances 0.000 description 3
- VSGQIKCWVMORTJ-UHFFFAOYSA-N CC(C)(C)OC(NC(CC1)CCN1C(NC1=NC=CN=C1C(NC1CC2=CC=CC=C2C1)=O)=O)=O Chemical compound CC(C)(C)OC(NC(CC1)CCN1C(NC1=NC=CN=C1C(NC1CC2=CC=CC=C2C1)=O)=O)=O VSGQIKCWVMORTJ-UHFFFAOYSA-N 0.000 description 3
- CURLTUGMZLYLDI-UHFFFAOYSA-N Carbon dioxide Chemical compound O=C=O CURLTUGMZLYLDI-UHFFFAOYSA-N 0.000 description 3
- 241000223935 Cryptosporidium Species 0.000 description 3
- 241000179197 Cyclospora Species 0.000 description 3
- 241000987822 Cystoisospora Species 0.000 description 3
- FBPFZTCFMRRESA-KVTDHHQDSA-N D-Mannitol Chemical compound OC[C@@H](O)[C@@H](O)[C@H](O)[C@H](O)CO FBPFZTCFMRRESA-KVTDHHQDSA-N 0.000 description 3
- BJDCWCLMFKKGEE-KDTBHNEXSA-N Dihydroartemisinin (DHA) Chemical compound C([C@](OO1)(C)O2)C[C@H]3[C@H](C)CC[C@@H]4[C@@]31[C@@H]2O[C@@H](O)[C@@H]4C BJDCWCLMFKKGEE-KDTBHNEXSA-N 0.000 description 3
- LYCAIKOWRPUZTN-UHFFFAOYSA-N Ethylene glycol Chemical compound OCCO LYCAIKOWRPUZTN-UHFFFAOYSA-N 0.000 description 3
- VZCYOOQTPOCHFL-OWOJBTEDSA-N Fumaric acid Chemical compound OC(=O)\C=C\C(O)=O VZCYOOQTPOCHFL-OWOJBTEDSA-N 0.000 description 3
- 241000224466 Giardia Species 0.000 description 3
- WQZGKKKJIJFFOK-GASJEMHNSA-N Glucose Natural products OC[C@H]1OC(O)[C@H](O)[C@@H](O)[C@@H]1O WQZGKKKJIJFFOK-GASJEMHNSA-N 0.000 description 3
- 102100022846 Histone acetyltransferase KAT2B Human genes 0.000 description 3
- 101710083341 Histone acetyltransferase KAT2B Proteins 0.000 description 3
- 241000282412 Homo Species 0.000 description 3
- UFHFLCQGNIYNRP-UHFFFAOYSA-N Hydrogen Chemical compound [H][H] UFHFLCQGNIYNRP-UHFFFAOYSA-N 0.000 description 3
- 101710176147 Isoleucine-tRNA ligase, cytoplasmic Proteins 0.000 description 3
- 229930182821 L-proline Natural products 0.000 description 3
- GUBGYTABKSRVRQ-QKKXKWKRSA-N Lactose Natural products OC[C@H]1O[C@@H](O[C@H]2[C@H](O)[C@@H](O)C(O)O[C@@H]2CO)[C@H](O)[C@@H](O)[C@H]1O GUBGYTABKSRVRQ-QKKXKWKRSA-N 0.000 description 3
- 240000007472 Leucaena leucocephala Species 0.000 description 3
- 235000010643 Leucaena leucocephala Nutrition 0.000 description 3
- 241000124008 Mammalia Species 0.000 description 3
- 229930195725 Mannitol Natural products 0.000 description 3
- AFVFQIVMOAPDHO-UHFFFAOYSA-N Methanesulfonic acid Chemical compound CS(O)(=O)=O AFVFQIVMOAPDHO-UHFFFAOYSA-N 0.000 description 3
- JCXJVPUVTGWSNB-UHFFFAOYSA-N Nitrogen dioxide Chemical compound O=[N]=O JCXJVPUVTGWSNB-UHFFFAOYSA-N 0.000 description 3
- 102000035195 Peptidases Human genes 0.000 description 3
- 108091005804 Peptidases Proteins 0.000 description 3
- 241000223801 Plasmodium knowlesi Species 0.000 description 3
- 241001505293 Plasmodium ovale Species 0.000 description 3
- 241000223810 Plasmodium vivax Species 0.000 description 3
- 101710149031 Probable isoleucine-tRNA ligase, cytoplasmic Proteins 0.000 description 3
- 229910006124 SOCl2 Inorganic materials 0.000 description 3
- 229920002472 Starch Polymers 0.000 description 3
- 241000223996 Toxoplasma Species 0.000 description 3
- KJDAGXLMHXUAGV-DGWLBADLSA-N [(1r,2r,3s,4r)-2,3-dihydroxy-4-[[2-[3-(trifluoromethylsulfanyl)phenyl]pyrazolo[1,5-a]pyrimidin-7-yl]amino]cyclopentyl]methyl sulfamate Chemical compound O[C@@H]1[C@H](O)[C@@H](COS(=O)(=O)N)C[C@H]1NC1=CC=NC2=CC(C=3C=C(SC(F)(F)F)C=CC=3)=NN12 KJDAGXLMHXUAGV-DGWLBADLSA-N 0.000 description 3
- 229960005305 adenosine Drugs 0.000 description 3
- 238000001042 affinity chromatography Methods 0.000 description 3
- 125000000304 alkynyl group Chemical group 0.000 description 3
- 229940125528 allosteric inhibitor Drugs 0.000 description 3
- 125000000266 alpha-aminoacyl group Chemical group 0.000 description 3
- MDFFNEOEWAXZRQ-UHFFFAOYSA-N aminyl Chemical compound [NH2] MDFFNEOEWAXZRQ-UHFFFAOYSA-N 0.000 description 3
- 239000007864 aqueous solution Substances 0.000 description 3
- WPYMKLBDIGXBTP-UHFFFAOYSA-N benzoic acid Chemical compound OC(=O)C1=CC=CC=C1 WPYMKLBDIGXBTP-UHFFFAOYSA-N 0.000 description 3
- 239000011230 binding agent Substances 0.000 description 3
- 230000008033 biological extinction Effects 0.000 description 3
- GXJABQQUPOEUTA-RDJZCZTQSA-N bortezomib Chemical compound C([C@@H](C(=O)N[C@@H](CC(C)C)B(O)O)NC(=O)C=1N=CC=NC=1)C1=CC=CC=C1 GXJABQQUPOEUTA-RDJZCZTQSA-N 0.000 description 3
- 229960001467 bortezomib Drugs 0.000 description 3
- 239000006227 byproduct Substances 0.000 description 3
- 239000002775 capsule Substances 0.000 description 3
- 125000003917 carbamoyl group Chemical group [H]N([H])C(*)=O 0.000 description 3
- 229910052801 chlorine Inorganic materials 0.000 description 3
- 210000003763 chloroplast Anatomy 0.000 description 3
- 210000000349 chromosome Anatomy 0.000 description 3
- KRKNYBCHXYNGOX-UHFFFAOYSA-N citric acid Chemical compound OC(=O)CC(O)(C(O)=O)CC(O)=O KRKNYBCHXYNGOX-UHFFFAOYSA-N 0.000 description 3
- 230000000295 complement effect Effects 0.000 description 3
- 230000009918 complex formation Effects 0.000 description 3
- 238000012937 correction Methods 0.000 description 3
- 230000008878 coupling Effects 0.000 description 3
- 238000010168 coupling process Methods 0.000 description 3
- 238000005859 coupling reaction Methods 0.000 description 3
- 238000002425 crystallisation Methods 0.000 description 3
- 230000008025 crystallization Effects 0.000 description 3
- 230000009089 cytolysis Effects 0.000 description 3
- 230000004069 differentiation Effects 0.000 description 3
- 239000002270 dispersing agent Substances 0.000 description 3
- 230000002255 enzymatic effect Effects 0.000 description 3
- 238000001914 filtration Methods 0.000 description 3
- 238000007306 functionalization reaction Methods 0.000 description 3
- 239000008187 granular material Substances 0.000 description 3
- 229940093915 gynecological organic acid Drugs 0.000 description 3
- 230000036541 health Effects 0.000 description 3
- 230000013632 homeostatic process Effects 0.000 description 3
- 210000005260 human cell Anatomy 0.000 description 3
- 150000004679 hydroxides Chemical class 0.000 description 3
- 238000002347 injection Methods 0.000 description 3
- 239000007924 injection Substances 0.000 description 3
- 230000010354 integration Effects 0.000 description 3
- 125000001449 isopropyl group Chemical group [H]C([H])([H])C([H])(*)C([H])([H])[H] 0.000 description 3
- 239000008101 lactose Substances 0.000 description 3
- 239000002502 liposome Substances 0.000 description 3
- 239000000594 mannitol Substances 0.000 description 3
- 235000010355 mannitol Nutrition 0.000 description 3
- 208000020968 mature T-cell and NK-cell non-Hodgkin lymphoma Diseases 0.000 description 3
- 230000001404 mediated effect Effects 0.000 description 3
- 239000012528 membrane Substances 0.000 description 3
- 238000003032 molecular docking Methods 0.000 description 3
- 238000012544 monitoring process Methods 0.000 description 3
- 125000002950 monocyclic group Chemical group 0.000 description 3
- 150000007524 organic acids Chemical class 0.000 description 3
- 235000005985 organic acids Nutrition 0.000 description 3
- 230000002018 overexpression Effects 0.000 description 3
- 239000010452 phosphate Substances 0.000 description 3
- 235000021317 phosphate Nutrition 0.000 description 3
- 239000000843 powder Substances 0.000 description 3
- 239000003755 preservative agent Substances 0.000 description 3
- 239000012460 protein solution Substances 0.000 description 3
- 238000010791 quenching Methods 0.000 description 3
- 125000006413 ring segment Chemical group 0.000 description 3
- 238000007480 sanger sequencing Methods 0.000 description 3
- 238000000926 separation method Methods 0.000 description 3
- 238000013207 serial dilution Methods 0.000 description 3
- 241000894007 species Species 0.000 description 3
- 235000019698 starch Nutrition 0.000 description 3
- 239000007858 starting material Substances 0.000 description 3
- 238000006467 substitution reaction Methods 0.000 description 3
- MPUQHZXIXSTTDU-QXGSTGNESA-N sulfamic acid [(1S,2S,4R)-4-[4-[[(1S)-2,3-dihydro-1H-inden-1-yl]amino]-7-pyrrolo[2,3-d]pyrimidinyl]-2-hydroxycyclopentyl]methyl ester Chemical compound C1[C@H](O)[C@H](COS(=O)(=O)N)C[C@H]1N1C2=NC=NC(N[C@@H]3C4=CC=CC=C4CC3)=C2C=C1 MPUQHZXIXSTTDU-QXGSTGNESA-N 0.000 description 3
- 125000002653 sulfanylmethyl group Chemical group [H]SC([H])([H])[*] 0.000 description 3
- 239000000375 suspending agent Substances 0.000 description 3
- GZCRRIHWUXGPOV-UHFFFAOYSA-N terbium atom Chemical compound [Tb] GZCRRIHWUXGPOV-UHFFFAOYSA-N 0.000 description 3
- 125000005931 tert-butyloxycarbonyl group Chemical group [H]C([H])([H])C(OC(*)=O)(C([H])([H])[H])C([H])([H])[H] 0.000 description 3
- 238000002560 therapeutic procedure Methods 0.000 description 3
- 102000035160 transmembrane proteins Human genes 0.000 description 3
- 108091005703 transmembrane proteins Proteins 0.000 description 3
- 239000001226 triphosphate Substances 0.000 description 3
- 235000011178 triphosphate Nutrition 0.000 description 3
- 230000007306 turnover Effects 0.000 description 3
- PUPZLCDOIYMWBV-UHFFFAOYSA-N (+/-)-1,3-Butanediol Chemical compound CC(O)CCO PUPZLCDOIYMWBV-UHFFFAOYSA-N 0.000 description 2
- OJCKRNPLOZHAOU-RSXXJMTFSA-N (1r,2r)-2-[(2s,4e,6e,8r,9s,11r,13s,15s,16s)-7-cyano-8,16-dihydroxy-9,11,13,15-tetramethyl-18-oxo-1-oxacyclooctadeca-4,6-dien-2-yl]cyclopentane-1-carboxylic acid Chemical compound O1C(=O)C[C@H](O)[C@@H](C)C[C@@H](C)C[C@@H](C)C[C@H](C)[C@@H](O)\C(C#N)=C\C=C\C[C@H]1[C@H]1[C@H](C(O)=O)CCC1 OJCKRNPLOZHAOU-RSXXJMTFSA-N 0.000 description 2
- KQJSQWZMSAGSHN-UHFFFAOYSA-N (9beta,13alpha,14beta,20alpha)-3-hydroxy-9,13-dimethyl-2-oxo-24,25,26-trinoroleana-1(10),3,5,7-tetraen-29-oic acid Natural products CC12CCC3(C)C4CC(C)(C(O)=O)CCC4(C)CCC3(C)C2=CC=C2C1=CC(=O)C(O)=C2C KQJSQWZMSAGSHN-UHFFFAOYSA-N 0.000 description 2
- 125000006708 (C5-C14) heteroaryl group Chemical group 0.000 description 2
- KQZLRWGGWXJPOS-NLFPWZOASA-N 1-[(1R)-1-(2,4-dichlorophenyl)ethyl]-6-[(4S,5R)-4-[(2S)-2-(hydroxymethyl)pyrrolidin-1-yl]-5-methylcyclohexen-1-yl]pyrazolo[3,4-b]pyrazine-3-carbonitrile Chemical compound ClC1=C(C=CC(=C1)Cl)[C@@H](C)N1N=C(C=2C1=NC(=CN=2)C1=CC[C@@H]([C@@H](C1)C)N1[C@@H](CCC1)CO)C#N KQZLRWGGWXJPOS-NLFPWZOASA-N 0.000 description 2
- VBICKXHEKHSIBG-UHFFFAOYSA-N 1-monostearoylglycerol Chemical compound CCCCCCCCCCCCCCCCCC(=O)OCC(O)CO VBICKXHEKHSIBG-UHFFFAOYSA-N 0.000 description 2
- YOETUEMZNOLGDB-UHFFFAOYSA-N 2-methylpropyl carbonochloridate Chemical compound CC(C)COC(Cl)=O YOETUEMZNOLGDB-UHFFFAOYSA-N 0.000 description 2
- BMYNFMYTOJXKLE-UHFFFAOYSA-N 3-azaniumyl-2-hydroxypropanoate Chemical compound NCC(O)C(O)=O BMYNFMYTOJXKLE-UHFFFAOYSA-N 0.000 description 2
- VHYFNPMBLIVWCW-UHFFFAOYSA-N 4-Dimethylaminopyridine Chemical compound CN(C)C1=CC=NC=C1 VHYFNPMBLIVWCW-UHFFFAOYSA-N 0.000 description 2
- YYROPELSRYBVMQ-UHFFFAOYSA-N 4-toluenesulfonyl chloride Chemical compound CC1=CC=C(S(Cl)(=O)=O)C=C1 YYROPELSRYBVMQ-UHFFFAOYSA-N 0.000 description 2
- NSPMIYGKQJPBQR-UHFFFAOYSA-N 4H-1,2,4-triazole Chemical compound C=1N=CNN=1 NSPMIYGKQJPBQR-UHFFFAOYSA-N 0.000 description 2
- NNHZTTGTYSXGED-ZWZTZDBGSA-N 7-bromo-6-chloro-3-[(2r)-2-hydroxy-3-[(2r,3s)-3-hydroxypiperidin-2-yl]propyl]quinazolin-4-one Chemical compound C([C@@H](O)CN1C(C2=CC(Cl)=C(Br)C=C2N=C1)=O)[C@H]1NCCC[C@@H]1O NNHZTTGTYSXGED-ZWZTZDBGSA-N 0.000 description 2
- KDCGOANMDULRCW-UHFFFAOYSA-N 7H-purine Chemical compound N1=CNC2=NC=NC2=C1 KDCGOANMDULRCW-UHFFFAOYSA-N 0.000 description 2
- 108700028369 Alleles Proteins 0.000 description 2
- GUBGYTABKSRVRQ-XLOQQCSPSA-N Alpha-Lactose Chemical compound O[C@@H]1[C@@H](O)[C@@H](O)[C@@H](CO)O[C@H]1O[C@@H]1[C@@H](CO)O[C@H](O)[C@H](O)[C@H]1O GUBGYTABKSRVRQ-XLOQQCSPSA-N 0.000 description 2
- QGZKDVFQNNGYKY-UHFFFAOYSA-N Ammonia Chemical compound N QGZKDVFQNNGYKY-UHFFFAOYSA-N 0.000 description 2
- CIWBSHSKHKDKBQ-JLAZNSOCSA-N Ascorbic acid Chemical compound OC[C@H](O)[C@H]1OC(=O)C(O)=C1O CIWBSHSKHKDKBQ-JLAZNSOCSA-N 0.000 description 2
- 102000008836 BTB/POZ domains Human genes 0.000 description 2
- 108050000749 BTB/POZ domains Proteins 0.000 description 2
- OJCKRNPLOZHAOU-BNXNOGCYSA-N Borrelidin Natural products CC1CC(C)CC(C)C(O)C(=C/C=C/CC(OC(=O)CC(O)C(C)C1)C2CCCC2C(=O)O)C#N OJCKRNPLOZHAOU-BNXNOGCYSA-N 0.000 description 2
- BAEBMMMAMBRLRZ-UHFFFAOYSA-N CC(C)(C)OC(NCC(CC1)CCN1C(NC1=NC=CN=C1C(NC1CC2=CC=CC=C2C1)=O)=O)=O Chemical compound CC(C)(C)OC(NCC(CC1)CCN1C(NC1=NC=CN=C1C(NC1CC2=CC=CC=C2C1)=O)=O)=O BAEBMMMAMBRLRZ-UHFFFAOYSA-N 0.000 description 2
- CVTCBTCJVOPYLC-UHFFFAOYSA-N CC(C)(C)OC(NCCCCCC(NCC(CC1)CCN1C(NC1=NC=CN=C1C(NC1CC2=CC=CC=C2C1)=O)=O)=O)=O Chemical compound CC(C)(C)OC(NCCCCCC(NCC(CC1)CCN1C(NC1=NC=CN=C1C(NC1CC2=CC=CC=C2C1)=O)=O)=O)=O CVTCBTCJVOPYLC-UHFFFAOYSA-N 0.000 description 2
- VTYYLEPIZMXCLO-UHFFFAOYSA-L Calcium carbonate Chemical compound [Ca+2].[O-]C([O-])=O VTYYLEPIZMXCLO-UHFFFAOYSA-L 0.000 description 2
- BHPQYMZQTOCNFJ-UHFFFAOYSA-N Calcium cation Chemical compound [Ca+2] BHPQYMZQTOCNFJ-UHFFFAOYSA-N 0.000 description 2
- 102000052052 Casein Kinase II Human genes 0.000 description 2
- 108010010919 Casein Kinase II Proteins 0.000 description 2
- AQKDBFWJOPNOKZ-UHFFFAOYSA-N Celastrol Natural products CC12CCC3(C)C4CC(C)(C(O)=O)CCC4(C)CCC3(C)C2=CC=C2C1=CC(=O)C(=O)C2C AQKDBFWJOPNOKZ-UHFFFAOYSA-N 0.000 description 2
- 208000003495 Coccidiosis Diseases 0.000 description 2
- 108020004705 Codon Proteins 0.000 description 2
- 208000008953 Cryptosporidiosis Diseases 0.000 description 2
- 206010011502 Cryptosporidiosis infection Diseases 0.000 description 2
- 102000036364 Cullin Ring E3 Ligases Human genes 0.000 description 2
- 108091007045 Cullin Ring E3 Ligases Proteins 0.000 description 2
- 108010025415 Cyclin-Dependent Kinase 8 Proteins 0.000 description 2
- 108010025461 Cyclin-Dependent Kinase 9 Proteins 0.000 description 2
- 102100024456 Cyclin-dependent kinase 8 Human genes 0.000 description 2
- 102100024457 Cyclin-dependent kinase 9 Human genes 0.000 description 2
- RGHNJXZEOKUKBD-SQOUGZDYSA-N D-gluconic acid Chemical compound OC[C@@H](O)[C@@H](O)[C@H](O)[C@@H](O)C(O)=O RGHNJXZEOKUKBD-SQOUGZDYSA-N 0.000 description 2
- FEWJPZIEWOKRBE-JCYAYHJZSA-N Dextrotartaric acid Chemical compound OC(=O)[C@H](O)[C@@H](O)C(O)=O FEWJPZIEWOKRBE-JCYAYHJZSA-N 0.000 description 2
- 101100204745 Drosophila melanogaster GluProRS gene Proteins 0.000 description 2
- 101100536354 Drosophila melanogaster tant gene Proteins 0.000 description 2
- 239000006144 Dulbecco’s modified Eagle's medium Substances 0.000 description 2
- 108050002772 E3 ubiquitin-protein ligase Mdm2 Proteins 0.000 description 2
- 102000012199 E3 ubiquitin-protein ligase Mdm2 Human genes 0.000 description 2
- 102000001301 EGF receptor Human genes 0.000 description 2
- 108060006698 EGF receptor Proteins 0.000 description 2
- 102100038595 Estrogen receptor Human genes 0.000 description 2
- QUSNBJAOOMFDIB-UHFFFAOYSA-N Ethylamine Chemical compound CCN QUSNBJAOOMFDIB-UHFFFAOYSA-N 0.000 description 2
- 102100027304 Eukaryotic translation initiation factor 4E Human genes 0.000 description 2
- 101710091918 Eukaryotic translation initiation factor 4E Proteins 0.000 description 2
- 229910052693 Europium Inorganic materials 0.000 description 2
- FWVHWDSCPKXMDB-LSDHHAIUSA-N Febrifugine Chemical compound O[C@@H]1CCCN[C@H]1CC(=O)CN1C(=O)C2=CC=CC=C2N=C1 FWVHWDSCPKXMDB-LSDHHAIUSA-N 0.000 description 2
- UIHLDYLKWIWXAH-UHFFFAOYSA-N Febrifugine Natural products OC1CCNCC1CC(=O)CN2C=Nc3ccccc3C2=O UIHLDYLKWIWXAH-UHFFFAOYSA-N 0.000 description 2
- 102000016621 Focal Adhesion Protein-Tyrosine Kinases Human genes 0.000 description 2
- 108010067715 Focal Adhesion Protein-Tyrosine Kinases Proteins 0.000 description 2
- 108010010803 Gelatin Proteins 0.000 description 2
- 238000002738 Giemsa staining Methods 0.000 description 2
- 241000711549 Hepacivirus C Species 0.000 description 2
- 102100038720 Histone deacetylase 9 Human genes 0.000 description 2
- 101001056180 Homo sapiens Induced myeloid leukemia cell differentiation protein Mcl-1 Proteins 0.000 description 2
- 101001012157 Homo sapiens Receptor tyrosine-protein kinase erbB-2 Proteins 0.000 description 2
- DGAQECJNVWCQMB-PUAWFVPOSA-M Ilexoside XXIX Chemical compound C[C@@H]1CC[C@@]2(CC[C@@]3(C(=CC[C@H]4[C@]3(CC[C@@H]5[C@@]4(CC[C@@H](C5(C)C)OS(=O)(=O)[O-])C)C)[C@@H]2[C@]1(C)O)C)C(=O)O[C@H]6[C@@H]([C@H]([C@@H]([C@H](O6)CO)O)O)O.[Na+] DGAQECJNVWCQMB-PUAWFVPOSA-M 0.000 description 2
- 102100026539 Induced myeloid leukemia cell differentiation protein Mcl-1 Human genes 0.000 description 2
- 108010072621 Interleukin-1 Receptor-Associated Kinases Proteins 0.000 description 2
- 102000006940 Interleukin-1 Receptor-Associated Kinases Human genes 0.000 description 2
- 102000029793 Isoleucine-tRNA ligase Human genes 0.000 description 2
- 206010023076 Isosporiasis Diseases 0.000 description 2
- 102000004034 Kelch-Like ECH-Associated Protein 1 Human genes 0.000 description 2
- 108090000484 Kelch-Like ECH-Associated Protein 1 Proteins 0.000 description 2
- 208000004554 Leishmaniasis Diseases 0.000 description 2
- 108060001084 Luciferase Proteins 0.000 description 2
- 239000005089 Luciferase Substances 0.000 description 2
- 108700012928 MAPK14 Proteins 0.000 description 2
- JLVVSXFLKOJNIY-UHFFFAOYSA-N Magnesium ion Chemical compound [Mg+2] JLVVSXFLKOJNIY-UHFFFAOYSA-N 0.000 description 2
- CSNNHWWHGAXBCP-UHFFFAOYSA-L Magnesium sulfate Chemical compound [Mg+2].[O-][S+2]([O-])([O-])[O-] CSNNHWWHGAXBCP-UHFFFAOYSA-L 0.000 description 2
- 241001465754 Metazoa Species 0.000 description 2
- 102100026930 Mitogen-activated protein kinase 13 Human genes 0.000 description 2
- 102000056248 Mitogen-activated protein kinase 13 Human genes 0.000 description 2
- 108700015928 Mitogen-activated protein kinase 13 Proteins 0.000 description 2
- 102000016943 Muramidase Human genes 0.000 description 2
- 108010014251 Muramidase Proteins 0.000 description 2
- 241000699666 Mus <mouse, genus> Species 0.000 description 2
- QPCDCPDFJACHGM-UHFFFAOYSA-N N,N-bis{2-[bis(carboxymethyl)amino]ethyl}glycine Chemical compound OC(=O)CN(CC(O)=O)CCN(CC(=O)O)CCN(CC(O)=O)CC(O)=O QPCDCPDFJACHGM-UHFFFAOYSA-N 0.000 description 2
- 108010062010 N-Acetylmuramoyl-L-alanine Amidase Proteins 0.000 description 2
- 102100022913 NAD-dependent protein deacetylase sirtuin-2 Human genes 0.000 description 2
- 101001092938 Oryza sativa subsp. japonica Serine/threonine-protein kinase SAPK4 Proteins 0.000 description 2
- 108091007960 PI3Ks Proteins 0.000 description 2
- 206010034133 Pathogen resistance Diseases 0.000 description 2
- 208000027190 Peripheral T-cell lymphomas Diseases 0.000 description 2
- YGYAWVDWMABLBF-UHFFFAOYSA-N Phosgene Chemical compound ClC(Cl)=O YGYAWVDWMABLBF-UHFFFAOYSA-N 0.000 description 2
- 102000003993 Phosphatidylinositol 3-kinases Human genes 0.000 description 2
- 108090000430 Phosphatidylinositol 3-kinases Proteins 0.000 description 2
- NBIIXXVUZAFLBC-UHFFFAOYSA-N Phosphoric acid Chemical compound OP(O)(O)=O NBIIXXVUZAFLBC-UHFFFAOYSA-N 0.000 description 2
- 241001505483 Plasmodium falciparum 3D7 Species 0.000 description 2
- 241000223821 Plasmodium malariae Species 0.000 description 2
- 102100023712 Poly [ADP-ribose] polymerase 1 Human genes 0.000 description 2
- 229920000776 Poly(Adenosine diphosphate-ribose) polymerase Polymers 0.000 description 2
- 102000002272 Polycomb Repressive Complex 2 Human genes 0.000 description 2
- 108010000597 Polycomb Repressive Complex 2 Proteins 0.000 description 2
- 229920002562 Polyethylene Glycol 3350 Polymers 0.000 description 2
- OFOBLEOULBTSOW-UHFFFAOYSA-N Propanedioic acid Natural products OC(=O)CC(O)=O OFOBLEOULBTSOW-UHFFFAOYSA-N 0.000 description 2
- 239000004365 Protease Substances 0.000 description 2
- 229940124158 Protease/peptidase inhibitor Drugs 0.000 description 2
- 102000004245 Proteasome Endopeptidase Complex Human genes 0.000 description 2
- 108090000708 Proteasome Endopeptidase Complex Proteins 0.000 description 2
- 102000001253 Protein Kinase Human genes 0.000 description 2
- JUJWROOIHBZHMG-UHFFFAOYSA-N Pyridine Chemical compound C1=CC=NC=C1 JUJWROOIHBZHMG-UHFFFAOYSA-N 0.000 description 2
- 102100030086 Receptor tyrosine-protein kinase erbB-2 Human genes 0.000 description 2
- 108010034546 Serratia marcescens nuclease Proteins 0.000 description 2
- 108010041216 Sirtuin 2 Proteins 0.000 description 2
- CDBYLPFSWZWCQE-UHFFFAOYSA-L Sodium Carbonate Chemical compound [Na+].[Na+].[O-]C([O-])=O CDBYLPFSWZWCQE-UHFFFAOYSA-L 0.000 description 2
- 102100036832 Steroid hormone receptor ERR1 Human genes 0.000 description 2
- QAOWNCQODCNURD-UHFFFAOYSA-N Sulfuric acid Chemical compound OS(O)(=O)=O QAOWNCQODCNURD-UHFFFAOYSA-N 0.000 description 2
- 208000031673 T-Cell Cutaneous Lymphoma Diseases 0.000 description 2
- 208000031672 T-Cell Peripheral Lymphoma Diseases 0.000 description 2
- 210000001744 T-lymphocyte Anatomy 0.000 description 2
- 108010076818 TEV protease Proteins 0.000 description 2
- 201000005485 Toxoplasmosis Diseases 0.000 description 2
- 102100027048 Transforming acidic coiled-coil-containing protein 3 Human genes 0.000 description 2
- 101710120248 Transforming acidic coiled-coil-containing protein 3 Proteins 0.000 description 2
- 239000007984 Tris EDTA buffer Substances 0.000 description 2
- 239000002250 absorbent Substances 0.000 description 2
- 230000002745 absorbent Effects 0.000 description 2
- 150000007513 acids Chemical class 0.000 description 2
- 230000001154 acute effect Effects 0.000 description 2
- 239000002671 adjuvant Substances 0.000 description 2
- 235000010443 alginic acid Nutrition 0.000 description 2
- 229920000615 alginic acid Polymers 0.000 description 2
- 125000003342 alkenyl group Chemical group 0.000 description 2
- 125000003545 alkoxy group Chemical group 0.000 description 2
- 125000003282 alkyl amino group Chemical group 0.000 description 2
- PNEYBMLMFCGWSK-UHFFFAOYSA-N aluminium oxide Inorganic materials [O-2].[O-2].[O-2].[Al+3].[Al+3] PNEYBMLMFCGWSK-UHFFFAOYSA-N 0.000 description 2
- 150000001412 amines Chemical class 0.000 description 2
- 229960000723 ampicillin Drugs 0.000 description 2
- 230000003321 amplification Effects 0.000 description 2
- 108010080146 androgen receptors Proteins 0.000 description 2
- 230000000078 anti-malarial effect Effects 0.000 description 2
- 239000003963 antioxidant agent Substances 0.000 description 2
- 235000006708 antioxidants Nutrition 0.000 description 2
- 239000012300 argon atmosphere Substances 0.000 description 2
- 238000002820 assay format Methods 0.000 description 2
- 238000003705 background correction Methods 0.000 description 2
- 239000002585 base Substances 0.000 description 2
- UHOVQNZJYSORNB-UHFFFAOYSA-N benzene Substances C1=CC=CC=C1 UHOVQNZJYSORNB-UHFFFAOYSA-N 0.000 description 2
- SRSXLGNVWSONIS-UHFFFAOYSA-N benzenesulfonic acid Chemical compound OS(=O)(=O)C1=CC=CC=C1 SRSXLGNVWSONIS-UHFFFAOYSA-N 0.000 description 2
- SIEXBOGDNOFGSE-UHFFFAOYSA-N benzyl n-[2-[2-(6-chlorohexoxy)ethoxy]ethyl]carbamate Chemical compound ClCCCCCCOCCOCCNC(=O)OCC1=CC=CC=C1 SIEXBOGDNOFGSE-UHFFFAOYSA-N 0.000 description 2
- WQZGKKKJIJFFOK-VFUOTHLCSA-N beta-D-glucose Chemical compound OC[C@H]1O[C@@H](O)[C@H](O)[C@@H](O)[C@@H]1O WQZGKKKJIJFFOK-VFUOTHLCSA-N 0.000 description 2
- 230000001588 bifunctional effect Effects 0.000 description 2
- 229960002685 biotin Drugs 0.000 description 2
- 235000020958 biotin Nutrition 0.000 description 2
- 239000011616 biotin Substances 0.000 description 2
- 229910052794 bromium Inorganic materials 0.000 description 2
- 238000011088 calibration curve Methods 0.000 description 2
- 239000011203 carbon fibre reinforced carbon Substances 0.000 description 2
- 239000001768 carboxy methyl cellulose Substances 0.000 description 2
- KQJSQWZMSAGSHN-JJWQIEBTSA-N celastrol Chemical compound C([C@H]1[C@]2(C)CC[C@@]34C)[C@](C)(C(O)=O)CC[C@]1(C)CC[C@]2(C)C4=CC=C1C3=CC(=O)C(O)=C1C KQJSQWZMSAGSHN-JJWQIEBTSA-N 0.000 description 2
- 230000008859 change Effects 0.000 description 2
- 230000000973 chemotherapeutic effect Effects 0.000 description 2
- 238000011278 co-treatment Methods 0.000 description 2
- 239000003086 colorant Substances 0.000 description 2
- 230000000052 comparative effect Effects 0.000 description 2
- 229940125877 compound 31 Drugs 0.000 description 2
- 239000012141 concentrate Substances 0.000 description 2
- 230000002596 correlated effect Effects 0.000 description 2
- 238000002447 crystallographic data Methods 0.000 description 2
- 201000007241 cutaneous T cell lymphoma Diseases 0.000 description 2
- 238000013480 data collection Methods 0.000 description 2
- 239000003599 detergent Substances 0.000 description 2
- 229910003460 diamond Inorganic materials 0.000 description 2
- 239000010432 diamond Substances 0.000 description 2
- 235000014113 dietary fatty acids Nutrition 0.000 description 2
- 230000008030 elimination Effects 0.000 description 2
- 239000003995 emulsifying agent Substances 0.000 description 2
- 108010038795 estrogen receptors Proteins 0.000 description 2
- OGPBJKLSAFTDLK-UHFFFAOYSA-N europium atom Chemical compound [Eu] OGPBJKLSAFTDLK-UHFFFAOYSA-N 0.000 description 2
- 229930195729 fatty acid Natural products 0.000 description 2
- 239000000194 fatty acid Substances 0.000 description 2
- 150000004665 fatty acids Chemical class 0.000 description 2
- FWVHWDSCPKXMDB-UHFFFAOYSA-N febrifugine dihydrochloride Natural products OC1CCCNC1CC(=O)CN1C(=O)C2=CC=CC=C2N=C1 FWVHWDSCPKXMDB-UHFFFAOYSA-N 0.000 description 2
- 239000000706 filtrate Substances 0.000 description 2
- 239000007850 fluorescent dye Substances 0.000 description 2
- 229910052731 fluorine Inorganic materials 0.000 description 2
- 238000011010 flushing procedure Methods 0.000 description 2
- 102000004632 fms-Like Tyrosine Kinase 3 Human genes 0.000 description 2
- 108010003374 fms-Like Tyrosine Kinase 3 Proteins 0.000 description 2
- 239000012634 fragment Substances 0.000 description 2
- 125000000524 functional group Chemical group 0.000 description 2
- 229920000159 gelatin Polymers 0.000 description 2
- 239000008273 gelatin Substances 0.000 description 2
- 235000019322 gelatine Nutrition 0.000 description 2
- 235000011852 gelatine desserts Nutrition 0.000 description 2
- 239000008103 glucose Substances 0.000 description 2
- 235000001727 glucose Nutrition 0.000 description 2
- 125000005456 glyceride group Chemical group 0.000 description 2
- 230000009036 growth inhibition Effects 0.000 description 2
- 210000003494 hepatocyte Anatomy 0.000 description 2
- 238000012203 high throughput assay Methods 0.000 description 2
- 239000000710 homodimer Substances 0.000 description 2
- IKDUDTNKRLTJSI-UHFFFAOYSA-N hydrazine hydrate Chemical compound O.NN IKDUDTNKRLTJSI-UHFFFAOYSA-N 0.000 description 2
- 239000000017 hydrogel Substances 0.000 description 2
- 239000001257 hydrogen Substances 0.000 description 2
- 229910052739 hydrogen Inorganic materials 0.000 description 2
- 125000004435 hydrogen atom Chemical group [H]* 0.000 description 2
- XMBWDFGMSWQBCA-UHFFFAOYSA-N hydrogen iodide Chemical compound I XMBWDFGMSWQBCA-UHFFFAOYSA-N 0.000 description 2
- 210000003692 ilium Anatomy 0.000 description 2
- 238000003384 imaging method Methods 0.000 description 2
- 229940127121 immunoconjugate Drugs 0.000 description 2
- 125000003392 indanyl group Chemical group C1(CCC2=CC=CC=C12)* 0.000 description 2
- 238000007689 inspection Methods 0.000 description 2
- 150000002500 ions Chemical class 0.000 description 2
- 150000002576 ketones Chemical class 0.000 description 2
- 210000003734 kidney Anatomy 0.000 description 2
- JVTAAEKCZFNVCJ-UHFFFAOYSA-N lactic acid Chemical compound CC(O)C(O)=O JVTAAEKCZFNVCJ-UHFFFAOYSA-N 0.000 description 2
- 230000007774 longterm Effects 0.000 description 2
- 230000028744 lysogeny Effects 0.000 description 2
- 239000004325 lysozyme Substances 0.000 description 2
- 235000010335 lysozyme Nutrition 0.000 description 2
- 229960000274 lysozyme Drugs 0.000 description 2
- HQKMJHAJHXVSDF-UHFFFAOYSA-L magnesium stearate Chemical compound [Mg+2].CCCCCCCCCCCCCCCCCC([O-])=O.CCCCCCCCCCCCCCCCCC([O-])=O HQKMJHAJHXVSDF-UHFFFAOYSA-L 0.000 description 2
- 239000011976 maleic acid Substances 0.000 description 2
- 238000013507 mapping Methods 0.000 description 2
- 239000002609 medium Substances 0.000 description 2
- QPJVMBTYPHYUOC-UHFFFAOYSA-N methyl benzoate Chemical compound COC(=O)C1=CC=CC=C1 QPJVMBTYPHYUOC-UHFFFAOYSA-N 0.000 description 2
- 150000007522 mineralic acids Chemical class 0.000 description 2
- 201000005962 mycosis fungoides Diseases 0.000 description 2
- 125000001624 naphthyl group Chemical group 0.000 description 2
- 229930014626 natural product Natural products 0.000 description 2
- 230000000626 neurodegenerative effect Effects 0.000 description 2
- 239000000346 nonvolatile oil Substances 0.000 description 2
- 238000003199 nucleic acid amplification method Methods 0.000 description 2
- 238000005457 optimization Methods 0.000 description 2
- FPOHNWQLNRZRFC-ZHACJKMWSA-N panobinostat Chemical compound CC=1NC2=CC=CC=C2C=1CCNCC1=CC=C(\C=C\C(=O)NO)C=C1 FPOHNWQLNRZRFC-ZHACJKMWSA-N 0.000 description 2
- 229960005184 panobinostat Drugs 0.000 description 2
- 230000036961 partial effect Effects 0.000 description 2
- 230000037361 pathway Effects 0.000 description 2
- 239000008188 pellet Substances 0.000 description 2
- 229960003330 pentetic acid Drugs 0.000 description 2
- 239000000137 peptide hydrolase inhibitor Substances 0.000 description 2
- 125000001997 phenyl group Chemical group [H]C1=C([H])C([H])=C(*)C([H])=C1[H] 0.000 description 2
- 125000000405 phenylalanyl group Chemical group 0.000 description 2
- NBIIXXVUZAFLBC-UHFFFAOYSA-K phosphate Chemical compound [O-]P([O-])([O-])=O NBIIXXVUZAFLBC-UHFFFAOYSA-K 0.000 description 2
- XKJCHHZQLQNZHY-UHFFFAOYSA-N phthalimide Chemical compound C1=CC=C2C(=O)NC(=O)C2=C1 XKJCHHZQLQNZHY-UHFFFAOYSA-N 0.000 description 2
- 239000013612 plasmid Substances 0.000 description 2
- 229940118768 plasmodium malariae Drugs 0.000 description 2
- 229920000642 polymer Polymers 0.000 description 2
- 230000004481 post-translational protein modification Effects 0.000 description 2
- 229910000027 potassium carbonate Inorganic materials 0.000 description 2
- 239000002243 precursor Substances 0.000 description 2
- 208000025638 primary cutaneous T-cell non-Hodgkin lymphoma Diseases 0.000 description 2
- 230000008569 process Effects 0.000 description 2
- 201000005825 prostate adenocarcinoma Diseases 0.000 description 2
- 108060006633 protein kinase Proteins 0.000 description 2
- 230000017854 proteolysis Effects 0.000 description 2
- 238000007420 radioactive assay Methods 0.000 description 2
- 230000002285 radioactive effect Effects 0.000 description 2
- 230000008261 resistance mechanism Effects 0.000 description 2
- YGSDEFSMJLZEOE-UHFFFAOYSA-N salicylic acid Chemical compound OC(=O)C1=CC=CC=C1O YGSDEFSMJLZEOE-UHFFFAOYSA-N 0.000 description 2
- 239000000741 silica gel Substances 0.000 description 2
- 229910002027 silica gel Inorganic materials 0.000 description 2
- RMAQACBXLXPBSY-UHFFFAOYSA-N silicic acid Chemical compound O[Si](O)(O)O RMAQACBXLXPBSY-UHFFFAOYSA-N 0.000 description 2
- 235000012239 silicon dioxide Nutrition 0.000 description 2
- 238000001542 size-exclusion chromatography Methods 0.000 description 2
- 229910052708 sodium Inorganic materials 0.000 description 2
- 235000009518 sodium iodide Nutrition 0.000 description 2
- 238000001228 spectrum Methods 0.000 description 2
- 210000003046 sporozoite Anatomy 0.000 description 2
- 239000007921 spray Substances 0.000 description 2
- 238000003756 stirring Methods 0.000 description 2
- 238000003860 storage Methods 0.000 description 2
- NVBFHJWHLNUMCV-UHFFFAOYSA-N sulfamide Chemical compound NS(N)(=O)=O NVBFHJWHLNUMCV-UHFFFAOYSA-N 0.000 description 2
- 239000004094 surface-active agent Substances 0.000 description 2
- 239000002562 thickening agent Substances 0.000 description 2
- UMGDCJDMYOKAJW-UHFFFAOYSA-N thiourea Chemical compound NC(N)=S UMGDCJDMYOKAJW-UHFFFAOYSA-N 0.000 description 2
- 230000036964 tight binding Effects 0.000 description 2
- 238000011200 topical administration Methods 0.000 description 2
- UNXRWKVEANCORM-UHFFFAOYSA-N triphosphoric acid Chemical compound OP(O)(=O)OP(O)(=O)OP(O)(O)=O UNXRWKVEANCORM-UHFFFAOYSA-N 0.000 description 2
- 239000013598 vector Substances 0.000 description 2
- 231100000747 viability assay Toxicity 0.000 description 2
- 238000003026 viability measurement method Methods 0.000 description 2
- 238000003260 vortexing Methods 0.000 description 2
- 230000003442 weekly effect Effects 0.000 description 2
- 239000000080 wetting agent Substances 0.000 description 2
- FATJLEZSGFVHQA-CABZTGNLSA-N (2,5-dioxopyrrolidin-1-yl) (2s,3s)-3-methyl-2-[(2-methylpropan-2-yl)oxycarbonylamino]pentanoate Chemical compound CC(C)(C)OC(=O)N[C@@H]([C@@H](C)CC)C(=O)ON1C(=O)CCC1=O FATJLEZSGFVHQA-CABZTGNLSA-N 0.000 description 1
- 125000004191 (C1-C6) alkoxy group Chemical group 0.000 description 1
- WRIDQFICGBMAFQ-UHFFFAOYSA-N (E)-8-Octadecenoic acid Natural products CCCCCCCCCC=CCCCCCCC(O)=O WRIDQFICGBMAFQ-UHFFFAOYSA-N 0.000 description 1
- 125000005919 1,2,2-trimethylpropyl group Chemical group 0.000 description 1
- 125000004502 1,2,3-oxadiazolyl group Chemical group 0.000 description 1
- 125000004511 1,2,3-thiadiazolyl group Chemical group 0.000 description 1
- 125000004514 1,2,4-thiadiazolyl group Chemical group 0.000 description 1
- 125000001376 1,2,4-triazolyl group Chemical group N1N=C(N=C1)* 0.000 description 1
- 125000001781 1,3,4-oxadiazolyl group Chemical group 0.000 description 1
- 125000004520 1,3,4-thiadiazolyl group Chemical group 0.000 description 1
- CGHIBGNXEGJPQZ-UHFFFAOYSA-N 1-hexyne Chemical compound CCCCC#C CGHIBGNXEGJPQZ-UHFFFAOYSA-N 0.000 description 1
- IIZPXYDJLKNOIY-JXPKJXOSSA-N 1-palmitoyl-2-arachidonoyl-sn-glycero-3-phosphocholine Chemical compound CCCCCCCCCCCCCCCC(=O)OC[C@H](COP([O-])(=O)OCC[N+](C)(C)C)OC(=O)CCC\C=C/C\C=C/C\C=C/C\C=C/CCCCC IIZPXYDJLKNOIY-JXPKJXOSSA-N 0.000 description 1
- QWENRTYMTSOGBR-UHFFFAOYSA-N 1H-1,2,3-Triazole Chemical compound C=1C=NNN=1 QWENRTYMTSOGBR-UHFFFAOYSA-N 0.000 description 1
- YBYIRNPNPLQARY-UHFFFAOYSA-N 1H-indene Natural products C1=CC=C2CC=CC2=C1 YBYIRNPNPLQARY-UHFFFAOYSA-N 0.000 description 1
- QXYLYYZZWZQACI-UHFFFAOYSA-N 2,3,4,5-tetrafluorophenol Chemical compound OC1=CC(F)=C(F)C(F)=C1F QXYLYYZZWZQACI-UHFFFAOYSA-N 0.000 description 1
- HCSBTDBGTNZOAB-UHFFFAOYSA-N 2,3-dinitrobenzoic acid Chemical compound OC(=O)C1=CC=CC([N+]([O-])=O)=C1[N+]([O-])=O HCSBTDBGTNZOAB-UHFFFAOYSA-N 0.000 description 1
- CHHHXKFHOYLYRE-UHFFFAOYSA-M 2,4-Hexadienoic acid, potassium salt (1:1), (2E,4E)- Chemical compound [K+].CC=CC=CC([O-])=O CHHHXKFHOYLYRE-UHFFFAOYSA-M 0.000 description 1
- LMHHFZAXSANGGM-UHFFFAOYSA-N 2-aminoindane Chemical compound C1=CC=C2CC(N)CC2=C1 LMHHFZAXSANGGM-UHFFFAOYSA-N 0.000 description 1
- XWKFPIODWVPXLX-UHFFFAOYSA-N 2-methyl-5-methylpyridine Natural products CC1=CC=C(C)N=C1 XWKFPIODWVPXLX-UHFFFAOYSA-N 0.000 description 1
- 125000004493 2-methylbut-1-yl group Chemical group CC(C*)CC 0.000 description 1
- LQJBNNIYVWPHFW-UHFFFAOYSA-N 20:1omega9c fatty acid Natural products CCCCCCCCCCC=CCCCCCCCC(O)=O LQJBNNIYVWPHFW-UHFFFAOYSA-N 0.000 description 1
- VHMICKWLTGFITH-UHFFFAOYSA-N 2H-isoindole Chemical compound C1=CC=CC2=CNC=C21 VHMICKWLTGFITH-UHFFFAOYSA-N 0.000 description 1
- WEVYNIUIFUYDGI-UHFFFAOYSA-N 3-[6-[4-(trifluoromethoxy)anilino]-4-pyrimidinyl]benzamide Chemical compound NC(=O)C1=CC=CC(C=2N=CN=C(NC=3C=CC(OC(F)(F)F)=CC=3)C=2)=C1 WEVYNIUIFUYDGI-UHFFFAOYSA-N 0.000 description 1
- ZAGZIOYVEIDDJA-UHFFFAOYSA-N 3-aminopyrazine-2-carboxylic acid Chemical compound NC1=NC=CN=C1C(O)=O ZAGZIOYVEIDDJA-UHFFFAOYSA-N 0.000 description 1
- PXACTUVBBMDKRW-UHFFFAOYSA-N 4-bromobenzenesulfonic acid Chemical compound OS(=O)(=O)C1=CC=C(Br)C=C1 PXACTUVBBMDKRW-UHFFFAOYSA-N 0.000 description 1
- 229960000549 4-dimethylaminophenol Drugs 0.000 description 1
- OBKXEAXTFZPCHS-UHFFFAOYSA-N 4-phenylbutyric acid Chemical compound OC(=O)CCCC1=CC=CC=C1 OBKXEAXTFZPCHS-UHFFFAOYSA-N 0.000 description 1
- JYCQQPHGFMYQCF-UHFFFAOYSA-N 4-tert-Octylphenol monoethoxylate Chemical compound CC(C)(C)CC(C)(C)C1=CC=C(OCCO)C=C1 JYCQQPHGFMYQCF-UHFFFAOYSA-N 0.000 description 1
- 102100023990 60S ribosomal protein L17 Human genes 0.000 description 1
- HBAQYPYDRFILMT-UHFFFAOYSA-N 8-[3-(1-cyclopropylpyrazol-4-yl)-1H-pyrazolo[4,3-d]pyrimidin-5-yl]-3-methyl-3,8-diazabicyclo[3.2.1]octan-2-one Chemical class C1(CC1)N1N=CC(=C1)C1=NNC2=C1N=C(N=C2)N1C2C(N(CC1CC2)C)=O HBAQYPYDRFILMT-UHFFFAOYSA-N 0.000 description 1
- QSBYPNXLFMSGKH-UHFFFAOYSA-N 9-Heptadecensaeure Natural products CCCCCCCC=CCCCCCCCC(O)=O QSBYPNXLFMSGKH-UHFFFAOYSA-N 0.000 description 1
- WRDABNWSWOHGMS-UHFFFAOYSA-N AEBSF hydrochloride Chemical compound Cl.NCCC1=CC=C(S(F)(=O)=O)C=C1 WRDABNWSWOHGMS-UHFFFAOYSA-N 0.000 description 1
- 108091006112 ATPases Proteins 0.000 description 1
- QTBSBXVTEAMEQO-UHFFFAOYSA-M Acetate Chemical compound CC([O-])=O QTBSBXVTEAMEQO-UHFFFAOYSA-M 0.000 description 1
- NIXOWILDQLNWCW-UHFFFAOYSA-M Acrylate Chemical compound [O-]C(=O)C=C NIXOWILDQLNWCW-UHFFFAOYSA-M 0.000 description 1
- 208000031261 Acute myeloid leukaemia Diseases 0.000 description 1
- 208000010507 Adenocarcinoma of Lung Diseases 0.000 description 1
- 206010052747 Adenocarcinoma pancreas Diseases 0.000 description 1
- 102000057290 Adenosine Triphosphatases Human genes 0.000 description 1
- 208000000230 African Trypanosomiasis Diseases 0.000 description 1
- 229920001817 Agar Polymers 0.000 description 1
- 206010001497 Agitation Diseases 0.000 description 1
- 239000012114 Alexa Fluor 647 Substances 0.000 description 1
- 102100026882 Alpha-synuclein Human genes 0.000 description 1
- 238000012815 AlphaLISA Methods 0.000 description 1
- 239000005995 Aluminium silicate Substances 0.000 description 1
- 206010001935 American trypanosomiasis Diseases 0.000 description 1
- 102100032187 Androgen receptor Human genes 0.000 description 1
- 241000256186 Anopheles <genus> Species 0.000 description 1
- 102100021569 Apoptosis regulator Bcl-2 Human genes 0.000 description 1
- 241000039087 Apostates Species 0.000 description 1
- 241000416162 Astragalus gummifer Species 0.000 description 1
- 102100021631 B-cell lymphoma 6 protein Human genes 0.000 description 1
- 102100022005 B-lymphocyte antigen CD20 Human genes 0.000 description 1
- 108010074708 B7-H1 Antigen Proteins 0.000 description 1
- 102000008096 B7-H1 Antigen Human genes 0.000 description 1
- 108091012583 BCL2 Proteins 0.000 description 1
- 241000894006 Bacteria Species 0.000 description 1
- 108010077805 Bacterial Proteins Proteins 0.000 description 1
- TXGZJQLMVSIZEI-UQMAOPSPSA-N Bardoxolone Chemical compound C1=C(C#N)C(=O)C(C)(C)[C@@H]2CC[C@@]3(C)[C@]4(C)CC[C@@]5(C(O)=O)CCC(C)(C)C[C@H]5[C@H]4C(=O)C=C3[C@]21C TXGZJQLMVSIZEI-UQMAOPSPSA-N 0.000 description 1
- 239000005711 Benzoic acid Substances 0.000 description 1
- LSNNMFCWUKXFEE-UHFFFAOYSA-M Bisulfite Chemical compound OS([O-])=O LSNNMFCWUKXFEE-UHFFFAOYSA-M 0.000 description 1
- 241000283690 Bos taurus Species 0.000 description 1
- CPELXLSAUQHCOX-UHFFFAOYSA-M Bromide Chemical compound [Br-] CPELXLSAUQHCOX-UHFFFAOYSA-M 0.000 description 1
- 102100033641 Bromodomain-containing protein 2 Human genes 0.000 description 1
- 102100033642 Bromodomain-containing protein 3 Human genes 0.000 description 1
- 102100029897 Bromodomain-containing protein 7 Human genes 0.000 description 1
- 102100029893 Bromodomain-containing protein 9 Human genes 0.000 description 1
- 241000195940 Bryophyta Species 0.000 description 1
- 102100032367 C-C motif chemokine 5 Human genes 0.000 description 1
- QZTDCJDOQCOISU-WUMBASEESA-N CC(C)(C)OC(N(CCC1)[C@@H]1C(NS(NC[C@H]([C@H]1OC(C)(C)O[C@H]11)O[C@H]1N1C2=NC=NC(N)=C2N=C1)(=O)=O)=O)=O Chemical compound CC(C)(C)OC(N(CCC1)[C@@H]1C(NS(NC[C@H]([C@H]1OC(C)(C)O[C@H]11)O[C@H]1N1C2=NC=NC(N)=C2N=C1)(=O)=O)=O)=O QZTDCJDOQCOISU-WUMBASEESA-N 0.000 description 1
- XFAMRABPTSHWDL-UHFFFAOYSA-N CC(C)(C)OC(NCCCCCC(NC(CC1)CCN1C(NC1=NC=CN=C1C(NC1CC2=CC=CC=C2C1)=O)=O)=O)=O Chemical compound CC(C)(C)OC(NCCCCCC(NC(CC1)CCN1C(NC1=NC=CN=C1C(NC1CC2=CC=CC=C2C1)=O)=O)=O)=O XFAMRABPTSHWDL-UHFFFAOYSA-N 0.000 description 1
- HVHAIOJBWOHOQO-UHFFFAOYSA-N CC(C)(C)OC(NCCOCCOCCCCCCI)=O Chemical compound CC(C)(C)OC(NCCOCCOCCCCCCI)=O HVHAIOJBWOHOQO-UHFFFAOYSA-N 0.000 description 1
- OPZKOLAIYPCTPS-PTGPVQHPSA-N CC(C)(C)OC(NCCOCCOCCCCCCN(C[C@H]([C@H]1OC(C)(C)O[C@H]11)O[C@H]1N1C2=NC=NC(N)=C2N=C1)S(N)(=O)=O)=O Chemical compound CC(C)(C)OC(NCCOCCOCCCCCCN(C[C@H]([C@H]1OC(C)(C)O[C@H]11)O[C@H]1N1C2=NC=NC(N)=C2N=C1)S(N)(=O)=O)=O OPZKOLAIYPCTPS-PTGPVQHPSA-N 0.000 description 1
- XHRUZGJWTUDIBC-CTDWIVFPSA-N CC1(C)O[C@H]2[C@H](N3C4=NC=NC(N)=C4N=C3)O[C@H](CN(CCCCCCOCCOCCNC(OCC3=CC=CC=C3)=O)S(N)(=O)=O)[C@H]2O1 Chemical compound CC1(C)O[C@H]2[C@H](N3C4=NC=NC(N)=C4N=C3)O[C@H](CN(CCCCCCOCCOCCNC(OCC3=CC=CC=C3)=O)S(N)(=O)=O)[C@H]2O1 XHRUZGJWTUDIBC-CTDWIVFPSA-N 0.000 description 1
- JPNNEJZGILHRIB-CTDWIVFPSA-N CC1(C)O[C@H]2[C@H](N3C4=NC=NC(N)=C4N=C3)O[C@H](CNCCCCCCOCCOCCNC(OCC3=CC=CC=C3)=O)[C@H]2O1 Chemical compound CC1(C)O[C@H]2[C@H](N3C4=NC=NC(N)=C4N=C3)O[C@H](CNCCCCCCOCCOCCNC(OCC3=CC=CC=C3)=O)[C@H]2O1 JPNNEJZGILHRIB-CTDWIVFPSA-N 0.000 description 1
- BQXUPNKLZNSUMC-YUQWMIPFSA-N CCN(CCCCCOCC(=O)N[C@H](C(=O)N1C[C@H](O)C[C@H]1C(=O)N[C@@H](C)c1ccc(cc1)-c1scnc1C)C(C)(C)C)CCOc1ccc(cc1)C(=O)c1c(sc2cc(O)ccc12)-c1ccc(O)cc1 Chemical compound CCN(CCCCCOCC(=O)N[C@H](C(=O)N1C[C@H](O)C[C@H]1C(=O)N[C@@H](C)c1ccc(cc1)-c1scnc1C)C(C)(C)C)CCOc1ccc(cc1)C(=O)c1c(sc2cc(O)ccc12)-c1ccc(O)cc1 BQXUPNKLZNSUMC-YUQWMIPFSA-N 0.000 description 1
- 102100032912 CD44 antigen Human genes 0.000 description 1
- PCBZRNYXXCIELG-WYFCWLEVSA-N COC1=CC=C(C[C@H](NC(=O)OC2CCCC3(C2)OOC2(O3)C3CC4CC(C3)CC2C4)C(=O)N[C@@H]2[C@@H](CO)O[C@H]([C@@H]2O)N2C=NC3=C2N=CN=C3N(C)C)C=C1 Chemical compound COC1=CC=C(C[C@H](NC(=O)OC2CCCC3(C2)OOC2(O3)C3CC4CC(C3)CC2C4)C(=O)N[C@@H]2[C@@H](CO)O[C@H]([C@@H]2O)N2C=NC3=C2N=CN=C3N(C)C)C=C1 PCBZRNYXXCIELG-WYFCWLEVSA-N 0.000 description 1
- 208000025721 COVID-19 Diseases 0.000 description 1
- 108010021064 CTLA-4 Antigen Proteins 0.000 description 1
- 102000008203 CTLA-4 Antigen Human genes 0.000 description 1
- 229940045513 CTLA4 antagonist Drugs 0.000 description 1
- 101000715943 Caenorhabditis elegans Cyclin-dependent kinase 4 homolog Proteins 0.000 description 1
- 101100001077 Caenorhabditis elegans rpn-13 gene Proteins 0.000 description 1
- 101100510617 Caenorhabditis elegans sel-8 gene Proteins 0.000 description 1
- OYPRJOBELJOOCE-UHFFFAOYSA-N Calcium Chemical compound [Ca] OYPRJOBELJOOCE-UHFFFAOYSA-N 0.000 description 1
- 241000282472 Canis lupus familiaris Species 0.000 description 1
- 229920002134 Carboxymethyl cellulose Polymers 0.000 description 1
- 201000009030 Carcinoma Diseases 0.000 description 1
- 208000017897 Carcinoma of esophagus Diseases 0.000 description 1
- 102000000844 Cell Surface Receptors Human genes 0.000 description 1
- 102100038503 Cellular retinoic acid-binding protein 1 Human genes 0.000 description 1
- 208000035484 Cellulite Diseases 0.000 description 1
- 208000024699 Chagas disease Diseases 0.000 description 1
- 108010012236 Chemokines Proteins 0.000 description 1
- 102000019034 Chemokines Human genes 0.000 description 1
- 241001502567 Chikungunya virus Species 0.000 description 1
- VEXZGXHMUGYJMC-UHFFFAOYSA-M Chloride anion Chemical compound [Cl-] VEXZGXHMUGYJMC-UHFFFAOYSA-M 0.000 description 1
- 201000009047 Chordoma Diseases 0.000 description 1
- 208000005590 Choroidal Neovascularization Diseases 0.000 description 1
- 206010060823 Choroidal neovascularisation Diseases 0.000 description 1
- VYZAMTAEIAYCRO-UHFFFAOYSA-N Chromium Chemical compound [Cr] VYZAMTAEIAYCRO-UHFFFAOYSA-N 0.000 description 1
- 208000006545 Chronic Obstructive Pulmonary Disease Diseases 0.000 description 1
- KRKNYBCHXYNGOX-UHFFFAOYSA-K Citrate Chemical compound [O-]C(=O)CC(O)(CC([O-])=O)C([O-])=O KRKNYBCHXYNGOX-UHFFFAOYSA-K 0.000 description 1
- 208000030808 Clear cell renal carcinoma Diseases 0.000 description 1
- 125000006605 Cn-m alkenyl group Chemical group 0.000 description 1
- 241000689227 Cora <basidiomycete fungus> Species 0.000 description 1
- 229920002261 Corn starch Polymers 0.000 description 1
- 208000011231 Crohn disease Diseases 0.000 description 1
- 102000004127 Cytokines Human genes 0.000 description 1
- 108090000695 Cytokines Proteins 0.000 description 1
- RGHNJXZEOKUKBD-UHFFFAOYSA-N D-gluconic acid Natural products OCC(O)C(O)C(O)C(O)C(O)=O RGHNJXZEOKUKBD-UHFFFAOYSA-N 0.000 description 1
- HMFHBZSHGGEWLO-SOOFDHNKSA-N D-ribofuranose Chemical compound OC[C@H]1OC(O)[C@H](O)[C@@H]1O HMFHBZSHGGEWLO-SOOFDHNKSA-N 0.000 description 1
- 102000053602 DNA Human genes 0.000 description 1
- 101100457345 Danio rerio mapk14a gene Proteins 0.000 description 1
- 101100457347 Danio rerio mapk14b gene Proteins 0.000 description 1
- 208000001490 Dengue Diseases 0.000 description 1
- 206010012310 Dengue fever Diseases 0.000 description 1
- 241000725619 Dengue virus Species 0.000 description 1
- 101000876610 Dictyostelium discoideum Extracellular signal-regulated kinase 2 Proteins 0.000 description 1
- XBPCUCUWBYBCDP-UHFFFAOYSA-N Dicyclohexylamine Chemical compound C1CCCCC1NC1CCCCC1 XBPCUCUWBYBCDP-UHFFFAOYSA-N 0.000 description 1
- 108010052167 Dihydroorotate Dehydrogenase Proteins 0.000 description 1
- 102100032823 Dihydroorotate dehydrogenase (quinone), mitochondrial Human genes 0.000 description 1
- QXNVGIXVLWOKEQ-UHFFFAOYSA-N Disodium Chemical compound [Na][Na] QXNVGIXVLWOKEQ-UHFFFAOYSA-N 0.000 description 1
- 208000003556 Dry Eye Syndromes Diseases 0.000 description 1
- 206010013774 Dry eye Diseases 0.000 description 1
- 206010013801 Duchenne Muscular Dystrophy Diseases 0.000 description 1
- 229910052692 Dysprosium Inorganic materials 0.000 description 1
- 238000012286 ELISA Assay Methods 0.000 description 1
- 108010032363 ERRalpha estrogen-related receptor Proteins 0.000 description 1
- 241000283086 Equidae Species 0.000 description 1
- 241001198387 Escherichia coli BL21(DE3) Species 0.000 description 1
- PIICEJLVQHRZGT-UHFFFAOYSA-N Ethylenediamine Chemical compound NCCN PIICEJLVQHRZGT-UHFFFAOYSA-N 0.000 description 1
- 241000282326 Felis catus Species 0.000 description 1
- 239000004606 Fillers/Extenders Substances 0.000 description 1
- BDAGIHXWWSANSR-UHFFFAOYSA-M Formate Chemical compound [O-]C=O BDAGIHXWWSANSR-UHFFFAOYSA-M 0.000 description 1
- 241000233866 Fungi Species 0.000 description 1
- 108091092584 GDNA Proteins 0.000 description 1
- 102000013446 GTP Phosphohydrolases Human genes 0.000 description 1
- 108091006109 GTPases Proteins 0.000 description 1
- IAJILQKETJEXLJ-UHFFFAOYSA-N Galacturonsaeure Natural products O=CC(O)C(O)C(O)C(O)C(O)=O IAJILQKETJEXLJ-UHFFFAOYSA-N 0.000 description 1
- 241000206672 Gelidium Species 0.000 description 1
- 208000032320 Germ cell tumor of testis Diseases 0.000 description 1
- 201000010915 Glioblastoma multiforme Diseases 0.000 description 1
- AEMRFAOFKBGASW-UHFFFAOYSA-M Glycolate Chemical compound OCC([O-])=O AEMRFAOFKBGASW-UHFFFAOYSA-M 0.000 description 1
- 208000009329 Graft vs Host Disease Diseases 0.000 description 1
- 102100034458 Hepatitis A virus cellular receptor 2 Human genes 0.000 description 1
- 102000008157 Histone Demethylases Human genes 0.000 description 1
- 108010074870 Histone Demethylases Proteins 0.000 description 1
- 102100039999 Histone deacetylase 2 Human genes 0.000 description 1
- 102100021455 Histone deacetylase 3 Human genes 0.000 description 1
- 102100021453 Histone deacetylase 5 Human genes 0.000 description 1
- 102100022537 Histone deacetylase 6 Human genes 0.000 description 1
- 102100038715 Histone deacetylase 8 Human genes 0.000 description 1
- 101000971234 Homo sapiens B-cell lymphoma 6 protein Proteins 0.000 description 1
- 101000897405 Homo sapiens B-lymphocyte antigen CD20 Proteins 0.000 description 1
- 101000871850 Homo sapiens Bromodomain-containing protein 2 Proteins 0.000 description 1
- 101000871851 Homo sapiens Bromodomain-containing protein 3 Proteins 0.000 description 1
- 101000794024 Homo sapiens Bromodomain-containing protein 4 Proteins 0.000 description 1
- 101000794019 Homo sapiens Bromodomain-containing protein 7 Proteins 0.000 description 1
- 101000794032 Homo sapiens Bromodomain-containing protein 9 Proteins 0.000 description 1
- 101000797762 Homo sapiens C-C motif chemokine 5 Proteins 0.000 description 1
- 101000868273 Homo sapiens CD44 antigen Proteins 0.000 description 1
- 101001068133 Homo sapiens Hepatitis A virus cellular receptor 2 Proteins 0.000 description 1
- 101001035011 Homo sapiens Histone deacetylase 2 Proteins 0.000 description 1
- 101000899282 Homo sapiens Histone deacetylase 3 Proteins 0.000 description 1
- 101000899255 Homo sapiens Histone deacetylase 5 Proteins 0.000 description 1
- 101000899330 Homo sapiens Histone deacetylase 6 Proteins 0.000 description 1
- 101001032113 Homo sapiens Histone deacetylase 7 Proteins 0.000 description 1
- 101001032118 Homo sapiens Histone deacetylase 8 Proteins 0.000 description 1
- 101001032092 Homo sapiens Histone deacetylase 9 Proteins 0.000 description 1
- 101000868279 Homo sapiens Leukocyte surface antigen CD47 Proteins 0.000 description 1
- 101000615488 Homo sapiens Methyl-CpG-binding domain protein 2 Proteins 0.000 description 1
- 101001052493 Homo sapiens Mitogen-activated protein kinase 1 Proteins 0.000 description 1
- 101000588302 Homo sapiens Nuclear factor erythroid 2-related factor 2 Proteins 0.000 description 1
- 101000695548 Homo sapiens Probable proline-tRNA ligase, mitochondrial Proteins 0.000 description 1
- 101000881168 Homo sapiens SPARC Proteins 0.000 description 1
- 101000835998 Homo sapiens SRA stem-loop-interacting RNA-binding protein, mitochondrial Proteins 0.000 description 1
- 101000864342 Homo sapiens Tyrosine-protein kinase BTK Proteins 0.000 description 1
- 102000008100 Human Serum Albumin Human genes 0.000 description 1
- 108091006905 Human Serum Albumin Proteins 0.000 description 1
- 208000022559 Inflammatory bowel disease Diseases 0.000 description 1
- 102100036015 Isoleucine-tRNA ligase, cytoplasmic Human genes 0.000 description 1
- 101150116862 KEAP1 gene Proteins 0.000 description 1
- 229930182816 L-glutamine Natural products 0.000 description 1
- DNVXATUJJDPFDM-UHFFFAOYSA-N LSM-6732 Chemical compound C1=2C(C)=C(C)SC=2N2C(C)=NN=C2C(CC(=O)OC(C)(C)C)N=C1C1=CC=C(Cl)C=C1 DNVXATUJJDPFDM-UHFFFAOYSA-N 0.000 description 1
- JVTAAEKCZFNVCJ-UHFFFAOYSA-M Lactate Chemical compound CC(O)C([O-])=O JVTAAEKCZFNVCJ-UHFFFAOYSA-M 0.000 description 1
- 208000031671 Large B-Cell Diffuse Lymphoma Diseases 0.000 description 1
- 102100032913 Leukocyte surface antigen CD47 Human genes 0.000 description 1
- 239000000232 Lipid Bilayer Substances 0.000 description 1
- WHXSMMKQMYFTQS-UHFFFAOYSA-N Lithium Chemical compound [Li] WHXSMMKQMYFTQS-UHFFFAOYSA-N 0.000 description 1
- 239000006137 Luria-Bertani broth Substances 0.000 description 1
- 102000019149 MAP kinase activity proteins Human genes 0.000 description 1
- 108040008097 MAP kinase activity proteins Proteins 0.000 description 1
- 239000007993 MOPS buffer Substances 0.000 description 1
- FYYHWMGAXLPEAU-UHFFFAOYSA-N Magnesium Chemical compound [Mg] FYYHWMGAXLPEAU-UHFFFAOYSA-N 0.000 description 1
- OFOBLEOULBTSOW-UHFFFAOYSA-L Malonate Chemical compound [O-]C(=O)CC([O-])=O OFOBLEOULBTSOW-UHFFFAOYSA-L 0.000 description 1
- 240000003183 Manihot esculenta Species 0.000 description 1
- 235000016735 Manihot esculenta subsp esculenta Nutrition 0.000 description 1
- 101150003941 Mapk14 gene Proteins 0.000 description 1
- 206010027406 Mesothelioma Diseases 0.000 description 1
- 102100021299 Methyl-CpG-binding domain protein 2 Human genes 0.000 description 1
- 102000016397 Methyltransferase Human genes 0.000 description 1
- 108060004795 Methyltransferase Proteins 0.000 description 1
- 241001314546 Microtis <orchid> Species 0.000 description 1
- 102100024193 Mitogen-activated protein kinase 1 Human genes 0.000 description 1
- 102100023482 Mitogen-activated protein kinase 14 Human genes 0.000 description 1
- 102000054819 Mitogen-activated protein kinase 14 Human genes 0.000 description 1
- 239000004909 Moisturizer Substances 0.000 description 1
- 208000034578 Multiple myelomas Diseases 0.000 description 1
- 102000007474 Multiprotein Complexes Human genes 0.000 description 1
- 108010085220 Multiprotein Complexes Proteins 0.000 description 1
- 241000699670 Mus sp. Species 0.000 description 1
- 241000186359 Mycobacterium Species 0.000 description 1
- 241000187479 Mycobacterium tuberculosis Species 0.000 description 1
- 208000033776 Myeloid Acute Leukemia Diseases 0.000 description 1
- FXHOOIRPVKKKFG-UHFFFAOYSA-N N,N-Dimethylacetamide Chemical compound CN(C)C(C)=O FXHOOIRPVKKKFG-UHFFFAOYSA-N 0.000 description 1
- 102000010722 N-Glycosyl Hydrolases Human genes 0.000 description 1
- 108010063372 N-Glycosyl Hydrolases Proteins 0.000 description 1
- WWGBHDIHIVGYLZ-UHFFFAOYSA-N N-[4-[3-[[[7-(hydroxyamino)-7-oxoheptyl]amino]-oxomethyl]-5-isoxazolyl]phenyl]carbamic acid tert-butyl ester Chemical compound C1=CC(NC(=O)OC(C)(C)C)=CC=C1C1=CC(C(=O)NCCCCCCC(=O)NO)=NO1 WWGBHDIHIVGYLZ-UHFFFAOYSA-N 0.000 description 1
- UEEJHVSXFDXPFK-UHFFFAOYSA-N N-dimethylaminoethanol Chemical compound CN(C)CCO UEEJHVSXFDXPFK-UHFFFAOYSA-N 0.000 description 1
- MBBZMMPHUWSWHV-BDVNFPICSA-N N-methylglucamine Chemical compound CNC[C@H](O)[C@@H](O)[C@H](O)[C@H](O)CO MBBZMMPHUWSWHV-BDVNFPICSA-N 0.000 description 1
- 150000001204 N-oxides Chemical class 0.000 description 1
- ZLEXLLSKDRSRMX-DQTVKBRSSA-N NCCOCCOCCCCCCN(C[C@H]([C@H]([C@H]1O)O)O[C@H]1N1C2=NC=NC(N)=C2N=C1)S(NC([C@H](CC1=CC=CC=C1)N)=O)(=O)=O Chemical compound NCCOCCOCCCCCCN(C[C@H]([C@H]([C@H]1O)O)O[C@H]1N1C2=NC=NC(N)=C2N=C1)S(NC([C@H](CC1=CC=CC=C1)N)=O)(=O)=O ZLEXLLSKDRSRMX-DQTVKBRSSA-N 0.000 description 1
- QIZQULYENOOLAH-PJBGZOMASA-N NCCOCCOCCCCCCN(C[C@H]([C@H]([C@H]1O)O)O[C@H]1N1C2=NC=NC(N)=C2N=C1)S(NC([C@H]1NCCC1)=O)(=O)=O Chemical compound NCCOCCOCCCCCCN(C[C@H]([C@H]([C@H]1O)O)O[C@H]1N1C2=NC=NC(N)=C2N=C1)S(NC([C@H]1NCCC1)=O)(=O)=O QIZQULYENOOLAH-PJBGZOMASA-N 0.000 description 1
- 102100031911 NEDD8 Human genes 0.000 description 1
- 108700004934 NEDD8 Proteins 0.000 description 1
- 101150107958 NEDD8 gene Proteins 0.000 description 1
- STQZXOGLEAHFHH-LZNZEIKDSA-N N[C@@]([C@@]1(O)S(N)(=O)=O)(N2C(N=CN=C3N)=C3N=C2)O[C@H](CO)[C@H]1O Chemical compound N[C@@]([C@@]1(O)S(N)(=O)=O)(N2C(N=CN=C3N)=C3N=C2)O[C@H](CO)[C@H]1O STQZXOGLEAHFHH-LZNZEIKDSA-N 0.000 description 1
- 239000000020 Nitrocellulose Substances 0.000 description 1
- 102100031701 Nuclear factor erythroid 2-related factor 2 Human genes 0.000 description 1
- 101710163270 Nuclease Proteins 0.000 description 1
- YXVZSRVITWERHY-UHFFFAOYSA-N O=C(NCCOCCOCCCCCCI)OCC1=CC=CC=C1 Chemical compound O=C(NCCOCCOCCCCCCI)OCC1=CC=CC=C1 YXVZSRVITWERHY-UHFFFAOYSA-N 0.000 description 1
- ZDFMGZGZVIOGCH-FQEVSTJZSA-N O=C([C@H]1NCCC1)NC(CC1)CCN1C(NC1=NC=CN=C1C(NC1CC2=CC=CC=C2C1)=O)=O Chemical compound O=C([C@H]1NCCC1)NC(CC1)CCN1C(NC1=NC=CN=C1C(NC1CC2=CC=CC=C2C1)=O)=O ZDFMGZGZVIOGCH-FQEVSTJZSA-N 0.000 description 1
- LWLYDJUTVWPRRI-UHFFFAOYSA-N OC(C(C=CC(NC(NCCCCCC(NCC(CC1)CCN1C(NC1=NC=CN=C1C(NC1CC2=CC=CC=C2C1)=O)=O)=O)=S)=C1)=C1C(C(C(O1)=C2)=CC=C2O)=C(C=C2)C1=CC2=O)=O Chemical compound OC(C(C=CC(NC(NCCCCCC(NCC(CC1)CCN1C(NC1=NC=CN=C1C(NC1CC2=CC=CC=C2C1)=O)=O)=O)=S)=C1)=C1C(C(C(O1)=C2)=CC=C2O)=C(C=C2)C1=CC2=O)=O LWLYDJUTVWPRRI-UHFFFAOYSA-N 0.000 description 1
- 208000008589 Obesity Diseases 0.000 description 1
- 206010030155 Oesophageal carcinoma Diseases 0.000 description 1
- 239000005642 Oleic acid Substances 0.000 description 1
- ZQPPMHVWECSIRJ-UHFFFAOYSA-N Oleic acid Natural products CCCCCCCCC=CCCCCCCCC(O)=O ZQPPMHVWECSIRJ-UHFFFAOYSA-N 0.000 description 1
- 239000012124 Opti-MEM Substances 0.000 description 1
- 101100532088 Oryza sativa subsp. japonica RUB2 gene Proteins 0.000 description 1
- 101100532090 Oryza sativa subsp. japonica RUB3 gene Proteins 0.000 description 1
- 238000012408 PCR amplification Methods 0.000 description 1
- 102000025443 POZ domain binding proteins Human genes 0.000 description 1
- 108091014659 POZ domain binding proteins Proteins 0.000 description 1
- 206010061332 Paraganglion neoplasm Diseases 0.000 description 1
- 208000009182 Parasitemia Diseases 0.000 description 1
- 206010049752 Peau d'orange Diseases 0.000 description 1
- 241001494479 Pecora Species 0.000 description 1
- NBIIXXVUZAFLBC-UHFFFAOYSA-L Phosphate ion(2-) Chemical compound OP([O-])([O-])=O NBIIXXVUZAFLBC-UHFFFAOYSA-L 0.000 description 1
- 102000045595 Phosphoprotein Phosphatases Human genes 0.000 description 1
- 108700019535 Phosphoprotein Phosphatases Proteins 0.000 description 1
- 108091000080 Phosphotransferase Proteins 0.000 description 1
- 102100026123 Pirin Human genes 0.000 description 1
- 101710176373 Pirin Proteins 0.000 description 1
- 206010035226 Plasma cell myeloma Diseases 0.000 description 1
- 241000224021 Plasmodium berghei ANKA Species 0.000 description 1
- 101100205354 Plasmodium falciparum (isolate 3D7) proRS gene Proteins 0.000 description 1
- 206010035500 Plasmodium falciparum infection Diseases 0.000 description 1
- 108010064218 Poly (ADP-Ribose) Polymerase-1 Proteins 0.000 description 1
- 101710179684 Poly [ADP-ribose] polymerase Proteins 0.000 description 1
- 102000012338 Poly(ADP-ribose) Polymerases Human genes 0.000 description 1
- 108010061844 Poly(ADP-ribose) Polymerases Proteins 0.000 description 1
- ZLMJMSJWJFRBEC-UHFFFAOYSA-N Potassium Chemical compound [K] ZLMJMSJWJFRBEC-UHFFFAOYSA-N 0.000 description 1
- 101000621511 Potato virus M (strain German) RNA silencing suppressor Proteins 0.000 description 1
- 102000007584 Prealbumin Human genes 0.000 description 1
- 108010071690 Prealbumin Proteins 0.000 description 1
- 241000288906 Primates Species 0.000 description 1
- 101710089372 Programmed cell death protein 1 Proteins 0.000 description 1
- XBDQKXXYIPTUBI-UHFFFAOYSA-M Propionate Chemical compound CCC([O-])=O XBDQKXXYIPTUBI-UHFFFAOYSA-M 0.000 description 1
- XBDQKXXYIPTUBI-UHFFFAOYSA-N Propionic acid Substances CCC(O)=O XBDQKXXYIPTUBI-UHFFFAOYSA-N 0.000 description 1
- 108010007568 Protamines Proteins 0.000 description 1
- 102000007327 Protamines Human genes 0.000 description 1
- 102000055027 Protein Methyltransferases Human genes 0.000 description 1
- 108700040121 Protein Methyltransferases Proteins 0.000 description 1
- 102000009516 Protein Serine-Threonine Kinases Human genes 0.000 description 1
- 108010009341 Protein Serine-Threonine Kinases Proteins 0.000 description 1
- 201000004681 Psoriasis Diseases 0.000 description 1
- 206010037660 Pyrexia Diseases 0.000 description 1
- 241000700159 Rattus Species 0.000 description 1
- 102000007056 Recombinant Fusion Proteins Human genes 0.000 description 1
- 108010008281 Recombinant Fusion Proteins Proteins 0.000 description 1
- PYMYPHUHKUWMLA-LMVFSUKVSA-N Ribose Natural products OC[C@@H](O)[C@@H](O)[C@@H](O)C=O PYMYPHUHKUWMLA-LMVFSUKVSA-N 0.000 description 1
- 241000283984 Rodentia Species 0.000 description 1
- 239000006146 Roswell Park Memorial Institute medium Substances 0.000 description 1
- 102100037599 SPARC Human genes 0.000 description 1
- 102100025491 SRA stem-loop-interacting RNA-binding protein, mitochondrial Human genes 0.000 description 1
- 108010044012 STAT1 Transcription Factor Proteins 0.000 description 1
- 102000004265 STAT2 Transcription Factor Human genes 0.000 description 1
- 108010081691 STAT2 Transcription Factor Proteins 0.000 description 1
- 102000005886 STAT4 Transcription Factor Human genes 0.000 description 1
- 108010019992 STAT4 Transcription Factor Proteins 0.000 description 1
- 101150063267 STAT5B gene Proteins 0.000 description 1
- 108010011005 STAT6 Transcription Factor Proteins 0.000 description 1
- 229910052772 Samarium Inorganic materials 0.000 description 1
- 206010039491 Sarcoma Diseases 0.000 description 1
- 206010039710 Scleroderma Diseases 0.000 description 1
- 229940124639 Selective inhibitor Drugs 0.000 description 1
- 102100038192 Serine/threonine-protein kinase TBK1 Human genes 0.000 description 1
- 101710106944 Serine/threonine-protein kinase TBK1 Proteins 0.000 description 1
- 102100029904 Signal transducer and activator of transcription 1-alpha/beta Human genes 0.000 description 1
- 102100024474 Signal transducer and activator of transcription 5B Human genes 0.000 description 1
- 102100023980 Signal transducer and activator of transcription 6 Human genes 0.000 description 1
- 108020004682 Single-Stranded DNA Proteins 0.000 description 1
- 102000011990 Sirtuin Human genes 0.000 description 1
- 108050002485 Sirtuin Proteins 0.000 description 1
- 206010040925 Skin striae Diseases 0.000 description 1
- VMHLLURERBWHNL-UHFFFAOYSA-M Sodium acetate Chemical compound [Na+].CC([O-])=O VMHLLURERBWHNL-UHFFFAOYSA-M 0.000 description 1
- DBMJMQXJHONAFJ-UHFFFAOYSA-M Sodium laurylsulphate Chemical compound [Na+].CCCCCCCCCCCCOS([O-])(=O)=O DBMJMQXJHONAFJ-UHFFFAOYSA-M 0.000 description 1
- 235000002595 Solanum tuberosum Nutrition 0.000 description 1
- 244000061456 Solanum tuberosum Species 0.000 description 1
- 208000000102 Squamous Cell Carcinoma of Head and Neck Diseases 0.000 description 1
- 208000034254 Squamous cell carcinoma of the cervix uteri Diseases 0.000 description 1
- SSZBUIDZHHWXNJ-UHFFFAOYSA-N Stearinsaeure-hexadecylester Natural products CCCCCCCCCCCCCCCCCC(=O)OCCCCCCCCCCCCCCCC SSZBUIDZHHWXNJ-UHFFFAOYSA-N 0.000 description 1
- 208000031439 Striae Distensae Diseases 0.000 description 1
- KDYFGRWQOYBRFD-UHFFFAOYSA-N Succinic acid Natural products OC(=O)CCC(O)=O KDYFGRWQOYBRFD-UHFFFAOYSA-N 0.000 description 1
- QAOWNCQODCNURD-UHFFFAOYSA-L Sulfate Chemical compound [O-]S([O-])(=O)=O QAOWNCQODCNURD-UHFFFAOYSA-L 0.000 description 1
- LSNNMFCWUKXFEE-UHFFFAOYSA-N Sulfurous acid Chemical compound OS(O)=O LSNNMFCWUKXFEE-UHFFFAOYSA-N 0.000 description 1
- 239000012505 Superdex™ Substances 0.000 description 1
- 241000282898 Sus scrofa Species 0.000 description 1
- 208000025317 T-cell and NK-cell neoplasm Diseases 0.000 description 1
- 208000000389 T-cell leukemia Diseases 0.000 description 1
- 208000028530 T-cell lymphoblastic leukemia/lymphoma Diseases 0.000 description 1
- 108091007283 TRIM24 Proteins 0.000 description 1
- FEWJPZIEWOKRBE-UHFFFAOYSA-N Tartaric acid Natural products [H+].[H+].[O-]C(=O)C(O)C(O)C([O-])=O FEWJPZIEWOKRBE-UHFFFAOYSA-N 0.000 description 1
- 108090000190 Thrombin Proteins 0.000 description 1
- 208000033781 Thyroid carcinoma Diseases 0.000 description 1
- 208000024770 Thyroid neoplasm Diseases 0.000 description 1
- 229920001615 Tragacanth Polymers 0.000 description 1
- 102000000887 Transcription factor STAT Human genes 0.000 description 1
- 108050007918 Transcription factor STAT Proteins 0.000 description 1
- 102100022011 Transcription intermediary factor 1-alpha Human genes 0.000 description 1
- GSEJCLTVZPLZKY-UHFFFAOYSA-N Triethanolamine Chemical compound OCCN(CCO)CCO GSEJCLTVZPLZKY-UHFFFAOYSA-N 0.000 description 1
- 239000013504 Triton X-100 Substances 0.000 description 1
- 229920004890 Triton X-100 Polymers 0.000 description 1
- 241000223109 Trypanosoma cruzi Species 0.000 description 1
- 102100029823 Tyrosine-protein kinase BTK Human genes 0.000 description 1
- 108010091546 Ubiquitin-Activating Enzymes Proteins 0.000 description 1
- 102000018478 Ubiquitin-Activating Enzymes Human genes 0.000 description 1
- XSQUKJJJFZCRTK-UHFFFAOYSA-N Urea Natural products NC(N)=O XSQUKJJJFZCRTK-UHFFFAOYSA-N 0.000 description 1
- 201000005969 Uveal melanoma Diseases 0.000 description 1
- 241000700605 Viruses Species 0.000 description 1
- 101001099854 Xenopus laevis Cellular retinoic acid-binding protein 2 Proteins 0.000 description 1
- ZZXDRXVIRVJQBT-UHFFFAOYSA-M Xylenesulfonate Chemical compound CC1=CC=CC(S([O-])(=O)=O)=C1C ZZXDRXVIRVJQBT-UHFFFAOYSA-M 0.000 description 1
- HCHKCACWOHOZIP-UHFFFAOYSA-N Zinc Chemical compound [Zn] HCHKCACWOHOZIP-UHFFFAOYSA-N 0.000 description 1
- QGOJGCAOMCBQFJ-QTOWJTHWSA-N [(2r,3s,4r,5r)-5-(6-aminopurin-9-yl)-3,4-dihydroxyoxolan-2-yl]methyl n-[(2s)-2-amino-3-phenylpropanoyl]sulfamate Chemical compound C([C@H](N)C(=O)NS(=O)(=O)OC[C@@H]1[C@H]([C@@H](O)[C@@H](O1)N1C2=NC=NC(N)=C2N=C1)O)C1=CC=CC=C1 QGOJGCAOMCBQFJ-QTOWJTHWSA-N 0.000 description 1
- 230000002159 abnormal effect Effects 0.000 description 1
- 239000003655 absorption accelerator Substances 0.000 description 1
- 229940124532 absorption promoter Drugs 0.000 description 1
- 238000010521 absorption reaction Methods 0.000 description 1
- 238000000862 absorption spectrum Methods 0.000 description 1
- 229960000583 acetic acid Drugs 0.000 description 1
- 150000001242 acetic acid derivatives Chemical class 0.000 description 1
- IPBVNPXQWQGGJP-UHFFFAOYSA-N acetic acid phenyl ester Natural products CC(=O)OC1=CC=CC=C1 IPBVNPXQWQGGJP-UHFFFAOYSA-N 0.000 description 1
- DPXJVFZANSGRMM-UHFFFAOYSA-N acetic acid;2,3,4,5,6-pentahydroxyhexanal;sodium Chemical compound [Na].CC(O)=O.OCC(O)C(O)C(O)C(O)C=O DPXJVFZANSGRMM-UHFFFAOYSA-N 0.000 description 1
- 230000021736 acetylation Effects 0.000 description 1
- 238000006640 acetylation reaction Methods 0.000 description 1
- YTIVTFGABIZHHX-UHFFFAOYSA-L acetylenedicarboxylate(2-) Chemical compound [O-]C(=O)C#CC([O-])=O YTIVTFGABIZHHX-UHFFFAOYSA-L 0.000 description 1
- 108020002494 acetyltransferase Proteins 0.000 description 1
- 102000005421 acetyltransferase Human genes 0.000 description 1
- 230000002378 acidificating effect Effects 0.000 description 1
- 239000000654 additive Substances 0.000 description 1
- 208000009956 adenocarcinoma Diseases 0.000 description 1
- 208000020990 adrenal cortex carcinoma Diseases 0.000 description 1
- 208000007128 adrenocortical carcinoma Diseases 0.000 description 1
- 239000000443 aerosol Substances 0.000 description 1
- 235000010419 agar Nutrition 0.000 description 1
- 238000000246 agarose gel electrophoresis Methods 0.000 description 1
- 239000000556 agonist Substances 0.000 description 1
- 125000006241 alcohol protecting group Chemical group 0.000 description 1
- IAJILQKETJEXLJ-QTBDOELSSA-N aldehydo-D-glucuronic acid Chemical compound O=C[C@H](O)[C@@H](O)[C@H](O)[C@H](O)C(O)=O IAJILQKETJEXLJ-QTBDOELSSA-N 0.000 description 1
- 239000000783 alginic acid Substances 0.000 description 1
- 229960001126 alginic acid Drugs 0.000 description 1
- 150000004781 alginic acids Chemical class 0.000 description 1
- 229910052783 alkali metal Inorganic materials 0.000 description 1
- 150000001340 alkali metals Chemical class 0.000 description 1
- 229910052784 alkaline earth metal Inorganic materials 0.000 description 1
- 150000001342 alkaline earth metals Chemical class 0.000 description 1
- 150000001336 alkenes Chemical class 0.000 description 1
- 230000003281 allosteric effect Effects 0.000 description 1
- HMFHBZSHGGEWLO-UHFFFAOYSA-N alpha-D-Furanose-Ribose Natural products OCC1OC(O)C(O)C1O HMFHBZSHGGEWLO-UHFFFAOYSA-N 0.000 description 1
- 108090000185 alpha-Synuclein Proteins 0.000 description 1
- HSFWRNGVRCDJHI-UHFFFAOYSA-N alpha-acetylene Natural products C#C HSFWRNGVRCDJHI-UHFFFAOYSA-N 0.000 description 1
- 229910052782 aluminium Inorganic materials 0.000 description 1
- XAGFODPZIPBFFR-UHFFFAOYSA-N aluminium Chemical compound [Al] XAGFODPZIPBFFR-UHFFFAOYSA-N 0.000 description 1
- 229910000147 aluminium phosphate Inorganic materials 0.000 description 1
- 235000012211 aluminium silicate Nutrition 0.000 description 1
- CEGOLXSVJUTHNZ-UHFFFAOYSA-K aluminium tristearate Chemical compound [Al+3].CCCCCCCCCCCCCCCCCC([O-])=O.CCCCCCCCCCCCCCCCCC([O-])=O.CCCCCCCCCCCCCCCCCC([O-])=O CEGOLXSVJUTHNZ-UHFFFAOYSA-K 0.000 description 1
- 229940063655 aluminum stearate Drugs 0.000 description 1
- 150000001408 amides Chemical class 0.000 description 1
- 125000000539 amino acid group Chemical group 0.000 description 1
- 125000004397 aminosulfonyl group Chemical group NS(=O)(=O)* 0.000 description 1
- 229910021529 ammonia Inorganic materials 0.000 description 1
- AVKUERGKIZMTKX-NJBDSQKTSA-N ampicillin Chemical compound C1([C@@H](N)C(=O)N[C@H]2[C@H]3SC([C@@H](N3C2=O)C(O)=O)(C)C)=CC=CC=C1 AVKUERGKIZMTKX-NJBDSQKTSA-N 0.000 description 1
- 239000003708 ampul Substances 0.000 description 1
- 102000001307 androgen receptors Human genes 0.000 description 1
- 230000033115 angiogenesis Effects 0.000 description 1
- 239000005557 antagonist Substances 0.000 description 1
- 125000002178 anthracenyl group Chemical group C1(=CC=CC2=CC3=CC=CC=C3C=C12)* 0.000 description 1
- 239000000058 anti acne agent Substances 0.000 description 1
- 230000000844 anti-bacterial effect Effects 0.000 description 1
- 230000003510 anti-fibrotic effect Effects 0.000 description 1
- 230000001857 anti-mycotic effect Effects 0.000 description 1
- 230000002141 anti-parasite Effects 0.000 description 1
- 229940124340 antiacne agent Drugs 0.000 description 1
- 239000000427 antigen Substances 0.000 description 1
- 108091007433 antigens Proteins 0.000 description 1
- 102000036639 antigens Human genes 0.000 description 1
- 239000002543 antimycotic Substances 0.000 description 1
- 239000003443 antiviral agent Substances 0.000 description 1
- 239000012062 aqueous buffer Substances 0.000 description 1
- 239000003125 aqueous solvent Substances 0.000 description 1
- 239000007900 aqueous suspension Substances 0.000 description 1
- 125000002029 aromatic hydrocarbon group Chemical group 0.000 description 1
- 229960002521 artenimol Drugs 0.000 description 1
- BJDCWCLMFKKGEE-ISOSDAIHSA-N artenimol Chemical compound C([C@](OO1)(C)O2)C[C@H]3[C@H](C)CC[C@@H]4[C@@]31[C@@H]2O[C@H](O)[C@@H]4C BJDCWCLMFKKGEE-ISOSDAIHSA-N 0.000 description 1
- 235000010323 ascorbic acid Nutrition 0.000 description 1
- 239000011668 ascorbic acid Substances 0.000 description 1
- 229960005070 ascorbic acid Drugs 0.000 description 1
- 208000006673 asthma Diseases 0.000 description 1
- 125000004429 atom Chemical group 0.000 description 1
- 150000001539 azetidines Chemical class 0.000 description 1
- 235000013871 bee wax Nutrition 0.000 description 1
- 239000012166 beeswax Substances 0.000 description 1
- 230000009286 beneficial effect Effects 0.000 description 1
- 239000000440 bentonite Substances 0.000 description 1
- 229910000278 bentonite Inorganic materials 0.000 description 1
- SVPXDRXYRYOSEX-UHFFFAOYSA-N bentoquatam Chemical compound O.O=[Si]=O.O=[Al]O[Al]=O SVPXDRXYRYOSEX-UHFFFAOYSA-N 0.000 description 1
- 229940092714 benzenesulfonic acid Drugs 0.000 description 1
- 235000010233 benzoic acid Nutrition 0.000 description 1
- 235000019445 benzyl alcohol Nutrition 0.000 description 1
- NFPGZLVPTVWFSY-UHFFFAOYSA-N benzyl n-[2-(2-hydroxyethoxy)ethyl]carbamate Chemical compound OCCOCCNC(=O)OCC1=CC=CC=C1 NFPGZLVPTVWFSY-UHFFFAOYSA-N 0.000 description 1
- 238000003339 best practice Methods 0.000 description 1
- 230000003115 biocidal effect Effects 0.000 description 1
- 230000008236 biological pathway Effects 0.000 description 1
- 230000005540 biological transmission Effects 0.000 description 1
- 238000001574 biopsy Methods 0.000 description 1
- OWMVSZAMULFTJU-UHFFFAOYSA-N bis-tris Chemical compound OCCN(CCO)C(CO)(CO)CO OWMVSZAMULFTJU-UHFFFAOYSA-N 0.000 description 1
- 206010005084 bladder transitional cell carcinoma Diseases 0.000 description 1
- 201000001528 bladder urothelial carcinoma Diseases 0.000 description 1
- 230000000903 blocking effect Effects 0.000 description 1
- 210000004556 brain Anatomy 0.000 description 1
- 210000004958 brain cell Anatomy 0.000 description 1
- 201000007983 brain glioma Diseases 0.000 description 1
- 210000000481 breast Anatomy 0.000 description 1
- DQXBYHZEEUGOBF-UHFFFAOYSA-N but-3-enoic acid;ethene Chemical compound C=C.OC(=O)CC=C DQXBYHZEEUGOBF-UHFFFAOYSA-N 0.000 description 1
- KDYFGRWQOYBRFD-NUQCWPJISA-N butanedioic acid Chemical compound O[14C](=O)CC[14C](O)=O KDYFGRWQOYBRFD-NUQCWPJISA-N 0.000 description 1
- 125000004106 butoxy group Chemical group [*]OC([H])([H])C([H])([H])C(C([H])([H])[H])([H])[H] 0.000 description 1
- 239000011575 calcium Substances 0.000 description 1
- 229910052791 calcium Inorganic materials 0.000 description 1
- 229910000019 calcium carbonate Inorganic materials 0.000 description 1
- 235000010216 calcium carbonate Nutrition 0.000 description 1
- CJZGTCYPCWQAJB-UHFFFAOYSA-L calcium stearate Chemical compound [Ca+2].CCCCCCCCCCCCCCCCCC([O-])=O.CCCCCCCCCCCCCCCCCC([O-])=O CJZGTCYPCWQAJB-UHFFFAOYSA-L 0.000 description 1
- 239000008116 calcium stearate Substances 0.000 description 1
- 235000013539 calcium stearate Nutrition 0.000 description 1
- 150000001720 carbohydrates Chemical class 0.000 description 1
- 235000014633 carbohydrates Nutrition 0.000 description 1
- 238000001460 carbon-13 nuclear magnetic resonance spectrum Methods 0.000 description 1
- BVKZGUZCCUSVTD-UHFFFAOYSA-N carbonic acid Chemical compound OC(O)=O BVKZGUZCCUSVTD-UHFFFAOYSA-N 0.000 description 1
- 235000010948 carboxy methyl cellulose Nutrition 0.000 description 1
- 125000006244 carboxylic acid protecting group Chemical group 0.000 description 1
- 239000008112 carboxymethyl-cellulose Substances 0.000 description 1
- 208000011892 carcinosarcoma of the corpus uteri Diseases 0.000 description 1
- 239000004359 castor oil Substances 0.000 description 1
- 235000019438 castor oil Nutrition 0.000 description 1
- 230000003197 catalytic effect Effects 0.000 description 1
- 238000000423 cell based assay Methods 0.000 description 1
- 238000004113 cell culture Methods 0.000 description 1
- 239000006143 cell culture medium Substances 0.000 description 1
- 210000000170 cell membrane Anatomy 0.000 description 1
- 230000003833 cell viability Effects 0.000 description 1
- 230000006800 cellular catabolic process Effects 0.000 description 1
- 230000036755 cellular response Effects 0.000 description 1
- 108010012671 cellular retinoic acid binding protein I Proteins 0.000 description 1
- 230000036232 cellulite Effects 0.000 description 1
- 239000001913 cellulose Substances 0.000 description 1
- 229920002678 cellulose Polymers 0.000 description 1
- 235000010980 cellulose Nutrition 0.000 description 1
- 201000006612 cervical squamous cell carcinoma Diseases 0.000 description 1
- 229960000541 cetyl alcohol Drugs 0.000 description 1
- 125000003636 chemical group Chemical group 0.000 description 1
- 239000003638 chemical reducing agent Substances 0.000 description 1
- 238000002512 chemotherapy Methods 0.000 description 1
- 208000006990 cholangiocarcinoma Diseases 0.000 description 1
- 201000010240 chromophobe renal cell carcinoma Diseases 0.000 description 1
- 208000037976 chronic inflammation Diseases 0.000 description 1
- 230000006020 chronic inflammation Effects 0.000 description 1
- 238000005352 clarification Methods 0.000 description 1
- 239000004927 clay Substances 0.000 description 1
- 206010073251 clear cell renal cell carcinoma Diseases 0.000 description 1
- 238000003776 cleavage reaction Methods 0.000 description 1
- 239000011248 coating agent Substances 0.000 description 1
- 229940110456 cocoa butter Drugs 0.000 description 1
- 235000019868 cocoa butter Nutrition 0.000 description 1
- 239000008119 colloidal silica Substances 0.000 description 1
- 201000010897 colon adenocarcinoma Diseases 0.000 description 1
- 208000029742 colonic neoplasm Diseases 0.000 description 1
- 238000004891 communication Methods 0.000 description 1
- 239000002361 compost Substances 0.000 description 1
- 238000013270 controlled release Methods 0.000 description 1
- 239000008120 corn starch Substances 0.000 description 1
- 239000006071 cream Substances 0.000 description 1
- 101150113466 cul-3 gene Proteins 0.000 description 1
- 208000030381 cutaneous melanoma Diseases 0.000 description 1
- 230000006378 damage Effects 0.000 description 1
- 230000002498 deadly effect Effects 0.000 description 1
- 230000034994 death Effects 0.000 description 1
- 231100000517 death Toxicity 0.000 description 1
- GHVNFZFCNZKVNT-UHFFFAOYSA-M decanoate Chemical compound CCCCCCCCCC([O-])=O GHVNFZFCNZKVNT-UHFFFAOYSA-M 0.000 description 1
- GHVNFZFCNZKVNT-UHFFFAOYSA-N decanoic acid Chemical compound CCCCCCCCCC(O)=O GHVNFZFCNZKVNT-UHFFFAOYSA-N 0.000 description 1
- 230000000593 degrading effect Effects 0.000 description 1
- 230000002939 deleterious effect Effects 0.000 description 1
- 208000025729 dengue disease Diseases 0.000 description 1
- 238000011033 desalting Methods 0.000 description 1
- 206010012601 diabetes mellitus Diseases 0.000 description 1
- 125000002720 diazolyl group Chemical group 0.000 description 1
- HPNMFZURTQLUMO-UHFFFAOYSA-N diethylamine Chemical compound CCNCC HPNMFZURTQLUMO-UHFFFAOYSA-N 0.000 description 1
- 206010012818 diffuse large B-cell lymphoma Diseases 0.000 description 1
- 238000009792 diffusion process Methods 0.000 description 1
- 229930016266 dihydroartemisinin Natural products 0.000 description 1
- NBIIXXVUZAFLBC-UHFFFAOYSA-M dihydrogenphosphate Chemical compound OP(O)([O-])=O NBIIXXVUZAFLBC-UHFFFAOYSA-M 0.000 description 1
- GXGAKHNRMVGRPK-UHFFFAOYSA-N dimagnesium;dioxido-bis[[oxido(oxo)silyl]oxy]silane Chemical compound [Mg+2].[Mg+2].[O-][Si](=O)O[Si]([O-])([O-])O[Si]([O-])=O GXGAKHNRMVGRPK-UHFFFAOYSA-N 0.000 description 1
- HPYNZHMRTTWQTB-UHFFFAOYSA-N dimethylpyridine Natural products CC1=CC=CN=C1C HPYNZHMRTTWQTB-UHFFFAOYSA-N 0.000 description 1
- XPPKVPWEQAFLFU-UHFFFAOYSA-J diphosphate(4-) Chemical compound [O-]P([O-])(=O)OP([O-])([O-])=O XPPKVPWEQAFLFU-UHFFFAOYSA-J 0.000 description 1
- 235000011180 diphosphates Nutrition 0.000 description 1
- ZPWVASYFFYYZEW-UHFFFAOYSA-L dipotassium hydrogen phosphate Chemical compound [K+].[K+].OP([O-])([O-])=O ZPWVASYFFYYZEW-UHFFFAOYSA-L 0.000 description 1
- 229910000396 dipotassium phosphate Inorganic materials 0.000 description 1
- 235000019797 dipotassium phosphate Nutrition 0.000 description 1
- 239000006185 dispersion Substances 0.000 description 1
- 238000003182 dose-response assay Methods 0.000 description 1
- 238000012912 drug discovery process Methods 0.000 description 1
- 239000003596 drug target Substances 0.000 description 1
- 230000009977 dual effect Effects 0.000 description 1
- 239000000975 dye Substances 0.000 description 1
- KBQHZAAAGSGFKK-UHFFFAOYSA-N dysprosium atom Chemical compound [Dy] KBQHZAAAGSGFKK-UHFFFAOYSA-N 0.000 description 1
- 239000003792 electrolyte Substances 0.000 description 1
- 238000001425 electrospray ionisation time-of-flight mass spectrometry Methods 0.000 description 1
- 230000009881 electrostatic interaction Effects 0.000 description 1
- 239000003974 emollient agent Substances 0.000 description 1
- 230000001804 emulsifying effect Effects 0.000 description 1
- 150000002081 enamines Chemical class 0.000 description 1
- RDYMFSUJUZBWLH-UHFFFAOYSA-N endosulfan Chemical compound C12COS(=O)OCC2C2(Cl)C(Cl)=C(Cl)C1(Cl)C2(Cl)Cl RDYMFSUJUZBWLH-UHFFFAOYSA-N 0.000 description 1
- 239000003623 enhancer Substances 0.000 description 1
- 238000011067 equilibration Methods 0.000 description 1
- 210000003743 erythrocyte Anatomy 0.000 description 1
- 201000005619 esophageal carcinoma Diseases 0.000 description 1
- 108091008559 estrogen-related receptor alpha Proteins 0.000 description 1
- BEFDCLMNVWHSGT-UHFFFAOYSA-N ethenylcyclopentane Chemical compound C=CC1CCCC1 BEFDCLMNVWHSGT-UHFFFAOYSA-N 0.000 description 1
- 229960005542 ethidium bromide Drugs 0.000 description 1
- ZMMJGEGLRURXTF-UHFFFAOYSA-N ethidium bromide Chemical compound [Br-].C12=CC(N)=CC=C2C2=CC=C(N)C=C2[N+](CC)=C1C1=CC=CC=C1 ZMMJGEGLRURXTF-UHFFFAOYSA-N 0.000 description 1
- DXBULVYHTICWKT-UHFFFAOYSA-N ethyl 6-bromohexanoate Chemical compound CCOC(=O)CCCCCBr DXBULVYHTICWKT-UHFFFAOYSA-N 0.000 description 1
- 239000002038 ethyl acetate fraction Substances 0.000 description 1
- 239000005038 ethylene vinyl acetate Substances 0.000 description 1
- 125000002534 ethynyl group Chemical group [H]C#C* 0.000 description 1
- 238000000695 excitation spectrum Methods 0.000 description 1
- 238000013401 experimental design Methods 0.000 description 1
- 238000013213 extrapolation Methods 0.000 description 1
- 235000019197 fats Nutrition 0.000 description 1
- 230000002349 favourable effect Effects 0.000 description 1
- 210000003608 fece Anatomy 0.000 description 1
- 210000002950 fibroblast Anatomy 0.000 description 1
- 239000000945 filler Substances 0.000 description 1
- 239000000796 flavoring agent Substances 0.000 description 1
- 238000002292 fluorescence lifetime imaging microscopy Methods 0.000 description 1
- 238000002875 fluorescence polarization Methods 0.000 description 1
- 108091006047 fluorescent proteins Proteins 0.000 description 1
- 102000034287 fluorescent proteins Human genes 0.000 description 1
- 239000006260 foam Substances 0.000 description 1
- 239000003205 fragrance Substances 0.000 description 1
- 229940050411 fumarate Drugs 0.000 description 1
- 239000001530 fumaric acid Substances 0.000 description 1
- 229960002598 fumaric acid Drugs 0.000 description 1
- 230000002538 fungal effect Effects 0.000 description 1
- 125000002541 furyl group Chemical group 0.000 description 1
- 201000006585 gastric adenocarcinoma Diseases 0.000 description 1
- 239000007903 gelatin capsule Substances 0.000 description 1
- 238000007429 general method Methods 0.000 description 1
- 201000006592 giardiasis Diseases 0.000 description 1
- 239000011521 glass Substances 0.000 description 1
- 208000005017 glioblastoma Diseases 0.000 description 1
- 239000000174 gluconic acid Substances 0.000 description 1
- 229950006191 gluconic acid Drugs 0.000 description 1
- 235000012208 gluconic acid Nutrition 0.000 description 1
- 229940097043 glucuronic acid Drugs 0.000 description 1
- 239000003292 glue Substances 0.000 description 1
- 229940049906 glutamate Drugs 0.000 description 1
- 229930195712 glutamate Natural products 0.000 description 1
- YQEMORVAKMFKLG-UHFFFAOYSA-N glycerine monostearate Natural products CCCCCCCCCCCCCCCCCC(=O)OC(CO)CO YQEMORVAKMFKLG-UHFFFAOYSA-N 0.000 description 1
- SVUQHVRAGMNPLW-UHFFFAOYSA-N glycerol monostearate Natural products CCCCCCCCCCCCCCCCC(=O)OCC(O)CO SVUQHVRAGMNPLW-UHFFFAOYSA-N 0.000 description 1
- ZEMPKEQAKRGZGQ-XOQCFJPHSA-N glycerol triricinoleate Natural products CCCCCC[C@@H](O)CC=CCCCCCCCC(=O)OC[C@@H](COC(=O)CCCCCCCC=CC[C@@H](O)CCCCCC)OC(=O)CCCCCCCC=CC[C@H](O)CCCCCC ZEMPKEQAKRGZGQ-XOQCFJPHSA-N 0.000 description 1
- 229960002449 glycine Drugs 0.000 description 1
- 230000013595 glycosylation Effects 0.000 description 1
- 238000006206 glycosylation reaction Methods 0.000 description 1
- 208000024908 graft versus host disease Diseases 0.000 description 1
- 239000001963 growth medium Substances 0.000 description 1
- 210000004209 hair Anatomy 0.000 description 1
- 201000000459 head and neck squamous cell carcinoma Diseases 0.000 description 1
- 238000005534 hematocrit Methods 0.000 description 1
- 206010073071 hepatocellular carcinoma Diseases 0.000 description 1
- 231100000844 hepatocellular carcinoma Toxicity 0.000 description 1
- MNWFXJYAOYHMED-UHFFFAOYSA-N heptanoic acid Chemical compound CCCCCCC(O)=O MNWFXJYAOYHMED-UHFFFAOYSA-N 0.000 description 1
- 125000000623 heterocyclic group Chemical group 0.000 description 1
- BXWNKGSJHAJOGX-UHFFFAOYSA-N hexadecan-1-ol Chemical compound CCCCCCCCCCCCCCCCO BXWNKGSJHAJOGX-UHFFFAOYSA-N 0.000 description 1
- 108091008039 hormone receptors Proteins 0.000 description 1
- 208000029080 human African trypanosomiasis Diseases 0.000 description 1
- QAOWNCQODCNURD-UHFFFAOYSA-M hydrogensulfate Chemical compound OS([O-])(=O)=O QAOWNCQODCNURD-UHFFFAOYSA-M 0.000 description 1
- 229940071870 hydroiodic acid Drugs 0.000 description 1
- 125000002887 hydroxy group Chemical group [H]O* 0.000 description 1
- 238000005286 illumination Methods 0.000 description 1
- 125000002883 imidazolyl group Chemical group 0.000 description 1
- 230000002519 immonomodulatory effect Effects 0.000 description 1
- 230000001506 immunosuppresive effect Effects 0.000 description 1
- 230000006872 improvement Effects 0.000 description 1
- 125000003454 indenyl group Chemical group C1(C=CC2=CC=CC=C12)* 0.000 description 1
- 239000003978 infusion fluid Substances 0.000 description 1
- 229940102223 injectable solution Drugs 0.000 description 1
- 229940102213 injectable suspension Drugs 0.000 description 1
- 229910052500 inorganic mineral Inorganic materials 0.000 description 1
- 239000002198 insoluble material Substances 0.000 description 1
- 238000009434 installation Methods 0.000 description 1
- 238000009830 intercalation Methods 0.000 description 1
- 238000001361 intraarterial administration Methods 0.000 description 1
- 238000007918 intramuscular administration Methods 0.000 description 1
- 238000007912 intraperitoneal administration Methods 0.000 description 1
- 238000007919 intrasynovial administration Methods 0.000 description 1
- 238000007913 intrathecal administration Methods 0.000 description 1
- 230000002601 intratumoral effect Effects 0.000 description 1
- 238000001990 intravenous administration Methods 0.000 description 1
- 208000024312 invasive carcinoma Diseases 0.000 description 1
- 235000000396 iron Nutrition 0.000 description 1
- 239000002085 irritant Substances 0.000 description 1
- 208000028867 ischemia Diseases 0.000 description 1
- 230000000302 ischemic effect Effects 0.000 description 1
- 125000000959 isobutyl group Chemical group [H]C([H])([H])C([H])(C([H])([H])[H])C([H])([H])* 0.000 description 1
- KQNPFQTWMSNSAP-UHFFFAOYSA-N isobutyric acid Chemical compound CC(C)C(O)=O KQNPFQTWMSNSAP-UHFFFAOYSA-N 0.000 description 1
- 125000000741 isoleucyl group Chemical group [H]N([H])C(C(C([H])([H])[H])C([H])([H])C([H])([H])[H])C(=O)O* 0.000 description 1
- QXJSBBXBKPUZAA-UHFFFAOYSA-N isooleic acid Natural products CCCCCCCC=CCCCCCCCCC(O)=O QXJSBBXBKPUZAA-UHFFFAOYSA-N 0.000 description 1
- 125000000555 isopropenyl group Chemical group [H]\C([H])=C(\*)C([H])([H])[H] 0.000 description 1
- 125000003253 isopropoxy group Chemical group [H]C([H])([H])C([H])(O*)C([H])([H])[H] 0.000 description 1
- BPHPUYQFMNQIOC-NXRLNHOXSA-N isopropyl beta-D-thiogalactopyranoside Chemical compound CC(C)S[C@@H]1O[C@H](CO)[C@H](O)[C@H](O)[C@H]1O BPHPUYQFMNQIOC-NXRLNHOXSA-N 0.000 description 1
- 150000002540 isothiocyanates Chemical class 0.000 description 1
- 125000000842 isoxazolyl group Chemical group 0.000 description 1
- 238000012804 iterative process Methods 0.000 description 1
- NLYAJNPCOHFWQQ-UHFFFAOYSA-N kaolin Chemical compound O.O.O=[Al]O[Si](=O)O[Si](=O)O[Al]=O NLYAJNPCOHFWQQ-UHFFFAOYSA-N 0.000 description 1
- 150000003951 lactams Chemical class 0.000 description 1
- 239000004310 lactic acid Substances 0.000 description 1
- 235000014655 lactic acid Nutrition 0.000 description 1
- 238000011173 large scale experimental method Methods 0.000 description 1
- 239000000787 lecithin Substances 0.000 description 1
- 235000010445 lecithin Nutrition 0.000 description 1
- 229940067606 lecithin Drugs 0.000 description 1
- 150000002632 lipids Chemical class 0.000 description 1
- 229910052744 lithium Inorganic materials 0.000 description 1
- 230000004807 localization Effects 0.000 description 1
- 239000006210 lotion Substances 0.000 description 1
- 239000007937 lozenge Substances 0.000 description 1
- 239000000314 lubricant Substances 0.000 description 1
- 201000005249 lung adenocarcinoma Diseases 0.000 description 1
- 201000005243 lung squamous cell carcinoma Diseases 0.000 description 1
- 206010025135 lupus erythematosus Diseases 0.000 description 1
- 208000019420 lymphoid neoplasm Diseases 0.000 description 1
- 125000003588 lysine group Chemical group [H]N([H])C([H])([H])C([H])([H])C([H])([H])C([H])([H])C([H])(N([H])[H])C(*)=O 0.000 description 1
- 208000002780 macular degeneration Diseases 0.000 description 1
- 239000011777 magnesium Substances 0.000 description 1
- 229910052749 magnesium Inorganic materials 0.000 description 1
- 239000000391 magnesium silicate Substances 0.000 description 1
- 235000019359 magnesium stearate Nutrition 0.000 description 1
- 229910052943 magnesium sulfate Inorganic materials 0.000 description 1
- 229910000386 magnesium trisilicate Inorganic materials 0.000 description 1
- 235000019793 magnesium trisilicate Nutrition 0.000 description 1
- 229940099273 magnesium trisilicate Drugs 0.000 description 1
- 210000004962 mammalian cell Anatomy 0.000 description 1
- IWYDHOAUDWTVEP-UHFFFAOYSA-M mandelate Chemical compound [O-]C(=O)C(O)C1=CC=CC=C1 IWYDHOAUDWTVEP-UHFFFAOYSA-M 0.000 description 1
- 230000007246 mechanism Effects 0.000 description 1
- 229910021645 metal ion Inorganic materials 0.000 description 1
- 150000002739 metals Chemical class 0.000 description 1
- 125000005341 metaphosphate group Chemical group 0.000 description 1
- 229940098779 methanesulfonic acid Drugs 0.000 description 1
- IZYBEMGNIUSSAX-UHFFFAOYSA-N methyl benzenecarboperoxoate Chemical compound COOC(=O)C1=CC=CC=C1 IZYBEMGNIUSSAX-UHFFFAOYSA-N 0.000 description 1
- 229940095102 methyl benzoate Drugs 0.000 description 1
- 125000001570 methylene group Chemical group [H]C([H])([*:1])[*:2] 0.000 description 1
- 230000005012 migration Effects 0.000 description 1
- 238000013508 migration Methods 0.000 description 1
- 230000003278 mimic effect Effects 0.000 description 1
- 235000010755 mineral Nutrition 0.000 description 1
- 239000011707 mineral Substances 0.000 description 1
- 238000002156 mixing Methods 0.000 description 1
- 230000001333 moisturizer Effects 0.000 description 1
- RPAWVEMNAJPPEL-UHFFFAOYSA-N morpholine;thiomorpholine Chemical compound C1COCCN1.C1CSCCN1 RPAWVEMNAJPPEL-UHFFFAOYSA-N 0.000 description 1
- 235000011929 mousse Nutrition 0.000 description 1
- 201000006417 multiple sclerosis Diseases 0.000 description 1
- SYSQUGFVNFXIIT-UHFFFAOYSA-N n-[4-(1,3-benzoxazol-2-yl)phenyl]-4-nitrobenzenesulfonamide Chemical class C1=CC([N+](=O)[O-])=CC=C1S(=O)(=O)NC1=CC=C(C=2OC3=CC=CC=C3N=2)C=C1 SYSQUGFVNFXIIT-UHFFFAOYSA-N 0.000 description 1
- 125000004370 n-butenyl group Chemical group [H]\C([H])=C(/[H])C([H])([H])C([H])([H])* 0.000 description 1
- 125000006606 n-butoxy group Chemical group 0.000 description 1
- 125000004108 n-butyl group Chemical group [H]C([H])([H])C([H])([H])C([H])([H])C([H])([H])* 0.000 description 1
- 125000001280 n-hexyl group Chemical group C(CCCCC)* 0.000 description 1
- 125000000740 n-pentyl group Chemical group [H]C([H])([H])C([H])([H])C([H])([H])C([H])([H])C([H])([H])* 0.000 description 1
- 125000003506 n-propoxy group Chemical group [H]C([H])([H])C([H])([H])C([H])([H])O* 0.000 description 1
- 125000004123 n-propyl group Chemical group [H]C([H])([H])C([H])([H])C([H])([H])* 0.000 description 1
- PSZYNBSKGUBXEH-UHFFFAOYSA-N naphthalene-1-sulfonic acid Chemical compound C1=CC=C2C(S(=O)(=O)O)=CC=CC2=C1 PSZYNBSKGUBXEH-UHFFFAOYSA-N 0.000 description 1
- KVBGVZZKJNLNJU-UHFFFAOYSA-N naphthalene-2-sulfonic acid Chemical compound C1=CC=CC2=CC(S(=O)(=O)O)=CC=C21 KVBGVZZKJNLNJU-UHFFFAOYSA-N 0.000 description 1
- 239000007922 nasal spray Substances 0.000 description 1
- 238000007481 next generation sequencing Methods 0.000 description 1
- 229920001220 nitrocellulos Polymers 0.000 description 1
- 231100000344 non-irritating Toxicity 0.000 description 1
- 230000036963 noncompetitive effect Effects 0.000 description 1
- 231100000252 nontoxic Toxicity 0.000 description 1
- 230000003000 nontoxic effect Effects 0.000 description 1
- 238000010606 normalization Methods 0.000 description 1
- 150000007523 nucleic acids Chemical class 0.000 description 1
- 102000039446 nucleic acids Human genes 0.000 description 1
- 108020004707 nucleic acids Proteins 0.000 description 1
- 235000020824 obesity Nutrition 0.000 description 1
- WWZKQHOCKIZLMA-UHFFFAOYSA-M octanoate Chemical compound CCCCCCCC([O-])=O WWZKQHOCKIZLMA-UHFFFAOYSA-M 0.000 description 1
- 239000002674 ointment Substances 0.000 description 1
- ZQPPMHVWECSIRJ-KTKRTIGZSA-N oleic acid Chemical compound CCCCCCCC\C=C/CCCCCCCC(O)=O ZQPPMHVWECSIRJ-KTKRTIGZSA-N 0.000 description 1
- 239000004006 olive oil Substances 0.000 description 1
- 235000008390 olive oil Nutrition 0.000 description 1
- 210000000056 organ Anatomy 0.000 description 1
- 239000012044 organic layer Substances 0.000 description 1
- 239000003960 organic solvent Substances 0.000 description 1
- 201000010302 ovarian serous cystadenocarcinoma Diseases 0.000 description 1
- 235000006408 oxalic acid Nutrition 0.000 description 1
- 125000002971 oxazolyl group Chemical group 0.000 description 1
- OJPNKYLDSDFUPG-UHFFFAOYSA-N p-quinomethane Chemical compound C=C1C=CC(=O)C=C1 OJPNKYLDSDFUPG-UHFFFAOYSA-N 0.000 description 1
- 201000002094 pancreatic adenocarcinoma Diseases 0.000 description 1
- FJKROLUGYXJWQN-UHFFFAOYSA-N papa-hydroxy-benzoic acid Natural products OC(=O)C1=CC=C(O)C=C1 FJKROLUGYXJWQN-UHFFFAOYSA-N 0.000 description 1
- 239000012188 paraffin wax Substances 0.000 description 1
- 208000007312 paraganglioma Diseases 0.000 description 1
- 238000007911 parenteral administration Methods 0.000 description 1
- 239000004031 partial agonist Substances 0.000 description 1
- 235000010603 pastilles Nutrition 0.000 description 1
- 230000035515 penetration Effects 0.000 description 1
- 150000002966 pentacyclic triterpenoids Chemical class 0.000 description 1
- 125000003538 pentan-3-yl group Chemical group [H]C([H])([H])C([H])([H])C([H])(*)C([H])([H])C([H])([H])[H] 0.000 description 1
- 230000035699 permeability Effects 0.000 description 1
- 230000008823 permeabilization Effects 0.000 description 1
- 239000008177 pharmaceutical agent Substances 0.000 description 1
- 230000000144 pharmacologic effect Effects 0.000 description 1
- 125000001792 phenanthrenyl group Chemical group C1(=CC=CC=2C3=CC=CC=C3C=CC12)* 0.000 description 1
- DYUMLJSJISTVPV-UHFFFAOYSA-N phenyl propanoate Chemical compound CCC(=O)OC1=CC=CC=C1 DYUMLJSJISTVPV-UHFFFAOYSA-N 0.000 description 1
- 229940049953 phenylacetate Drugs 0.000 description 1
- WLJVXDMOQOGPHL-UHFFFAOYSA-N phenylacetic acid Chemical compound OC(=O)CC1=CC=CC=C1 WLJVXDMOQOGPHL-UHFFFAOYSA-N 0.000 description 1
- 229950009215 phenylbutanoic acid Drugs 0.000 description 1
- 208000028591 pheochromocytoma Diseases 0.000 description 1
- NMHMNPHRMNGLLB-UHFFFAOYSA-N phloretic acid Chemical compound OC(=O)CCC1=CC=C(O)C=C1 NMHMNPHRMNGLLB-UHFFFAOYSA-N 0.000 description 1
- 150000003904 phospholipids Chemical class 0.000 description 1
- 150000003013 phosphoric acid derivatives Chemical class 0.000 description 1
- 229910052698 phosphorus Inorganic materials 0.000 description 1
- 230000026731 phosphorylation Effects 0.000 description 1
- 238000006366 phosphorylation reaction Methods 0.000 description 1
- 102000020233 phosphotransferase Human genes 0.000 description 1
- 238000013379 physicochemical characterization Methods 0.000 description 1
- 239000000049 pigment Substances 0.000 description 1
- 125000004482 piperidin-4-yl group Chemical group N1CCC(CC1)* 0.000 description 1
- AXIPBRXJGSXLHF-UHFFFAOYSA-N piperidine;pyrrolidine Chemical compound C1CCNC1.C1CCNCC1 AXIPBRXJGSXLHF-UHFFFAOYSA-N 0.000 description 1
- 229920003023 plastic Polymers 0.000 description 1
- 239000004033 plastic Substances 0.000 description 1
- 229920001200 poly(ethylene-vinyl acetate) Polymers 0.000 description 1
- 229920000747 poly(lactic acid) Polymers 0.000 description 1
- 229920000058 polyacrylate Polymers 0.000 description 1
- 229920001610 polycaprolactone Polymers 0.000 description 1
- 239000004632 polycaprolactone Substances 0.000 description 1
- 125000003367 polycyclic group Chemical group 0.000 description 1
- 239000004626 polylactic acid Substances 0.000 description 1
- 229920001282 polysaccharide Polymers 0.000 description 1
- 239000005017 polysaccharide Substances 0.000 description 1
- 150000004804 polysaccharides Chemical class 0.000 description 1
- 229920001296 polysiloxane Polymers 0.000 description 1
- 239000001267 polyvinylpyrrolidone Substances 0.000 description 1
- 229920000036 polyvinylpyrrolidone Polymers 0.000 description 1
- 235000013855 polyvinylpyrrolidone Nutrition 0.000 description 1
- 229910052700 potassium Inorganic materials 0.000 description 1
- 239000011591 potassium Substances 0.000 description 1
- LWIHDJKSTIGBAC-UHFFFAOYSA-K potassium phosphate Substances [K+].[K+].[K+].[O-]P([O-])([O-])=O LWIHDJKSTIGBAC-UHFFFAOYSA-K 0.000 description 1
- 239000004302 potassium sorbate Substances 0.000 description 1
- 235000010241 potassium sorbate Nutrition 0.000 description 1
- 229940069338 potassium sorbate Drugs 0.000 description 1
- 230000003334 potential effect Effects 0.000 description 1
- 238000011324 primary prophylaxis Methods 0.000 description 1
- 238000012913 prioritisation Methods 0.000 description 1
- 230000002206 pro-fibrotic effect Effects 0.000 description 1
- 102000004196 processed proteins & peptides Human genes 0.000 description 1
- 230000000135 prohibitive effect Effects 0.000 description 1
- 230000002035 prolonged effect Effects 0.000 description 1
- VVWRJUBEIPHGQF-MDZDMXLPSA-N propan-2-yl (ne)-n-propan-2-yloxycarbonyliminocarbamate Chemical compound CC(C)OC(=O)\N=N\C(=O)OC(C)C VVWRJUBEIPHGQF-MDZDMXLPSA-N 0.000 description 1
- VVWRJUBEIPHGQF-UHFFFAOYSA-N propan-2-yl n-propan-2-yloxycarbonyliminocarbamate Chemical compound CC(C)OC(=O)N=NC(=O)OC(C)C VVWRJUBEIPHGQF-UHFFFAOYSA-N 0.000 description 1
- KCXFHTAICRTXLI-UHFFFAOYSA-N propane-1-sulfonic acid Chemical compound CCCS(O)(=O)=O KCXFHTAICRTXLI-UHFFFAOYSA-N 0.000 description 1
- QQONPFPTGQHPMA-UHFFFAOYSA-N propylene Natural products CC=C QQONPFPTGQHPMA-UHFFFAOYSA-N 0.000 description 1
- 125000004805 propylene group Chemical group [H]C([H])([H])C([H])([*:1])C([H])([H])[*:2] 0.000 description 1
- UORVCLMRJXCDCP-UHFFFAOYSA-M propynoate Chemical compound [O-]C(=O)C#C UORVCLMRJXCDCP-UHFFFAOYSA-M 0.000 description 1
- 229950008679 protamine sulfate Drugs 0.000 description 1
- 235000019833 protease Nutrition 0.000 description 1
- 235000019419 proteases Nutrition 0.000 description 1
- 108020001580 protein domains Proteins 0.000 description 1
- 230000004853 protein function Effects 0.000 description 1
- 238000001243 protein synthesis Methods 0.000 description 1
- 230000018883 protein targeting Effects 0.000 description 1
- 230000004850 protein–protein interaction Effects 0.000 description 1
- 230000005588 protonation Effects 0.000 description 1
- 125000004307 pyrazin-2-yl group Chemical group [H]C1=C([H])N=C(*)C([H])=N1 0.000 description 1
- 125000003373 pyrazinyl group Chemical group 0.000 description 1
- 125000003226 pyrazolyl group Chemical group 0.000 description 1
- 125000002098 pyridazinyl group Chemical group 0.000 description 1
- UMJSCPRVCHMLSP-UHFFFAOYSA-N pyridine Natural products COC1=CC=CN=C1 UMJSCPRVCHMLSP-UHFFFAOYSA-N 0.000 description 1
- 125000004076 pyridyl group Chemical group 0.000 description 1
- 125000000714 pyrimidinyl group Chemical group 0.000 description 1
- 125000000168 pyrrolyl group Chemical group 0.000 description 1
- 238000004445 quantitative analysis Methods 0.000 description 1
- 238000006862 quantum yield reaction Methods 0.000 description 1
- 150000003856 quaternary ammonium compounds Chemical class 0.000 description 1
- 230000000171 quenching effect Effects 0.000 description 1
- 239000001397 quillaja saponaria molina bark Substances 0.000 description 1
- 102000005962 receptors Human genes 0.000 description 1
- 108020003175 receptors Proteins 0.000 description 1
- 238000011084 recovery Methods 0.000 description 1
- 210000000664 rectum Anatomy 0.000 description 1
- 201000001281 rectum adenocarcinoma Diseases 0.000 description 1
- 238000000611 regression analysis Methods 0.000 description 1
- 230000000241 respiratory effect Effects 0.000 description 1
- 208000037803 restenosis Diseases 0.000 description 1
- 230000000717 retained effect Effects 0.000 description 1
- 239000003340 retarding agent Substances 0.000 description 1
- 238000012552 review Methods 0.000 description 1
- 206010039073 rheumatoid arthritis Diseases 0.000 description 1
- 101150024074 rub1 gene Proteins 0.000 description 1
- 239000012146 running buffer Substances 0.000 description 1
- YGSDEFSMJLZEOE-UHFFFAOYSA-M salicylate Chemical compound OC1=CC=CC=C1C([O-])=O YGSDEFSMJLZEOE-UHFFFAOYSA-M 0.000 description 1
- 229960004889 salicylic acid Drugs 0.000 description 1
- KZUNJOHGWZRPMI-UHFFFAOYSA-N samarium atom Chemical compound [Sm] KZUNJOHGWZRPMI-UHFFFAOYSA-N 0.000 description 1
- 229930182490 saponin Natural products 0.000 description 1
- 150000007949 saponins Chemical class 0.000 description 1
- 230000036573 scar formation Effects 0.000 description 1
- 230000037390 scarring Effects 0.000 description 1
- 229940116351 sebacate Drugs 0.000 description 1
- CXMXRPHRNRROMY-UHFFFAOYSA-L sebacate(2-) Chemical compound [O-]C(=O)CCCCCCCCC([O-])=O CXMXRPHRNRROMY-UHFFFAOYSA-L 0.000 description 1
- 125000002914 sec-butyl group Chemical group [H]C([H])([H])C([H])([H])C([H])(*)C([H])([H])[H] 0.000 description 1
- 238000002864 sequence alignment Methods 0.000 description 1
- 238000012163 sequencing technique Methods 0.000 description 1
- 230000000405 serological effect Effects 0.000 description 1
- 210000002966 serum Anatomy 0.000 description 1
- 238000007493 shaping process Methods 0.000 description 1
- 150000004760 silicates Chemical class 0.000 description 1
- 239000000377 silicon dioxide Substances 0.000 description 1
- 201000003708 skin melanoma Diseases 0.000 description 1
- 201000002612 sleeping sickness Diseases 0.000 description 1
- 239000012748 slip agent Substances 0.000 description 1
- 229940126586 small molecule drug Drugs 0.000 description 1
- 239000000344 soap Substances 0.000 description 1
- 229910000030 sodium bicarbonate Inorganic materials 0.000 description 1
- 229910000029 sodium carbonate Inorganic materials 0.000 description 1
- 235000019812 sodium carboxymethyl cellulose Nutrition 0.000 description 1
- 229920001027 sodium carboxymethylcellulose Polymers 0.000 description 1
- 235000019333 sodium laurylsulphate Nutrition 0.000 description 1
- 239000001488 sodium phosphate Substances 0.000 description 1
- 229910000162 sodium phosphate Inorganic materials 0.000 description 1
- 230000003381 solubilizing effect Effects 0.000 description 1
- 238000000527 sonication Methods 0.000 description 1
- 235000010199 sorbic acid Nutrition 0.000 description 1
- 239000004334 sorbic acid Substances 0.000 description 1
- 229940075582 sorbic acid Drugs 0.000 description 1
- 230000009870 specific binding Effects 0.000 description 1
- 230000003595 spectral effect Effects 0.000 description 1
- 239000008107 starch Substances 0.000 description 1
- 230000000707 stereoselective effect Effects 0.000 description 1
- 239000012536 storage buffer Substances 0.000 description 1
- 238000012916 structural analysis Methods 0.000 description 1
- 238000007920 subcutaneous administration Methods 0.000 description 1
- TYFQFVWCELRYAO-UHFFFAOYSA-L suberate(2-) Chemical compound [O-]C(=O)CCCCCCC([O-])=O TYFQFVWCELRYAO-UHFFFAOYSA-L 0.000 description 1
- KDYFGRWQOYBRFD-UHFFFAOYSA-L succinate(2-) Chemical compound [O-]C(=O)CCC([O-])=O KDYFGRWQOYBRFD-UHFFFAOYSA-L 0.000 description 1
- BDHFUVZGWQCTTF-UHFFFAOYSA-M sulfonate Chemical compound [O-]S(=O)=O BDHFUVZGWQCTTF-UHFFFAOYSA-M 0.000 description 1
- 230000000475 sunscreen effect Effects 0.000 description 1
- 239000000516 sunscreening agent Substances 0.000 description 1
- 239000000829 suppository Substances 0.000 description 1
- 238000003239 susceptibility assay Methods 0.000 description 1
- 238000013268 sustained release Methods 0.000 description 1
- 239000012730 sustained-release form Substances 0.000 description 1
- 239000000454 talc Substances 0.000 description 1
- 229910052623 talc Inorganic materials 0.000 description 1
- 235000012222 talc Nutrition 0.000 description 1
- 238000002626 targeted therapy Methods 0.000 description 1
- 230000008685 targeting Effects 0.000 description 1
- 235000002906 tartaric acid Nutrition 0.000 description 1
- 239000011975 tartaric acid Substances 0.000 description 1
- 229940095064 tartrate Drugs 0.000 description 1
- KKEYFWRCBNTPAC-UHFFFAOYSA-L terephthalate(2-) Chemical compound [O-]C(=O)C1=CC=C(C([O-])=O)C=C1 KKEYFWRCBNTPAC-UHFFFAOYSA-L 0.000 description 1
- 125000004213 tert-butoxy group Chemical group [H]C([H])([H])C(O*)(C([H])([H])[H])C([H])([H])[H] 0.000 description 1
- VHYXAWLOJGIJPC-UHFFFAOYSA-N tert-butyl n-(piperidin-4-ylmethyl)carbamate Chemical compound CC(C)(C)OC(=O)NCC1CCNCC1 VHYXAWLOJGIJPC-UHFFFAOYSA-N 0.000 description 1
- RLXCBXSJBGIUND-UHFFFAOYSA-N tert-butyl n-[2-[2-(6-chlorohexoxy)ethoxy]ethyl]carbamate Chemical compound CC(C)(C)OC(=O)NCCOCCOCCCCCCCl RLXCBXSJBGIUND-UHFFFAOYSA-N 0.000 description 1
- CKXZPVPIDOJLLM-UHFFFAOYSA-N tert-butyl n-piperidin-4-ylcarbamate Chemical compound CC(C)(C)OC(=O)NC1CCNCC1 CKXZPVPIDOJLLM-UHFFFAOYSA-N 0.000 description 1
- 208000002918 testicular germ cell tumor Diseases 0.000 description 1
- 125000003831 tetrazolyl group Chemical group 0.000 description 1
- 125000000335 thiazolyl group Chemical group 0.000 description 1
- 125000001544 thienyl group Chemical group 0.000 description 1
- 229960004072 thrombin Drugs 0.000 description 1
- 208000008732 thymoma Diseases 0.000 description 1
- 201000002510 thyroid cancer Diseases 0.000 description 1
- 208000013077 thyroid gland carcinoma Diseases 0.000 description 1
- JOXIMZWYDAKGHI-UHFFFAOYSA-N toluene-4-sulfonic acid Chemical compound CC1=CC=C(S(O)(=O)=O)C=C1 JOXIMZWYDAKGHI-UHFFFAOYSA-N 0.000 description 1
- 238000000492 total internal reflection fluorescence microscopy Methods 0.000 description 1
- 235000010487 tragacanth Nutrition 0.000 description 1
- 239000000196 tragacanth Substances 0.000 description 1
- 229940116362 tragacanth Drugs 0.000 description 1
- 238000001890 transfection Methods 0.000 description 1
- 238000013519 translation Methods 0.000 description 1
- 125000004306 triazinyl group Chemical group 0.000 description 1
- IMFACGCPASFAPR-UHFFFAOYSA-N tributylamine Chemical compound CCCCN(CCCC)CCCC IMFACGCPASFAPR-UHFFFAOYSA-N 0.000 description 1
- 125000000876 trifluoromethoxy group Chemical group FC(F)(F)O* 0.000 description 1
- 125000002264 triphosphate group Chemical group [H]OP(=O)(O[H])OP(=O)(O[H])OP(=O)(O[H])O* 0.000 description 1
- RYFMWSXOAZQYPI-UHFFFAOYSA-K trisodium phosphate Chemical compound [Na+].[Na+].[Na+].[O-]P([O-])([O-])=O RYFMWSXOAZQYPI-UHFFFAOYSA-K 0.000 description 1
- 150000003648 triterpenes Chemical class 0.000 description 1
- 230000003827 upregulation Effects 0.000 description 1
- 210000002700 urine Anatomy 0.000 description 1
- 201000005290 uterine carcinosarcoma Diseases 0.000 description 1
- 201000003701 uterine corpus endometrial carcinoma Diseases 0.000 description 1
- 230000002792 vascular Effects 0.000 description 1
- 235000013311 vegetables Nutrition 0.000 description 1
- 125000000391 vinyl group Chemical group [H]C([*])=C([H])[H] 0.000 description 1
- 230000003612 virological effect Effects 0.000 description 1
- 230000000007 visual effect Effects 0.000 description 1
- 238000012800 visualization Methods 0.000 description 1
- 238000005406 washing Methods 0.000 description 1
- 239000008215 water for injection Substances 0.000 description 1
- 239000001993 wax Substances 0.000 description 1
- 239000012130 whole-cell lysate Substances 0.000 description 1
- 210000002268 wool Anatomy 0.000 description 1
- 230000029663 wound healing Effects 0.000 description 1
- 229940071104 xylenesulfonate Drugs 0.000 description 1
- 150000003751 zinc Chemical class 0.000 description 1
- 229910052725 zinc Inorganic materials 0.000 description 1
- 239000011701 zinc Substances 0.000 description 1
Classifications
-
- C—CHEMISTRY; METALLURGY
- C07—ORGANIC CHEMISTRY
- C07H—SUGARS; DERIVATIVES THEREOF; NUCLEOSIDES; NUCLEOTIDES; NUCLEIC ACIDS
- C07H19/00—Compounds containing a hetero ring sharing one ring hetero atom with a saccharide radical; Nucleosides; Mononucleotides; Anhydro-derivatives thereof
- C07H19/02—Compounds containing a hetero ring sharing one ring hetero atom with a saccharide radical; Nucleosides; Mononucleotides; Anhydro-derivatives thereof sharing nitrogen
- C07H19/04—Heterocyclic radicals containing only nitrogen atoms as ring hetero atom
- C07H19/16—Purine radicals
- C07H19/167—Purine radicals with ribosyl as the saccharide radical
-
- A—HUMAN NECESSITIES
- A61—MEDICAL OR VETERINARY SCIENCE; HYGIENE
- A61P—SPECIFIC THERAPEUTIC ACTIVITY OF CHEMICAL COMPOUNDS OR MEDICINAL PREPARATIONS
- A61P33/00—Antiparasitic agents
-
- C—CHEMISTRY; METALLURGY
- C07—ORGANIC CHEMISTRY
- C07D—HETEROCYCLIC COMPOUNDS
- C07D241/00—Heterocyclic compounds containing 1,4-diazine or hydrogenated 1,4-diazine rings
- C07D241/02—Heterocyclic compounds containing 1,4-diazine or hydrogenated 1,4-diazine rings not condensed with other rings
- C07D241/10—Heterocyclic compounds containing 1,4-diazine or hydrogenated 1,4-diazine rings not condensed with other rings having three double bonds between ring members or between ring members and non-ring members
- C07D241/14—Heterocyclic compounds containing 1,4-diazine or hydrogenated 1,4-diazine rings not condensed with other rings having three double bonds between ring members or between ring members and non-ring members with hetero atoms or with carbon atoms having three bonds to hetero atoms with at the most one bond to halogen, e.g. ester or nitrile radicals, directly attached to ring carbon atoms
- C07D241/24—Carbon atoms having three bonds to hetero atoms with at the most one bond to halogen, e.g. ester or nitrile radicals
-
- C—CHEMISTRY; METALLURGY
- C07—ORGANIC CHEMISTRY
- C07D—HETEROCYCLIC COMPOUNDS
- C07D401/00—Heterocyclic compounds containing two or more hetero rings, having nitrogen atoms as the only ring hetero atoms, at least one ring being a six-membered ring with only one nitrogen atom
- C07D401/02—Heterocyclic compounds containing two or more hetero rings, having nitrogen atoms as the only ring hetero atoms, at least one ring being a six-membered ring with only one nitrogen atom containing two hetero rings
- C07D401/12—Heterocyclic compounds containing two or more hetero rings, having nitrogen atoms as the only ring hetero atoms, at least one ring being a six-membered ring with only one nitrogen atom containing two hetero rings linked by a chain containing hetero atoms as chain links
-
- C—CHEMISTRY; METALLURGY
- C09—DYES; PAINTS; POLISHES; NATURAL RESINS; ADHESIVES; COMPOSITIONS NOT OTHERWISE PROVIDED FOR; APPLICATIONS OF MATERIALS NOT OTHERWISE PROVIDED FOR
- C09B—ORGANIC DYES OR CLOSELY-RELATED COMPOUNDS FOR PRODUCING DYES, e.g. PIGMENTS; MORDANTS; LAKES
- C09B11/00—Diaryl- or thriarylmethane dyes
- C09B11/04—Diaryl- or thriarylmethane dyes derived from triarylmethanes, i.e. central C-atom is substituted by amino, cyano, alkyl
- C09B11/10—Amino derivatives of triarylmethanes
- C09B11/22—Amino derivatives of triarylmethanes containing OH groups bound to an aryl nucleus and their ethers and esters
Definitions
- This disclosure relates to assays to study or identify modulators (e.g., small- molecule modulators) of proteins of interest, and in particular to assays utilizing the Forster resonance energy transfer (FRET) between a donor and a acceptor that are bound or otherwise associated with the protein of interest.
- modulators e.g., small- molecule modulators
- FRET Forster resonance energy transfer
- An ideal assay platform enables the direct and quantitative measurement of the interaction between a ligand (e.g. small molecules, peptides or other biomolecules such as carbohydrates, lipids and nucleic acids) with a target protein of interest (POI), offers the flexibility to determine both thermodynamic and kinetic binding constants, and provides information on the binding modality (e.g.
- a ligand e.g. small molecules, peptides or other biomolecules such as carbohydrates, lipids and nucleic acids
- POI target protein of interest
- a target POI is expressed recombinantly as a fusion protein with an epitope tag to facilitate purification and/or enable specific labeling and detection (e.g. His6-tag, GST-tag, Flag-tag, HaloTag).
- an epitope tag e.g. His6-tag, GST-tag, Flag-tag, HaloTag.
- Such modifications not only greatly simplify protein production but can also be advantageous for assay development.
- epitope- tag fusion proteins is unsuccessful, or the epitope tag can interfere with protein function.
- the POI is a member of one or more defined multi-protein complexes and may exhibit differential affinities for small molecule ligands depending on the specific complex a POI resides in.
- the ability to selectively profile compounds for the POI in a specific complex type can be highly desirable but can be difficult to accomplish, particularly in the presence of other complex types carrying the POI.
- TR-FRET donors e.g., CoraFluors
- small -molecule ligands labeled with a FRET -acceptor e.g., a fluorophore
- FRET -acceptor e.g., a fluorophore
- Small molecule modulators e.g., inhibitors, activators, molecular glues
- proteins of interest biological targets relevant to human health and disease
- proteins of interest include anninoacyl tRNA synthesizes, specific histone deacetylase and histone deacetylase complexes, G- protein coupled receptors, and cysteine-rich proteins such as Keap1.
- the assays disclosed herein greatly simplify existing approaches, while improving sensitivity, flexibility, robustness and throughput. These assays enable, for example, a very sensitive high-throughput screening (HTS) for small-molecule drug candidates.
- HTS high-throughput screening
- the straightforward, single-step biochemical assay platform not only facilitates HTS, but also allows reliable ligand characterization, including kinetic and substrate-dependent profiling with accurate determination of binding affinities, binding kinetics, and mode of protein modulation (e.g., substrate-independent inhibition).
- the assays within the instant claims offer a unique advantage over existing assay platforms.
- the assay may be performed, for example, with as little as picomolar concentration of the protein of interest, which is >1,000 and 100-fold lower than current non -radioactive and radioactive assay platforms, respectively.
- the assay platform also allows to use live cell applications, which is not possible with current TR-FRET technologies.
- the present disclosure provides a compound of Formula
- the present disclosure provides a compound of Formula or a pharmaceutically acceptable salt thereof.
- this disclosure provides a compound of Formula (II): or a pharmaceutically acceptable salt thereof. In some embodiments, the present disclosure provides a compound of Formula (II): or a pharmaceutically acceptable salt thereof. In some embodiments, the present disclosure provides a compound of Formula (II): or a pharmaceutically acceptable salt thereof. In some embodiments, the present disclosure provides a compound of Formula (II): or a pharmaceutically acceptable salt thereof. In some embodiments, the present disclosure provides a compound of Formula (II): or a pharmaceutically acceptable salt thereof. In some embodiments, the present disclosure provides a compound of Formula (II): or a pharmaceutically acceptable salt thereof. In some embodiments, the present disclosure provides a compound of Formula (II): or a pharmaceutically acceptable salt thereof. In some embodiments, the present disclosure provides a compound of Formula (II): or a pharmaceutically acceptable salt thereof. In some embodiments, the present disclosure provides a compound of Formula (II): or a pharmaceutically acceptable salt thereof. In some embodiments, the present disclosure
- the present disclosure provides a compound of Formula or a pharmaceutically acceptable salt thereof.
- the present disclosure provides a compound of Formula
- the present disclosure provides a compound of Formula or a pharmaceutically acceptable salt thereof.
- the present disclosure provides a compound of Formula
- the present disclosure provides a compound of Formula
- the present disclosure provides a compound of Formula
- the present disclosure provides a pharmaceutical composition comprising a compound of Formula (B), or a pharmaceutically acceptable salt thereof and a pharmaceutically acceptable carrier.
- the present disclosure provides a method of inhibiting prolyl-tRNA-synthetase in a cell, comprising contacting the cell with a compound of Formula (B), or a pharmaceutically acceptable salt thereof.
- the present disclosure provides a method of inhibiting prolyl-tRNA-synthetase in a subject, comprising administering to the subject a compound of Formula (B), or a pharmaceutically acceptable salt thereof.
- the present disclosure provides a method of treating a disorder associated with glutamyl-prolyl-tRNA synthetase, prolyl-tRNA synthetase, or a combination thereof, the method comprising administering to a subject in need thereof a therapeutically effective amount of a compound of Formula (B), or a pharmaceutically acceptable salt thereof and a pharmaceutically acceptable carrier.
- the present disclosure provides a method of identifying a compound that modulates a protein of interest, the method comprising:
- the present disclosure provides a method of evaluating an interaction between a protein of interest and a modulator of the protein of interest, the method comprising:
- the present disclosure provides a method of determining an amount of a protein of interest in a sample, the method comprising:
- FIG. 1 TR-FRET background.
- FRET is the non-radiative energy transfer from a donor fluorophore to an acceptor fluorophore that requires (A) close proximity of the fluorophores, and (B) overlap the donor emission spectrum with the acceptor excitation spectrum.
- C TR-FRET utilizes the long excitation lifetime of lanthanides. The time delay between excitation and detection allows for virtual elimination of background signal.
- D The excitation (blue) and emission spectrum (green) of Lumi4Tb and CoraFluors show a large effective Stokes shifts and discrete emission bands.
- FIG. 2A TR-FRET assay scheme.
- TR-FRET is installed using various strategies, including (a) antibodies and nanobodies (b) biotin/streptavidin, (c) self- labeling protein tags (e.g. HaloTag), (d) direct chemical labeling (e.g. lysine or cysteine side chains). (e) Representative examples.
- the POI is tagged using a TR- FRET donor modified antibody. TR-FRET signal is observed upon binding of an acceptor labeled small molecule ligand. Competition with unlabeled ligands causes signal decrease.
- FIG. 2B TR-FRET-based ProRS assay design and validation.
- a Principle of His6-HaloTag-ProRS (HT-ProRS) ligand displacement assay.
- the TR-FRET donor is installed either via labeling of the HaloTag with CoraFluor-1 -functionalized HaloTag ligand (CoraFluor-1-Halo) and/or using a CoraFluor-1-labeled anti-His6 antibody (CoraFluor-1 -Pfp).
- Positive TR-FRET signal is observed upon binding of a suitable tracer labeled with a compatible fluorescence acceptor. Displacement of the fluorescent tracer by a test compound disrupts the signal .
- FIG. 2C Principle of TR-FRET-based PRS ligand displacement assays.
- A Structures of MAT334 and TR-FRET tracer MAT379 (FITC shown in green).
- the FRET donor can be installed via labeling of HaloTag (B), using a CoraFluor labeled tag-specific antibody (C), or by direct labeling of lysine residues using an amine reactive CoraFluor analog (D).
- B-D FRET acceptor for the identification of active site directed inhibitors
- FIG. 3 Dose-response titration of MATS 56 using either CoraFluor-1 -Halo- labeled HT-PfcProRS (0.5 nM) or CoraFluor-1 -Halo-labeled HT-HsProRS (1 nM), and MAT379 as tracer at 250nM (for PfcProRS, 2.5x KD and for HsProRS, 0.15x KD) in the absence or presence of 100 ⁇ M proline. Data in b are expressed as mean ⁇ SD (n ⁇ 2 technical replicates) and are representative of 1 independent experiment.
- FIG. 4 Synthesis and characterization of MAT574.
- b-c Dose-response titration of tracers MAT574.
- MAT379 and MAT425 using either CoraFluor-1 -Pfp-labeled P. aeruginosa ProRS (5 nM) or CoraFluor-1-Pfp-labeled S. aureus ProRS (5 nM) in the absence of substrates
- d-e Dose-response titration of proline with CoraFluor-1-Halo- labeled HT-HsProRS (1 nM) and MAT574 as tracer at 50 nM (0.69x KD).
- Data in b-e are expressed as mean ⁇ SD (n ⁇ 2 technical replicates) and are representative of 1 independent experiment.
- FIG. 5 b-j Dose-response titration ofPheRS tracer MAT588 using various PheRS constructs in the absence of substrates. Plots are labeled according to the method by which the CoraFluor-1 TR-FRET donor was installed (anti-His IgG-Tb is the same antibody setup described in Chapter 2). The CoraFluor-1-Halo (b, e, f, h) and CoraFluor-1 -Pfp (c, g, i, j) samples were run with 5 nM of the indicated PheRS.
- FIG. 6 b-c TR-FRET assay data for serial dilution of HEK293 cell lysates using either GluRS tracer MAT579 at 250 nM (b) or ProRS tracer MAT574 at 250 nM (3.5x KD) (c), and a constant CoraFluor-1 -labeled anti-EPRS detection mixture consisting of either “5 nM unlabeled ab31531 anti-EPRS polyclonal rabbit IgG antibody + 10 nM CoraFluor-1-Pfp-labeled CTK0101 anti-Rabbit-IgG secondary nanobody”, “5 nM CoraFluor-1-Pfp-labeled Proteintech 67712-1-lg anti-EPRS monoclonal mouse lgG2a antibody”, or “5 nM unlabeled CST45956 anti-EPRS polyclonal rabbit IgG antibody + 10 nM CoraFluor-1 -Pfp-
- Abcam ab31531 was raised against an Abcam- proprietary, recombinant, full-lengthHsGluProRS protein.
- Proteintech 67712-1-lg was raised against a peptide encoding HsGluProRS residues 1163-1512.
- Cell Signaling Technology CST45956 was raised against a peptide encoding residues surrounding HsGluProRSP978.
- CTK0101 ChoromTek anti-Rabbit-IgG secondary nanobody (single domain nanobody) was previously labeled with CoraFluor-1-Pfp and validated to bind Rabbit IgG antibodies with high affinity. Data in b-c are expressed as mean ⁇ SD (n ⁇ 2 technical replicates) and are representative of 1 independent experiment
- FIG. 7 ProRS inhibitor design and anti -Plasmodium activity, a, Schematic representation of the ProRS active site and binding mode of canonical substrates (proline, ATP, tRNAPro), halofuginone (1), and T-3767758 (2).
- the active site of ProRS constitutes three distinct substrate pockets, which hind the terminal adenosine (A76) residue of tRNAPro (red), proline (green), and ATP (yellow).
- Halofuginone binds in the tRNAPro and proline-binding pockets and requires the presence of ATP for tight binding (ATP -uncompetitive), while compound 2 targets the ATP-binding pocket and requires the presence of praline for tight binding (proline-uncompetitive).
- FIG. 7 Schematic representation of the ProRS active site and binding mode of canonical substrates (proline, ATP, tRNAPro), halofuginone (1), and T-3767758 (2).
- the active site of ProRS constitutes three
- FIG. 9 c Saturation binding of fluorescent tracer MAT379 to CoraFluor-1- labeled HT-PfcProRS (1 nM) in the absence or presence of 100 ⁇ M Pro or 500 ⁇ M ATP. TR-FRET ratios were background-corrected relative to 10 ⁇ M ProSA ( ⁇ 20,000x KD).
- d-f Dose-response titration of reference compounds using CoraFluor-1-labeled HT-PfcProRS (0.25-1 nM) and MAT379 as tracer at 2.5x KD (250 nM) in the absence (d) or presence of 100 ⁇ M Pro (e) or 500 ⁇ M ATP (f).
- ProSA is titrating HT-PfcProRS.
- g Dose-response titration of ProSA using CoraFluor- l-labeled HT-PfcProRS (20 pM), CoraFluor-1-labeled anti-His6 antibody (1 nM), and MAT379 as tracer at 2.5x KD (250 nM).
- h Saturation binding of fluorescent tracer MAT379 to CoraFluor-1-labeled HT-HsProRS (1.5 nM). TR-FRET ratios were background corrected relative to 10 ⁇ M ProSA ( ⁇ 20,000x KD), i-j.
- FIG. 10 Additional characterization of TR-FRET tracers MAT379 (2.4) and MAT425.
- a-b Saturation binding of fluorescent tracer MAT425 to (a) CoraFluor-1 - labeled HT-PfcProRS (1 nM) or (b) CoraFluor-1-labeled HT-HsProRS (1.5 nM).
- c Determination of dissociation kinetics for tracer MAT379.
- FIG. 11 Asexual blood stage P. falciparum activity of ATP-site targeted pyrazinamide-derived ProRS inhibitors.
- a-c In vitro characterization of pyrazinamides 4 (a), 6 (b), and 7 (c) in wildtype (Dd2-2D4; circles and solid lines), haiofuginone-induced (squares and dashed lines), and HFGR-I (triangles and dotted lines) ABS P. falciparum parasites.
- d-g In vitro characterization of ProRS inhibitors in Dd2-2D4 wildtype (d and g), halofuginone-induced (e), and HFGR-I (f) ABS P. falciparum parasites. Data in panels d and g was split for visualization purposes only.
- FIG. 13A-D structures of exemplified compounds.
- FIG. 14 Overlay of all TR-FRET-based ProRS assay data. Dose-response titration of ProRS inhibitors in the absence (a, d) or presence of 100 ⁇ M Pro (b, e) or 500 ⁇ M ATP (c, f) using CoraFluor-1-labeled HT-PfcProRS (0.020-1 nM) or HT ⁇ HsProRS (0.050- 1.5 nM) and MAT379 as tracer at 250 nM (2.5x KD for HT- PfcProRS and 0.15x KD for HT-HsProRS). Compounds marked with * were supplemented with 1 nM CoraFluor-1-labeled anti ⁇ His6 antibody. Compounds marked with ** were titrating ProRS under these conditions. Data are expressed as mean ⁇ s.d. (n ⁇ 2 technical replicates) and are representative of ⁇ 2 independent experiments.
- FIG. 15 Correlation between TR-FRET pKD values and P. falciparum asexual blood stage grow th assay pEC50 values.
- a Comparison of TR-FRET pKD values for HT-HsProRS (x-axis) vs HT-PfcProRS (y-axis).
- b Comparison of asexual blood stage (ABS) P. falciparum Dd2-2D4 pEC50 (x-axis) vs HT-PfcProRS TR-FRET pKD value (y-axis).
- Data are expressed as the respective mean values and are representative of ⁇ 2 independent experiments.
- TR-FRET pKD values shown are from the highest affinity conditions (i.e.
- FIG. 16 NCP26-resistance selection and whole genome sequence analysis, a, In vitro activity of NCP26 against ABS P. falciparum Dd2-2D4 (parent) or subclones from three independent resistance selection experiments (S1-3). S1 did not yield resistant parasites and S1 - clone A8 was included for comparison, b, vitr Ion activity of reference compounds against Dd2-2D4 (parent) or subclones from each selection (SI -3).
- Reference compounds include PfcProRS inhibitors (halofuginone and halofugmol) and non-PfcProRS inhibitors dihydroartemisinin (DHA) and borreiidm (P.
- FIG. 17 a, Chemical structures of pyrazinarnide-proline hybrids (absolute stereochemistry). b, Overlay of the co-crystal structures of PfcProRS (grey surface) in complex with proline (orange sticks) and either NCP26 (PDB: 6T7K, yellow sticks), MAT334 (29) (PDB: 7QC2, green sticks), and MAT345 (30) (PDB: 7QB7, pink sticks) shows the prolyl-substituents of MAT334 and MAT345 pointing outside the active site.
- TR-FRET assay data in c and d are expressed as mean ⁇ s.d. (n ⁇ 2 technical replicates) and are representative of at least 2 independent experiments.
- FIG. 18 Data collection and refinement statistics for PfcProRS ligand complexes. Data were collected from one crystal for each structure. Statistics for the highest-resolution shell are shown in parentheses.
- FIG. 19 Characterization of dual-site ligands binding HsProRS in the absence or presence of proline. Dose-response titration of pyrazinamide-proline hybrids in the (a) absence or (b) presence of 100 ⁇ M Pro using CoraFluor-1 -labeled HT-HsProRS (1.5 nM) and MAT379 as tracer at 0.15x KD (250 nM). Data are expressed as mean ⁇ s.d. (n ⁇ 2 technical replicates) and are representative of ⁇ 2 independent experiments.
- FIG. 20 Structural comparison of free and ligand-bound HsProRS.
- a Overlay of HsProR S crystal structures in the apo state (green, PDB: 4K86). bound to proline alone (yellow and pink, respectively; PDB: 70SY), and bound to both proline and 2 (blue, orange, and white, respectively; PDB: 5VAD) reveals significant allosteric structural changes upon proline binding, including the ATP -binding pocket and the active site entry. Selected residues in and adjacent to the active site are shown as lines.
- b Apo crystal structure of HsProRS (PDB: 4K86).
- FIG. 21 Conventional assay platforms for measuring protein levels and target engagement.
- A Western blot, where proteins are separated by SDS-polyacrylamide gel electrophoresis (SDS-PAGE), transferred to nitrocellulose membranes, and are detected with a primary antibody/HRP-linked secondary system with photodetection as the readout.
- B Sandwich enzyme-linked immunosorbent assay (ELISA). An immobilized capture antibody first binds the POI After, an enzyme-conjugated detection antibody is added and protein is detected via colorimetric readout.
- C Homogenous time-resolved fluorescence (LITRE) immunoassay. Similar to a sandwich ELISA, orthogonal antibody pairs are used.
- LITRE Homogenous time-resolved fluorescence
- TR-FRET ligand displacement assay Recombinant, epitope- tagged proteins are incubated with a TR-FRET donor-labeled anti-epitope tag antibody and a fluorescent tracer. Subsequent addition of test compounds displace the fluorescent tracer, resulting in a decrease in TR-FRET signal.
- FIG. 22 A single -antibody TR-FRET platform to quantitatively measure small molecule target engagement and endogenous protein levels in whole cell extracts.
- A Quantification of both small molecule target engagement and protein levels with endogenous protein targets, here for BRD4.
- the detection mix consists of a single primary antibody, CoraFluor-1-labeled nano-secondary, and a fluorescent JQ1 -based tracer.
- (C) TR-FRET-based BRD4 quantification (see STAR Methods) in serially diluted MCF7 cell lysate shows linearity over approximately three orders of magnitude (n 2).
- (D-F) Dose-titration of small molecule inhibitors and degraders in TR-FRET ligand displacement assays with (D-E) recombinant BRD4(BD1) and BRD4(BD2) domains, and (F) endogenous BRD4 in MCF7 cell extract (0.8 mg/mL total protein) (n 2). Data were fited to a four-parameter dose-response model in Prism 9. Data in (C-F) are expressed as mean ⁇ SD of n technical replicates and are representative of at least two independent experiments.
- FIG. 23 Determination of apparent equilibrium dissociation constant for JQ1- FITC to recombinant bromodomains and endogenous BRD4.
- Conditions include (A) 0.5 nM GST- BRD4(BD1), 2 nM CoraFluor-1 -labeled anti-GST VHH, (B) 0.5 nM GST-BRD4(BD2), 2 nM CoraFluor-1 -labeled anti -GST VHH, (C) 0.8 mg/mL total protein MCF7 lysate, 0.5 nM rabbit anti- BRD4 IgG, 1 nM CoraFluor-1-labeled anti- rabbit nano-secondary (endogenous BRD4).
- FIG. 24 contains a table showing apparent equilibrium dissociation constants for individual recombinant bromodomains and endogenous BRD4 determined by biochemical TR-FRET ligand displacement assays.
- FIG. 25 contains a table showing cellular degradation constants for small molecule BRD4 degraders determined by TR-FRET.
- FIG. 26 contains a table showing apparent equilibrium dissociation constants for CS and CS-JQ1 toward Keapl-Kelch and Keapl-BTB domains.
- FIG. 27 TR-FRET-based quantification of BRD4 levels in unmodified cell lines after degrader treatment.
- BRD4 protein levels in cell lysate after 5 h treatment with dBET6 (positive control) and JQ1 (negative control) were measured with TR- FRET assay as described in Figure 1A.
- Assays were run in a 24-well plate format with either (A) MCF7 or (B) MDA-MB-231 cells. Cells were lysed and BRD4 was quantified via addition of TR- FRET detection mix (see STAR Methods). The total time between cell treatment and TR- FRET measurement was ⁇ 1.5 h.
- Data in (A-D) are expressed as mean ⁇ SD of n biological replicates.
- FIG. 28 Assay miniaturization and assessment of robustness in 96-well plate format.
- MDA-MB-231 cells (20,000 cells/well) in 96-well plates were treated with a dose- titration of dBET6 or JQ1 for 5 h.
- BRD4 levels were quantified via subsequent addition of lysis buffer (60 ⁇ L) and detection mix (TO ⁇ L) followed by TR-FRET signal acquisition after 1 h incubation (see STAR Methods).
- FIG. 29 Z -factor measurement for CellTiter-Glo 2.0.
- the Z'-factor is a statistical measure of assay quality using control data, in this case the negative control being lysis buffer in the absence of cell extract (no cellular ATP) and was found to be 0.83, indicating an excellent assay. Data are representative of two independent experiments.
- FIG. 30 contains chemical structures of CDDQ and CDDO-Me. Thiophilie site is shown as a grey circle.
- FIG. 31 A shows that DCastrol is a powerful E3 ubiquitin ligase recruiter for targeted protein degradation applications.
- the figure shows chemical structures of DCDQ and CDDO-Me.
- CS ubiquitin ligase recruiter for targeted protein degradation applications.
- the figure shows chemical structures of DCDQ and CDDO-Me.
- CS-JQI celastrol-JQ 1
- FIG. 31B shows quantification of target engagement of CS-JQi with recombinant BRD4(BD1).
- BRD4(BD2), and endogenous BRD4 in MCF7 cell extracts (n 2).
- FIG. 31E shows TR-FRET quantification of BRD4 levels in MCF7 andMDA- MB-231 cells after treatment with dose-titrations of CS-JQI for 5 h in 24- well plate assay format.
- FIG. 31F shows western blot analysis of the same samples used for TR-FRET quantification in FIG. IE.
- FIG. 31G shows western blot analysis of the same samples used for TR-FRET quantification in FIG. 1E.
- Data in FIG. 1B - FIG. 1D are expressed as mean ⁇ SD of n technical replicates and are representative of at least two independent experiments.
- Data in FIG. 1E - FIG. 1J are expressed as mean ⁇ SD of n biological replicates.
- FIG. 32A shows HSFP6xHis expression and Ni-NTA purification.
- FIG. 32B shows labeling of HSFP6xHis by Cora-1-Halo and Cora-1-SNAP.
- FIG. 32C shows labeling of EGFP-HaloTagin live cells cwith Cora-2-Halo.
- FIG. 33 Chemical structures, photophysical and physicochemical characterization of representative CoraFluors. Chemical structures of (a) Lumi4TM ligand (Cisbio, PerkinElmer), (b) carboxylinker-modified ligands (1-3) and CoraFluors (4-6), (c) CoraFluors functionalized as HaloTag, SNAP-tag, and active ester derivatives, (d) linker-less core complexes 12-14.
- FIG. 34 Biochemical validation of CoraFluors with HSFP6xHis test system.
- FIG. 35 CoraFluors enable versatile and domain-specific interrogation of Keapl ⁇ Kea.pl and Keapl -small molecule interactions .
- CoraFluors enable TR-FRET based target engagement profiling in live cells.
- FIG. 38E Time-dependent stability profiling: the stability of terbium complexes (5 nM) to various concentrations of ethylenediaminetetraacetic acid
- FIG. 38F Time-dependent stability profiling: the stability of terbium complexes (5 nM) to various concentrations of diethylenetriaminepentaaeetic acid (DTPA ; 0.1 , 1, 25 mM) at room temperature (pH 7.5) was monitored over seven days.
- DTPA diethylenetriaminepentaaeetic acid
- FIG. 38G Cora-1-Halo and Cora-1-SNAP are efficient substrates for their self- labeling protein tags (HaloTag, SNAP-tag, respectively).
- the competition of TMR- Halo and TMR-SNAP labeling of HSFPbxHis construct via the respective CoraFluor complexes (2 h incubation) was assessed by SDS-PAGE and Cy3 fluorescence gel imaging (Typhoon FLA 9500).
- the CoraFluor complexes are not fluorescent under Cy3 fluorescence gel imaging.
- FIG. 3811 Chemical structures of HaloTag and SNAP-tag ligands used in this study.
- FIG. 38I Qualitative monitoring of HDACl-HaloTag expression, localization and transfection efficiency via fluorescence imaging with TMR-Halo.
- HEK293T cells were seeded into 24-well plates (Coming) at 50,000 cells/well in phenol red-free culture media and allowed to recover for 24 h. Cells were then transfected with pFC14A-HDACl-HaloTag/PEI cocktail (see Methods) and grown for an additional 24 h before the addition of 100 nM TMR-Halo to the media.
- FIG. 38K Inhibition of HaloTag labeling by Roche cOmpleteTM Protease Inhibitor Cocktail tablets and an unknown component(s) ofLB-Miller broth.
- Purified HSFP6xHis conjugates labeled with either Cora-1-SNAP alone or Cora-1-SNAP/ Ac- Halo (negative control) were diluted into different buffers to 25 nM then FITC-Halo was dose-titrated from 0 to 200 nM (2 h incubation). Corrected TR-FRET ratios were obtained via subtraction of the pre-blocked (Ac-Halo) negative control on a per-buffer basis.
- Buffer recipes are as follows: PBS, 50 inM sodium phosphate, 150 mM NaCl, 0.05% (v./v) TWEEN-20, pH 7.5; Lysis buffer 1, 50 mM Tris, 150 mM NaCl, 2 mM DTP, 1% (v/v) Triton X-100, 0.1% (w/v) sodium deoxyehoiate, pH 7.5; Lysis buffer 2, 50 mM Tris, 150 mM NaCl, 0.8%) (v/v) IGEPAL-CA630, 5% glycerol, 1.5 mM MgCl 2 , 2 mM DTP, pH 7.5; HDAC buffer, 50 mM HEPES, 100 mM KCl, 0.5 mg/mL BSA, 0.001% (v/v) Tween-20, pH 7.5; LB Broth, Luria-Bertani broth (MilliporeSigma 71-753-5).
- FIG. 39A Three-dimensional representation of CoraFluor complex. Model of macrotricyclic terbium complex with tertiary amide linker attachment (upper left).
- the model was generated in Chem ⁇ 3D (ChemDraw, PerkinElmer, Waltham, MA).
- the terbium center is shown as a green sphere.
- FIG. 39B Synthetic scheme to access CoraFluor ligands .
- Reagents and conditions (a) TsCl, K 2 CO 3 , H 2 O, rt, 48 h; (b) NaOH, H 2 O, 0°C, 2 h (43% over 2 steps); (c) ethylenediamine, 10 mol p -TsOH, MePh, 60°C, 24 h (92%); (d) HBr, AcOH, 115°C, 24 h (> 95%); (e) ethyl 6-bromohexanoate, K 2 CO 3 , ACN, 80°C, 12 h then KOH , H 2 O, 95°C, 2 h; (f) HBr, AcOH, 115% .
- FIG. 40 CoraFluor-2 exhibits improved excitability at 405 rim.
- (a) Visual comparison of luminescence intensities of CoraFluors under constant illumination with a 365 nm LED (left image) or a 405 nm laser diode (right image) demonstrates significantly enhanced luminescence intensity of Cora-2-Halo compared to Cora-1- Halo with 405 nm but not 365 nm excitation. Excitation light is passed through the adjacent samples from the left, eliminating potential light filtering effects from Cora- 2 -Halo, which exhibits a higher molar absorptivity at the tested wavelengths. (10 ⁇ M CoraFluor in 50 mM HEPES buffer, pH 7.4).
- FIG. 41 Select photophysical characterization data for CoraFluors and linkerless complexes.
- (b) Background-corrected decay curves and calculated luminescence lifetimes for linker- less (12-14) and select CoraFluor complexes. Luminescence intensity values were normalized, ln-transformed and linear regression analysis was performed in Prism 8. Data are represented as means ⁇ SD of fifty replicates (n 50).
- FIG. 42 Characterization of Keapl fluorescent tracers and their use in single- ligand displacement TR-FRET assays.
- (a-e) Saturation binding of (a) FITC-KL9 against Keapl (His/GST) construct (1 nM) with 0.5 nM Tb-Anti-6xHis, (b) Cora-1- KL9 against Keapl (His/GST) construct (1 nM) with 0.5 nM AF488-Anti-6xHis, (c) FITC/Cora-1-KL9 mixture against Keapl (tag-free) construct (1 nM), (d) CDDO- FITC against Keapl (His/GST) construct (1 nM) with 0.5 nM Tb-Anti-6xHis, and (e) CDDO-FITC against Keapl (tag-free) construct (5 nM) with 5 nM Cora-1-KL9.
- K d and K d,app were calculated in Prism 8 (GraphPad Software) using a one-site-binding (a-d) or four-parameter (e) nonlinear regression fit model.
- a-d one-site-binding
- e four-parameter
- f-g Dose-response curves for Keapl inhibitor test set as measured in TR-FRET assays with recombinant, full-length Keapl with N-terminal 6xHis/GST tags and FITC-KL9 tracer (t) or CDDO-FITC tracer (g).
- FIG. 43 Cell permeability profiling of select CoraFluors with EGFP-HaloTag expression construct.
- FIG. 44 Mammalian expression and lysate-based quantification of HDACl- HaloTag construct.
- the concentration of Cora-1-Halo labeled HDACl-HaloTag in the lysate can accurately be determined via a reference calibration curve (here measuring Tb emission at 548 nm, 340/50 excitation, 100 ⁇ s delay, 400 ⁇ s integration, 0-230 nM and 10 nM increment calibration curve).
- HDACl- HaloTag (Cora-1-Halo labeled) in HEK293T cell overexpression lysate with AF488-HaloTrap.
- the labeled lysate was diluted 1: 12 (275 ⁇ g/mL total protein) and incubated with varying concentrations of HaloTrap- AF488 (0-150 nM, 16-point).
- FIG. 45 Biochemical validation of HDAC fluorescent tracers and inhibitors with purified, recombinant protein.
- SAHA-NCT Saturation binding curves for fluorescent HDAC tracers (SAHA-NCT, M344-FITC) using recombinant HDAC1.
- HDAC1 His/FLAG; 50051; BPS Biosciences Inc
- 2.5 nM Tb-Anti-6xHis IgG 20 nM SAHA-NCT or 70 nM M344-FTTC, 3 h incubation .
- 5 nM HDACT His/FLAG; 50051; BPS Biosciences Inc
- 18 ⁇ M MAZ1600 substrate 3x KM
- FIG. 46 Profiling cellular response of HDAC inhibitors with 0.25 ⁇ M SAHA- NCT.
- Conditions: 25,000 cells/well (384-well plate; Corning 3574), 4 h incubation at 37°C and 5% CO 2 . See Table herein for measured EC 50 and apparent K i (K i, app ) values. Data are represented as means ⁇ SD of six replicates (n 6).
- FIG. 47A schematically shows assay for proteins of interest with two or more binding sites.
- FIG. 47B schematically show's assay for proteins of interest with multiprotein complex.
- FIG. 48 schematically shows assay for membrane-bond proteins of interest.
- FIG. 49 Quantification of BRD4 protein in MCF7-cell lysate: Condition 1) 1 nM Ab, 2 nM Tb-nano-secondaxy, 20 nM JQ1-FITC, 2) 0.5 nM Ab, 1 nM Tb-nano- secondary, 10 nM JQ1-FITC, 3) 0.25 nM Ab, 0.5 nM Tb-nano-secondaiy, 5 nM JQ1- FITC, 4) 0.125 nM Ab, 0.25 nM Th-nano-secondary, 2.5 nM JQ1-FTTC, 5) 10 nMJQ1 mix, 6) 5 nM JQ1 mix, 7) 2.5 nM JQ1 mix, 8) 1.25 nM JQ1 mix.
- FIG. 50 Quantification of BRD4 protein in MCF7- cell lysate following dBET6 treatment: MCF7 cells were seeded at 600k/well in 6-well plates and allowed to recover overnight. Cells treated either with DM80 (0.25%) or 250 nM dBET6 for 5 h. Cells were washed and lysed in 250 uL lysis buffer/well for 30 min at 4C. insoluble matter was removed by centrifugation. Cleared lysate was added (30 uL) to 384-well plate and then add 7x detection mix 0.5 nM rabbit anti-BRD4, 1 tiM rabbit-nano secondary -Tb, 10 nM JQ1-FITC FIG.
- HEK293T cell were incubated in the presence and absence of Dil (3 ⁇ M) with aTb-labeled anti CD44 antibody (10 nM), or with a Tb-labeled anti -GST antibody (10 nM) in the presence of Dil (background control).
- Dil 3 ⁇ M
- aTb-labeled anti CD44 antibody 10 nM
- a Tb-labeled anti -GST antibody 10 nM
- B structures of MCP415 and NCP189 Tb-complexes
- MCF7 cells were incubated with 1 ⁇ M NCP415 or NCP189 in the presence of Dil.
- FIG. 52 HDAC isoform and complex specific assays for lysate and cell-based applications.
- the HDAC isoform (A) of interest or a member protein (B) of a specific HDAC complex is expressed as HaloTag fusion protein for labeling with an HaloTag- figand functionalized CoraFluor or alternative an CoraFluor -labeled specific antibody is used to install the TR-FRET donor.
- a fluorophore tagged HDAC inhibitor will be used as TR-FRET acceptor. This approach will then be used in a ligand displacement assay for small molecule inhibitor profiling.
- the tag-free approach was be validated using the pairwise combination of CoraFluor - and acceptor-functionalized HDAC inhibitors.
- TR-FRET-based assays stand out with superior sensitivity, unparalleled flexibility, and assay robustness.
- the signal is generated by energy transfer from a donor with a long luminescence lifetime to an acceptor fluorophore when in close proximity to each other (within 5-10 nm, approximately the size of anucleosorne).
- the time gated measurement allows for the virtual elimination of non-specific background signals originating from scattered excitation light and autofluorescence of screening compounds, buffer reagents and assay plates, while the FRET component limits the readout to acceptor molecules that are in immediate proximity of the donor. This approach therefore enables the quantitative measurement of the interaction of biomolecules and/or small molecule ligands with superior sensitivity.
- TR-FRET assays are target agnostic and many TR-FRET based assays have been published and/or are commercially available. Most TR-FRET assay platforms are l igand displacement assays that measure the disruption of a TR-FRET pair and not the enzymatic turnover of a substrate (e.g. fluorogenic or luminescent) that generates a specific signal. This strategy allows for a real-time readout and is beneficial for POI that lack enzymatic activity or have inherently low turnover rates.
- a substrate e.g. fluorogenic or luminescent
- TR-FRET assays generally follow the same canonical scheme ( Figure 2A).
- the POI is tagged with a TR-FRET donor (generally a luminescent terbium or europium complex) using a) a donor-modified specific antibody or nanobody, or combination thereof, b) donor-modified streptavidin if the POI is biotinylated, c) functionalized via a self-labeling protein tag such as HaloTag, SNAP-tag or CLIP-tag, d) or directly covalently labeled by reaction of lysine and cysteine side chains with active ester (e.g. NHS-esters, isothiocyanates) and malemide-functionalized donors, respectively.
- active ester e.g. NHS-esters, isothiocyanates
- the assay is designed to study protein-small molecule interaction, a small molecule ligand with sufficiently high affinity labeled with a suitable fluorophore to function as FRET acceptor is used as a tracer. The tracer is then incubated at fixed concentration with the donor-tagged POI in the presence of varying concentrations of test compound. Measurement of the dose-dependent change of the TR-FRET signal enables determination of the binding affinity of the test compounds. While the positions of acceptor and donor label can be switched, the high costs and limited availability of conjugatable TR-FRET donors are generally prohibitive for small molecule labeling. If the assay is designed to measure a protein-protein interaction, both binding partners are orthogonally tagged with a TR-FRET donor and acceptor, respectively. In some cases, fluorescent proteins can be used as acceptors instead of small molecule fluorophores. To determine specific posttranslational modifications or the abundance of a POI, orthogonally labeled complementary antibody pairs are used. Exemplary assay platforms
- the present disclosure provides assays for studying interactions between a modulator compound of a protein of interest and the protein of interest itself.
- the assay can be used to determine binding and other characteristics between the compound and the protein, or to determine concentration of the protein in a sample (e.g., aqueous buffer, live cells, or cell lysate).
- the assay can be used to identify novel modulators of the protein, for example, using a ligand displacement strategy.
- the cell is implicated in the pathologies of a disease or conditions (e.g., any of the diseases described herein).
- the cell is a cancer cell or a brain cell affected by a neurodegenerative condition.
- the present disclosure provides a method of identifying a compound that modulates a protein of interest, the method comprising:
- step (v) determining whether the intensity of fluorescence detected from the FRET acceptor moiety in step (iv) is decreased compared to the intensity of fluorescence detected from the FRET acceptor moiety in step (ii), wherein said decrease in fluorescence intensity in an indication that the test compound is the modulator the protein of interest.
- the method is a high-throughput screening method.
- the method can be earned out using suitable screening robots handling multiwall assay plates.
- the plates can be made of glass or plastic or any other suitable material that allows for FRET applications (such as a material that allows the excitation light to reach the FRET donor and allows the fluorescence from the FRET acceptor to reach the measuring device).
- the piate may contain 96, 192, 384, 1536, 3456, ro 6144 wells as appropriate. A skilled chemist or an engineer would be able to select and implement appropriate HTS equipment.
- the sample provided in step (i) may be placed, for example, in one of the wells of the multiwall plate.
- Step (i) can be carried out, for example, by obtaining a protein of interest attached to FRET donor (as discussed below) and admixing it with the ligand attached to FRET acceptor moiety (obtained as discussed below).
- the two components may be allowed to equilibrate for a period of time sufficient for the ligand to bind to the protein of interest.
- the sample can be equilibrated for about 10 min, about 30 min, about 1 hour, about 2 hours, or about 3 hours.
- the sample may also contain a carrier liquid, such as water or a buffer solution to facilitate the binding.
- a concentration of the protein of interest in the sample may range from about 1 pM to about i ⁇ M, or from about 1 pM to about i nJVl.
- the ligand attached to FRET acceptor is any one of the tracer compounds of Formulae (I)-(VH), or a pharmaceutically acceptable salt thereof. Concentation of the tracer in the sample may also range from about 1 pM to about 1 ⁇ M, or from about 1 pM to about 1 nM.
- said detecting of fluorescence may be carried out using fluorescent microscopy, fluorescent imaging probe, or fluorescent spectroscopy.
- both the excitation of the donor and detection (and measurement) of fluorescence of the acceptor can be performed using a single piece of equipment. Excitation can be earned out using a UV lamp or a laser.
- photomultiplier (PMT) or charge-couple device (CCD) can be used to detect and quantify emitted photons.
- CCD charge-couple device
- total internal reflection fluorescence microscopy, light sheet fluorescence microscopy, or fluorescence- lifetime imaging microscopy can be used.
- the amount of time between exciting the FRET donor and reading fluorescence output from FRET acceptor can be from about 1 sec to 10 min, from about 5 sec and about 5 min, from about 10 sec to about 2 min, or from about 30 sec to about 1 min.
- the wavelength of the light capable of being absorbed by the FRET donor moiety is from about 300 am to about 400 nm.
- the wavelength emitted by the FRET acceptor moiety is from about 450 nm to about 600 nm.
- a skilled analytical chemist would be able to tune the equipment as necessary depending to the particular excitation and fluorescent characteristics of the FRET pair used in the method.
- Step (iii) can be carried out by adding a solution of a tes t compound or compounds to the sample provided in step (i).
- a solution of the test compound of suitable concentration from about 1 pM to about 1 ⁇ M
- an aqueous solvent or an organic solvent such as DMSO can be pipeted to the sample manually or robotically.
- the compound is an inhibitor of a protein of interest (substrate-competitive orthosteric inhibitor, substrate-noncompetitive orthosteric inhibitor, or allosteric inhibitor).
- the test compound is an antagonist or a partial antagonst of the function of the protein.
- the compound is an activator of a protein of interest.
- the test compound is an agonist or a partial agonist of the protein of interest.
- affinity of the ligand attached to the FRET acceptor moiety to the protein of interest is less than affinity of the test compound to the protein of interest.
- affinity of the ligand may be from about 100 to about 200 nM, while affinity of the test compound may be from about 10 nM to about 100 nM.
- affinity of the test compound is about 2 ⁇ , about 4 ⁇ , about 10 ⁇ , about 20 ⁇ , about 50 ⁇ , about 100 ⁇ , or about 200 ⁇ greater compared to affinity of the ligand.
- Step (iv) may be carried out in a manner similar to step (ii) above, by detecting and, if necessary, quantifing the fluorescence signal using a microscopy or spectroscopy device and associated software.
- the following step (v) of comparing the fluorescence intensity of step (iv) and the fluorescence intensity of step (ii) can be carried out using any suitable device or a piece of software. Without being bound by any particular theory, it is believed that the decrease in the intensity of fluorescence signal in step (iv) compared to step (ii) indicates that the test compound has bond to the protein of interest and thereby displaced the fluorescent tracer, which is in turn indicative of the fact that the test compound is a modulator of the protein of interest.
- the test compound has the same mode of action as the tracer (e.g., the test compound and the tracer are both inhibitors of the protein of interest). In other embodiments, the test compound and the tracer have different mode of action (e.g., the test compound is a substrate-competitive inhibitor and the tracer is allosteric inhibitor).
- the fluorescence intensity in step (iv) is about 2x, about 4 ⁇ , about 5 ⁇ , about 10 ⁇ , about 20 ⁇ , about 50 ⁇ , or about 100 ⁇ less than in step
- the fluorescent FRET acceptor moiety is selected from fluorescein, AF488, hydroxycoumarin blue, methoxycoumarin blue, alexa fluor blue, aminocoumarin blue, Cy2 green (dark), FAM green (dark), alexa fluor 488 green (light), fluorescein FITC green (light), alexa fluor 430 green (light), Alexa fluor 532 green (light), HEX green (light), Cy3 yellow, TRITC yellow, Alexa fluor 546 yellow, Alexa fluor 555 3 yellow, R-phycoerythrin (PE) 480; yellow, Rhodamine Red-X orange, Tamara red, Cy3.5 581 red, Rox red, Alexa fluor 568 red, Red 613 red, Texas Red red, Alexa fluor 594 red, Alexa fluor 633 red, Allophycocyanin red, Alexa fluor 633 red, Cy5 red, Alexa fluor 660 red, Cy5.5 red, TruRed red, Alexa fluor 680 red
- the waive! ength of emitted light (e.g., maximum of emittance) for each of these FRET acceptor moiteis is well-known in the literature.
- the chemist can adjust the selection of FRET donor and the various parameters of the step (ii) process, e.g., to ensure that the energy can be efficienty transferred from the donor moiety or the acceptor moiety.
- the FRET acceptor moiety has formula:
- the FRET donor moiety comprises a complex of a lanthanide metal with a moiety of formula (i): wherein: each X 1 is independently selected from halo, NO 2 , CN, N 3 , C 1-6 alkyl, C 1-6 alkoxy, C 2-6 alkenyl, C 2-6 alkynyl, C 6-10 aryl, and 5-14 membered heteroaryl, wherein said C 1-6 alkyl, C 2-6 alkenyl, C 2-6 alkynyl, C 6-10 aryl, and 5-14 membered heteroaryl are each optionally substituted with 1, 2, or 3 substituents independently selected from halo, OH, SH, NH 2 , C 1-3 alkylamino, di(C 1-3 alkyl)amino, NO 2 , CN, C(O)OH, C 1-3 alkoxy, C 1-3 haloalkoxy, and N 3 ; and each R 1 is independently selected from H, C 1-6 alkyl
- each X 1 is independently a H or a halo.
- each X 1 is H.
- each X 1 is Cl or Br.
- one of R* is selected from C 1-6 alkyl, C 2-6 alkenyl, and C 2-6 alkynyl, each of which is optionally substituted with 1, 2, or 3 substituents independently selected from halo, OH, SH, NH 2 , C 1-3 alkylamino, di(C 1-3 alkyl)amino, NO 2 , CN, C(O)OH, C 1-3 alkoxy, C 1-3 haloalkoxy, and N 3 ; and the remaining R 1 groups are all H.
- each R 1 is H.
- the moiety of formula (i) has formula:
- the moiety of formula (i) has formula:
- the moiety of formula (i) has formula:
- the lanthanide metal is selected from Tb (terbium), Eu (europium), 8m (samarium), and Dy (dysprosium). In some embodiments, the lanthanide metal is Tb 3+ .
- the protein of interest is selected from an enzyme, a cell-surface receptor, nuclear hormone receptor, a transporter, a G-protein coupled receptor, a CD marker, a voltage-gated ion channel, a nuclear factor, a nuclear receptor, a protein-protein or protein-peptide interaction domain, scaffolding protein, structural protein, transcription factor, chaperone, and assembly /disassembly factor.
- the enzyme is selected from kinases, proteases, deacetylases, ATPases, GTPases, phosphatases, peptidases, synthetases, phosphorilases, and nucleosidases.
- the protein of interest is selected from KEAP1 protein, bromodomain protein, and an aminoacyl tRNA synthetase. In some embodiments, the protein of interest is selected from KEAP1 protein, bromodomain protein, an aminoacyl tRNA synthetase, and a histone deacetylase (e.g, HDAC1, 2, 3, 4, 5, 6, 7,
- Suitable examples of attaching FRET donor moiety are schemantically shown in Figures 2A, 2B, and 2C.
- the method includes making the protein of interest attached to a FRET donor moiety in the sample by contacting the protein of interest comprising a halotag with a FRET donor moiety comprising a halotag ligand.
- the protein of interest can be expressed as a fusion protein with halotag optionally with His6).
- the method includes making the protein of interest attached to a FRET donor moiety by contacting the protein of interest comprising an epitope tag with an antibody or nanobody to the epitope tag, the antibody or nanobody being attached to the FRET donor moiety (directly or through a linker).
- the method includes making the protein of interest attached to a FRET donor moiety by contacting the protein of interest with an antibody or nanobody to the protein of interest, the antibody or nanobody being attached to the FRET donor moiety.
- the method includes making the protein of interest attached to a FRET donor moiety by contacting the protein of interest with a first antibody or nanobody to the protein of interest to obtain the protein-antibody conjugate, followed by contacting the conjugate with a second antibody or nanobody to the first antibody or nanobody, the second antibody or nanobody being attached to the FRET donor moiety (directly or through a linker).
- the method includes making the protein of interest attached to a FRET donor moiety by contacting the protein of interest comprising a biotin moiety with a streptavidin protein attached to the FRET donor moiety.
- the method includes making the protein of interest attached to a FRET donor moiety by contacting the protein of interest with a FRET donor moiety comprising an activated ester.
- the activated ester is selected from N-rydroxysuecinimide, sulfo-N-hydroxysuceinimide, tetrafluorophenoxy, pentafluorophenoxy, and p-nitophenoxy.
- the method includes making the ligand attached to the FRET acceptor moiety by coupling the ligand with the FRET acceptor moiety using a linker moiety.
- the protein of interest is an arninoacyl tRNA synthetase and the ligand atached to the FRET acceptor moiety is a tracer compound of Formula (I) described herein, or a pharmaceutically acceptable salt thereof, wherein the amino acid in the compound of Formula (I) corresponds to the amino acid attached to the tRNA by the aminoacyl tRNA synthetase enzyme.
- Amino acyl sulfamoyl adenosine such as prolyl-sulfamoyl adenosine (ProSA), have been shown to be high affinity ligands for their respective aaRS isoforms.
- aaSA closely mimic amino acyl AMP (e.g. prolyl-AMP), the activated amino acid intermediate that is formed in the first catalytic step by reaction of the cognate amino acid and ATP.
- aaSA analogs are hydrolytically stable and therefore can be employed as tool compounds to selectively inhibit aaRS activity.
- Corresponding nitrogen- analogs amino acyl sulfamoyl amino adenosine (aaSNA) offer the possibility for linker attachment sufficiently close to the narrow* aperture that is otherwise occupied by the triphosphate of ATP.
- the protein of interest is a prolyl tRNA synthetase and the ligand attached to the FRET acceptor moiety is a tracer compound of Formulae (P) or (III), or a pharmaceutically acceptable salt thereof.
- the protein of interest is a phenylalanyl tRNA synthetase and the ligand attached to the FRET acceptor moiety is a tracer compound of Formula (IV), or a pharmaceutically acceptable salt thereof.
- the protein of interest is a isoleucyl tRNA synthetase and the ligand attached to the FRET acceptor moiety is a tracer compound of Formula (VI), or a pharmaceutically acceptable salt thereof.
- the protein of interest is a glutamyl-tRNA synthetase and the ligand attached to the FRET acceptor moiety is a tracer compound of Formula (VII), or a pharmaceutically acceptable salt thereof.
- the sample comprises live cells (e.g., human cells, bacterial cells, or parasite cells, as may be appropraite).
- live cells e.g., human cells, bacterial cells, or parasite cells, as may be appropraite.
- the sample comprises a cell lysate.
- the sample may contain surfactants used to lyse cells, or the sample may be surfactant-free.
- the sample comprises an aqueous solution.
- the aqueous solution is a buffer solution (having pH from about 5 to about 8).
- the present disclosure provides a method of evaluating an interaction between a protein of interest and a modulator of the protein of interest, the method comprising:
- the steps (i)-(iii) are carried out as described for the screening method above.
- the emobodiments of the protein, FRET donors, FRET acceptors, and equipment are also as in the screening method.
- the method includes determining a thermodynamic binding constant betw een the modulator and the protein of interest.
- the method includes de termining a kinetic binding constant between the modulator and the protein of interest.
- the method includes determining the mode of binding of the modulator to the protein of interest. In some embodiments, the method includes determining whether the modulator is a substrate-competitive orthosteric inhibitor, substrate -noncompetitive orthosteric inhibitor, or allosteric inhibitor.
- the method includes determining whether the modulator is an activator of the protein of interest.
- the method includes determining binding affinity between the modulator and the protein of interest,
- the method includes making the modulator attached to a FRET acceptor moiety by coupling the modulator to the FRET acceptor moiety through a linker.
- the present disclosure provides a method of determining an amount of a protein of interest in a sample, the method comprising:
- the steps (i)-(iii) are carried out as described for the screening method above.
- the emobodiments of the protein, FRET donors, FRET acceptors, and equipment are also as in the screening method.
- the method comprises quantifying abundance of a post- translational modification of the protein of interest.
- the method comprises determining intracellular concentration of the protein of interest.
- the method includes obtaining a sample comprising the protein of interest from a subject for diagnosing a disease or condition, wherein the amount of the protein of interest in the sample is indicative of the disease or condition. In some embodiments, the method includes obtaining a sample comprising the protein of interest from a subject for monitoring treatment a disease or condition, wherein the amount of the protein of interest in the sample is indicative of efficacy of treatment of the disease or condition.
- the sample comprises live cells.
- the sample comprises cell lysate.
- the protein of interest in implicated in the disease or condition Suitable examples of such proteins include proteins implicated in the pathology of cancer. Suitable example of such proteins include kinases (cytosolic and receptor), transcription factors, epigenetic writers (e.g., methyltransferases, acetyltransferases,) epigenetic readers, and epigenetic erasers (e.g., demethylases, deacetylases). Examples of methyltransferases include those described in Nature Structural & Molecular Biology volume 26, pages 880-889 (2019), which is incorporated herein by reference in its entirety.
- histone demethyl ases examples include those described in Nature Reviews Molecular Cell Biology volume 13, pages297-311 (2012), which is incorporated herein by reference in its entirety. More specifically, suitable examples of such proteins include hormone receptor, androgen receptor (AR), estrogen receptor (ER), estrogen-related receptor alpha (ERR ⁇ ),
- BRD4 brornodornain and extraterminal (BET) domain epigenetic reader protein BRIM
- the protein is implicated in the pathology of a neurodegenerative di sease or condition.
- Suitable examples of such proteins include alpha-synuclein, transthyretin, tan protein, and amyloid-b peptide.
- the assay platforms described herein can be used to identify a PROTAC compound, and/or to study infractions of the compounds with the protein of intersest, including quantitatively and qualitavely.
- the assays can be used to identify the ligase recruiting ligand and/or to identify a protein targeting ligand.
- the protein of interest comprises 1, 2, 3, 4, or 5 binding sites (e.g., 2 or more binding sites).
- the POI comprises 1 or 2 bidning sites.
- each of the two or more binding sites can bind the FRET donor moiety -containing reagent and the FRET acceptor moiety containing reagent.
- the POI is a multi-protein complex.
- the POI may comprises 2, 3, 4, 5, or 6 protein domains.
- FRET donor moiety and FRET acceptor moiety are bound to different domains within the complex.
- the present disclosure includes a method of identifying a PROTAC compound, the method comprising:
- test PTQTAC compound e.g., test PTQTAC compound
- step (v) determining whether the intensity of fluorescence detected from the FRET acceptor moiety in step (iv) is decreased compared to the intensity of fluorescence detected from the FRET acceptor moiety in step (ii), wherein said decrease in fluorescence intensity in an indication that the test compound is the PROTAC compound capable of degrading the protein of interest (e.g., using the proteasome machinery of the cell).
- the protein of interest is targeted by PROTAC compound for degradation.
- the modulators, tracers, FRET donors and acceptors, as well as the methods of carrying out steps (i)-(v) are as described herein.
- the present disclosure also provides assay platforms for identyfing moduelators of transmembrane proteins of interest, as well as methods of studying transmembrane proteins of interests quantitatively and qualitatively.
- the present disclosure includes a method of identifying a compound that modulates a transmembrate protein of interest, the method comprising:
- step (v) determining whether the intensity of fluorescence detected from the FRET acceptor moiety in step (iv) is decreased compared to the intensity of fluorescence detected from the FRET acceptor moiety in step (ii), wherein said decrease in fluorescence intensity in an indication that the test compound is the modulator the protein of interest.
- affinity of the test compound to the protein of interest is greater than affibity of the FRET donor moiety to the protein of interest.
- the method can be carried out in a HTS manner as described herein.
- the method also can be used to monitor treatment of a disease.
- a sample containing a cell can be taken from a a patient (e.g., blood, hair, tissue sample, biopsy, sali ve, urine, feces), and the test compounds is a drug the treatment with which is being monitored.
- the method can also be carried out in vi vo, when the drug and the FRET donor, and the fluorophore acceptor are administered to the patient.
- the present disclosure provides a compound of Formula or a pharmaceutically acceptable salt thereof, wherein:
- R 3 is an ATP -binding moiety
- the ATP-binding moiety is selected from any one of the following moieties: wherein R and R are independently selected from H, C 1-3 alkyl, and C 1-3 haloalkyl.
- the present disclosure provides a compound of Formula
- in the amino acid is selected from alanine, arginine, asparagine, aspartic acid, cysteine, glutamine, glutamic acid, glycine, histidine, isoleucine, leucine, isoleucine, lysine, methionine, phenylalanine, proline, serine, threonine, tryptophan, tyrosine, and valine.
- the amino acid is proline.
- the amino acid is phenylalanine
- the amino acid is isoieucine.
- the amino acid is glutamic acid.
- the moiety (L 1 ) n comprises OCH 2 CH 2 O. In some embodiments, the moiety (L 1 ) n comprises OCH 2 CH 2 NH. In some embodiments, the compound has formula: or a pharmaceutically acceptable salt thereof.
- R 1 is a FRET acceptor fluorophore.
- fluorophores include any fluorescent chemical compounds that can re-emit light upon excitation.
- the fluorophores in the compounds within the present claims are FRET acceptors.
- the fluorophores may be excited by energy emitted through space by a FRET donor, and then emit light upon that excitation
- the fluorophores can by excited by a light of a wavelength form about 300 nm to about 800 nm, and then emit light of a wavelength from about 350 nm to about 770 nm (e.g., violet, blue, cyan, green, yellow, orange or red light), which can be detected by fluorescent imaging devices, including the ability to measure the intensity of the fluorescence.
- fluorophores include fluorescein, AF488, hydroxycoumarin blue, methoxycoumarin blue, alexa fluor blue, aminocoumarin blue, Cy2 green (dark), FAM green (dark), alexa fluor 488 green (light), fluorescein FITC green (light), alexa fluor 430 green (light), Alexa fluor 532 green (light), HEX green (light), Cy3 yellow, TRITC yellow, Alexa fluor 546 yellow, Alexa fluor 555 3 yellow, R-phycoerythrin (PE) 480; yellow; Rhodamine Red-X orange, Tamara red, Cy3.5 581 red, Rox red, Alexa fluor 568 red, Red 613 red, Texas Red red, Alexa fluor 594 red, Alexa fluor 633 red, Allophycocyanin red, Alexa fluor 633 red, Cy5 red, Alexa fluor 660 red, Cy5.5 red, TruRed red, Alexa fluor 680 red, and Cy7 red.
- R 1 is selected from any of the aforementioned fluorophores, or a pharmaceutically acceptable salt thereof.
- the compound has formula: or a pharmaceutically acceptable salt thereof.
- the compound is selected from any one of the following compounds:
- this disclosure provides a compound of Formula (II): or a pharmaceutically acceptable salt thereof, wherein:
- the compound has formula: or a pharmaceutically acceptable salt thereof.
- the compound has formula: or a pharmaceutically acceptable salt thereof.
- the moiety (L 1 ) n comprises OCH 2 CH 2 O.
- the moiety (L 1 ) n comprises OCH 2 CH 2 NH.
- the moiety (L 1 ) n comprises any one of the following fragments:
- R 1 is a FRET acceptor fluorophore.
- R 1 is selected from fluorescein, AF488, hydroxycoumarin blue, methoxycoumarm blue, alexa fluor blue, aminoeoumarin blue,
- the compound has formula: or a pharmaceutically acceptable salt thereof.
- the compound of Formula (II) is selected from any one of the following compounds:
- the moiety (L 1 ) n comprises OCH 2 CH 2 NH.
- R 1 is selected from fluorescein, AF488, hydroxycoumarin blue, methoxycoumarin blue, alexa fluor blue, aminocoumarin blue, Cy2 green (dark), FAM green (dark), alexa fluor 488 green (light), fluorescein FITC green (light), alexa fluor 430 green (light), Alexa fluor 532 green (light), HEX green (light), Cy3 yellow, TRITC yellow, Alexa fluor 546 yellow, Alexa fluor 555 3 yellow, R-phycoerythrin (PE) 480; yellow, Rhodamine Red-X orange, Tamara red, Cy3.5 581 red, Rox red, Alexa fluor 568 red, Red 613 red, Texas Red red, Alexa fluor 594 red, Alexa fluor 633 red, Allophyeocyanin red, Alexa fluor 633 red, Cy5 red, Alexa fluor
- the compound has formula: or a pharmaceutically acceptable salt thereof.
- the compound has formula:
- the moiety (L 1 ) n comprises OCH 2 CH 2 O.
- the moiety (L 1 ) n comprises OCH 2 CH 2 NH.
- the compound has formula: or a pharmaceutically acceptable salt thereof.
- R 1 is a FRET acceptor fluorophore.
- R 1 is selected from fluorescein, AF488, hydroxyeoumarin blue, in ethoxy eoumarin blue, alexa fluor blue, aminocoumarin blue, Cy2 green (dark), FAM green (dark), alexa fluor 488 green (light), fluorescein FITC green (light), alexa fluor 430 green (light), Alexa fluor 532 green (light), HEX green (light), Cy3 yellow, TR1TC yellow, Alexa fluor 546 yellow, Alexa fluor 555 3 yellow, R-phyeoerythrin (PE) 480; yellow, Rhodamine Red-X orange, Tamara red, Cy3.5 581 red, Rox red, Alexa fluor 568 red.
- fluorescein AF488, hydroxyeoumarin blue, in ethoxy eoumarin blue, alexa fluor blue, aminocoumarin blue
- Red 613 red Texas Red red
- Alexa fluor 594 red Alexa fluor 633 red
- Allophycocyanin red Alexa fluor 633 red
- Cy5 red Alexa fluor 660 red
- Cy5.5 red TruRed red
- Alexa fluor 680 red and Cy7 red.
- the compound has formula: or a pharmaceutically acceptable salt thereof. In some embodiments, the compound has formula: or a pharmaceutically acceptable salt thereof.
- the present disclosure provides a compound of Formula
- R 1 is a FRET acceptor fluorophore.
- R 1 is selected from fluorescein, AF488, hydroxycoumarin blue, methoxycoumarin blue, alexa fluor blue, aminocoumarin blue Cy2 green (dark), FAM green (dark), alexa fluor 488 green (light), fluorescein FITC green (light), alexa fluor 430 green (light), Alexa fluor 532 green (light), HEX green (light), Cy3 yellow, TR1TC yellow, Alexa fluor 546 yellow; Alexa fluor 555 3 yellow, R-phycoervthrin (PE) 480; yellow, Rhodamine Red-X orange, Tamara red, Cy3.5 581 red, Rox red, Alexa fluor 568 red.
- fluorescein AF488, hydroxycoumarin blue, methoxycoumarin blue, alexa fluor blue, aminocoumarin blue Cy2 green (dark), FAM green (dark), alexa fluor 488 green (light), fluorescein FITC green (light), alexa fluor 430 green (
- Red 613 red Texas Red red
- Alexa fluor 594 red Alexa fluor 633 red
- Allophycoeyanin red Alexa fluor 633 red
- Cy5 red Alexa fluor 660 red
- Cy5.5 red TruRed red
- Alexa fluor 680 red and Cy7 red.
- the compound has formula: or a pharmaceutically acceptable salt thereof.
- the compound has formula: or a pharmaceutically acceptable salt thereof.
- the present disclosure provides a compound of Formula
- the moiety (L 1 ) n comprises OCH 2 CH 2 O.
- the moiety (L 1 ) n comprises OCH 2 CH 2 NH.
- the compound has formula: or a pharmaceutically acceptable salt thereof.
- R 1 is a FRET acceptor fluorophore.
- R 1 is selected from fluorescein, AF488, hydroxycoumarin blue, methoxycoumarin blue, alexa fluor blue, aminocoumarin blue, Cy2 green (dark), FAM green (dark), alexa fluor 488 green (light), fluorescein FITC green (light), alexa fluor 430 green (light), Alexa fluor 532 green (light), HEX green (light), Cy3 yellow, TRITC yellow, Alexa fluor 546 yellow, Alexa fluor 555 3 yellow, R-phycoerythrin (PE) 480; yellow, Rhodamine Red-X orange, Tamara red, Cy3.5 581 red, Rox red, Alexa fiuor 568 red.
- Red 613 red Texas Red red
- Alexa fluor 594 red Alexa fiuor 633 red
- Allophyeocyanin red Alexa fiuor 633 red
- Cy5 red Alexa fiuor 660 red
- Cy5.5 red TruRed red
- Alexa fiuor 680 red and Cy7 red.
- the compound has formula: or a pharmaceutically acceptable salt thereof. In some embodiments, the compound has formula: or a pharmaceutically acceptable salt thereof.
- the present disclosure provides a compound of Formula
- R 1 is a FRET acceptor fluorophore.
- R is selected from fluorescein, AF488, hydroxycoumarin blue, methoxycoumarin blue, alexa fluor blue, aminocoumarin blue, Cy2 green (dark), FAM green (dark), alexa fluor 488 green (light), fluorescein FITC green (light), alexa fluor 430 green (light), Alexa fluor 532 green (light), HEX green (light), Cy3 yellow, TRITC yellow, Alexa fluor 546 yellow, Alexa fluor 555 3 yellow, R-phycoerythrin (PE) 480; yellow, Rhodamine Red-X orange, Tamara red, Cy3.5 581 red, Rox red, Alexa fluor 568 red, Red 613 red, Texas Red red, Alexa fluor 594 red, Alexa fluor 633 red, Allophycoeyanin red, Alexa fluor 633 red, Cy5 red, Alexa fluor 660 red, Cy5.5 red, TruRed red, Alexa fluor 680 red, and Cy3 yellow, TRITC
- the compound has formula: or a pharmaceutically acceptable salt thereof.
- the compound has formula: or a pharmaceutically acceptable salt thereof.
- the present disclosure provides a composition comprising a tracer compound as described herein or a pharmaceutically acceptable salt thereof, and an inert carrier.
- the intert carrier can be a pure water or a buffer solution (e.g., buffer with pH of from about 5 to about 8).
- the composition can be used, for example, in any of the assays described herein as a sample or a part of a sample where the protein of interest is being studied.
- the composition is an aqueous solution.
- the inert carrier is a buffer solution.
- X 1 is selected from O and NR N ;
- n is an integer from 0 to 12;
- R 1 is selected from H, C 1-6 alkyl, and a protecting group.
- L 1 is absent. In some embodiments, L 1 is C 1-3 alkylene.
- L 1 is selected from methylene, 1,2-ethylene, 1,1- ethylene, and propylene.
- L 1 is methylene
- X 1 is O. some embodiments, X 1 is NH.
- the compound of Formula (A) has formula: or a pharmaceutically acceptable salt thereof.
- the compound of Formula (A) has formula: or a pharmaceutically acceptable salt thereof.
- n 0.
- n is an integer from 1 to 12.
- the moiety (L 2 ) n comprises any one of the following fragments:
- R 1 is H. In some embodiments, R 1 is C 1-6 alkyl,
- R 1 is an alcohol -protecting group, an amino-protecting group, or a carboxylic acid protecting group.
- the compound of Formula (A) is selected from any one of the following compounds:
- the present disclosure provides a compound of Formula
- L 1 is C 1-3 alkylene; or L 1 is absent;
- the compound has formula: or a pharmaceutically acceptable salt thereof.
- L 1 is C 1-3 alkylene.
- the compound has formula: or a pharmaceutically acceptable salt thereof.
- R 1 is H.
- R 1 is C 1-3 alkyl.
- R A1 is H.
- R A1 is C 1-6 alkyl.
- the compound is selected from any one of the following compounds : or a pharmaceutically acceptable salt thereof.
- a salt of a compound is formed between an acid and a basic group of the compound, such as an amino functional group, or a base and an acidic group of the compound, such as a carboxyl functional group.
- the compound is a pharmaceutically acceptable acid addition salt.
- acids commonly employed to form pharmaceutically acceptable salts of the compounds include inorganic acids such as hydrogen bisulfide, hydrochloric acid, hydrobromic acid, hydroiodic acid, sulfuric acid and phosphoric acid, as well as organic acids such as para-toluenesulfonic acid, salicylic acid, tartaric acid, bitartaric acid, ascorbic acid, maleic acid, besylic acid, fumaric acid, gluconic acid, glucuronic acid, formic acid, glutamic acid, methanesulfonic acid, ethanesulfonie acid, benzenesulfonic acid, lactic acid, oxalic acid, para- bromophenylsulfonic acid, carbonic acid, succinic acid, citric acid, benzoic acid and acetic acid, as well as related inorganic and organic acids.
- inorganic acids such as hydrogen bisulfide, hydrochloric acid, hydrobromic acid, hydroiodic acid, sulfuric acid and
- Such pharmaceutically acceptable salts thus include sulfate, pyrosulfate, bisulfate, sulfite, bisulfite, phosphate, monohydrogenphosphate, dihydrogenphosphate, metaphosphate, pyrophosphate, chloride, bromide, iodide, acetate, propionate, decanoate, caprylate, acrylate, formate, isobutyrate, caprate, heptanoate, propiolate, oxalate, malonate, succinate, suberate, sebacate, fumarate, maleate, butyne-1,4-dioate, hexyne ⁇ I,6-dioate, benzoate, clilorobenzoate, methylbenzoate, dinitrobenzoate, hydroxybenzoate, methoxybenzoate, phthaiate, terephthalate, sulfonate, xylene sulfonate, phenylacetate,
- bases commonly employed to form pharmaceutically acceptable salts of the compounds include hydroxides of alkali metals, including sodium, potassium, and lithium; hydroxides of alkaline earth metals such as calcium and magnesium; hydroxides of other metals, such as aluminum and zinc; ammonia, organic amines such as unsubstituted or hydroxyl-substituted mono-, di-, ortri- alkyl amines, dicyclohexylamine; tributyl amine; pyridine; N -methyl, N-ethylamine; diethylamine; triethylamine; mono-, bis-, or tris ⁇ (2-OH-(C1-C6)-alkylamine), such as N,N-dimethyl-N-(2-hydroxyethyl)amine or tri-(2-hydroxyethyl)amine; N-methyl-D- glucamine; morpholine; thiomorpholine: piperidine; pyrrolidine; and amino acids such as arg
- Certain compounds of this disclosure may be useful for treating a disease or condition as described herein. These compounds include, for example, the compounds of Formula (B).
- the compounds of Formulae (I)-(VII) may be used as tracers (e.g., FRET accep tor-containing modulators of corresponding proteins of interest) that are useful in assays for diagnosing a disease or monitoring a treatment of a disease as described herein.
- Compounds of Formula (A) may he useful as synthetic intermediates for making these tracers for the assays.
- the present disclosure also provides methods of inhibiting glutamyl-prolyl-tRNA synthetase, prolyl-tRNA synthetase, or a combination thereof.
- the inhibiting may be carried out in a cell, such as in vitro, in vivo, or ex vivo.
- the disclosure provides a method of inhibiting prolyl-tRNA-synthetase in a cell, comprising contacting the cell with a compound of this disclosure, or a pharmaceutically acceptable salt thereof.
- the cell is a human cell or a protozoan parasitic cell.
- the cell is a human cell (e.g., cancer cell).
- the cell is a protozoan parasitic cell.
- the protozoan parasitic cell is a Plasmodium parasitic cell, som
- the protozoan parasitic cell is a Plasmodium falciparum.
- the protozoan parasitic cell is selected from the group consisting of a Cryptosporidium, Babesia, Cyclospora, Cystoisospora, Toxoplasma, Giardia, and Plasmodia parasitic cell.
- the protozoan parasitic cell is selected a Plasmodia parasitic cell.
- the protozoan parasitic cell is selected from the group consisting of Plasmodium vivax, Plasmodium falciparum, Plasmodium malariae, Plasmodium ovale, and Plasmodium knowlesi.
- the present disclosure provides a method of inhibiting prolyl -tRNA-synthetase (e.g., a glutamyl-prolyl-tRNA synthetase) in a subject, comprising administering to the subject an effective amount of a compound as described herein, or a pharmaceutically acceptable salt thereof.
- prolyl -tRNA-synthetase e.g., a glutamyl-prolyl-tRNA synthetase
- the human has been infected with protozoan parasite, in some embodiments, the human has been identified as having been infected with protozoan parasite.
- the protozoan parasite is selected from the group consisting of Cryptosporidium , Babesia, Cyclospora, Cystoisospora, Toxoplasma, Giardia, and Plasmodium.
- the human has been infected with a Plasmodium parasite.
- the human has been identified as having been infected with a Plasmodium parasite.
- the human has been identified as having been infected with a Plasmodium parasite (e.g., a drug resistant Plasmodium parasite) selected from the group consisting of Plasmodium vivax, Plasmodium falciparum, Plasmodium malariae, Plasmodium ovale, and Plasmodium knowlesi.
- a Plasmodium parasite e.g., a drug resistant Plasmodium parasite selected from the group consisting of Plasmodium vivax, Plasmodium falciparum, Plasmodium malariae, Plasmodium ovale, and Plasmodium knowlesi.
- the human has been infected with Plasmodium falciparum.
- the human has been identified as having been infected with Plasmodium falciparum.
- the infected human is diagnosed with malaria.
- the present application further provides methods of treating a disorder in a subject (e.g., a subject in need thereof).
- the disorder is associated with (e.g., abnormal activity) glutamyl -prolyl-tRNA synthetase, prolyl- tRNA synthetase, or a combination thereof.
- the method typically includes administering to a subject a therapeutically effective amount of a compound of this disclosure, or a pharmaceutically acceptable salt thereof.
- the subject is in need of treatment, for example, the subject may be diagnosed with the disorder by a treating physician.
- the disorder is a parasitic infection, som
- the parasite is a protozoan parasite.
- the parasite is a protozoan parasite selected from the group consisting of Cryptosporidium, Babesia , Cyclospora, Cystoisospora, Toxoplasma, Giardia, and Plasmodium.
- the parasite is a Plasmodium parasite.
- the parasite is a drug resistant parasite.
- the parasite is a drug resistant Plasmodium parasite.
- the parasite in Plasmodium falciparum.
- the Plasmodium parasite (e.g., a drug resistant Plasmodium parasite) is selected from the group consisting of Plasmodium vivax, Plasmodium falciparum, Plasmodium rnalariae, Plasmodium ovale , and Plasmodium knowlesi.
- the parasite is a drug resistant Plasmodium falciparum.
- the parasitic infection is selected from malaria, toxoplasmosis, leishmaniasis, cryptosporidiosis, coccidiosis, Chagas disease, African sleeping sickness, giardiasis, and babesiosis.
- the disorder is malaria.
- the infectious disease is malaria, wherein the malaria is associated with a Plasmodium parasite.
- the infectious disease is malaria, wherein the malaria is associated with Plasmodium falciparum.
- the Plasmodium falciparum is a drug resistant Plasmodium falciparum.
- the disorder is an autoimmune disease.
- the autoimmune disease is selected from multiple sclerosis, rheumatoid arthritis, lupus, psoriasis, scleroderma, dry eye syndrome, Crohn's Disease, inflammatory bowel disease, chronic obstructive pulmonary disease (COPD), asthma, fibrosis, scar formation, ischemic damage, and graft versus host disease.
- COPD chronic obstructive pulmonary disease
- the disorder is a bacterial infection. In some embodiments, the disorder is a fungal infection, s Ionme embodiments, the disorder is a viral infection. In some embodiments, the viral infection caused by corona vims, dengue virus or chikungunya virus.
- the disorder is selected from neurological disorder (e.g., Alzheimer’s, Parkinson’s, Huntington’s, or ALS), a genetic disorder, a cardiovascular disorder (e.g., ischemia, stroke), a protein aggregation disorder, a metabolic disorder, an inflammatory disorder, and a cosmetic disorder.
- neurological disorder e.g., Alzheimer’s, Parkinson’s, Huntington’s, or ALS
- a genetic disorder e.g., a genetic disorder
- a cardiovascular disorder e.g., ischemia, stroke
- a protein aggregation disorder e.g., a metabolic disorder
- an inflammatory disorder e.g., a chronic myethelial disorder
- a cosmetic disorder e.g., a cosmetic disorder.
- Compounds of the present disclosure may also be used to promote wound healing and/or prevent scarring and may be useful cosmetically.
- the disorder is amino acid response (AAR)-mediated condition or a Th17-mediated condition.
- AAR amino acid response
- compounds of the present invention may be used to inhibit pro-fibrotic behavior in fibroblasts or inhibit the differentiation of Th 17 cells. Therefore, provided compounds may be useful in preventing fibrosis. Provided compounds may also be used as probes of biological pathways. Provided compounds may also be used in studying the differentiation of T cells.
- the genetic disorder is Duchenne muscular dystrophy.
- the metabolic disorder is selected from diabetes and obesity.
- the cosmetic disorder is selected from the group consisting of cellulite and stretch marks.
- the inflammatory disorder is selected from restenosis, macular degeneration, choroidal neovascularization, and chronic inflammation.
- the disorder may also be a disorder involving angiogenesis, such as cancer.
- the disorder is cancer.
- the cancer is a T-cell neoplasm selected from mature T-cell leukemia, nodal peripheral T-cell lymphoma (PTCL), extranodal PTCLs, and cutaneous T-cell lymphoma (CTCL).
- the cancer is selected from adrenocortical carcinoma, bladder urothelial carcinoma, breast invasive carcinoma, cervical squamous cell carcinoma and endoeervical adenocarcinoma, cholangio carcinoma, colon adenocarcinoma, lymphoid neoplasm diffuse large B-cell lymphoma, esophageal carcinoma, glioblastoma multiforme, head and neck squamous cell carcinoma, kidney chromophobe, kidney renal clear cell carcinoma, kidney renal papillary cell carcinoma, acute myeloid leukemia, brain lower grade glioma, liver hepatocellular carcinoma, lung adenocarcinoma, lung squamous cell carcinoma, mesothelioma, ovarian serous cystadenocarcinoma, pancreatic adenocarcinoma, pheochromocytoma and paraganglioma, prostate adenocarcinoma
- the cancer may be any one of cancers described, for example, in Wang et a!., Genes 2020, 11, 1384, and Arita et al., Biochemical and Biophysical Research Communications 488 (2017) 648-654, both of which are incorporated here by reference in their entirety.
- compositions comprising, formulations, and routes of administration
- the present application also provides pharmaceutical compositions comprising an effective amount of a compound of the present disclosure disclosed herein, or a pharmaceutically acceptable salt thereof; and a pharmaceutically acceptable carrier.
- the pharmaceutical composition may also comprise any one of the additional therapeutic agents described herein.
- the application also provides pharmaceutical compositions and dosage forms comprising any one the additional therapeutic agents described herein.
- the earrier(s) are ‘ ‘ acceptable” in the sense of being compatible with the other ingredients of the formulation and, in the case of a pharmaceutically acceptable carrier, not deleterious to the recipient thereof in an amount used in the medicament.
- Pharmaceutically acceptable carriers, adjuvants and vehicles that may be used in the pharmaceutical compositions of the present application include, but are not limited to, ion exchangers, alumina, aluminum stearate, lecithin, scram proteins, such as human serum albumin, buffer substances such as phosphates, glycine, sorbic acid, potassium sorbate, partial glyceride mixtures of saturated vegetable fatty acids, water, salts or electrolytes, such as protamine sulfate, disodium hy drogen phosphate, potassium hydrogen phosphate, sodium chloride, zinc salts, colloidal silica, magnesium trisilicate, polyvinyl pyrrolidone, cellulose-based substances, polyethylene glycol, sodium carboxymethylcellulose, polyacrylates, waxes, polyethylene-polyoxypropylene-block polymers, polyethylene glycol, and wool fat.
- ion exchangers alumina, aluminum stearate, lecithin
- scram proteins such as human serum
- compositions or dosage forms may contain any one of the compounds and therapeutic agents described herein in the range of 0.005% to 100% with the balance made up from the suitable pharmaceutically acceptable excipients.
- the contemplated compositions may contain 0.001%-100% of any one of the compounds and therapeutic agents provided herein, in one embodiment 0.1-95%, in another embodiment 75-85%, in a further embodiment 20-80%, wherein the balance may be made up of any pharmaceutically acceptable excipient described herein, or any combination of these excipients.
- compositions of the present application include those suitable for any acceptable route of administration.
- Acceptable routes of administration include, but are not limited to, buccal, cutaneous, endoeervical, endosinusial, endotracheal, enteral, epidural, interstitial, intra-abdominal, intra- arterial, intrabronehial, intrabursal, intracerebral, intracisternal, intracoronary, intradermal, intraductal, intraduodenai, intradural, intraepidermal, intraesophageal, intragastrie, intragingival, intraileal, intralymphatic, intramedullary, intrameningeal, intramuscular, intranasal, intraovarian, intraperitoneal, intraprostatic, intrapulmonary, mtrasinal, intraspinal, intrasynovial, intratesticular, intrathecal, intratubular, intratumoral, intrauterine, intravascular, intravenous, nasal, nasogastric, oral
- compositions and formulations described herein may conveniently be presented in a unit dosage form, e.g., tablets, sustained release capsules, and in liposomes, and may be prepared by any methods well known in the art of pharmacy. See, for example. Remington : The Science and Practice of Pharmacy, Lippineott Williams & Wilkins, Baltimore, MD (20th ed. 2000). Such preparative methods include the step of bringing into association with the molecule to be administered ingredients such as the carrier that constitutes one or more accessory ' ingredients. In general, the compositions are prepared by uniformly and intimately bringing into association the active ingredients with liquid carriers, liposomes or finely divided solid carriers, or both, and then, if necessary, shaping the product.
- compositions of the present application suitable for oral administration may be presented as discrete units such as capsules, sachets, granules or tablets each containing a predetermined amount (e.g., effective amount) of the active ingredient; a powder or granules; a solution or a suspension in an aqueous liquid or a non-aqueous liquid; an oil-in-water liquid emulsion; a water-in- oil liquid emulsion; packed in liposomes; or as a bolus, etc.
- Soft gelatin capsules can be useful for containing such suspensions, which may beneficially increase the rate of compound absorption, I tnhe case of tablets for oral use, carriers that are commonly used include lactose, sucrose, glucose, mannitol, and silicic acid and starches.
- excipients may include: a) fillers or extenders such as starches, lactose, sucrose, glucose, mannitol, and silicic acid, b) binders such as, for example, carboxymethylcellulose, alginates, gelatin, polyvinylpyrrolidinone, sucrose, and acacia, c) humeetants such as glycerol, d) disintegrating agents such as agar-agar, calcium carbonate, potato or tapioca starch, alginic acid, certain silicates, and sodium carbonate, e) solution retarding agents such as paraffin, f) absorption accelerators such as quaternary ammonium compounds, g) wetting agents such as, for example, cetyl alcohol and glycerol monostearate, h) absorbents such as kaolin and bentonite clay; and i) lubricants such as talc, calcium stearate, magnesium stearate, solid polyethylene glycols,
- useful diluents include lactose and dried corn starch.
- aqueous suspensions are administered orally; the active ingredient is combined with emulsifying and suspending agents. If desired, certain sweetening and/or flavoring and/or coloring agents may be added.
- Compositions suitable for oral administration include lozenges comprising the ingredients in a flavored basis, usually sucrose and acacia or tragacanth; and pastilles comprising the active ingredient in an inert basis such as gelatin and glycerin, or sucrose and acacia.
- compositions suitable for parenteral administration include aqueous and non- aqueous sterile injection solutions or infusion solutions which may contain antioxidants, buffers, bacteriostats and solutes which render the formulation isotonic with the blood of the intended recipient: and aqueous and non-aqueous sterile suspensions which may include suspending agents and thickening agents.
- the formulations may be presented in unit-dose or multi-dose containers, for example, sealed ampules and vials, and may be stored in a freeze dried (lyophilized) condition requiring only the addition of the sterile liquid carrier, for example water for injections, saline (e.g., 0.9% saline solution) or 5% dextrose solution, immediately prior to use.
- Extemporaneous injection solutions and suspensions may be prepared from sterile powders, granules and tablets.
- the injection solutions may be in the form, for example, of a sterile injectable aqueous or oleaginous suspension.
- This suspension may be formulated according to techniques known in the art using suitable dispersing or wetting agents and suspending agents.
- the sterile injectable preparation may also be a sterile injectable solution or suspension in a non-toxic parenterally-acceptable diluent or solvent, for example, as a solution in 1,3-butanediol.
- the acceptable vehicles and solvents that may be employed are mannitol, water. Ringer's solution and isotonic sodium chloride solution.
- sterile, fixed oils are conventionally employed as a solvent or suspending medium.
- any bland fixed oil may be employed including synthetic mono- or diglycerides.
- Fatty acids, such as oleic acid and its glyceride derivatives are useful in the preparation of injectabfes, as are natural pharmaceutically-acceptable oils, such as olive oil or castor oil, especially in their poly oxyethylated versions.
- These oil solutions or suspensions may also contain a long-chain alcohol diluent or dispersant.
- compositions of the present application may be administered in the form of suppositories for rectal administration.
- These compositions can be prepared by mixing a compound of the present application with a suitable non-irritating excipient which is solid at room temperature but liquid at the rectal temperature and therefore will melt in the rectum to release the active components.
- suitable non-irritating excipient include, but are not limited to, cocoa butter, beeswax, and polyethylene glycols.
- compositions of the present application may be administered by nasal aerosol or inhalation.
- Such compositions are prepared according to techniques well-known in the ait of pharmaceutical formulation and may be prepared as solutions in saline, employing benzyl alcohol or other suitable preservatives, absorption promoters to enhance bioavailability, fluorocarbons, and/or other solubilizing or dispersing agents known in the art. See, for example, U.S. Patent No. 6,803,031. Additional formulations and methods for intranasal administration are found in Ilium, L., J Pharm Pharmacol, 56:3-17, 2004 and Ilium, I.., Eur J Pharm Set 11 : 1-18, 2000.
- the topical compositions of the present disclosure can he prepared and used in the form of an aerosol spray, cream, emulsion, solid, liquid, dispersion, foam, oil, gel, hydrogel, lotion, mousse, ointment, powder, patch, pomade, solution, pump spray, stick, towelette, soap, or other forms commonly employed in the art of topical administration and/or cosmetic and skin care formulation.
- the topical compositions can be in an emulsion form. Topical administration of the pharmaceutical compositions of the present application is especially useful when the desired treatment involves areas or organs readily accessible by topical application.
- the topical composition comprises a combination of any one of the compounds and therapeutic agents disclosed herein, and one or more additional ingredients, carriers, excipients, or diluents including, but not limited to, absorbents, anti-irritants, anti-acne agents, preservatives, antioxidants, coloring agents/pigments, emollients (moisturizers), emulsifiers, film-forming/holding agents, fragrances, leave- on exfoliants, prescription drags, preservatives, scrub agents, silicones, skin- identical/repairing agents, slip agents, sunscreen actives, surfactants/detergent cleansing agents, penetration enhancers, and thickeners.
- additional ingredients, carriers, excipients, or diluents including, but not limited to, absorbents, anti-irritants, anti-acne agents, preservatives, antioxidants, coloring agents/pigments, emollients (moisturizers), emulsifiers, film-forming/holding agents, fragrances
- the compounds and therapeutic agents of the present application may be incorporated into compositions for coating an implantable medical device, such as prostheses, artificial valves, vascular grafts, stents, or catheters.
- Suitable coatings and the general preparation of coated implantable devices are known in the art and are exemplified in U.S. Patent Nos. 6,099,562; 5,886,026; and 5,304,121.
- the coatings are typically biocompatible polymeric materials such as a hydrogel polymer, polymethyldisiloxane, polycaprolactone, polyethylene glycol, polylactic acid, ethylene vinyl acetate, and mixtures thereof.
- the coatings may optionally be further covered by a suitable topcoat of fluorosilicone , polysaccharides, polyethylene glycol, phospholipids or combinations thereof to impart controlled release characteristics in the composition.
- Coatings for invasive devices are to be included within the definition of pharmaceutically acceptable carrier, adjuvant or vehicle, as those terms are used herein.
- the present application provides an implantable drag release device impregnated with or containing a compound or a therapeutic agent, or a composition comprising a compound of the present application or a therapeutic agent, such that said compound or therapeutic agent is released from said device and is therapeutically active. Dosages and regimens
- a compound of the present disclosure is present in an effective amount (e.g., a therapeutically effective amount).
- Effective doses may vary, depending on the diseases treated, the severity of the disease, the route of administration, the sex, age and general health condition of the subject, excipient usage, the possibility of co-usage with other therapeutic treatments such as use of other agents and the judgment of the treating physician.
- an effective amount of the compound can range, for example, from about 0.001 mg/kg to about 500 mg/kg (e.g . from about 0.001 mg/kg to about 200 mg/kg; from about 0.01 mg/kg to about 200 mg/kg; from about 0.01 mg/kg to about 150 mg/kg; from about 0.01 mg/kg to about 100 mg/kg; from about 0.01 mg/kg to about 50 mg/kg; from about 0.01 mg/kg to about 10 mg/kg; from about 0.01 mg/kg to about 5 mg/kg; from about 0.01 mg/kg to about 1 mg/kg; from about 0.01 mg/kg to about 0.5 mg/kg; from about 0.01 mg/kg to about 0.1 mg/kg; from about 0. 0.01 mg/kg to about 500 mg/kg (e.g . from about 0.001 mg/kg to about 200 mg/kg; from about 0.01 mg/kg to about 200 mg/kg; from about 0.01 mg/kg to about 150 mg/kg; from about 0.01 mg/kg to about 100 mg/kg; from about
- an effective amount of a compound is about 0.1 mg/kg, about 0.5 mg/kg, about 1 mg/kg, about 2 mg/kg, or about 5 mg/kg.
- the foregoing dosages can be administered on a daily basis (e.g., as a single dose or as two or more divided doses, e.g., once daily, twice daily, thrice daily) or non-daily basis (e.g., every other day, every two days, even- three days, once weekly, twice weekly, once every two weeks, once a month).
- a daily basis e.g., as a single dose or as two or more divided doses, e.g., once daily, twice daily, thrice daily
- non-daily basis e.g., every other day, every two days, even- three days, once weekly, twice weekly, once every two weeks, once a month.
- the term “about” means “approximately” (e.g., plus or minus approximately 10% of the indicated value).
- substituents of compounds of the invention are disclosed in groups or in ranges, it is specifically intended that the invention include each and every indiv idual subcombination of the members of such groups and ranges.
- C 1-6 alkyl is specifically intended to individually disclose methyl, ethyl, C 3 alkyl, C 4 alkyl, C 5 alkyl, and C 6 alkyl.
- the phrase “optionally substituted” means unsubstituted or substituted.
- the substituents are independently selected, and substitution may be at any chemically accessible position.
- substituted means that a hydrogen atom is removed and replaced by a substituent.
- a single divalent substituent, e.g., oxo, can replace two hydrogen atoms. It is to be understood that substitution at a given atom is limited by valency.
- C n-m indicates a range which includes the endpoints, wherein n and m are integers and indicate the number of carbons. Examples include C 1-4 , C 1-6 , and the like.
- C n-m alkyl refers to a saturated hy drocarbon group that may be straight-chain or branched, having n to m carbons.
- alkyl moieties include, but are not limited to, chemical groups such as methyl, ethyl, n-propyl, isopropyl, n-butyl, tert- butyl, isobutyl, sec-butyl; higher homologs such as 2-methyl-1-butyl, n-pentyl, 3- pentyl, n-hexyl, 1,2,2-trimethylpropyl, and the like.
- the alkyl group contains from 1 to 6 carbon atoms, from 1 to 4 carbon atoms, from 1 to 3 carbon atoms, or 1 to 2 carbon atoms.
- alkylene includes divalent alkyl groups.
- C n-m haloalkyl refers to an alkyl group having from one halogen atom to 2s+1 halogen atoms which may be the same or different, where “s” is the number of carbon atoms in the alkyl group, wherein the alkyl group has n to m carbon atoms.
- the haloalkyl group is fluorinated only.
- the alkyl group has 1 to 6, 1 to 4, or 1 to 3 carbon atoms.
- C n-m alkenyl refers to an alkyl group having one or more double carbon-carbon bonds and having n to m carbons.
- Example alkenyl groups include, but are not limited to, ethenyl, n-propenyl, isopropenyl, n-butenyl, sec- butenyl, and the like, In some embodiments, the alkenyl moiety contains 2 to 6, 2 to 4, or 2 to 3 carbon atoms.
- halo refers to F, Cl, Br, or I. In some embodiments, a halo is F, Cl, or Br.
- aryl employed alone or in combination with other terms, refers to an aromatic hydrocarbon group, which may be monocyclic or polycyclic (e.g., having 2, 3 or 4 fused rings).
- C n-m aryl refers to an aryl group having from n to m ring carbon atoms.
- groups include, e.g., phenyl, naphthyl, anthracenyl, phenanthrenyl, indanyl, indenyl, and the like. In some embodiments, aryl groups have from 6 to 10 carbon atoms. In some embodiments, the and group is phenyl or naphtyl.
- C n-m alkynyl refers to an alkyl group having one or more triple carbon-carbon bonds and having n to m carbons.
- Example alkynyl groups include, but are not limited to, ethynyl, propyn-1-yl, propyn-2-yl, and the like.
- the alkynyl moiety contains 2 to 6, 2 to 4, or 2 to 3 carbon atoms.
- C n-m alkylene refers to a divalent alkyl linking group having n to m carbons.
- alkylene groups include, but are not limited to, ethan-1,1 -diyl, ethan- 1,2- diyl, propan-1,1,-diyl, propan -1, 3 -diyl, propan- 1, 2 -diyl, butan-1,4-diyl, butan-1,3- diyl, butan-1,2-diyl, 2-methyl-propan-1,3-diyl, and the like.
- the alkylene moiety contains 2 to 6, 2 to 4, 2 to 3, 1 to 6, 1 to 4, or 1 to 2 carbon atoms.
- C n-m alkoxy refers to a group of formula -O-alkyl, wherein the alkyl group has n to m carbons.
- Example alkoxy groups include, but are not limited to, methoxy, ethoxy, propoxy (e.g., n-propoxy and isopropoxy), butoxy (e.g., n-butoxy and tert- butoxy), and the like.
- the alkyl group has 1 to 6, 1 to 4, or 1 to 3 carbon atoms.
- C n-m haloalkoxy refers to a group of formula -O-haloalkyl having n to m carbon atoms.
- An example haloalkoxy group is OCF 3 .
- the haloalkoxy group is fluorinated only.
- the alkyl group has 1 to 6, 1 to 4, or 1 to 3 carbon atoms.
- amino refers to a group of formula -NH 2 .
- C n-m alkylamino refers to a group of formula -NH(alkyl), wherein the alkyl group has n to m carbon atoms. In some embodiments, the alkyl group has 1 to 6, 1 to 4, or 1 to 3 carbon atoms.
- alkylamino groups include, but are not limited to, N-methylamino, N-ethylamino , IN- propylamino (e.g., N-(n-propyl)amino and N-isopropylamino), N-butylatnino (e.g., N- (n-butyl)amino and N-(tert-butyl)amino), and the like.
- di(C n-m -alkyl)amino refers to a group of formula - N(alkyl) 2 , wherein the two alkyl groups each has, independently, n to m carbon atoms, In some embodiments, each alkyl group independently has 1 to 6, 1 to 4, or 1 to 3 carbon atoms.
- heteroaryl refers to a monocyclic or polycyclic aromatic heterocycle having at least one heteroatom ring member selected from sulfur, oxygen, and nitrogen, In some embodiments, the heteroaryl ring has 1, 2, 3, or 4 heteroatom ring members independently selected from nitrogen, sulfur and oxygen . In some embodiments, any ring-forming N in a heteroaryl moiety can be an N-oxide. In some embodiments, the heteroaryl is a 5-10 membered monocyclic or bicyclic heteroaryl having 1, 2, 3 or 4 heteroatom ring members independently selected from nitrogen, sulfur and oxygen. In some embodiments, the heteroaryl is a 5-6 monocyclic heteroaryl having 1 or 2 heteroatom ring members independently selected from nitrogen, sulfur and oxygen.
- the heteroaryl is a five- membered or six-membereted heteroaryl ring.
- a five-membered heteroaryl ring is a heteroaryl with a ring having five ring atoms wherein one or more (e.g., 1, 2, or 3 ⁇ ring atoms are independently selected from N, O, and S.
- Exemplary five-membered ring heteroaryls are thienyl, furyl, pyrrolyl, imidazolyl, thiazolyl, oxazolyl, pyrazolyl, isotliiazolyl, isoxazolyl, 1,2,3-trxazolyl, tetrazolyl, 1,2,3-thiadiazolyl, 1,2,3- oxadiazolyl, 1,2,4-triazolyl, 1,2,4-thiadiazolyl, 1 ,2,4-oxa.diazolyl, 1,3,4-triazolyl, 1,3,4-thiadiazolyl, and 1,3,4-oxadiazolyl.
- a six-membered heteroaryl ring is a heteroaryl with a ring having six ring atoms wherein one or more (e.g., 1, 2, or 3) ring atoms are independently selected from N, O, and S.
- Exemplary six-membered ring heteroaryls are pyridyl, pyrazinyl, pyrimidinyl, triazinyl and pyridazinyl.
- the compounds described herein can be asymmetric (e.g., having one or more stereocenters). All stereoisomers, such as enantiomers and diastereomers, are intended unless otherwise indicated.
- Cis and irons geometric isomers of the compounds of the present invention are described and may be isolated as a mixture of isomers or as separated isomeric forms.
- the compound has the (R)-configuration.
- the compound has the (S) -configuration.
- Tautomeric fomis result from the swapping of a single bond with an adjacent double bond together with the concomitant migration of a proton.
- Tautomeric forms include prototropic tautomers which are isomeric protonation states having the same empirical formula and total charge.
- Example prototropic tautomers include ketone - enol pairs, amide - imidic acid pairs, lactam - lactim pairs, enamine - imine pairs, and annular forms where a proton can occupy two or more positions of a heterocyclic system, for example, 1H- and 3H-imidazole, 1H-, 2H- and 4H- 1,2,4-triazole, 1H- and 2H- isoindole, and 1H- and 2H-pyrazoIe.
- Tautomeric forms can be in equilibrium or sterically locked into one form by appropriate substitution.
- an ex vivo cell can he part of a tissue sample excised from an organism such as a mammal .
- an in vitro cell can be a cell in a cell culture.
- an in vivo cell is a cell living in an organism such as a mammal.
- contacting refers to the bringing together of indicated moieties in an in vitro system or an in vivo system.
- “contacting” the aaRS with a compound of the inv ention includes the administration of a compound of the present invention to an individual or patient, such as a human, having aaRS, as well as, for example, introducing a compound of the invention into a sample containing a cellular or purified preparation containing the aaRS.
- the term “individual”, “patient”, or “subject” used interchangeably, refers to any animal, including mammals, preferably mice, rats, other rodents, rabbits, dogs, cats, swine, cattle, sheep, horses, or primates, and most preferably humans.
- the phrase “effective amount” or “therapeutically effective amount” refers to the amount of active compound or pharmaceutical agent that elicits the biological or medicinal response in a tissue, system, animal, individual or human that is being sought by a researcher, veterinarian, medical doctor or other clinician.
- treating refers to 1) inhibiting the disease: for example, inhibiting a disease, condition or disorder in an indi vidual who is experiencing or displaying the pathology or symptomatology of the disease, condition or disorder (i.e., arresting further development of the pathology and/or symptomatology), or 2) ameliorating the disease; for example, ameliorating a disease, condition or disorder in an individual who is experiencing or displaying the pathology or symptomatology of the disease, condition or disorder (i.e., reversing the pathology and/or symptomatology).
- aaRS AminoacyTtRNA synthetase
- ProRS prolyl-tRNA synthetase
- aaRS a novel single-step biochemical assay platform for Plasmodium
- HsProRS human ProRS
- the assay informs the inhibitor requirements, e.g., to o vercome existing resistance mechanisms and therefore accelerates rational development of ProRS-targeted anti-malarial therapies.
- Malaria is an infectious diseases caused by Plasmodium parasites and ranks third among deadly infectious diseases, with over 200 million cases and more than 600,000 deaths per year.
- the emergence and spread of resistance to first-line antimalarials threatens the ability to treat and contain malaria. This problem is exacerbated by the limited number of targets exploited by current drugs, most of which are only relevant for the asexual blood stage (ABS), restricting their utility to the treatment of acute malaria. Therefore, new antimalaria! therapies that exploit novel targets and pathways essential for multiple life-cycle stages are highly sought after for primary prophylaxis and transmission blocking, in addition to acute treatment.
- Halofuginone is one the most potent known antimalarials and a synthetic derivative of the natural product febrifugine (1), the curative ingredient of an ancient herbal remedy that has been used in Traditional Chinese Medicine for over 2,000 years for the treatment of fevers and malaria.
- the therapeutic utility of halofuginone and analogs as antimalarials has been stymied by poor tolerability, and the previously unknown mode of action in the host and parasite has impeded rational development of drugs with improved pharmacological properties.
- Cytoplasmic prolyl- tRNA synthetase (ProRS) was identified as the molecular target of halofuginone in P falciparum.
- ProRS is a member of the aaRS enzyme family, which exist in all living cells and catalyze the transfer of amino acids to their cognate tRNAs.
- recent research has also revealed secondary functions of specific aaRS isoforms and tRNA s beyond their canonical role in protein biosynthesis.
- Halofuginone and derivatives are also active against liver stage parasites in vitro and in vivo, further validating ProRS as an attractive target for antimalariai drug development.
- halofuginone In complementary efforts, investigating the mode of action of halofuginone in humans, where halofuginone has been studied as chemotherapeutic, antifibrotic, immunomodulatory agent and more recently as antiviral drug, prolyl-tRNA synthetase activity of the bifunctional glutamyl-prolyl-tRNA synthetase (HsGluProRS) was identified as the mechanistic target.Crystallographic data of the co-complexes with human and Plasmodium ProRS revealed that halofuginone binds the A76-tRNA Pro and proline -binding pockets of the active site (Fig.7), which are highly conserved between both homologs. Despite the high homology between parasite and host enzymes (see Fig.
- halofuginone is significantly more active against asexual blood- stage P. falciparum than mammalian cell lines.
- halofuginone- induced parasites mounted a 10-20-fold tolerance by upregulation (-20-fold) of intracellular proline, which is competitive with halofuginone.
- This previously unrecognized mode of resistance could potentially also explain the failure of febrifugine and halofuginone to control recrudescence in vivo and their narrow therapeutic indices as antimalarials.
- Non-radioactive aaRS assay s generally require 0.1-0.5 ⁇ M enzyme and are consequently Incapable of accurately measuring ifo-values substantially below this concentration range. Additionally, current assay platforms require long incubation times and multiple manipulation steps that increase variability, largely preclude the measurement of binding kinetics, and are generally challenging to implement in high- throughput screening (HTS) settings.
- the assay within the present claims is a straightforward, single-step biochemical assay that facilitates HTS and reliable ligand characterization, including kinetic and substrate-dependent profiling, and therefore greatly accelerates inhibitor development for tins enzyme family.
- Time-resolved Forster resonance energy transfer (TR-FRET) assays possesses favorable characteristics including high sensitivity, specificity, and flexibility, and offer an equally straightforward and robust platform for the quantitative characterization of aaRS ligands (Fig. 2a, 2B, 2C).
- TR-FRET Time-resolved Forster resonance energy transfer
- the active site of ProRS comprises three distinct pockets that bind ATP, proline, and the 3’ -terminal adenosine residue of tRNA Pro (A76), respectively (Fig. 1a).
- a class of HsProRS inhibitors is represented by T-3767758 (2) (Fig. 1a). Unlike halofuginone and analogs, which span the A76 and proline-binding sites and interact in an ATP-imcompetitive manner (i.e., the inhibitor affinity increases with increasing ATP concentration), this inhibitor class targets the A TP-binding pocket and features adjacent to the active site.
- T-3767758 (2) (Fig. la) displayed proline- uncompetitive steady state kinetics forHsPro RS.
- 4-amino-piperidyl substituent of ProRS inhibitor compound 7 identified above represents a suitable position for linker functionalization, providing fluorescent tracers for TR-FRET-based ligand displacement assays (Fig. 2a, 2B, 2C).
- Replacement of the BOC-group with an acyl linker follows the triphosphate exit vector, as in the halofuginone-ATP PfcProRS co-crystal structure (e.g. PDB: 40LF).
- TR-FRET tracers were prepared, such as MAT379 (24) and MAT425, shown below, that were appropriate for the development of a single-step ligand displacement assay, enabling screening of active site inhibitors for ProRS:
- the HaloTag is a self-labeling protein tag that allows for efficient and defined covalent atachment of HaloTag-ligand modified small molecules, which were exploited to functionalize HT-PfcProRS with CoraFluor- 1-Halo as the TR-FRET donor.
- the first-order dissociation rate constant (k off ) was measured for MAT379 by 10-fold dilution of an equilibrated solution of CoraFluor-1 -labeled HT-PfcProRS (100 nM) and ⁇ EC 80 MAT379 (560 nM) which yielded k off -value of ⁇ 0.16 min -1 (Fig. 10c-d), suggesting that quasi-equilibrium is reached within 15 min (unless the test compounds themselves exhibit slow binding kinetics).
- HsProRS N-terminal His6-Halo Tag fusion protein
- pyrazinamide compounds were profiled (see Fig 13A-D) together with several reference compounds such as halofuginol (26), D-ProSA (27) as a negative control for ProSA, and glyburide (28).
- the inh ibitor set was first tested in a dose- response format against both CoraFluor-1-Halo-labeled HT-PfcProRS and HT- HsProRS. in the absence and presence of individual substrates, to determine the quantitative binding affinities and modes of inhibition. Inhibitors that exhibited ligand depletion under the default assay conditions were retested at lower ProRS concentrations using the antibody-based labeling protocol (Fig. 14).
- glyburide which has previously been identified as a parasite-selective inhibitor that targets PfcProRS allosterically adjacent to the active site displayed >30-fold selectivity in the absence of substrates, and, consistent with the original report, was ATP- and proline-competitive (Fig. 14, Table 1 ).
- the clonal lines exhibited the same level of NCP26- resistance (Fig. 16a), but no (S1-2) or low-level ( ⁇ 5 -fold, S3) cross-resistance to halofuginone analogs and no differential sensitivity to other drugs, such as dihydroartemisinin (DHA) or the threonyl-tRNA synthetase inhibitor borrelidin (Fig.
- exemplary compounds are inhibitors (e.g., dual-site inhibitors) of ProRS.
- exemplary compounds are MAT334 (29) and MAT345 (30): their BOC-protected precursors (31 and 32) were also prepared:
- TR-FRET-based ligand displacement assay strategy resolves the limitations of current platforms that have stymied aaRS -targeted drug development and offers exceptional throughput, robustness, sensitivity, and flexibility.
- the methodology is based on a simple mix-and-read assay design that enables kinetic measurements and detailed interrogation of inhibition modes, while reducing the required amount of protein by several orders of magnitude. These characteristics not only improve economic aspects, but, more importantly, allow for the quantitative profiling of high-affinity ligands, which for the first time established accurate equilibrium binding constants for ProSA.
- CoraFluor-ProRS technology greatly accelerates the drug discovery process beyond malaria and is equally applicable to other parasitic diseases where the corresponding ProRS homolog is a validated drag target, including toxoplasmosis, leishmaniasis, cryptosporidiosis, and coccidiosis.
- host aaRSs have been recognized for their many roles in human health and disease, and HsProRS is an attractive target for the development of new' drug classes for the treatment of autoimmune disorders, fibrosis, cancel; and more recently viral infections, including COVID-19, ehikungunya, and dengue.
- TR-FRET tracers MAT379 and MAT425 exhibited > 15-fold and >50-fold reduced affinity ' for Hs ProRS relative to PfcProRS, respectively. This points to contributions of protein features adjacent to the active site, fac Int, the region expected to be occupied by the FITC-functionaiized linker represents one of the least conserved regions between Pfc ProRS and Hs ProRS (Fig. 8).
- Aminoacyl tRNA synthetase (aaRS) enzymes are desirable drug targets.
- aaRSs exist in all living cells and are indispensable enzymes in protein biosynthesis. In their canonical function they catalyze the transfer of amino acids to their cognate tRNAs. This process, generally referred to as “charging”, is highly specific and ensures the steady supply of aminoacyl-tRNAs that are used by the ribosome as the fundamental building blocks for protein synthesis. More recently, additional secondary, isoform- specific, functions of aaRSs have been recognized.
- aaRSs and associated pathw ays are attractive targets for chemo therapeutic intervention in a wide range of human diseases, such as cancer, autoimmune disorders, and infectious diseases, including bacterial, fungal, viral, parasitic infections.
- the general lack of robust, sensitive and straightforward biochemical and cellular assay platforms for aaRSs has broadly- hampered the identification and rational development of inhibitors for this enzyme family.
- the identification and development of aaRS inhibitors has been greatly impeded by the lack of sensitive, robust, and straightforward biochemical assay platforms that allow for high-throughput screening and reliable ligand profiling.
- biochemical aaRSs assay platforms have been reported, including for both PRS homologs, they suffer from several shortcomings.
- aaRS assays Because of the low turnover rate of aaRS and the lack of sensitive fluorogenic substrates non-radioactive aaRS assays generally require 0.1-0.5 ⁇ M enzyme ([E]). However, even if enzyme supply does not constitute a bottleneck, high enzyme concentration limits the accurate measurement of binding affinities to inhibitors with Kd-values > 1 ⁇ 2[E], while more potent inhibitors will appear indistinguishable. Additionally, current assay platforms require multiple manipulation steps that are challenging to implement in HTS settings and are prone to errors.
- a ligand-displacement assay utilizes linker- modified active site-directed small molecule ligands that are labeled with a fluorophore that is suitable to function as TR-FRET acceptor.
- the TR-FRET donor molecule is installed on the aaRS of interest by different means, including direct covalent labeling, through an antibody directed at the aaRS or an epitope tag (e.g., His6-tag), or by expressing the aaRS of interest as a fusion protein with a self-labeling protein tag (e.g., HaloTag).
- ligand displacement assay platforms have been developed for other protein targets, no such assay has been reported fo araRSs. The reason for this is that no small molecule ligands that would allow for fluorophore labeling while retaining sufficiently high affinity for the target aaRS isoform have been reported.
- fluorophore labeled ligands such as MAT379 and MAT425
- PRS P. falciparum prolyl-tRNA-synthetase
- these assays reduce the procedure to a single step and require 100- 1000-fold less enzyme, while simultaneously providing increased robustness, flexibility and sensitivity.
- the assay developed in this example is a generalizable approach that is applicable to other aaRS isoforms besides ProRS.
- Analysis of existing co-crystal structures of various aaRS isoforms with their substrates or small molecule inhibitors suggests that the ligands are generally bound deeply buried (comparable to ProRS), generally limiting the options for the attachment of a linker that would enable the installment of a fluorophore as TR-FRET acceptor or donor.
- Ligands were docked against the ProRS structures reported here (PDB 6T7K, 7QB7, 7QC1, and 7QC2) and previously (for Hs ProRS, PDB: 5VAD, 4HVC, 4K86, 4K87, 4K88, and 5V58; for Pfc ProRS, PDB 4Q15, 4NCX, 4YDQ, 40LF, 5IFU, and 4WI1). Protein preparation was accomplished using default settings and the pharmacophore constraints were automatically generated and used without modification. Conformation hunts were done with “ very accurate but slow” setting modified to allow rotation about acyclic secondary amide bonds. Alignments were performed using both “ normal” (unbiased) and “ substructure ” (guided by ligands from crystal structures) settings. No model building was used to guide chemical synthesis.
- Hs ProRS (residues 996-1512), UniProt accession ID P07814) and PfcProRS (residues 249-746, PF3D7 1213800) were codon optimized for expression in E. coli and subcloned (GenScript Biotech Corporation, Piscataway, New Jersey) into a pFN29A His6HaloTag T7 Flexi V ector (Promega), which contains an N-terminal His6-Tag- HaloTag (henceforth HT) followed by a linker sequence containing a TEV-cleavage site (5’-
- HT-PfcProRS and HT-HsProRS plasmids were independently transformed into SoluBL-21 TM E. coli (Genlantis Inc. # €700200) and single colonies were picked from lysogeny broth (LB)-agar-ampicillin plate.
- SoluBL-21TM E. coli expressing either HT- PfcProRS or HT-Hs ProRS were cultured in lysogeny broth supplemented with 100 ⁇ g/ml ampicillin at 37°C until OD 600 -0.17, cooled to I5°C, induced with 0.1 mg/mL 1PTG (isopropyl b-D-thiogalactopyranoside), and cultured overnight at 15°C.
- Cell pellets were collected via centrifugation for 20 min at 2,800 x g, flash frozen with liquid nitrogen, and stored at ⁇ 80°C until lysis performed.
- Bacterial cell pellets were quickly thawed in room-temperature water and independently lysed on ice in B-PER Bacterial Protein Expression Reagent (Thermo Scientific #78243), pH 7.0 supplemented with 10 m.M imidazole, 500 mM NaCl,
- Protein purity was assessed by sodium dodecyl sulfate polyacrylamide gel electrophoresis (SDS-PAGE) with 1.0-mm NuPAGE 4-12% Bis-Tris protein gels in NuPAGE MOPS running buffer at 120V.
- the HaloTag of HT-ProRS was labeled prior to sample preparation with 100 ⁇ M TAMRA-Halo (55) for 15 min at room temperature. Gels were analyzed using an Amersham Typhoon FLA 9500 fluorescence gel scanner (Cytiva Life Sciences; version 1.0.0.7; Cy3 excitation/emission) followed by Coomassie staining with SimplyBlueTM SafeStain (ThermoFisher #LC6060) .
- Desired fractions based up were buffer exchanged into 2.5 mM HEPES, pH 7.0,
- ProRS protein stocks were aliquoted following addition of glycerol to 20%, flash frozen in liquid nitrogen, and stored at -80°C.
- FIT-PfcProRS was expressed in a phage-resistant derivative of Escherichia coli strain BL21(DE3) carrying the pRARE2 plasmid for rare codon expression.
- Cells were grown at 37°C in Terrific Broth supplemented with 100 ⁇ g/mL ampiciilin until the culture reached an OD 600 of 2.0. The temperature was then decreased to 18°C and protein expression induced with 0.5 mM IPTG (isopropyl b-D-thiogalactopyranoside) overnight.
- Cells were collected by centrifugation and resuspended in 50 mM HEPES, pH 7.5, 500 mM NaCl, 10 mM Imidazole, 5% glycerol, 0.5 mM TCEP, a protease inhibitor cocktail (Sigma), lysozyme, and benzonase, and lysed by sonication.
- the cell lysate was clarified by centrifugation and the proteins purified by nickel-affinity chromatography (Cytiva) using a stepwise gradient of imidazole.
- the His6-Tag-HaloTag fusion was removed by incubating with TEV protease at 4°C overnight and this was followed by size exclusion chromatography (Superdex 200, Cytiva) in 20 mM MES, pH 6.0, 250 mM NaCl, 5% glycerol, and 0.5 mM TCEP.
- the TEV protease, cleaved byproducts containing histidine tag, and unreacted HT-PfcProRS were removed by nickel-affinity chromatography and concentrated using an Amicon centrifugal filtration unit.
- the mass of purified protein w as verified by electrospray ionization time of flight mass spectrometry (ESI-TOF-TOF: Agilent LC/MSD).
- CoraFluor-1-Halo labeling of HT fusion proteins A freshly thawed solution of HT-ProRS in storage buffer (25 mM HEPES, pH 7.0, 100 mM NaCl,
- the concentration of active HT-ProRS concentration following CoraFluor- 1- Halo- labeling was quantitively measured by active-site titration of Cora-Fluor-labeled HT-ProRS (200 nM by nanodrop) with ProSA (25) in the presence of 250 nM MA379 (2.5x KD for HT-PfcProRS and 0.15x K D for HT-Hs ProRS) to determine the IC 50 , calculating the apparent K D using the Cheng Prusoff equation, and doubling the apparent K D value (Equation 1). This allowed for accurate K D determination for inhibitors suffering from ligand depletion (Equation 2) in the TR-FRET assay. For long-term storage at -80°C, glycerol was added to 20% and samples were flash-frozen with liquid nitrogen.
- TR-FRET Time-Resolved Forster Resonance Energy Transfer
- a Multidrop Combi Reagent Dispenser (ThermoFisher Scientific) was used to dispense 40 ⁇ L protein solution into wells of a white, 384-well plate (Corning 3572). Tracer MAT379 (24) or MAT425 was dispensed in dose-response in sextnplicate using a D300 digital dispenser (Hewlett Packard). Half the wells received 10 ⁇ M ProSA for background correction. Plates were mixed on an Ika MTS 2/4 Digital Microtiter Shaker at 750 rpm for 2 min, centrifuged at 1,000 x g at 25°C for 1 min, and allowed to equilibrate at room temperature for 2 h before TR-FRET measurements were taken.
- Specific signal was determined by subtracting raw values from wells containing 10 ⁇ M ProSA (25).
- PRISM 9 GraphPad
- GraphPad was used to perform non-linear regression analysis (one site - specific binding), plot dose-response curves, and calculate K D values.
- PRISM 9 (GraphPad) was used to perform non-linear regression analysis (log(inhibitor) vs, response - Variable slope (four parameters)), plot dose-response curves, and calculate IC 50 values.
- the Cheng Prusoff equation was used to convert IC 50 to K D values (Equation 3). Determination of ProRS Affinity and Substrate Binding Mode by Time-
- TR-FRET Resolved Forster Resonance Energy Transfer Assay
- ATP and proline concentrations used are not substantially above the substrates K D values to facilitate differentiation of substrate-noncompetitive and substrate-competitive inhibitors because these substrate concentrations would compete with our tracer and because it was explicitly sought to develop proline- uncompetitive ProRS inhibitors to circumvent or overcome halofuginone-resistance mechanisms.
- assay buffer 50 mM Tris, pH 7.5, 20 mM KCl, 10 mM MgCl 2 , 0.05% Tween-20, 1 mM dithiothreitoi, and 0.5 mg/mL BSA
- a Multidrop Combi Reagent Dispenser (ThermoFisher Scientific) was used to dispense protein solution (30 or 40 ⁇ L) into each well of a flat, white, 384- well plate (Corning 3572 or Greiner 781207). Test compounds were dispensed in duplicate, triplicate, or sextuplieate dose-response format using a D300 digital dispenser (Hewlett Packard). Each plate included blank wells (no-inhibitor negative control for assay ceiling) and wells receiving 10 ⁇ M ProSA (25, positive control for assay floor) for Z-factor determination and a dose-response of NCP26 (3) as a standard. Plates were mixed on an Ika MTS 2/4 Digital Microti ter Shaker at 750 rpm for 2 min, centrifuged at 1,000 x g at 25°C for 1 min, and allowed to equilibrate for 2h at room temperature.
- Z-factors were calculated in Excel using 10 ⁇ M ProSA wells and negative control wells.
- GraphPad PRISM was used to perform non-linear regression (log(inhibitor) vs. response - Variable slope (four parameters)), plot dose-response curves, and calculate IC 50 values.
- the ligand-depletion corrected Cheng Prusoff equation was used to convert IC 50 to K D values (Equation 4).
- K D_app ,MAT379 is defined as MAT379's K D corrected for the concentration of proline or ATP, if any, using the Cheng Prusoff equation. Note that for this equation, the [active HT-ProRS] was the active ProRS concentration determined by titration with ProSA (see above).
- the inhibition mode for each test compound with respect to ATP or proline was determined by comparing the K D values measured in the presence and absence of each substrate.
- Equation 4 is only valid when the active HT-ProRS concentration is > ⁇ 2 x K D . All values reported in the text or tables are not from ProRS -titrating conditions, but in some plots, compounds are titrating and these are clearly indicated in the figure legend (Fig. 9d-f and Fig. 14b, c,e).
- the anti-His6 antibody format was utilized to enable accurate determination of ProSA’s affinity (K D value) and this data is shown for ProSA in Fig 9g, Table 1.
- Time Resolved Forster Resonance Energy Transfer (TR-FRET) Inhibition Mode Determination - anti-His6 antibody format: This assay was generally conducted in the same manner as the CoraFluor-1-FIalo format with minor differences. All assays were conducted in sextuplicate dose-response with CoraFluor-1-Halo-labeled HT- ProRS whose concentration was determined by titration with ProSA. Each well was supplemented with 1 nM CoraFluor-1-Pfp-labeled anti-His6 antibody before the 2 h incubation.
- TR-FRET Time Resolved Forster Resonance Energy Transfer
- the commercially available anti-His6 antibody (Abcam ab18184) was labeled as described pre viously .
- the following extinction coefficients were used to calculate antibody concentration and degree-of-labeling (DOL):
- Antibody E280 210,000 M- 1 cm -1
- CoraFluor-1-Pfp E 340 22,000 M -1 cm -1 .
- Antibody conjugates were diluted with 50% glycerol, flash-frozen in liquid nitrogen, and stored at -80°C.
- TR-FRET measurements were acquired in kinetic mode (1 read every -45 s) for at least 10 min.
- Excel was used to subtract the background signal (10 ⁇ M ProSA wells) from the DMSO vehicle wells.
- PRISM 9 GraphPad
- PRISM 9 was used to perform non-linear regression (Dissociation - One Phase exponential decay), plot 520/490 nm TR-FRET ratio vs. time, and calculate k off values.
- association rates (k on, obs ) were measured using a similar method (described below), but they were too fast to measure (fully equilibrated by first time point) calculated the association rates (k on,calc ) using the measured dissociation rates (k off ) and measured equilibrium dissociation constants (K D ) in Equation 5.
- k on,calc k off / K D (Equation 5)
- TR-FRET measurements were acquired in kinetic mode (1 read every -45 s) for at least 10 min.
- Excel was used to subtract the background signal (10 ⁇ M ProSA wells) from the DMSG vehicle wells.
- GraphPad PRISM was used to perform non-linear regression (Association kinetics - One Conc. of hot), plot 520/490 nm TR-FRET ratio vs. time, and calculate k on,obs values.
- PfcProRS was co-crystallized with NCP26 (3), MAT334 (29), and MAT345 (30) at 20°C using the sitting drop vapor diffusion method .
- MAT334 was added to P/cProRS (3 mg/mL) at a concentration of 0.5 mM, and the protein-compound mixture incubated 30 min on ice before it was concentrated to 28,5 mg/mL. Crystals of PfcProRS in complex with MAT334 and proline were obtained in a drop containing 75 nL of protein-compound mixture and 75 nL precipitant composed of 0.2 M L-Proline, 10% PEG3350, and 0.1 M HEPES, pH 7.5.
- Crystals ofPfcProRS in complex with MAT345 and proline were obtained in a drop containing 75 nL of a protein -compound mixture with 1 mM of MAT345, 5 mM L-proline, and 22 mg/mL P/cProRS, and 75 nL precipitant compost of 25% PEG3350 and 0.1 M B1S-TR1S, pH 6.5.
- the complex structure of P/cProRS with NCP26 (PDB 6T7K) was solved to 1.79 A resolution using PDB 4Q15 as a search model.
- the complex structure of PfcProRS with MAT334 was solved to 2.28 A resolution (PDB 7QC2), MAT345 to 1.92 A (PDB 7QB7), using PDB 6T7K as search model.
- the structures were refined in an iterative process using PHENIX with electron density map inspections and model improvement in WinCOOT and terminated when there were no substantial changes in the R work and R free - values and inspection of the electron density map suggested that no further corrections or additions were justified. Structural analysis and figures were performed with PyMOL.
- P. falciparum. Cell Lines and Culture Conditions Parasites were maintained under standard culture conditions as described previously.
- the P. falciparum Dd2- 2D4 clone was derived from Malaria Research and Reagent Resource Repository line MRA-156 (BEI Resources).
- the P. falciparum HFG-induced (elevated proline homeostasis) and HFGRl (elevated proline homeostasis and PfcProRS L482H ) were previously reported previously.
- P. falciparum Asexual Blood Stage Growth Assay This assay was performed as previously described. In short, P. falciparum erythrocytic-stage parasites at 1% parasitemia and 1% hematocrit in RPMI + 0.5% Albumax were seeded at 40 ⁇ L/well in 384-well plates with test compounds in triplicate, dose-response format with 10 ⁇ M dihydro-artemisinin as a kill-control and blank (no compound) wells as a growth-control. DMSO concentration did not exceed 1% (v/v). After 72 h, growth was quantified by measuring fluorescence following SYBR Green staining. Data was analyzed in Excel and plotted in GraphPad PRISM.
- P. falciparum Asexual Blood Stage Short-Term Resistance Susceptibility Assay Using the robust procedure previously used to generate HFG-induced parasites (HFG-tolerant with elevated proline homeostasis), unsuccessful attempts were made to generate NCP26-tolerant/resistant parasites, sh Ionrt, three independent flasks of P. falciparum Dd2-2D4 parasites were treated with 4x EC 50 NCP26 until no parasites were detected by Giemsa staining microscopy. Following recrudescence, sensitivity to NCP26 and halofuginone was assayed using the ABS growth assay.
- NCP26 Resistance Selection Three independent selections for NCP26- resistant mutants of P. falciparum Dd2-2D4 parasites were conducted in vitro as previously reported. In short, parasites were treated with 4x EC 50 NCP26 until no parasites were detected by giemsa staining microscopy.
- the asexual blood stage growth assay was used to determine sensitivity to NCP26 and control compounds including ProRS inhibitors halofuginone (1), halofuginol (26), and ProSA (25); threonyl-tRNA synthetase (ThrRS) inhibitor borrelidin; and dihydroartemisinin (DHA),
- This cycle was repeated for ⁇ 50 generations (- 100 days), corresponding to 5-6 cycles of drug pressure.
- Selections were initially made with ⁇ 3 x 10 8 parasites per flask (i.e. per independent selection), but did not observe any resistance after 2 cycles of drag pressure (38 days; ⁇ 19 generations) so selection cultures were expanded to ⁇ 1 x 10 9 parasites per flask and maintained this for the remainder of the selection.
- SNVs and INDELs wore called using GATK HaplotypeCaller and filtered according to GATK's best practice recommendations.
- Variants wore annotated using a custom SnpEff database and further filtered by comparing those from resistant clones to the parent clone, such that only a mutation present in the resistant clone but not the sensitive parent clone would be retained.
- CNVs wore identified by differential Log2 copy ratio as described in the GATK 4 workflow. Briefly, read counts were collected across genic intervals for each sample.
- PCR amplification and Sanger sequencing Genomic DNA was isolated as described above (see Library preparation and whole genome sequencing). Sections of the cPRS gene were amplified by polymerase chain reaction (PCR) to validate the mutations observed by whole genome sequencing. Primers (single stranded DNA oligomers) were ordered from integrated DNA Technologies Inc (see PCR Primers Table below for sequences).
- PCR reactions were analyzed by 1% agarose gel electrophoresis and fluorescentiy imaged following ethidium bromide staining to ensure PCR reactions produced one product.
- DNA was purified from PCR reactions using Zymo DNA Clean and Concentrator-5 Kit (Zymo Research #D4005). Purified DNA was submitted to Genewiz Inc for Sanger sequencing and results were aligned to the predicted and sequenced results from the Dd2-2D4 parent line using Benchling.
- HuH7 cells (Sigma) were cultured in DMEM + L-Glutamine (Gibco) supplemented with 10% (v/v) heat-inactivated FBS (Sigma) and 1% (v/v) antibiotic/ antimycotic (Sigma). Hepatocyte cultures were maintained in a standard tissue culture incubator at 37°C. Anopheles mosquitoes infected with luciferase-expressing P. berghei ANKA sporozoites were obtained from the Sporocore at the University of Georgia. liver stage P. berghei assays were completed as previously described.
- HuH7 cells were seeded into 384-well plates (Corning) one day prior to infection. Compounds (0-50 ⁇ M) were added in triplicate to wells before infection with 4,000 P. berghei sporozoites. At ⁇ 44 hpi, HuH7 cell viability and P. berghei parasite load was assessed using CellTiter-Fluor (Promega) and Bright -Glo (Promega), respectively, using an Envision plate reader. Relative fluorescence and luminescence signal intensities were normalized to the negative control, 1% DM80. EC 50 values were determined using GraphPad Prism through fitting data to a dose response curve. Reported EC 50 values are averages of three independent experiments.
- HT-PfcProRS and HT- HsPro RS were expressed and purified as described herein and elsewhere. The remaining constructs were provided by Dr. Vadim Baidin. All constructs except HsPro RS were expressed in E. coli. The MtbPheRS was expressed in Mycobacterium. Following lysis and clarification by centrifugation, samples were successively purified by Ni-NTA affinity chromatography and size exclusion chromatography. Protein purity was analyzed by SDS-PAGE followed by Coomassie staining.
- TR-FRET Assay Except the HsGluProRS lysate assays (described below), ail TR-FRET assays were performed as described in Chapter 2, but with the indicated aaRS enzyme. These TR-FRET assay were performed in the format described in Chapter 2 methods: “Determination of ProRS Affinity and Substrate Binding Mode by Time-Resolved Forster Resonance Energy Transfer Assay” and “Time Resolved Forster Resonance Energy Transfer (TR-FRET) Inhibition Mode Determination - anti-His6 antibody format”. Please note that many of the assays described in this chapter have only one experimental replicate (not technical replicate).
- P. falciparum Cell Lines and Culture Conditions P. falciparum Asexual Blood Stage Growth Assay.
- PheRS activity assay Performed as described previously.
- Abcam ab31531 was raised against an Abcam -proprietary, recombinant, full- length HsGluProRS protein.
- Proteintech 67712-1 -Ig was raised against a peptide encoding HsGluProRS residues 1163-1512.
- Cell Signaling Technology CST45956 was raised against a peptide encoding residues surrounding HsGluProRS- P978 .
- CTK0101 Chrom Tek anti-Rabbit-IgG secondary nanobody (single domain nanobody) was previously labeled with CoraFluor-1-Pfp and validated to bind Rabbit IgG antibodies with high affinity.
- Non-hydrolyzable aminoacyl-AMP analogs particularly 5’-N-linked aminoacyl sulfamidyladenosine analogs, are suitable TR-FRET tracers for the generalization of TR-FRET assay platform to several other aaRS isoforms from diverse bacterial and eukaryotic species including humans , P. falciparum (malaria),
- M. tuberculosis S. aureus , E. coli , P. aeruginosa and A. thahana.
- the data presented herein can be generalized to all isoforms, which enables generation of aaRS inhibitors, useful for a wide range of disorders such as those described herein (e.g., cancer, fibrosis, autoimmune disorders, and diverse infections including those caused by bacteria, fungi, malaria and other parasites, and viruses).
- these assays required two things: labeling the target aaRS with the CoraFluor-1 TR-FRET donor (e.g. labeling HaloTag-aaRS with CoraFluor-1-Halo as done for ProRS in Example 1, or direct chemical labeling with CoraFluor-1-Pfp) and developing a fluorescently-labeled tracer that could be displaced by test compounds.
- labeling the target aaRS with the CoraFluor-1 TR-FRET donor e.g. labeling HaloTag-aaRS with CoraFluor-1-Halo as done for ProRS in Example 1, or direct chemical labeling with CoraFluor-1-Pfp
- fluorescently-labeled tracer that could be displaced by test compounds.
- the pyrazmamide series (described in Example 1), including TR-FRET tracers MAT379 and MAT425, are ProRS specific by virtue of their indane moiety which binds a ProRS-unique auxiliary pocket.
- the only reported chemotype which can bind all aaRS enzymes are non-hydrolyzable aminoacyl-AMP analogs, including the aminoacyl sulfamoyladenossne (aaSA) analogs.
- aaSNA aminoacyl sulfamidyladenosine
- the amino acid is any one of 20 natural amino acids, including alanine, arginine, asparagine, aspartic acid, cysteine, glutamine, glutamic acid, glycine, histidine, isoleucine, leucine, lysine, methionine, phenylalanine, proline, serine, threonine, tryptophan, tyrosine, and valine.
- these compounds bind with extremely high affinity.
- ProSA has mid-picomolar Ko for both PfcProRS and HsProRS) which suggested sufficiently high affinity probes even if the introduction of the linker reduced their affinity.
- the parent aaSA analogs could be used as control inhibitors when developing the assays.
- ProSNA Since the chosen oxygen already had a valency of 2, it was formally replaced by a ni trogen, resulting in ProSNA which was readily accessed as shown in the examples. Notably, the protected precursors to ProSNA (MAT495 and MAT498) proved to he more chemically stable than those for ProSA due to the inability to form the N 3 ,5’-cycloadenosine byproduct, improving yields and significantly reducing the effort to purify synthetic intermediates.
- MAT566 is substantially worse than that of ProSA and ProSNA, it is similar to that of MAT379 for PfcProRS and what others have suggested may be the ideal tracer affinity for primary screening (-100 nM).
- MAT574 was prepared, a fluorescein-labeled analog of MAT556, as shown in the examples.
- MAT574 or pyrazinarnide-based tracers could be used for bacterial ProRS paralogs.
- ProRS from P aeruginosa (residues 10-546) and S. aureus (residues 2-567) were recombinantly expressed as N-terminal His6- ThrombinSite fusion proteins and purified.
- Samples of each protein w ere labeled wi th CoraFluor-1-R ⁇ r following the same protocol used for anti-His6 IgG. The affinity of each TR-FRET tracer was then determined by TR-FRET for P. aeruginosa ProRS and S.
- aureus ProRS respectively, in both the antibody format (unlabeled ProRS and two molar equivalents of CoraFluor-1 -Pfp-labeled anti-His6 IgG) or with CoraFluor-1- Pfp-labeled ProRS.
- PheRS phenyialanyl-tRNA synthetase
- MtbPheRS Mycobacterium tuberculosis phenylalanyl-tRNA synthetase
- HscPheRS human cytoplasmic phenylalanyl-tRNA synthetase ( ⁇ ) 2 ).
- MtbPheRS IC 50 2 ⁇ M
- HscPhcRS IC 50 0.14 ⁇ M
- this activity-based assay requires the use of high concentrations of both phenylalanine (100 ⁇ M) and ATP (200 ⁇ M). These concentrations are within 10-fold of the K D values we determined for proline and ATP for both HsProRS and PfcProRS but phenylalanine and ATP aren’t merely competitive substrates as they are also converted to phenylalanyl -AMP which is expected to have comparable affinity to PheSA and ProSA.
- P. falciparum 3D7 cytoplasmic PheRS (His- PfcPheRS; alpha subunit residues 1-575; beta subunit residues 1-623 as C-terminal T4L-HRV-3C-His9 fusion), human cytoplasmic PheRS (HisHalo ⁇ HscPheRS; alpha subunit residues 1-508; beta subunit residues 1-589 as C-terminal HaloTag-ThrombinSite-His9 fusion), human cytoplasmic PheRS (His-HsccPheRS; alpha subunit residues 1-508; beta subunit residues 1-589 as C-terminal HRV-3C-His9 fusion), human mitochondrial PheRS (HisHalo-HsmPheRS; residues 1-410 as C-terminal Halo-HRV-3C-His9 fusion), M.
- tuberculosis PheRS HisHalo-Mtb PheRS; alpha subunit residues 28-343 as TV-terminal His6-ThrombinSite-HaloTag fusion; beta subunit residues 1-831)
- M. tuberculosis PheRS His ⁇ Mtb PheRS; alpha subunit residues 4-343 as TV-terminal His6- ThrombinSite fusion; beta subunit residues 1-831)
- coli PheRS (HisHalo-EcPheRS; alpha subunit residues 7-331 as N-terminal His6-HaloTag fusion; beta subunit residues 7-795), A thaliana cytoplasmic PheRS (HisAtcytoPheRS; alpha subunit residues 2.-485 as N-terminal His9-HRV-3C firsion; beta subunit residues 1-598 as C- terminal S. pneumoniae NanA fusion (residues 296-776)), and A. thaliana chloroplast PheRS (His-AtchloroPheRS residues 54-429 as C-terminal HRV-3C-His9 fusion).
- IleSNA Isoleucyl sulfamidyladenosine
- IleRS from both S. aureus (residues 1-917) and E. coli (residues 1-938) was recombinantly expressed as C-terminal His6 fusion proteins and purified.
- a tracer could be prepared:
- HEK293T lysate was serially diluted into 384-well plates containing constant concentrations of tracer (either 250 nM MATS 74 for ProRS or 2.50 nM MAT579 for GluRS), one of the antibodies (5 nM), and for the unlabeled antibodies, CoraFluor-1-Pfp labeled nano secondary (20 nM).
- tracer either 250 nM MATS 74 for ProRS or 2.50 nM MAT579 for GluRS
- one of the antibodies 5 nM
- CoraFluor-1-Pfp labeled nano secondary (20 nM).
- No TR-FRET signal was observed for MAT579 under any conditions, whereas specific TR-FRET signal was only observed for MAT574 using the Abcam ab31531 antibody and the secondary nanobody.
- Antibody labeling strategy gave weaker TR-FRET signal and because there was too much separation between the TR-FRET donor and acceptor. HaloTag labeling and direct chemical labeling gave stronger specific TR-FRET signal (not to be confused with higher affinity).
- the fluorescein dye on the TR-FRET acceptors may be replaced with a fluorophore with a longer Forster radius, such as Alexa Fluor 647 which has a -25% larger Forster radius. This could have a substantial effect because FRET (and TR-FRET) efficiency drops off proportionally to 1/r 6 , where r is the Forster radius.
- the affinity of pyrazinamide based ProRS tracers MAT379 and MAT425 suggests that the pyrazinamide series may also have potential for use as antibacterial therapies, but further studies are required.
- Example 3 preparation of exemplified compounds Reagents and Chemical Synthesis: All reagents were purchased from Chem-Impex international Inc., Combi-Blocks Inc., Oakwood Chemical, Sigma Aldrich, Fisher Scientific International Inc., VWR International, and BioSynth CarboSynth and were used without purification. Detailed synthetic procedures can be found in Supplementary Information. Stock solutions of inhibitors were prepared at 10 mM in molecular biology grade DM8Q (Sigma Aldrich). Preparation of TAMRA-Halo (55) and the TR-FRET donor CoraFluor-1 reagents (CoraFluor-1-Halo and CoraFluor-1- Pfp) were reported previously. Halofuginone (1) was purchased from BioSynth CarboSynth and used without purification. Glyburide (28) was purchased from Combi-Blocks Inc. and used without further purification.
- Tins compound has been previously reported in a patent with minimal procedural information and zero characterization data. Synthesized using the general sulfamide coupling protocol developed by Meng et al. for the synthesis of structurally unrelated compounds, In short, charged vial with MA T521 (112 mg, 366 ⁇ mol , 1eq), sulfuric diamide (93.9 mg, 977 ⁇ mol , 2.67 eq), and water (1 mL). Stirred vigorously and refluxed for 2.75 h. Purified by reverse-phase flash column chromatography (water / MeCN, both with 0.1% formic acid). Yield: 131 mg, 93%. White solid. 1 H
- MAT562 (812 mg, 1.81 mmol, 1 eq), MAT521 (1.78 g, 5.79 mmol, 3.2 eq), MeCN (100 mL) and DIPEA (2 mL). Stirred vigorously and heated to 70°C for 22 h. Added ⁇ 8 g silica gel and concentrated in vacuo. Purified by flash column chromatography (dry load; DCM / MeOH) to obtain clean MAT563 and clean MAT521. Yield: 902 mg, 79.5% by isolated product (97% yield by recovered starting material). White solid. Also recovered 1.28 g MAT521 (72% recovery).
- Example 5 assays to identify and profile heterobifunctional degraders (PROTAC)
- This example provides a generalizable TR-FRET-based platform to profile the cellular action of heterobifunctional degraders (or PROTACs), capable of both accurately quantifying protein levels in whole cell lysates in less than 1 h and measuring small-molecule target engagement to endogenous proteins.
- a non-limiting embodiment provided in this example is for human bromodomain-containing protein 4 (BRD4).
- the detection mix consists of a single primary antibody targeting the protein of interest, a luminescent donor-labeled anti-species nanobody, and a fluorescent acceptor ligand.
- the strategy in this example can readily be applied to other targets of interest and will greatly facilitate the cell-based profiling of small molecule inhibitors and PROTACs in high-throughput format with unmodified cell lines.
- the platform is validated by exemplary characterization of celastrol, a p- quinone methide-containing pentacyclic triterpenoid, as a broad cysteine-targeting E3 ubiquitin ligase warhead for potent and efficient targeted protein degradation.
- a set of complementary assay strategies is described in this example based on a common TR-FRET assay platform that greatly facilitates both the characterization of ligand-target engagement, as well as the quantification of endogenous target protein levels directly in cell lysates in high-throughput format.
- This approach is employed, by way of non-limiting example, to identify and characterize celastrol, a tri terpene natural product that reversibly and covalently binds cysteine side chains, as a powerful E3 ligase recruiter for the development of next generation PROTACs.
- TR-FRET assays are also frequently used to determine the affinity of small molecules for respective POIs ( Figure 21).
- This format generally employs an acceptor-labeled small molecule ligand, referred to as a tracer, in combination with a recombinantly expressed protein featuring an epitope tag (e.g. 6xHis, GST or AviTag) that can be TR-FRET donor-functionalized with a corresponding labeled antibody or streptavidin.
- an epitope tag e.g. 6xHis, GST or AviTag
- BRD4 was selected as an exemplary protein of interest for proof-of-concept studies.
- JQ1-FITC JQ1-FITC
- Figure 22B the potent prototype BRD4 inhibitor JQ1, JQ1-FITC was synthesized as a tracer and validated for its applicability with individual recombinant bromodomains BRD4(BD1) and BRD4(BD2).
- Quantifying BRIM levels in response to degrader treatment following val idation of the target engagement assay for recombinant proteins, the system was applied for the detection of endogenous BRD4.
- the tracer is canonically used at or around its K D,app .
- the “titration regime” is desired where the tracer concentration is much greater than the K D,app to maximize occupancy.
- dBET6 a potent BRIM degrader, was chosen as a positive control due to its well- established activity.
- dBET6- induced BRD4 degradation was quantified in MCF7 cells.
- Cells were then lysed in mild lysis buffer (see STAR Methods), followed by the addition of the detection mix (100 nM JQ1-FITC ( ⁇ 11 ⁇ K D,app ), 0.5 nM anti-BRIM IgG and 1 nM CoraFluor-1 -labeled nano-secondary).
- TR-FRET assay The ability of the developed TR-FRET assay was tested to quantify the rescue of dBET6-induced BRD4 degradation by bortezomib (BTZ), MLN7243, MLN4924 (1 ⁇ M), and JQ1 (10 ⁇ M), which constitute 20S proteasome, El ubiquitin-activating enzyme, NEDDS, and competing inhibitors, respectively, in both MCF7 and MDA- MB-231 cells (250 nM dBET6; Figure 27C-D). In both cell lines, BRD4 degradation was attenuated by all compounds, consistent with previous reports.
- BZ bortezomib
- MLN7243 MLN4924
- JQ1 10 ⁇ M
- Assay miniaturization to 96-well plate format PROTAC development and characterization demands the combinatorial analysis of multiple variables including incubation time and compound concentration, which are ideally performed with multiple replicates in parallel to ensure consistency. Accordingly, the number of required data points can quickly grow exponentially. Therefore, rapid, scalable and quantitative assays - especially in unmodified cell lines - are highly desirable.
- the assay platform was therefore miniturized and adapted to a 96-well plate format, which increases both throughput and compatibility with automated liquid handling equipment.
- CS triterpenoid celastrol
- the triterpenoid celastrol (CS) can form reversible covalent adducts with multiple cysteine nucleophiles and has been shown to bind a host of proteins.
- CS also targets Keapl (Kelch-like ECH-associated protein 1), a redox-regulated member of the CRL3 (Cullin-RING E3 ligase) complex that regulates homeostatic abundance of the transcription factor Nrf2 (abbreviation).
- CS binds Keapl BTB and Kelch domains with low micromolar affinity (Table in figure 26).
- a previous report has demonstrated the promise of PROTACs (CDDO-JQ1) derived from bardoxolone methyl (CDDO- Me), a synthetic triterpenoid that binds Keapl with high affinity ( Figure 30).
- This example shows the capacity of CS to function as a recruiting element for E3 ligase activity in a similar manner.
- a PROTAC compound CS-JQ1 (2, Figure 31A) was prepared as described herein. Data shows that CS-conjugation did not impair binding to BRD4 ( Figure 31B and Table in fig. 24). Surprisingly and unexpectedly, however, CS-JQ1 lost, the ability to bind the Keapl Kelch domain, while exhibiting slightly improved affinity for the BTB domain ( Figure 31C and Table in fig. 26). In contrast, functionalization of CDDO results in substantially decreased affinity for BTB. Furthermore, CS-JQ1 was able to induce ternary complex formation between wildtype, full-length Keapl, and isolated BRD4(BD1 ) and BRD4(BD2) domains ( Figure 3 ID).
- TR-FRET does not require addition of a luciferase substrate and enzymatic turnover, which provides long signal stability and superior temporal control over assay readout.
- TR-FRET donor-labeled nano-secondaries Another significant improvement is the adaptation of TR-FRET donor-labeled nano-secondaries, which circumvent the need for conjugation of the TR-FRET donor to individual primary antibodies and should find general acceptance for antibody tagging.
- monovalent nature of nanobodies avoids the formation of higher order immune compl exes common to the use of multivalent secondary detection reagents (e.g.
- MCF7 cells were propagated in RPMI-1640 medium supplemented with 10% FBS, 1% pen-strep, and 1% L-glutamine at 37 °C and 5%CO 2 .
- MDA-MB-231 cells were propagated in DMEM medium supplemented with 10% FBS, and 1% pen-strep at 37 °C and 5% CO 2 .
- MCF7 cell extracts a cell pellet from one 15 cm dish (—25 M cells) of MCF7 cells was allowed to thaw on ice and cells were suspended in 400 ⁇ L lysis buffer (25 mM IIEPES, 150 mM NaCl, 0.2% (v/v) Triton X-100, 0.02% (v/v) TWEEN-20, pH 7.5 supplemented with 2 mM DTT, 250 U Benzonase (Sigma E1014) and 1 mM AEBSF hydrochloride (Combi-Blocks SS-7834)).
- lysis buffer 25 mM IIEPES, 150 mM NaCl, 0.2% (v/v) Triton X-100, 0.02% (v/v) TWEEN-20, pH 7.5 supplemented with 2 mM DTT, 250 U Benzonase (Sigma E1014) and 1 mM AEBSF hydrochloride (Combi-Blocks SS-7834)).
- Roche cOmplete, Mini, EDTA-free protease inhibitor cocktail (Sigma 11836170001) can be used in place of, or in combination with, AEBSF hydrochloride.
- Cells were homogenized via passage through a 27.5-gauge needle 5 times, and the resulting mixture was incubated with slow, end-over-end mixing at 4°C for 30 min.
- the lysate was clarified via centrifugation at 16,100 ⁇ g for 20 min at 4°C then 800 ⁇ L (1:3 dilution) dilution buffer (25 mM HEPES, 150 mM NaCl, 0.005% (v/v) TWEEN-20, pH 7.5) was added and the lysate was re-clarified at 16,100 x g for 20 min at 4 °C.
- Total protein was quantified via detergent-compatible Bradford assay (ThermoFisher 23246) The lysate was used fresh or flash-frozen in liquid nitrogen and stored at -80 °C in single-use aliquots.
- TR-FRET measurements unless otherwise noted, experiments were performed in white, 384-well microtiter plates (Coming 3572) in 30 ⁇ L assay volume. TR-FRET measurements were acquired on a Tecan SPARK plate reader with SPARKCONTROL software version V2.1 (Tecan Group Ltd.), with the following settings: 340/50 nm excitation, 490/10 nm (Tb) and 520/10 nm (FITC) emission, 100 ps delay, 400 ⁇ s integration. The 490/10 and 520/10 emission channels were acquired with a 50% mirror and a dichroic 510 mirror, respectively, using independently optimized detector gain settings unless specified otherwise . The TR-FRET ratio was taken as the 520/490 nm intensity ratio on a per-well basis.
- Nano-secondary alpaca anti-rabbit IgG (ChromoTek shurbGNHS-1), GST V H H (ChromoTek st-250), anti-6xHis IgG (Abeam 18184), and anti-GST IgG (Abeam 19256) were labeled with CoraFluor-1 -Pfp as previously described.
- recombinant BRD4(BD1) and BRD4(BD2) were purchased from BPS Biosciences, Inc and Epicypher, Inc (GST-BRD4(BD1), 31040; GST-BRD4(BD2), 15-0013, respectively).
- Nonspecific signal was determined with 50 ⁇ M JQ1-Acid, and data were fitted to a One Site - Specific Binding model in Prism 9.
- MCF7 cell l ysate as prepared above was diluted to 0.8 mg/mL total protein in 1:3 lysis bufferdilution buffer with 0.5 nM rabbit anti-BRD4 antibody (Cell Signaling Technology; E2A7X) and 1 nM CoraFluor-1 -labeled anti-rabbit nano secondary.
- Nonspecific signal was determined with 50 ⁇ M JQ1-Acid, and data were fitted to a One Site - Specific Binding model in Prism 9.
- TR-FRET ligand displacement assays the following assay parameters have been used: (i) 4 nM GST-BRD4(BD1), 4 nM CoraFluor-1 -labeled anti-GST V H H, 20 nM JQ1-FITC in assay buffer, (ii) 4 nM GST-BRD4(BD2), 4 nM CoraFluor-1- labeled anti-GST V H H, 20 nM JQ1-FITC in assay buffer, (iii) MCF7 cell lysate at 0.8 mg/mL total protein, 0.5 nM rabbit anti-BRD4 antibody, 1 nM CoraFluor-1 -labeled anti-rabbit nano secondary, 20 nM JQ1-FITC.
- the assay floor (background) was defined with the 10 ⁇ M JQ1 dose, and the assay ceiling (top) was defined via a no-inhibitor control.
- TR-FRET ligand displacement assays with 6xHis-GST-Keapl construct were performed as previously described. Data were background corrected, normalized and fitted to a four-parameter dose response model using Prism 9.
- IC 50 is the measured IC 50 value
- [S] is the concentration of fluorescent tracer
- Kx is the K D,app of the fluorescent tracer for a given condition (Cheng and Prusoff, 1973).
- Keapl (tag-free; 11981- HNCB; Sino Biological) was diluted to 40 nM in assay buffer (supplemented with 1 mM DTT) containing 40 nM FITC-Ahx-LDEETGEFL-CONH 2 tracer, 20 nM CoraFluor-1 -labeled anti-GST antibody, and either 40 nM GST-BRD4(BD1) or GST- BRD4(BD2).
- Cells were incubated for 5 h at 37 °C and 5% CO 2 then media was replaced with pre-warmed cell culture medium (1 mL/well) and residual test compound was washed out for 1 h at 37 °C and 5% CO 2 . After, media was aspirated and cells were washed with PBS (2 mL/well), followed by the addition of ice-cold lysis buffer (200 ⁇ L/well).
- the plate was shaken at 200 rpm on an orbital shaker (IKA KS 260 basic) for 10 min, then lysate was transferred to 1.5 mL Eppendorf tubes and further incubated with slow, end-over-end mixing for 10 min at 4°C.
- the lysate was clarified via centrifugation at 16,100 x g for 10 min at 4°C then total protein concentration was measured using a detergent-compatible Bradford assay (ThermoFisher 23246).
- Lysate was transferred to a 384-well plate (30 ⁇ L x 3 TR- FRET replicates) then 5 ⁇ L of 7x detection mix (0.5 nM rabbit anti-BRD4 antibody, 1 nM CoraFluor-1 -labeled anti-rabbit nano-secondary, 100 nM JQ1-FITC final concentrations, prepared in dilution buffer) was added to each well and allowed to equilibrate for 1 h before TR-FRET measurements were taken. TR-FRET ratios were background-subtracted from wells containing lysis buffer, 0.5 mg/mL BSA, and detection mix, then normalized to total protein concentration. The average TR-FRET intensity was normalized to DMSO for each biological replicate before being analyzed in Prism 9.
- a D300 digital dispenser was used to dispense rescue compounds (see respective figure panels for concentrations) normalized to 0.2% DMSO and were pre-incubated for 30 min at 37°C and 5% CO 2 before degraders (250 nM) were added.
- Cell treatment, lysate preparation and TR-FRET analysis was performed as described above.
- the plate was centrifuged at 2,000 x g for 1 min then lysate was transferred to a 384-well plate (30 ⁇ L x 2 TR-FRET replicates) using an adjustable electronic multichannel pipette (Matrix Equalizer, ThermoFisher 2231) and TR-FRET measurements were taken.
- 5 ⁇ L/well of CellTiter-Glo 2.0 reagent (Promega G9241) was added to the wells of the 384-well plate and allowed to equilibrate for 10 minutes before luminescence intensity was recorded on a Tecan SPARK plate reader (luminescence module, no attenuation, 250 ms integration time, output Counts/s).
- TR-FRET ratios were background-subtracted from wells containing lysis buffer, 0.5 mg/mL BSA, and detection mix. The average TR-FRET intensity was normalized to DMSO for each biological replicate, then data were fitted to a four- parameter dose response model using Prism 9.
- Immunoblotting proteins in lysates (10 ⁇ g ) were analyzed by electrophoresis on 3-8% SDS-polyacrylamide gels (ThermoFisher) and subsequently transferred to a nitrocellulose membrane (Bio-Rad). All antibodies were purchased from Cell Signaling Technology. Ponceau staining and ⁇ -actin probing (8H10D10, 1: 1,000) were used to verify equal protein loading on the blot.
- the membrane was blocked using 5% nonfat milk powder in TBS-T (Tris-buffered saline; 0.1% TWEEN-20) at room temperature for 1 h and then incubated with an anti-rabbit IgG BRD4 antibody (E2A7X, 1:750) in 2.5% nonfat milk overnight at 4°C. The membrane was then incubated with an anti-rabbit IgG HRP-linked antibody (1:5,000 in 2.5% nonfat milk; 7074S). The proteins were detected using SuperSignalTM West Femto Maximum Sensitivity Substrate (ThermoFisher).
- Reagents and ligands were purchased from Chem-Impex International, Millipore-Sigma, TCI America, Beantown Chemical, Combi-Blocks, MedChemExpress, Ontario Chemicals, and BOC Sciences and used as received.
- FITC-Ahx-LDEETGEFL-CONH 2 (FITC-KL9) peptide tracer was custom synthesized by Genscript (Piscataway, New Jersey).
- CDDO-FITC fluorescent tracer was prepared as previously described. Column purifications were performed on a Biotage Isolera 4 Purification System equipped with a 200- 400 nm diode array detector. For normal phase flash purifications, Sorbtech Purity Flash Cartridges were used (CFC-52300-012-18 and CFC-52500-025-12). For reverse phase flash purifications, Biotage Sfar Bio C18 Duo 300 A, 20 pm cartridges were used (FSBD-0411-001).
- the reaction mixture was diluted into EtOAc (50 mL) and the organic layer was washed 2 x equal volume 0.2 N HCl, 2 x H 2 O, 1 x saturated brine solution. The organic layer was then dried over Na 2 SO 4 , filtered, and concentrated.
- biological replicates have been defined as independent cell treatments, performed at different times with biologically distinct samples.
- TR-FRET technical replicates refer to the number of replicates performed during the analysis of a given biological sample.
- technical replicates refer to the number of parallel replicates used to calculate mean ⁇ SD for a given data point within an experiment. No statistical methods were used to predetermine sample size and investigators were not blinded to outcome assessment.
- Photophysical characterization UV-VIS absorption, fluorescence emission and quantum yield measurements were performed on a Horiba DualFL spectrophotometer (Horiba Instruments, Kyoto, Japan) using 1 cm pathlength quartz cuvettes.
- five separate dilutions of the respective terbium complexes in 50 mM HEPES, pH 7.4 were prepared within the optically dilute limit (OD 340 ranging from -0.25 to 0.04).
- samples were excited using a mounted 365 nm LED (M365LP1 , Thorlabs Inc., Newton, NJ) that was coupled to a cuvette holder (CVH100, Thorlabs Inc.) via an adjustable collimation adapter (ACP2520-A, Thorlabs Inc.).
- the mounted LED was powered by a pulse modulated LED driver (DC2100, Thorlabs Inc.).
- Antibody and nanobody labeling a 100 ⁇ L aliquot of respective IgG antibody (anti-6xHis; 18184, Abeam; RT0266, BioXCell) or nanobody (ChromoTek anti-Halo V H H OT-250; HaloTrap) at a concentration of ⁇ 1 mg/mL was buffer exchanged into reaction buffer (100 mM sodium carbonate buffer, pH 8.5 + 0.05% (v/v) TWEEN-20) using a 0.5 mL, 7K MWCO ZebaTM Spin Desalting Column (ThermoFisher 89882) according to the manufacturer’s protocol.
- reaction buffer 100 mM sodium carbonate buffer, pH 8.5 + 0.05% (v/v) TWEEN-20
- the corrected A 280 value (A 280, corr ) of antibody/nanobody conjugate was determined via Nanodrop (ND- 1000; ThermoFisher; 0.1 cm path length) by measuring A 280 and A 340 , using Equation 4: where cf is the correction factor for the terbium complex contribution to A 280 and is equal to 0.157.
- concentration of antibody/nanobody conjugate, c ab/vhh (M) was determined using Equation 5: where ⁇ ab is the antibody extinction coefficient at A 280 , equal to 210,000 M-
- ⁇ vhh is the nanobody extinction coefficient (HaloTrap) at A 280 , equal to 23,045 M -1 cm -1
- b is path length in cm (0.1 cm).
- concentration of terbium complex, era (M) covalently bound was determined using Equation 6: where ⁇ Tb is the complex extinction coefficient at A 340 , equal to 22,000 M -1 cm-
- the antibody /nanobody conjugates were diluted with 50% glycerol. Aliquots were snap-frozen in liquid nitrogen and stored at -80°C.
- HaloTrap nanobody was also labeled with AF488-Tfp ester (ThermoFisher A37570) using the same methodology, using a correction factor (A 280 /A 495 ) of 0.11 and an extinction coefficient of 71,000 (A 495 ) for AF488.
- Keapl tracer characterization saturation binding curves to determine K d,app values for FITC-KL9 and CDDO-FITC against epitope-tagged Keapl (His/GST; 11981-H20B; Sino Biological Inc.) were performed with 1 nM Keapl (His/GST) and 0.5 nM Tb-Anti-6xHis (Abeam, 18184) in Keapl assay buffer (25 mM HEPES, 150 mM NaCl, 1 mM DTT, 0.5 mg/mL BSA, 0.005% (v/v) TWEEN-20, pH 7.4). Dose- titration of tracers was performed using a D300 digital dispenser.
- Titration ranges of 0-31 nM (1:2, 13-point) and 0-125 nM (1:2, 15-point) were used for FITC-KL9 and CDDO-FITC, and nonspecific signal was determined with 25 ⁇ M Ac-KL9 or CDDO, respectively.
- K d,app values were determined using 1 nM Keapl (His/GST) and 0.5 nM AF488-Anti-6xHis in Keapl assay buffer with a dose-titration range of 0-31 nM Cora-1-KL9 (1:2, 13-point).
- Nonspecific signal was determined with 25 ⁇ M Ac-KL9.
- Dose-titration ranges were 0 to 31 nM (1: 1.5 titration, 13-point, total peptide concentration) and 0 to 500 nM (1: 1 .5 titration, 15-point) for FITC-KL9/Cora-1-KL9 mix and CDDO-FITC, and nonspecific signal was determined with 25 ⁇ M Ac-KL9 or CDDO, respectively.
- TR-FRET measurements were acquired on a Tecan SPARK plate reader: 340/50 nm excitation, 490/10 nm (Tb) and 520/10 nm (FITC) emission, 100 ⁇ s delay, 400 ⁇ s integration.
- the TR-FRET ratio was taken as the 520/490 nm intensity ratio.
- 490 nm emission was normalized to the dispensed concentration of terbium before the TR-FRET ratio was calculated.
- Data were fitted to a One Site - Specific Binding model using Prism 8 for all experiments except the FITC-KL9/Cora-1-KL9 mixture, in which case a four-parameter nonlinear regression fit model was used.
- Keapl homodimer interaction K d, dimer : FITC- and Cora-1-KL9 were diluted to 300 nM each (600 nM total tracer concentration) into Keapl assay buffer in white 384-well plates (Corning 3572, 25 ⁇ L assay volume, quadruplicate measurements). Keapl (tag-free; 11981- HCNB; Sino Biological Inc.) was added in serial dilution from 0 to 500 nM (1: 1.4 titration, 7-point) using a D300 digital dispenser and allowed to equilibrate for 2 h at room temperature.
- TR-FRET measurements were acquired on a Tecan SPARK plate reader: 340/50 nm excitation, 490/10 nm (Tb) and 520/10 nm (FITC) emission, 100 ⁇ s delay, 400 ⁇ s integration.
- the TR-FRET ratio was taken as the 520/490 nm intensity ratio.
- Data were background subtracted, normalized to the concentration of dispensed protein, and log-transformed. The value of K d,dimer was solved via linear regression extrapolation using Prism 8.
- Keap 1 His/GST; 11981-H20B; Sino Biological Inc.
- Keap 1 was diluted to 1 nM into Keapl assay buffer with 0.5 nM Tb-Anti-6xHis (Abeam, 18184) and either 10 nM FITC-KL9 (6.3x K d,app ) or 30 nM CDDO-FITC (4.5x K d,app ) in white 384-well plates (Coming 3572, 30 ⁇ L assay volume, triplicate measurements).
- Keapl (tag-free) and FITC/Cora-1- KL9 assay system (homo-dimerization of Keapl; Assay-1): Keapl (tag-free; 11981- HCNB; Sino Biological Inc.) was diluted to 5 nM into Keapl assay buffer containing 3.5 nM Cora-1-KL9 and 3.5 nM FITC-KL9 (pre-mixed solution of peptide tracers) in white 384-well plates (Coming 3572, 30 ⁇ L assay volume, triplicate measurements).
- TR-FRET measurements were acquired on a Tecan SPARK plate reader: 340/50 nm excitation, 490/10 nm (Tb) and 520/10 nm (FITC) emission, 100 ⁇ s delay, 400 ⁇ s integration. The TR-FRET ratio was taken as the 520/490 nm intensity ratio.
- the assay floor was defined with the 10 ⁇ M KI-696 dose, and the assay ceiling (top) was defined via a no-inhibitor control. Data were background corrected, normalized and fitted to a four-parameter dose response model using Prism 8.
- TR.-FRET measurements were acquired on a Tecan SPARK plate reader: 340/50 nm excitation, 490/10 nm (Tb) and 520/10 nm (FITC) emission, 100 ⁇ s delay, 400 ⁇ s integration. The TR-FRET ratio was taken as the 520/490 nm intensity ratio.
- the assay floor (background) was defined with the 10 ⁇ M CDDO dose, and the assay ceiling (top) was defined via a no- inhibitor control. Data were background corrected, normalized and fitted to a four- parameter dose response model using Prism 8.
- Plasmid propagation and production plasmids were transformed into chemically competent DH5 ⁇ (Fisher FEREC0111) according to manufacturer’s protocol.
- a single transformed colony from a Luria-Bertani (LB)- Ampicillin agar plate was used to inoculate 10 mL of LB Broth (MilliporeSigma 71-753-5) containing Ampicillin (0.1 mg/mL) and the culture was incubated at 37 °C overnight at 225 rpm.
- 1 mL of starter cul ture was used to inoculate 250 mL LB Broth containing Ampicillin (0.1 mg/mL), which was incubated at 37 °C with shaking at 225 rpm for 16 h.
- Cells were harvested by centrifugation at 3,000 x g for 20 minutes at 4°C and washed once with Dulbecco’s PBS (DPBS). Cell pellets were snap-frozen in liquid nitrogen and stored at -80°C until plasmid isolation performed.
- DPBS Dulbecco
- HEK293T cells (ATCC) were propagated in DMEM medium supplemented with 10% FBS, and 1% pen-strep at 37°C and 5% CO 2 .
- PEI-MAX (Polysciences 24765-1) was dissolved in water to a concentration of 1 mg/mL. The pH of the solution was neutralized to pH 7 with NaOH, then sterile filtered (0.22 ⁇ m), aliquoted, and stored at -20°C until further use.
- HDACl-HaloTag HDACl-HT
- plasmid pFC14A-HDACl-HaloTag was custom cloned by Genscript (Piscataway, New Jersey).
- Genscript Progenscript (Piscataway, New Jersey).
- HEK293T cells were seeded into 15 cm dishes (-8-10 million cells) to reach -70-80% confluency one day prior to transfection.
- stock solutions of plasmid DNA pFC14A-HDACl-HaloTag; 16 ⁇ g /mL
- PEI-MAX 48 ⁇ g /mL
- the solutions were thoroughly mixed, then the DNA solution was added slowly to the PEI solution and the resulting transfection cocktail (1 : 10 volume of culture media) was incubated for 20 min at room temperature.
- the transfection cocktail was added dropwise to the cells (final concentrations: 0.8 ⁇ g /mL DNA, 2.4 ⁇ g /mL PEI-MAX) and cells were grown for 48 h at 37°C and 5% CO 2 (fresh media provided to cells 24 h post-transfection). Cells were harvested viatrypsinization, washed twice with PBS, and cell pellets snap- frozen in liquid nitrogen and stored at -80°C until further use.
- Cells were homogenized via passage through a 27.5-gauge needle 5 times, and the resulting mixture was incubated with slow, end-over-end mixing at 4°C for 30 min.
- the lysate was clarified via centrifugation at 16,100 x g for 20 min at 4°C then 800 ⁇ L (1 :3 dilution) lx TBS (50 mM Tris, 150 mM NaCl, pH 7.5) was added and the lysate was re-clarified at 16,100 x g for 20 min at 4°C.
- the resulting diluted, clarified lysate was incubated with 10 ⁇ M Cora-1-Halo for 16 h at 4°C with slow, end-over-end mixing.
- the labeled lysate was then gel filtrated through a PD-10 desalting column (GE) with exchange buffer (lx TBS + 1 mM DTT + 0.005% (v/v) TWEEN-20, pH 7.5) to remove excess Cora-1-Halo.
- PD-10 fractions were tested for protein concentration (Bradford assay, ThermoFisher 23246) and terbium fluorescence (Tecan SPARK plate reader; 340/50 nm excitation, 548/10 nm emission, 100 ⁇ s delay, 400 ⁇ s integration). Fractions containing both significant protein and terbium fluorescence were pooled, and total protein concentration was determined via Bradford assay.
- HaloTag labeling is stoichiometric (1:1 Cora-1-Halo:HDACl-HT)
- concentration of the Cora-1-Halo labeled HDACl-HT protein in the pooled, gel- filtrated lysate can be determined via a calibration curve of Cora-1-Halo (0-230 nM, 10 nM increments, 23-step; see fig 43).
Abstract
Description


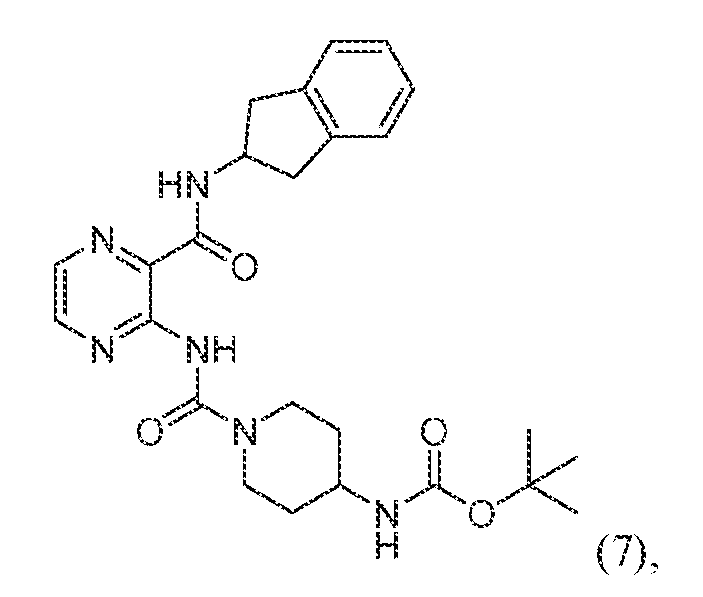


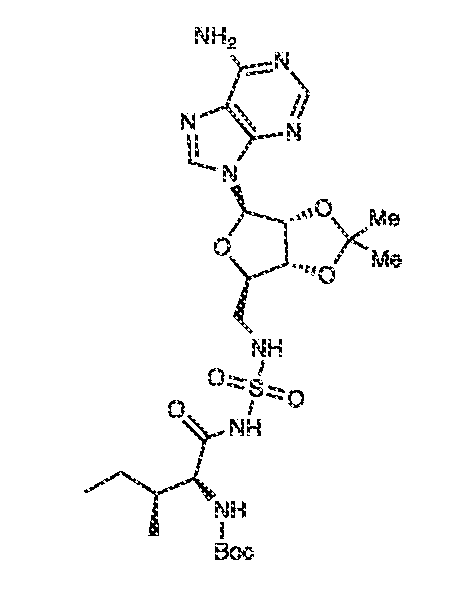


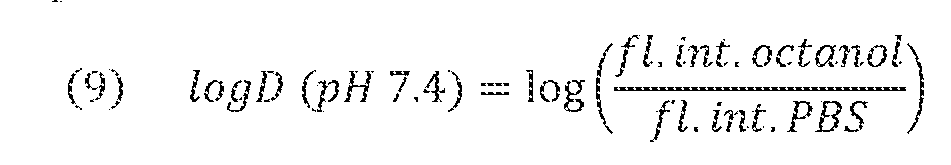


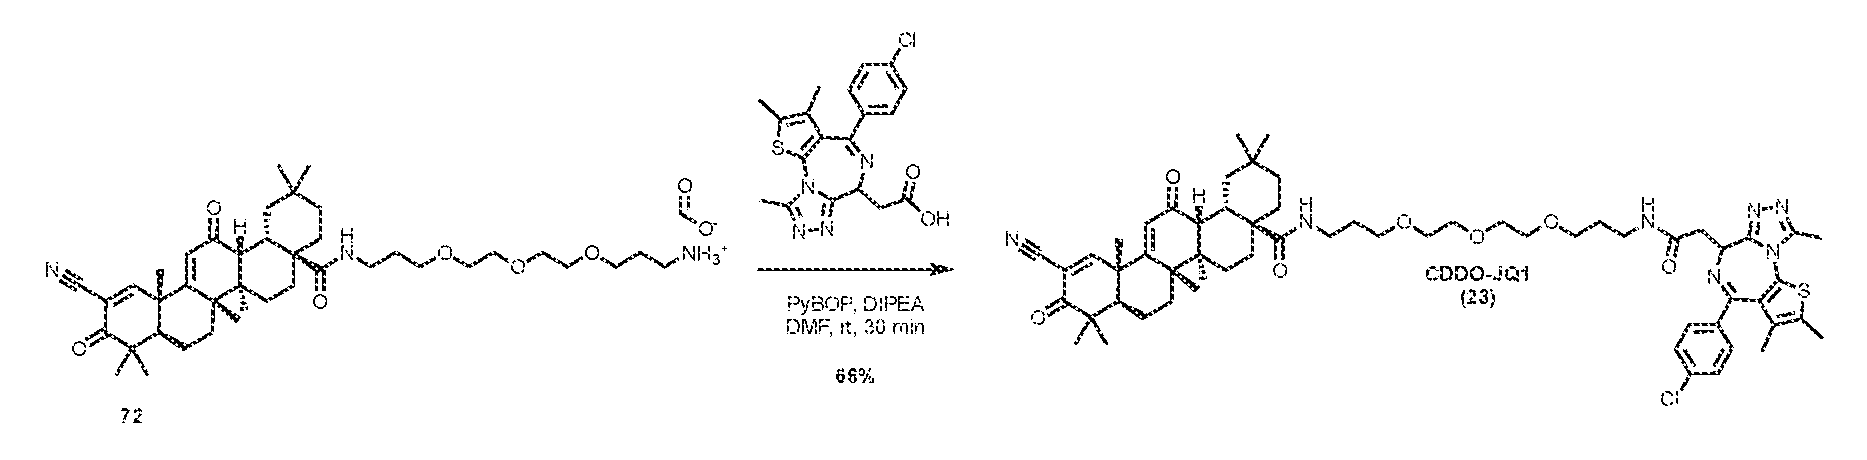


Claims


Applications Claiming Priority (12)
| Application Number | Priority Date | Filing Date | Title |
|---|---|---|---|
| US202163224433P | 2021-07-22 | 2021-07-22 | |
| US63/224,433 | 2021-07-22 | ||
| US202163277643P | 2021-11-10 | 2021-11-10 | |
| US63/277,643 | 2021-11-10 | ||
| US202263333080P | 2022-04-20 | 2022-04-20 | |
| US63/333,080 | 2022-04-20 | ||
| US202263353348P | 2022-06-17 | 2022-06-17 | |
| US202263353526P | 2022-06-17 | 2022-06-17 | |
| US63/353,526 | 2022-06-17 | ||
| US63/353,348 | 2022-06-17 | ||
| US202263391655P | 2022-07-22 | 2022-07-22 | |
| US63/391,655 | 2022-07-22 |
Publications (2)
| Publication Number | Publication Date |
|---|---|
| WO2023004438A2 true WO2023004438A2 (en) | 2023-01-26 |
| WO2023004438A3 WO2023004438A3 (en) | 2023-03-09 |
Family
ID=84978777
Family Applications (1)
| Application Number | Title | Priority Date | Filing Date |
|---|---|---|---|
| PCT/US2022/074087 WO2023004438A2 (en) | 2021-07-22 | 2022-07-22 | Fret-based assays |
Country Status (1)
| Country | Link |
|---|---|
| WO (1) | WO2023004438A2 (en) |
Cited By (1)
| Publication number | Priority date | Publication date | Assignee | Title |
|---|---|---|---|---|
| CN116593356A (en) * | 2023-06-05 | 2023-08-15 | 南京工业大学 | Method for detecting viscosity of micro-solution by stirring magnetic nano brush |
Family Cites Families (3)
| Publication number | Priority date | Publication date | Assignee | Title |
|---|---|---|---|---|
| GB0915986D0 (en) * | 2009-09-14 | 2009-10-28 | Sec Dep For Environment Food A | Detection method |
| EP3474835B1 (en) * | 2016-06-23 | 2023-07-05 | University of Maryland, Baltimore | Non-catalytic substrate-selective p38 -specific mapk inhibitors with endothelial-stabilizing and anti-inflammatory activity, and methods of use thereof |
| WO2019237125A1 (en) * | 2018-06-08 | 2019-12-12 | The General Hospital Corporation | Inhibitors of prolyl-trna-synthetase |
-
2022
- 2022-07-22 WO PCT/US2022/074087 patent/WO2023004438A2/en active Application Filing
Cited By (2)
| Publication number | Priority date | Publication date | Assignee | Title |
|---|---|---|---|---|
| CN116593356A (en) * | 2023-06-05 | 2023-08-15 | 南京工业大学 | Method for detecting viscosity of micro-solution by stirring magnetic nano brush |
| CN116593356B (en) * | 2023-06-05 | 2023-11-17 | 南京工业大学 | Method for detecting viscosity of micro-solution by stirring magnetic nano brush |
Also Published As
| Publication number | Publication date |
|---|---|
| WO2023004438A3 (en) | 2023-03-09 |
Similar Documents
| Publication | Publication Date | Title |
|---|---|---|
| Vasta et al. | Quantitative, wide-spectrum kinase profiling in live cells for assessing the effect of cellular ATP on target engagement | |
| AU2019202669B2 (en) | Selective grp94 inhibitors and uses thereof | |
| US11505560B2 (en) | Heterobifunctional compounds with improved specificity | |
| US8987233B2 (en) | Bruton's tyrosine kinase activity probe and method of using | |
| JP2023052201A (en) | Methods and Reagents for Analyzing Protein-Protein Interfaces | |
| US9382230B2 (en) | Methods and compositions for modulating Ire1, SRC and ABL activity | |
| KR20210098960A (en) | HELIOS small molecule degrading agent and method of use | |
| US9108930B2 (en) | N1- and N2-carbamoyl-1,2,3-triazole serine hydrolase inhibitors and methods | |
| JP2023134482A (en) | Methods and reagents for analyzing protein-protein interfaces | |
| AU2021372427A1 (en) | Compounds for targeted protein degradation of kinases | |
| CA3172987A1 (en) | Small molecule inhibitors of oncogenic chd1l with preclinical activity against colorectal cancer | |
| WO2023004438A2 (en) | Fret-based assays | |
| US11896589B2 (en) | Diazinyl amino acridines and medical uses thereof | |
| ES2936864T3 (en) | Pyrimidinosulfamide derivative and method of preparation and medical application thereof | |
| J van Adrichem et al. | Discovery of MINC1, a GTPase-activating protein small molecule inhibitor, targeting MgcRacGAP | |
| JP2023550557A (en) | improved small molecules | |
| AU2017203184A1 (en) | Carbonic anhydrase inhibitors | |
| Zheng | Development of Lysine-Targeted Probes for Protein Kinases | |
| Kaneshige | Development of a First-In-Class STAT5 PROTAC Degrader | |
| Swartzel | Development of Diverse Bifunctional Molecules for Interrogating DcpS, HER3, Brachyury, and Phosphorylation-Driven Diseases Towards Therapeutic Applications | |
| US20210300939A1 (en) | Single Molecule Compounds Providing Multi-Target Inhibition of BTK and Other Proteins and Methods of Use Thereof | |
| Li et al. | Discovery of LHF418 as a New Potent SOS1 PROTAC degrader | |
| 박한검 | Development of Methodologies for Target Protein Identification and Their Application | |
| WO2022148821A1 (en) | Usp7 binding survival-targeting chimeric (surtac) molecules & uses thereof | |
| Wood | Chemical Synthesis and Use of In Silico Methods for the Rational Design of Small Molecule Anti-Cancer Therapeutic Candidates |
Legal Events
| Date | Code | Title | Description |
|---|---|---|---|
| 121 | Ep: the epo has been informed by wipo that ep was designated in this application |
Ref document number: 22846873 Country of ref document: EP Kind code of ref document: A2 |
|
| WWE | Wipo information: entry into national phase |
Ref document number: 2022846873 Country of ref document: EP |
|
| NENP | Non-entry into the national phase |
Ref country code: DE |
|
| ENP | Entry into the national phase |
Ref document number: 2022846873 Country of ref document: EP Effective date: 20240222 |
|
| 121 | Ep: the epo has been informed by wipo that ep was designated in this application |
Ref document number: 22846873 Country of ref document: EP Kind code of ref document: A2 |