WO2022254584A1 - 情報処理装置、情報処理方法およびプログラム - Google Patents
情報処理装置、情報処理方法およびプログラム Download PDFInfo
- Publication number
- WO2022254584A1 WO2022254584A1 PCT/JP2021/020885 JP2021020885W WO2022254584A1 WO 2022254584 A1 WO2022254584 A1 WO 2022254584A1 JP 2021020885 W JP2021020885 W JP 2021020885W WO 2022254584 A1 WO2022254584 A1 WO 2022254584A1
- Authority
- WO
- WIPO (PCT)
- Prior art keywords
- graph
- line
- probability map
- extraction unit
- component
- Prior art date
- Legal status (The legal status is an assumption and is not a legal conclusion. Google has not performed a legal analysis and makes no representation as to the accuracy of the status listed.)
- Ceased
Links
Images


Classifications
-
- G—PHYSICS
- G06—COMPUTING OR CALCULATING; COUNTING
- G06V—IMAGE OR VIDEO RECOGNITION OR UNDERSTANDING
- G06V30/00—Character recognition; Recognising digital ink; Document-oriented image-based pattern recognition
- G06V30/40—Document-oriented image-based pattern recognition
- G06V30/41—Analysis of document content
- G06V30/414—Extracting the geometrical structure, e.g. layout tree; Block segmentation, e.g. bounding boxes for graphics or text
-
- G—PHYSICS
- G06—COMPUTING OR CALCULATING; COUNTING
- G06V—IMAGE OR VIDEO RECOGNITION OR UNDERSTANDING
- G06V30/00—Character recognition; Recognising digital ink; Document-oriented image-based pattern recognition
- G06V30/40—Document-oriented image-based pattern recognition
- G06V30/42—Document-oriented image-based pattern recognition based on the type of document
- G06V30/422—Technical drawings; Geographical maps
-
- G—PHYSICS
- G06—COMPUTING OR CALCULATING; COUNTING
- G06V—IMAGE OR VIDEO RECOGNITION OR UNDERSTANDING
- G06V10/00—Arrangements for image or video recognition or understanding
- G06V10/70—Arrangements for image or video recognition or understanding using pattern recognition or machine learning
- G06V10/82—Arrangements for image or video recognition or understanding using pattern recognition or machine learning using neural networks
-
- G—PHYSICS
- G06—COMPUTING OR CALCULATING; COUNTING
- G06V—IMAGE OR VIDEO RECOGNITION OR UNDERSTANDING
- G06V10/00—Arrangements for image or video recognition or understanding
- G06V10/70—Arrangements for image or video recognition or understanding using pattern recognition or machine learning
- G06V10/84—Arrangements for image or video recognition or understanding using pattern recognition or machine learning using probabilistic graphical models from image or video features, e.g. Markov models or Bayesian networks
-
- G—PHYSICS
- G06—COMPUTING OR CALCULATING; COUNTING
- G06V—IMAGE OR VIDEO RECOGNITION OR UNDERSTANDING
- G06V30/00—Character recognition; Recognising digital ink; Document-oriented image-based pattern recognition
- G06V30/40—Document-oriented image-based pattern recognition
- G06V30/42—Document-oriented image-based pattern recognition based on the type of document
Definitions
- the present invention relates to an information processing device, an information processing method and a program, and more particularly to a technique for analyzing graph images.
- U.S. Pat. No. 6,200,303 analyzes a line graph representation of collected patient data to identify individual pixels and to generate a plurality of pixel representation data elements that identify the relative position of each pixel with respect to a reference point of the desired data.
- a system for processing image display data generated in a format and stored in a file is disclosed.
- Patent document 2 reads a non-digital vibration waveform recorded on paper or the like with a scanner, reads the amplitude data for each set pitch for the graph image that is read, and converts it to digital data that can be used by a shaking table.
- a data digitizing device is disclosed.
- Non-Patent Document 1 discloses a technique for analyzing line graphs by extracting figures from PDF files of research papers, separating the line graphs from the extracted figures, and detecting the axes and legends of the line graphs.
- the present invention has been made to solve the above problems, and an object of the present invention is to provide an information processing apparatus, an information processing method, and a program capable of analyzing images of a wider variety of graphs with higher accuracy and versatility. to provide.
- one aspect of an information processing apparatus includes a graph image acquisition unit that acquires a graph image, and classifies the graph image acquired by the graph image acquisition unit for each graph type.
- a graph classification unit that classifies the graph image acquired by the graph image acquisition unit for each graph type.
- a probability map generation unit that generates different types of probability maps for each graph type from the graph image using a single neural network; and the probability map generated by the probability map generation unit.
- a component extracting unit for extracting a component in the graph image, a value extracting unit for extracting the value of the component of the graph image extracted by the component extracting unit, and a value extracted by the value extracting unit based on an output for outputting the value of the component.
- the single neural network used by the probability map generator may have different output channels for each graph type.
- the single neural network used by the probability map generator may comprise different types of output channels for separating different components for each graph type.
- the component extraction unit may extract the components in the graph image and trace the graph.
- the output unit may add the value of the component extracted by the value extraction unit to the graph traced by the component extraction unit and output the graph.
- the component extractor may simultaneously trace the plurality of components in the graph image.
- the component extraction unit calculates a first cost between adjacent X-coordinate positions of graph images of the line graphs using a first probability map for the line graphs, and calculates the The line graph may be traced to minimize the sum of the first costs.
- the component extraction unit may use linear programming to calculate the first cost of the line graph to be traced.
- the component extraction unit holds a shielding flag indicating whether or not the line graph to be traced at each X coordinate position is shielded by another line graph, and uses the shielding flag to extract the line graph to be traced. may calculate the first cost of .
- the shielding flag may be provided for each of the plurality of line graphs, and hold the state of each of the plurality of line graphs at each X-coordinate position.
- the component extraction unit detects the start point and the end point of the line graph by adding the existence probabilities of the line graph in the Y coordinate axis direction at each X coordinate position using the first type of probability map,
- the line graph may be traced from the detected start point to the end point.
- the component extractor may trace the graph by connecting adjacent pixels using a second type of probability map for graphs other than line graphs.
- the component extraction unit may connect the adjacent pixels of the graph image of the graph using CCA (Connected Component Analysis).
- the component extractor may correct the extracted component by referring to the second type probability map.
- the component extraction unit calculates a second cost of each pixel of a graph image of the line graph using a first probability map for the line graph, and calculates a second cost on the pixel with the minimum second cost.
- the line graph may be traced.
- the component extraction unit may calculate the second cost of the pixel of the graph image of the line graph using dynamic programming.
- the component extraction unit calculates the second cost based on a function that evaluates at least one of line smoothness of the line graph and consistency of line color or line type of the line graph. good.
- the probability map generation unit generates a probability map for extracting scales of graph axes, and the value extraction unit extracts the scales of the graph image based on the probability map for extracting scales of graph axes. Component values may be extracted.
- One aspect of an information processing method is an information processing method executed by an information processing apparatus, comprising: acquiring a graph image; classifying the acquired graph image by graph type; generating different types of probability maps for each graph type from a graph image using a single neural network; and extracting components in the graph image based on the generated probability maps. , extracting values of the components of the extracted graph image; and outputting the values of the extracted components.
- One aspect of an information processing program is an information processing program for causing a computer to execute information processing, wherein the program causes the computer to acquire a graph image; A graph classification process for classifying the graph image acquired by the acquisition process by graph type, and a probability map for generating a different type of probability map for each graph type from the graph image using a single neural network. a generation process; a component extraction process for extracting a component in the graph image based on the probability map generated by the probability map generation process; and a value of the component of the graph image extracted by the component extraction process. and an output process for outputting the value of the component extracted by the value extraction process.
- FIG. 1 is a block diagram showing an example of the functional configuration of a graph image analysis device according to each embodiment of the present invention.
- FIG. 2 is a conceptual diagram explaining an overview of graph image analysis processing executed by the graph image analysis apparatus according to each embodiment.
- FIG. 3 is a flowchart showing an example of the procedure of graph image analysis processing executed by the graph image analysis device according to each embodiment.
- FIG. 4 is a diagram showing an example of an output channel of a neural network output for a bar graph by the probability map generator of the graph image analysis device.
- FIG. 5 is a diagram showing an example of output channels of a neural network that the probability map generation unit of the graph image analysis device outputs for a pie chart.
- FIG. 1 is a block diagram showing an example of the functional configuration of a graph image analysis device according to each embodiment of the present invention.
- FIG. 2 is a conceptual diagram explaining an overview of graph image analysis processing executed by the graph image analysis apparatus according to each embodiment.
- FIG. 3 is a flowchart showing an example of the procedure
- FIG. 6 is a diagram showing an example of an output channel of a neural network that is output for a line graph by the probability map generation unit of the graph image analysis device.
- FIG. 7 is a flowchart showing a modification of the procedure of graph image analysis processing executed by the graph image analysis apparatus according to each embodiment.
- FIG. 8 is a flowchart showing an example of the detailed processing procedure of the component extraction process of S4 in FIG. 3 executed by the component extraction unit of the graph image analysis device for the bar graph and the pie chart.
- FIG. 9 is a diagram illustrating an example in which the component extraction unit of the graph image analysis device extracts the bar graph component from the bar graph image using the bar graph probability map.
- FIG. 10 is a flowchart showing an example of a detailed processing procedure of component extraction processing in S4 of FIG. FIG.
- FIG. 11 is a diagram for explaining the line tracing algorithm executed by the component extraction unit of the graph image analysis device for the line graph, taking a single line as an example.
- FIG. 12 is a diagram for explaining the line tracing algorithm executed by the component extraction unit of the graph image analysis device for a line graph, taking a plurality of lines as an example.
- FIG. 13 is a diagram illustrating an example of a line graph traced from a line graph image by the component extraction unit of the graph image analysis device using the probability map of the line graph.
- FIG. 14 is a diagram illustrating an example of extracting graph values from a line graph image by the value extraction unit of the graph image analysis device.
- FIG. 15 is a flowchart showing an example of a detailed processing procedure of component extraction processing in S4 of FIG.
- FIG. 16 is a block diagram showing an example of the hardware configuration of the graph image analysis device according to each embodiment of the present invention.
- the graph image analysis apparatus classifies an input graph image by graph type, generates a different probability map for each graph type, and automatically analyzes the graph image using the generated probability map. do.
- the graph image analysis device classifies the input graph image into graph types of bar graph, pie chart, and line graph, generates a probability map for each graph type, and uses the generated probability map , an example of analyzing each type of graph image will be described.
- the graphical image analyzer may classify and analyze any other graphical image, such as flowcharts, radar charts, scatter plots, Venn diagrams, and the like.
- a graph image refers to an image including a graph (diagram or chart, hereinafter collectively referred to as "graph") in all or part of the image.
- the graphical image may be input to the graphical image analysis device in any format.
- FIG. 1 is a block diagram showing an example of the functional configuration of a graph image analysis device 1 according to this embodiment.
- a graph image analysis apparatus 1 shown in FIG. 1 is a block diagram showing an example of the functional configuration of a graph image analysis device 1 according to this embodiment.
- the data acquisition unit 11 acquires input data from the input data set 3 and supplies the acquired input data to the graph classification unit 12 .
- Input data acquired by the data acquisition unit 11 may include a graph image.
- the input data set 3 consists of a non-volatile storage device and may be provided locally to the graph image analysis device 1 or remotely connected.
- the graph image may have any image file format such as, for example, bitmap, GIF (Graphics Interchange Format), JPEG (Joint Photographic Experts Group), TIFF (Tag Image File Format).
- the image may have any file format such as PDF (Portable Document Format) or HTML (Hyper Text Markup Language) constituting a web page.
- the data acquisition unit 11 may receive input data from the counterpart device via the communication I/F.
- the data acquisition unit 11 may also receive input of various parameters necessary for executing the graph image analysis process in the graph image analysis apparatus 1 .
- the graph classification unit 12 extracts a graph image to be analyzed at a later stage from the input data supplied from the data acquisition unit 11, classifies the extracted graph image into one of a plurality of graph types, and classifies the classified graph image.
- the graph image is supplied to the probability map generation unit 13 .
- the graph classification unit 12 may extract, for example, bar graphs, pie charts, and line graphs from the input data as graph images to be analyzed.
- the graph classification unit 12 may use a classification network such as a neural network to extract graph images from input data and classify the extracted graph images.
- the probability map generation unit 13 generates a probability map of the graph image for each classified graph type with respect to the classified graph images supplied from the graph classification unit 12, and sends the generated probability map to the component extraction unit. 14.
- the probability map generation unit 13 may also receive the graph image before being classified by the graph classification unit 12 as an input and generate a probability map of the graph image for each graph type.
- the probability map (Probability Map) generated by the probability map generation unit 13 estimates the probability that the components constituting the graph of the classified type appear for each pixel of the graph image, and the estimated It is a map composed of probability distributions.
- the probability map generation unit 13 may generate a probability map from the classified graph images, for example, using a probability map generation network such as a neural network.
- the probability map generation network used by the probability map generation unit 13 may be a single segmentation network (segmentation model) that outputs probability maps of multiple types of graphs, or may be provided for each of multiple types of graphs. It may be a plurality of segmentation networks (segmentation models).
- the probability map generation unit 13 may also generate different types of probability maps for each classified graph type (described later with reference to FIG. 2), and generate a plurality of different types of probability maps for each classified graph type. may be generated (described below with reference to FIGS. 4-6).
- the component extraction unit 14 uses the probability map supplied from the probability map generation unit 13 to extract components (hereinafter simply referred to as “components”) that form the graph from the graph image. Specifically, the component extraction unit 14 uses the probability map supplied from the probability map generation unit 13 corresponding to the type of the graph image classified by the graph classification unit 13 for the graph image classified by the graph classification unit 13, Separate each of the multiple components that make up the graph from the graph image.
- the component extraction unit 14 may separate main components from among the plurality of components forming the graph from the graph image. Multiple types of probability maps may be generated corresponding to each of the multiple major components to be separated. The component extraction unit 14 traces the graph for each of the plurality of components separated from the graph image, and supplies the separated component and its graph to the value extraction unit 15 .
- the value extraction unit 15 extracts the corresponding graph value for each component of the graph image supplied from the component extraction unit 14 . Specifically, the value extracting unit 15 extracts the label of the axis of the graph image and the label assigned to each component, and based on the text of the extracted label and the geometric arrangement, assigns the value to each component of the graph image. Generate the corresponding graph values. The value extractor 15 may also generate graph values corresponding to each component of the graph image based on the probability map of the tick-marks of the graph axes.
- the graph itself included in the graph image is a visualization of predetermined input data, but the original input data on which the graph is drawn cannot be accessed directly from the visualized graph image.
- the value extraction unit 15 recovers the original input data on which the graph drawing is based by generating graph values corresponding to each component of the graph image.
- the value extraction unit 15 may continuously generate graph values corresponding to continuous pixels of each component of the graph image, or may generate graph values discretely at predetermined pixel intervals. good.
- the value extraction unit 15 adds or associates the generated graph values with the respective components of the graph image, and supplies them to the output unit 16 .
- the output unit 16 synthesizes each component of the graph image extracted by the component extraction unit 14 into a graph and outputs it as digital data to the output data set 4 .
- the graph output to the output data set 4 may be output to the outside in a push or pull fashion via the user interface of the graph image analysis device 1 or another device. Values of the graph extracted by the value extraction unit 15 are added to each component of the graph synthesized by the output unit 16 . Therefore, the graph image analysis device 1 or other devices can read the synthesized graph data from the output data set 4, arbitrarily process it, and output it as a post-processing of the graph image analysis processing.
- the output unit 16 or the post-processing may change the graph type classified by the graph classification unit 12 to a graph type different from that classified by the graph classification unit 12 and output the graph. You can also change the line type, etc., and output the graph.
- the output unit 16 may output the values of the graph generated by the value extraction unit 15 independently without adding them to each component of the graph image.
- the output unit 16 may format the values of these graphs into an arbitrary format such as a tabular format and output them.
- the graph image analysis device 1 is communicably connected to a client device composed of a PC (Personal Computer) or the like, and the client device is used when the graph image analysis device 1 executes input/output of information with the outside.
- a user interface may be provided, and a part or all of each component 11 to 16 of the graph image analysis apparatus 1 may be provided.
- FIG. 2 is a conceptual diagram for explaining an overview of graph image analysis processing executed by the graph image analysis apparatus 1 according to this embodiment.
- the graph image analysis device 1 extracts a graph image to be analyzed from input data, and classifies the extracted graph image into one of a plurality of graph types.
- input data 21 is input to a classification network 22 configured by a neural network or the like.
- 23 is output.
- the classification result 23 output by the classification network 22 includes graph images of a line graph (Line), a pie graph (Pie), a horizontal bar graph (H-Bar), and a vertical bar graph (V-Bar).
- the classification network 22 is learned in advance using various graph image data and graph type labels as learning data.
- Each of these classified graph images may be input to the network 24 for subsequent probability map generation.
- the classification network 22 also outputs graph images of types other than the graph image to be analyzed (for example, map graphs) and photographs as classification results. No input to network 24 for map generation.
- the graph image analysis apparatus 1 generates different types of probability maps for each classified graph type, uses the generated probability maps to separate components of the graph image from the graph image, and separates the components of the graph image.
- the graph is traced by the components of the graph image drawn, and the graph values corresponding to the traced graph components are extracted.
- the classification result 23, that is, the data of the classified graph image is input to a probability map generation network 24 composed of a neural network or the like.
- Probability maps 25a to 25d are output for each graph type.
- the probability maps output by the probability map generating network 24 include a line graph probability map 25a, a pie graph probability map 25b, a horizontal bar graph probability map 25c, and a vertical bar graph probability map 25d. Details of the configuration of the probability map will be described later with reference to FIGS. 4 to 6.
- the probability map generating network 24 generates graph image data to which the classified graph type is added, and labels according to the graph type such as color, borderline, segmentation, legend, graph axis scale, and line type. It is learned in advance as learning data.
- the classification network 22 and the probability map generation network 24 may be neural networks such as CNN (Convolutional Neural Network), or may use other machine learning models such as SVM (Support Vector Machine). good.
- the graph image analysis apparatus 1 may concurrently use the classification network 22 and the probability map generation network 24 to classify the graph image and generate the probability map. That is, the graph image analysis apparatus 1 inputs the graph image extracted from the input data 21 to the classification network 22 and classifies it into one of a plurality of graph types. 21 may be input to the probability map generation network 24 to output probability maps 25a to 25d for each graph type.
- probability map generation network 24 comprises a single unified segmentation network ( segmentation model).
- the graph image analysis apparatus 1 receives the graph image classified by the classification network 22 as an input, and executes the probability map generation processing using the single probability map generation network 24 as the subsequent stage of the graph classification processing. good too.
- the computational load is reduced while the probability map generation network 24, which is a segmentation model, is made more efficient. can be learned.
- the probability map generation network 24 which is a segmentation model
- the probability map generation network 24 and the classification network 22 it is possible to analyze the graph image at a higher speed.
- a line graph probability map 25a separates the components of each line graph.
- a probability map 25b of the pie chart separates the components of each pie slice of the pie chart.
- different types of probability maps 25a to 25d are used for each of these graph types to separate and extract each component from the graph image.
- each line graph component 26a is extracted and traced.
- the pie slice probability map 25b is used to extract and trace the component 26b of each pie slice.
- the components 26c, 26d of each bar segment are extracted and traced using the horizontal bar graph probability map 25c and the vertical bar graph probability map 25d, respectively.
- a graph value is extracted for each of the components 26a to 26d extracted from the graph image. Specifically, the coordinate axis label of each graph image of the line graph, pie graph, horizontal bar graph, and vertical bar graph, the label of each component, the title, the legend, etc. are displayed in the rectangular areas in the graph images 27a to 27d. The text is detected and character recognized as shown. A graph value is generated based on the result of this character recognition and the geometric arrangement of each component extracted on the graph image. The values of the generated graph are added to each component of the traced graph to output digitized graph data 28 .
- FIG. 3 is a flowchart showing an example of the procedure of graph image analysis processing executed by the graph image analysis apparatus 1 according to this embodiment.
- the graph image analysis device 1 uses a single probability map generation network to perform the classification of the graph image by the graph classification unit 12 and the generation of the probability map by the probability map generation unit 13 in parallel. execute Each step in FIG. 3 is realized by the CPU reading and executing a program stored in a storage device such as an HDD of the graph image analysis apparatus 1 . Also, at least part of the flowchart shown in FIG. 3 may be realized by hardware.
- a dedicated circuit When implemented by hardware, for example, by using a predetermined compiler, a dedicated circuit may be automatically generated on an FPGA (Field Programmable Gate Array) from a program for implementing each step. Also, a Gate Array circuit may be formed in the same manner as the FPGA and implemented as hardware. Also, it may be realized by an ASIC (Application Specific Integrated Circuit).
- FPGA Field Programmable Gate Array
- ASIC Application Specific Integrated Circuit
- the data acquisition unit 11 of the graph image analysis device 1 acquires input data including a graph image from the input data set 3 .
- the graph classification unit 12 of the graph image analysis device 1 uses the classification network 22 to extract a graph image to be analyzed from the input data, and classifies the extracted graph image into a plurality of graphs to be analyzed. Classify into one of the types.
- the probability map generation unit 13 of the graph image analysis device 1 uses the single network 24 for probability map generation to extract from the graph image extracted from the input data input in S1 A probability map for extracting each component is generated for each graph type.
- the single network 24 for probability map generation used by the probability map generation unit 13 in S3 has, as described above, a plurality of output channels respectively corresponding to the components of a plurality of types of graphs, and for all types of graphs.
- a single unified segmentation network (segmentation model) that produces a probability map.
- the probability map generation network 24 may be formed as a learning model that has already been trained with different learning data for each graph type to be analyzed, but the probability map generation network 24 is designed for only the output channel of the network, the graph type Each network may have a different structure, and networks other than the output channel may have a common structure. This improves the versatility of the network 24 for probability map generation.
- the term "probability map generation network” includes both such a single network and a network for each graph type.
- FIG. 4 shows an example of the output channels of network 24 for probability map generation, which generates a probability map that extracts each component from a graph image of a column graph.
- the probability map generation network 24 outputs channels of colors (primary colors) for coloring the bar segments shown in FIG. 4(b), Each has a segmentation output channel that separates each bar segment shown in FIG. 4(c) and a borderline output channel that defines the boundaries of each bar segment shown in FIG. 4(d).
- the probability map generating network 24 may further comprise a legend output channel shown in FIG. 4(e) and a graph axis scale output channel shown in FIG. 4(f), respectively.
- the probability map generation unit 13 generates a plurality of types of probability maps respectively corresponding to FIGS. 4(b) to 4(f).
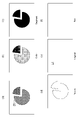
- FIG. 5 shows an example of the output channels of network 24 for probability map generation, which generates a probability map that extracts each component from a graph image of a pie chart.
- the probability map generation network 24 outputs channels of colors (primary colors) for coloring the pie slices shown in FIG. 5(b), Each has a segmentation output channel that partitions each pie slice shown in FIG. 5(c) and a borderline output channel that bounds each pie slice shown in FIG. 5(d).
- the probability map generating network 24 may further comprise a legend output channel shown in FIG. 5(e) and a graph axis scale output channel shown in FIG. 5(f), respectively.
- the probability map generation unit 13 generates a plurality of types of probability maps respectively corresponding to FIGS. 5(b) to 5(f). Since graph axes are not usually given to pie charts, the probability map of graph axis scales extracted from the graph image of the pie chart may have all zero values as shown in FIG. 5(f).
- FIG. 6 shows an example of the output channels of the probability map generation network 24, which generates a probability map that extracts each component from a graph image of a line graph.
- the network 24 for generating the probability map generates output channels of the solid line graph shown in FIG. 6(c), the dashed line graph output channel shown in FIG. 6(d), and the dashed line graph output channel shown in FIG. 6(e).
- the probability map generation network 24 may further comprise a legend output channel shown in FIG. 6(f) and a graph axis scale output channel shown in FIG. 6(g), respectively.
- the probability map generation unit 13 generates a plurality of types of probability maps respectively corresponding to FIGS. 6(b) to 6(g).
- the probability map generation network 24 is configured with a single segmentation model that supports all graph types of bar graphs, pie charts, and line graphs
- the probability map generation network 24 is configured for each RGB color, segmentation (foreground) , a borderline, four linetypes, a legend, and graph axis ticks.
- the configuration of the output channels (probability maps) of the network 24 for generating probability maps shown in FIGS. 4 to 6 is an example, and the present embodiment is not limited to this.
- the output channels (probability maps) shown in FIGS. 4(e), 5(e), and 6(f) for extracting the legend from the graph image mask the region of the legend so that May be used to define the area in which the graph is drawn, but is not necessarily generated.
- the output channels (probability maps) shown in FIGS. 4(f), 4(f), and 6(g) for extracting the graph axis ticks from the graph image are values may be used to more accurately extract the , but not necessarily generated.
- the probability map generation unit 13 may generate a plurality of different types of probability maps according to the graph type so as to facilitate tracing of the components of the graph.
- the component extraction unit 14 of the graph image analysis device 1 estimates each component of the graph from the graph image using the probability map generated corresponding to each graph type in S3, and the estimated Trace graph components.
- the component extraction unit 14 may estimate each component of the graph from the graph image using different techniques for each graph type. Details of the component extraction processing of these graphs will be described later with reference to FIGS.
- probability maps provided for each graph type are used.
- a probability map provided for each graph type it is possible to obtain the probability of appearance of each component for each pixel on the graph image, facilitating estimation of the area of each component. So, for example, if the graph image contains artifacts, noise or gradients, if the graph components cross or overlap or are separated from other components, if they are highly compressed and have low resolution, if the graph component boundaries are Even if it is not clear, each component of the graph can be estimated with high accuracy from the graph image.
- the value extraction unit 15 of the graph image analysis device 1 extracts the graph values corresponding to the respective components of the graph estimated in S4.
- the value extracting unit 15 extracts the graph image of the pie graph based on the area of the pie slice segment (component) acquired in S4 and the character recognition result of the text labeled on the axis and the component of the graph.
- the value extractor 15 also geometrically identifies the relationship between the pixel coordinates of the components of the bar graphs and line graphs and the character recognition results of the text labeled on the axes and components of the graph. Extract the value of each component of the graph by making a decision based on the positional arrangement.
- the value extraction unit 15 first reads the entire graph image by OCR (Optical Character Recognition), detects text, and converts the text box of the detected text to either the vertical axis or the horizontal axis. group to. Text boxes may also be grouped into legends or titles. The value extractor 15 then determines the scales of the vertical and horizontal coordinate axes for the bar graphs and line graphs from the positions of the text boxes containing numbers as text.
- OCR Optical Character Recognition
- the value extracting unit 15 further uses the probability map of the graph axis scales of the bar graph or line graph to identify the value corresponding to each scale of the graph axis, and generates the value of each component based on the identified value. good. If the values corresponding to each tick mark of the graph axis are not available, for example, the barycentric coordinates of the bounding box containing the numerical values may be used as the values corresponding to the tick marks of the graph axis. By applying the scale of the determined coordinate axis, the value extraction unit 15 converts the coordinates of each component of the graph into values of the graph.
- the value extraction unit 15 converts the pixel coordinates of all points on each line component of the line graph into graph values.
- the value extractor 15 also converts the apex Y coordinate (ordinate) and the right end X coordinate (abscissa) of each bar segment component of the bar graph into graph values.
- the value extraction unit 15 generates graph values based on the area ratio or the central angle of the components of each pie slice of the pie chart.
- the output unit 16 of the graph image analysis apparatus 1 adds the graph values and coordinate axis scale information extracted by the value extraction unit 15 to the traced graph components extracted by the component extraction unit 14. and output to the output data set 4 as digital data of the graph.
- FIG. 7 is a flow chart showing a modification of the procedure of the graph image analysis process executed by the graph image analysis apparatus 1 according to this embodiment.
- the graph image analysis device 1 inputs graph images classified by the graph classification unit 12 to the probability map generation unit 13 .
- the processing of S1 and S2 in FIG. 7 is the same as the processing of S1 and S2 shown in FIG.
- the probability map generation unit 13 of the graph image analysis device 1 uses the probability map generation network 24 to generate a probability map for extracting each component from the classified graph image for each graph type.
- the network 24 for probability map generation may be formed as a learning model that has been trained with different learning data for each graph type to be analyzed.
- a network may have a common structure. That is, in S3a, since the probability map generation unit 13 generates a probability map from the classified graph images, a different network (segmentation model) may be used for each graph type, or a single network (segmentation model) may be used. may be used.
- the processing of S4 to S6 in FIG. 7 is the same as the processing of S4 to S6 shown in FIG.
- FIG. 8 is a flowchart showing an example of a detailed processing procedure of the component extraction (graph tracing) process of S4 in FIGS. 3 and 7 executed by the component extraction unit 14 of the graph image analysis apparatus 1 for bar graphs and pie charts.
- the component extraction unit 14 masks the legend area in the graph image.
- the component extraction unit 14 detects a legend region from the graph image using the legend probability map generated in S3 of FIG. May be masked on the probability map. As a result, in the graph image, it is possible to distinguish between the area where the graph components exist and the legend area.
- the component extraction unit 14 demarcates the borderline of each component of the graph image. Specifically, the component extraction unit 14 uses the borderline probability map generated in S3 of FIG. 3 to demarcate the borderline and remove the borer line from the graph image segmentation probability map. In S403, the component extraction unit 14 applies CCA (Connected Component Analysis) to connect adjacent pixels in the graph image in order to extract the components of the bar graph and the pie graph. CCA can connect pixels and extract components by grouping adjacent pixels with similar colors in the RGB color space.
- CCA Connected Component Analysis
- the component extraction unit 14 uses the segmentation probability map and the color probability map from which the borderline has been removed in S402, and extracts the connected components connected by applying CCA in S403 as components of the graph of the graph image. Extract and trace graph components. Further, the component extraction unit 14 may discard, among the connected components configured by connecting pixels, components that deviate from the shapes of the components estimated from the segmentation probability map for each graph type. For example, in a bar chart, connected components that are not rectangular shaped may be discarded, and in a pie chart, connected components that are not pie slice shaped may be discarded.
- the component extraction unit 14 corrects the components extracted in S404 as necessary.
- adjacent pixels are connected if they have similar colors to each other. In some cases, pixels that should be connected may not be connected.
- FIG. 9 is a diagram illustrating an example in which the component extraction unit 14 of the graph image analysis device 1 extracts a bar graph component from a bar graph image using a bar graph probability map.
- a horizontal bar chart displays years on the Y-coordinate axis and oil production on the X-coordinate axis, with each year's oil production comprising one bar segment and one bar segment is further broken down into sub-segments of regions A-F and other regions.
- each sub-segment of the six bar segments is extracted as a component, as can be understood from the fact that it is surrounded by a thick frame. .
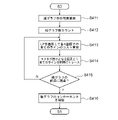
- FIG. 10 is a flowchart showing an example of a detailed processing procedure of the component extraction (graph tracing) process of S4 in FIG.
- the component extraction unit 14 of the graph image analysis device 1 calculates the existence range of the line graph.
- the component extraction unit 14 detects the start point and end point of the line graph by acquiring the X-coordinate range in which the line graph exists.
- the component extraction unit 14 averages the probability maps of the plurality of line types generated in S3 of FIG. 3 (four types of line types in FIGS. 6B to 6E) for each pixel position. It is assumed that a line probability map is calculated in advance.
- the component extraction unit 14 calculates the existence probability of the stacked (added) lines on each X coordinate axis by calculating the sum of the existence probabilities along the Y coordinate axis direction.
- the component extraction unit 14 binarizes the existence probability of the stacked lines using the threshold ⁇ th .
- the existence range of the line graph is obtained as the minimum and maximum values on the X coordinate axis of the cluster of the line existence distribution.
- the component extraction unit 14 counts the number of line graphs. Specifically, the component extraction unit 14 binarizes the line probability map using the threshold pth , and scans the binarized line probability map along the Y coordinate axis at each X coordinate position. counts the number of pixel clusters on the X coordinate axis. Thus, the number of line graphs is obtained using the number of pixel clusters on the X coordinate axis.
- the component extraction unit 14 applies linear programming (LP) to calculate the cost of all lines at each X coordinate.
- the component extraction unit 14 simultaneously traces all the lines onto the pixel that minimizes the total cost of all the lines in S413.
- the present embodiment uses linear programming (LP) to trace line graphs.
- Linear programming (LP) is an algorithm for finding a value that maximizes or minimizes an objective function expressed by a linear expression under constraints expressed by a linear inequality or linear expression.
- the present embodiment regards each of a plurality of lines in a line graph as a path in a directed graph and applies linear programming to minimize the flow cost of the directed graph. to trace.
- the component extraction unit 14 samples pixels with high line probabilities as nodes and connects adjacent nodes in the X-axis direction to trace the graph.
- linear programming is applied to determine the assignment from pixels to any of the lines.
- a line graph contains multiple lines, and each of the multiple lines is traced individually, if there is a section where multiple lines overlap, a line will be occluded by the other lines, resulting in an occluded line. Lines may not be traced accurately.
- linear programming is applied to trace multiple lines (which may be multiple lines of multiple line types) for each X coordinate at once.
- an occlusion flag indicating whether or not each of a plurality of lines is occluded by another line is held for each sample point of the trace, and this occlusion flag is referred to. to trace multiple lines at the same time.
- the component extraction unit 14 uses the existence range (X coordinate range) of the line graph calculated in S411 and the number of count line graphs in S412, the component extraction unit 14 extracts the detected line graph from the start point to the end point along the X axis. , the line graph is traced by linear programming (LP). Specifically, the component extraction unit 14 extracts a line connecting two points in the binarized line probability map (segmentation map) using the binarization variable b (b ⁇ 0, 1 ⁇ ). to estimate
- the component extractor 14 scans the pixels vertically along the Y-coordinate axis, starting from the leftmost X-coordinate xi , and for each X-coordinate xi , points up to twice the number n line of the line graph. to sample.
- the component extraction unit 14 minimizes a linear programming (LP) function consisting of a cost function c and a binarized variable b, shown in Equation 1 below.
- LP linear programming
- i is the index of the sample point in the X coordinate.
- l is the line index.
- the variables z and z ' respectively indicate whether the first sample point (x i ,y) or the second sample point (x i+1 ,y ' ) is occluded.
- the binarized variable b(x i , y, y ′ , l, z, z ′ ) respectively indicates whether the first sample point and the second sample point are on the same l-th line. show.
- FIG. 11 is a diagram for explaining the line tracing algorithm executed by the component extraction unit 14 of the graph image analysis apparatus 1 for the line graph, taking a single line as an example.
- the line to be traced is a single line and no occlusion by other lines occurs.
- FIG. 12 is a diagram for explaining the line tracing algorithm executed by the component extraction unit 14 of the graph image analysis apparatus 1 for a line graph, taking a plurality of lines as an example.
- FIG. 12 when tracing two partially occluded lines, there are four possible patterns at each sample point on each line. That is, at each sample point, line 1 and line 2 are foregrounded or occluded, respectively.
- the component extraction unit 14 has an occluded flag that holds the state of foreground or occluded for line 1 and line 2 at each sample point.
- line 2 (dashed line) is partially obscured by line 1 (solid line) between sample points X i+1 and X i+2 .
- the shielding flag in the section where the line 2 is shielded turns on the foreground slot for the line 1 and turns on the shielding slot for the line 2 .
- the component extraction unit 14 uses linear programming (LP) to store and refer to the state of whether each line is in the foreground or occluded at each sample point based on the shielding flag of each line, as shown in FIG. traces two lines at the same time. Note that the component extraction unit 14 recursively traces a plurality of lines using linear programming (LP) shown in Equation 1.
- FIG. 12 shows only the final flow after solving the linear programming (LP).
- the LP cost function c shown in Equation 1 is defined by Equation 2 below.
- C col is a cost term that indicates the consistency in color of traced lines.
- C sty is a cost term that indicates consistency in line style.
- C fg is a cost term that indicates the probability that a line is foreground, and C sm is the smoothness of the line to connect adjacent pixels of the traced line smoothly without excessively steep slopes. is the cost term shown.
- the cost function c in Equation 2 also has a bias weight ⁇ occ term based on the occlusion flag (z,z′). The cost function c shown in Equation 2 allows multiple lines to be fitted simultaneously by having terms for the foreground and occlusion of the lines.
- Equation 2 is calculated as in Equations 3 to 6 below.
- the LP function shown in Equation 1 may be minimized with the following constraints. ⁇ The number of lines input to each sample point is equal to the number of lines output. • The number of lines entering each non-occluded sample point for each line is at most one. • The value of b during optimization is in the range [0,1]. • The number of lines to output at the leftmost x index is the number of lines n line .
- the component extraction unit 14 uses linear programming to consider the probability map of the line graph and the attributes of the line graph such as the consistency of the line type and color of the line graph and the smoothness of the line. Using the evaluation function described above, the line graph can be traced with high accuracy and less computational load without relying on the legend information in the graph image.
- a plurality of lines can be traced simultaneously by linear programming using an occlusion flag that is provided for each sample point as many as the number of lines and indicates either the foreground or occlusion state.
- the component extraction unit 14 can detect consistency of the line type and color of the line graph between the start point and the end point of the detected line graph without using the dynamic programming method using the evaluation function or the probability map.
- Line graphs included in the graph image may be traced based on line graph attributes such as line smoothness and line smoothness.
- the component extraction unit 14 determines whether or not the traced line graph has reached the end point detected in S411. While the traced line graph does not reach the end point (S415:N), the process returns to S413, and the component extraction unit 14 repeats the processes of S413 and S414. On the other hand, when the traced line graph reaches the end point (S415: Y), the process proceeds to S416. In S416, the component extraction unit 14 extracts each traced line graph as a component of the line graph, and proceeds to S5.
- FIG. 13 is a diagram for explaining an example of a line graph traced from a line graph image by the component extraction unit 14 of the graph image analysis device 1 using a line graph probability map.
- the line graph of Legend A is traced by a solid line
- the line graph of Legend B is traced by a dashed line
- the line graph of Legend C is traced by a dashed line.
- Each legend A-C contains two line graphs that intersect each other: the thick line graph plots the values for each year and has a steep waveform, and the thin line graph shows the multi-year moving average and has a smooth waveform. It has a waveform.
- the line smoothness cost function C sm is used to determine in which direction the line is traced from the intersection. Therefore, even if the colors and line types are the same, the thin line graph that intersects with the thick line graph can be distinguished from the thick line graph and accurately traced.
- FIG. 14 is a diagram illustrating an example of extracting (generating) graph values from a line graph image by the value extracting unit 15 of the graph image analysis apparatus 1.
- FIG. 14 text boxes detected by scanning the graph image are indicated by rectangular areas. Since the value extraction unit 15 scans the entire graph image, in FIG. 14, in addition to the labels of the X coordinate axis and the Y coordinate axis, labels given to the line graph in the drawing area of the line graph are detected as text boxes. .
- the value extracting unit 15 recognizes the text in the detected text box, and when numerical values are recognized, calculates the scale of the graph from the recognized numerical values, and calculates the graph value corresponding to each label. to generate
- the graph image analysis apparatus classifies graph images by graph type, calculates probability maps of different graph images for each graph type, and based on the calculated probability maps, to extract a plurality of components in the graph image and trace the graph of the extracted plurality of components.
- the graph image analysis device further extracts the values of the components of the extracted graph image, adds the values of the extracted components to the traced graph, and outputs the traced graph.
- a different probability map is calculated for each graph type, and each component of the graph can be separated from the graph image in a versatile and effective manner using the calculated probability map. Therefore, it becomes possible to analyze a wider variety of graph images at a higher speed and with a higher degree of accuracy, and the availability of many graph images scattered on the web or the like is improved.
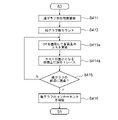
- FIG. 15 is a flowchart showing an example of a detailed processing procedure of the component extraction (graph tracing) process of S4 in FIG.
- the processes of S411 and S412 of FIG. 15 are the same as the processes of S411 and S412 of the first embodiment shown in FIG.
- the component extraction unit 14 applies dynamic programming (DP) to calculate the cost of adjacent pixels.
- DP dynamic programming
- the component extraction unit 14 traces a line on the pixel with the lowest cost at S413.
- the component extraction unit 14 sequentially and individually traces each of the line graphs of the plurality of line types.
- Dynamic programming is an algorithm that divides a target problem into a plurality of subproblems and solves them while recording the calculation results of the subproblems.
- dynamic programming is applied to calculate the cost of each pixel within the existence range of the line graph. By reusing intermediate calculation results, repetition of calculation can be avoided and calculation efficiency can be improved.
- the component extraction unit 14 uses the table W to hold the total cost of points (pixels) on the traced line.
- x prev is the previous pixel on the x coordinate of x (last point traced immediately before).
- X prev is a pixel group of x-coordinates up to the immediately preceding pixel i ⁇ 1, and is expressed by Equation 11 below.
- the component extractor 14 uses dynamic programming to find the best one that minimizes the value of the cost function in equation 10 from X prev in equation 11. .
- E color is a function of color that maintains consistency in the color of traced lines. Since the dynamic programming holds the information of the traced line to which xprev belongs, the average line color of xprev can be calculated from this line information. E color is calculated by the color difference between the average line color and the pixel color of x.
- the evaluation function E pattern is a line type function that maintains consistency in the line type (line pattern) of traced lines. Similar to the evaluation function E color , the evaluation function E pattern is calculated by the difference between the average line type of xprev and the line type of x.
- the evaluation function E smooth is a line smoothness function for smoothly connecting adjacent pixels of a traced line without excessively steep slopes. The evaluation function E smooth is calculated from the absolute difference between the slope of xprev and the slope of x.
- the evaluation function E prob is a function of existence probability for connecting traced lines along pixels with high existence probability values.
- the evaluation function E prob is calculated from the mean value of the existence probabilities of a plurality of line types.
- the evaluation function E dupl is an overlap function that penalizes multiple lines traced on the same pixel.
- the evaluation function E_dupl returns 1 if x has already been traced by another line, and 0 otherwise. ⁇ 1 to ⁇ 5 are weighting coefficients for each evaluation function.
- the component extraction unit 14 selects the point (pixel) to be traced next at each point on the X coordinate from the start point to the end point of the detected line graph with the minimum cost points (pixels) are determined in order.
- the line type evaluation function E pattern , existence probability evaluation function E prob, etc.
- the line graph probability maps may refer to probability maps for the four line types). For example, points (pixels) that do not fit into any of the four line types can be determined not to be traced.
- FIG. 16 is a diagram showing a non-limiting example of the hardware configuration of the graph image analysis device 1 according to this embodiment.
- the graph image analysis device 1 according to this embodiment can be implemented on any single or multiple computers, mobile devices, or any other processing platforms. With reference to FIG. 16, an example in which the graph image analysis device 1 is implemented in a single computer is shown. may be implemented. A plurality of computers may be interconnectably connected by a wired or wireless network.
- the graph image analysis apparatus 1 may include a CPU 161, a ROM 162, a RAM 163, an HDD 164, an input section 165, a display section 166, a communication I/F 167, and a system bus 168. .
- the graph image analysis device 1 may also comprise an external memory.
- a CPU (Central Processing Unit) 161 comprehensively controls operations in the graph image analysis apparatus 1, and controls each component (162 to 16) via a system bus 168, which is a data transmission line.
- the graph image analysis device 1 may also include a GPU (Graphics Processing Unit).
- the GPU has higher computational power than the CPU 121, and running multiple or multiple GPUs in parallel provides higher processing performance, especially for image processing applications that use machine learning, such as the present embodiment. do.
- a GPU typically includes a processor and shared memory. Each processor obtains data from a high-speed shared memory and executes a common program to perform a large amount of the same kind of computation at high speed.
- a ROM (Read Only Memory) 162 is a non-volatile memory that stores control programs and the like necessary for the CPU 161 to execute processing.
- the program may be stored in a non-volatile memory such as a HDD (Hard Disk Drive) 164 or an SSD (Solid State Drive) or an external memory such as a removable storage medium (not shown).
- a RAM (Random Access Memory) 163 is a volatile memory and functions as a main memory, a work area, and the like for the CPU 161 . That is, the CPU 161 loads necessary programs and the like from the ROM 162 to the RAM 163 when executing processing, and executes the programs and the like to realize various functional operations.
- the HDD 164 stores, for example, various data and various information necessary when the CPU 161 performs processing using a program.
- the HDD 164 also stores various data, various information, and the like obtained by the CPU 161 performing processing using programs and the like, for example.
- the input unit 165 is configured by a pointing device such as a keyboard and mouse.
- the display unit 166 is configured by a monitor such as a liquid crystal display (LCD).
- the display unit 166 provides a GUI (Graphical User Interface) for inputting instructions to the graph image analysis apparatus 1, such as various parameters used in graph image analysis processing and communication parameters used in communication with other devices. You can
- the communication I/F 167 is an interface that controls communication between the graph image analysis apparatus 1 and an external device.
- a communication I/F 167 provides an interface with a network and performs communication with an external device via the network. Via the communication I/F 167, image data, various parameters, etc. are transmitted/received to/from an external device.
- the communication I/F 167 may perform communication via a wired LAN (Local Area Network) conforming to a communication standard such as Ethernet (registered trademark) or a dedicated line.
- the network that can be used in this embodiment is not limited to this, and may be configured as a wireless network.
- This wireless network includes a wireless PAN (Personal Area Network) such as Bluetooth (registered trademark), ZigBee (registered trademark), and UWB (Ultra Wide Band). It also includes a wireless LAN (Local Area Network) such as Wi-Fi (Wireless Fidelity) (registered trademark) and a wireless MAN (Metropolitan Area Network) such as WiMAX (registered trademark). Furthermore, wireless WANs (Wide Area Networks) such as LTE/3G, 4G, and 5G are included. It should be noted that the network connects each device so as to be able to communicate with each other, and the communication standard, scale, and configuration are not limited to those described above.
- At least some of the functions of the elements of the graph image analysis apparatus 1 shown in FIG. 1 can be realized by the CPU 161 executing a program. However, at least some of the functions of the elements of the graph image analysis apparatus 1 shown in FIG. 1 may operate as dedicated hardware. In this case, the dedicated hardware operates under the control of the CPU 161 .
Landscapes
- Engineering & Computer Science (AREA)
- Computer Vision & Pattern Recognition (AREA)
- Theoretical Computer Science (AREA)
- Physics & Mathematics (AREA)
- General Physics & Mathematics (AREA)
- Multimedia (AREA)
- Artificial Intelligence (AREA)
- Evolutionary Computation (AREA)
- Software Systems (AREA)
- Health & Medical Sciences (AREA)
- Medical Informatics (AREA)
- Computing Systems (AREA)
- General Health & Medical Sciences (AREA)
- Databases & Information Systems (AREA)
- Probability & Statistics with Applications (AREA)
- Computer Graphics (AREA)
- Geometry (AREA)
- Image Analysis (AREA)
- Character Discrimination (AREA)
Priority Applications (4)
| Application Number | Priority Date | Filing Date | Title |
|---|---|---|---|
| EP21929421.2A EP4120126A4 (en) | 2021-06-01 | 2021-06-01 | INFORMATION PROCESSING DEVICE, INFORMATION PROCESSING METHOD AND PROGRAM |
| US17/911,228 US12288412B2 (en) | 2021-06-01 | 2021-06-01 | Information processing apparatus and information processing method |
| PCT/JP2021/020885 WO2022254584A1 (ja) | 2021-06-01 | 2021-06-01 | 情報処理装置、情報処理方法およびプログラム |
| JP2022515127A JP7132459B1 (ja) | 2021-06-01 | 2021-06-01 | 情報処理装置、情報処理方法およびプログラム |
Applications Claiming Priority (1)
| Application Number | Priority Date | Filing Date | Title |
|---|---|---|---|
| PCT/JP2021/020885 WO2022254584A1 (ja) | 2021-06-01 | 2021-06-01 | 情報処理装置、情報処理方法およびプログラム |
Publications (1)
| Publication Number | Publication Date |
|---|---|
| WO2022254584A1 true WO2022254584A1 (ja) | 2022-12-08 |
Family
ID=83188030
Family Applications (1)
| Application Number | Title | Priority Date | Filing Date |
|---|---|---|---|
| PCT/JP2021/020885 Ceased WO2022254584A1 (ja) | 2021-06-01 | 2021-06-01 | 情報処理装置、情報処理方法およびプログラム |
Country Status (4)
| Country | Link |
|---|---|
| US (1) | US12288412B2 (https=) |
| EP (1) | EP4120126A4 (https=) |
| JP (1) | JP7132459B1 (https=) |
| WO (1) | WO2022254584A1 (https=) |
Families Citing this family (1)
| Publication number | Priority date | Publication date | Assignee | Title |
|---|---|---|---|---|
| US20250218205A1 (en) * | 2023-12-27 | 2025-07-03 | Highradius Corporation | Machine learning based systems and methods for data extraction from financial statements |
Citations (1)
| Publication number | Priority date | Publication date | Assignee | Title |
|---|---|---|---|---|
| JP2005326940A (ja) * | 2004-05-12 | 2005-11-24 | Fuji Xerox Co Ltd | グラフ作成装置、プログラムおよび記録媒体 |
Family Cites Families (13)
| Publication number | Priority date | Publication date | Assignee | Title |
|---|---|---|---|---|
| JP2002328068A (ja) | 2001-05-02 | 2002-11-15 | Mitsubishi Heavy Ind Ltd | 振動データデジタル化装置 |
| JP2005503851A (ja) | 2001-08-31 | 2005-02-10 | シーメンス メディカル ソルーションズ ヘルス サーヴィシズ コーポレイション | 画像表示データの処理システム |
| US7181054B2 (en) | 2001-08-31 | 2007-02-20 | Siemens Medical Solutions Health Services Corporation | System for processing image representative data |
| US6996268B2 (en) * | 2001-12-28 | 2006-02-07 | International Business Machines Corporation | System and method for gathering, indexing, and supplying publicly available data charts |
| GB2457267B (en) * | 2008-02-07 | 2010-04-07 | Yves Dassas | A method and system of indexing numerical data |
| US10726252B2 (en) * | 2017-05-17 | 2020-07-28 | Tab2Ex Llc | Method of digitizing and extracting meaning from graphic objects |
| US10489126B2 (en) * | 2018-02-12 | 2019-11-26 | Oracle International Corporation | Automated code generation |
| US11557107B2 (en) * | 2019-01-02 | 2023-01-17 | Bank Of America Corporation | Intelligent recognition and extraction of numerical data from non-numerical graphical representations |
| CN110059687B (zh) * | 2019-03-19 | 2024-05-28 | 平安科技(深圳)有限公司 | 图片信息识别方法、装置、计算机设备和存储介质 |
| US20220358379A1 (en) * | 2019-07-04 | 2022-11-10 | Samyak Jain | System, apparatus and method of managing knowledge generated from technical data |
| US11288324B2 (en) * | 2020-01-22 | 2022-03-29 | Adobe Inc. | Chart question answering |
| CN112786019A (zh) * | 2021-01-04 | 2021-05-11 | 中国人民解放军32050部队 | 一种通过图像识别方式实现语音转写系统及方法 |
| US12327394B2 (en) * | 2021-06-01 | 2025-06-10 | Rakuten Group, Inc. | Information processing apparatus and information processing method |
-
2021
- 2021-06-01 WO PCT/JP2021/020885 patent/WO2022254584A1/ja not_active Ceased
- 2021-06-01 EP EP21929421.2A patent/EP4120126A4/en active Pending
- 2021-06-01 JP JP2022515127A patent/JP7132459B1/ja active Active
- 2021-06-01 US US17/911,228 patent/US12288412B2/en active Active
Patent Citations (1)
| Publication number | Priority date | Publication date | Assignee | Title |
|---|---|---|---|---|
| JP2005326940A (ja) * | 2004-05-12 | 2005-11-24 | Fuji Xerox Co Ltd | グラフ作成装置、プログラムおよび記録媒体 |
Non-Patent Citations (2)
| Title |
|---|
| See also references of EP4120126A4 |
| SIEGEL, N.HORVITZ, Z.LEVIN, R.LEVIN, R.DIVVALA, S.FARHADI, A.: "FigureSeer: Parsing Result-Figures in Research Papers", ECCV, 2016, pages 664 - 680, XP047355142, DOI: 10.1007/978-3-319-46478-7_41 |
Also Published As
| Publication number | Publication date |
|---|---|
| JP7132459B1 (ja) | 2022-09-06 |
| US12288412B2 (en) | 2025-04-29 |
| JPWO2022254584A1 (https=) | 2022-12-08 |
| EP4120126A1 (en) | 2023-01-18 |
| US20240221415A1 (en) | 2024-07-04 |
| EP4120126A4 (en) | 2023-03-29 |
Similar Documents
| Publication | Publication Date | Title |
|---|---|---|
| JP5379085B2 (ja) | スキャンされた文書画像内の前景画素群の連結グループをマーキング種類に基づき分類する方法及びシステム | |
| US9367766B2 (en) | Text line detection in images | |
| JP5729930B2 (ja) | 文書内のテキスト行を区分するための方法 | |
| EP2980755B1 (en) | Method for partitioning area, and inspection device | |
| US8995761B2 (en) | Image processing apparatus, image processing method, and computer-readable medium | |
| US20150154442A1 (en) | Handwriting drawing apparatus and method | |
| JP2006524394A (ja) | 画像における人体輪郭描写 | |
| CN111368831B (zh) | 一种竖排文字的定位系统及方法 | |
| JP7132458B1 (ja) | 情報処理装置、情報処理方法およびプログラム | |
| EP4343630A1 (en) | Image processing apparatus, method of generating learning model, and inference method | |
| US12033376B2 (en) | Method and system for training neural network for entity detection | |
| JP7132459B1 (ja) | 情報処理装置、情報処理方法およびプログラム | |
| JP6968241B1 (ja) | 情報処理装置、情報処理方法およびプログラム | |
| JP6546385B2 (ja) | 画像処理装置及びその制御方法、プログラム | |
| CN116596921B (zh) | 一种焚烧炉渣分选方法及系统 | |
| KR20200005853A (ko) | 심층 구조 학습 기반 사람 계수 방법 및 시스템 | |
| CN113743389A (zh) | 一种面部表情识别的方法、装置和电子设备 | |
| JP2021093142A (ja) | 画像処理装置、画像処理装置の制御方法、識別器の生成方法、識別方法、識別装置、識別器の生成装置、及び識別器 | |
| US12340606B2 (en) | Automatic template recommendation | |
| US20260073019A1 (en) | Clustering apparatus, method, and storage medium | |
| Kumar et al. | An optimized domain-specific shrimp detection architecture integrating conditional GAN and weighted ensemble learning | |
| JP4966946B2 (ja) | 時空間画像分離装置、時空間画像分離方法および時空間画像分離プログラム | |
| US20260030266A1 (en) | Systems and Methods for Rendering Large-Scale Data Visualizations | |
| Pelapur | Incremental Machine Learning Based Segmentation with Expert-in-the-Loop Workflow Using FIB-SEM Imagery | |
| KR20240142177A (ko) | 네트워크 모델 성능 분석 장치 및 그 방법 |
Legal Events
| Date | Code | Title | Description |
|---|---|---|---|
| ENP | Entry into the national phase |
Ref document number: 2022515127 Country of ref document: JP Kind code of ref document: A |
|
| WWE | Wipo information: entry into national phase |
Ref document number: 17911228 Country of ref document: US |
|
| ENP | Entry into the national phase |
Ref document number: 2021929421 Country of ref document: EP Effective date: 20220913 |
|
| NENP | Non-entry into the national phase |
Ref country code: DE |
|
| WWG | Wipo information: grant in national office |
Ref document number: 17911228 Country of ref document: US |