WO2022201447A1 - 位置座標検出装置及び方法 - Google Patents
位置座標検出装置及び方法 Download PDFInfo
- Publication number
- WO2022201447A1 WO2022201447A1 PCT/JP2021/012616 JP2021012616W WO2022201447A1 WO 2022201447 A1 WO2022201447 A1 WO 2022201447A1 JP 2021012616 W JP2021012616 W JP 2021012616W WO 2022201447 A1 WO2022201447 A1 WO 2022201447A1
- Authority
- WO
- WIPO (PCT)
- Prior art keywords
- position coordinate
- image data
- detected
- coordinate detection
- subject
- Prior art date
- Legal status (The legal status is an assumption and is not a legal conclusion. Google has not performed a legal analysis and makes no representation as to the accuracy of the status listed.)
- Ceased
Links
Images










Classifications
-
- G—PHYSICS
- G06—COMPUTING OR CALCULATING; COUNTING
- G06T—IMAGE DATA PROCESSING OR GENERATION, IN GENERAL
- G06T7/00—Image analysis
-
- G—PHYSICS
- G06—COMPUTING OR CALCULATING; COUNTING
- G06N—COMPUTING ARRANGEMENTS BASED ON SPECIFIC COMPUTATIONAL MODELS
- G06N20/00—Machine learning
-
- G—PHYSICS
- G06—COMPUTING OR CALCULATING; COUNTING
- G06N—COMPUTING ARRANGEMENTS BASED ON SPECIFIC COMPUTATIONAL MODELS
- G06N3/00—Computing arrangements based on biological models
- G06N3/02—Neural networks
- G06N3/04—Architecture, e.g. interconnection topology
- G06N3/045—Combinations of networks
- G06N3/0455—Auto-encoder networks; Encoder-decoder networks
-
- G—PHYSICS
- G06—COMPUTING OR CALCULATING; COUNTING
- G06T—IMAGE DATA PROCESSING OR GENERATION, IN GENERAL
- G06T7/00—Image analysis
- G06T7/10—Segmentation; Edge detection
- G06T7/11—Region-based segmentation
-
- G—PHYSICS
- G06—COMPUTING OR CALCULATING; COUNTING
- G06T—IMAGE DATA PROCESSING OR GENERATION, IN GENERAL
- G06T7/00—Image analysis
- G06T7/60—Analysis of geometric attributes
- G06T7/66—Analysis of geometric attributes of image moments or centre of gravity
-
- G—PHYSICS
- G06—COMPUTING OR CALCULATING; COUNTING
- G06T—IMAGE DATA PROCESSING OR GENERATION, IN GENERAL
- G06T7/00—Image analysis
- G06T7/70—Determining position or orientation of objects or cameras
-
- G—PHYSICS
- G06—COMPUTING OR CALCULATING; COUNTING
- G06T—IMAGE DATA PROCESSING OR GENERATION, IN GENERAL
- G06T7/00—Image analysis
- G06T7/70—Determining position or orientation of objects or cameras
- G06T7/73—Determining position or orientation of objects or cameras using feature-based methods
-
- G—PHYSICS
- G06—COMPUTING OR CALCULATING; COUNTING
- G06T—IMAGE DATA PROCESSING OR GENERATION, IN GENERAL
- G06T7/00—Image analysis
- G06T7/70—Determining position or orientation of objects or cameras
- G06T7/73—Determining position or orientation of objects or cameras using feature-based methods
- G06T7/74—Determining position or orientation of objects or cameras using feature-based methods involving reference images or patches
-
- G—PHYSICS
- G06—COMPUTING OR CALCULATING; COUNTING
- G06T—IMAGE DATA PROCESSING OR GENERATION, IN GENERAL
- G06T7/00—Image analysis
- G06T7/70—Determining position or orientation of objects or cameras
- G06T7/73—Determining position or orientation of objects or cameras using feature-based methods
- G06T7/75—Determining position or orientation of objects or cameras using feature-based methods involving models
-
- G—PHYSICS
- G06—COMPUTING OR CALCULATING; COUNTING
- G06V—IMAGE OR VIDEO RECOGNITION OR UNDERSTANDING
- G06V10/00—Arrangements for image or video recognition or understanding
- G06V10/70—Arrangements for image or video recognition or understanding using pattern recognition or machine learning
- G06V10/77—Processing image or video features in feature spaces; using data integration or data reduction, e.g. principal component analysis [PCA] or independent component analysis [ICA] or self-organising maps [SOM]; Blind source separation
- G06V10/776—Validation; Performance evaluation
-
- G—PHYSICS
- G06—COMPUTING OR CALCULATING; COUNTING
- G06T—IMAGE DATA PROCESSING OR GENERATION, IN GENERAL
- G06T2207/00—Indexing scheme for image analysis or image enhancement
- G06T2207/20—Special algorithmic details
- G06T2207/20081—Training; Learning
-
- G—PHYSICS
- G06—COMPUTING OR CALCULATING; COUNTING
- G06T—IMAGE DATA PROCESSING OR GENERATION, IN GENERAL
- G06T2207/00—Indexing scheme for image analysis or image enhancement
- G06T2207/20—Special algorithmic details
- G06T2207/20084—Artificial neural networks [ANN]
Definitions
- the present invention relates to a position coordinate detection device and method using machine learning technology.
- Non-Patent Document 1 Non-Patent Document 2
- Non-Patent Document 3 Non-Patent Document 4
- Methods for detecting specific position coordinates of an object in an image are available as methods for detecting specific position coordinates of an object in an image.
- training image data in which the position coordinates to be detected are specified and a two-dimensional Gaussian heat map centered on the position coordinates to be detected are used as teacher data (correct data) to learn a deep learning network.
- a new image is inferred using a deep learning network (called a trained model), and the position coordinates to be detected in the new image are detected.
- the inference result output by the trained model is a two-dimensional Gaussian heat map
- the coordinates of the peak values are output as the position coordinates to be detected.
- the peak value itself represents the reliability (certainty) of the inferred position coordinates.
- position coordinates are used to automate device operations, such as industrial products, it is required to automatically determine whether the position coordinates inferred by the learned model are correct or not. At this time, it is conceivable to use reliability.
- the inferred peak value of the heat map indicates the position coordinate to be detected and the reliability at the same time, if the peak value is wrong, the incorrect position coordinate or the reliability is replaced with the correct position. There is a possibility that the problem of continuing the operation by judging the coordinates or the degree of reliability may occur.
- An object of the present invention is to solve the above-described problems of the prior art and to provide a position coordinate detection device and method that can realize position detection with high detection performance simply by providing an image and coordinates to be detected.
- a position coordinate detection apparatus provides training image data in which a position to be detected on an image of an object is specified, and the object at the position to be detected on the training image data.
- a deep learning model trained using multiple combinations of teacher image data created by arranging pixel groups different from the background of the subject, and an image of a new subject whose position coordinates are to be detected are applied to the deep learning model.
- a position coordinate calculation unit that calculates position coordinates using inference image data obtained by input, and position coordinates calculated by the position coordinate calculation unit using pixel group information of the inference image data output from the deep learning model. and a reliability calculation unit for calculating the reliability.
- the present invention it is possible to determine the reliability using a scale different from the peak value of the heat map, so it is possible to determine the possibility that the peak value is incorrect. Furthermore, when the position coordinates or the reliability are calculated from the shape of the pixel group of the inference data, the pixel groups that are independent of the shape of the subject are used as teacher data, so the position coordinates or the reliability are obtained without depending on the shape of the subject. be able to.
- FIG. 1 is a block diagram showing a configuration example of a position coordinate detection device according to Example 1.
- FIG. FIG. 4 is a diagram showing an example of training image data and teacher image data in Example 1;
- FIG. 4 is a diagram showing an example of image data to be inferred and inference image data as an inference result in Example 1;
- FIG. 4 is a diagram showing an example of image data to be inferred and inference image data as an inference result in Example 1;
- 4 is a flow chart showing a position coordinate detection program according to Example 1.
- FIG. FIG. 10 is a block diagram showing a configuration example of a position coordinate detection device according to Example 2;
- FIG. 10 is a diagram showing an example of training image data and teacher image data in Example 2;
- FIG. 10 is a diagram showing an example of image data to be inferred and inference image data as an inference result in Example 2;
- FIG. 10 is a diagram showing an example of image data to be inferred and inference image data as an inference result in Example 2;
- 9 is a flow chart showing a position coordinate detection program according to Example 2.
- FIG. FIG. 11 is a block diagram showing a configuration example of a position coordinate detection device according to Example 3;
- FIG. 10 is a diagram showing an example of inference image data, which is an inference result in Example 3; 10 is a flow chart showing a position coordinate detection program according to Example 3.
- FIG. 11 is a block diagram showing a configuration example of a sample processing apparatus according to Example 4; 15 is a flow chart showing an example of the operation of the sample processing apparatus of FIG. 14 according to Example 4.
- FIG. FIG. 11 is a block diagram showing a configuration example of a sample inspection apparatus according to Example 5; 17 is a flow chart showing an example of the operation of the sample inspection apparatus of FIG. 16 according to Example 5.
- FIG. FIG. 10 is a block diagram showing a configuration example of a position coordinate detection device according to a modification of the second embodiment;
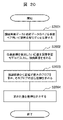
- FIG. 10 is a diagram showing an example of training image data and teacher image data in a modified example of Example 2; 10 is a flow chart showing a position detection program according to a modification of the second embodiment;
- the present invention provides training image data in which position coordinates to be detected are specified, and teacher image data in which pixel groups presenting shapes independent of the subject of the training image data are arranged at positions relative to the position coordinates to be detected.
- a position coordinate calculation unit that calculates position coordinates using the deep learning model learned using the inference image data output from the deep learning model, and a pixel group of the inference image data output from the deep learning model.
- the present invention relates to a position coordinate detection device provided with a reliability calculation unit that calculates reliability using the global information of (1).
- FIG. 1 is a block diagram showing a configuration example of a position coordinate detection device 100 according to the first embodiment.
- the position coordinate detection device 100 includes a deep learning model 110 , a position coordinate calculator 120 and a reliability calculator 130 .
- the position coordinate detection device 100 is composed of hardware or a software program provided in a part of a computer system (not shown).
- the deep learning model 110 is a pre-learned model that has been pre-learned using multiple pairs of training image data and teacher data.
- the deep learning model 110 is a Fully-Convolutional Encoder-Decoder Network as shown in prior art documents (Non-Patent Documents 1 to 4). An example of training image data and teacher data will be described with reference to FIG.
- the image 210 in FIG. 2(a) is training image data (hereinafter referred to as training image data 210) in which the subject 201 is captured.
- the training image data 210 is a diagram created for explanation and has nothing to do with the image output by the actual device.
- An X mark 202 on the training image data 210 represents the position coordinates to be detected.
- the x mark 202 does not exist on the actual image.
- An image 220 in FIG. 2(b) is training data (hereinafter referred to as training data 220) in which a heat map 204 is formed centering on the position coordinates of the X mark 203 to be detected.
- the positional coordinates of the x mark 203 in the teacher data 220 are the same as the positional coordinates of the x mark 202 in the training image data 210 .
- the x mark 203 also does not exist on the teacher data 220 .
- the heat map 204 is composed of a group of pixels having a high pixel value (for example, 255) at the center and decreasing pixel values away from the center.
- the distribution of pixel values may be two-dimensional Gaussian or conical.
- a plurality of pairs of training image data (a) and teacher data (b) as shown in FIG. 2 are prepared, and the deep learning model 110 is learned.
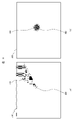
- An image 310 in FIG. 3A is an image in which the subject 301 is captured.
- the image 310 is a diagram created for explanation and has nothing to do with the image output by the actual device.
- An X mark 302 on the image 310 represents the position coordinates to be detected.
- the x mark 302 does not exist on the actual image.
- An image 320 in FIG. 3B is an inference image (hereinafter referred to as an inference image 320) in which a heat map 304 is formed centering on position coordinates 303, which are the same coordinates as the position coordinates of the X mark 302 to be detected in the image 310. ). If deep learning model 110 is a trained model that has been successfully trained, inputting image 310 into deep learning model 110 will result in inference image 320 .
- the position coordinate calculation unit 120 calculates position coordinates from the inference image 320 inferred by the deep learning model 110 . Specifically, by obtaining the peak with the maximum pixel value from the inference image 320, the peak (position coordinate 303) of the heat map 304 is detected and the coordinate is output.
- the reliability calculation unit 130 calculates the reliability from the inference image 320 inferred by the deep learning model 110 from the shape of the heat map 304 formed at the peak position output by the position coordinate calculation unit 120 .
- Specific calculation methods include a method of quantifying the isotropy of the heat map, a method of obtaining the difference from the heat map used for the training data, a method of obtaining the correlation value with the heat map used for the training data, etc.
- a known technique for quantifying the difference in shape or a combination technique thereof may be used.
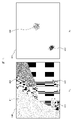
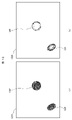
- An image 410 in FIG. 4(a) is an image in which the subject 401 is captured.
- An image 410 includes backgrounds 411 and 412 with different contrasts and noise 413 .
- the image 410 is a diagram created for explanation and has nothing to do with the image output by the actual device.
- An image 420 in FIG. 4B shows an example of an inference image (hereinafter referred to as an inference image 420) inferred by giving the image 410 to the deep learning model 110.
- FIG. Two heat maps, a heat map 403 and a heat map 404 are formed in the inference image 420 .
- the peak pixel value of the heat map 403 is larger than the peak pixel value of the heat map 404 .
- the heat map 403 is less isotropic than the heat map 404 .
- the position coordinate calculation unit 120 detects the peak of the heat map 403 by obtaining the peak with the maximum pixel value from the inference image 420, and outputs the coordinates.
- the reliability calculation unit 130 calculates the reliability from the shape of the heat map 403 formed at the peak position output by the position coordinate calculation unit 120 from the inference image 420 . Since the heat map 403 is less isotropic than the heat map 204 used for the training data 220, a low confidence is output. This indicates that the position coordinates output by the position coordinate calculator 120 are not appropriate.
- FIG. 5 is a flowchart of a position coordinate detection program representing one embodiment of the present invention using a computer system (not shown) incorporating the position coordinate detection device 100 described in FIG.
- the deep learning model 110 is learned using a plurality of pairs of training image data and teacher data (S501). Examples of training image data and teacher data are shown in training image data 210 in FIG. 2(a) and teacher data 220 in FIG. 2(b), respectively.
- the image whose position coordinates are to be detected is input to the trained deep learning model to obtain an inference image (S502).
- An example of an image whose position coordinates are to be detected is shown in the image 310 in FIG. 3A, and an example of an inference image is shown in an inference image 320 in FIG. 3B.
- a maximum of N peak coordinates whose pixel values are equal to or greater than a specific threshold value are obtained from the obtained inference image (S503).
- a specific threshold value and N are set in advance.
- the reliability is calculated from the shape of the heat map corresponding to the obtained peak coordinates (S504).
- Examples of heat maps are shown at 403 and 404 in FIG. 4(b).
- Specific calculation methods include a method of quantifying the isotropy of the heat map, a method of obtaining the difference from the heat map used for the training data, a method of obtaining the correlation value with the heat map used for the training data, etc.
- a known technique for quantifying the difference in shape or a combination technique thereof may be used.
- the peak coordinates with the highest reliability are obtained and the peak coordinates are output (S505).
- reliability information corresponding to the output peak coordinates may also be output together.
- the destination of the output may be a control unit of a computer (not shown) (a control unit that controls an external device) or a display screen, or an external processing device connected to a computer (not shown). good too.
- the reliability is calculated using information different from the peak value of the heat map, when the peak position is erroneously detected, it is possible to suggest that it is an erroneous detection in the output information. can.
- FIG. 6 is a block diagram showing a configuration example of a position coordinate detection device 600 according to the second embodiment.
- the position coordinate detection device 600 includes a deep learning model 610 , a position coordinate calculator 620 and a reliability calculator 630 .
- the position coordinate detection device 600 is composed of hardware or a software program provided in a part of a computer system (not shown).
- the deep learning model 610 is a pre-learned model that has been pre-learned using multiple pairs of training image data and teacher data. Deep learning model 610 can perform semantic segmentation. That is, the background-likeness and the object-likeness for each class are calculated for each pixel, and the label corresponding to the largest value is output as the pixel value. It can be said that each pixel is classified as a background or an object. In some cases, the greater the ratio of the maximum value (or the value of the softmax function) to the total value of background-likeness and object-likeness for each class, the higher the probability.
- An example of training image data and teacher data will be described with reference to FIG.
- the training image data 210 in FIG. 7(a) is the same image as the training image data 210 in FIG. 2 and is training image data.
- An image 720 in FIG. 7B is teacher data (hereinafter referred to as teacher data 720) in which a circular figure 704 is formed centering on the position coordinates of the X mark 703 to be detected.
- the x mark 703 in the teacher data 720 has the same coordinates as the x mark 203 in the training image data 210 shown in FIG. 2 in the first embodiment. Like the x mark 203, the x mark 703 does not exist on the teacher data 720 either.
- a circular figure 704 is composed of a group of pixels in which all pixel values are the same (eg, 255).
- the portion other than the circle (called background) has the same value (for example, 0) as the circle.
- the pixel value of the circle corresponds to the label of the position coordinates
- the pixel value of the background corresponds to the label of the background.
- the teacher data 720 in this embodiment is displayed as a binarized image, which is different from the teacher data 220 in the first embodiment in which the teacher data 220 is displayed as a multivalued image.
- a pixel group in which pixels such as the circle 704 are connected is also called a blob in the field of image processing.
- a plurality of pairs of training image data as shown in FIG. 7(a) and teacher data as shown in (b) are prepared, and the deep learning model 610 is learned.
- the behavior of the trained deep learning model 610 will be described with reference to FIG.
- the image 310 in FIG. 8(a) is the same image as the image 310 in FIG. 3(a).
- An image 820 in FIG. 8B is an inference image (hereinafter referred to as an inference image 820) formed with a blob 804 whose center of gravity is a position coordinate 803 that is the same as the position coordinates of the X mark 302 to be detected in the image 310. is.
- the deep learning model 610 is a trained model that has been successfully trained, when the image 310 is input to the deep learning model 610, the deep learning model 610 produces a circle 704 and Output the label of the position coordinates for the pixels within the same radius, and output the label of the background for the other pixels. That is, the inference image 820 is output from the deep learning model 610 .
- the position coordinate calculation unit 620 calculates position coordinates from the inference image 820 inferred by the deep learning model 610 . Specifically, a blob whose area is equal to or greater than a specific threshold value is obtained from the inference image 820, the barycentric coordinates of the obtained blob are obtained, and the barycentric coordinates are output. A well-known method may be used for detecting blobs and calculating barycentric coordinates. In addition, selection may be prioritized using the probability of barycentric coordinates or the average probability of all blobs. This likelihood value may be output in association with the corresponding barycentric coordinates.
- the reliability calculation unit 630 calculates the reliability from the inference image 820 inferred by the deep learning model 610 from the shape of the blob 804 formed at the center of gravity position output by the position coordinate calculation unit 620 .
- Specific calculation methods include a method of quantifying the degree of circularity of the blob, a method of obtaining the correlation value with the blob used as the training data, and a method of converting the blob from the center of gravity to polar coordinates and quantifying the unevenness at the boundary. , a known technique for digitizing the difference in shape, or a combination thereof.
- the image 410 in FIG. 9(a) is the same image as the image 410 in FIG. 4(a).
- An image 920 in FIG. 9B shows an example of an inference image (hereinafter referred to as an inference image 920) inferred by giving the image 410 to the deep learning model 610.
- FIG. Two blobs, a blob 903 and a blob 904 are formed in the inference image 920 .
- the blob 903 has a higher probability of the center-of-gravity coordinates than the blob 904 .
- the blob 903 has a lower degree of circularity than the blob 904 .
- the position coordinate calculation unit 620 obtains a blob whose area is equal to or greater than a specific threshold value from the inferred image 920 inferred by the deep learning model 610, obtains the barycentric coordinates of the obtained blobs, and outputs the barycentric coordinates.
- the reliability calculation unit 630 calculates the reliability from the shape of the blob 903 formed at the center of gravity position output by the position coordinate calculation unit 620 from the inference image 920 . Since blob 903 has low circularity, a low confidence is output. Accordingly, it can be seen that the position coordinates output by the position coordinate calculation unit 620 are not appropriate. In the above embodiment, only inappropriate position coordinates are output, but a plurality of position coordinates and their corresponding reliability may be output, and appropriate position coordinates may be selected by post-processing (not shown). Also, although the configuration of the position coordinate detection device is changed, the position coordinates with the highest reliability may be output by inputting the output of the reliability calculation unit to the position coordinate calculation unit.
- FIG. 10 is a flowchart of a position coordinate detection program representing one embodiment of the present invention using a computer system (not shown) incorporating the position coordinate detection device 600 described in FIG.
- a deep learning model is learned using a plurality of pairs of training image data and teacher data (S1001). Examples of training image data and teacher data are shown in training image data 210 in FIG. 7(a) and teacher data 720 in FIG. 7(b), respectively.
- the image whose position coordinates are to be detected is input to the trained deep learning model 610 to obtain an inference image (S1002).
- An example of an image whose position coordinates are to be detected is shown in the image 310 in FIG. 8(a), and an example of an inference image is shown in an inference image 820 in FIG. 8(b).
- a maximum of N blobs with an area equal to or larger than a specific threshold value are obtained from the obtained inference image, and the barycentric positions of the blobs are obtained (S1003).
- a specific threshold value and N are set in advance.
- the reliability is calculated from the shape of the blob corresponding to the obtained barycentric coordinates (S1004).
- Specific calculation methods include a method of quantifying the degree of circularity of the blob, a method of obtaining the correlation value with the blob used as the training data, and a method of converting the blob from the center of gravity to polar coordinates and quantifying the unevenness at the boundary. , a known technique for digitizing the difference in shape, or a combination thereof.
- the barycentric coordinates with the highest reliability are obtained and output (S1005).
- the reliability corresponding to the barycentric coordinates to be output may be output.
- the training data is circular, but polygons such as quadrilaterals are also acceptable. Even in that case, the feature calculated by a known technique for the shape may be used as the reliability.
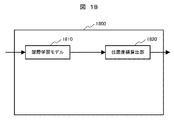
- FIG. 18 is a block diagram showing a configuration example of a position coordinate detection device 1800 according to this modification.
- a position coordinate detection device 1800 includes a deep learning model 1810 and a position coordinate calculator 1820 .
- This modification differs from the second embodiment in that the reliability calculation unit 630 described in the second embodiment is not provided.
- the deep learning model 1810 is the same as the deep learning model 610 of FIG. 6 described in the second embodiment. Therefore, examples of training image data and teacher data are the same as the training image data 210 and teacher data 720 described with reference to FIG.
- the image 410 in FIG. 19(a) is the same image as the image 410 in FIG. 4(a).
- An inference image 1920 in FIG. 19B shows an example of an inference image inferred by giving the image 410 to the deep learning model 1810 .
- Two blobs, blob 1903 and blob 1904 are formed in the inference image 1920 .
- the blob 1904 is a blob corresponding to position coordinates to be detected
- the blob 1903 is a blob corresponding to position coordinates that are not the position coordinates to be detected. It is also assumed that the blob 1903 has a smaller area than the blob 1904 .
- the position coordinate calculation unit 1820 obtains the blob with the largest area from the inference image 1920, obtains the barycentric coordinates of the obtained blob, and outputs the barycentric coordinates.
- a plurality of blobs are detected in the inference image 1920, using the characteristic that the area of the blob whose barycentric coordinates should be obtained is generally larger than that of other blobs that become noise, , by detecting the blob with the largest area, it is determined as a blob that should be originally detected without calculating the reliability of each of the plurality of blobs.
- FIG. 20 is a flowchart of a position coordinate detection program for performing position coordinate detection according to this modified example using a computer system (not shown).
- the deep learning model 1810 is learned using a plurality of pairs of training image data and teacher data (S2001).
- Examples of the training image data and teacher data are the same as the training image data 210 and teacher data 720 described with reference to FIG. 7 in the second embodiment, respectively.
- the image whose position coordinates are to be detected is input to the trained deep learning model to obtain an inference image (S2002).
- An example of an image whose position coordinates are to be detected is shown in the image 410 in FIG. 19(a), and an example of an inference image is shown in an inference image 1920 in FIG. 19(b).
- a blob with the largest area is obtained from the obtained inference image, and its centroid position is obtained (S2003). Finally, the determined coordinates are output (S2005).
- this modification also has the advantage that the position coordinates can be obtained without obtaining the reliability index.
- FIG. 11 is a block diagram showing a configuration example of a position coordinate detection device 1100 according to this embodiment.
- the position coordinate detection device 1100 includes a deep learning model 1110 , a position coordinate calculator 1120 and a reliability calculator 1130 .
- the deep learning model 1110 is a pre-learned model that has been pre-learned using multiple pairs of training image data and teacher data. Deep learning model 1110 can also perform semantic segmentation. The deep learning model 1110 randomly drops out the internal nodes multiple times and uses the average value to determine the label of the pixel. It is also assumed that an image whose pixel values are variations due to a plurality of dropouts is also output.
- Example 2 a plurality of pairs of training image data 210 and teacher data 720 as described with reference to FIG. 7 are prepared, and the deep learning model 1110 is learned.
- the behavior of the trained deep learning model 1110 will be described with reference to FIG.
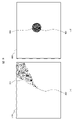
- the image 1210 in FIG. 12( a ) is the average of semantic segmentation performed by randomly dropping out multiple times when the subject image 410 described in FIG. 9( a ) in Example 2 is input to the deep learning model 1110 .
- An example of a label image (hereinafter referred to as an inference image 1210) inferred using the values is shown.
- Two blobs, a blob 1201 and a blob 1202 are formed in the inference image 1210 .
- the blob 1201 has a higher likelihood than the blob 1202 .
- the image 1220 in FIG. 12(b) is inferred using the variation obtained by performing semantic segmentation with random multiple dropouts when the subject image 410 in FIG. 9(a) is input to the deep learning model 1110.
- An example of an image (hereinafter referred to as an inference image 1220) is shown.
- Each pixel in the inference image 1220 represents the output value variation (or label variation) of the deep learning model 1110 for multiple dropouts.
- the whiter the image the lesser the variation, and the darker the greater the variation.
- the position coordinate calculation unit 1120 in the position coordinate detection device 1100 shown in FIG. 11 obtains a blob whose area is equal to or greater than a specific threshold value from the inference image 1210 in FIG. Output its barycentric coordinates.
- the reliability calculation unit 1130 in the position coordinate detection device 1100 calculates the reliability from the shape of the blob 1203 formed at the position of the center of gravity output by the position coordinate calculation unit 1120 from the inference image 1220 in FIG. 12(b). do. Since blob 1203 has low circularity, a low confidence is output. This indicates that the position coordinates output by the position coordinate calculator 1120 are not appropriate. Instead of the degree of circularity, it is also possible to obtain the amount of variation with respect to the circle at which the variation is zero.
- FIG. 13 is a flowchart of a position coordinate detection program for detecting position coordinates described in this embodiment using a computer system (not shown).
- a deep learning model is learned using a plurality of pairs of training image data and teacher data (S1301).
- This deep learning model performs semantic segmentation by randomly dropping out the internal nodes multiple times, and uses the average value to determine the label of the pixel. It is also assumed that an image is output in which pixel values are variations in semantic segmentation due to multiple dropouts. Examples of training image data and teacher data are shown in training image data 210 in FIG. 7(a) and teacher data 720 in FIG. 7(b), respectively.
- an image whose position coordinates are to be detected is input to the trained deep learning model 1110, and dropout is performed multiple times at random to determine the pixel label using the semantic segmentation average value.
- An inference image is obtained in which pixel values are variations in semantic segmentation due to the dropout of .
- An example of an image whose position coordinates are to be detected is shown in image 410 in FIG. 9(a).
- FIG. 12A shows an inference image 1210 in which pixel labels are determined using the semantic segmentation average values obtained by performing random dropout multiple times.
- An inference image 1220 in FIG. 12B shows an example of an inference image having a pixel value of .
- a maximum of N blobs with an area equal to or greater than a specific threshold are obtained from the inference image in which pixel labels are determined using the semantic segmented average value by randomly dropping out multiple times, and the centroid position of the blob is determined. (S1303).
- a specific threshold value and N are set in advance.
- a blob corresponding to the obtained barycentric coordinates is identified from the inference image whose pixel value is the variation in semantic segmentation due to multiple dropouts, and the reliability is calculated from its shape (S1304).
- Specific calculation methods include a method of digitizing the circularity of the blob, a method of obtaining a correlation value with the blob used as the training data, a method of converting the blob from the center of gravity to polar coordinates, and a method of quantifying the unevenness at the boundary.
- a known technique for quantifying the difference in shape such as the amount of variation from a circle with zero variation, or a combination technique thereof may be used.
- the training data is circular, but polygons such as quadrilaterals are also acceptable. Even in that case, the feature calculated by a known technique for the shape may be used as the reliability.
- FIG. 14 is a block diagram showing a configuration example of a sample processing device 1400 according to the fourth embodiment.
- the sample processing apparatus 1400 includes a needle section 1401 , a transport section 1402 , a computer 1403 and an image sensor 1404 .
- Needle unit 1401 , transport unit 1402 , computer 1403 and image sensor 1404 are connected via bus 1406 .
- the bus 1406 holds or mediates transmission of data, control information and analysis information handled by each processing unit connected to the bus 1406 .
- the sample processing device 1400 is connected to a display device 1410 and an input/output device 1411 via a bus 1406.
- the sample processing apparatus 1400 may be wired or wirelessly connected to the display device 1410 and the input/output device 1411 .
- the display device 1410 and the input/output device 1411 are provided outside the sample processing apparatus 1400 in FIG. 14, they may be incorporated in the sample processing apparatus 1400.
- the sample processing apparatus 1400 conveys the specific sample into the apparatus, and brings the tip of a needle (not shown) built in the needle portion 1401 close to a specific portion of the sample. It has the function to
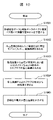
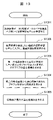
- a processing flow for bringing the tip of a needle (not shown) built into the needle portion 1401 close to a specific portion of the sample will be described with reference to FIG.
- a target sample (not shown) is transported into the sample processing apparatus 1400 using the transport unit 1402 (S1501).
- a processing unit processes a specific portion of the transported sample (S1502).
- a specific portion of the processed sample is detected using a position coordinate detection program prepared in advance in the computer 1403 and an image of the sample captured by the image sensor 1404 (S1503).
- This position coordinate detection program may be a position coordinate detection program corresponding to the flowchart shown in FIG. 13, which has been learned to detect a specific portion of the sample, or may be based on a known technique.
- the operator can be notified by an alarm.
- the position coordinates calculated using another position coordinate detection program stored in the computer 1403 may be collated, and if both are within the allowable range, the operation may be continued.
- the operator refers to the image of the image sensor 1404 displayed on the display device 1610 and the position coordinates of the center of gravity obtained in S1303 of the flowchart shown in FIG. You can judge
- the tip of the needle is detected using a position coordinate detection program created in advance in the computer 1403 and the image of the needle captured by the image sensor 1404 (S1504).
- This position coordinate detection program uses the position coordinate detection program corresponding to the flowchart shown in FIG.
- the operator may be notified by an alarm, or the position coordinates calculated using another position coordinate detection program may be compared with each other. If it exists within the allowable range, the operation may be continued. When the operator is notified by an alarm, the operator may refer to the image of the image sensor and the position coordinates displayed on the display device to determine whether to continue or interrupt the operation. If the operation is to be continued, the needle is moved by controlling the needle unit 1401 so that the position coordinates of the detected specific portion of the sample and the position coordinates of the tip of the needle are close to each other (S1505).
- the barycentric coordinates and the degree of reliability are obtained by the same method as described in the third embodiment, the robustness against noise is enhanced, and the tip position of the needle can be obtained with higher reliability. can be done.
- FIG. 16 is a block diagram showing a configuration example of a sample inspection device 1600 according to the fifth embodiment.
- a sample inspection apparatus 1600 includes a charged particle beam section 1601 , a transport section 1602 , a computer 1603 and an image sensor 1604 .
- the charged particle beam unit 1601 , transport unit 1602 , computer 1603 and image sensor 1604 are connected via a bus 1606 .
- Bus 1606 holds or mediates transmission of data, control information, and analysis information handled by each processing unit connected to bus 1606 .
- a sample inspection device 1600 is connected to a display device 1610 and an input/output device 1611 via a bus 1606 .
- the sample inspection device 1600 may be wired or wirelessly connected to the display device 1610 and the input/output device 1611 .
- the display device 1610 and the input/output device 1611 are provided outside the sample inspection device 1600 in FIG.
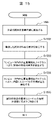
- FIG. 1 A processing flow for detecting a specific portion of a sample will be described using FIG.
- a target sample (not shown) is transported into the sample inspection apparatus 1600 using the transport unit 1602 (S1701).
- a position coordinate detection program stored in advance in the computer 1603 and an image of the sample captured by the image sensor 1604 or charged particle beam unit 1601, a specific portion of the sample is detected (S1702).
- This position coordinate detection program uses the position coordinate detection program corresponding to the flowchart described in the third embodiment with reference to FIG.
- the operator may be notified by an alarm, or the position coordinates calculated using another position coordinate detection program stored in the computer 1603 may be detected. and if both are within the allowable range, the operation may be continued.
- the operator refers to the image detected by the image sensor 1604 displayed on the display device 1610 and the positional coordinates of the center of gravity obtained in S1303 of the flowchart shown in FIG. You may decide whether to continue or interrupt.
- the detected specific portion of the sample is inspected (S1703).
Landscapes
- Engineering & Computer Science (AREA)
- Theoretical Computer Science (AREA)
- Physics & Mathematics (AREA)
- General Physics & Mathematics (AREA)
- Computer Vision & Pattern Recognition (AREA)
- Software Systems (AREA)
- Artificial Intelligence (AREA)
- Computing Systems (AREA)
- Evolutionary Computation (AREA)
- General Engineering & Computer Science (AREA)
- General Health & Medical Sciences (AREA)
- Data Mining & Analysis (AREA)
- Medical Informatics (AREA)
- Mathematical Physics (AREA)
- Health & Medical Sciences (AREA)
- Geometry (AREA)
- Life Sciences & Earth Sciences (AREA)
- Biomedical Technology (AREA)
- Biophysics (AREA)
- Computational Linguistics (AREA)
- Molecular Biology (AREA)
- Databases & Information Systems (AREA)
- Multimedia (AREA)
- Image Analysis (AREA)
- Image Processing (AREA)
Abstract
Description
図1は、実施例1の実施形態に係る位置座標検出装置100の構成例を示すブロック図である。位置座標検出装置100は、深層学習モデル110、位置座標算出部120、信頼度算出部130を備える。位置座標検出装置100は、図示していないコンピュータシステムの一部に備えられるハードウェアまたはソフトウェアプログラムで構成される。
図3(a)の画像310は、被写体301が写った画像である。画像310は説明のために作成した図で、実際の装置が出力する画像とは関係しない。画像310上の×マーク302は検出したい位置座標を表す。×マーク302は実際の画像上には存在しない。図3(b)の画像320は、画像310の検出したい×マーク302の位置座標と同じ座標である位置座標303を中心としたヒートマップ304が形成された推論画像(以下、推論画像320と記す)である。深層学習モデル110がうまく学習された学習済モデルである場合、画像310を深層学習モデル110に入力すると、推論画像320が出力される。
図6は、第2の実施形態に係る位置座標検出装置600の構成例を示すブロック図である。位置座標検出装置600は、深層学習モデル610、位置座標算出部620、信頼度算出部630を備える。位置座標検出装置600は、図示していないコンピュータシステムの一部に備えられるハードウェアまたはソフトウェアプログラムで構成される。
図8(a)の画像310は、図3(a)の画像310と同じ画像である。図8(b)の画像820は、画像310の検出したい×マーク302の位置座標と同じ座標である位置座標803を重心としたブロブ804が形成された推論画像(以下、推論画像820と記す)である。深層学習モデル610がうまく学習された学習済モデルである場合、画像310を深層学習モデル610に入力すると、深層学習モデル610は、正解位置座標である位置座標803を中心とした、円図形704と同じ半径内の画素に対して位置座標のラベルを出力し、その他の画素に対して背景のラベルを出力する。すなわち深層学習モデル610からは、推論画像820が出力される。
上記の実施例では、適切でない位置座標のみを出力したが、複数の位置座標とそれに対応する信頼度を出力し、図示していない後段処理によって適切な位置座標を選択しても良い。また、位置座標検出装置の構成は変わるが、信頼度算出部の出力を位置座標算出部に入力することにより、信頼度が最も高い位置座標を出力するようにしてもよい。
[変形例]
実施例2の変形例を図18乃至図20を用いて説明する。図18は、本変形例に係る位置座標検出装置1800の構成例を示すブロック図である。位置座標検出装置1800は、深層学習モデル1810、位置座標算出部1820を備える。
図11は、本実施例に係る位置座標検出装置1100の構成例を示すブロック図である。位置座標検出装置1100は、深層学習モデル1110、位置座標算出部1120、信頼度算出部1130を備える。
図12(a)の画像1210は、実施例2において図9(a)で説明した被写体の画像410を深層学習モデル1110に入力したときの、ランダムで複数回ドロップアウトを行ってセマンティックセグメンテーションした平均値を用いて推論されたラベル画像(以下、推論画像1210と記す)の例を示している。推論画像1210には、ブロブ1201とブロブ1202の2つのブロブが形成されている。ここで、ブロブ1201はブロブ1202と比べて確からしさが高いものとする。
110、610、1110,1810 深層学習モデル
120,620,1120、1820 位置座標算出部
130,630,1130 信頼度算出部
201 被写体画像
210 訓練画像データ
220、720 教師データ
320、420、820、920、1210 推論画像
1210 推論画像
1400 試料加工装置
1600 試料検査装置
Claims (16)
- 被写体を撮像した画像上で検出したい位置が特定された訓練画像データと前記訓練画像データ上の前記検出したい位置における前記被写体に対して前記被写体とは独立な形状を呈する画素群を配置して作成した教師画像データとの組み合わせを複数組用いて学習された深層学習モデルと、
位置座標を検出したい新たな被写体の画像を前記深層学習モデルに入力して求めた推論画像データを用いて前記位置座標を算出する位置座標算出部と、
前記深層学習モデルから出力された推論画像データの画素群の情報を用いて前記位置座標算出部で算出した前記位置座標の信頼度を算出する信頼度算出部と、
を備えることを特徴とする位置座標検出装置。 - 請求項1に記載の位置座標検出装置において、
前記教師画像データの前記検出したい位置における前記被写体に対して前記被写体の背景とは異なる画素群は、2次元ガウシアン型の画素値からなる前記検出したい位置座標を中心とした円又は多角形であり、前記深層学習モデルがFully―Convolutional Encoder-Decoder Networkであり、前記位置座標算出部が前記推論画像データのピーク座標を求める処理を含む
ことを特徴とする位置座標検出装置。 - 請求項1に記載の位置座標検出装置において、
前記教師画像データの前記検出したい位置における前記被写体に対して前記被写体の背景とは異なる画素群は、同一画素値からなる前記検出したい位置座標を中心とした円又は多角形であり、前記深層学習モデルがセマンティックセグメンテーションのための深層学習ネットワークであり、前記位置座標算出部が前記推論画像データの連結成分及び該連結成分の重心を求める処理を含む
ことを特徴とする位置座標検出装置。 - 請求項1に記載の位置座標検出装置において、
前記信頼度算出部が、前記推論画像データの前記画素群の大域的な情報と前記教師画像データの前記画素群の形状との違いを数値化する処理を含む
ことを特徴とする位置座標検出装置。 - 請求項3に記載の位置座標検出装置において、
前記信頼度算出部が、前記推論画像データの前記画素群の大域的な情報を数値化する処理を含む
ことを特徴とする位置座標検出装置。 - 請求項1に記載の位置座標検出装置を含むことを特徴とする試料加工装置。
- 請求項1に記載の位置座標検出装置を含むことを特徴とする試料検査装置。
- 被写体を撮像した画像上で検出したい位置座標が特定された訓練画像データと、前記訓練画像データ上の前記検出したい位置座標における前記被写体に対して相対的な位置に同一画素値からなる前記検出したい位置座標を中心とした円形状を呈する画素群を配置した教師画像データとの組み合わせを複数個用いて学習された深層学習モデルと、
位置座標を求めたい新たな被写体の画像を前記深層学習モデルに入力して求めた推論画像データを用いて前記新たな被写体の画像における前記求めたい位置座標を算出する位置座標算出部と、
を備えることを特徴とする位置座標検出装置。 - 被写体を撮像した画像上で検出したい位置が特定された訓練画像データと前記訓練画像データ上の前記検出したい位置における前記被写体に対して前記被写体とは独立な形状を呈する画素群を配置して作成した教師画像データとの組み合わせを複数組用いて学習された深層学習モデルを作成し、
位置座標を検出したい新たな被写体の画像を前記深層学習モデルに入力して求めた推論画像データを用いて位置座標算出部で前記新たな被写体の検出したい位置の位置座標を算出し、
前記深層学習モデルから出力された推論画像データの画素群の情報を用いて前記位置座標算出部で算出した前記新たな被写体の位置座標の信頼度を信頼度算出部で算出する、
ことを特徴とする位置座標検出方法。 - 請求項9に記載の位置座標検出方法において、
前記教師画像データの前記検出したい位置における前記被写体に対して前記被写体の背景とは異なる画素群は、2次元ガウシアン型の画素値からなる前記検出したい位置座標を中心とした円であり、前記深層学習モデルがFully―Convolutional Encoder-Decoder Networkであり、前記位置座標算出部が前記推論画像データのピーク座標を求める処理を含む
ことを特徴とする位置座標検出方法。 - 請求項9に記載の位置座標検出方法において、
前記教師画像データの前記検出したい位置における前記被写体に対して前記被写体の背景とは異なる画素群は、同一画素値からなる前記検出したい位置座標を中心とした円又は多角形であり、前記深層学習モデルがセマンティックセグメンテーションのための深層学習ネットワークであり、前記位置座標算出部が前記推論画像データの連結成分及び該連結成分の重心を求める処理を含む
ことを特徴とする位置座標検出方法。 - 請求項9に記載の位置座標検出方法において、前記信頼度算出部が、前記推論画像データの前記画素群の大域的な情報と前記教師画像データの前記画素群の形状との違いを数値化する処理を含む
ことを特徴とする位置座標検出方法。 - 請求項11に記載の位置座標検出方法において、前記信頼度算出部が前記推論画像データの前記画素群の形状を数値化する処理を含む
ことを特徴とする位置座標検出方法。 - 請求項9に記載の位置座標検出方法を含むことを特徴とする試料加工方法。
- 請求項9に記載の位置座標検出方法を含むことを特徴とする試料検査方法。
- 被写体を撮像した画像上で検出したい位置座標が特定された訓練画像データと、前記訓練画像データ上の前記検出したい位置座標における前記被写体に対して相対的な位置に同一画素値からなる前記検出したい位置座標を中心とした円形状を呈する画素群を配置した教師画像データとの組み合わせを複数個用いて深層学習モデルを学習し、
位置座標を求めたい新たな被写体の画像を前記深層学習モデルに入力して求めた推論画像データを用いて位置座標算出部で前記新たな被写体の画像における前記求めたい位置座標を算出する
ことを特徴とする位置座標検出方法。
Priority Applications (5)
| Application Number | Priority Date | Filing Date | Title |
|---|---|---|---|
| US18/282,004 US20240177333A1 (en) | 2021-03-25 | 2021-03-25 | Localization Apparatus and Method |
| KR1020237030885A KR20230145137A (ko) | 2021-03-25 | 2021-03-25 | 위치 좌표 검출 장치 및 방법 |
| JP2023508330A JP7614330B2 (ja) | 2021-03-25 | 2021-03-25 | 位置座標検出装置、試料加工装置および試料検査装置 |
| PCT/JP2021/012616 WO2022201447A1 (ja) | 2021-03-25 | 2021-03-25 | 位置座標検出装置及び方法 |
| TW110136482A TWI800016B (zh) | 2021-03-25 | 2021-09-30 | 位置座標偵測裝置及方法 |
Applications Claiming Priority (1)
| Application Number | Priority Date | Filing Date | Title |
|---|---|---|---|
| PCT/JP2021/012616 WO2022201447A1 (ja) | 2021-03-25 | 2021-03-25 | 位置座標検出装置及び方法 |
Publications (1)
| Publication Number | Publication Date |
|---|---|
| WO2022201447A1 true WO2022201447A1 (ja) | 2022-09-29 |
Family
ID=83395443
Family Applications (1)
| Application Number | Title | Priority Date | Filing Date |
|---|---|---|---|
| PCT/JP2021/012616 Ceased WO2022201447A1 (ja) | 2021-03-25 | 2021-03-25 | 位置座標検出装置及び方法 |
Country Status (5)
| Country | Link |
|---|---|
| US (1) | US20240177333A1 (ja) |
| JP (1) | JP7614330B2 (ja) |
| KR (1) | KR20230145137A (ja) |
| TW (1) | TWI800016B (ja) |
| WO (1) | WO2022201447A1 (ja) |
Cited By (1)
| Publication number | Priority date | Publication date | Assignee | Title |
|---|---|---|---|---|
| US20220383537A1 (en) * | 2021-05-28 | 2022-12-01 | Infineon Technologies Ag | Method and apparatus to evaluate radar images and radar device |
Family Cites Families (5)
| Publication number | Priority date | Publication date | Assignee | Title |
|---|---|---|---|---|
| WO2017087334A1 (en) * | 2015-11-16 | 2017-05-26 | Orbital Insight, Inc. | Moving vehicle detection and analysis using low resolution remote sensing imagery |
| JP7209333B2 (ja) * | 2018-09-10 | 2023-01-20 | 国立大学法人 東京大学 | 関節位置の取得方法及び装置、動作の取得方法及び装置 |
| TWI687898B (zh) * | 2018-11-23 | 2020-03-11 | 宏碁股份有限公司 | 影像正規化方法及影像處理裝置 |
| JP2021117548A (ja) * | 2020-01-22 | 2021-08-10 | 富士通株式会社 | 画像処理装置、画像処理方法及び画像処理プログラム |
| US11770551B2 (en) * | 2020-12-15 | 2023-09-26 | Google Llc | Object pose estimation and tracking using machine learning |
-
2021
- 2021-03-25 JP JP2023508330A patent/JP7614330B2/ja active Active
- 2021-03-25 US US18/282,004 patent/US20240177333A1/en active Pending
- 2021-03-25 WO PCT/JP2021/012616 patent/WO2022201447A1/ja not_active Ceased
- 2021-03-25 KR KR1020237030885A patent/KR20230145137A/ko active Pending
- 2021-09-30 TW TW110136482A patent/TWI800016B/zh active
Non-Patent Citations (1)
| Title |
|---|
| TOMPSON JONATHAN; GOROSHIN ROSS; JAIN ARJUN; LECUN YANN; BREGLER CHRISTOPH: "Efficient object localization using Convolutional Networks", 2015 IEEE CONFERENCE ON COMPUTER VISION AND PATTERN RECOGNITION (CVPR), IEEE, 7 June 2015 (2015-06-07), pages 648 - 656, XP032793514, DOI: 10.1109/CVPR.2015.7298664 * |
Cited By (2)
| Publication number | Priority date | Publication date | Assignee | Title |
|---|---|---|---|---|
| US20220383537A1 (en) * | 2021-05-28 | 2022-12-01 | Infineon Technologies Ag | Method and apparatus to evaluate radar images and radar device |
| US12380589B2 (en) * | 2021-05-28 | 2025-08-05 | Infineon Technologies Ag | Method and apparatus to evaluate radar images and radar device |
Also Published As
| Publication number | Publication date |
|---|---|
| KR20230145137A (ko) | 2023-10-17 |
| TWI800016B (zh) | 2023-04-21 |
| JPWO2022201447A1 (ja) | 2022-09-29 |
| JP7614330B2 (ja) | 2025-01-15 |
| US20240177333A1 (en) | 2024-05-30 |
| TW202238525A (zh) | 2022-10-01 |
Similar Documents
| Publication | Publication Date | Title |
|---|---|---|
| Li et al. | Automatic welding seam tracking and identification | |
| US8144193B2 (en) | Work piece tracking system and method | |
| Tian et al. | Automatic identification of multi-type weld seam based on vision sensor with silhouette-mapping | |
| Günther et al. | Model-based furniture recognition for building semantic object maps | |
| Aziz et al. | Implementation of lane detection algorithm for self-driving car on toll road cipularang using Python language | |
| CN110796029B (zh) | 人脸校正及模型训练方法、装置、电子设备及存储介质 | |
| CN110910363A (zh) | 基于机器视觉和深度学习的虚焊检测方法、系统及介质 | |
| KR102810293B1 (ko) | 입력 이미지로부터 전력선을 검출하는 인공신경망의 학습 방법 | |
| Singh et al. | Performance analysis of object detection algorithms for robotic welding applications in planar environment | |
| JP7614330B2 (ja) | 位置座標検出装置、試料加工装置および試料検査装置 | |
| Chu et al. | Identification of flange specification in real industrial settings with human reasoning assisted by augmented reality | |
| WO2022147774A1 (zh) | 基于三角剖分和概率加权ransac算法的物体位姿识别方法 | |
| Pan et al. | A novel method: YOLO-CE and 3D point cloud-based feature extraction for welding seams of tower bases | |
| Mörwald et al. | Advances in real-time object tracking: Extensions for robust object tracking with a Monte Carlo particle filter | |
| Garcia-Salguero et al. | Socially acceptable approach to humans by a mobile robot | |
| Chen et al. | A hierarchical visual model for robot automatic arc welding guidance | |
| Fletcher et al. | Predicting visual differentiability for unmanned aerial vehicle gestures | |
| CN105427295A (zh) | 一种基于焊缝的图像识别方法和图像识别系统 | |
| Liu et al. | An RGB‐D‐Based Cross‐Field of View Pose Estimation System for a Free Flight Target in a Wind Tunnel | |
| Cortés et al. | Semi-automatic pose estimation of a fleet of robots with embedded stereoscopic cameras | |
| Mokuwe et al. | Assembly line quality assurance through hand tracking and object detection | |
| CN116408585A (zh) | 一种基于深度学习的细窄焊缝稳健定位方法 | |
| Cherkasov et al. | Detection of Defects in Welded Joints Based on Data from the Computer Vision System Using YOLOv5 | |
| CN105513050A (zh) | 一种目标图像提取方法及装置 | |
| Dong et al. | Visual Weld Seam Tracking Through Feature-Fused Kernelized Correlation Filters and Generative Adversarial Networks |
Legal Events
| Date | Code | Title | Description |
|---|---|---|---|
| 121 | Ep: the epo has been informed by wipo that ep was designated in this application |
Ref document number: 21931948 Country of ref document: EP Kind code of ref document: A1 |
|
| ENP | Entry into the national phase |
Ref document number: 20237030885 Country of ref document: KR Kind code of ref document: A |
|
| WWE | Wipo information: entry into national phase |
Ref document number: 1020237030885 Country of ref document: KR |
|
| WWE | Wipo information: entry into national phase |
Ref document number: 18282004 Country of ref document: US Ref document number: 2023508330 Country of ref document: JP |
|
| NENP | Non-entry into the national phase |
Ref country code: DE |
|
| 122 | Ep: pct application non-entry in european phase |
Ref document number: 21931948 Country of ref document: EP Kind code of ref document: A1 |