WO2022192574A1 - Method and system for estimating thickness of deep reservoirs - Google Patents
Method and system for estimating thickness of deep reservoirs Download PDFInfo
- Publication number
- WO2022192574A1 WO2022192574A1 PCT/US2022/019804 US2022019804W WO2022192574A1 WO 2022192574 A1 WO2022192574 A1 WO 2022192574A1 US 2022019804 W US2022019804 W US 2022019804W WO 2022192574 A1 WO2022192574 A1 WO 2022192574A1
- Authority
- WO
- WIPO (PCT)
- Prior art keywords
- frequency
- seismic data
- reservoir
- aoi
- horizons
- Prior art date
- Legal status (The legal status is an assumption and is not a legal conclusion. Google has not performed a legal analysis and makes no representation as to the accuracy of the status listed.)
- Ceased
Links
Classifications
-
- G—PHYSICS
- G01—MEASURING; TESTING
- G01V—GEOPHYSICS; GRAVITATIONAL MEASUREMENTS; DETECTING MASSES OR OBJECTS; TAGS
- G01V1/00—Seismology; Seismic or acoustic prospecting or detecting
- G01V1/28—Processing seismic data, e.g. for interpretation or for event detection
- G01V1/30—Analysis
- G01V1/306—Analysis for determining physical properties of the subsurface, e.g. impedance, porosity or attenuation profiles
-
- G—PHYSICS
- G01—MEASURING; TESTING
- G01V—GEOPHYSICS; GRAVITATIONAL MEASUREMENTS; DETECTING MASSES OR OBJECTS; TAGS
- G01V1/00—Seismology; Seismic or acoustic prospecting or detecting
- G01V1/28—Processing seismic data, e.g. for interpretation or for event detection
- G01V1/30—Analysis
- G01V1/301—Analysis for determining seismic cross-sections or geostructures
- G01V1/302—Analysis for determining seismic cross-sections or geostructures in 3D data cubes
-
- G—PHYSICS
- G01—MEASURING; TESTING
- G01V—GEOPHYSICS; GRAVITATIONAL MEASUREMENTS; DETECTING MASSES OR OBJECTS; TAGS
- G01V1/00—Seismology; Seismic or acoustic prospecting or detecting
- G01V1/28—Processing seismic data, e.g. for interpretation or for event detection
- G01V1/30—Analysis
- G01V1/307—Analysis for determining seismic attributes, e.g. amplitude, instantaneous phase or frequency, reflection strength or polarity
-
- G—PHYSICS
- G01—MEASURING; TESTING
- G01V—GEOPHYSICS; GRAVITATIONAL MEASUREMENTS; DETECTING MASSES OR OBJECTS; TAGS
- G01V2210/00—Details of seismic processing or analysis
- G01V2210/10—Aspects of acoustic signal generation or detection
- G01V2210/12—Signal generation
- G01V2210/129—Source location
- G01V2210/1293—Sea
-
- G—PHYSICS
- G01—MEASURING; TESTING
- G01V—GEOPHYSICS; GRAVITATIONAL MEASUREMENTS; DETECTING MASSES OR OBJECTS; TAGS
- G01V2210/00—Details of seismic processing or analysis
- G01V2210/10—Aspects of acoustic signal generation or detection
- G01V2210/12—Signal generation
- G01V2210/129—Source location
- G01V2210/1295—Land surface
-
- G—PHYSICS
- G01—MEASURING; TESTING
- G01V—GEOPHYSICS; GRAVITATIONAL MEASUREMENTS; DETECTING MASSES OR OBJECTS; TAGS
- G01V2210/00—Details of seismic processing or analysis
- G01V2210/10—Aspects of acoustic signal generation or detection
- G01V2210/14—Signal detection
- G01V2210/142—Receiver location
- G01V2210/1423—Sea
-
- G—PHYSICS
- G01—MEASURING; TESTING
- G01V—GEOPHYSICS; GRAVITATIONAL MEASUREMENTS; DETECTING MASSES OR OBJECTS; TAGS
- G01V2210/00—Details of seismic processing or analysis
- G01V2210/10—Aspects of acoustic signal generation or detection
- G01V2210/14—Signal detection
- G01V2210/142—Receiver location
- G01V2210/1425—Land surface
-
- G—PHYSICS
- G01—MEASURING; TESTING
- G01V—GEOPHYSICS; GRAVITATIONAL MEASUREMENTS; DETECTING MASSES OR OBJECTS; TAGS
- G01V2210/00—Details of seismic processing or analysis
- G01V2210/20—Trace signal pre-filtering to select, remove or transform specific events or signal components, i.e. trace-in/trace-out
- G01V2210/21—Frequency-domain filtering, e.g. band pass
-
- G—PHYSICS
- G01—MEASURING; TESTING
- G01V—GEOPHYSICS; GRAVITATIONAL MEASUREMENTS; DETECTING MASSES OR OBJECTS; TAGS
- G01V2210/00—Details of seismic processing or analysis
- G01V2210/40—Transforming data representation
- G01V2210/43—Spectral
-
- G—PHYSICS
- G01—MEASURING; TESTING
- G01V—GEOPHYSICS; GRAVITATIONAL MEASUREMENTS; DETECTING MASSES OR OBJECTS; TAGS
- G01V2210/00—Details of seismic processing or analysis
- G01V2210/60—Analysis
- G01V2210/62—Physical property of subsurface
- G01V2210/624—Reservoir parameters
-
- G—PHYSICS
- G01—MEASURING; TESTING
- G01V—GEOPHYSICS; GRAVITATIONAL MEASUREMENTS; DETECTING MASSES OR OBJECTS; TAGS
- G01V2210/00—Details of seismic processing or analysis
- G01V2210/60—Analysis
- G01V2210/64—Geostructures, e.g. in 3D data cubes
- G01V2210/641—Continuity of geobodies
-
- G—PHYSICS
- G01—MEASURING; TESTING
- G01V—GEOPHYSICS; GRAVITATIONAL MEASUREMENTS; DETECTING MASSES OR OBJECTS; TAGS
- G01V2210/00—Details of seismic processing or analysis
- G01V2210/60—Analysis
- G01V2210/64—Geostructures, e.g. in 3D data cubes
- G01V2210/643—Horizon tracking
-
- G—PHYSICS
- G01—MEASURING; TESTING
- G01V—GEOPHYSICS; GRAVITATIONAL MEASUREMENTS; DETECTING MASSES OR OBJECTS; TAGS
- G01V2210/00—Details of seismic processing or analysis
- G01V2210/70—Other details related to processing
- G01V2210/74—Visualisation of seismic data
Definitions
- BACKGROUND Horizons refer to surfaces or seismic reflectors that separate different rock layers in depositional environments.
- a horizon can he a boundary between two different geological layers in a subterranean region.
- Horizons may be perceived using methods for decomposing seismic data into frequencies to indicate a point in which two different rock layers meet, interpreting whether a meeting point between two different rock layers occurs in a thin reservoir is usually performed by taking direct source rock samples from a formation and is not usually performed using the seismic data as a starting point.
- seismic data is usually required to be processed along with well data to look at characteristics in the seismic and well response to infer geologic boundaries in the formation. This requirement to combine seismic data and well data prevents advanced thickness analysis of a formation during petroleum exploration.
- embodiments disclosed herein relate to a method for estimating a thickness of a deep reservoir.
- the method includes obtaining seismic data relating to the deep reservoir ⁇ .
- the method includes performing spectral decomposition to obtain one or more frequency components from the seismic data.
- the method includes identifying a number of mono-frequency horizons corresponding to high frequencies in the seismic data, determining whether the deep reservoir is a thin reservoir based on tire number of mono-frequency horizons, and estimating the thickness of the deep reservoir when the deep reservoir is determined to be the thin reservoir.
- embodiments disclosed herein relate to seismic survey system.
- the system includes a generator device that transmits a signal to an area of interest (AOI), a collector device that obtains a response to the signal from the AOI, and a controller device.
- the controller device determines seismic data based on the signal and the response to the signal.
- the controller device performs spectral decomposition to obtain one or more frequency components from the seismic data.
- the controller device identifies a number of mono-frequency horizons corresponding to high frequencies in the seismic data, determines whether the deep reservoir is a thin reservoir based on the number of mono-frequency horizons, and estimates the thickness of the deep reservoir when the deep reservoir is determined to be the thin reservoir.
- embodiments disclosed herein relate to a n on- transitory computer readable medium storing instructions executable by a computer processor.
- the instructions include functionality for obtaining seismic data relating to the deep reservoir.
- the instructions include functionality for performing spectral decomposition to obtain one or more frequency components from the seismic data.
- the instructions include functionality for identifying a number of mono-frequency horizons corresponding to high frequencies in the seismic data, determining whether the deep reservoir is a thin reservoir based on the number of mono-frequency horizons, and estimating the thickness of the deep reservoir when the deep reservoir is determined to be the thin reservoir.
- FIG. 1 shows a schematic diagram showing a system for estimating a thickness of a deep reservoir.
- FIG. 2 shows a schematic diagram showing a generator device in accordance with one or more embodiments.
- FIG. 3 shows a schematic diagram showing a collector device in accordance with one or more embodiments.
- FIG. 4 shows a schematic diagram showing a controller device in accordance with one or more embodiments.
- FIG. 5A shows a schematic diagram showing an example of an offshore system for estimating a thickness of a deep reservoir.
- FIG. 1 shows a schematic diagram showing a system for estimating a thickness of a deep reservoir.
- FIG. 2 shows a schematic diagram showing a generator device in accordance with one or more embodiments.
- FIG. 3 shows a schematic diagram showing a collector device in accordance with one or more embodiments.
- FIG. 4 shows a schematic diagram showing a controller device in accordance with one or more embodiments.
- FIG. 5A shows a schematic diagram showing an example of an offshore system for estimating a thickness
- FIG. 5B shows a schematic diagram showing an example of an onshore system for estimating a thickness of a deep reservoir.
- FIG. 6 shows a block diagram showing a method for estimating a thickness of a deep reservoir in accordance with one or more embodiments.
- FIG. 7A shows an image showing a thickness of a deep reservoir in accordance with one or more embodiments.
- FIG. 7B shows an image showing a thickness of a deep reservoir at a first depth.
- FIG. 7C shows an image showing a thickness of a deep reservoir at a second depth.
- FIG. 8 shows an image showing a thickness of a deep reservoir ⁇ at a third depth.
- FIG. 9 shows a flowchart in accordance with one or more embodiments.
- FIG. 10 shows a computer system for estimating a thickness of a deep reservoir in accordance with one or more embodiments.
- ordinal numbers are not to imply or create any particular ordering of the elements nor to limit any element to being only a single element unless expressly disclosed, such as using the terms "before”, “after”, “single”, and other such terminology. Rather, the use of ordinal numbers is to distinguish between the elements.
- a first element is distinct from a second element, and the first element may encompass more than one element and succeed (or precede) the second element in an ordering of elements.
- embodiments of the disclosure are directed towards a method and a system for estimating thickness of hydrocarbon reservoirs or any geologic layers in the subsurface directly from the observed peak frequency in the seismic data. The method and the system may estimate a thickness of deep thin reservoirs targeted for petroleum exploration.
- the method and the system mitigate any difficulties in estimating thickness of deep thin reservoirs through conventional seismic interpretation techniques by developing (i.e. , resolving) images of thinner layers using seismic data.
- Thin reservoirs are difficult to resolve through conventional seismic interpretation once the seismic data is below a tuning thickness.
- Thin reservoirs below a tuning thickness tend to result in observed relatively high peak frequency of the seismic data due to the interference of events below the seismic resolution.
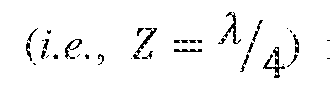
- the vertical resolution of seismic data is limited and does not exceed one quarter of the seismic wavelength where ⁇ is the seismic wavelength, V p is the seismic velocity, and/is the seismic frequency). Resolving thin reservoirs of the tuning thickness limit is difficult because the corresponding reflections to these thin reservoirs intervene with each other.
- the resolution of the seismic data decreases with depth because high seismic frequencies are attenuated as the seismic waves propagate into great depths. This makes it more difficult to resolve deep thin reservoirs.
- Such reservoirs can be interpreted on conventional seismic data.
- the frequency characteristics of thin reservoir's are deri ved from collected seismic data.
- various frequency components of amplitude spectrum of the seismic data may be obtained through spectral decomposition.
- thin reservoirs may be picked at mono -frequency horizons corresponding to high frequencies (i.e ., peak frequencies) of the spectrum.
- high peak frequencies may he identified as the frequencies where the thin reservoirs show the highest degree of illumination.
- Horizons refer to surfaces or seismic reflectors that separate different rock layers in depositional environments.
- Horizon picking or tracking refers to a process of identifying or determining a seismic reflector between two geological layers.
- Horizon picking may be performed manually or automatically.
- software tools may execute auto-horizon picking algorithms to perform horizon picking automatically based on seismic data. Both manual horizon picking and auto-horizon picking can be difficult, time consuming, and error-prone because of the complexity of the geology, poor signal to noise ratio of the seismic data, or both.
- a one-way travel time of seismic waves with a geologic layer T can be approximated as a function of the high peak frequency (i.e., f peaik ) as follow:
- the thickness of any geologic layer Z can be estimated as follow:
- V int is the interval velocity of P- waves in a particular geologic layer.
- the thickness may be estimated based on an illumination on an image mapping the deep reservoir.
- the seismic data may be obtained from an area of interest, the thickness may be calculated using equations (1) and (2), and the results may be mapped from a database onto a map showing an illumination gradient corresponding to a calculated thickness.
- FIG. 1 shows a schematic diagram illustrating a seismic survey system 100 for collecting seismic data from a deep reservoir 180 located below a surface 150 of the ocean 165.
- the seismic survey system 100 includes a generator device 135 that generates various sampling signals 140 towards an area of interest (AOI) located at a testing surface 170.
- the testing surface 170 absorbs a portion of the various sampling signals 140 and reflects signals 155A, 155B, and 155C a corresponding depths 175A, 175B, and 175C. Once the reflected signals 155A-155C reach the surface, they may be retrieved by one or more corresponding collector devices 160A, 160B, and 160C.
- Each collector device out of the collector devices 160A-16QC may be located on the ocean surface 150 and disposed at an angle corresponding to a location for receiving the corresponding reflected signals 155A-155C.
- the collector devices 160A-160C receive the corresponding reflected signals 155A-155C and share the received information with a controller device 120 that processes seismic data received from tire reflected signals 155A-155C.
- the seismic data is used for frequency-based horizon interpretation.
- the offshore seismic survey system 100 can be used on land, offshore, or in another subterranean region. As shown in FIG. 1, in offshore operations, a vessel 125 may act as a surveying site 105 for processing the seismic data.
- the generator device 135 may be tethered through a conveyance mechanism 130 that deploys the generator device 135 to a strategic location closer to the AOI where multiple depths may be identified.
- the vessel 125 may be a movable surveying site or a permanently moored vessel.
- the surveying site 105 may include at least one operations hub 110, one or more storage units 115, and the controller device 120.
- the operations hub 110 may include multiple laboratories and testing stations for operators to process seismic data.
- the operations hub 110 may include one or more display panels for analyzing images generated using the seismic data.
- the operations hub 110 may further include data storage stations that provide storage space for the seismic data and any processed data thereof.
- the storage unit 115 may be one or more locations for safeguarding industrial equipment used in the process of petroleum exploration.
- the storage unit 115 may include a memory for storing well logs and data regarding sampling signals 140, reflected signals 155A-155C, and their seismic data for performing simulations
- the controller device 120 may include a reservoir simulator (not shown).
- the reservoir simulator may include hardware and/or software with functionality for generating one or more reservoir models regarding the deep reservoir 180 and/or performing one or more reservoir simulations.
- the reservoir simulator may perform production analysis and estimation based on one or more characteristics associated to the deep reservoir 180. While the reservoir simulator may be included in the controller device 120 at the surveying site 105, the reservoir simulator may be located away from the surveying site 105.
- the reservoir simulator may include a computer system disposed to estimate a depth of the depths 175A, 175B, and 175C.
- the reservoir simulator may use the memory for compiling and storing historical data about the deep reservoir 180.
- the historical data may be information including reservoir depth, well production rate, packer depth, and/or casing depth.
- Subsurface sedimentary structures that trap oil such as faults, folds, and domes, may be mapped by one or more reflected waves.
- the amplitude, phase, frequency, and travel time information of the waves at specified locations within the deep reservoir 180 may be recorded as seismic data.
- the frequency information of the seismic data may be used for horizon interpretation.
- the seismic data may include multiple frequency components and a bandwidth of a spectrum or a range in a frequency domain.
- the recorded seismic data may have a bandwidth of 10-150 Hz in the frequency domain.
- the seismic data may include two-dimensional (2D), three-dimensional (3D), or higher dimensional seismic data.
- the seismic data may include 3D seismic volumes.
- Each 3D seismic volume can include sets of seismic traces organized into 2D seismic lines, in which each trace has respective coordinates and each data point of the trace corresponds to a certain seismic travel time or depth.
- seismic data may be collected in 2D seismic lines.
- the seismic data may include full stack seismic volumes that span the full bandwidth of the seismic data (for example, from 10 Hz to 1000 Hz).
- the generator device 135 includes electronic components that enable the generator device 135 to perform communication functions, data collecting functions, and/or processing functions.
- the generator device 135 has a generator housing 200 that includes generator communication system 210, generator processing system 220, and generator sensing system 230 coupled to the source chamber 240 containing a source element 242.
- the generator device 135 may be hosted inside the vessel 125 or disposed at a distance from the vessel 125.
- the generator device 135 is deployed above the surface 170 in the manner shown in FIG. 1. In this case, the generator housing 200 may be formed to resist sub-nautical pressures and to resist hazardous environments.
- the generator communication system 210 may include communication devices such as a generator transmitter 212 and a generator receiver 214.
- the generator transmitter 212 and the generator receiver 214 may transmit and receive communication signals, respectively.
- the generator transmitter 2.12 and the generator receiver 214 may communicate with one or more control systems located at a remote location through a wired connection.
- the generator communication system 210 may communicate wirelessly with the collector communication system 310 of the collector device 160.
- the generator communication system 210 may act as a relay to transfer information from the collector device 160 to the controller device 120 located at the vessel 125.
- the generator processing system 220 may include a generator processor 222 and a generator memory 224.
- the generator processor 222 may perform computational processes simultaneously and/or sequentially.
- the generator processor 222 may determine information to be transmitted and processes to he performed using information received or collected. Similarly, the generator processor 222 may control collection and exchange of geospatial information from the generator device 135.
- the generator sensing system 230 may include generator sensors 232.
- the generator sensors 232 may be sensors that collect physical data from the environment surrounding tire generator device 135 (Le., sensing conditions at a predetermined depth in the ocean 165).
- the generator sensors 232 may be lightweight sensors requiring a small footprint. These sensors may exchange information with each other and supply it to the generator processor 222 for analysis.
- the generator sensors 232 may be logging tools of an electrical type, a nuclear type, a sonic type, or another type.
- the generator sensors 232 may release signals (Le., electrical, nuclear, or sonic) through a signal generator at the source chamber 240.
- the source chamber 240 may include a source element 242 that is used as a catalyst for generating one or more sampling signals 140.
- FIG. 3 shows a schematic diagram showing various systems disposed in the collector device 160.
- the collector device 160 may be a geophone that includes embedded electronic components that enable the collector device 160 to perform communication functions, data collecting functions, processing functions, and/or translation functions.
- the electronic components may be temperature and pressure sensors, batteries, wireless communication capabilities and/or instrumentation capabilities.
- one or more batteries are embedded in the collector device 160 to provide the device with maximum power life and operation energy consumption.
- various data collecting sensors are also embedded in the collector device 160.
- the various collecting sensors may collect data relating to the ocean 165 and surrounding conditions of the collector device 160.
- the transmitter and the receiver may use available, or existing, supervisory control and data acquisition (SC ADA) platforms to link the collector device 160 to the panel and/or the controller device 120 to retrieve any data collected.
- SC ADA supervisory control and data acquisition
- the collector device 160 may float along the surface
- the collector device 160 may remain at a predetermined distance from the vessel 125 to allow the reflected signals 155A-155C to reach different Collector devices I60A-160C as shown in FIG. 1.
- the collector device 160 includes a collector housing 300 containing a collector communication system 310, a collector processing system 320, a collector sensing system 330, and collector installation system 340.
- the collector communication system 310 may include communication devices such as a collector transceiver 314, and localization system 316.
- the transceiver 314 may transmit and receive communication signals. Specifically, the transceiver 314 may communicate with one or more control systems located at a remote location. The transceiver 314 may communicate wirelessly using a wide range of frequencies.
- the localization system 316 may include one or more geospatial location identification components that collect information associated with a geospatial location of the collector device 160 with respect to the AOI or with respect to the vessel 125.
- the collector processing system 320 may include a collector processor 322, a collector memory 324, and a power supply 326.
- the power supply 326 may be a battery or wired connection for providing electrical energy to the col lector device 160. In some embodiments, the battery is charged using electrical connectors (not shown).
- the collector processor 322 may perform computational processes simultaneously and/or sequentially. The collector processor 322 may determine information to he transmitted and processes to be performed using information received or collected.
- the collector processor 322 may control collection and exchange of geospatial information through the localization system 316.
- the collector sensing system 330 may include collector sensors 332 and a cell group sensing element 336.
- the collector sensors 332 may he sensors that collect physical data from the environment surrounding the collector device 160 (i.e., the surface 155).
- the collector sensors 332 may be sensors that collect physical data from the collector device 160 itself (i.e., internal temperature, internal pressure, or internal humidity).
- the collector sensors 332 may he lightweight sensors requiring a small footprint. These sensors may exchange information with each other and supply it to the collector processor 322 for analysis.
- the cell group sensing element 336 may be a logging tool of an electrical type that establishes communication links with one or more additional collector devices disposed on the surface 150.
- the cell group sensing element 336 may identify trends, characteristics or properties (i.e., such as pressure or temperature changes) relating to the movement of the collector device 160 and tire additional collector devices on the surface 150.
- the power supply 326 may be operationally connected to the cell group sensing system 336 and including connections (not shown) for collecting energy and producing electrical energy as a result.
- the installation system 340 may include coordination elements 342 and translation elements 344.
- the translation elements 344 may be mechanisms that identify and track the positioning of the collector device 160 with respect to the controller device 120, the AQI, and any additional collector devices in a 3D space.
- FIG 4 shows a schematic diagram showing various systems that may he incorporated into the generator device 135.
- the controller device 120 includes electronic components that enable the controller device 120 to perform communication functions, data collecting functions, and/or data mapping functions.
- the controller device 120 has a controller housing 400 that includes controller communication system 410, controller processing system 420, and data mapping system 430. As noted above, the controller device 120 may he hosted inside the vessel 125 in the manner shown in FIG. 1.
- the controller communication system 410 may include communication devices such as a controller transceiver 414.
- the controller transceiver 414 may transmit and receive communication signals.
- the generator transceiver 414 may communicate with the generator device 135 and one or more collector devices 160 located at a remote location through wired and/or wireless connections.
- the controller processing system 420 may include a controller processor 422 and a controller memory 424.
- the controller processor 422 may perform computational processes simultaneously and/or sequentially.
- the controller processor 422 may determine information to be transmitted and processes to be performed using information received or collected.
- the controller memory 424 may include at least one database 425 for mapping one or more data points from the seismic data collected by the collector device 160.
- seismic data contains information about various geological features. Seismic data collected by the collector device 160 may have various seismic data components at different frequencies containing information about various geological features.
- the seismic data may be used to generate frequency- based horizon interpretation.
- horizon interpretation may include horizon picking, as well as the processing of the picked horizon tor deriving additional information of a subterranean region.
- Horizon picking is also referred to as horizon tracking.
- horizon picking refers to a process of determining, selecting, or otherwise identifying a horizon that represents a seismic reflector between two geological layers.
- the controller device 120 may perform horizon picking based on mono -frequency seismic data (or single-frequency seismic data).
- horizon interpretations may be performed using seismic volumes that are filtered to a single frequency and then perform the horizon picking on the filtered single-frequency seismic volumes.
- the controller device 120 may include a data mapping system 430 that uses the information stored in the database 425 to generate one or more images onto the controller display 434 and relating to one or more depths of the deep reservoir 180.
- continuity features of layer reflectors in seismic data may be better observed at single frequency volumes rather than full stack seismic volumes. The continuity may refer to a lateral distance from a specified location and in a specified azimuthal direction for which a reflection character of a seismic event is essentially unchanged.
- using mono-frequency seismic data may reduce or remove noise created by different sources that occurs at certain specific frequencies.
- the data mapping system 430 may output a report that includes picked or identified seismic horizons from the seismic data.
- the output may include one or more interpretations of the horizons.
- the controller device 120 may decompose the seismic data into different frequency components for an auto picker (i.e. , an automated horizon picking system in the data mapping system) to work effectively, which may save interpretation time and improves quality.
- peak frequencies may be determined using one or more filtering methods.
- the results from these filtering procedures may be saved on the database 425 with an assigned illumination value corresponding to the frequency level.
- peak-frequencies may be brighter than other frequency values such that thinner portions of the deep reservoir ⁇ 180 may have a larger illumination value.
- the thickness of the deep reservoir 180 may be estimated based on an illumination on an image mapping the deep reservoir 180.
- the seismic data may be obtained from an area of interest, the thickness may be calculated using equations (1) and (2), and the results may he mapped from a database onto a map showing an illumination gradient corresponding to a calculated thickness.
- the seismic survey system 100 A includes the generator device 135 that generates various sampling signals 140 towards the A OI located at the testing surface 170.
- the testing surface 170 absorbs a portion of the various sampling signals 140 and reflects signals 155A-155C the corresponding depths 175A-175C.
- the reflected signals 155A-155C reach the surface, they may be retrieved by one or more corresponding collector devices 160A-160C.
- Each collector device out of the collector devices 160A-160C may be located on the ocean surface 150 and disposed at an angle corresponding to a location for receiving the corresponding reflected signals 155A-155C.
- the collector devices 160A-160C receive the corresponding reflected signals 155A-155C and share the received information with the controller device 120 that processes seismic data received from the reflected signals 155A-155C.
- the seismic data is used for frequency- based horizon interpretation.
- a vessel 125 A may act as A surveying site 105 A for processing the seismic data.
- the generator device 135 may be inside the vessel 125A.
- the vessel 125A may be a movable surveying site or a permanently moored vessel in the manner described in reference to FIG. 1.
- FIG. 5B shows a schematic diagram illustrating an onshore seismic survey system 100B for collecting seismic data from a deep reservoir 180B located below the surface 150B of the Earth.
- the seismic survey system 100B includes the generator device 135 that generates various sampling signals 140 towards the AOI located at the testing surface 170.
- the testing surface 170 absorbs a portion of the various sampling signals 140 and reflects signals 155D, 155E, and 155F the corresponding depths 175D, 175E, and 175F.
- the reflected signals 155D-155F may be retrieved by one or more corresponding collector devices 160D, 160E, and 160F.
- Each collector device out of the collector devices 160D-160F may he located on the surface 150 and disposed at an angle corresponding to a location for receiving the corresponding reflected signals 155D-155F.
- the collector devices 160D-160F receive the corresponding reflected signals 155D-155F and share the received information with the controller device 120 that processes seismic data received from the reflected signals 155D-155F.
- the seismic data is used for frequency-based horizon interpretation.
- the onshore seismic survey system 100B may act as a surveying site 105B for processing the seismic data.
- the generator device 135 may he inside the building I25B.
- the building 125B may a location acting in a similar manner to the vessel 125 A in manner described in reference to FIG. 1.
- FIG. 6 shows a schematic diagram for an example in accordance with one or more embodiments.
- the method and tire system include a new scheme for estimating a thickness in a deep reservoir.
- the method and the system may process measured physical phenomena to perform thickness estimation.
- the process starts by obtaining seismic data 610.
- the seismic data 610 is received by the controller device 120 and it includes information resulting from the combination of the sampling signals 140 and the reflected signals 155A-155C as described in reference to FIG. 1.
- a seismic data evaluation 620 is used to determine whether the collected seismic data 610 is relevant to determine the thickness of the deep reservoir.
- the seismic data evaluation 620 involves a shale reservoir characterization 614 based on the changes of frequency and timing in the reflected signals 155A-L55C as received by the collector devices 160A-160C. Once the seismic data 610 is received and validated as such, the frequency characteristics of thin reservoirs may be derived.
- various frequency components of an amplitude spectrum 632 of the seismic data 610 may be obtained through spectral decomposition 630.
- thin reservoir's may be picked at mono-frequency horizons corresponding to high frequencies of the spectrum based on high frequency peaks in the amplitude spectrum 632.
- high frequency peak information 634 may be identified as the frequency where the thin reservoirs show a highest degree of contrast in the seismic data (i.e., larges frequency difference).
- the controller device 120 identifies the peak frequency by identifying events corresponding to thin reservoirs at mono-frequency horizons of high frequencies. The peak frequency may be used together with the interval velocity to directly estimate a thickness.
- mono-frequency seismic data information 650 may be processed to illustrate a mapping of the frequency information of the seismic data 640.
- the frequency information is broken down into its individual components and each component is given a corresponding weight to provide an illumination value or an illumination gradient.
- a display of the frequency peaks in an image 652 may he prepared to associate the frequency peaks to a location in an image representing topographical changes in the deep reservoir.
- an illumination location mapping 654 provides a clear positioning of the different illumination gradient values to corresponding locations in the image.
- FIGs. 7A, 7B, and 7C are examples of images generated based on seismic data obtained using a seismic survey system 100.
- the seismic data may be retrieved with signals having a frequency bandwidth ranging from 10 Hz to 1000 Hz.
- a search step of 5 Hz, 10 Hz, or similar values may be used by the controller device 120 to find a single frequency that gives rise to a predetermined continuity along a target horizon.
- the search may start by selecting or otherwise identifying a representative 2D seismic line by the controller device 120.
- the controller device 120 may decompose the seismic data into mono-frequencies, assess the horizon continuity level at each frequency, and select the frequency that gives rise to the predetermined continuity.
- estimating thicknesses of deep reservoirs is performed by identifying the peak frequency after determining events corresponding to thin reservoirs at mono-frequency horizons of high frequencies. These mono-frequency horizons are obtained through spectral decomposition. Then the peak frequency is used together with the interval velocity to directly calculate thickness.
- the one-way travel time of seismic waves with a geologic layer T can be approximated as a function of the high peak frequency (Le., f peak ) using equation (1).
- the thickness of any geologic layer Z can be estimated in equation (2).
- the thickness may be estimated based on an illumination on an image mapping the deep reservoir.
- the seismic data may be obtained from an area of interest, the thickness may be calculated using equations (I) and (2), and the results may be mapped from a database onto a map showing an illumination gradient corresponding to a calculated thickness.
- applying the method and the system to a real dataset resulted in estimated thickness of a thin reservoir that is very close to the observed actual thickness in a drilled well.
- the method and the system improve petroleum exploration as the method and the system improve characterization of deep thin reservoirs using seismic data as a starting point.
- the method was applied to a real dataset to estimate the thickness of a real thin reservoir at a depth greater than 14000 ft.
- strong illuminations in the vicinity of thin reservoirs were observed at high frequencies (i.e., greater than 40 Hz).
- the estimated frequency was converted to thickness.
- the estimated thickness through the method is about 150 ft whereas the actual thickness at the well is 170 ft. This shows an overall ail reliable estimation of thickness of a thin reservoir that is not resolvable by conventional seismic interpretation techniques as the tuning thickness of tire data is 250 ft.
- F!Gs. 7A-7C show images 700A, 700B, and 700C mono- frequency horizons corresponding to the frequency values of 16 Hz, 36 Hz and 41 Hz, respectively.
- FIG. 8 shows an image 800 resulting from the thickness estimation as carried out based on tire peak frequency values and following equation (2).
- the resulting thickness map shows a thickness of about 150 ft (as identified by the legend slider 810) for the thin reservoir near the left bottom corner. In this process, proper processing of tire seismic data is carried out by the controller device 120.
- FIG. 9 shows a flowchart in accordance with one or more embodiments.
- FIG. 9 describes a method for estimating a thickness of a deep reservoir.
- the method may be implemented using the devices described in reference to FIGs. 1-8. While the various blocks in FIG. 9 are presented and described sequentially, one of ordinary skill in the art will appreciate that some or all of the blocks may be executed in different orders, may be combined or omitted, and some or all of the blocks may be executed in parallel. Furthermore, the blocks may be performed actively or passively.
- the method allows thickness estimation in petroleum exploration without heavily depending on interpreting petroleum reservoirs using seismic data and converting the interpreted reservoirs to depth. Specifically, the method is successful in resolving reservoirs that are difficult to resolve using conventional seismic data. In this regard, the method uses collected frequency information to estimate thickness by enabling assessment of the thickness of deep thin reservoirs based on peak seismic frequency information.
- Block 910 information relating to various depths is obtained of the AOL
- One or more collector devices may gather reflected signals in real-time and they are received instantaneously in a recording station connecting to one or more control systems.
- seismic surveys may be conducted by creating a shock wave - a seismic wave - on the surface of the ground along a predetermined line, using an energy source.
- the seismic wave travels into the Earth, is reflected by subsurface formations, and returns to the surface where it is recorded by collector devices.
- frequencies information is evaluated corresponding to the respective depths in the AOL Reflected signals are sampled in the time domain (i.e., sampled according to their two-way travel time) using the collector devices.
- the data recorded from the seismic surveys is “raw” or “unprocessed” form until it is processed. Processing of the data recorded includes filtering, stacking, migrating, and other computer analysis to transform the recorded data.
- various mono-frequency horizons are identified based on the frequencies information evaluated from the AOL As described in FIG. 6, the mono- frequency horizons may be determined by the controller device 120. By analyzing the time it takes for the seismic waves to reflect off of subsurface formations and return to the surface, a geophysicist can map subsurface formations and anomalies and predict where hydrocarbons may be trapped in sufficient quantities for exploration activities.
- a frequency dataset is created including all identified mono- frequency horizons. In the frequency dataset, peak frequency values are identified using equations (1) and (2).
- a new dataset may be created based on new information obtained from the seismic data or based on updated information from an existing dataset. For example, a new' seismic volume attribute of a particular mono-frequency may be used to update an existing dataset and a new dataset may be created as a result.
- the frequency dataset is mapped to various frequency gradient values.
- the frequency gradient values are processed to show at least one peak frequency in a location in the AOI.
- the various frequency gradient values are displayed in an image showing the location of the at least one peak frequency by assigning an illumination value to each frequency gradient value. For example, there might be at ieast one peak frequency with an increase in an amplitude of a frequency range around it (i.e., frequency band).
- the thickness of the location of the at least one peak frequency is estimated from the image.
- the contrast range provides a clear representation of areas based on frequency changes corresponding to the topography of the deep surface.
- the thickness may be estimated by identifying the locations with increased contrast on the image.
- FIGs. 1-9 show various configurations of components, other configurations may be used without departing from the scope of the disclosure. For example, various components in FIG. 1-5 may be combined to create a single component. As another example, the functionality performed by a single component may be performed by two or more components. As shown in FIG.
- the computing system 1000 may include one or more computer processor(s) 1004, non-persistent storage 1002 (e.g., random access memory (RAM), cache memory, or flash memory), one or more persistent storage 1006 (e.g., a hard disk), a communication interface 1008 (transmitters and/or receivers) and numerous other elements and functionalities.
- the computer proeessor(s) 1004 may be an integrated circuit for processing instructions.
- the computing system 1000 may also include one or more input deviee(s) 1020, such as a touchscreen, keyboard, mouse, microphone, touchpad, electronic pen, or any other type of input device.
- the one or more input device(s) 1020 may be a surface panel connected to the controller device 120 described in reference to FIG. 1.
- the computing system 1000 may include one or more output device(s) 1010, such as a screen (e.g., a liquid crystal display (LCD), a plasma display, or touchscreen), a printer, external storage, or any other output device.
- a screen e.g., a liquid crystal display (LCD), a plasma display, or touchscreen
- a printer e.g., external storage
- One or more of the output device(s) may be the same or different from the input device(s).
- the computing system 1000 may he connected to a network system 1030 (e.g., a local area network (LAN), a wide area network (WAN) such as the Internet, mobile network, or any other type of network) via a network interface connection (not shown).
- the input device 1020 may be coupled to a receiver and a transmitter used for exchanging communication with one or more peripherals connected to the network system 1030.
- the receiver may receive information relating to one or more reflected signals 155A-155C as described in reference to FIG. 1.
- the transmitter may relay information received by the receiver to other elements in the computing system 1000.
- the computer processor(s) 1004 may be configured for performing or aiding in implementing the processes described in reference to FIGs. 6 and/or 9.
- one or more elements of the computing system 1000 may he located at a remote location and be connected to foe other elements over the network system 1030.
- the network system 1030 may be a cloud-based interface performing processing at a remote location from the well site and connected to the other elements over a network.
- the computing system 1000 may be connected through a remote connection established using a 5G connection, such as protocols established in Release 15 and subsequent releases of the 3GPP/New Radio (NR) standards.
- the computing system in FIG. 10 may implement and/or he connected to a data repository.
- a data repository is a database like database 425).
- a database is a collection of information configured for ease of data retrieval, modification, re-organization, and deletion.
- the database includes pubiished/measured data relating to the method, the assemblies, and tire devices as described in reference to FlGs.
Landscapes
- Engineering & Computer Science (AREA)
- Remote Sensing (AREA)
- Physics & Mathematics (AREA)
- Life Sciences & Earth Sciences (AREA)
- Acoustics & Sound (AREA)
- Environmental & Geological Engineering (AREA)
- Geology (AREA)
- General Life Sciences & Earth Sciences (AREA)
- General Physics & Mathematics (AREA)
- Geophysics (AREA)
- Geophysics And Detection Of Objects (AREA)
Abstract
Description



Claims
Applications Claiming Priority (2)
| Application Number | Priority Date | Filing Date | Title |
|---|---|---|---|
| US17/197,730 US20220291406A1 (en) | 2021-03-10 | 2021-03-10 | Method and system for estimating thickness of deep reservoirs |
| US17/197,730 | 2021-03-10 |
Publications (1)
| Publication Number | Publication Date |
|---|---|
| WO2022192574A1 true WO2022192574A1 (en) | 2022-09-15 |
Family
ID=80979063
Family Applications (1)
| Application Number | Title | Priority Date | Filing Date |
|---|---|---|---|
| PCT/US2022/019804 Ceased WO2022192574A1 (en) | 2021-03-10 | 2022-03-10 | Method and system for estimating thickness of deep reservoirs |
Country Status (2)
| Country | Link |
|---|---|
| US (1) | US20220291406A1 (en) |
| WO (1) | WO2022192574A1 (en) |
Families Citing this family (2)
| Publication number | Priority date | Publication date | Assignee | Title |
|---|---|---|---|---|
| CN120044582B (en) * | 2023-11-27 | 2026-01-09 | 中国石油化工股份有限公司 | Thin reservoir earthquake prediction method |
| US12597202B2 (en) * | 2024-02-27 | 2026-04-07 | Schlumberger Technology Corporation | Geologically meaningful subsurface model generation based on a text description |
Citations (1)
| Publication number | Priority date | Publication date | Assignee | Title |
|---|---|---|---|---|
| US6131071A (en) * | 1996-12-06 | 2000-10-10 | Bp Amoco Corporation | Spectral decomposition for seismic interpretation |
Family Cites Families (9)
| Publication number | Priority date | Publication date | Assignee | Title |
|---|---|---|---|---|
| US3731268A (en) * | 1970-12-07 | 1973-05-01 | Amoco Prod Co | Time-compressing multi-transmission signals |
| US5031159A (en) * | 1990-02-21 | 1991-07-09 | Laitram Corporation | Hydroacoustic ranging system |
| EA005692B1 (en) * | 2001-04-30 | 2005-04-28 | Те Риджентс Оф Те Юниверсити Оф Калифорния | Frequency-dependent processing and interpretation (fdpi) of seismic data for identifying, imaging and monitoring fluid-saturated underground reservoirs |
| US8228759B2 (en) * | 2003-11-21 | 2012-07-24 | Fairfield Industries Incorporated | System for transmission of seismic data |
| US8498177B2 (en) * | 2010-08-20 | 2013-07-30 | Schlumberger Technology Corporation | Determining a position of a geological layer relative to a wavelet response in seismic data |
| EP2738948A1 (en) * | 2012-11-28 | 2014-06-04 | Sercel | Method for setting frequency channels in a multi-hop wireless mesh network. |
| CN105974473B (en) * | 2016-06-15 | 2018-10-16 | 中国石油天然气集团公司 | A kind of method and apparatus for the seismic properties determining thin reservoir |
| US10712459B2 (en) * | 2018-01-19 | 2020-07-14 | Saudi Arabian Oil Company | Frequency-based horizon interpretation based on seismic data |
| CN109581498B (en) * | 2018-11-08 | 2020-07-10 | 中国石油天然气集团有限公司 | Reservoir thickness distribution determination method, system, device and readable medium |
-
2021
- 2021-03-10 US US17/197,730 patent/US20220291406A1/en not_active Abandoned
-
2022
- 2022-03-10 WO PCT/US2022/019804 patent/WO2022192574A1/en not_active Ceased
Patent Citations (1)
| Publication number | Priority date | Publication date | Assignee | Title |
|---|---|---|---|---|
| US6131071A (en) * | 1996-12-06 | 2000-10-10 | Bp Amoco Corporation | Spectral decomposition for seismic interpretation |
Non-Patent Citations (4)
| Title |
|---|
| MARFURT K J ET AL: "NARROW-BAND SPECTRAL ANALYSIS AND THIN-BED TUNING", GEOPHYSICS, SOCIETY OF EXPLORATION GEOPHYSICISTS, US, vol. 66, no. 4, 1 July 2001 (2001-07-01), pages 1274 - 1283, XP001127728, ISSN: 0016-8033, DOI: 10.1190/1.1487075 * |
| NASEER MUHAMMAD TAYYAB ET AL: "Detection of cretaceous incised-valley shale for resource play, Miano gas field, SW Pakistan: Spectral decomposition using continuous wavelet transform", JOURNAL OF ASIAN EARTH SCIENCES, PERGAMON, AMSTERDAM, NL, vol. 147, 21 July 2017 (2017-07-21), pages 358 - 377, XP085172042, ISSN: 1367-9120, DOI: 10.1016/J.JSEAES.2017.07.031 * |
| PARTYKA GREG ET AL: "Interpretational applications of spectral decomposition in reservoir characterization", THE LEADING EDGE, vol. 18, no. 3, 1 March 1999 (1999-03-01), US, pages 353 - 360, XP055924188, ISSN: 1070-485X, DOI: 10.1190/1.1438295 * |
| YOUSF ABUSHALAH ET AL: "Application of amplitude spectrum and genetic inversion to determine shaly facies distribution: a case study: Murzuq Basin, Libya", GEOPHYSICAL PROSPECTING, BLACKWELL SCIENCE, HOBOKEN, USA, vol. 66, no. 6, 9 May 2018 (2018-05-09), pages 1144 - 1158, XP071259710, ISSN: 0016-8025, DOI: 10.1111/1365-2478.12627 * |
Also Published As
| Publication number | Publication date |
|---|---|
| US20220291406A1 (en) | 2022-09-15 |
Similar Documents
| Publication | Publication Date | Title |
|---|---|---|
| CN113759425B (en) | Method and system for combined well-seismic evaluation of filling characteristics of deep paleokarst reservoirs | |
| EP2864817B1 (en) | Seismic orthogonal decomposition attribute | |
| US11561312B2 (en) | Mapping near-surface heterogeneities in a subterranean formation | |
| RU2570221C2 (en) | Determining position of geologic horizon relative to manifestation of seismic pulse in seismic data | |
| US20190227186A1 (en) | Frequency-based horizon interpretation based on seismic data | |
| US20140336940A1 (en) | Estimation of q-factor in time domain | |
| US20230125277A1 (en) | Integration of upholes with inversion-based velocity modeling | |
| US12517272B2 (en) | Near surface modeling and drilling hazard identification for a subterranean formation | |
| US20220291406A1 (en) | Method and system for estimating thickness of deep reservoirs | |
| US20200257012A1 (en) | Seismic Polynomial Filter | |
| US20230127237A1 (en) | Integrating wells into adaptive multi-scale geological modeling | |
| US11474270B2 (en) | Three-component seismic data acquisition while fracking | |
| US20190187310A1 (en) | Subsalt Imaging Tool for Interpreters | |
| US20250243742A1 (en) | Predicting Reservoir Properties Based on Seismic Inversion | |
| US12560733B2 (en) | Identifying geological structural style in seismic reflections | |
| US20240240554A1 (en) | Training dataset generation process for moment tensor machine learning inversion models | |
| US12405396B2 (en) | Holographic inversion for hydrocarbon indicator | |
| US20210405235A1 (en) | Detecting subsea hydrocarbon seepage | |
| US20250052921A1 (en) | Determining thickness of glacial channels from seismic surveys | |
| US20250138211A1 (en) | Surface-consistent travel-times inversion with accuracy estimation | |
| US20250028072A1 (en) | Identifying Unconformities in Subsurface Formations | |
| US20250389862A1 (en) | Recovering Resources from a Subsurface Region | |
| US20240377551A1 (en) | Modeling acoustic impedance of a subterranean formation | |
| WO2025147894A1 (en) | Methods and systems for real-time identification of reflected waves generated by drilling operations | |
| US12535606B2 (en) | Seismic inversion downscaling and extrapolation for generation of seismic images |
Legal Events
| Date | Code | Title | Description |
|---|---|---|---|
| 121 | Ep: the epo has been informed by wipo that ep was designated in this application |
Ref document number: 22713810 Country of ref document: EP Kind code of ref document: A1 |
|
| NENP | Non-entry into the national phase |
Ref country code: DE |
|
| WWE | Wipo information: entry into national phase |
Ref document number: 523450633 Country of ref document: SA |
|
| 32PN | Ep: public notification in the ep bulletin as address of the adressee cannot be established |
Free format text: NOTING OF LOSS OF RIGHTS PURSUANT TO RULE 112(1) EPC (EPO FORM 1205A DATED 16/01/2024) |
|
| WWE | Wipo information: entry into national phase |
Ref document number: 523450633 Country of ref document: SA |
|
| 122 | Ep: pct application non-entry in european phase |
Ref document number: 22713810 Country of ref document: EP Kind code of ref document: A1 |
|
| WWE | Wipo information: entry into national phase |
Ref document number: 523450633 Country of ref document: SA |
|
| WWE | Wipo information: entry into national phase |
Ref document number: 523450633 Country of ref document: SA |
|
| WWG | Wipo information: grant in national office |
Ref document number: 523450633 Country of ref document: SA |